Embed Size (px)
Citation preview
SYSTEM PERFORMANCE FUNDING PROGRAM
January 2005
Administration BuildingDixon University Center

Welcome and Introductory Remarks
Chancellor Hample

Purposes of the Workshop
President Grunenwald

Distributed Materials
A Copy of this PresentationGlossary of Terms (in Order of Presentation)
The Accountability MatrixPerformance Funding Naming Conventions
Distributed Prior to the Meeting:
Performance Funding Guidelines (Board of Governors)Performance Funding Definitions and Documentation
Glossary of Terms (in Alphabetical Order)Peer Institutions by University
PA Public Peer InstitutionsCSRDE Peer Institutions
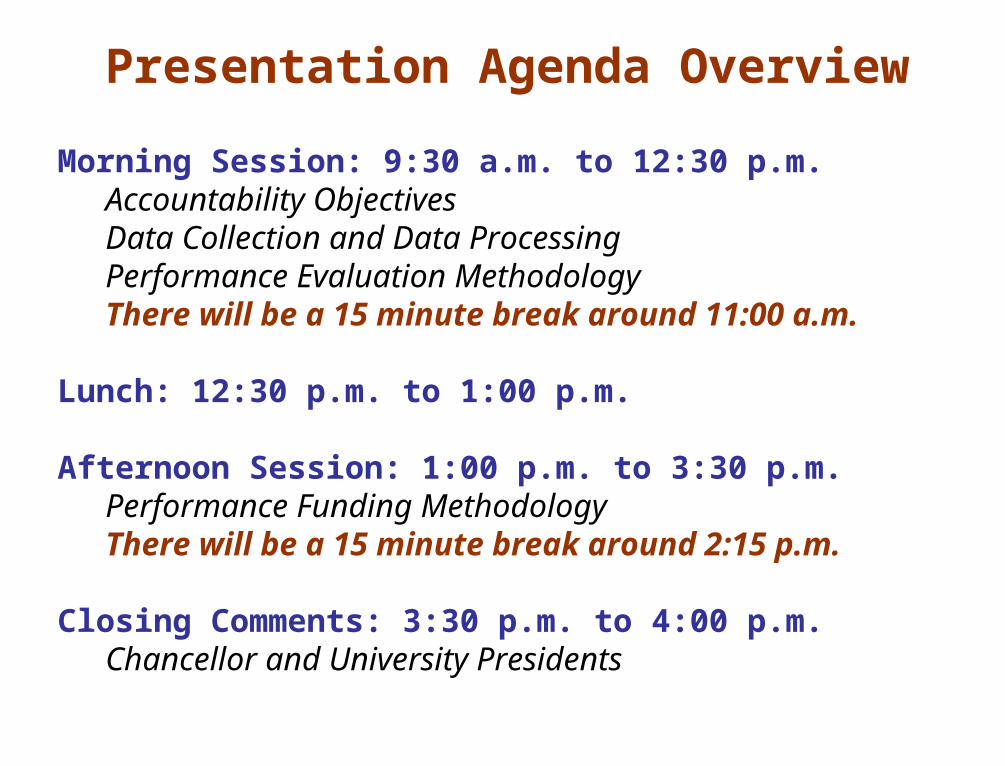
Presentation Agenda Overview
Morning Session: 9:30 a.m. to 12:30 p.m. Accountability ObjectivesData Collection and Data ProcessingPerformance Evaluation MethodologyThere will be a 15 minute break around 11:00 a.m.
Lunch: 12:30 p.m. to 1:00 p.m.
Afternoon Session: 1:00 p.m. to 3:30 p.m.Performance Funding MethodologyThere will be a 15 minute break around 2:15 p.m.
Closing Comments: 3:30 p.m. to 4:00 p.m.Chancellor and University Presidents
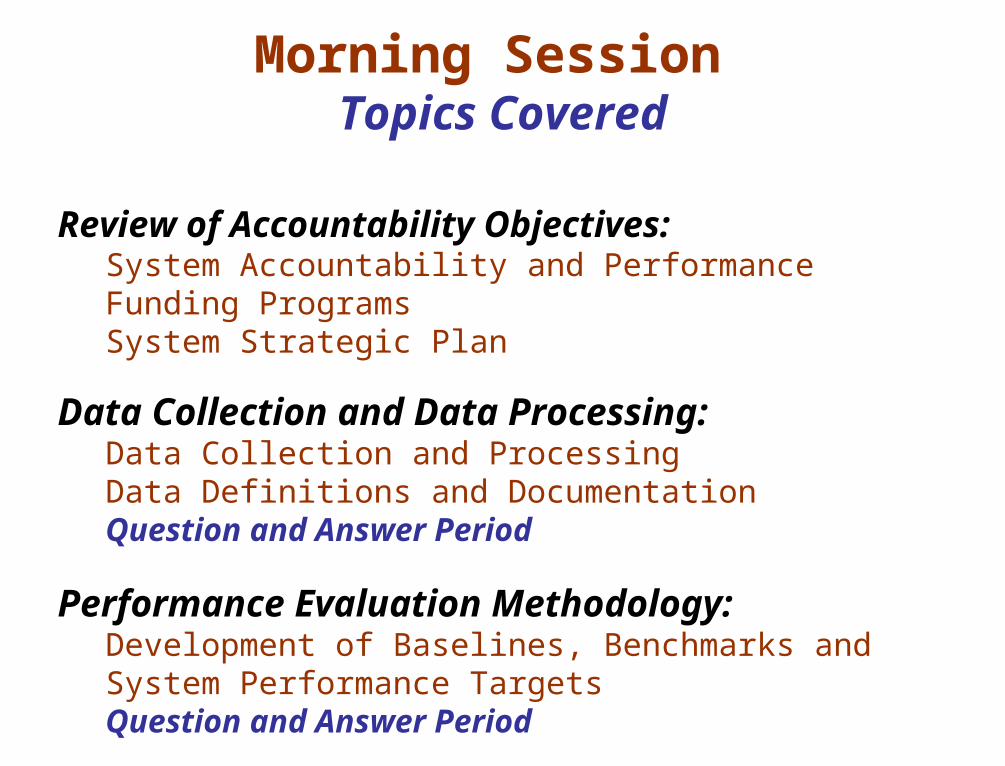
Morning Session Topics Covered
Review of Accountability Objectives:System Accountability and Performance Funding ProgramsSystem Strategic Plan
Data Collection and Data Processing:Data Collection and Processing Data Definitions and Documentation Question and Answer Period
Performance Evaluation Methodology:Development of Baselines, Benchmarks and System Performance TargetsQuestion and Answer Period
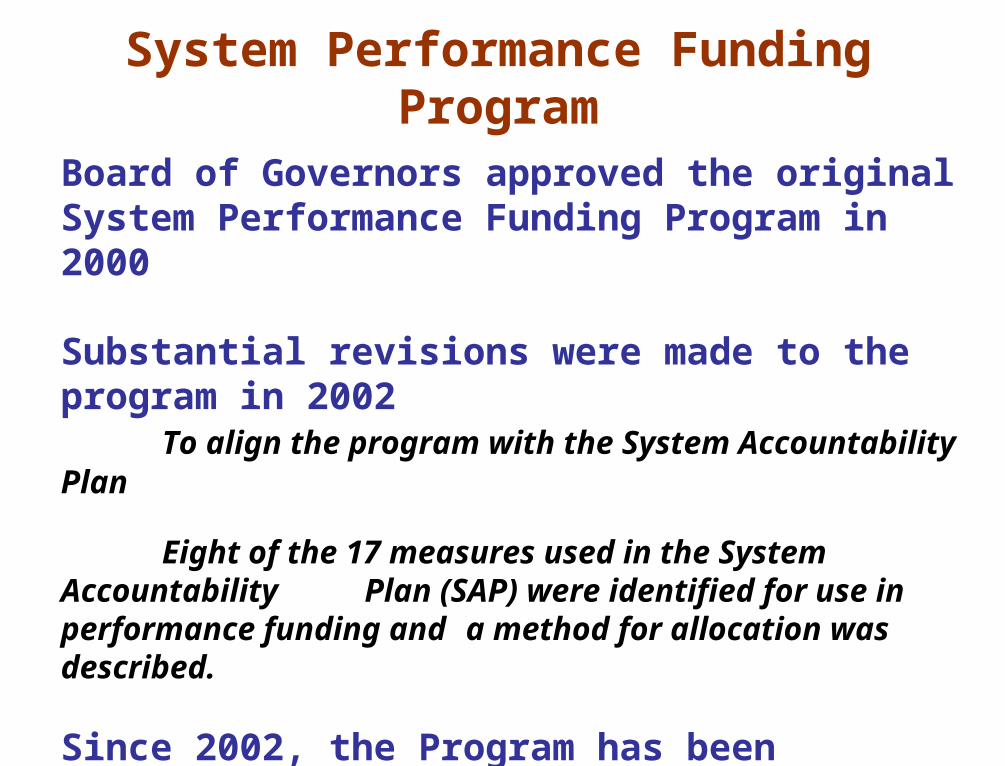
System Performance Funding Program
Board of Governors approved the original System Performance Funding Program in 2000
Substantial revisions were made to the program in 2002To align the program with the System Accountability Plan
Eight of the 17 measures used in the System Accountability Plan (SAP) were identified for use in performance funding
and a method for allocation was described.
Since 2002, the Program has been expanded to includeEvaluation based on Benchmark comparisonsEvaluation based on System Performance Target
comparisons
The Accountability Matrix and
Accountability Measures
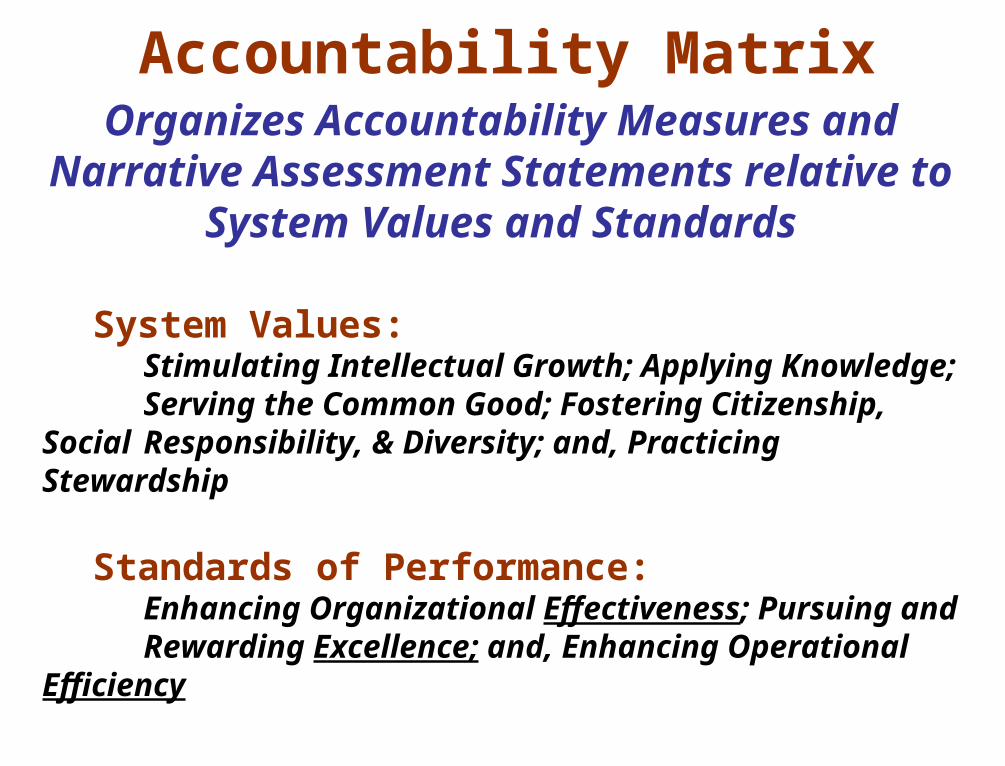
Accountability Matrix
System Values:Stimulating Intellectual Growth; Applying Knowledge;Serving the Common Good; Fostering Citizenship, Social
Responsibility, & Diversity; and, Practicing Stewardship
Standards of Performance:Enhancing Organizational Effectiveness; Pursuing and
Rewarding Excellence; and, Enhancing Operational Efficiency
Organizes Accountability Measures and Narrative Assessment
Statements relative to System Values and Standards
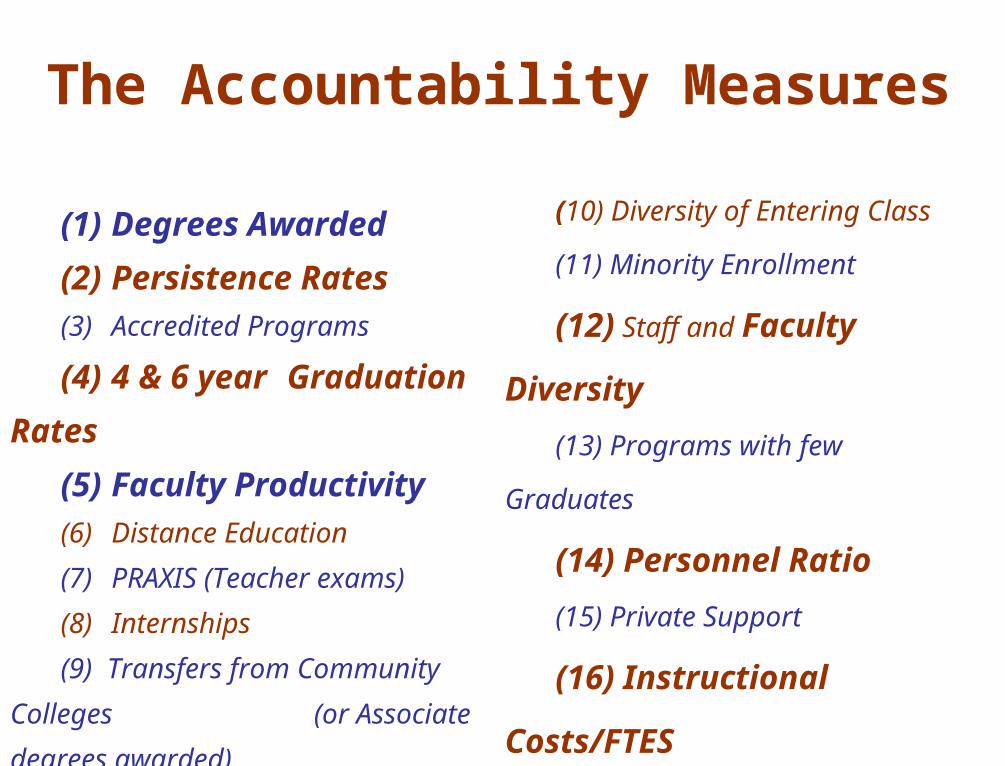
The Accountability Measures
(1) Degrees
Awarded
(2) Persistence
Rates (3) Accredited Programs
(4) 4 & 6 year
Graduation Rates
(5) Faculty
Productivity(6) Distance Education
(7) PRAXIS (Teacher exams)
(8) Internships
(9) Transfers from Community
Colleges (or Associate
degrees awarded)
(10) Diversity of Entering
Class
(11) Minority Enrollment
(12) Staff and Faculty
Diversity
(13) Programs with few
Graduates
(14) Personnel Ratio
(15) Private Support
(16) Instructional
Costs/FTES
(17) Faculty with
Terminal Degrees
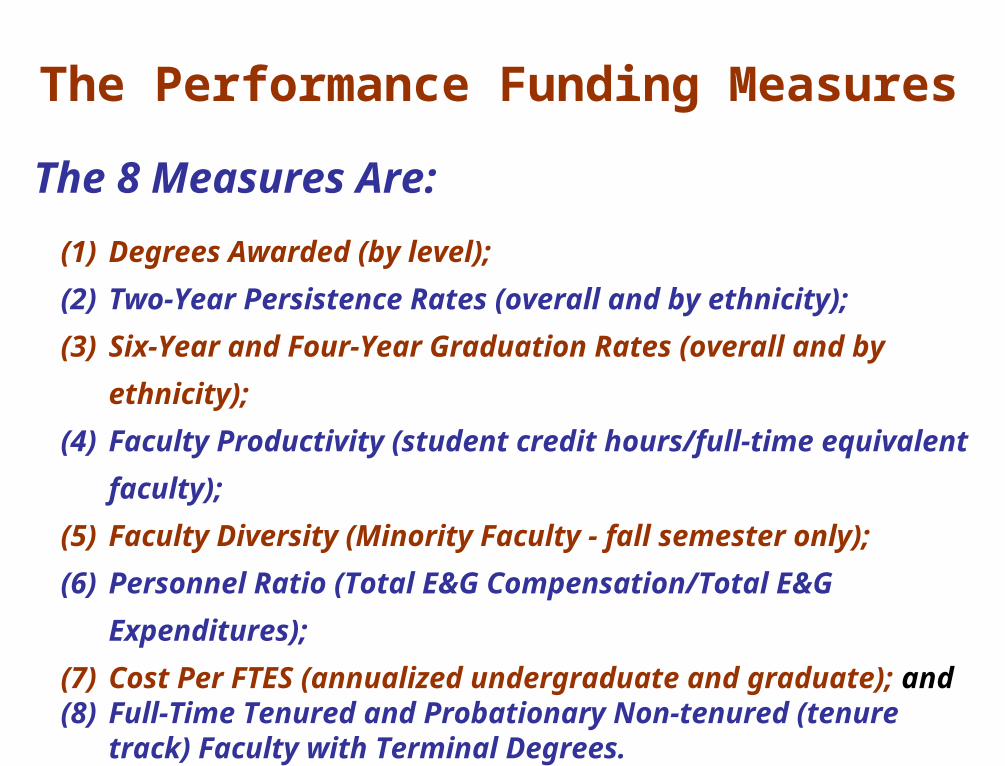
The Performance Funding Measures
(1) Degrees Awarded (by level);
(2) Two-Year Persistence Rates (overall and by ethnicity);
(3) Six-Year and Four-Year Graduation Rates (overall and by ethnicity);
(4) Faculty Productivity (student credit hours/full-time equivalent faculty);
(5) Faculty Diversity (Minority Faculty - fall semester only);
(6) Personnel Ratio (Total E&G Compensation/Total E&G Expenditures);
(7) Cost Per FTES (annualized undergraduate and graduate); and(8) Full-Time Tenured and Probationary Non-tenured (tenure track)
Faculty with Terminal Degrees.
The 8 Measures Are:
Data Collection and Data Processing
The purpose of this section is to review the process of data collection through
the calculation of the measures
Data Collection and Data ProcessingTopics Covered
Historical Context for Performance Funding Measures
Data Collection PracticesEdit Checks, University Review and ReconciliationData SubmissionsOutliers and Missing Data
Data Definitions and Calculation of Measures
Question and Answer Period
Historical Context for Performance Funding Measures
PASSHE has been reporting data on performance measures for many years.
Some measures have been reported each year in the Factbook since the 1980’s.
24 Performance Indicators were developed in 1998, including:
Second Year PersistenceSix-Year Overall Graduation RateSix-Year Underrepresented
Graduation RateUnderrepresented Racial/Ethnic
FacultyInstructional Costs (Undergraduate
& Graduate)
Historical Context for Performance Funding
MeasuresPerformance and Outcomes Plan
Adopted by Board of Governors in 2000
Set three year targets set for both quantitative and qualitative measures
Quantitative measures included:Faculty productivitySecond year persistenceMinority faculty

Data Collection Practices
Data Collection, Data Integrity, University
Review and Reconciliation
Data CollectionGeneral Observations
Data submitted by the universities To be used in constructing the measures.
External data sourcesInclude state and federal reporting bodies as well as university consortiums and private agencies.
Definitions and criteria are regularly reviewed To ensure relevance, consistency and comparability (particularly for external benchmarking data sources).
Data CollectionGeneral Observations
System data collection has evolved
More comprehensive and integrated; trends that will continue with the implementation of Campus Management
Future improvements
Web-based tools and applications will enable staff at each university to see their data and predict performance evaluations before report is distributed

Data Collection Practices
Data Collection PracticesTopics Covered
Data Integrity
Types of Data Requests
Sources of Data
Internal Data
External Data
Data Collection Process
Data Collection PracticesData Integrity
Universities are the source of all internal data
Submissions are documented and audit trails are established
Edit checking and reconciliation of data are next steps in the process
Data loaded to the Data Warehouse are reviewed by each University
University data is periodically audited
Internal Review Group Data Audits

Data Collection Practices
Data Submissions
Data Collection PracticesTypes of Data Requests
Regular/Recurring:Annual Data Collection PlanSubmissions to National and State Agencies
Ad Hoc:Special RequestsExtraction and Compilation of National Databases
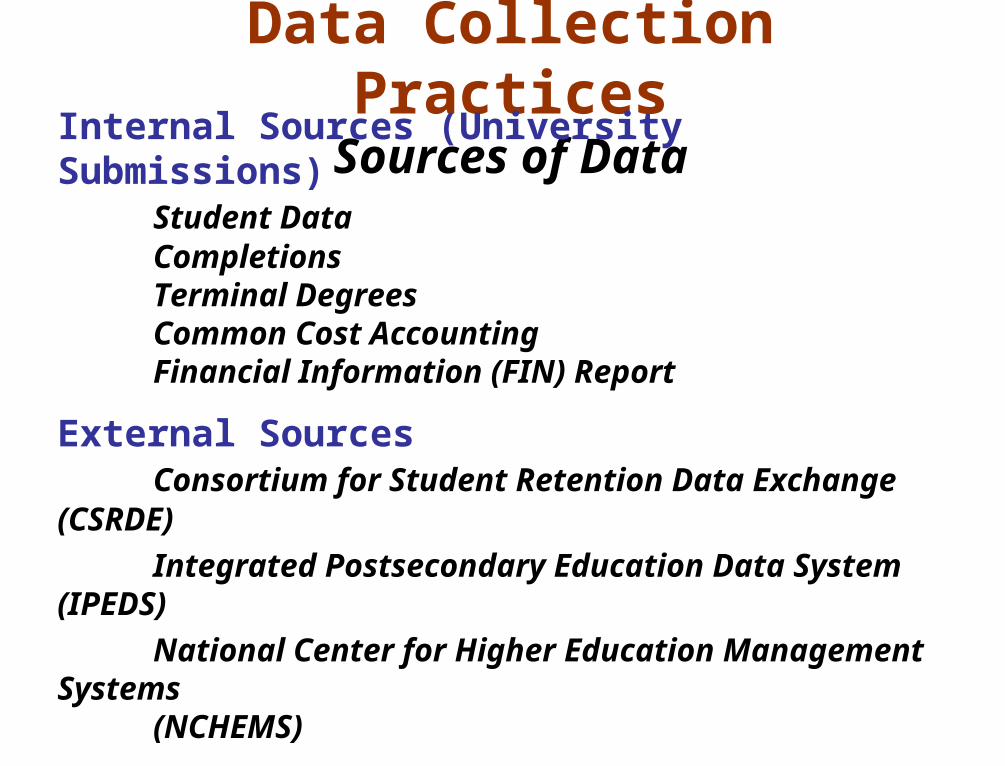
Data Collection PracticesSources of Data
Internal Sources (University Submissions)Student DataCompletionsTerminal DegreesCommon Cost AccountingFinancial Information (FIN) Report
External SourcesConsortium for Student Retention Data Exchange (CSRDE)
Integrated Postsecondary Education Data System (IPEDS)
National Center for Higher Education Management Systems(NCHEMS)
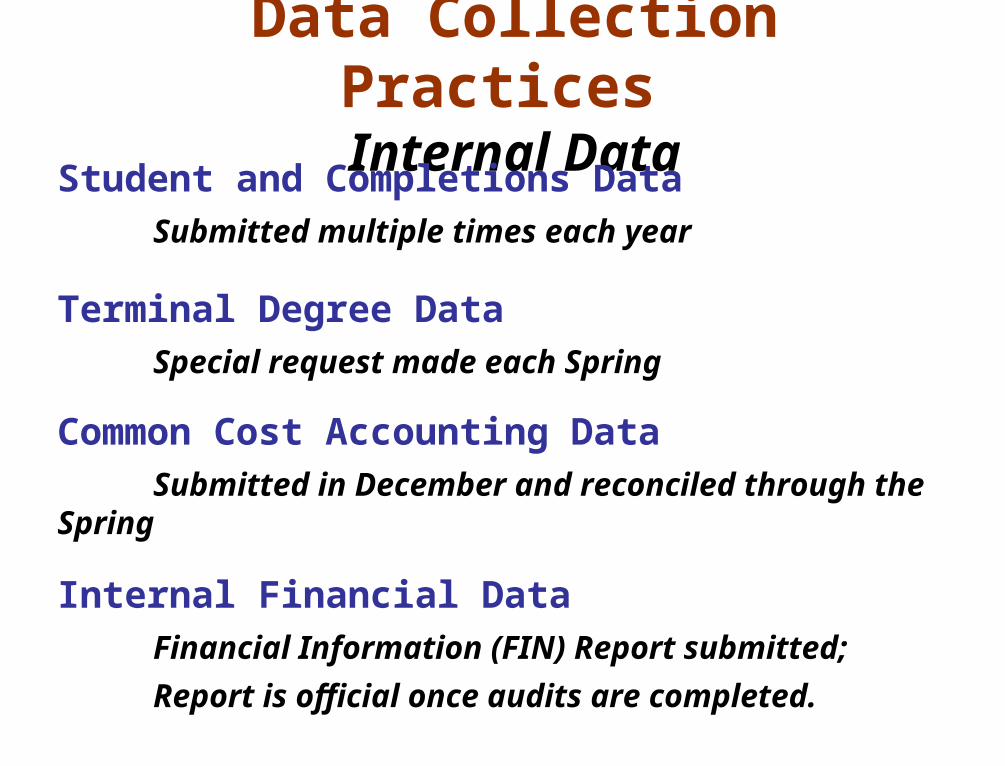
Data Collection Practices
Internal DataStudent and Completions Data
Submitted multiple times each year
Terminal Degree DataSpecial request made each Spring
Common Cost Accounting DataSubmitted in December and reconciled through the Spring
Internal Financial DataFinancial Information (FIN) Report submitted;
Report is official once audits are completed.
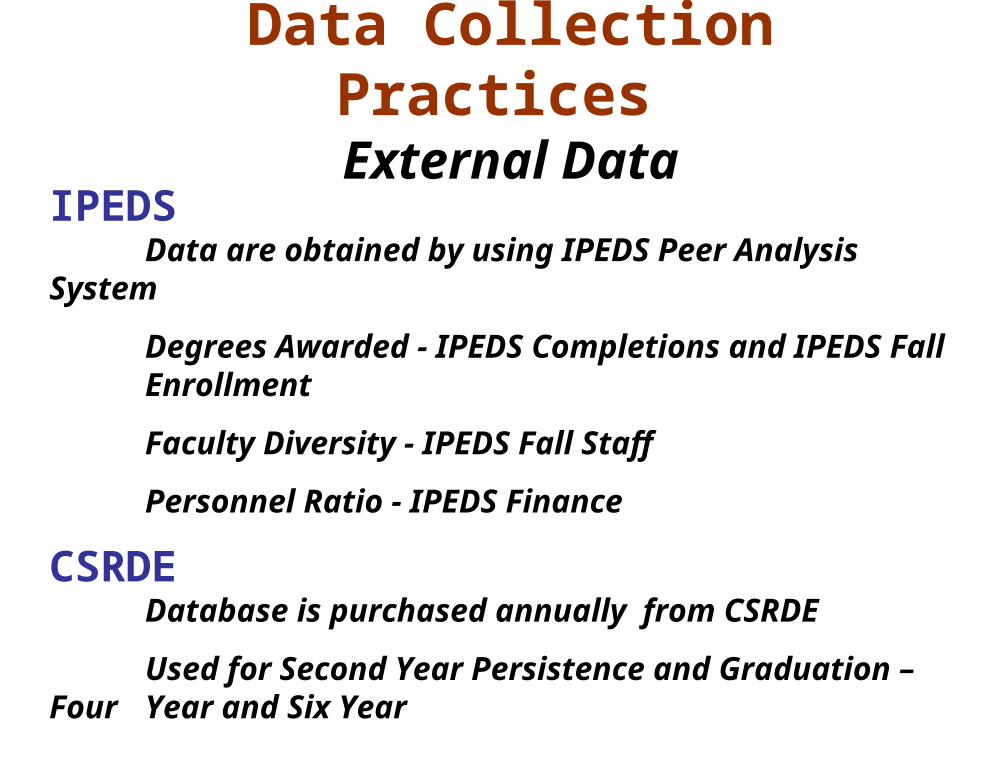
Data Collection Practices
External DataIPEDS
Data are obtained by using IPEDS Peer Analysis System
Degrees Awarded - IPEDS Completions and IPEDS Fall Enrollment
Faculty Diversity - IPEDS Fall Staff
Personnel Ratio - IPEDS Finance
CSRDEDatabase is purchased annually from CSRDE
Used for Second Year Persistence and Graduation – Four Year and Six Year
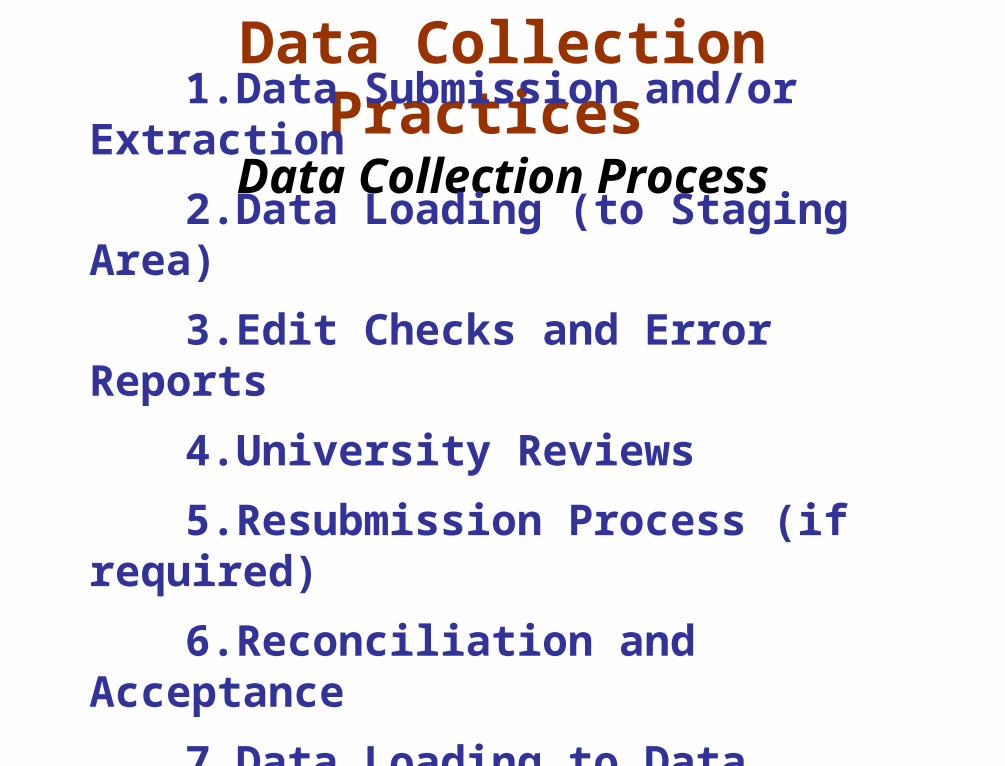
Data Collection Practices Data Collection Process
1.Data Submission and/or Extraction
2.Data Loading (to Staging Area)
3.Edit Checks and Error Reports
4.University Reviews
5.Resubmission Process (if required)
6.Reconciliation and Acceptance
7.Data Loading to Data Warehouse
Data Collection Practices
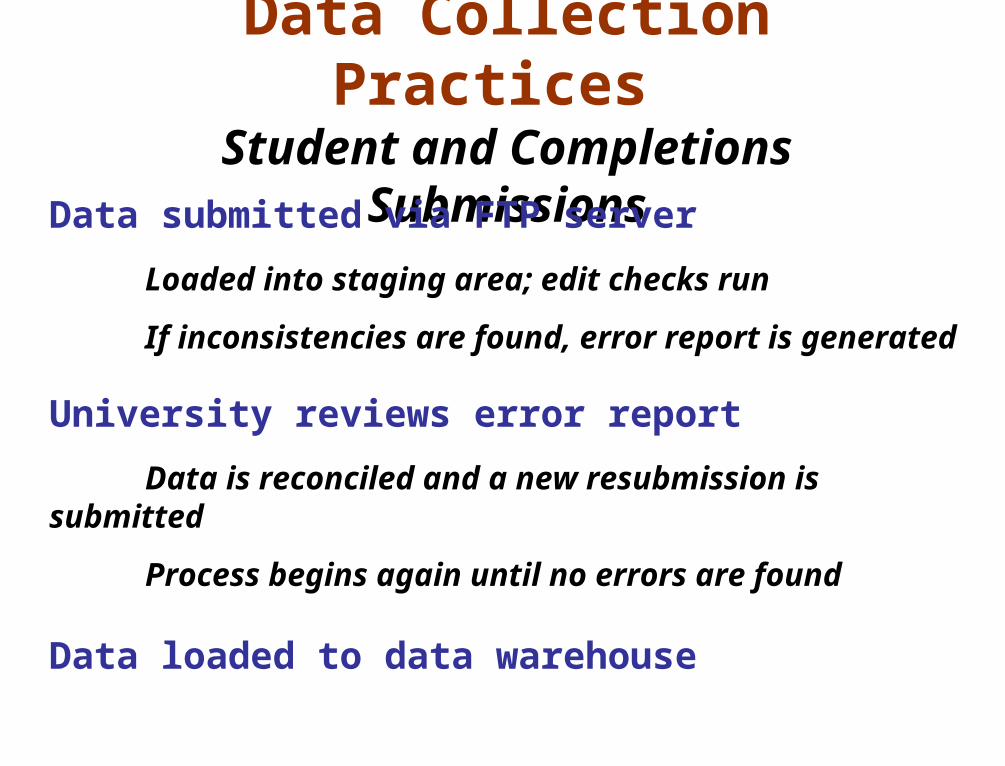
Student and Completions SubmissionsData submitted via FTP server
Loaded into staging area; edit checks run
If inconsistencies are found, error report is generated
University reviews error report
Data is reconciled and a new resubmission is submitted
Process begins again until no errors are found
Data loaded to data warehouse
Data Collection Practices
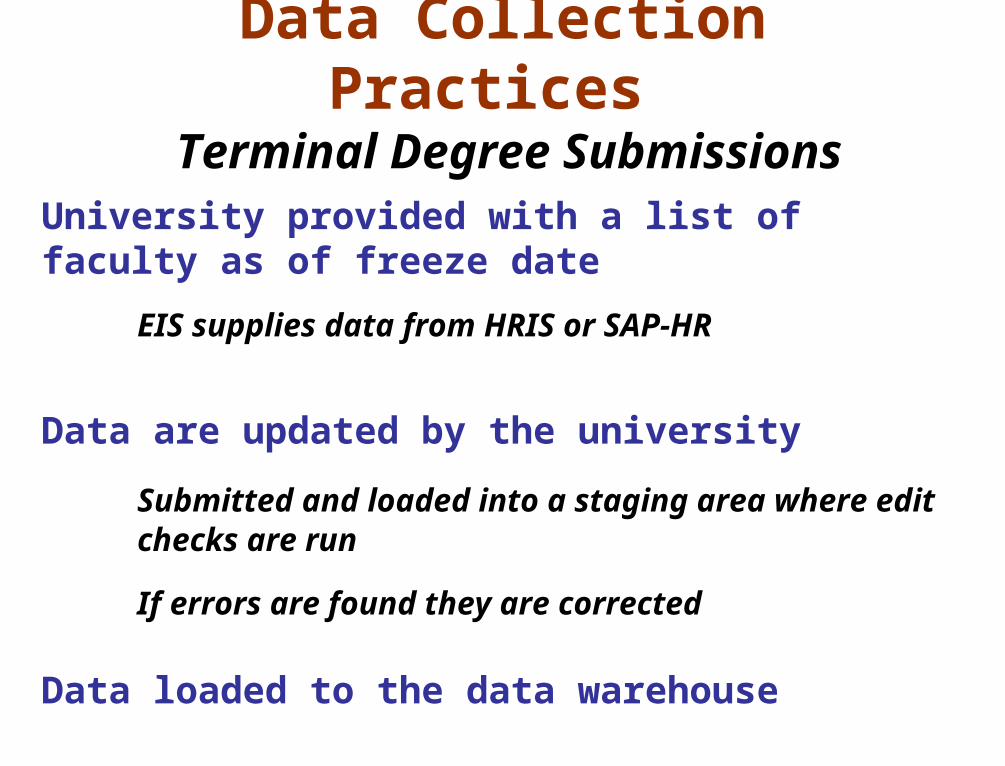
Terminal Degree Submissions
University provided with a list of faculty as of freeze date
EIS supplies data from HRIS or SAP-HR
Data are updated by the university
Submitted and loaded into a staging area where edit checks are run
If errors are found they are corrected
Data loaded to the data warehouse
Data Collection Practices
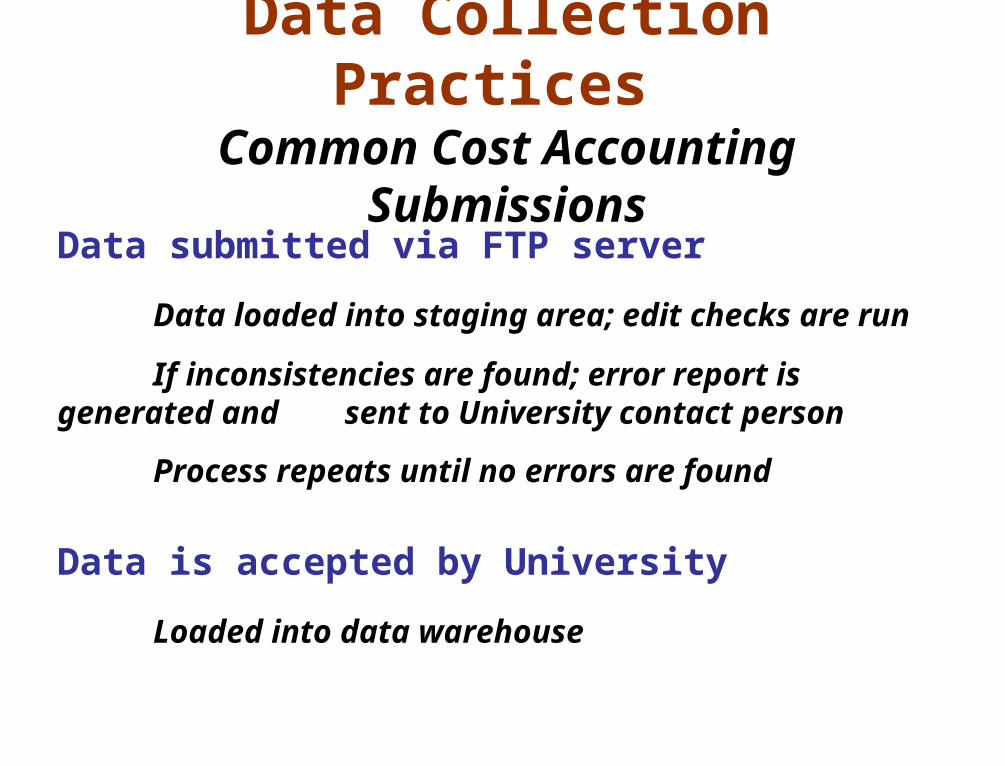
Common Cost Accounting SubmissionsData submitted via FTP server
Data loaded into staging area; edit checks are run
If inconsistencies are found; error report is generated and sent to University contact person
Process repeats until no errors are found
Data is accepted by University
Loaded into data warehouse
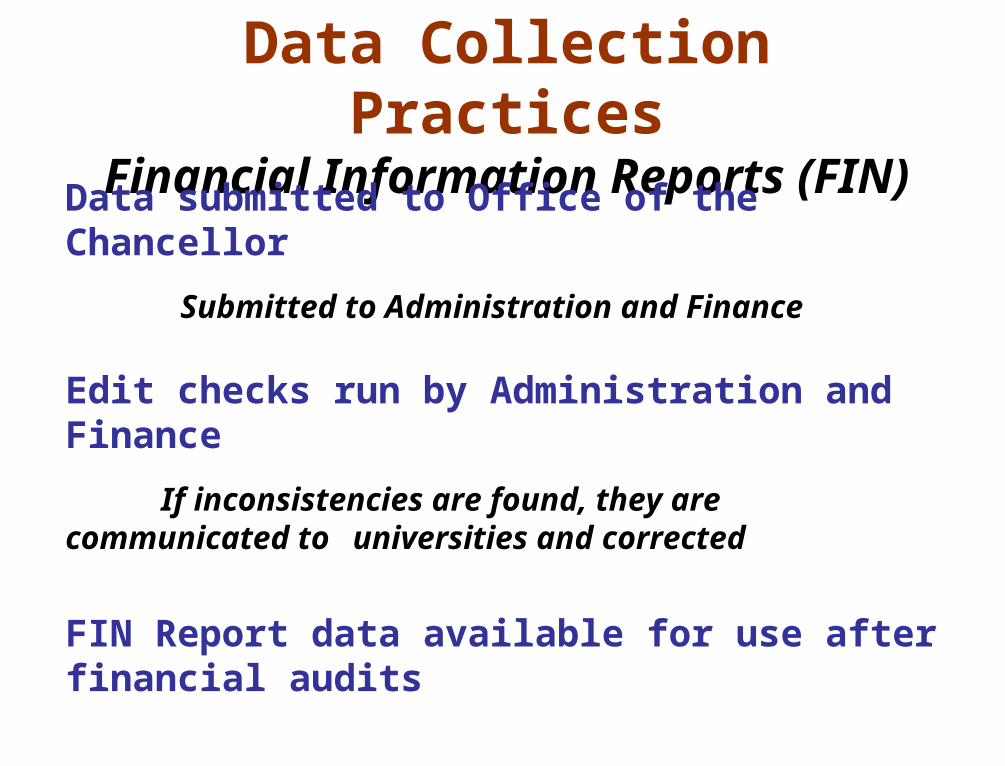
Data Collection PracticesFinancial Information Reports (FIN)
Data submitted to Office of the Chancellor
Submitted to Administration and Finance
Edit checks run by Administration and Finance
If inconsistencies are found, they are communicated to universities and corrected
FIN Report data available for use after financial audits
Data Processing:Outliers and Missing
Data
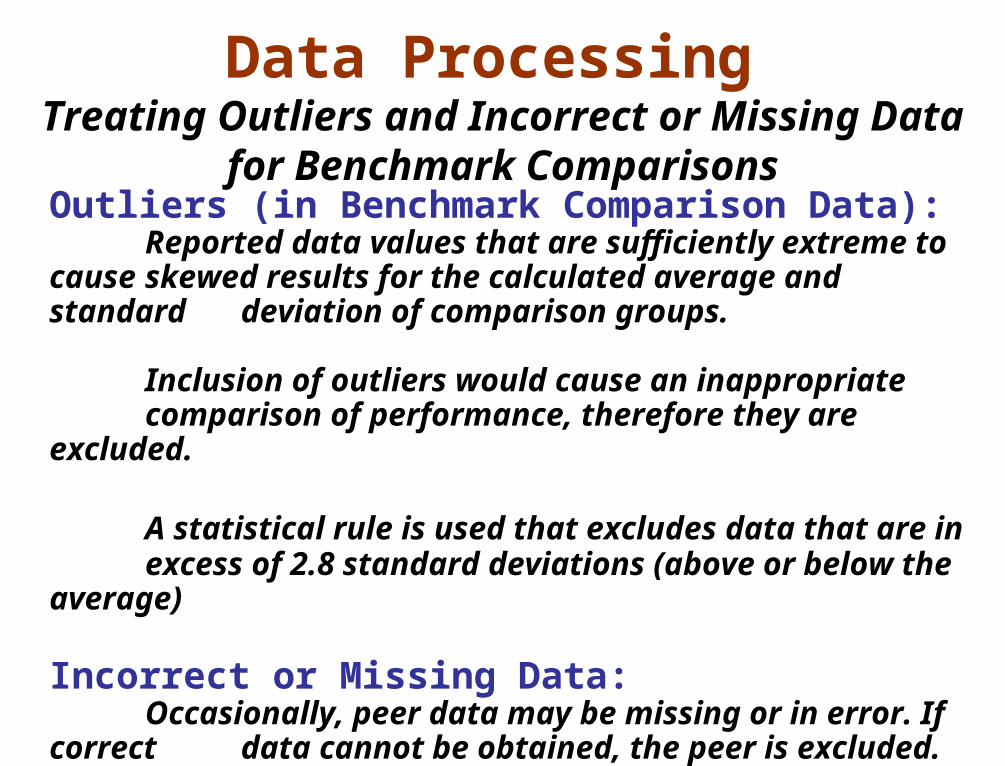
Data Processing Treating Outliers and Incorrect or Missing Data for
Benchmark Comparisons
Outliers (in Benchmark Comparison Data):Reported data values that are sufficiently extreme to cause skewed results for the calculated average and standard
deviation of comparison groups.
Inclusion of outliers would cause an inappropriate comparison of performance, therefore they are excluded.
A statistical rule is used that excludes data that are in excess of 2.8 standard deviations (above or below the average)
Incorrect or Missing Data:Occasionally, peer data may be missing or in error. If correct data cannot be obtained, the peer is excluded.
Data Definitions and Calculation of
Measures
In this portion of the presentation
Review sub-measures and definitions for each of the 8
measures
Provide representative calculations for each
measure using university data
Data Definitions and Calculation of Measures
Data Definitions and Calculation of Measures
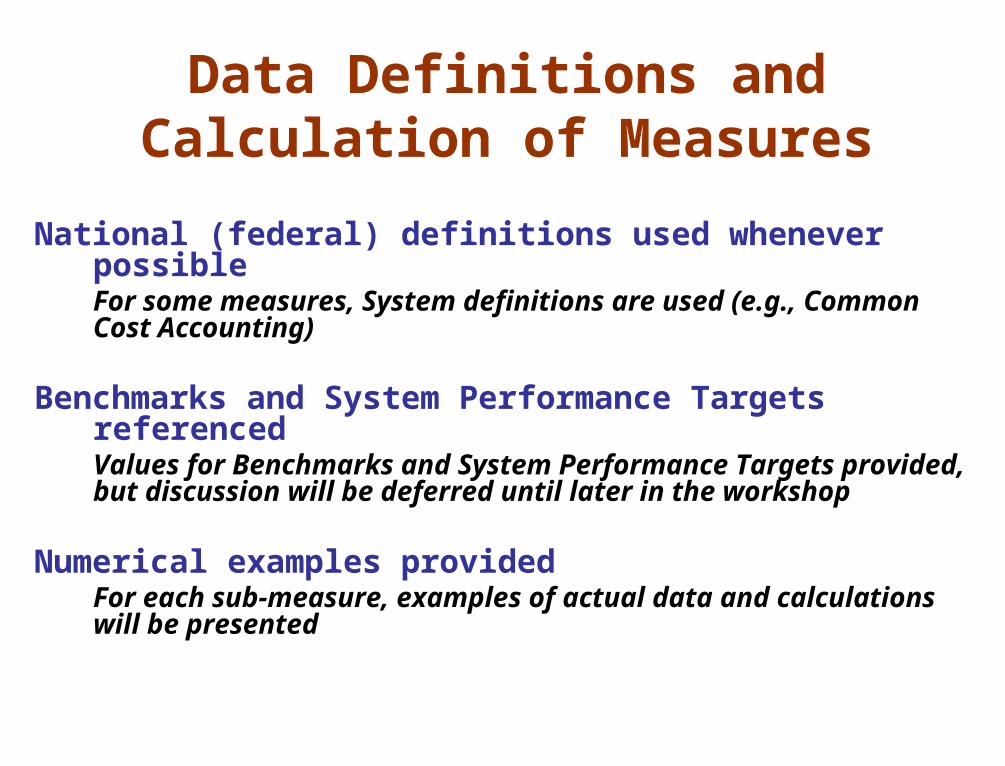
National (federal) definitions used whenever possibleFor some measures, System definitions are used (e.g., Common Cost Accounting)
Benchmarks and System Performance Targets referencedValues for Benchmarks and System Performance Targets provided, but discussion will be deferred until later in the workshop
Numerical examples providedFor each sub-measure, examples of actual data and calculations will be presented
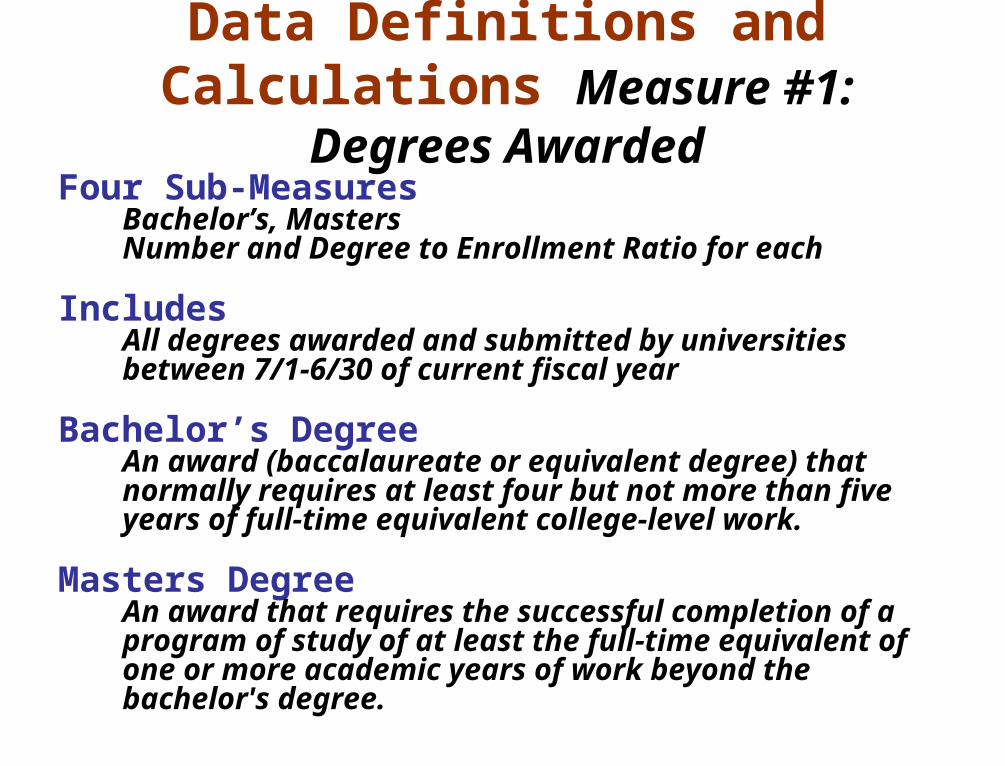
Data Definitions and Calculations Measure #1: Degrees
AwardedFour Sub-Measures
Bachelor’s, Masters Number and Degree to Enrollment Ratio for each
Includes All degrees awarded and submitted by universities between 7/1-6/30 of current fiscal year
Bachelor’s DegreeAn award (baccalaureate or equivalent degree) that normally requires at least four but not more than five years of full-time equivalent college-level work.
Masters DegreeAn award that requires the successful completion of a program of study of at least the full-time equivalent of one or more academic years of work beyond the bachelor's degree.
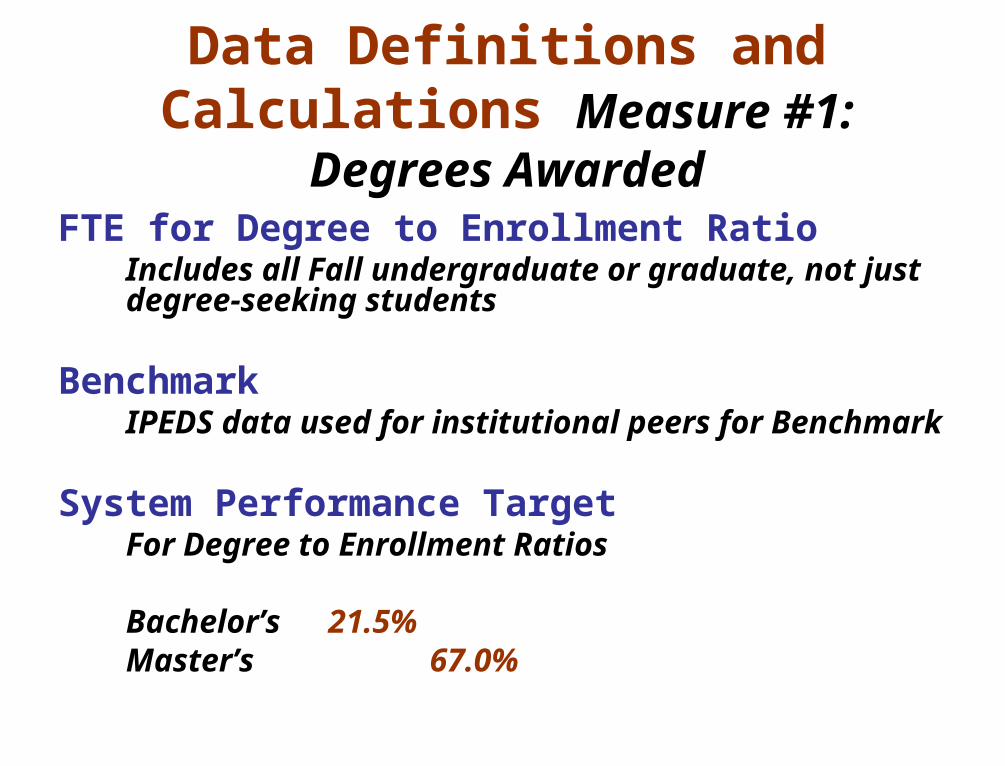
Data Definitions and Calculations Measure #1: Degrees
AwardedFTE for Degree to Enrollment Ratio
Includes all Fall undergraduate or graduate, not just degree-seeking students
BenchmarkIPEDS data used for institutional peers for Benchmark
System Performance TargetFor Degree to Enrollment Ratios
Bachelor’s 21.5% Master’s 67.0%
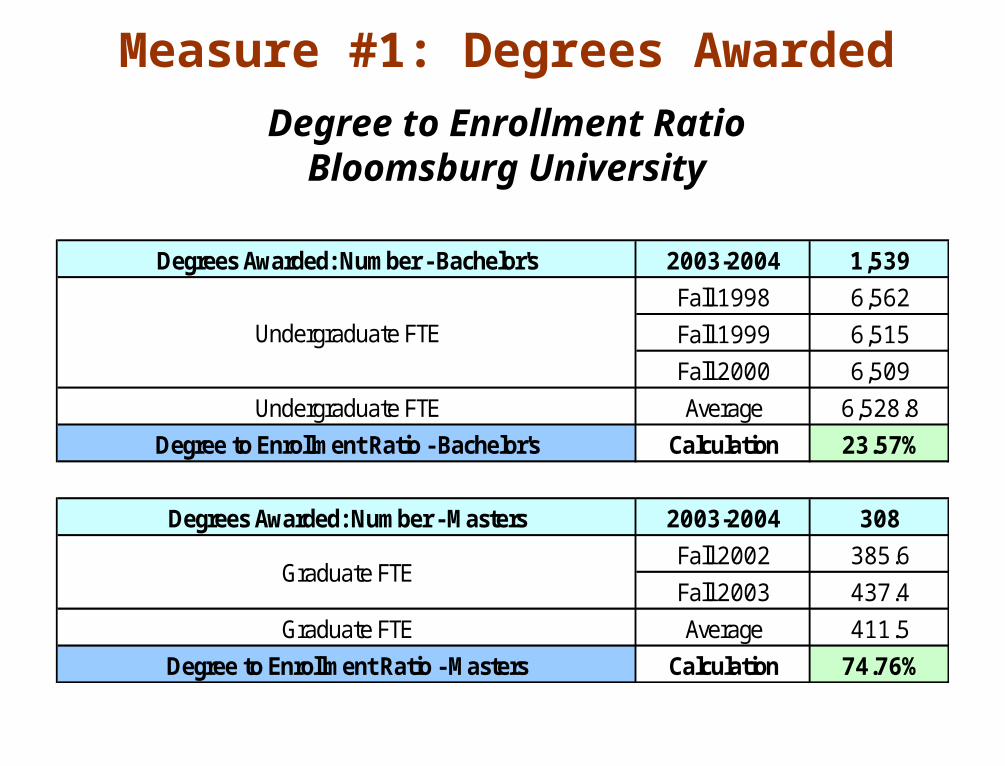
Degree to Enrollment RatioBloomsburg University
Measure #1: Degrees Awarded
Degrees Awarded: Number - Bachelor's 2003-2004 1,539
Fall 1998 6,562
Fall 1999 6,515
Fall 2000 6,509
Undergraduate FTE Average 6,528.8
Degree to Enrollment Ratio - Bachelor's Calculation 23.57%
Degrees Awarded: Number - Masters 2003-2004 308
Fall 2002 385.6
Fall 2003 437.4
Graduate FTE Average 411.5
Degree to Enrollment Ratio - Masters Calculation 74.76%
Undergraduate FTE
Graduate FTE
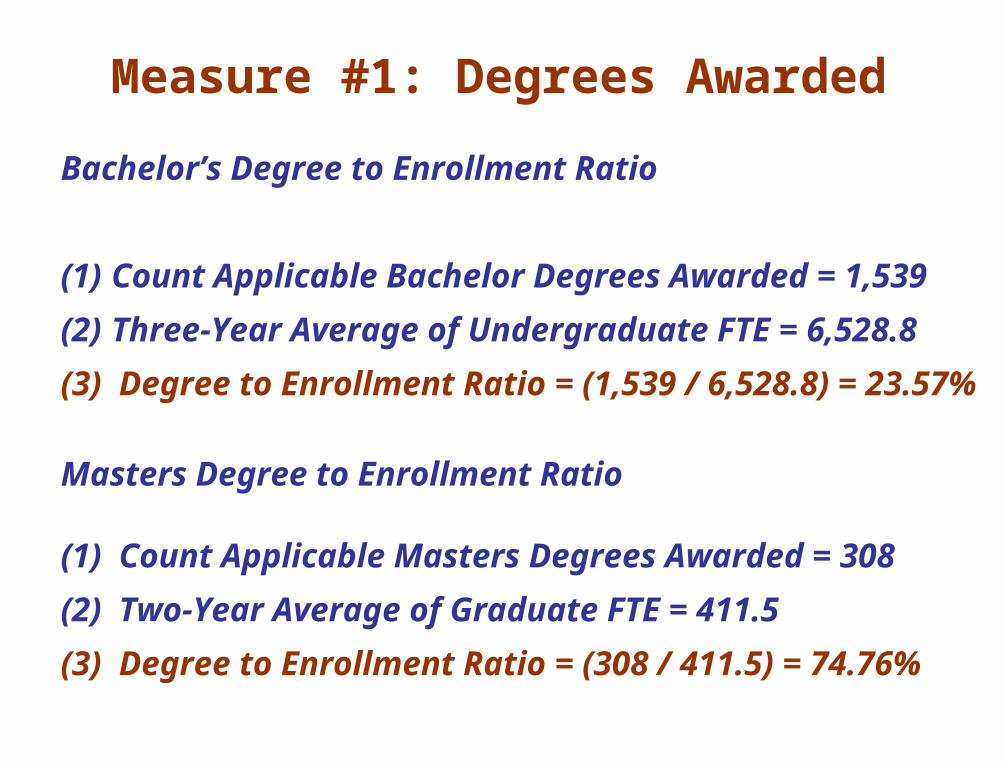
Measure #1: Degrees Awarded
Bachelor’s Degree to Enrollment Ratio
(1) Count Applicable Bachelor Degrees
Awarded = 1,539
(2) Three-Year Average of Undergraduate
FTE = 6,528.8
(3) Degree to Enrollment Ratio = (1,539 /
6,528.8) = 23.57%
Masters Degree to Enrollment Ratio
(1) Count Applicable Masters Degrees Awarded
= 308
(2) Two-Year Average of Graduate FTE = 411.5
(3) Degree to Enrollment Ratio = (308 / 411.5) =
74.76%
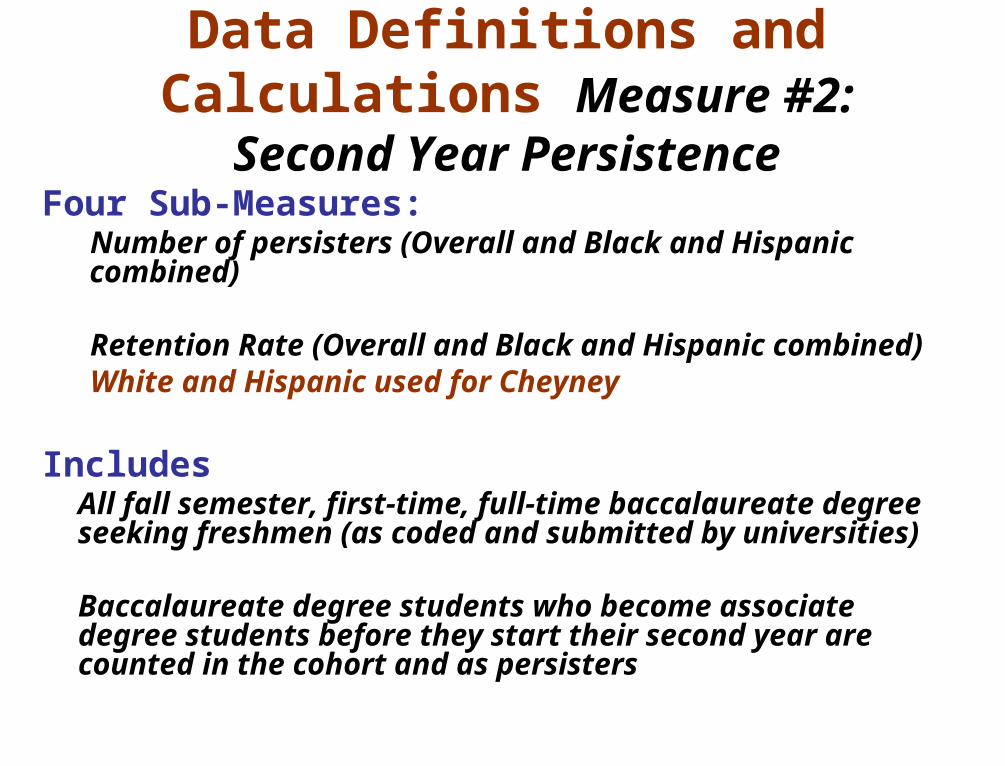
Data Definitions and Calculations Measure #2: Second
Year PersistenceFour Sub-Measures:
Number of persisters (Overall and Black and Hispanic combined)
Retention Rate (Overall and Black and Hispanic combined)White and Hispanic used for Cheyney
IncludesAll fall semester, first-time, full-time baccalaureate degree seeking freshmen (as coded and submitted by universities)
Baccalaureate degree students who become associate degree students before they start their second year are counted in the cohort and as persisters
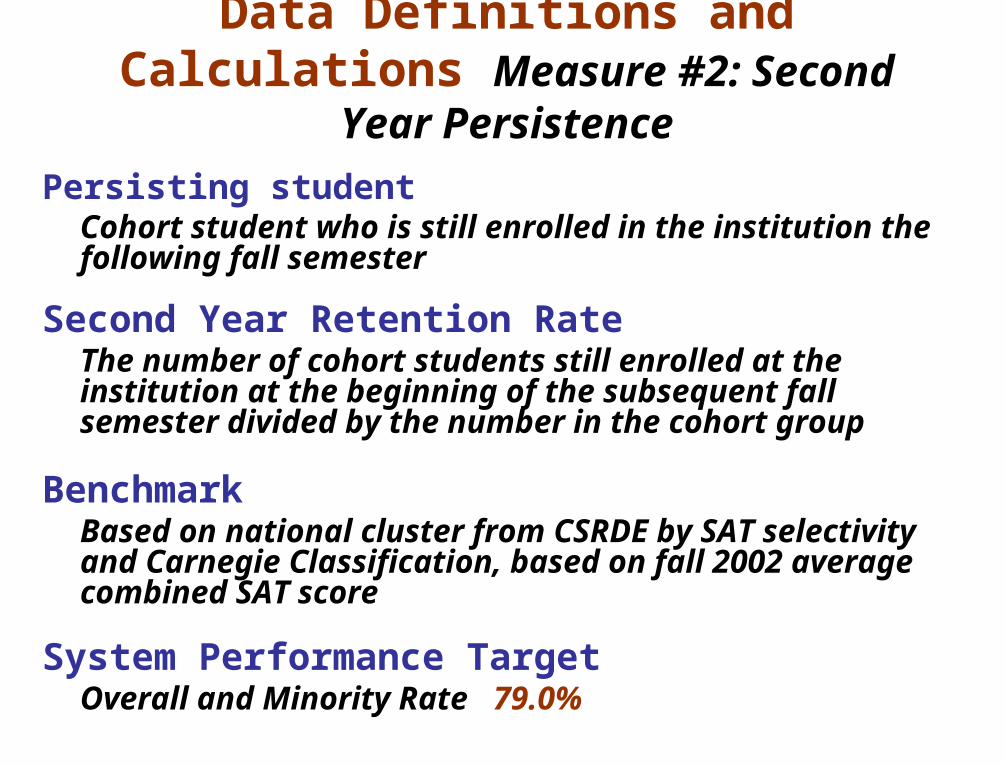
Data Definitions and Calculations Measure #2: Second Year
Persistence
Persisting studentCohort student who is still enrolled in the institution the following fall semester
Second Year Retention RateThe number of cohort students still enrolled at the institution at the beginning of the subsequent fall semester divided by the number in the cohort group
BenchmarkBased on national cluster from CSRDE by SAT selectivity and Carnegie Classification, based on fall 2002 average combined SAT score
System Performance Target Overall and Minority Rate 79.0%
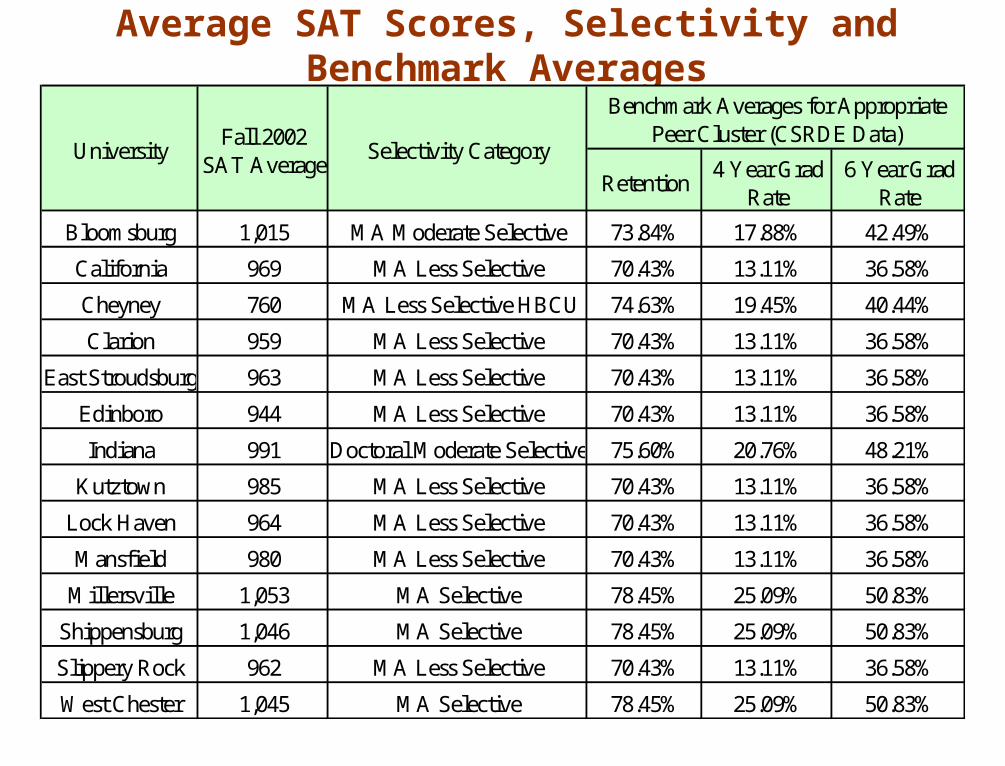
Average SAT Scores, Selectivity and Benchmark Averages
Retention4 Year Grad
Rate6 Year Grad
Rate
Bloomsburg 1,015 MA Moderate Selective 73.84% 17.88% 42.49%
California 969 MA Less Selective 70.43% 13.11% 36.58%
Cheyney 760 MA Less Selective HBCU 74.63% 19.45% 40.44%
Clarion 959 MA Less Selective 70.43% 13.11% 36.58%
East Stroudsburg 963 MA Less Selective 70.43% 13.11% 36.58%
Edinboro 944 MA Less Selective 70.43% 13.11% 36.58%
Indiana 991 Doctoral Moderate Selective 75.60% 20.76% 48.21%
Kutztown 985 MA Less Selective 70.43% 13.11% 36.58%
Lock Haven 964 MA Less Selective 70.43% 13.11% 36.58%
Mansfield 980 MA Less Selective 70.43% 13.11% 36.58%
Millersville 1,053 MA Selective 78.45% 25.09% 50.83%
Shippensburg 1,046 MA Selective 78.45% 25.09% 50.83%
Slippery Rock 962 MA Less Selective 70.43% 13.11% 36.58%
West Chester 1,045 MA Selective 78.45% 25.09% 50.83%
UniversityFall 2002
SAT AverageSelectivity Category
Benchmark Averages for Appropriate Peer Cluster (CSRDE Data)
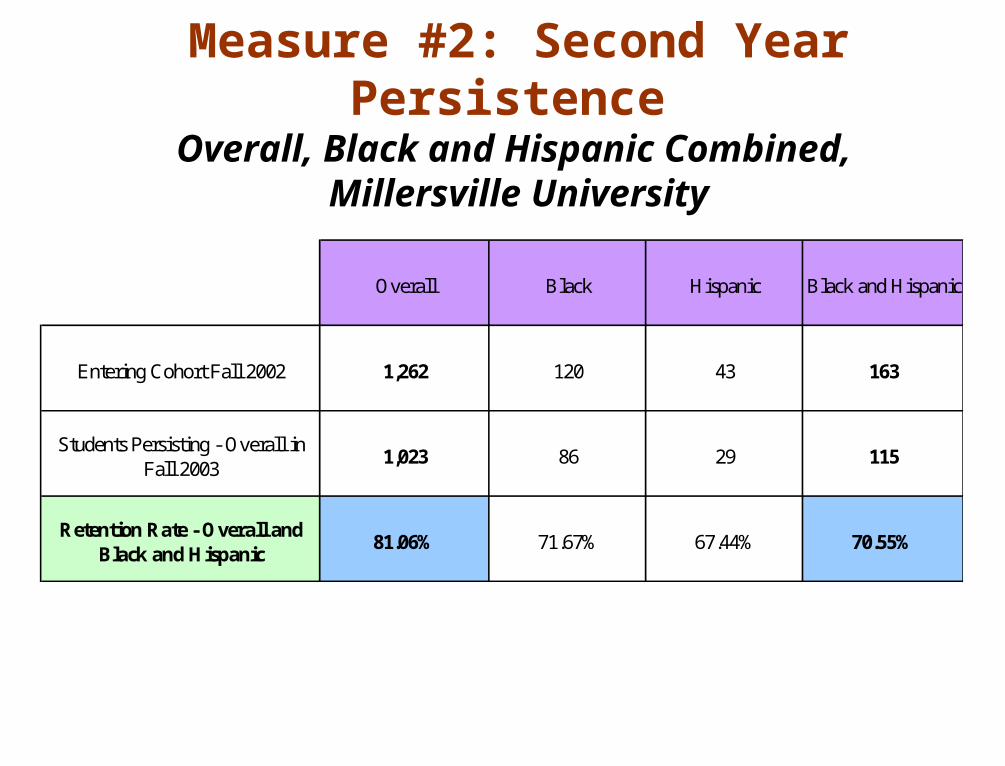
Measure #2: Second Year Persistence Overall, Black and Hispanic Combined,
Millersville University
Overall Black Hispanic Black and Hispanic
Entering Cohort Fall 2002 1,262 120 43 163
Students Persisting - Overall in Fall 2003
1,023 86 29 115
Retention Rate - Overall and Black and Hispanic
81.06% 71.67% 67.44% 70.55%
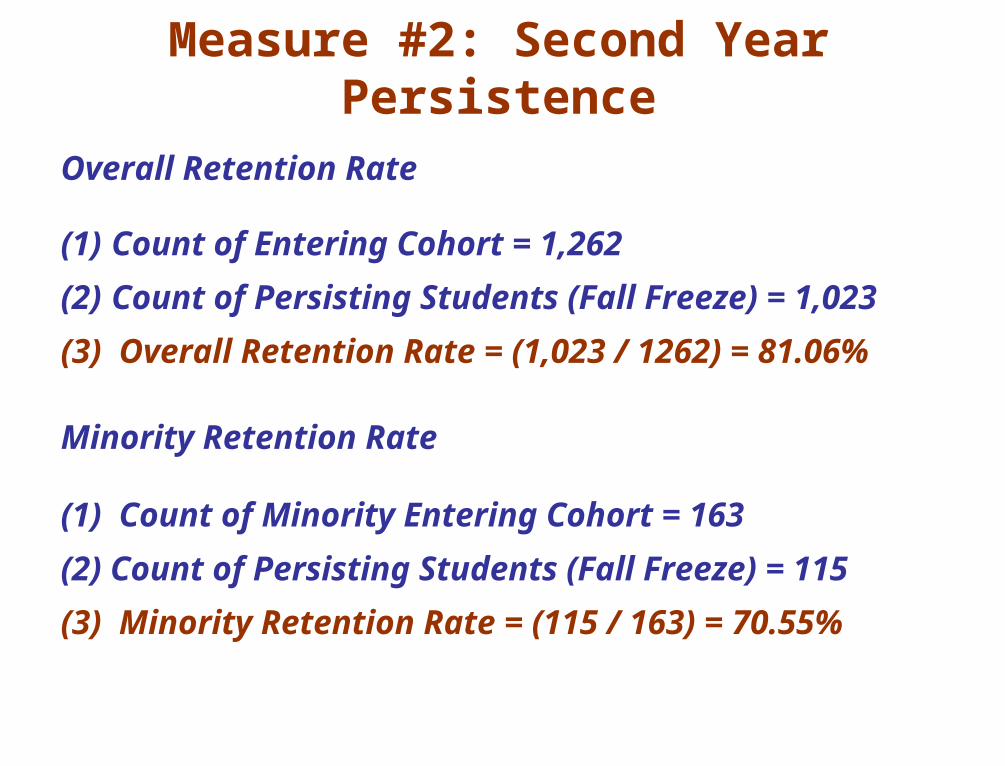
Measure #2: Second Year Persistence
Overall Retention Rate
(1) Count of Entering Cohort = 1,262
(2) Count of Persisting Students (Fall
Freeze) = 1,023
(3) Overall Retention Rate = (1,023 / 1262) =
81.06%
Minority Retention Rate
(1) Count of Minority Entering Cohort = 163
(2) Count of Persisting Students (Fall Freeze)
= 115
(3) Minority Retention Rate = (115 / 163) =
70.55%
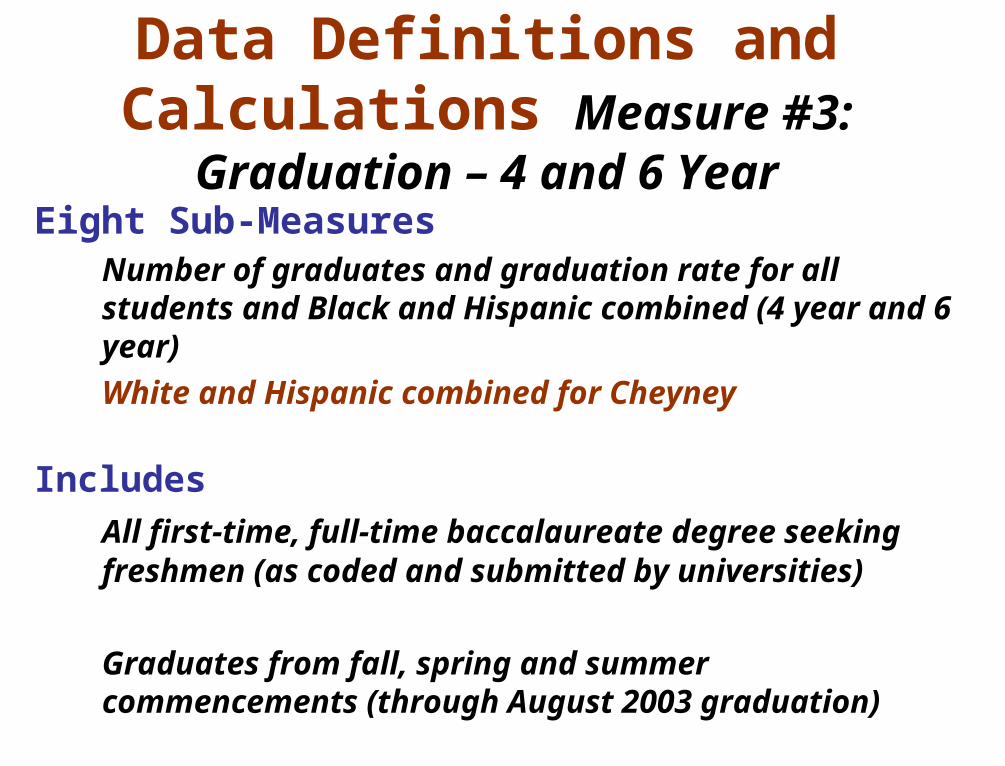
Data Definitions and Calculations Measure #3:
Graduation – 4 and 6 YearEight Sub-Measures
Number of graduates and graduation rate for all students and Black and Hispanic combined (4 year and 6 year)
White and Hispanic combined for Cheyney
Includes
All first-time, full-time baccalaureate degree seeking freshmen (as coded and submitted by universities)
Graduates from fall, spring and summer commencements (through August 2003 graduation)
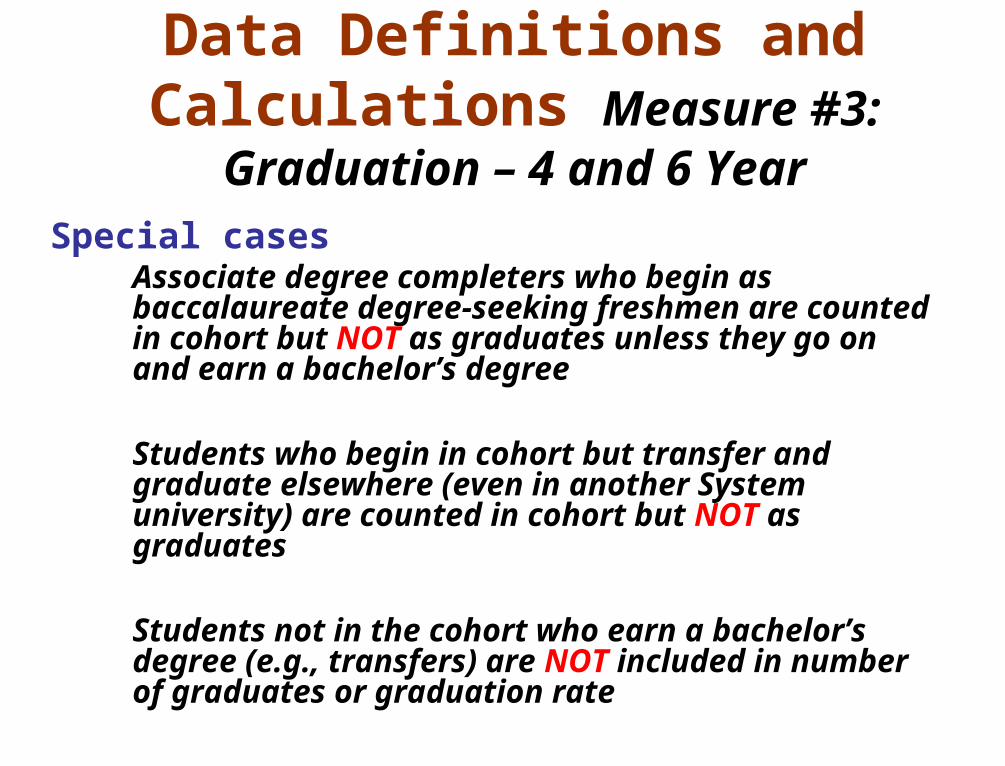
Data Definitions and Calculations Measure #3:
Graduation – 4 and 6 YearSpecial cases
Associate degree completers who begin as baccalaureate degree-seeking freshmen are counted in cohort but NOT as graduates unless they go on and earn a bachelor’s degree
Students who begin in cohort but transfer and graduate elsewhere (even in another System university) are counted in cohort but NOT as graduates
Students not in the cohort who earn a bachelor’s degree (e.g., transfers) are NOT included in number of graduates or graduation rate
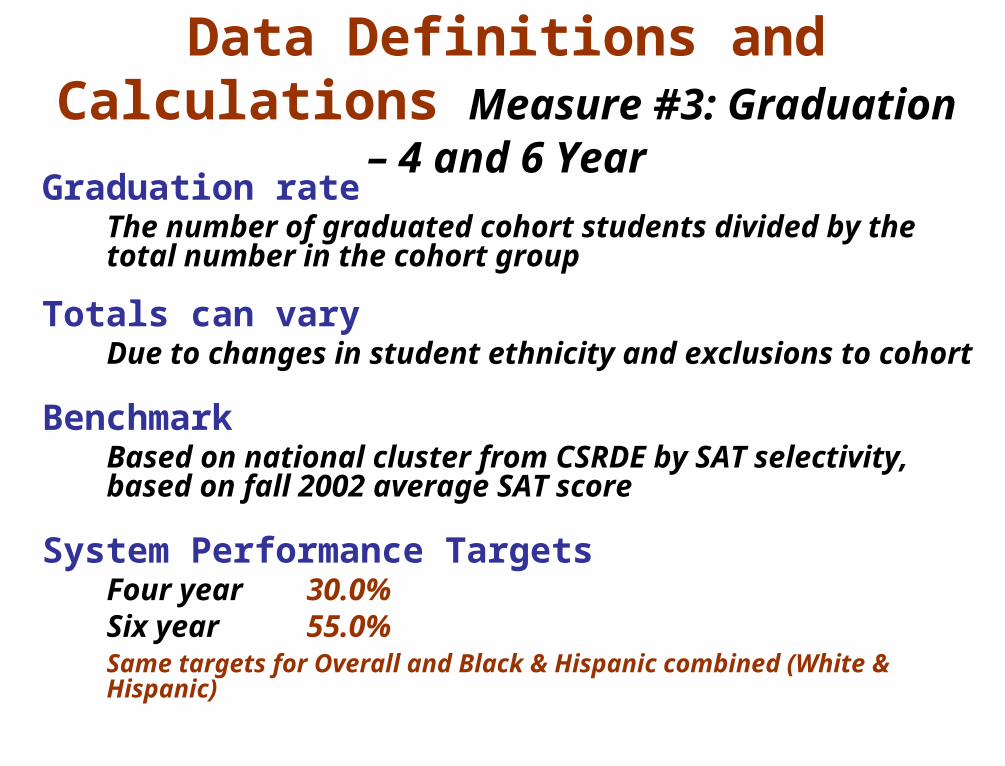
Data Definitions and Calculations Measure #3: Graduation – 4
and 6 YearGraduation rate
The number of graduated cohort students divided by the total number in the cohort group
Totals can varyDue to changes in student ethnicity and exclusions to cohort
BenchmarkBased on national cluster from CSRDE by SAT selectivity, based on fall 2002 average SAT score
System Performance TargetsFour year 30.0%Six year 55.0%Same targets for Overall and Black & Hispanic combined (White & Hispanic)
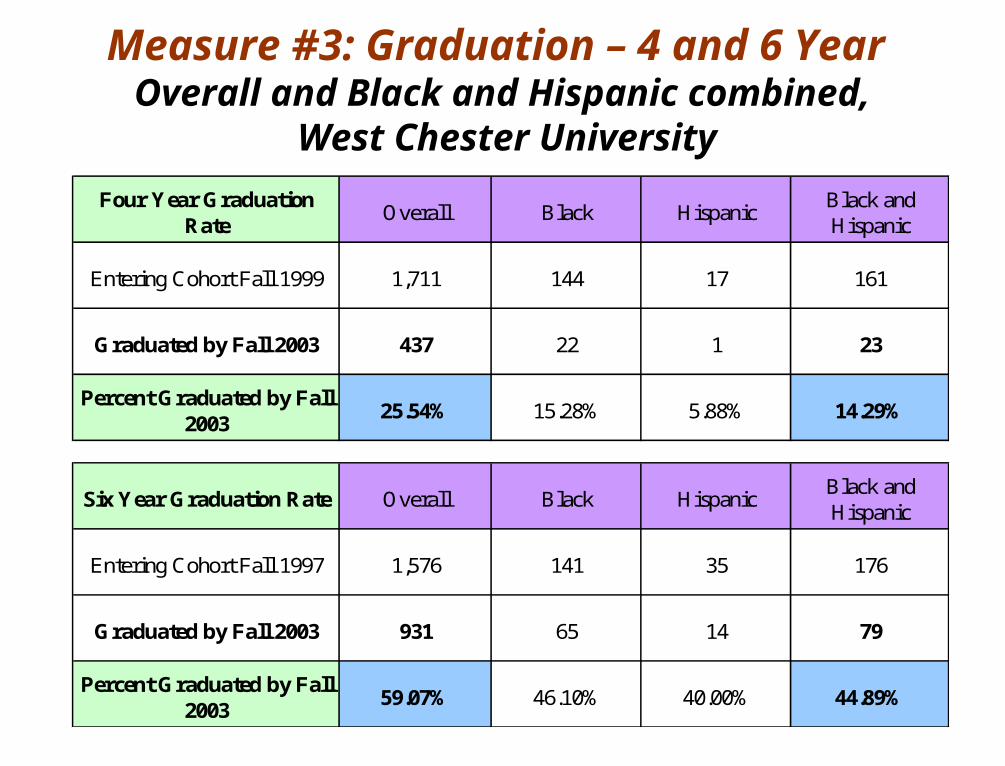
Measure #3: Graduation – 4 and 6 Year Overall and Black and Hispanic combined,
West Chester University
Four Year Graduation Rate
Overall Black HispanicBlack and Hispanic
Entering Cohort Fall 1999 1,711 144 17 161
Graduated by Fall 2003 437 22 1 23
Percent Graduated by Fall 2003
25.54% 15.28% 5.88% 14.29%
Six Year Graduation Rate Overall Black HispanicBlack and Hispanic
Entering Cohort Fall 1997 1,576 141 35 176
Graduated by Fall 2003 931 65 14 79
Percent Graduated by Fall 2003
59.07% 46.10% 40.00% 44.89%
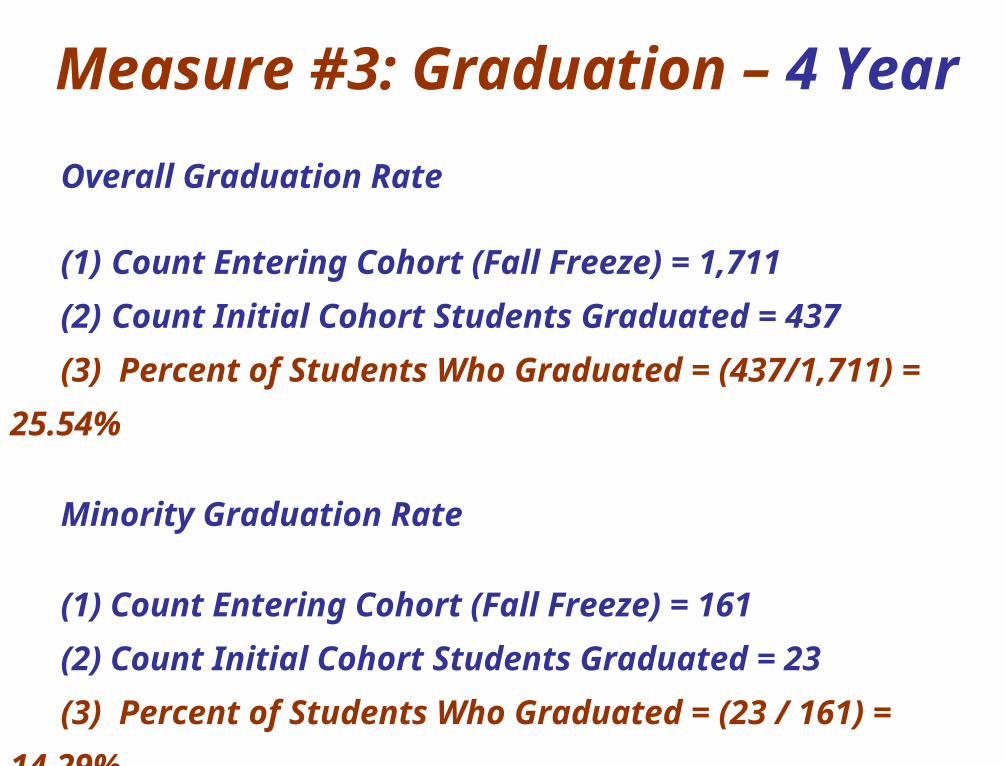
Measure #3: Graduation – 4 Year
Overall Graduation Rate
(1) Count Entering Cohort (Fall Freeze) =
1,711
(2) Count Initial Cohort Students Graduated
= 437
(3) Percent of Students Who Graduated =
(437/1,711) = 25.54%
Minority Graduation Rate
(1) Count Entering Cohort (Fall Freeze) = 161
(2) Count Initial Cohort Students Graduated = 23
(3) Percent of Students Who Graduated = (23 /
161) = 14.29%
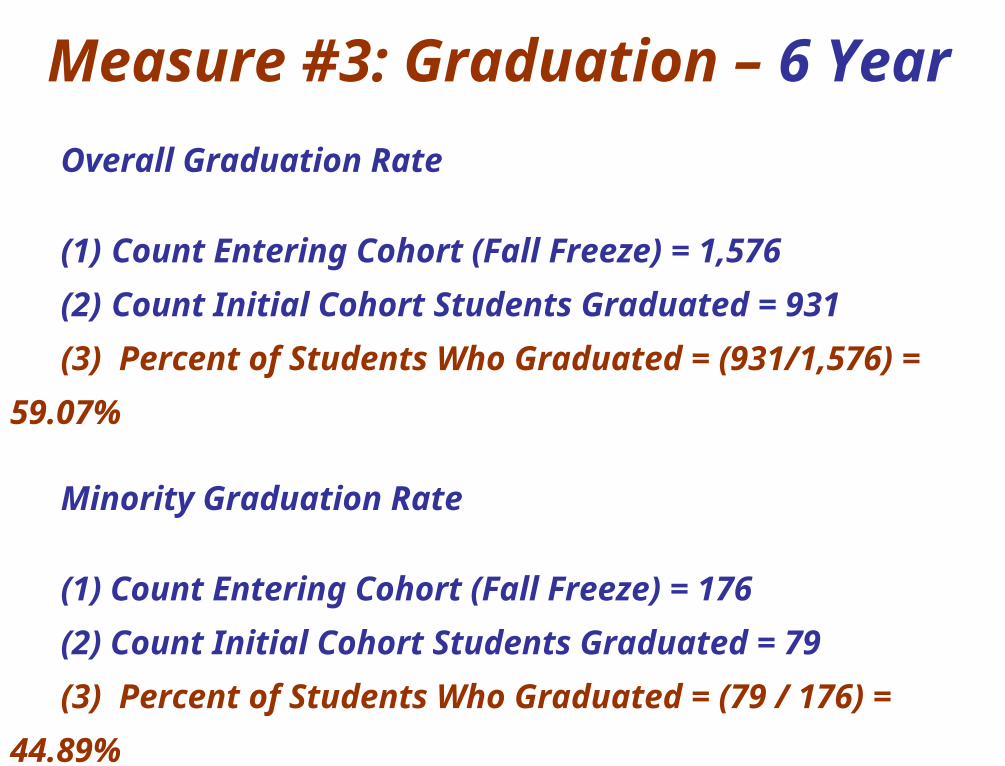
Measure #3: Graduation – 6 Year
Overall Graduation Rate
(1) Count Entering Cohort (Fall Freeze) =
1,576
(2) Count Initial Cohort Students Graduated
= 931
(3) Percent of Students Who Graduated =
(931/1,576) = 59.07%
Minority Graduation Rate
(1) Count Entering Cohort (Fall Freeze) = 176
(2) Count Initial Cohort Students Graduated = 79
(3) Percent of Students Who Graduated = (79 /
176) = 44.89%
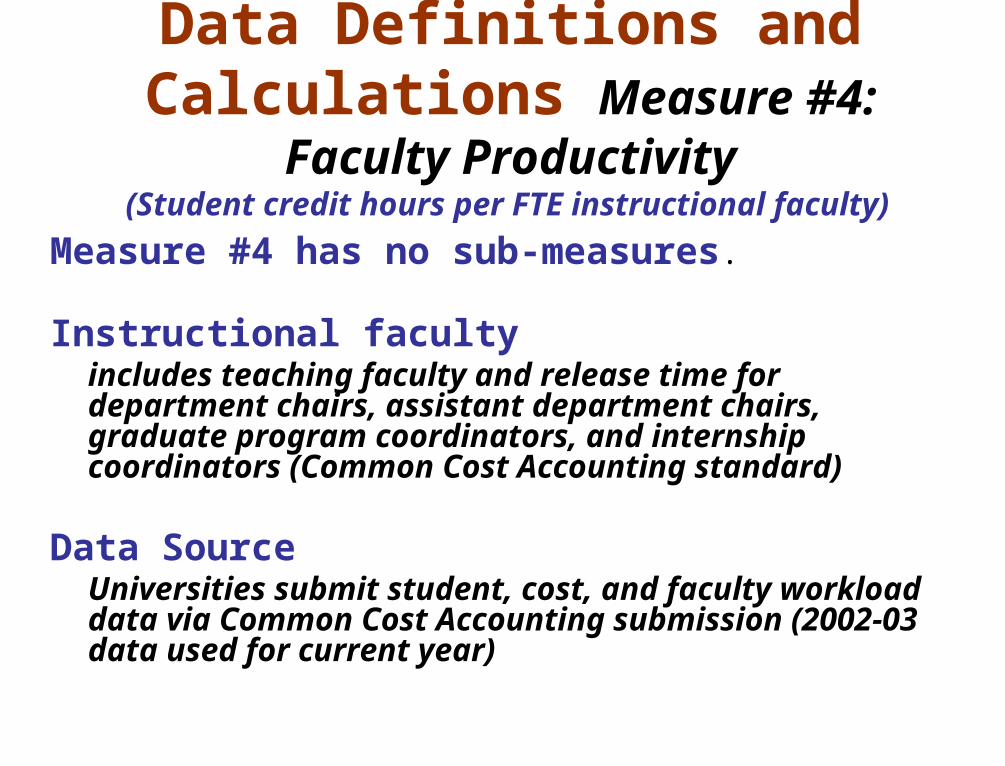
Data Definitions and Calculations Measure #4: Faculty
Productivity (Student credit hours per FTE instructional faculty)
Measure #4 has no sub-measures.
Instructional faculty includes teaching faculty and release time for department chairs, assistant department chairs, graduate program coordinators, and internship coordinators (Common Cost Accounting standard)
Data SourceUniversities submit student, cost, and faculty workload data via Common Cost Accounting submission (2002-03 data used for current year)
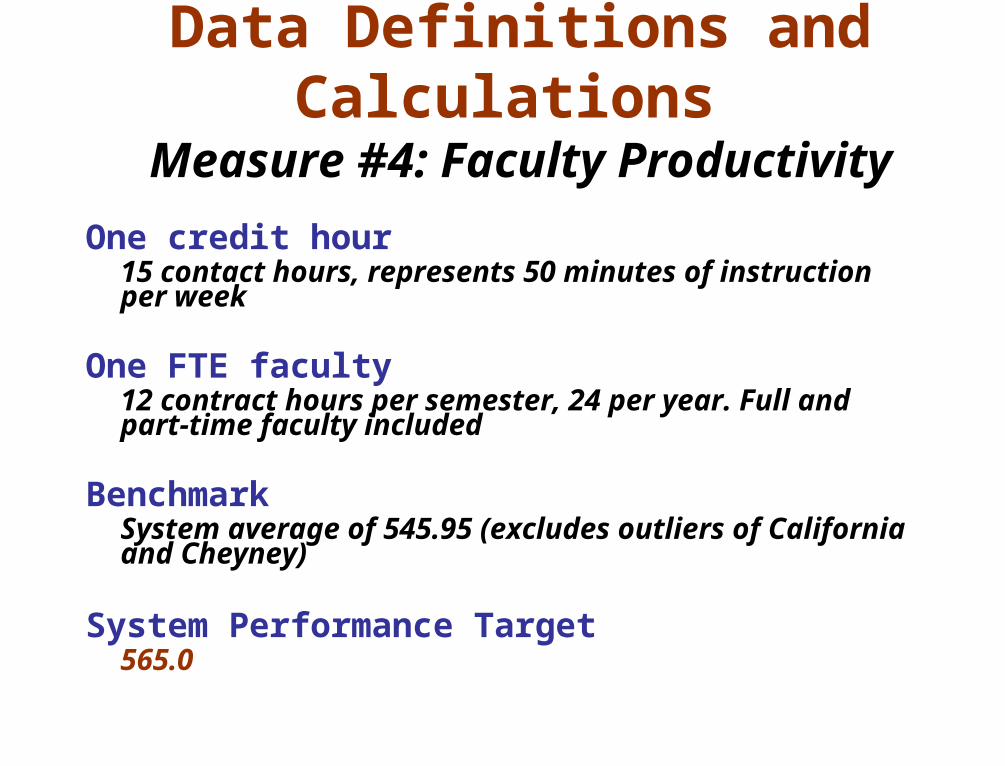
Data Definitions and Calculations
Measure #4: Faculty Productivity
One credit hour15 contact hours, represents 50 minutes of instruction per week
One FTE faculty12 contract hours per semester, 24 per year. Full and part-time faculty included
BenchmarkSystem average of 545.95 (excludes outliers of California and Cheyney)
System Performance Target565.0
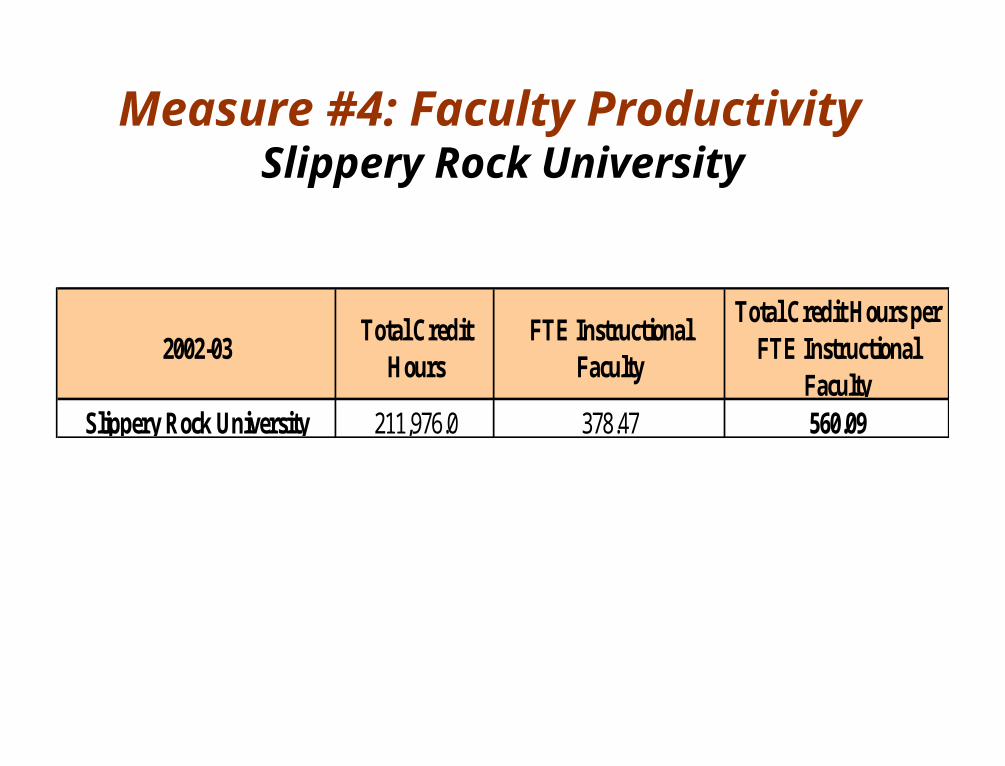
Measure #4: Faculty Productivity Slippery Rock University
2002-03Total Credit
HoursFTE Instructional
Faculty
Total Credit Hours per FTE Instructional
FacultySlippery Rock University 211,976.0 378.47 560.09
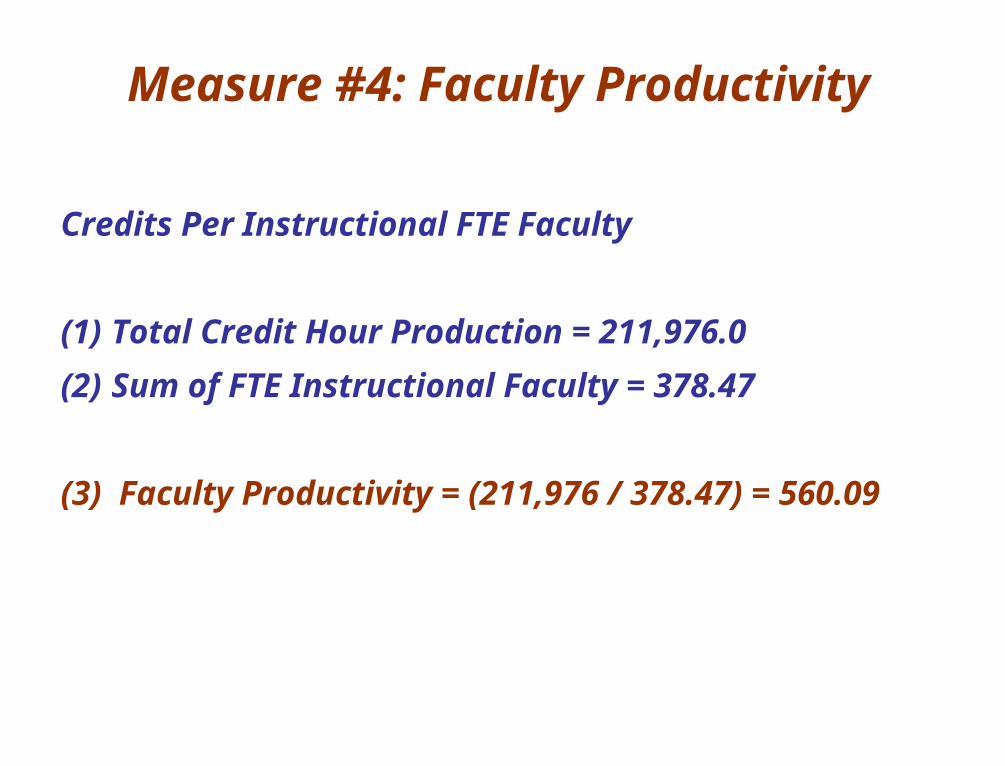
Measure #4: Faculty Productivity
Credits Per Instructional FTE Faculty
(1) Total Credit Hour Production = 211,976.0
(2) Sum of FTE Instructional Faculty =
378.47
(3) Faculty Productivity = (211,976 / 378.47) =
560.09
Data Definitions and Calculations
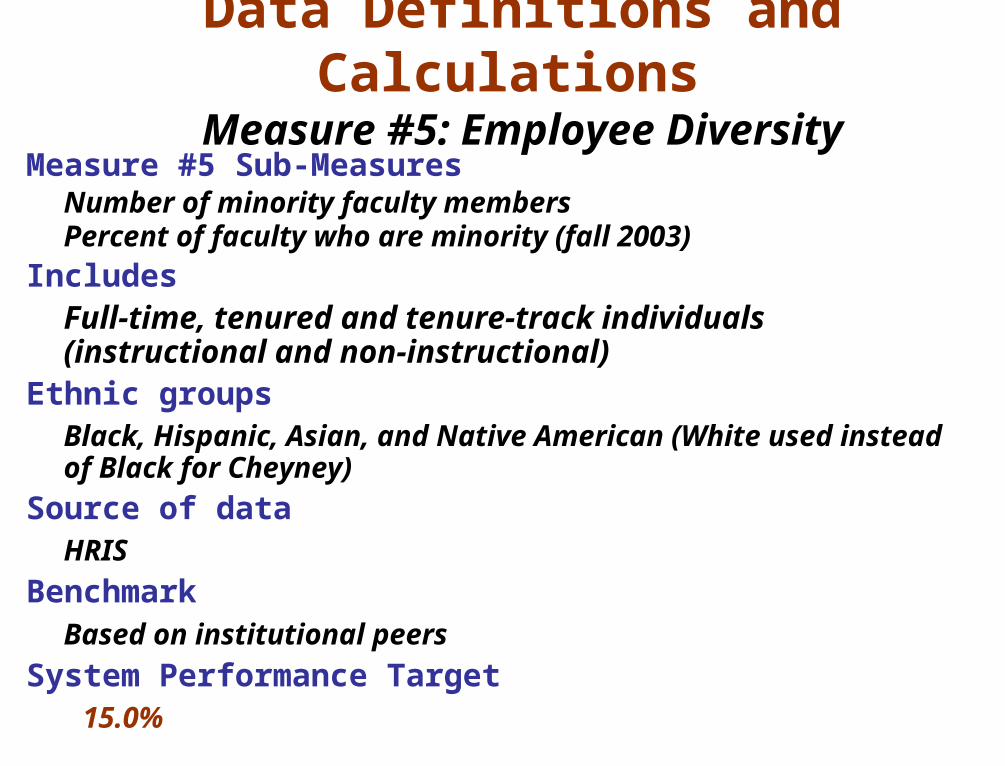
Measure #5: Employee DiversityMeasure #5 Sub-Measures
Number of minority faculty membersPercent of faculty who are minority (fall 2003)
Includes Full-time, tenured and tenure-track individuals (instructional and non-instructional)
Ethnic groupsBlack, Hispanic, Asian, and Native American (White used instead of Black for Cheyney)
Source of dataHRIS
BenchmarkBased on institutional peers
System Performance Target 15.0%
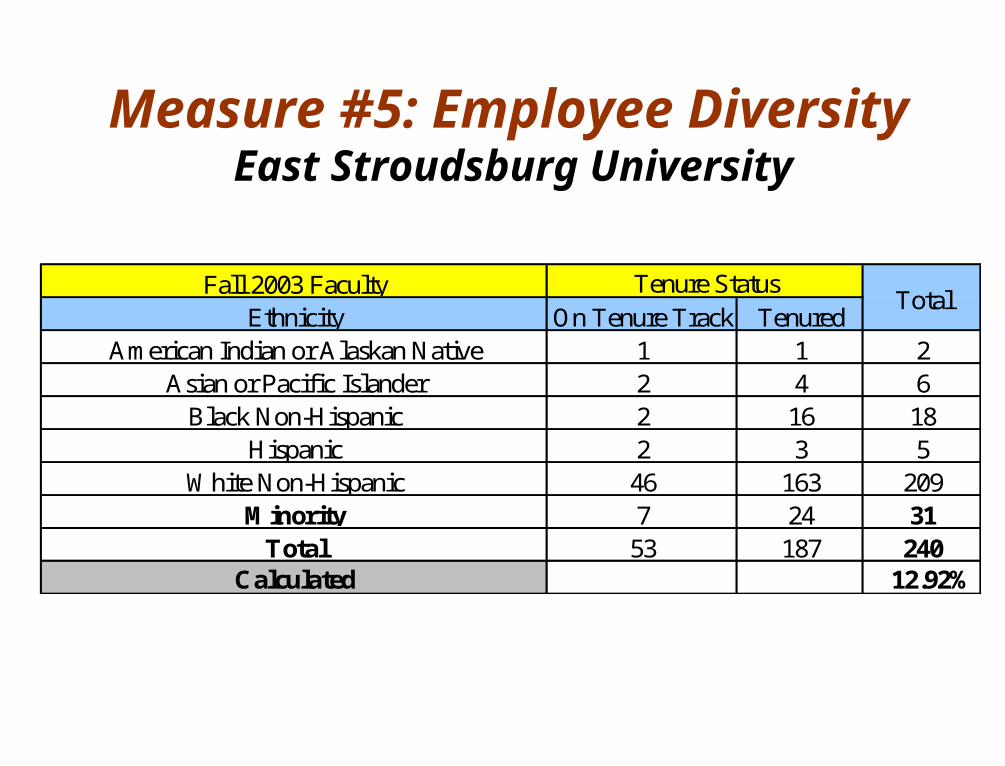
Measure #5: Employee Diversity East Stroudsburg University
Fall 2003 FacultyEthnicity On Tenure Track Tenured
American Indian or Alaskan Native 1 1 2Asian or Pacific Islander 2 4 6
Black Non-Hispanic 2 16 18Hispanic 2 3 5
White Non-Hispanic 46 163 209Minority 7 24 31
Total 53 187 240Calculated 12.92%
Tenure StatusTotal
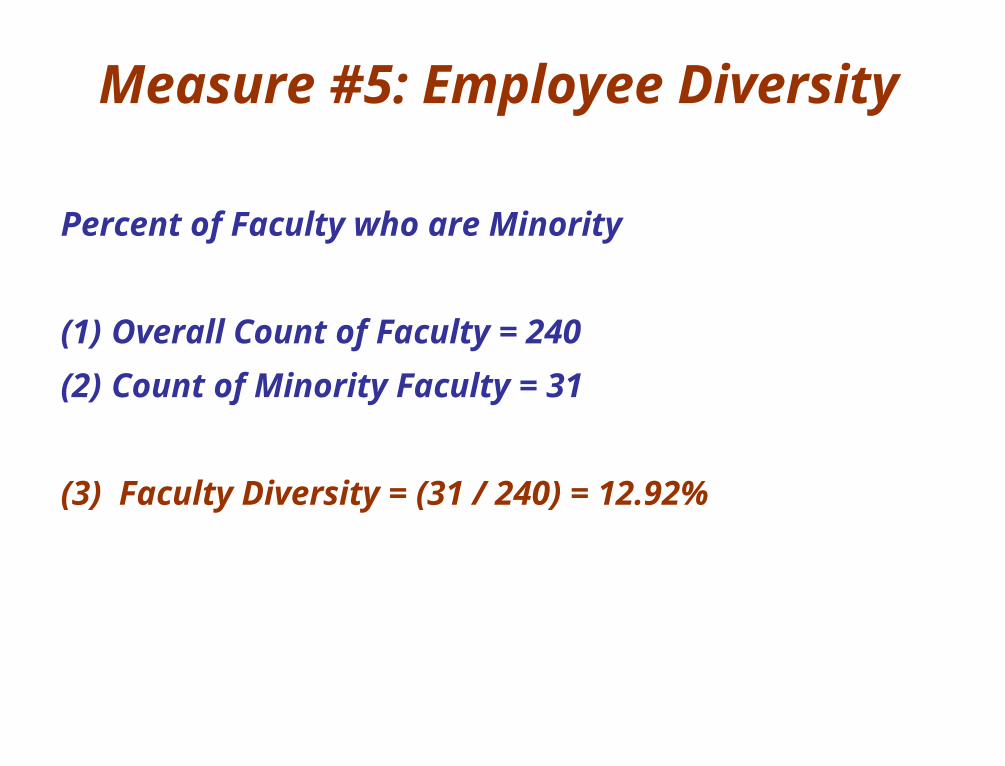
Measure #5: Employee Diversity
Percent of Faculty who are Minority
(1) Overall Count of Faculty = 240
(2) Count of Minority Faculty = 31
(3) Faculty Diversity = (31 / 240) = 12.92%
Data Definitions and Calculations
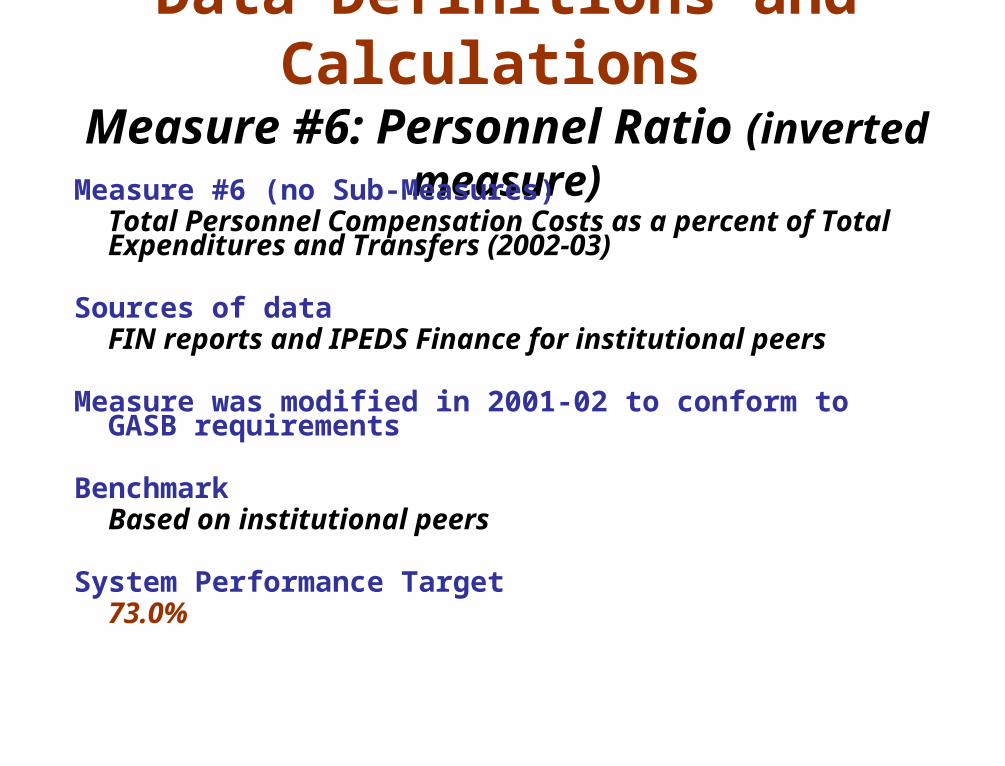
Measure #6: Personnel Ratio (inverted measure)Measure #6 (no Sub-Measures)
Total Personnel Compensation Costs as a percent of Total Expenditures and Transfers (2002-03)
Sources of dataFIN reports and IPEDS Finance for institutional peers
Measure was modified in 2001-02 to conform to GASB requirements
BenchmarkBased on institutional peers
System Performance Target73.0%
Data Definitions and Calculations
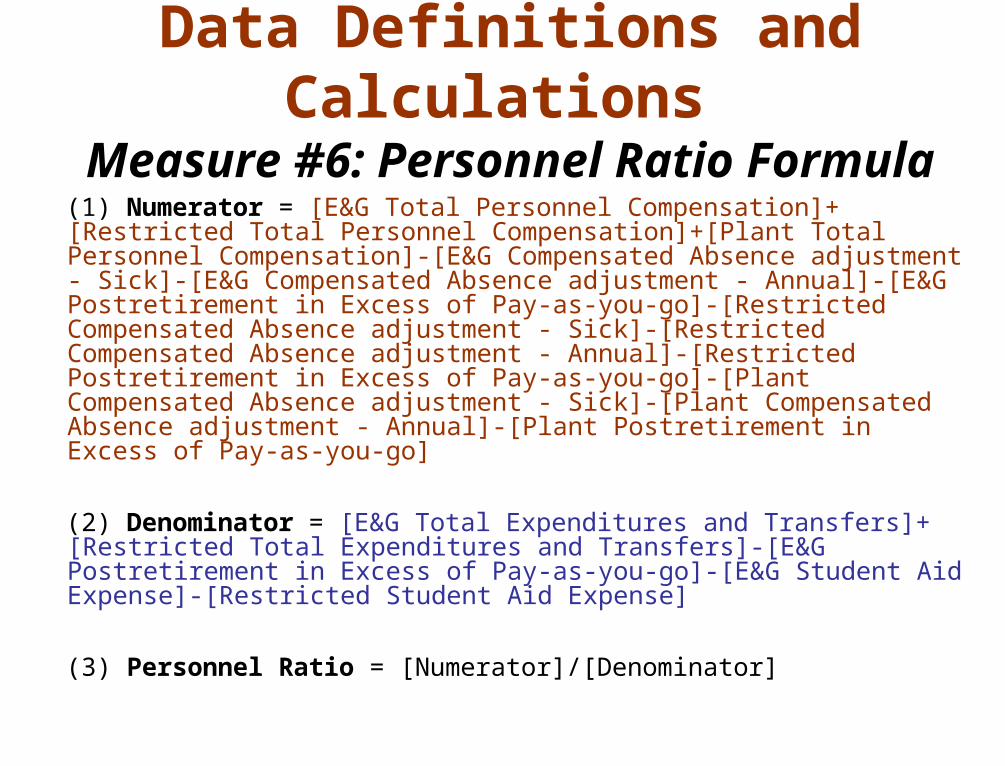
Measure #6: Personnel Ratio Formula(1) Numerator = [E&G Total Personnel Compensation]+[Restricted Total Personnel Compensation]+[Plant Total Personnel Compensation]-[E&G Compensated Absence adjustment - Sick]-[E&G Compensated Absence adjustment - Annual]-[E&G Postretirement in Excess of Pay-as-you-go]-[Restricted Compensated Absence adjustment - Sick]-[Restricted Compensated Absence adjustment - Annual]-[Restricted Postretirement in Excess of Pay-as-you-go]-[Plant Compensated Absence adjustment - Sick]-[Plant Compensated Absence adjustment - Annual]-[Plant Postretirement in Excess of Pay-as-you-go]
(2) Denominator = [E&G Total Expenditures and Transfers]+[Restricted Total Expenditures and Transfers]-[E&G Postretirement in Excess of Pay-as-you-go]-[E&G Student Aid Expense]-[Restricted Student Aid Expense]
(3) Personnel Ratio = [Numerator]/[Denominator]
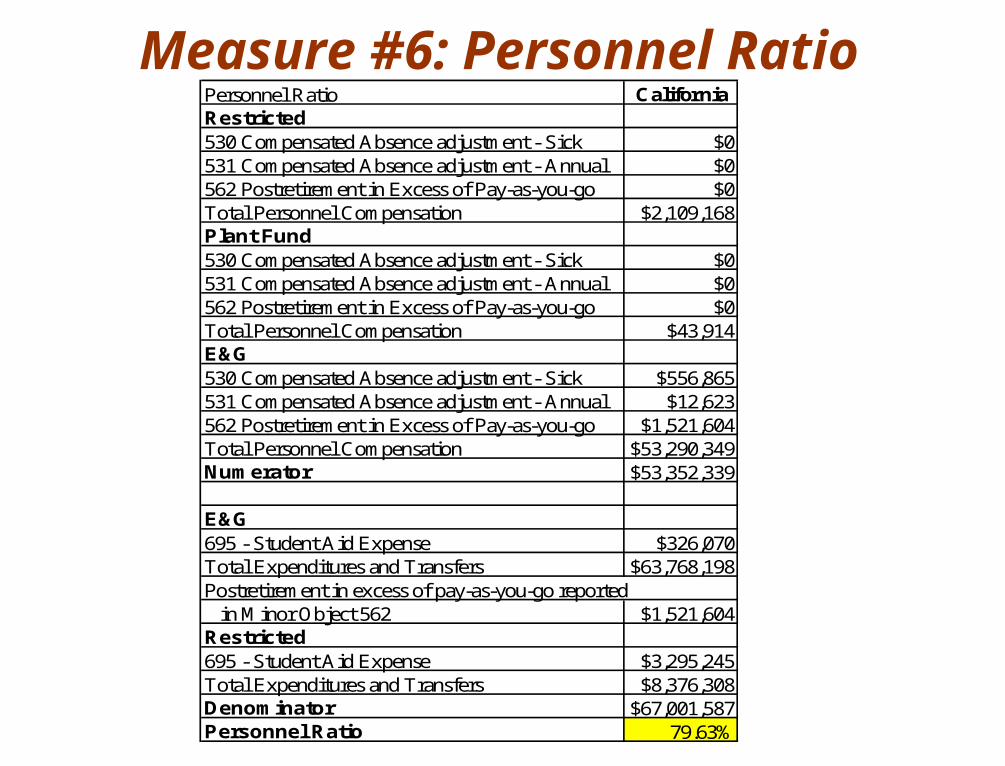
Personnel Ratio CaliforniaRestricted530 Compensated Absence adjustment - Sick $0531 Compensated Absence adjustment - Annual $0562 Postretirement in Excess of Pay-as-you-go $0Total Personnel Compensation $2,109,168Plant Fund530 Compensated Absence adjustment - Sick $0531 Compensated Absence adjustment - Annual $0562 Postretirement in Excess of Pay-as-you-go $0Total Personnel Compensation $43,914E&G530 Compensated Absence adjustment - Sick $556,865531 Compensated Absence adjustment - Annual $12,623562 Postretirement in Excess of Pay-as-you-go $1,521,604Total Personnel Compensation $53,290,349Numerator $53,352,339
E&G695 - Student Aid Expense $326,070Total Expenditures and Transfers $63,768,198Postretirement in excess of pay-as-you-go reported in Minor Object 562 $1,521,604Restricted695 - Student Aid Expense $3,295,245Total Expenditures and Transfers $8,376,308Denominator $67,001,587Personnel Ratio 79.63%
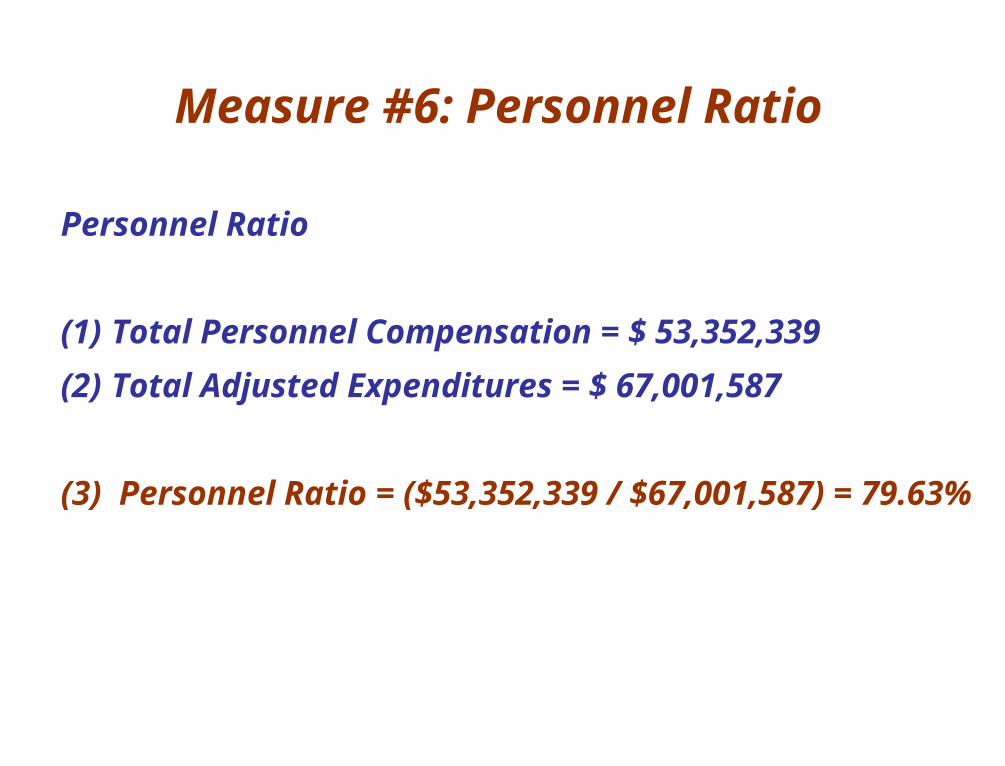
Measure #6: Personnel Ratio
Measure #6: Personnel Ratio
Personnel Ratio
(1) Total Personnel Compensation = $
53,352,339
(2) Total Adjusted Expenditures = $
67,001,587
(3) Personnel Ratio = ($53,352,339 /
$67,001,587) = 79.63%
Data Definitions and Calculations
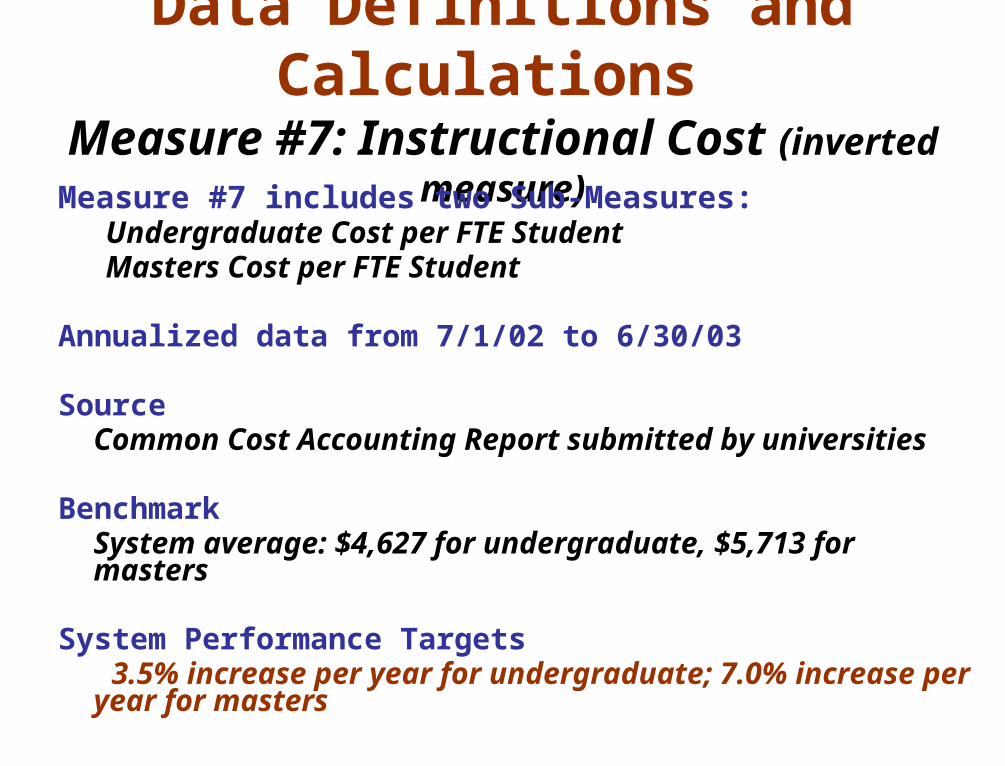
Measure #7: Instructional Cost (inverted measure)Measure #7 includes two Sub-Measures:
Undergraduate Cost per FTE StudentMasters Cost per FTE Student
Annualized data from 7/1/02 to 6/30/03
SourceCommon Cost Accounting Report submitted by universities
BenchmarkSystem average: $4,627 for undergraduate, $5,713 for masters
System Performance Targets 3.5% increase per year for undergraduate; 7.0% increase per year for masters
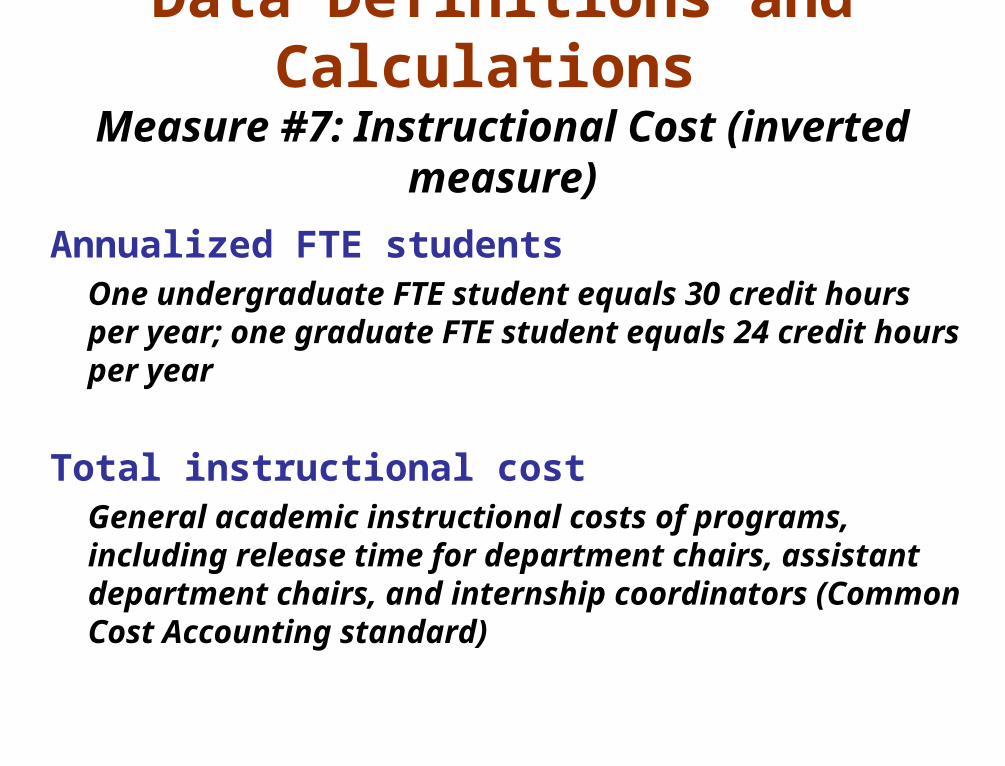
Data Definitions and Calculations
Measure #7: Instructional Cost (inverted measure)
Annualized FTE studentsOne undergraduate FTE student equals 30 credit hours per year; one graduate FTE student equals 24 credit hours per year
Total instructional costGeneral academic instructional costs of programs, including release time for department chairs, assistant department chairs, and internship coordinators (Common Cost Accounting standard)
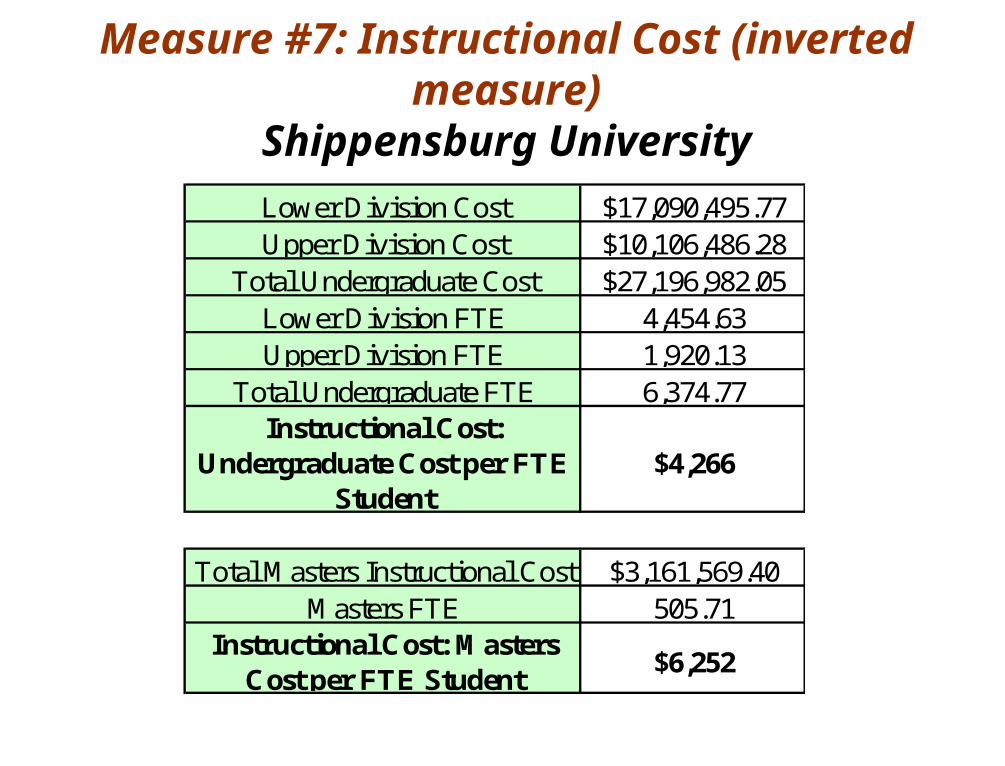
Measure #7: Instructional Cost (inverted measure)Shippensburg University
Lower Division Cost $17,090,495.77Upper Division Cost $10,106,486.28
Total Undergraduate Cost $27,196,982.05Lower Division FTE 4,454.63Upper Division FTE 1,920.13
Total Undergraduate FTE 6,374.77Instructional Cost:
Undergraduate Cost per FTE Student
$4,266
Total Masters Instructional Cost $3,161,569.40Masters FTE 505.71
Instructional Cost: Masters Cost per FTE Student
$6,252
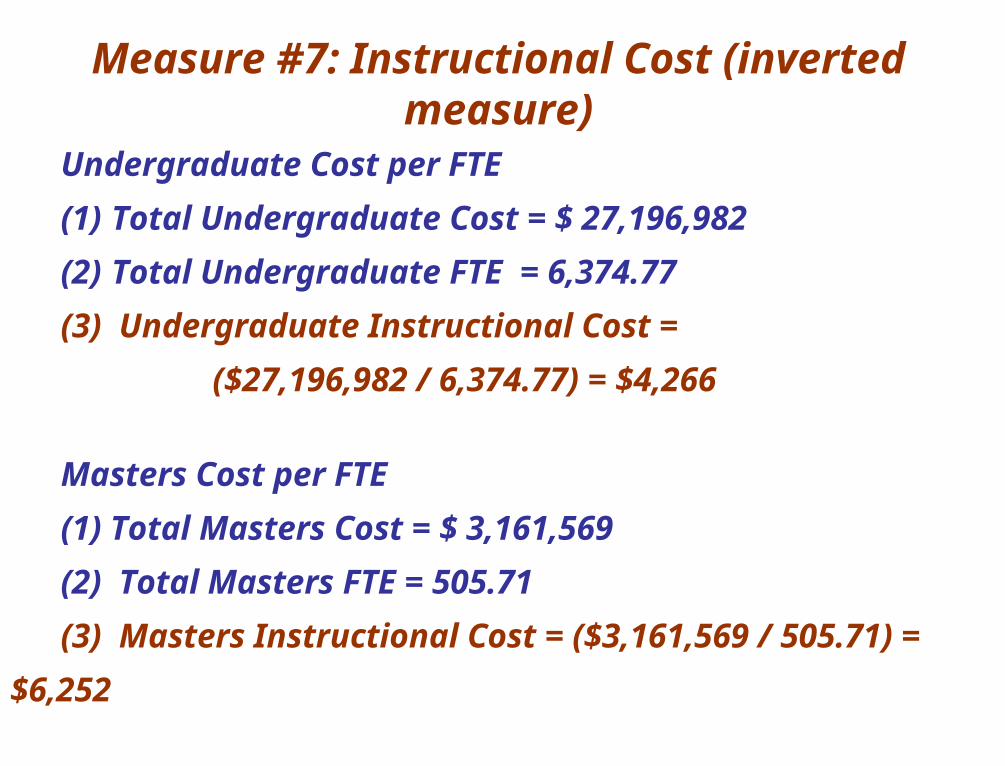
Measure #7: Instructional Cost (inverted measure)
Undergraduate Cost per FTE
(1) Total Undergraduate Cost = $ 27,196,982
(2) Total Undergraduate FTE = 6,374.77
(3) Undergraduate Instructional Cost =
($27,196,982 / 6,374.77) = $4,266
Masters Cost per FTE
(1) Total Masters Cost = $ 3,161,569
(2) Total Masters FTE = 505.71
(3) Masters Instructional Cost = ($3,161,569 /
505.71) = $6,252
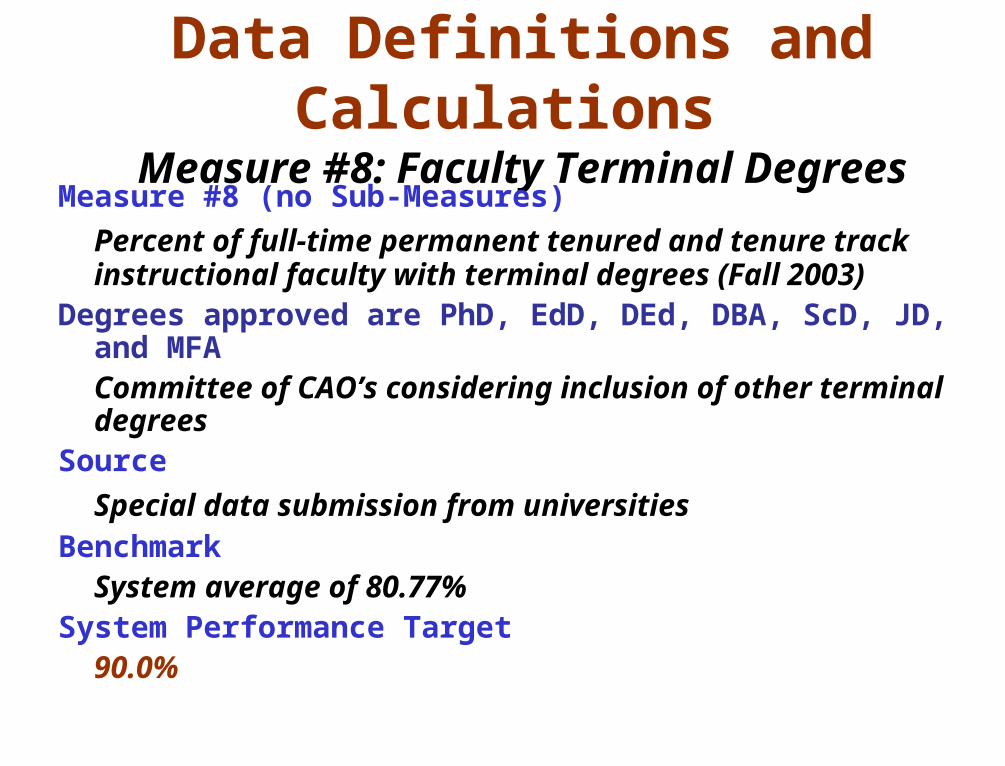
Data Definitions and Calculations
Measure #8: Faculty Terminal DegreesMeasure #8 (no Sub-Measures)
Percent of full-time permanent tenured and tenure track instructional faculty with terminal degrees (Fall 2003)
Degrees approved are PhD, EdD, DEd, DBA, ScD, JD, and MFACommittee of CAO’s considering inclusion of other terminal degrees
Source
Special data submission from universitiesBenchmark
System average of 80.77%System Performance Target
90.0%
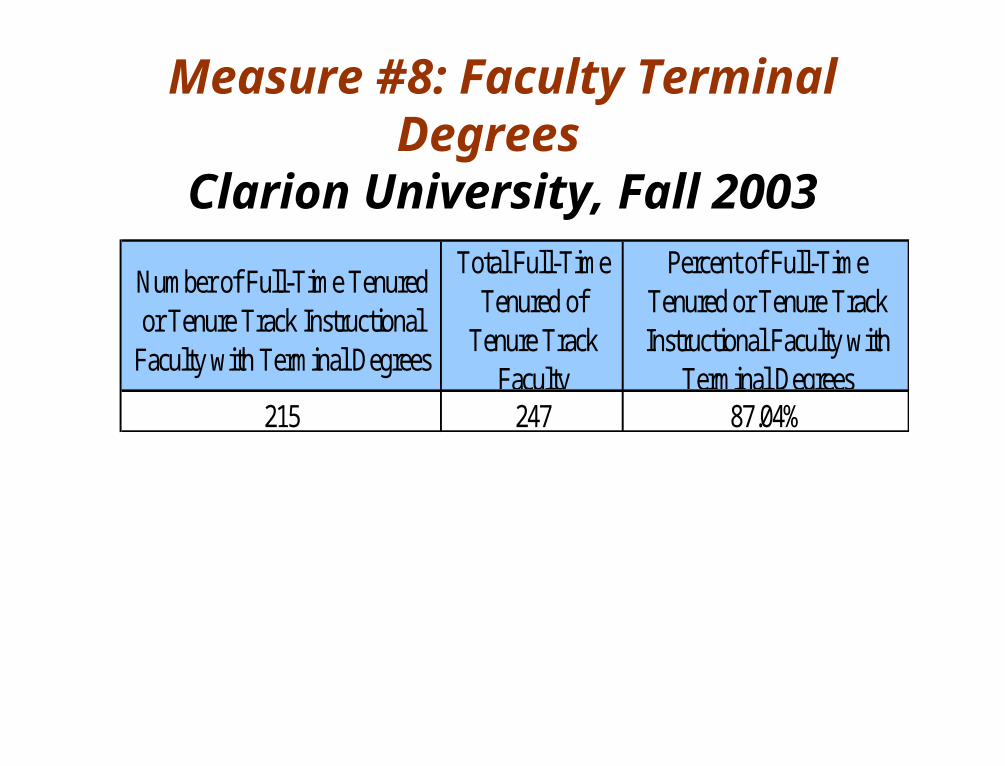
Measure #8: Faculty Terminal Degrees Clarion University, Fall 2003
Number of Full-Time Tenured or Tenure Track Instructional
Faculty with Terminal Degrees
Total Full-Time Tenured of
Tenure Track Faculty
Percent of Full-Time Tenured or Tenure Track Instructional Faculty with
Terminal Degrees215 247 87.04%
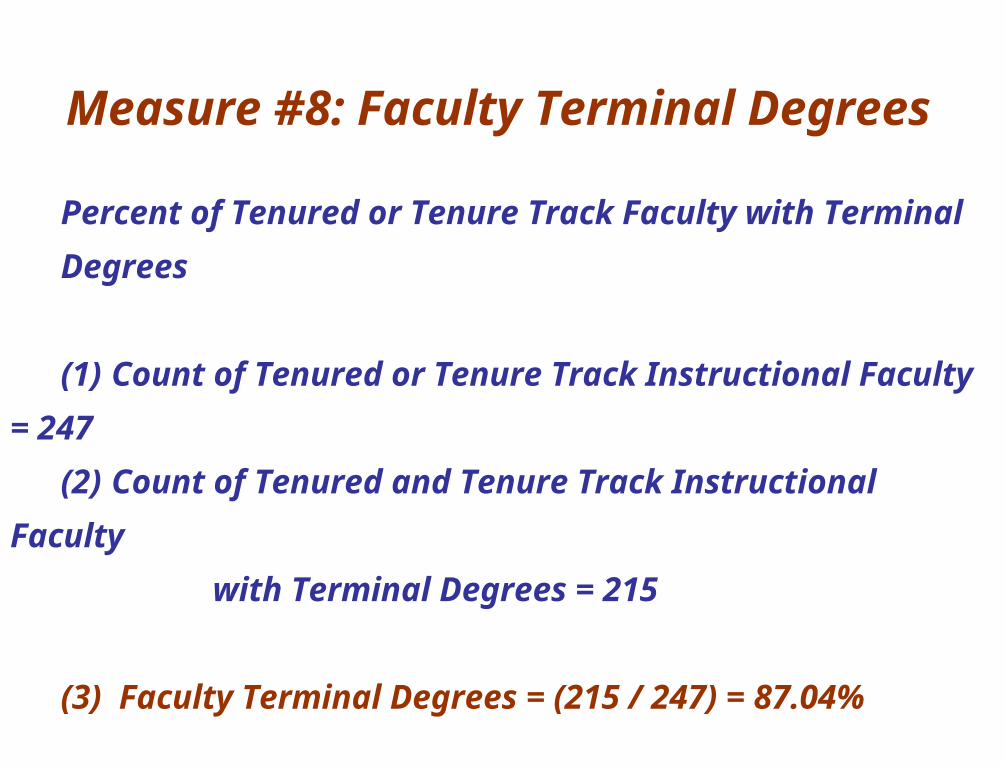
Measure #8: Faculty Terminal Degrees
Percent of Tenured or Tenure Track Faculty with
Terminal
Degrees
(1) Count of Tenured or Tenure Track
Instructional Faculty = 247
(2) Count of Tenured and Tenure Track
Instructional Faculty
with Terminal Degrees = 215
(3) Faculty Terminal Degrees = (215 / 247) =
87.04%
Data Definitions, Documentation and the Calculation of Measures
Questions & Answers

Performance Evaluation Methodology
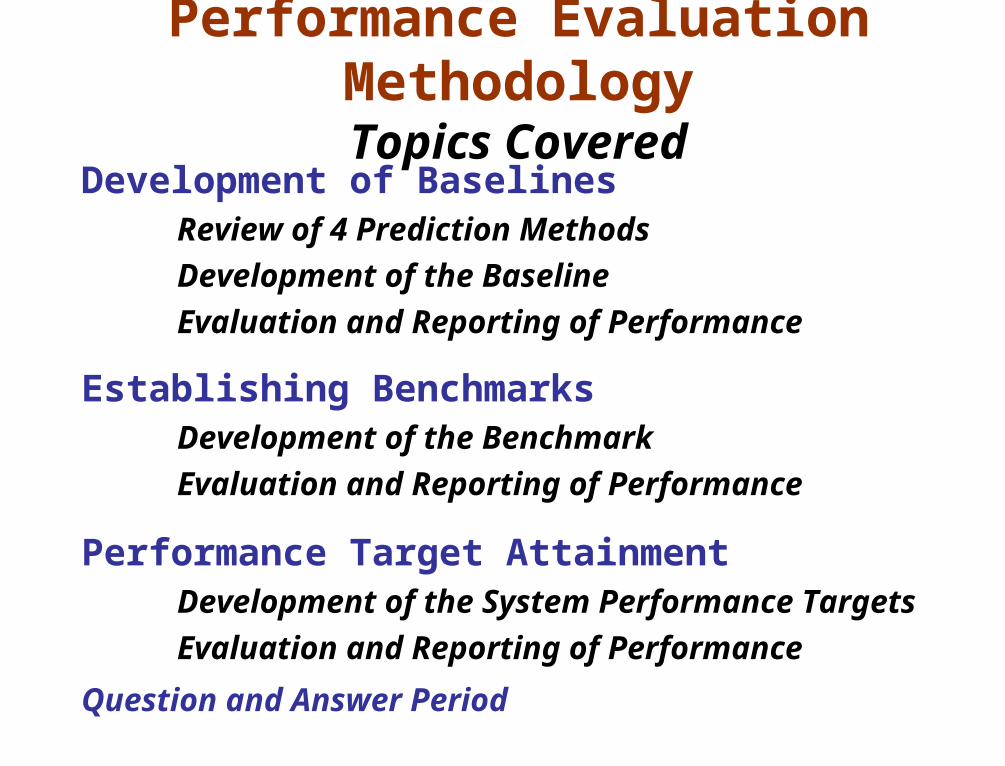
Performance Evaluation MethodologyTopics Covered
Development of Baselines
Review of 4 Prediction Methods
Development of the Baseline
Evaluation and Reporting of Performance
Establishing BenchmarksDevelopment of the Benchmark
Evaluation and Reporting of Performance
Performance Target AttainmentDevelopment of the System Performance Targets
Evaluation and Reporting of Performance
Question and Answer Period
Performance Evaluation Methodology
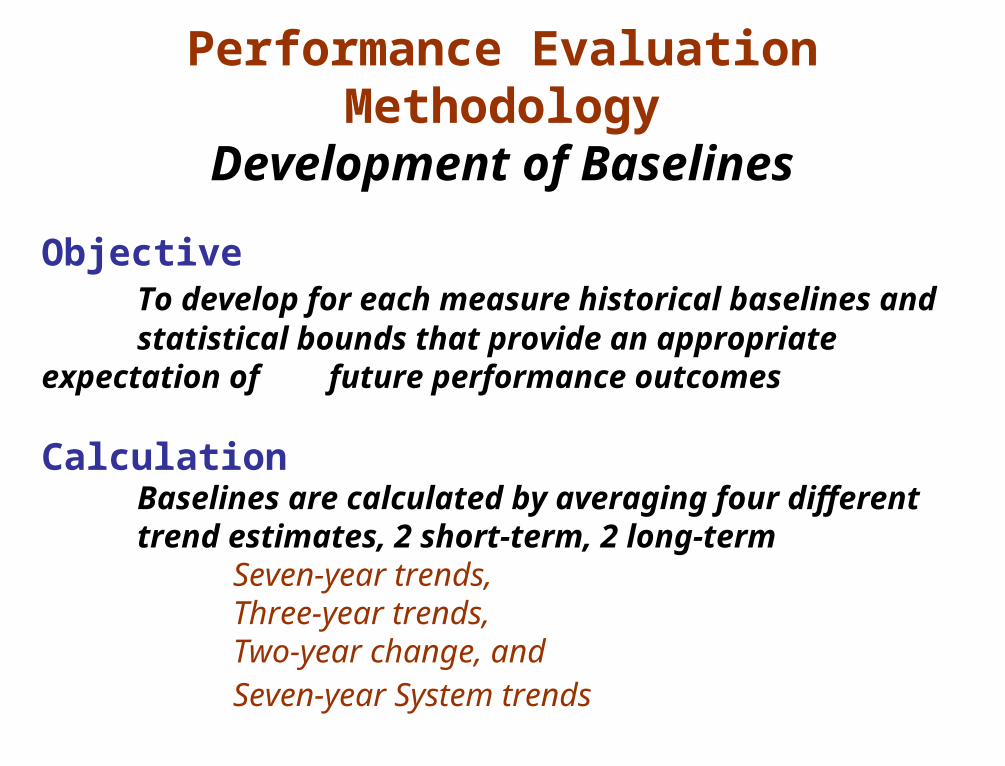
Development of Baselines
ObjectiveTo develop for each measure historical baselines and
statistical bounds that provide an appropriate expectation of future performance outcomes
CalculationBaselines are calculated by averaging four different
trend estimates, 2 short-term, 2 long-term Seven-year trends,Three-year trends, Two-year change, and Seven-year System trends
Performance Evaluation Methodology
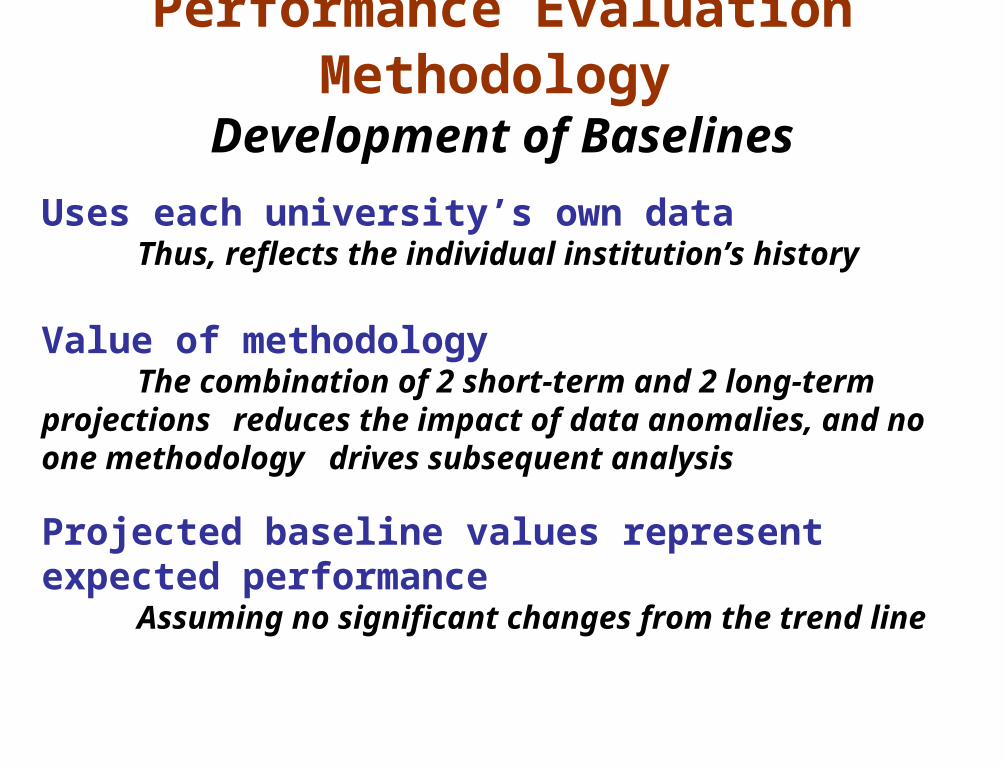
Development of Baselines
Uses each university’s own dataThus, reflects the individual institution’s history
Value of methodologyThe combination of 2 short-term and 2 long-term projections reduces the impact of data anomalies, and no one methodology drives subsequent analysis
Projected baseline values represent expected performanceAssuming no significant changes from the trend line
Performance Evaluation Methodology
Development of Baselines
A detailed description of statistical methodology
Development of BaselinesTopics Covered
The Four Methods of Prediction
Calculating the Baseline
Adding Statistical Bounds
Evaluation of Performance
Performance Evaluation Methodology Development of Baselines
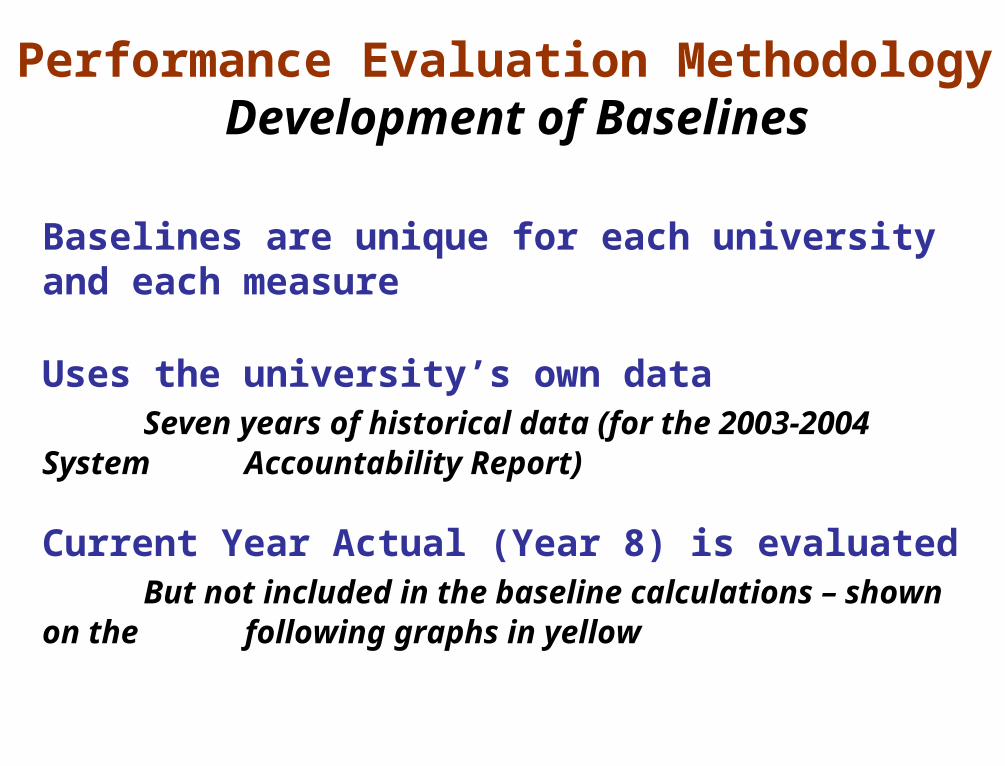
Baselines are unique for each university and each measure
Uses the university’s own dataSeven years of historical data (for the 2003-2004 System
Accountability Report)
Current Year Actual (Year 8) is evaluatedBut not included in the baseline calculations – shown on the
following graphs in yellow
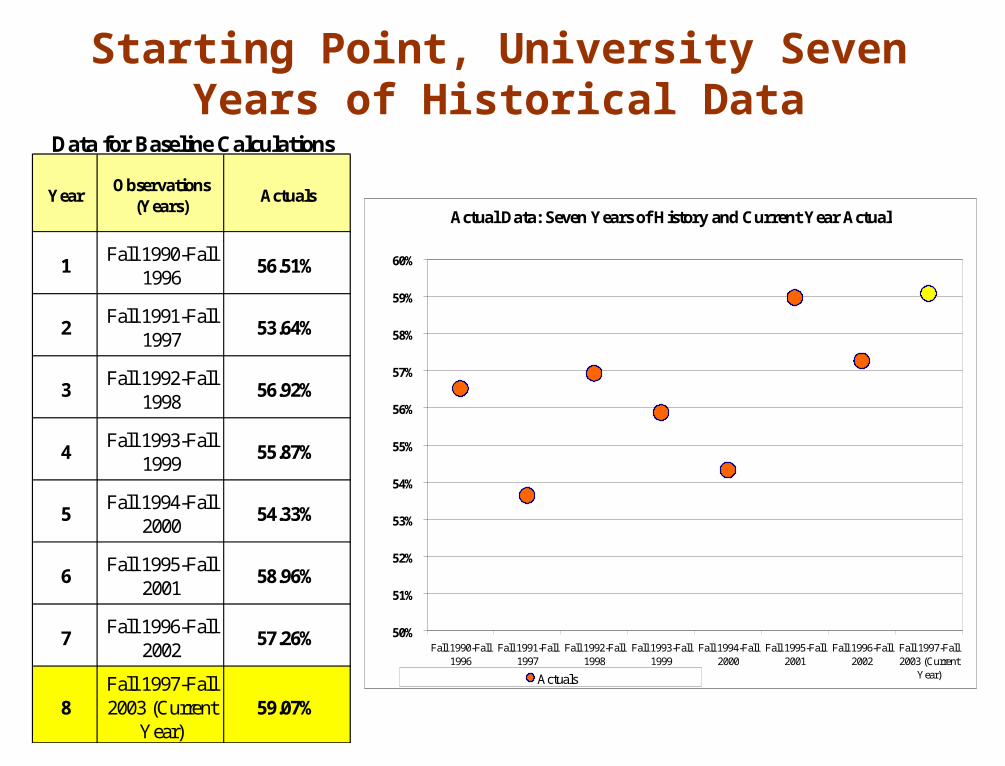
Starting Point, University Seven Years of Historical Data
YearObservations
(Years)Actuals
1Fall 1990-Fall
199656.51%
2Fall 1991-Fall
199753.64%
3Fall 1992-Fall
199856.92%
4Fall 1993-Fall
199955.87%
5Fall 1994-Fall
200054.33%
6Fall 1995-Fall
200158.96%
7Fall 1996-Fall
200257.26%
8Fall 1997-Fall 2003 (Current
Year)59.07%
Data for Baseline Calculations
Actual Data: Seven Years of History and Current Year Actual
50%
51%
52%
53%
54%
55%
56%
57%
58%
59%
60%
Fall 1990-Fall1996
Fall 1991-Fall1997
Fall 1992-Fall1998
Fall 1993-Fall1999
Fall 1994-Fall2000
Fall 1995-Fall2001
Fall 1996-Fall2002
Fall 1997-Fall2003 (Current
Year)Actuals
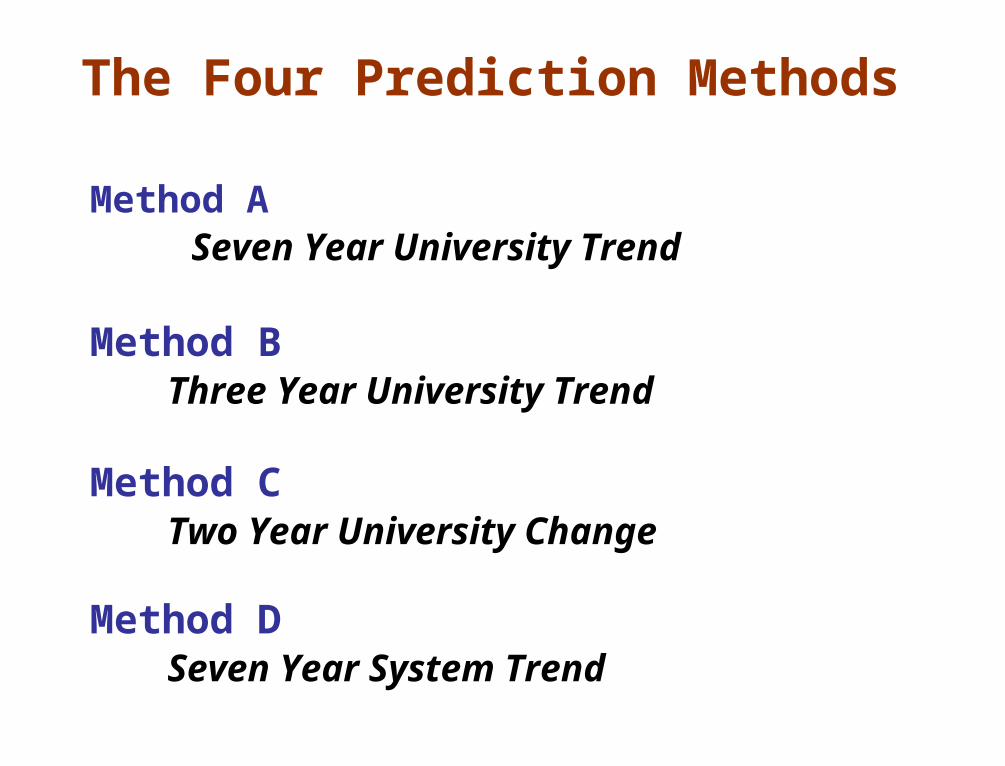
The Four Prediction Methods
Method A Seven Year University Trend
Method BThree Year University Trend
Method CTwo Year University Change
Method DSeven Year System Trend
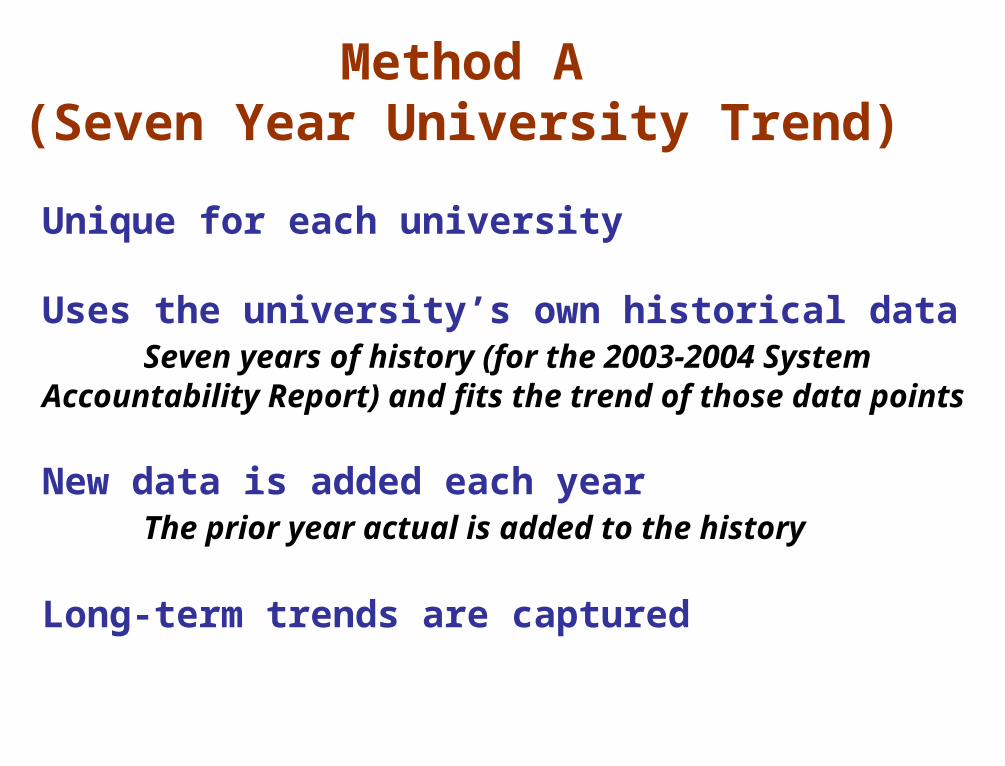
Method A(Seven Year University Trend)
Unique for each university
Uses the university’s own historical data Seven years of history (for the 2003-2004 System
Accountability Report) and fits the trend of those data points
New data is added each yearThe prior year actual is added to the history
Long-term trends are captured
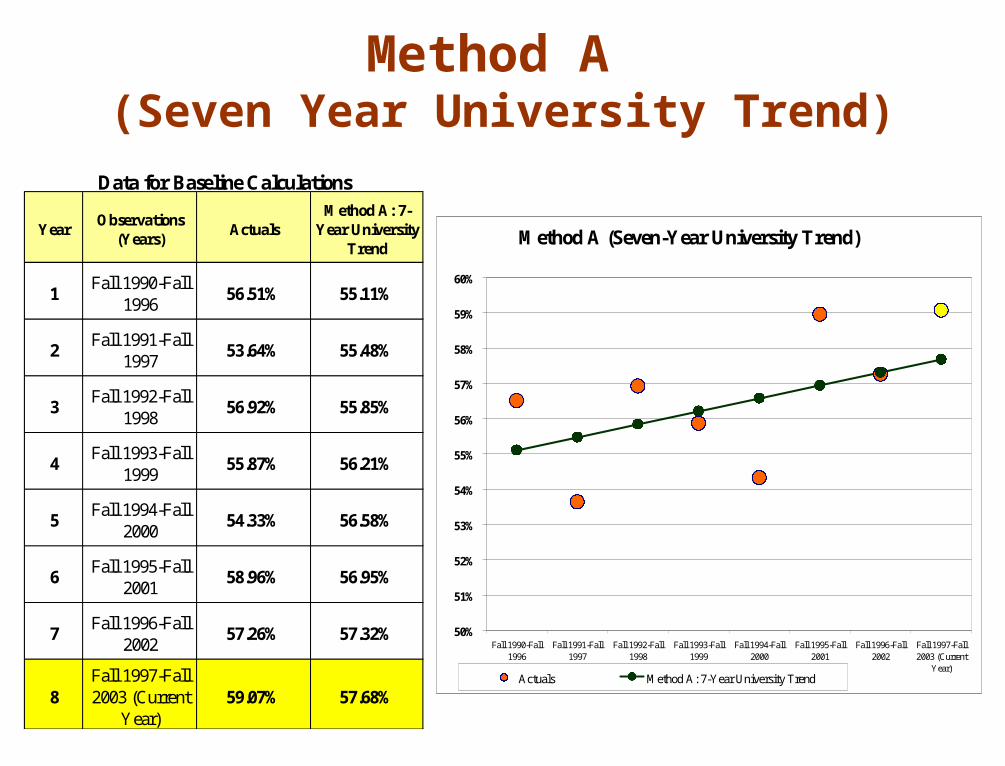
Method A (Seven Year University Trend)
YearObservations
(Years)Actuals
Method A: 7-Year University
Trend
1Fall 1990-Fall
199656.51% 55.11%
2Fall 1991-Fall
199753.64% 55.48%
3Fall 1992-Fall
199856.92% 55.85%
4Fall 1993-Fall
199955.87% 56.21%
5Fall 1994-Fall
200054.33% 56.58%
6Fall 1995-Fall
200158.96% 56.95%
7Fall 1996-Fall
200257.26% 57.32%
8Fall 1997-Fall 2003 (Current
Year)59.07% 57.68%
Data for Baseline Calculations
Method A (Seven-Year University Trend)
50%
51%
52%
53%
54%
55%
56%
57%
58%
59%
60%
Fall 1990-Fall1996
Fall 1991-Fall1997
Fall 1992-Fall1998
Fall 1993-Fall1999
Fall 1994-Fall2000
Fall 1995-Fall2001
Fall 1996-Fall2002
Fall 1997-Fall2003 (Current
Year)Actuals Method A: 7-Year University Trend
Method B(Three Year University Trend)
Unique for each university
Uses the university’s own historical data Uses the last three data points of the university’s own
historical data and fits the trend
In 2003-2004, the System Accountability Report three-year trend is calculated using years 5, 6 and 7 of history
Intermediate term trends are captured
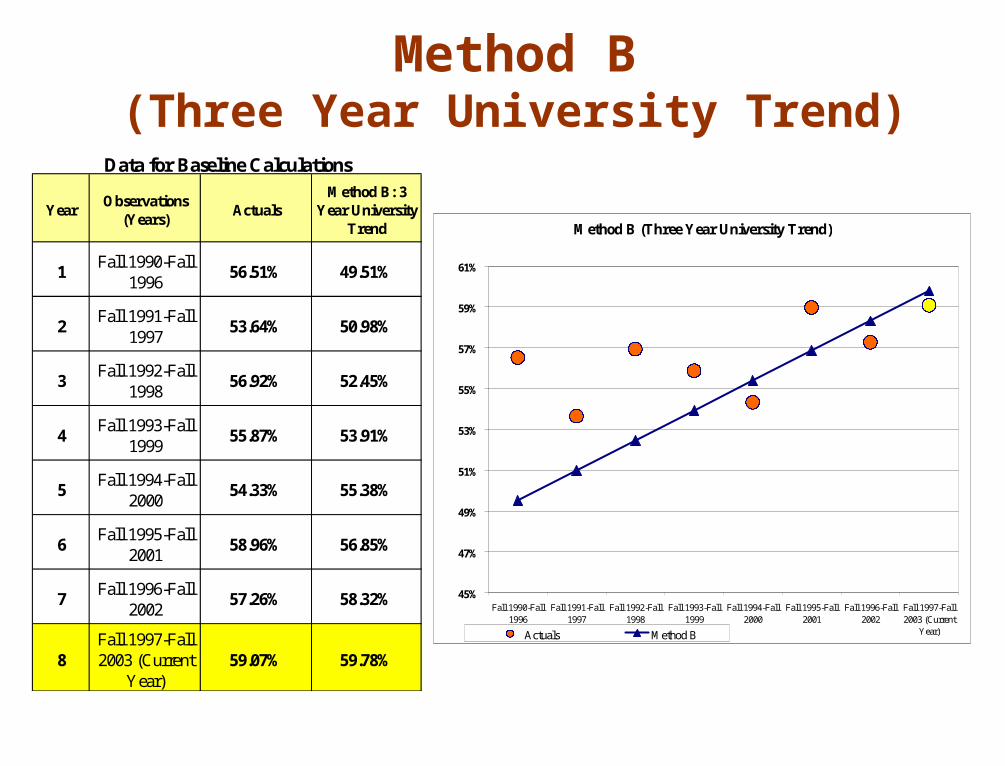
Method B(Three Year University Trend)
YearObservations
(Years)Actuals
Method B: 3 Year University
Trend
1Fall 1990-Fall
199656.51% 49.51%
2Fall 1991-Fall
199753.64% 50.98%
3Fall 1992-Fall
199856.92% 52.45%
4Fall 1993-Fall
199955.87% 53.91%
5Fall 1994-Fall
200054.33% 55.38%
6Fall 1995-Fall
200158.96% 56.85%
7Fall 1996-Fall
200257.26% 58.32%
8Fall 1997-Fall 2003 (Current
Year)59.07% 59.78%
Data for Baseline Calculations
Method B (Three Year University Trend)
45%
47%
49%
51%
53%
55%
57%
59%
61%
Fall 1990-Fall1996
Fall 1991-Fall1997
Fall 1992-Fall1998
Fall 1993-Fall1999
Fall 1994-Fall2000
Fall 1995-Fall2001
Fall 1996-Fall2002
Fall 1997-Fall2003 (Current
Year)Actuals Method B
Method C(Two Year University Change)
Unique for each university
Applies the calculated 2 year rate of change (between the two prior years) to the prior year to project the
next year
Reflects short term trends
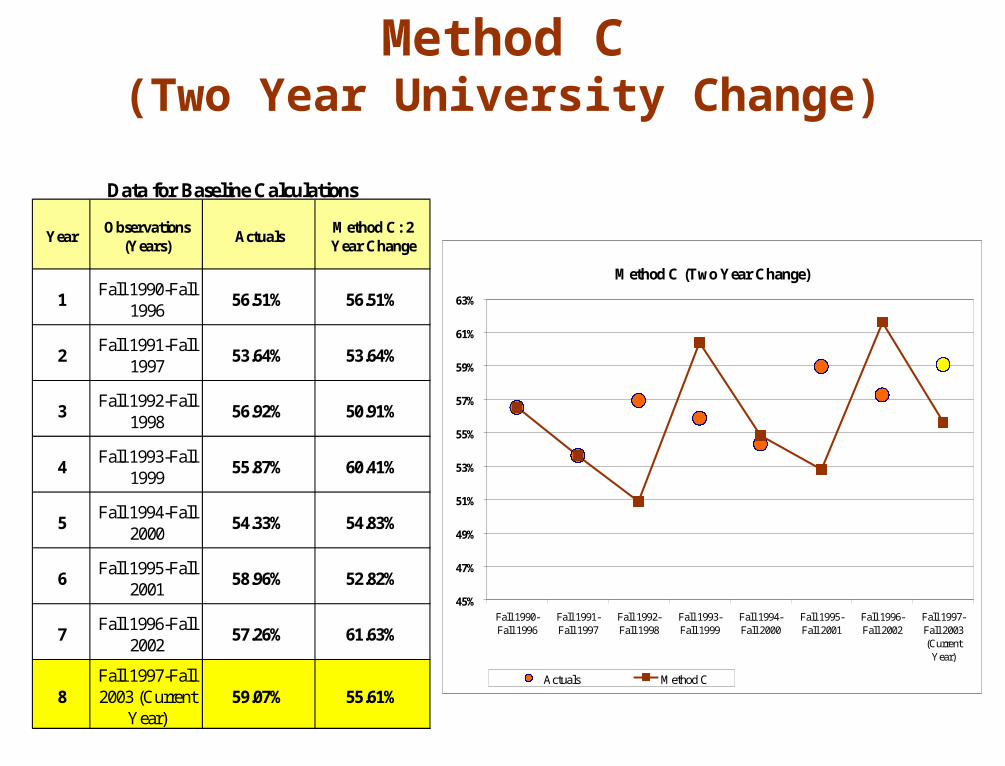
Method C(Two Year University Change)
YearObservations
(Years)Actuals
Method C: 2 Year Change
1Fall 1990-Fall
199656.51% 56.51%
2Fall 1991-Fall
199753.64% 53.64%
3Fall 1992-Fall
199856.92% 50.91%
4Fall 1993-Fall
199955.87% 60.41%
5Fall 1994-Fall
200054.33% 54.83%
6Fall 1995-Fall
200158.96% 52.82%
7Fall 1996-Fall
200257.26% 61.63%
8Fall 1997-Fall 2003 (Current
Year)59.07% 55.61%
Data for Baseline Calculations
Method C (Two Year Change)
45%
47%
49%
51%
53%
55%
57%
59%
61%
63%
Fall 1990-Fall 1996
Fall 1991-Fall 1997
Fall 1992-Fall 1998
Fall 1993-Fall 1999
Fall 1994-Fall 2000
Fall 1995-Fall 2001
Fall 1996-Fall 2002
Fall 1997-Fall 2003(Current
Year)
Actuals Method C
Method D(Seven Year System Trend)
Uses historical data for all 14 universitiesSeven years of history (for the 2003-2004 System
Accountability Report) and fits the trend of those data points
Each university has a unique intercept, but all slopes are the same
New data is added each yearThe prior year actual is added to the history
Long term System-wide trends are captured
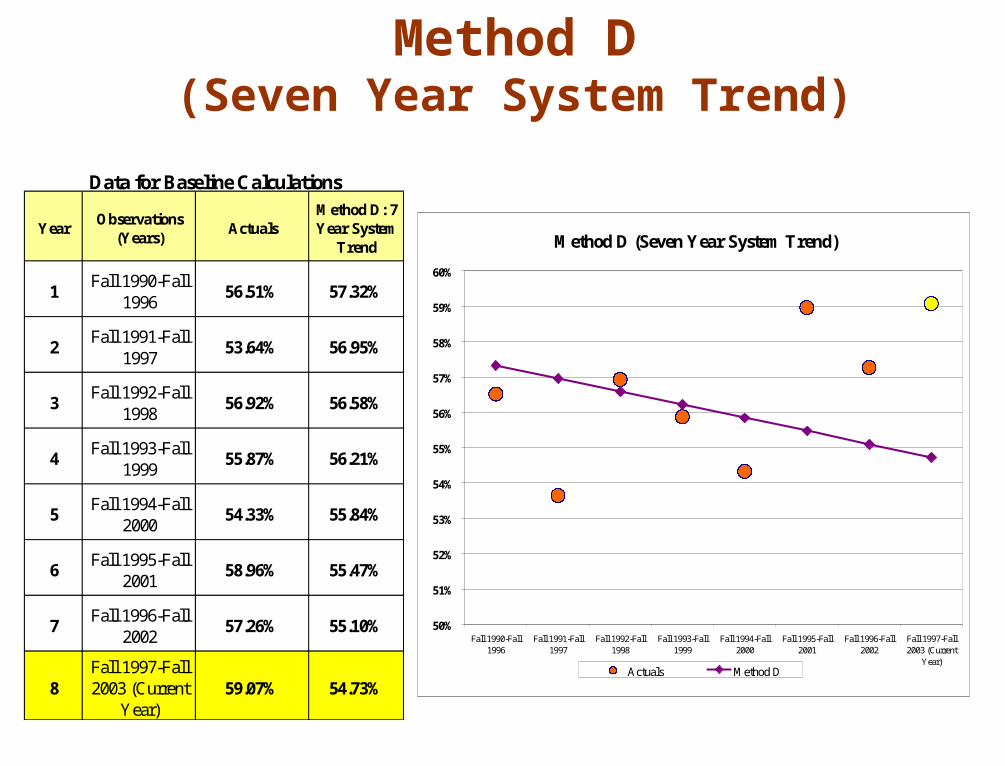
Method D(Seven Year System Trend)
YearObservations
(Years)Actuals
Method D: 7 Year System
Trend
1Fall 1990-Fall
199656.51% 57.32%
2Fall 1991-Fall
199753.64% 56.95%
3Fall 1992-Fall
199856.92% 56.58%
4Fall 1993-Fall
199955.87% 56.21%
5Fall 1994-Fall
200054.33% 55.84%
6Fall 1995-Fall
200158.96% 55.47%
7Fall 1996-Fall
200257.26% 55.10%
8Fall 1997-Fall 2003 (Current
Year)59.07% 54.73%
Data for Baseline Calculations
Method D (Seven Year System Trend)
50%
51%
52%
53%
54%
55%
56%
57%
58%
59%
60%
Fall 1990-Fall1996
Fall 1991-Fall1997
Fall 1992-Fall1998
Fall 1993-Fall1999
Fall 1994-Fall2000
Fall 1995-Fall2001
Fall 1996-Fall2002
Fall 1997-Fall2003 (Current
Year)Actuals Method D
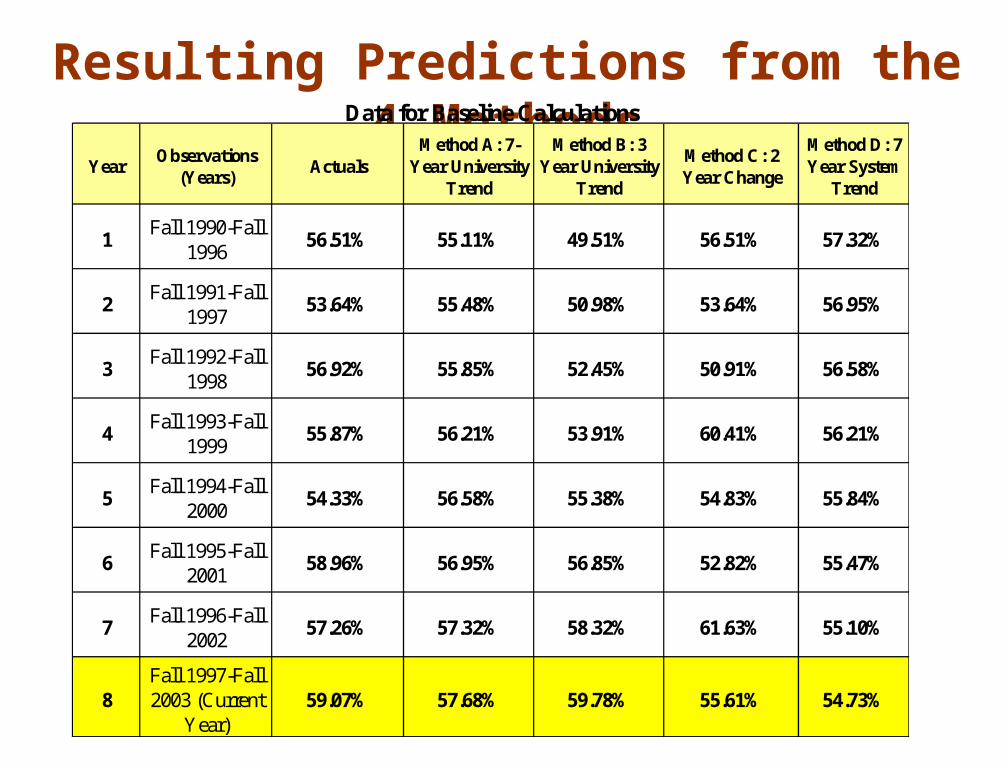
Resulting Predictions from the 4 Methods
YearObservations
(Years)Actuals
Method A: 7-Year University
Trend
Method B: 3 Year University
Trend
Method C: 2 Year Change
Method D: 7 Year System
Trend
1Fall 1990-Fall
199656.51% 55.11% 49.51% 56.51% 57.32%
2Fall 1991-Fall
199753.64% 55.48% 50.98% 53.64% 56.95%
3Fall 1992-Fall
199856.92% 55.85% 52.45% 50.91% 56.58%
4Fall 1993-Fall
199955.87% 56.21% 53.91% 60.41% 56.21%
5Fall 1994-Fall
200054.33% 56.58% 55.38% 54.83% 55.84%
6Fall 1995-Fall
200158.96% 56.95% 56.85% 52.82% 55.47%
7Fall 1996-Fall
200257.26% 57.32% 58.32% 61.63% 55.10%
8Fall 1997-Fall 2003 (Current
Year)59.07% 57.68% 59.78% 55.61% 54.73%
Data for Baseline Calculations
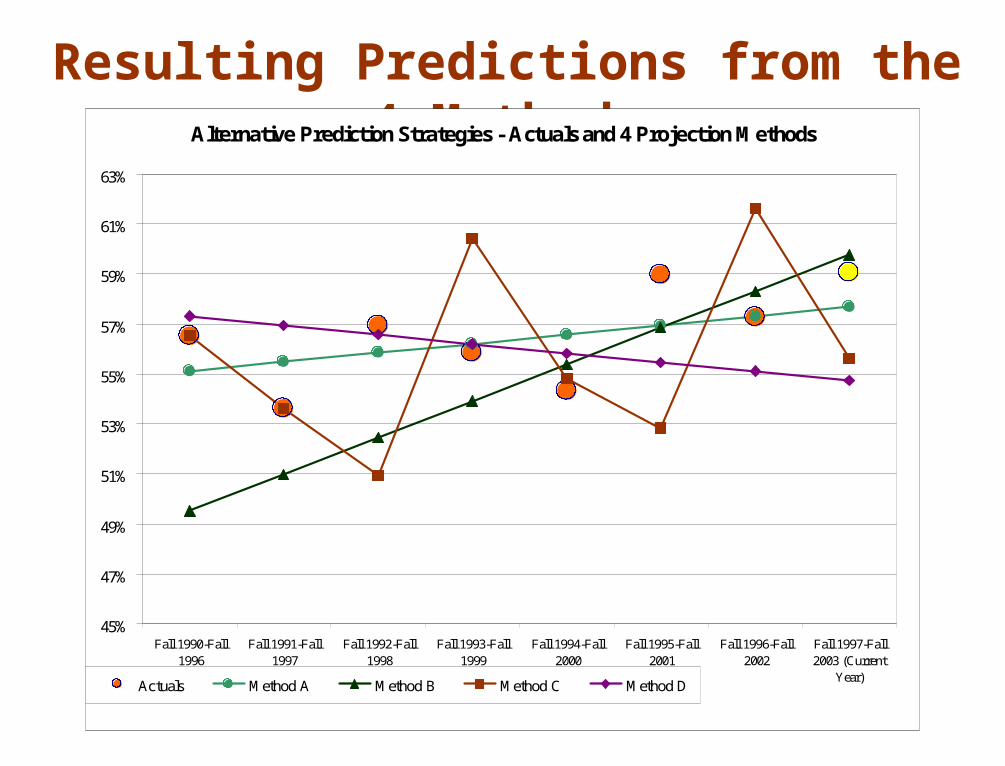
Resulting Predictions from the 4 MethodsAlternative Prediction Strategies - Actuals and 4 Projection Methods
45%
47%
49%
51%
53%
55%
57%
59%
61%
63%
Fall 1990-Fall1996
Fall 1991-Fall1997
Fall 1992-Fall1998
Fall 1993-Fall1999
Fall 1994-Fall2000
Fall 1995-Fall2001
Fall 1996-Fall2002
Fall 1997-Fall2003 (Current
Year)Actuals Method A Method B Method C Method D
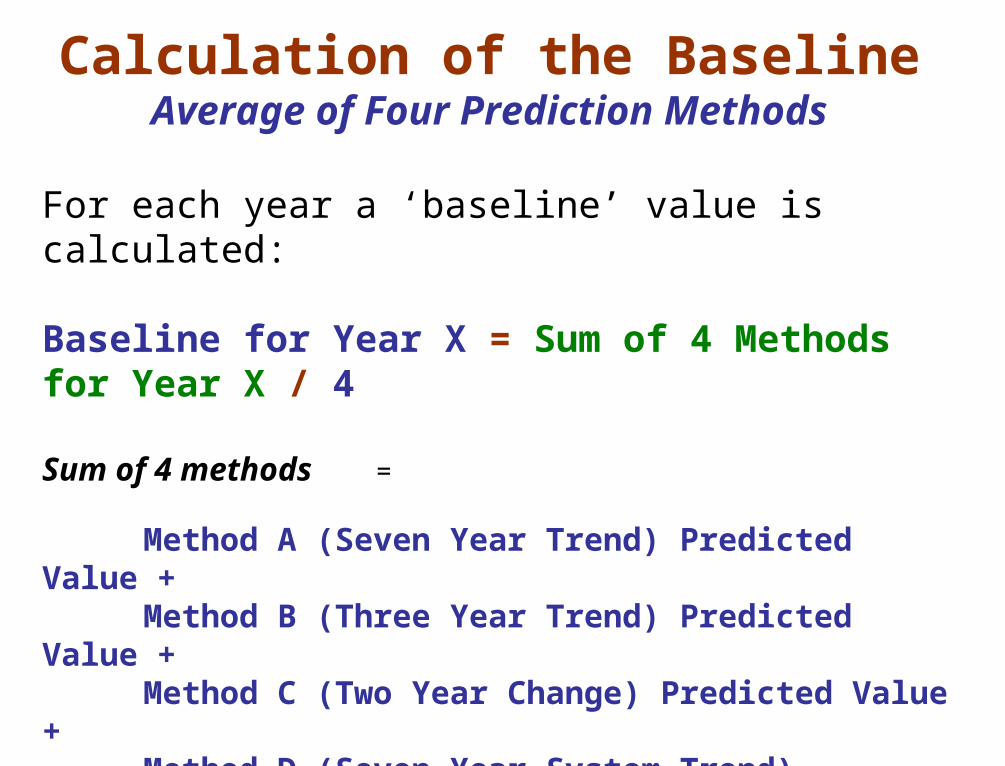
Calculation of the BaselineAverage of Four Prediction Methods
For each year a ‘baseline’ value is calculated:
Baseline for Year X = Sum of 4 Methods for Year X / 4
Sum of 4 methods =
Method A (Seven Year Trend) Predicted Value +Method B (Three Year Trend) Predicted Value +Method C (Two Year Change) Predicted Value +Method D (Seven Year System Trend) Predicted Value
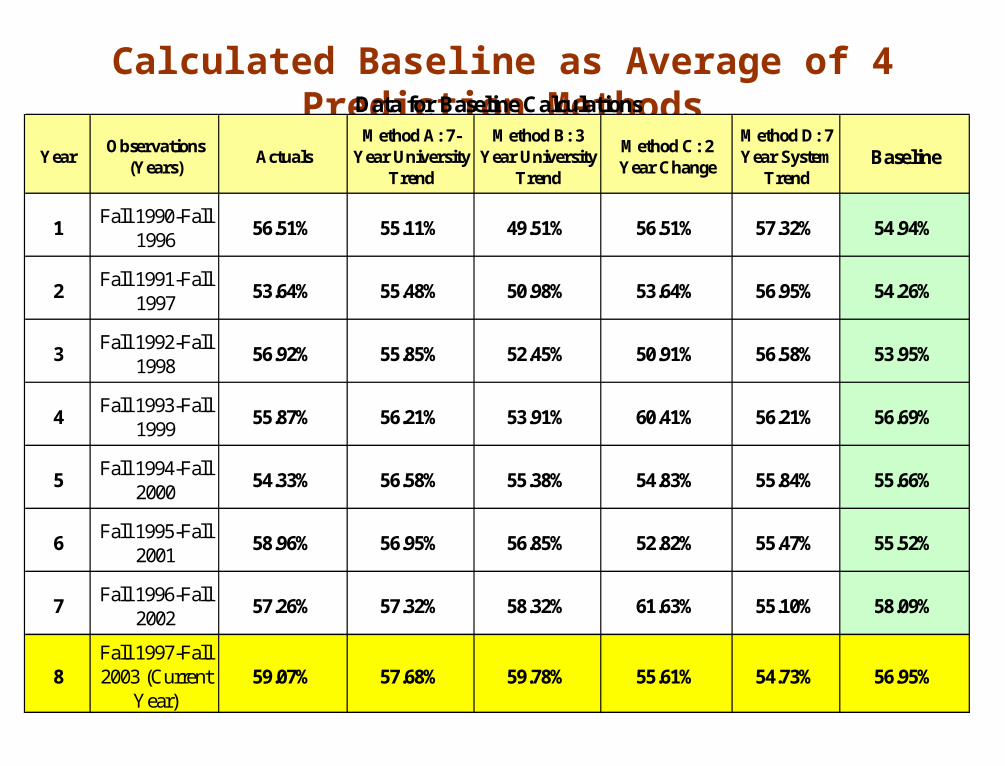
Calculated Baseline as Average of 4 Prediction Methods
YearObservations
(Years)Actuals
Method A: 7-Year University
Trend
Method B: 3 Year University
Trend
Method C: 2 Year Change
Method D: 7 Year System
TrendBaseline
1Fall 1990-Fall
199656.51% 55.11% 49.51% 56.51% 57.32% 54.94%
2Fall 1991-Fall
199753.64% 55.48% 50.98% 53.64% 56.95% 54.26%
3Fall 1992-Fall
199856.92% 55.85% 52.45% 50.91% 56.58% 53.95%
4Fall 1993-Fall
199955.87% 56.21% 53.91% 60.41% 56.21% 56.69%
5Fall 1994-Fall
200054.33% 56.58% 55.38% 54.83% 55.84% 55.66%
6Fall 1995-Fall
200158.96% 56.95% 56.85% 52.82% 55.47% 55.52%
7Fall 1996-Fall
200257.26% 57.32% 58.32% 61.63% 55.10% 58.09%
8Fall 1997-Fall 2003 (Current
Year)59.07% 57.68% 59.78% 55.61% 54.73% 56.95%
Data for Baseline Calculations
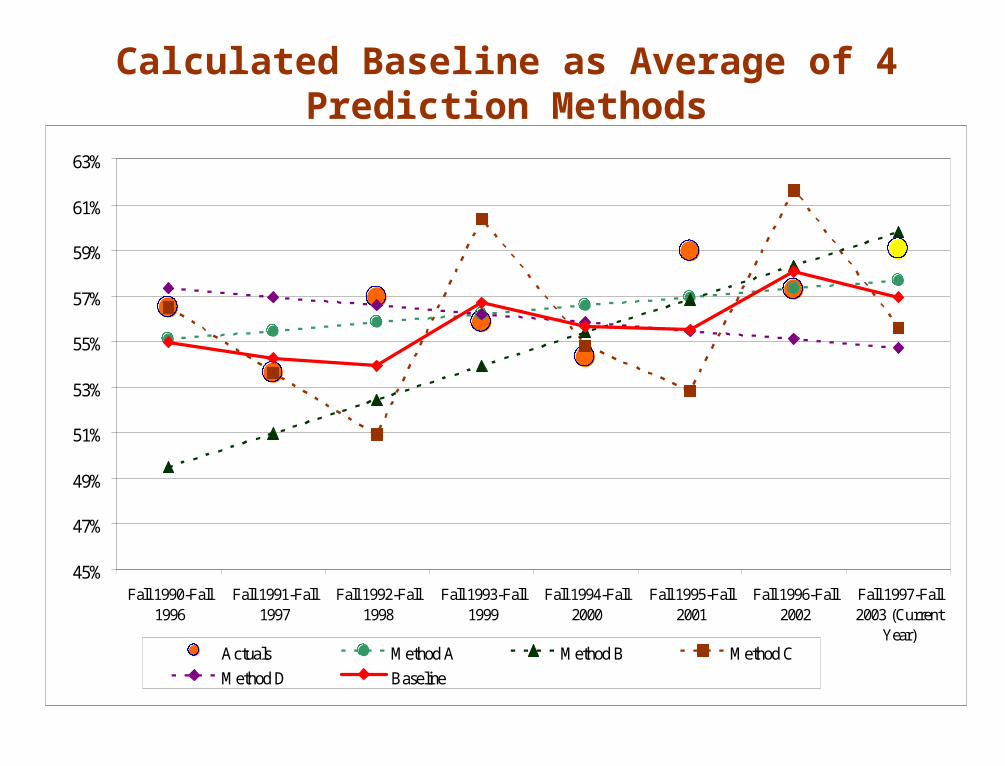
Calculated Baseline as Average of 4 Prediction Methods
45%
47%
49%
51%
53%
55%
57%
59%
61%
63%
Fall 1990-Fall1996
Fall 1991-Fall1997
Fall 1992-Fall1998
Fall 1993-Fall1999
Fall 1994-Fall2000
Fall 1995-Fall2001
Fall 1996-Fall2002
Fall 1997-Fall2003 (Current
Year)Actuals Method A Method B Method C
Method D Baseline
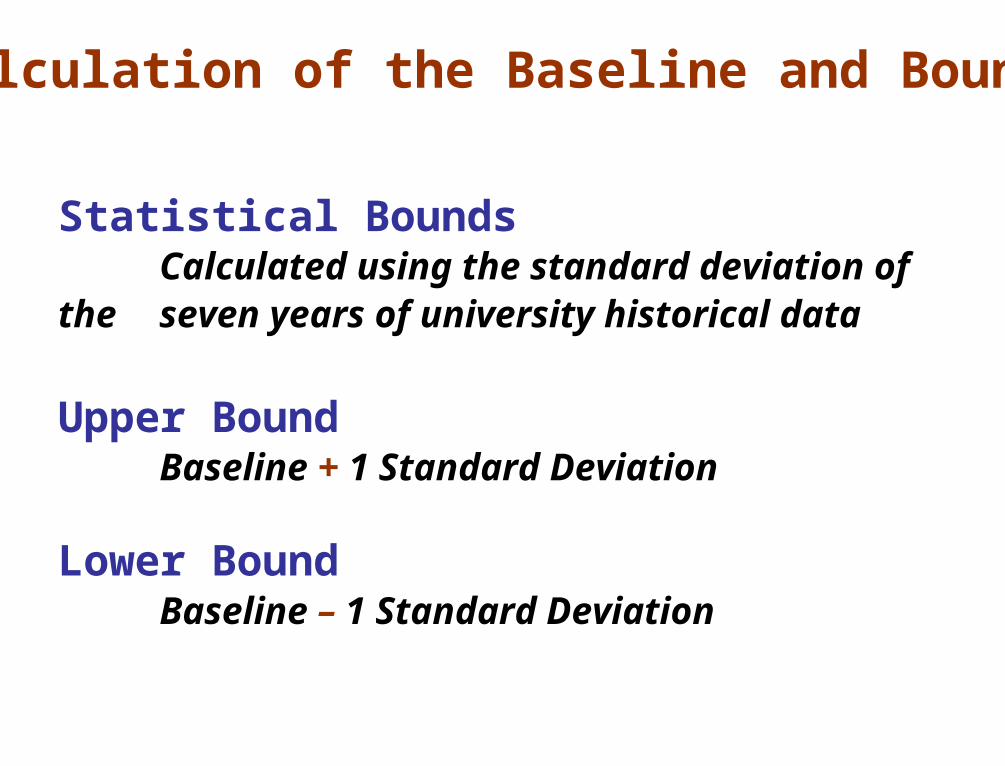
Calculation of the Baseline and Bounds
Statistical BoundsCalculated using the standard
deviation of the seven years of university historical data
Upper BoundBaseline + 1 Standard Deviation
Lower BoundBaseline – 1 Standard Deviation
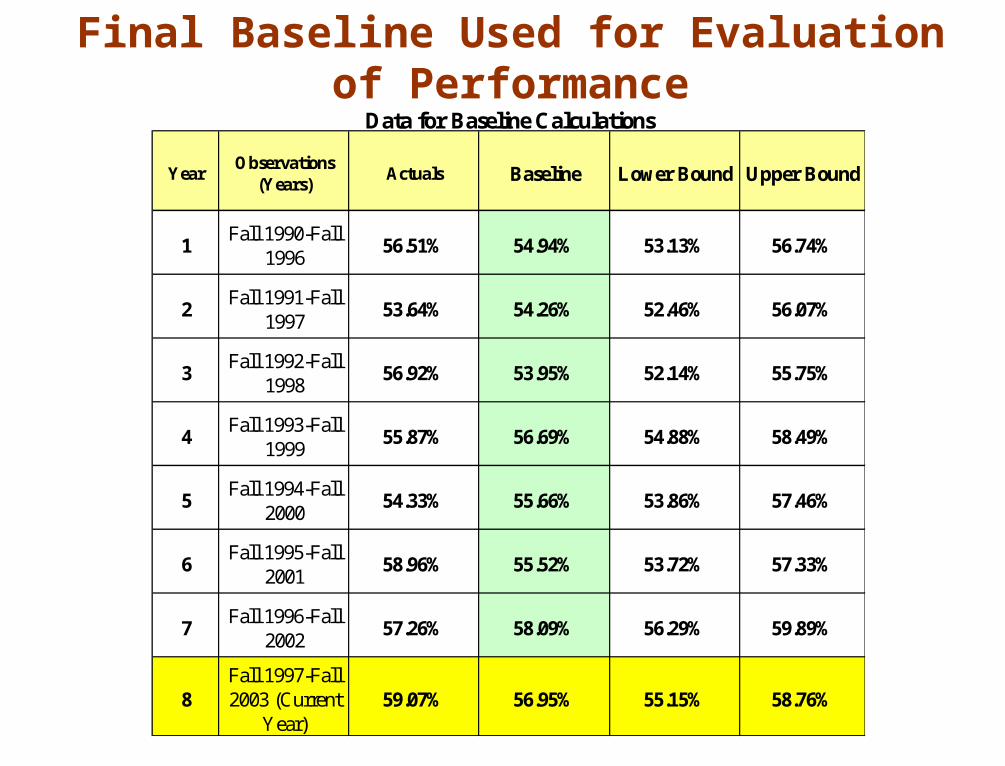
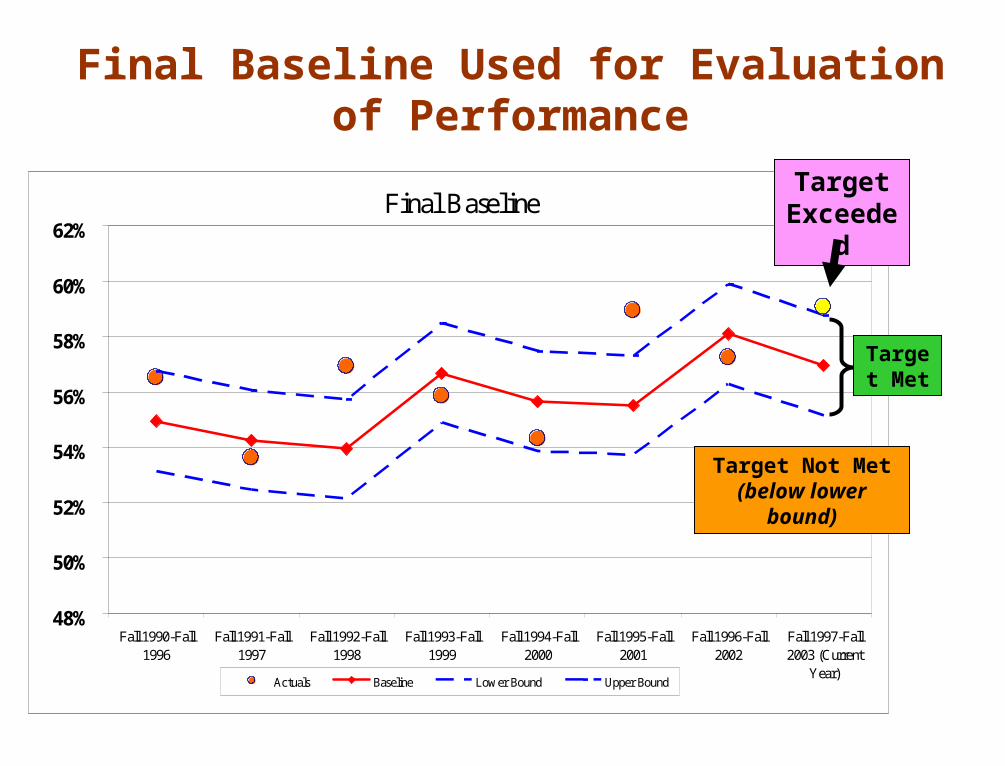
Final Baseline Used for Evaluation of Performance
YearObservations
(Years)Actuals Baseline Lower Bound Upper Bound
1Fall 1990-Fall
199656.51% 54.94% 53.13% 56.74%
2Fall 1991-Fall
199753.64% 54.26% 52.46% 56.07%
3Fall 1992-Fall
199856.92% 53.95% 52.14% 55.75%
4Fall 1993-Fall
199955.87% 56.69% 54.88% 58.49%
5Fall 1994-Fall
200054.33% 55.66% 53.86% 57.46%
6Fall 1995-Fall
200158.96% 55.52% 53.72% 57.33%
7Fall 1996-Fall
200257.26% 58.09% 56.29% 59.89%
8Fall 1997-Fall 2003 (Current
Year)59.07% 56.95% 55.15% 58.76%
Data for Baseline Calculations
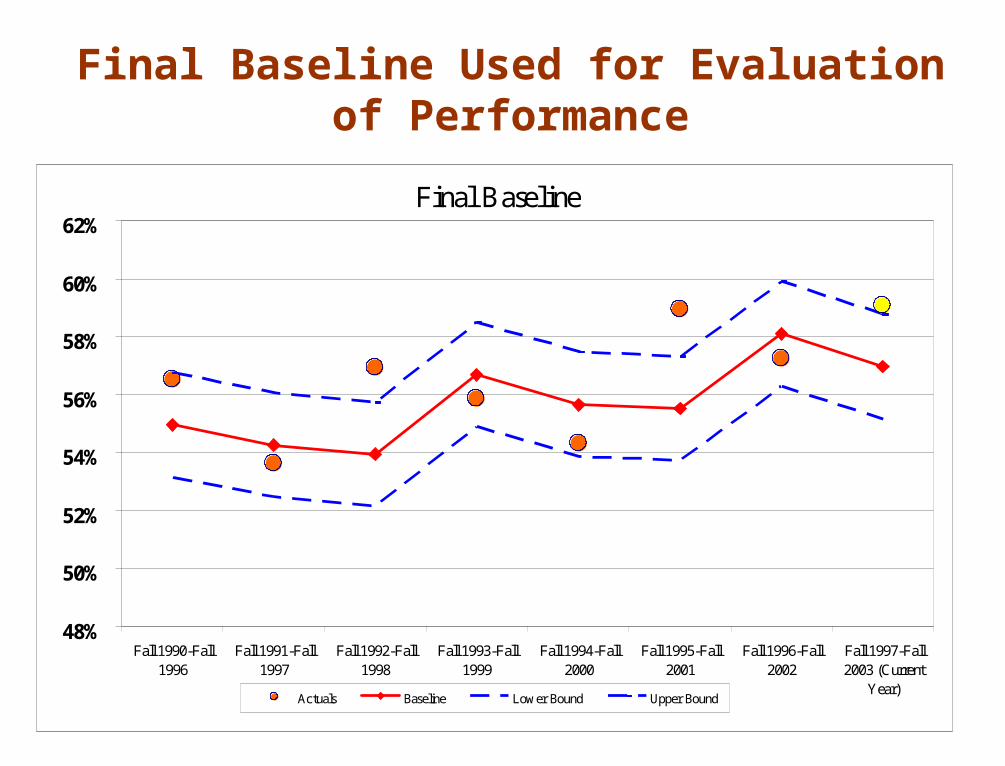
Final Baseline Used for Evaluation of Performance
Final Baseline
48%
50%
52%
54%
56%
58%
60%
62%
Fall 1990-Fall1996
Fall 1991-Fall1997
Fall 1992-Fall1998
Fall 1993-Fall1999
Fall 1994-Fall2000
Fall 1995-Fall2001
Fall 1996-Fall2002
Fall 1997-Fall2003 (Current
Year)Actuals Baseline Lower Bound Upper Bound
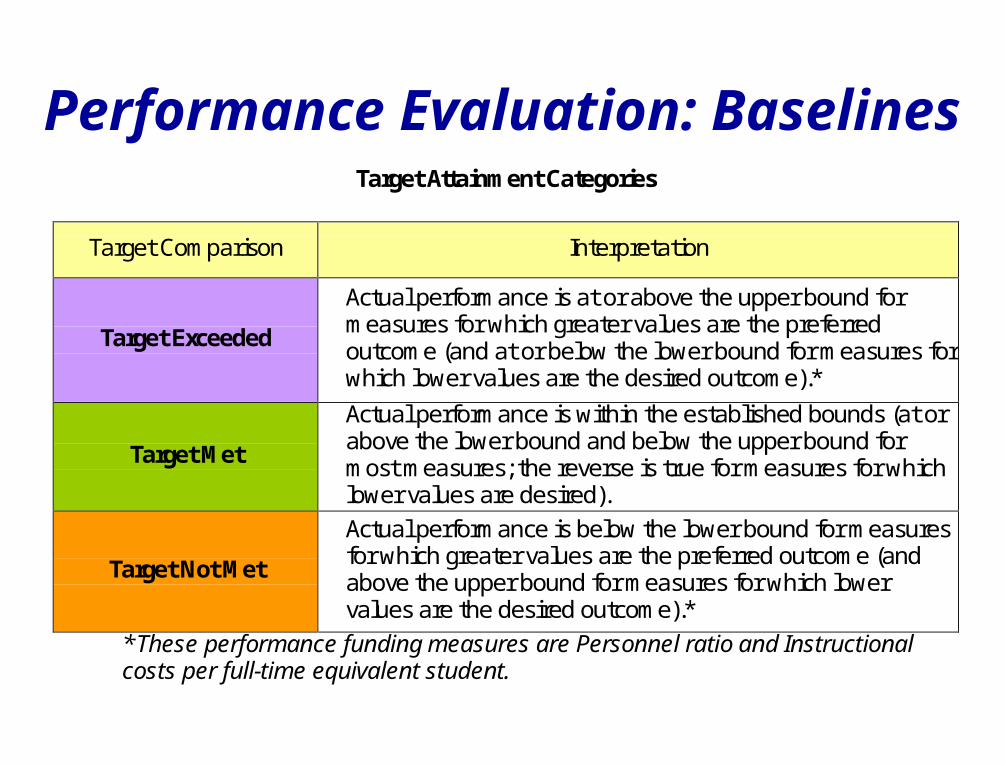
Performance Evaluation: BaselinesTarget Attainment Categories
Target Comparison Interpretation
Target Exceeded
Actual performance is at or above the upper bound for measures for which greater values are the preferred outcome (and at or below the lower bound for measures for which lower values are the desired outcome).*
Target Met
Actual performance is within the established bounds (at or above the lower bound and below the upper bound for most measures; the reverse is true for measures for which lower values are desired).
Target Not Met
Actual performance is below the lower bound for measures for which greater values are the preferred outcome (and above the upper bound for measures for which lower values are the desired outcome).*
*These performance funding measures are Personnel ratio and Instructional costs per full-time equivalent student.
Final Baseline
48%
50%
52%
54%
56%
58%
60%
62%
Fall 1990-Fall1996
Fall 1991-Fall1997
Fall 1992-Fall1998
Fall 1993-Fall1999
Fall 1994-Fall2000
Fall 1995-Fall2001
Fall 1996-Fall2002
Fall 1997-Fall2003 (Current
Year)Actuals Baseline Lower Bound Upper Bound
Final Baseline Used for Evaluation of Performance
Target Exceeded
Target Met
Target Not Met (below lower bound)
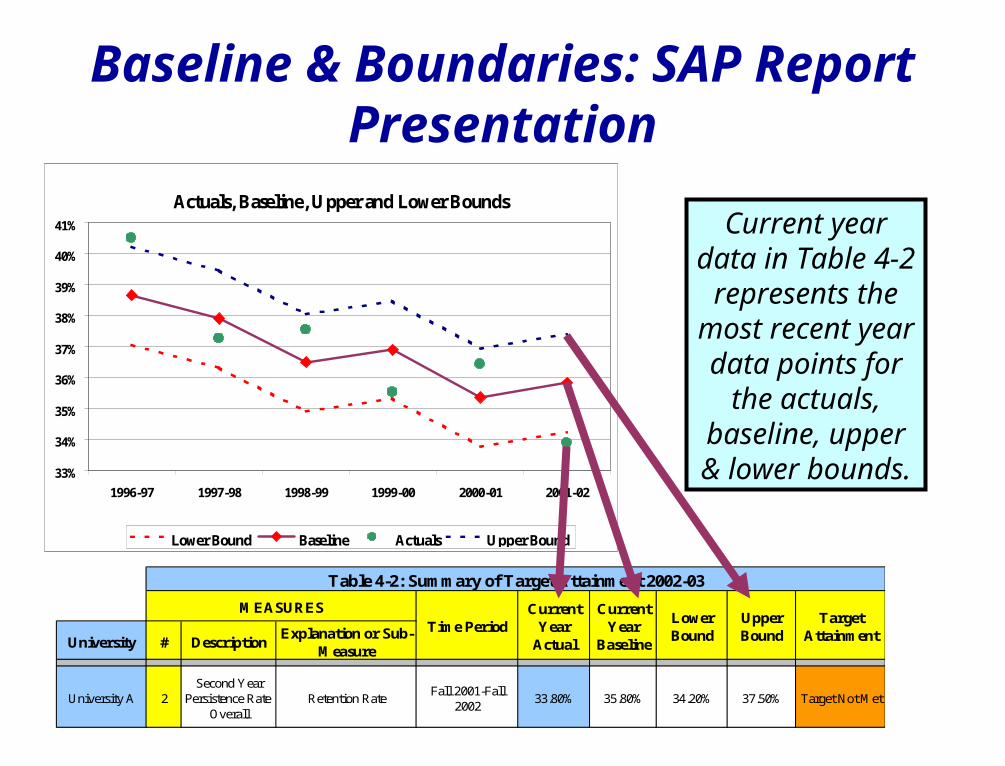
Baseline & Boundaries: SAP Report Presentation
33%
34%
35%
36%
37%
38%
39%
40%
41%
1996-97 1997-98 1998-99 1999-00 2000-01 2001-02
Lower Bound Baseline Actuals Upper Bound
Actuals, Baseline, Upper and Lower Bounds
University # DescriptionExplanation or Sub-
Measure
University A 2Second Year
Persistence Rate - Overall
Retention RateFall 2001-Fall
200233.80% 35.80% 34.20% 37.50% Target Not Met
Table 4-2: Summary of Target Attainment 2002-03
MEASURESTime Period
Current Year
Actual
Current Year
Baseline
Lower Bound
Upper Bound
Target Attainment
Current year data in Table 4-2
represents the most recent year
data points for the actuals, baseline,
upper & lower bounds.

Baselines and Performance Evaluations
Questions and Answers
Establishing Benchmarks
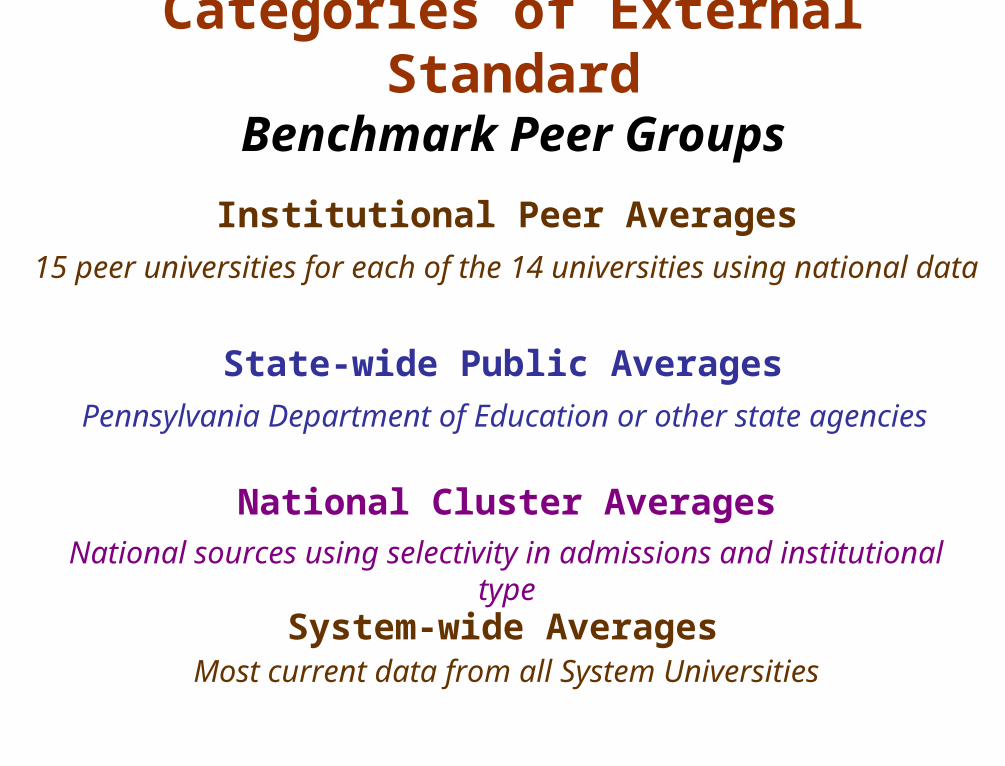
Categories of External StandardBenchmark Peer Groups
Pennsylvania Department of Education or other state agencies
State-wide Public Averages
System-wide AveragesMost current data from all System Universities
National Cluster AveragesNational sources using selectivity in admissions and institutional type
Institutional Peer Averages
15 peer universities for each of the 14 universities using national data
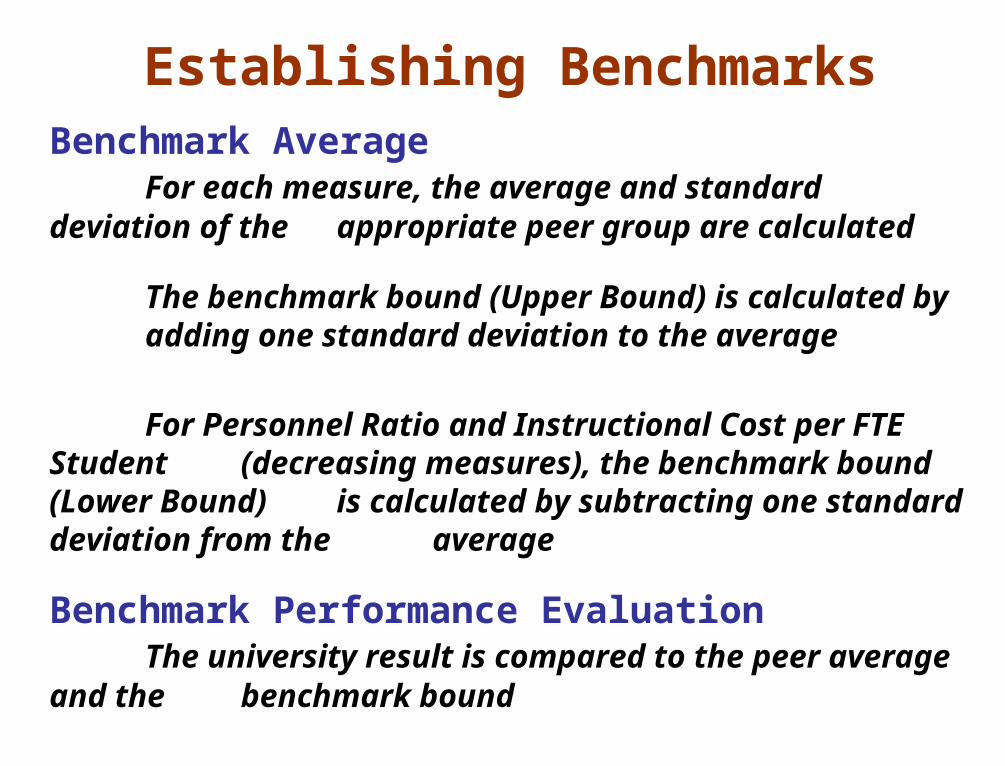
Establishing BenchmarksBenchmark Average
For each measure, the average and standard deviation of the appropriate peer group are calculated
The benchmark bound (Upper Bound) is calculated by adding one standard deviation to the average
For Personnel Ratio and Instructional Cost per FTE Student (decreasing measures), the benchmark bound (Lower Bound) is calculated by subtracting one standard deviation from the average
Benchmark Performance EvaluationThe university result is compared to the peer average and the benchmark bound
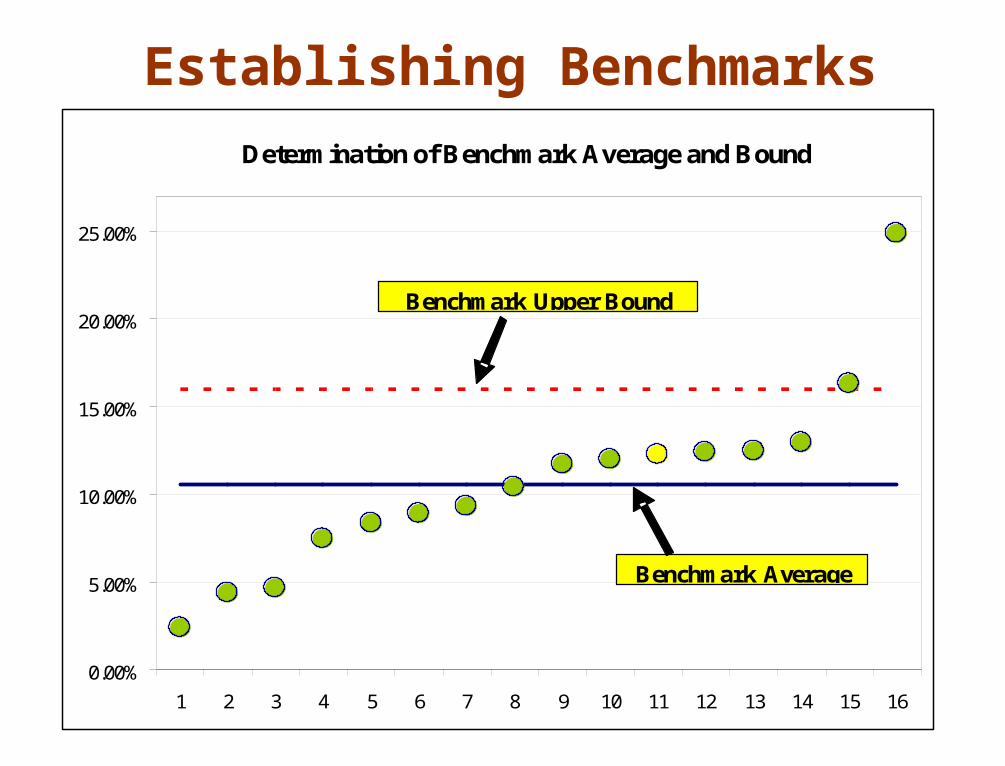
Establishing Benchmarks
0.00%
5.00%
10.00%
15.00%
20.00%
25.00%
1 2 3 4 5 6 7 8 9 10 11 12 13 14 15 16
Benchmark Average
Benchmark Upper Bound
Determination of Benchmark Average and Bound
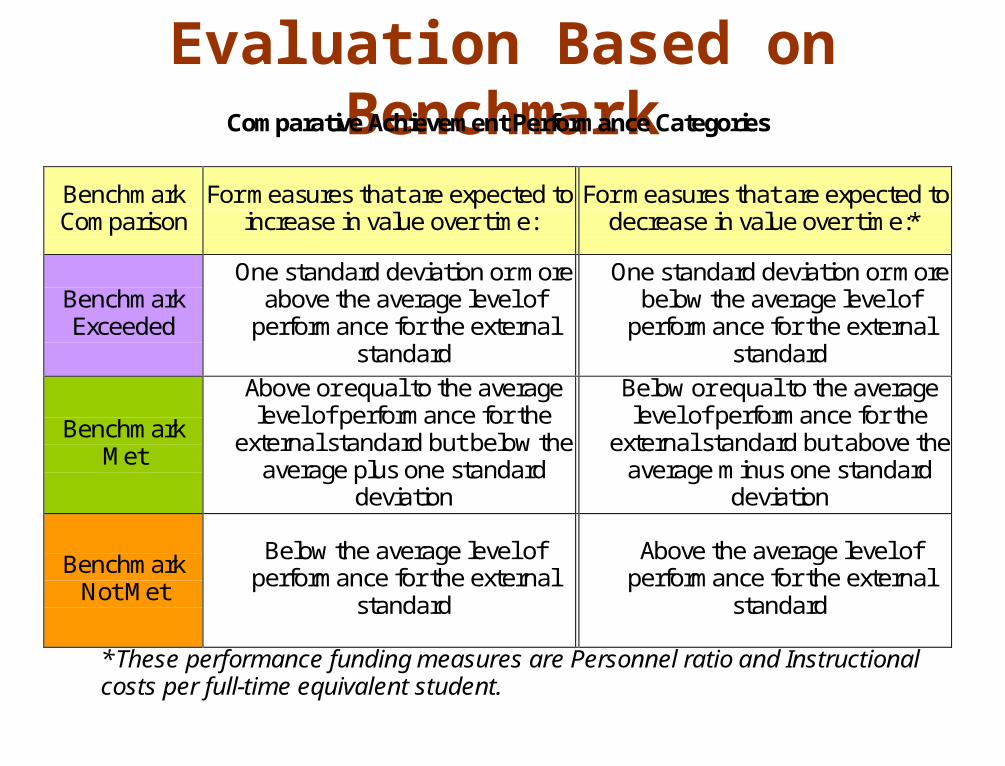
Evaluation Based on BenchmarkComparative Achievement Performance Categories
Benchmark Comparison
For measures that are expected to increase in value over time:
For measures that are expected to
decrease in value over time:*
Benchmark Exceeded
One standard deviation or more above the average level of
performance for the external standard
One standard deviation or more below the average level of
performance for the external standard
Benchmark Met
Above or equal to the average level of performance for the
external standard but below the average plus one standard
deviation
Below or equal to the average level of performance for the
external standard but above the average minus one standard
deviation
Benchmark Not Met
Below the average level of performance for the external
standard
Above the average level of
performance for the external standard
*These performance funding measures are Personnel ratio and Instructional costs per full-time equivalent student.
Evaluation Based on Benchmark
5%
10%
15%
20%
25%
30%
35%
40%
1 2 3 4 5 6 7 8 9 10 11 12 13 14
University
University Actuals External Standard Average Average + 1 Standard Deviation
4-Y
ear
Gra
du
ati
on
Ra
te
Performance Relative to an External StandardExample: Comparision of University Performance to the National Average
Benchmark Not Met
Benchmark Met
Benchmark Exceeded
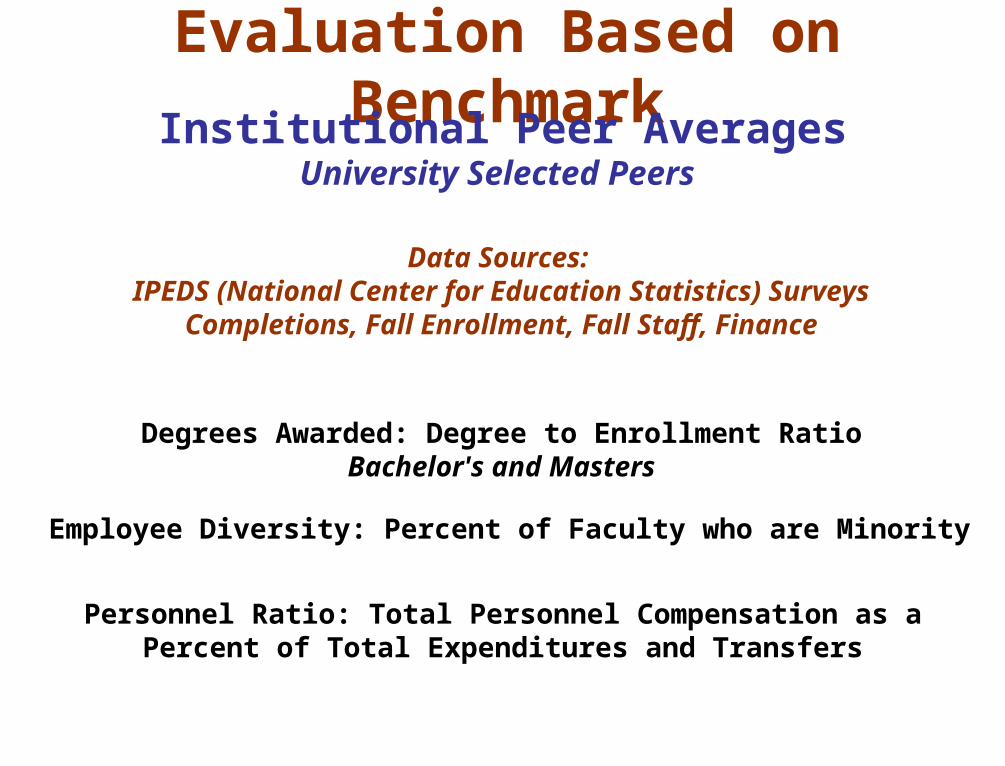
Evaluation Based on BenchmarkInstitutional Peer Averages
University Selected Peers
Degrees Awarded: Degree to Enrollment RatioBachelor's and Masters
Employee Diversity: Percent of Faculty who are Minority
Personnel Ratio: Total Personnel Compensation as a Percent of Total Expenditures and Transfers
Data Sources: IPEDS (National Center for Education Statistics) Surveys
Completions, Fall Enrollment, Fall Staff, Finance

Employee Diversity: Percent of Faculty who are Minority
Example:
East Stroudsburg University
Evaluation Based on BenchmarkInstitutional Peer Averages
University Selected Peers
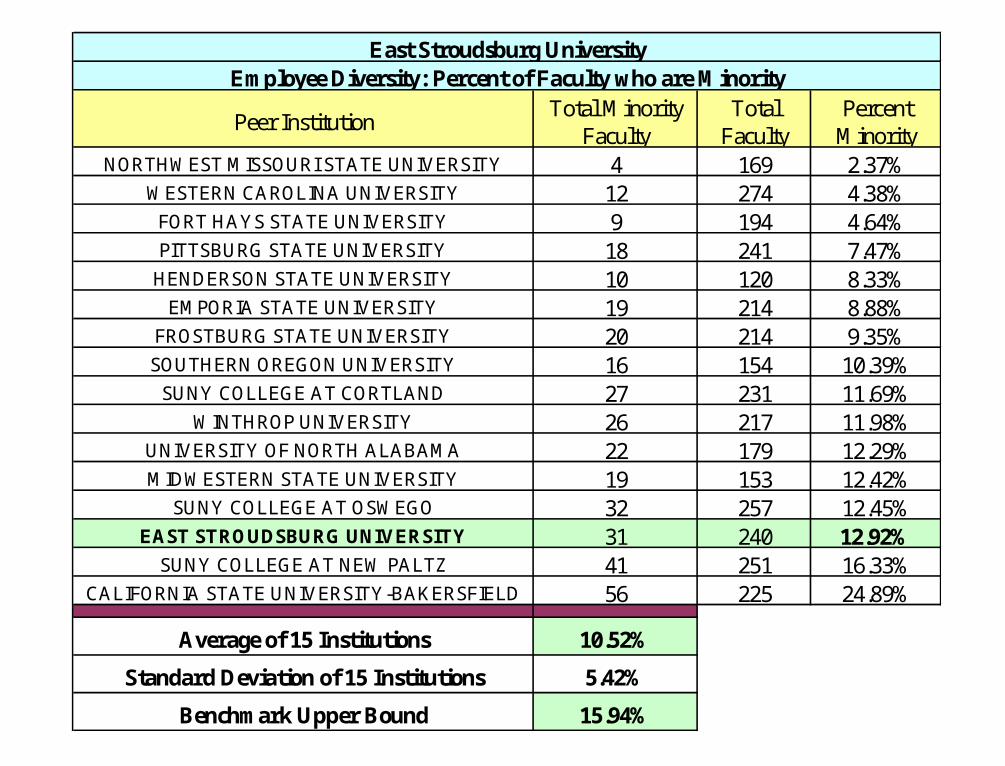
Peer InstitutionTotal Minority
FacultyTotal
FacultyPercent
MinorityNORTHWEST MISSOURI STATE UNIVERSITY 4 169 2.37%
WESTERN CAROLINA UNIVERSITY 12 274 4.38%FORT HAYS STATE UNIVERSITY 9 194 4.64%PITTSBURG STATE UNIVERSITY 18 241 7.47%
HENDERSON STATE UNIVERSITY 10 120 8.33%EMPORIA STATE UNIVERSITY 19 214 8.88%
FROSTBURG STATE UNIVERSITY 20 214 9.35%SOUTHERN OREGON UNIVERSITY 16 154 10.39%
SUNY COLLEGE AT CORTLAND 27 231 11.69%WINTHROP UNIVERSITY 26 217 11.98%
UNIVERSITY OF NORTH ALABAMA 22 179 12.29%MIDWESTERN STATE UNIVERSITY 19 153 12.42%
SUNY COLLEGE AT OSWEGO 32 257 12.45%EAST STROUDSBURG UNIVERSITY 31 240 12.92%
SUNY COLLEGE AT NEW PALTZ 41 251 16.33%CALIFORNIA STATE UNIVERSITY-BAKERSFIELD 56 225 24.89%
Average of 15 Institutions 10.52%
Standard Deviation of 15 Institutions 5.42%
Benchmark Upper Bound 15.94%
East Stroudsburg UniversityEmployee Diversity: Percent of Faculty who are Minority
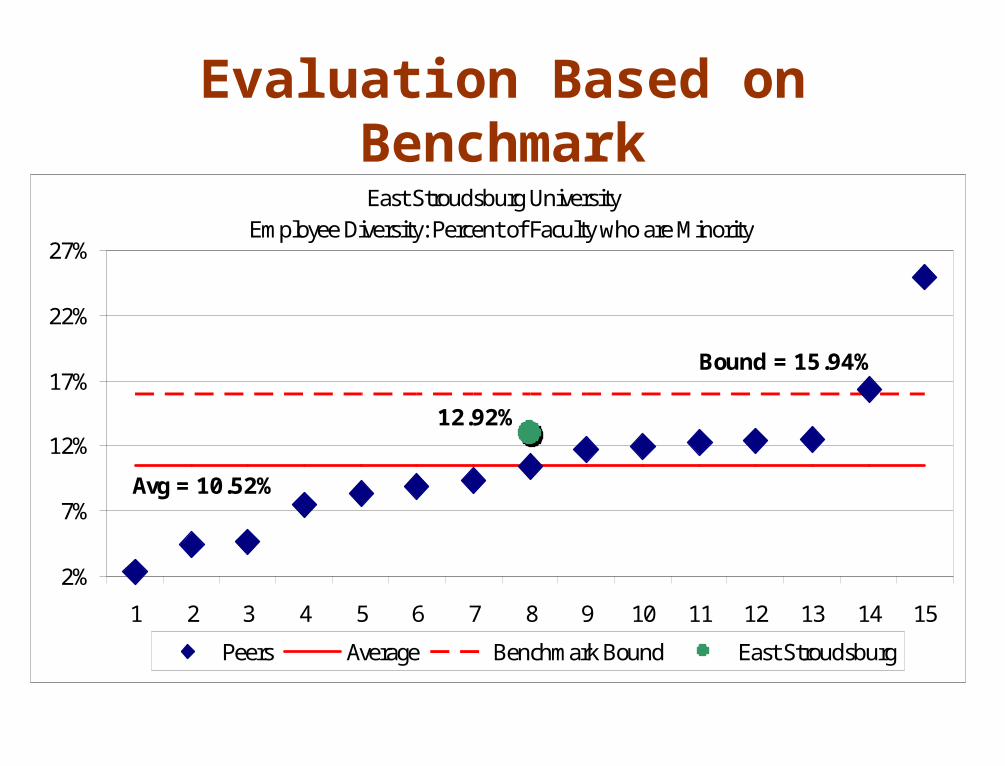
East Stroudsburg University Employee Diversity: Percent of Faculty who are Minority
Avg = 10.52%
Bound = 15.94%
12.92%
2%
7%
12%
17%
22%
27%
1 2 3 4 5 6 7 8 9 10 11 12 13 14 15
Peers Average Benchmark Bound East Stroudsburg
Evaluation Based on Benchmark
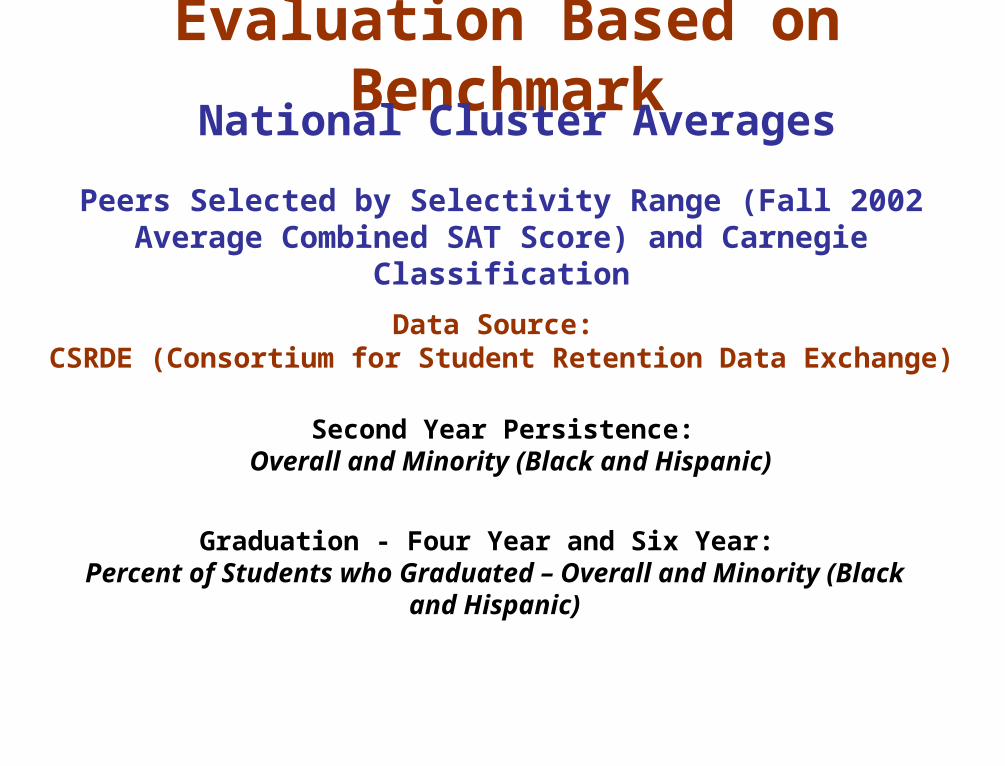
Evaluation Based on Benchmark
National Cluster Averages
Peers Selected by Selectivity Range (Fall 2002 Average Combined SAT Score) and Carnegie
Classification
Data Source: CSRDE (Consortium for Student Retention Data Exchange)
Graduation - Four Year and Six Year: Percent of Students who Graduated – Overall and
Minority (Black and Hispanic)
Second Year Persistence: Overall and Minority (Black and Hispanic)
Evaluation Based on BenchmarkNational Cluster Averages
Percent of Students who Graduated in Four Years -
Overall
Example:
West Chester University
Peers: Selective Masters Institutions
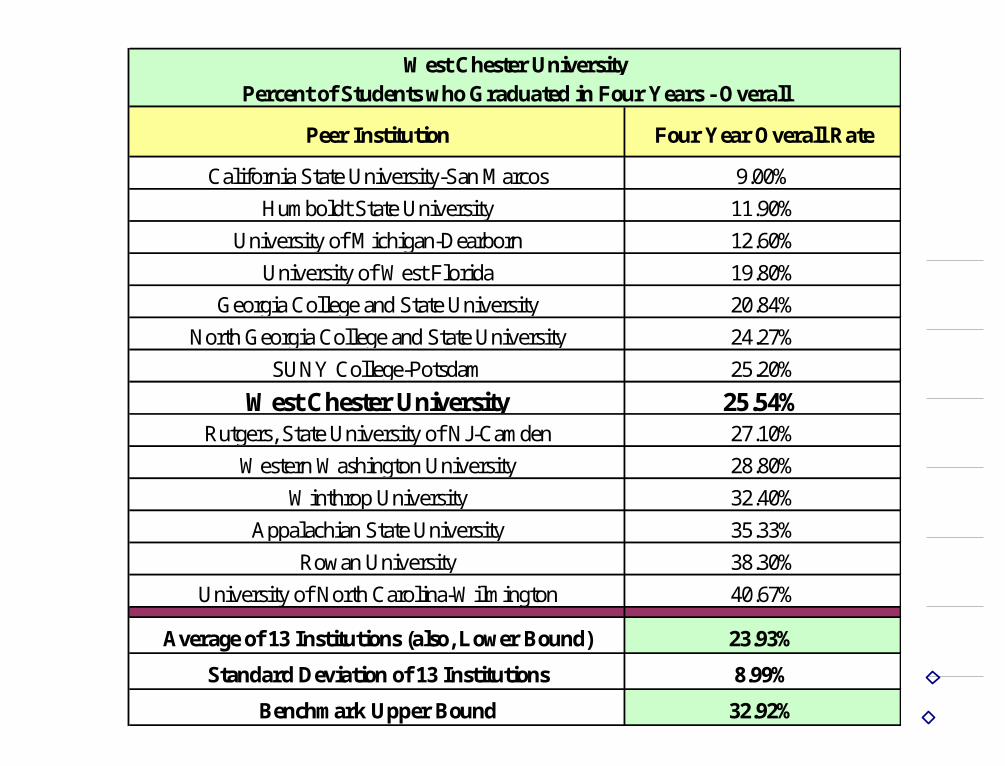
Peer Institution Four Year Overall Rate
California State University-San Marcos 9.00%
Humboldt State University 11.90%
University of Michigan-Dearborn 12.60%
University of West Florida 19.80%
Georgia College and State University 20.84%
North Georgia College and State University 24.27%
SUNY College-Potsdam 25.20%
West Chester University 25.54%Rutgers, State University of NJ-Camden 27.10%
Western Washington University 28.80%
Winthrop University 32.40%
Appalachian State University 35.33%
Rowan University 38.30%
University of North Carolina-Wilmington 40.67%
Average of 13 Institutions (also, Lower Bound) 23.93%
Standard Deviation of 13 Institutions 8.99%
Benchmark Upper Bound 32.92%
West Chester UniversityPercent of Students who Graduated in Four Years - Overall
West Chester University
Graduation - Four Year and Six Year: Percent of Students who Graduated in
Four Years - Overall
7%
12%
17%
22%
27%
32%
37%
42%
1 2 3 4 5 6 7 8 9 10 11 12 13
Four Year Overall Rate
#REF!
Benchmark Bound
West Chester
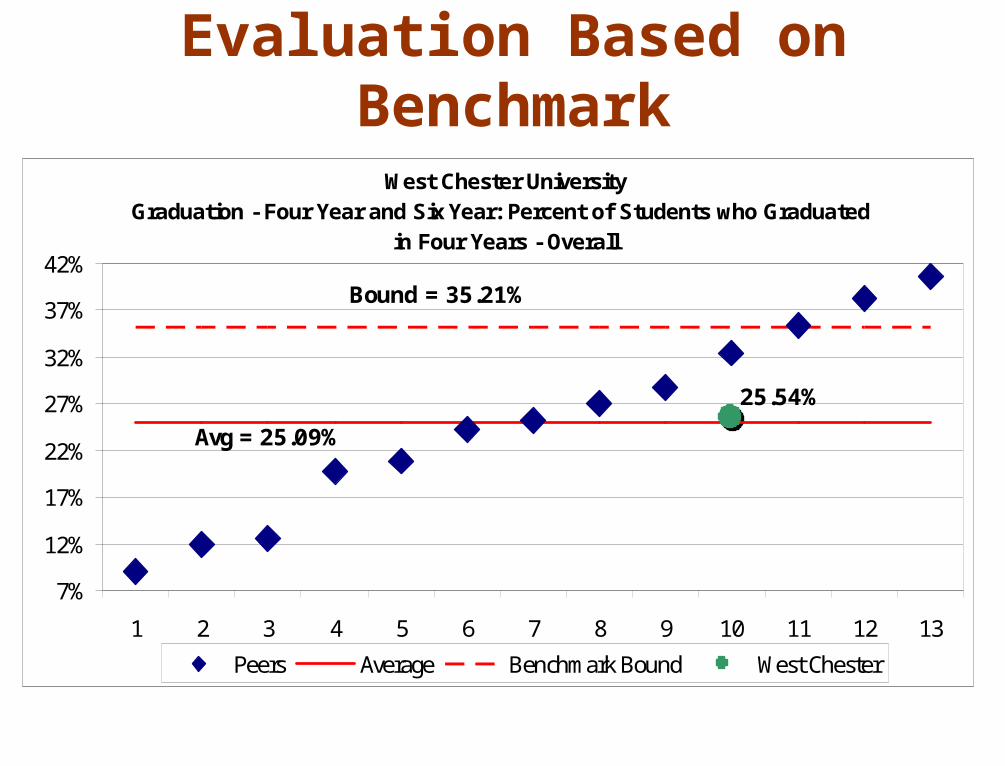
West Chester UniversityGraduation - Four Year and Six Year: Percent of Students who Graduated
in Four Years - Overall
Avg = 25.09%
Bound = 35.21%
25.54%
7%
12%
17%
22%
27%
32%
37%
42%
1 2 3 4 5 6 7 8 9 10 11 12 13
Peers Average Benchmark Bound West Chester
Evaluation Based on Benchmark
Evaluation Based on Benchmark
System-wide AveragesMost current data from all System Universities.
Instructional Cost: Undergraduate and Graduate (Masters) Cost per FTE
Student
Faculty Terminal Degrees: Percent of Full-time Tenured or Tenure Track
Instructional Faculty
Faculty Productivity: Total Credits per FTE Instructional Faculty
Data Sources: Common Cost Accounting Report, University
Submissions
Evaluation Based on Benchmark
Instructional Cost: Masters Cost per FTE Student
Example:
All Universities
System-wide Averages
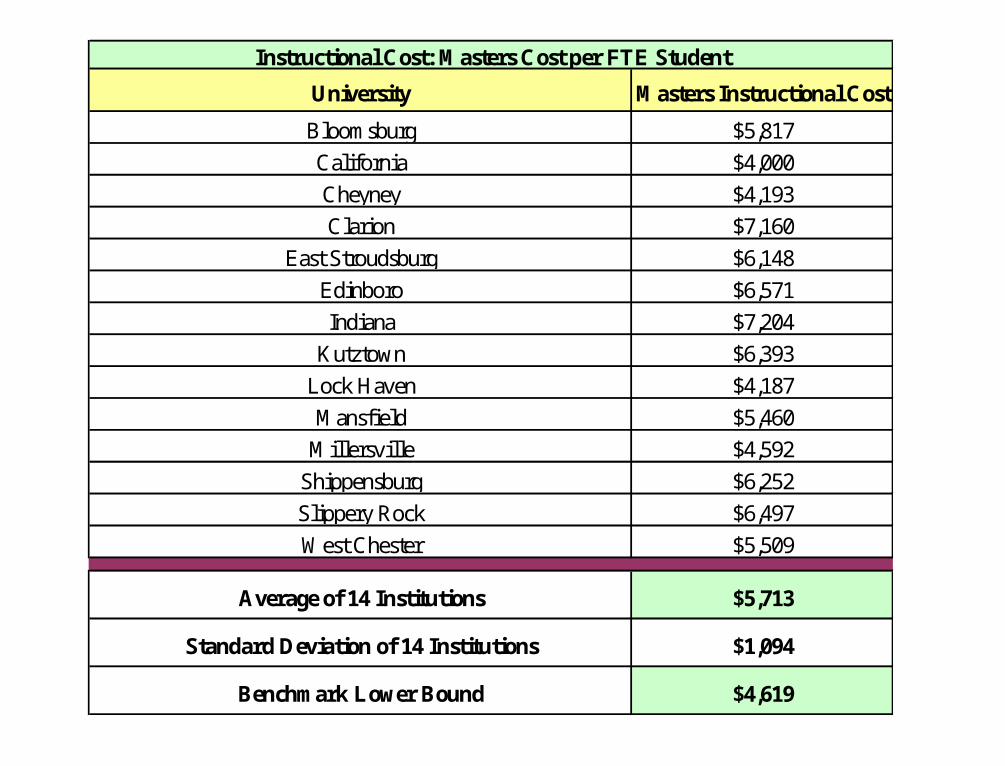
University Masters Instructional Cost
Bloomsburg $5,817
California $4,000
Cheyney $4,193
Clarion $7,160
East Stroudsburg $6,148
Edinboro $6,571
Indiana $7,204
Kutztown $6,393
Lock Haven $4,187
Mansfield $5,460
Millersville $4,592
Shippensburg $6,252
Slippery Rock $6,497
West Chester $5,509
Average of 14 Institutions $5,713
Standard Deviation of 14 Institutions $1,094
Benchmark Lower Bound $4,619
Instructional Cost: Masters Cost per FTE Student
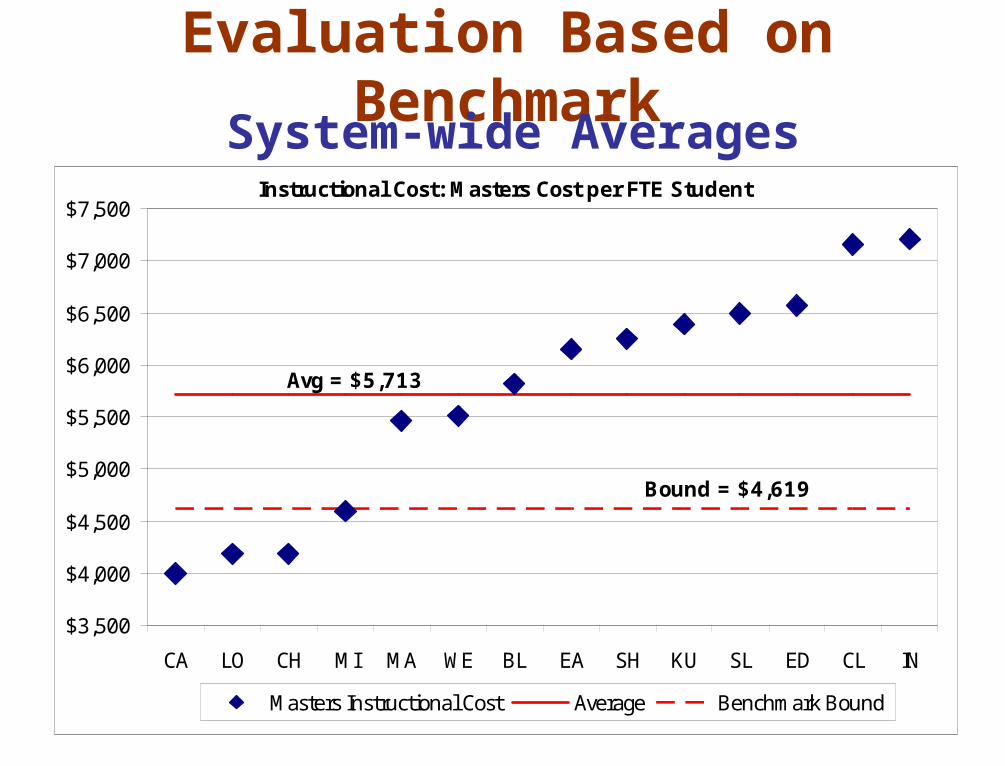
Evaluation Based on BenchmarkSystem-wide Averages
Instructional Cost: Masters Cost per FTE Student
Avg = $5,713
Bound = $4,619
$3,500
$4,000
$4,500
$5,000
$5,500
$6,000
$6,500
$7,000
$7,500
CA LO CH MI MA WE BL EA SH KU SL ED CL IN
Masters Instructional Cost Average Benchmark Bound
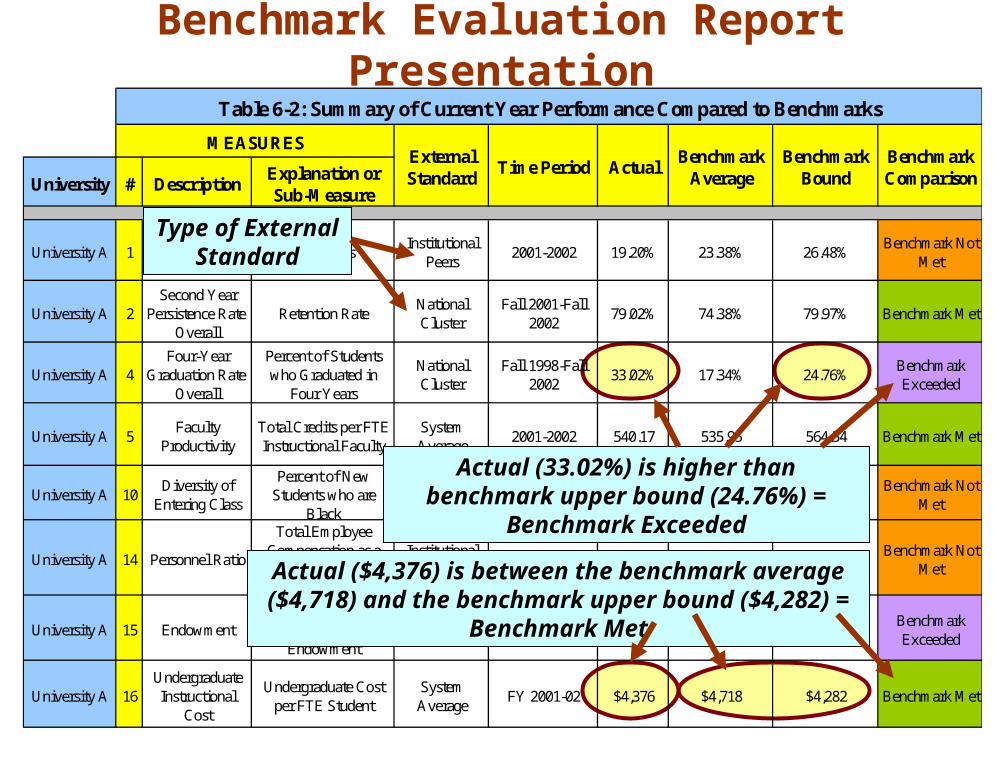
Benchmark Evaluation Report Presentation
University # DescriptionExplanation or Sub-Measure
University A 1Degree to
Enrollment RatioBachelor's
Institutional Peers
2001-2002 19.20% 23.38% 26.48%Benchmark Not
Met
University A 2Second Year
Persistence Rate - Overall
Retention RateNational Cluster
Fall 2001-Fall 2002
79.02% 74.38% 79.97% Benchmark Met
University A 4Four-Year
Graduation Rate - Overall
Percent of Students who Graduated in
Four Years
National Cluster
Fall 1998-Fall 2002
33.02% 17.34% 24.76%Benchmark Exceeded
University A 5Faculty
ProductivityTotal Credits per FTE Instructional Faculty
System Average
2001-2002 540.17 535.95 564.54 Benchmark Met
University A 10Diversity of
Entering Class
Percent of New Students who are
Black
Public State-wide Average
Fall 2002 5.25% 6.75% 14.65%Benchmark Not
Met
University A 14 Personnel Ratio
Total Employee Compensation as a
Percent of Total Expenditures
Institutional Peers
FY 2001-02 80.61% 73.72% 68.95%Benchmark Not
Met
University A 15 EndowmentRate of Change in Market Value of
Endowment
Institutional Peers
FY 2000-01 and FY 2001-02
4.55% -3.88% 2.76%Benchmark Exceeded
University A 16Undergraduate Instructional
Cost
Undergraduate Cost per FTE Student
System Average
FY 2001-02 $4,376 $4,718 $4,282 Benchmark Met
Table 6-2: Summary of Current Year Performance Compared to Benchmarks
MEASURESExternal Standard
Time Period ActualBenchmark
AverageBenchmark
BoundBenchmark Comparison
Type of External Standard
Actual (33.02%) is higher than benchmark upper bound (24.76%) = Benchmark Exceeded
Actual ($4,376) is between the benchmark average ($4,718) and the benchmark upper bound ($4,282) = Benchmark Met
Benchmarking and Performance Evaluations
Questions and Answers
System Performance Targets
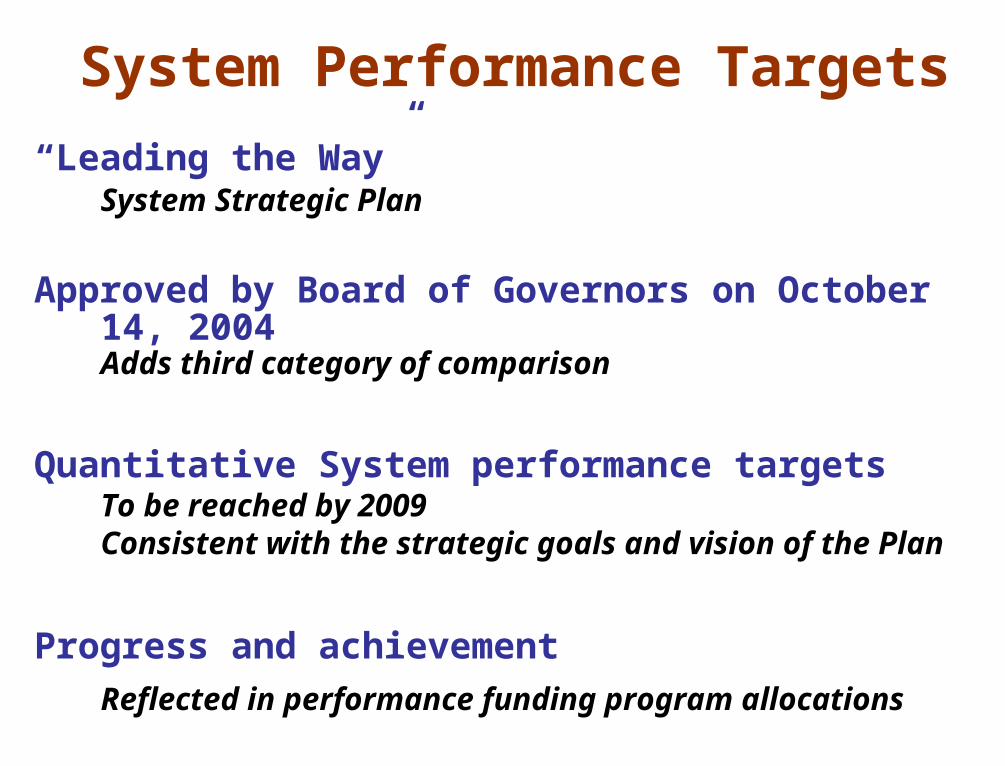
System Performance Targets
“Leading the Way”System Strategic Plan
Approved by Board of Governors on October 14, 2004 Adds third category of comparison
Quantitative System performance targetsTo be reached by 2009Consistent with the strategic goals and vision of the Plan
Progress and achievementReflected in performance funding program allocations
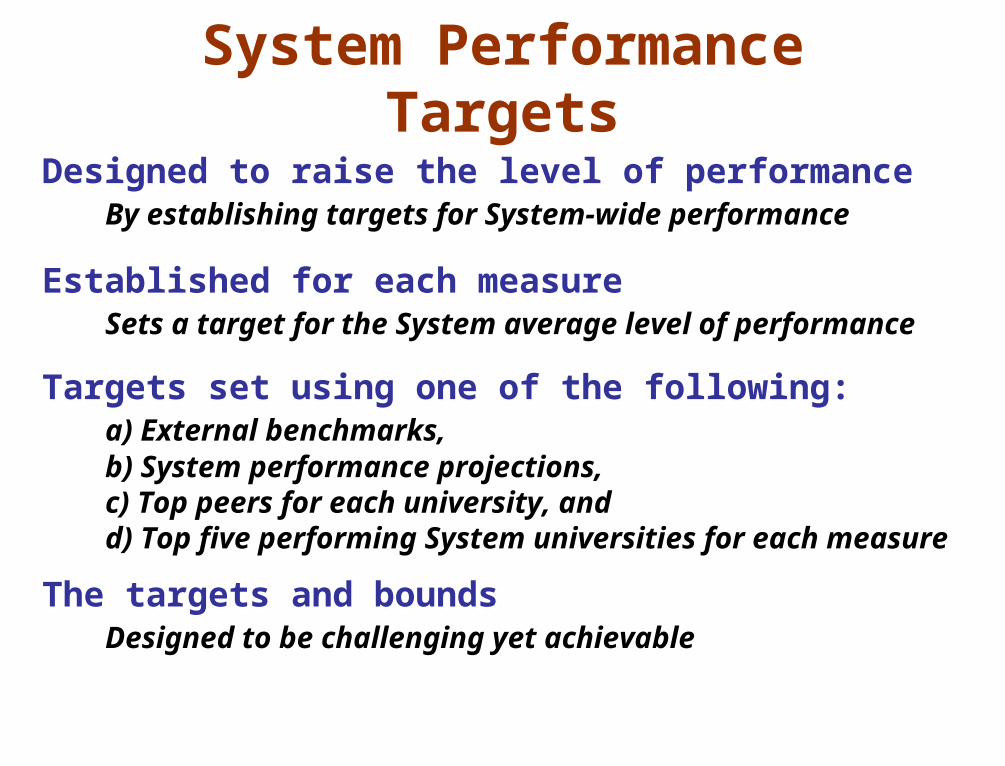
System Performance Targets
Designed to raise the level of performanceBy establishing targets for System-wide performance
Established for each measureSets a target for the System average level of performance
Targets set using one of the following:a) External benchmarks,b) System performance projections,c) Top peers for each university, and d) Top five performing System universities for
each measure
The targets and boundsDesigned to be challenging yet achievable
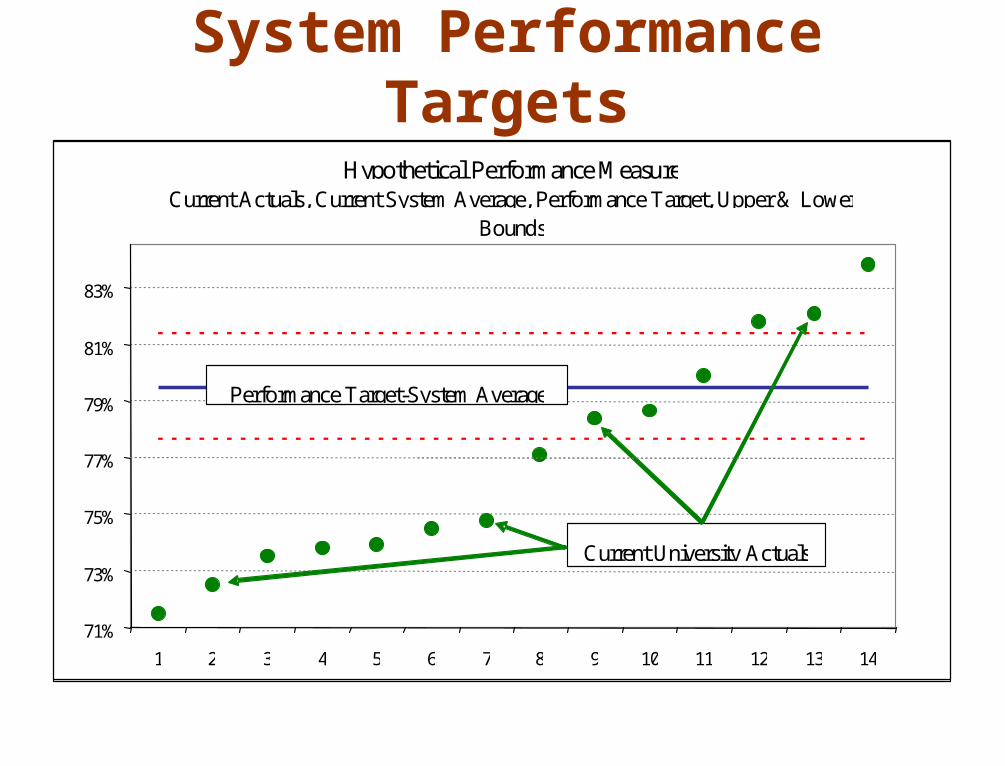
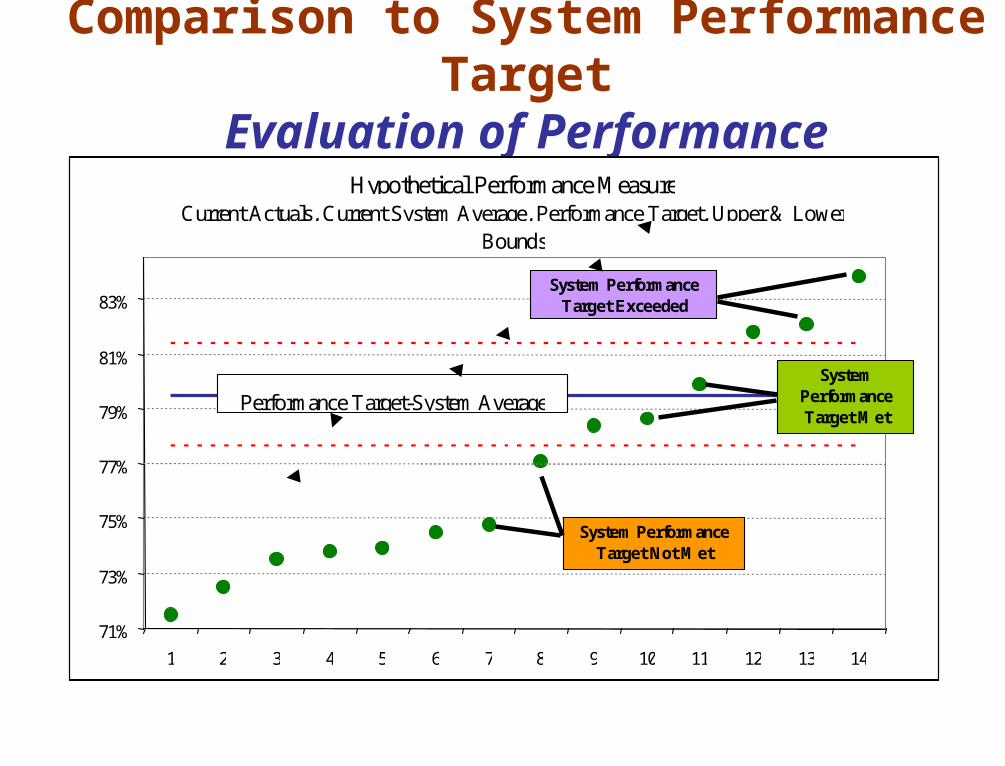
System Performance TargetsPerformance targets are expectations of overall improvement
with some universities expected to improve more than others.
71%
73%
75%
77%
79%
81%
83%
1 2 3 4 5 6 7 8 9 10 11 12 13 14
Performance Target-System Average
Current System Average
Current University Actuals
Hypothetical Performance MeasureCurrent Actuals, Current System Average, Performance Target, Upper & Lower
Bounds
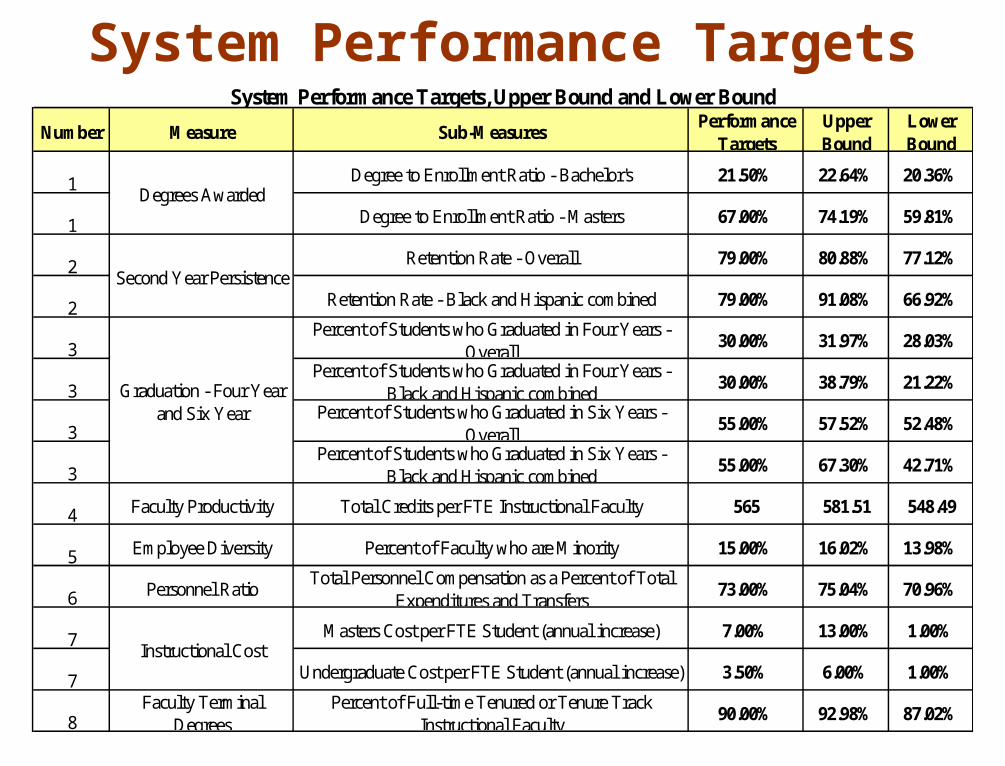
System Performance TargetsNumber Measure Sub-Measures
Performance Targets
Upper Bound
Lower Bound
1 Degree to Enrollment Ratio - Bachelor's 21.50% 22.64% 20.36%
1 Degree to Enrollment Ratio - Masters 67.00% 74.19% 59.81%
2 Retention Rate - Overall 79.00% 80.88% 77.12%
2 Retention Rate - Black and Hispanic combined 79.00% 91.08% 66.92%
3Percent of Students who Graduated in Four Years -
Overall30.00% 31.97% 28.03%
3Percent of Students who Graduated in Four Years -
Black and Hispanic combined30.00% 38.79% 21.22%
3Percent of Students who Graduated in Six Years -
Overall55.00% 57.52% 52.48%
3Percent of Students who Graduated in Six Years -
Black and Hispanic combined55.00% 67.30% 42.71%
4 Faculty Productivity Total Credits per FTE Instructional Faculty 565 581.51 548.49
5 Employee Diversity Percent of Faculty who are Minority 15.00% 16.02% 13.98%
6 Personnel RatioTotal Personnel Compensation as a Percent of Total
Expenditures and Transfers73.00% 75.04% 70.96%
7 Masters Cost per FTE Student (annual increase) 7.00% 13.00% 1.00%
7 Undergraduate Cost per FTE Student (annual increase) 3.50% 6.00% 1.00%
8Faculty Terminal
DegreesPercent of Full-time Tenured or Tenure Track
Instructional Faculty90.00% 92.98% 87.02%
Instructional Cost
System Performance Targets, Upper Bound and Lower Bound
Degrees Awarded
Second Year Persistence
Graduation - Four Year and Six Year
System Performance Targets
71%
73%
75%
77%
79%
81%
83%
1 2 3 4 5 6 7 8 9 10 11 12 13 14
Performance Target-System Average
Current University Actuals
Hypothetical Performance MeasureCurrent Actuals, Current System Average, Performance Target, Upper & Lower
Bounds
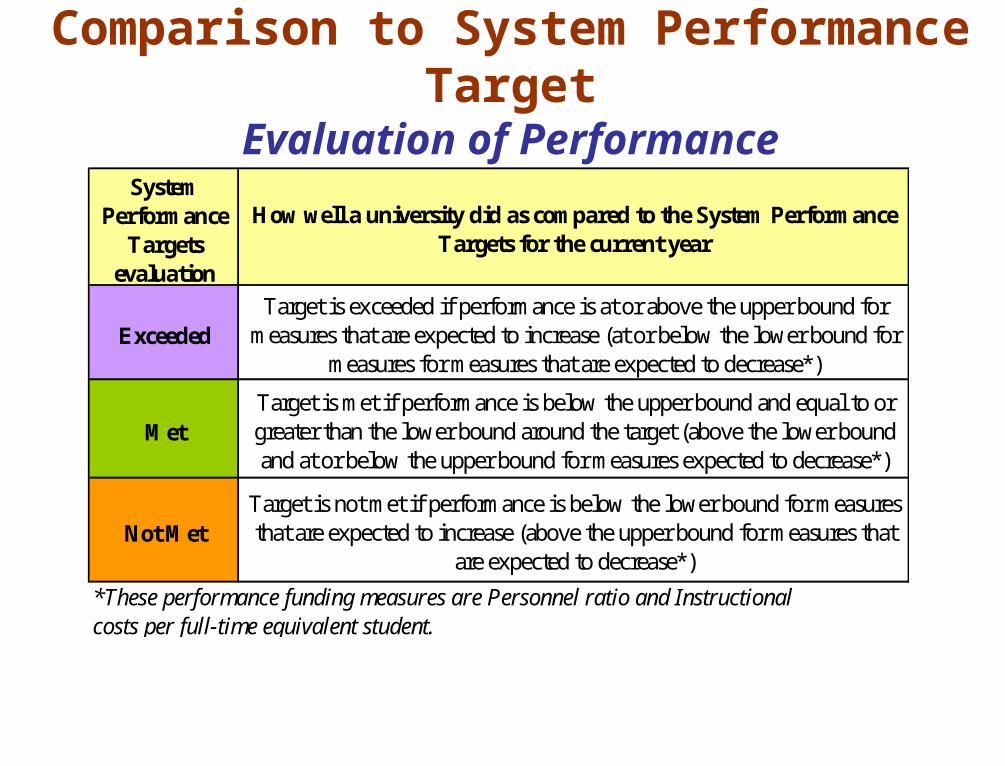
Comparison to System Performance Target
Evaluation of PerformanceSystem
Performance Targets
evaluation
Exceeded
Met
Not MetTarget is not met if performance is below the lower bound for measures that are expected to increase (above the upper bound for measures that
are expected to decrease*)
*These performance funding measures are Personnel ratio and Instructional costs per full-time equivalent student.
How well a university did as compared to the System Performance Targets for the current year
Target is exceeded if performance is at or above the upper bound for measures that are expected to increase (at or below the lower bound for
measures for measures that are expected to decrease*)
Target is met if performance is below the upper bound and equal to or greater than the lower bound around the target (above the lower bound and at or below the upper bound for measures expected to decrease*)
Comparison to System Performance Target
Evaluation of Performance
71%
73%
75%
77%
79%
81%
83%
1 2 3 4 5 6 7 8 9 10 11 12 13 14
Performance Target-System Average
Hypothetical Performance MeasureCurrent Actuals, Current System Average, Performance Target, Upper & Lower
Bounds
System Performance Target Not Met
System Performance Target Met
System Performance Target Exceeded
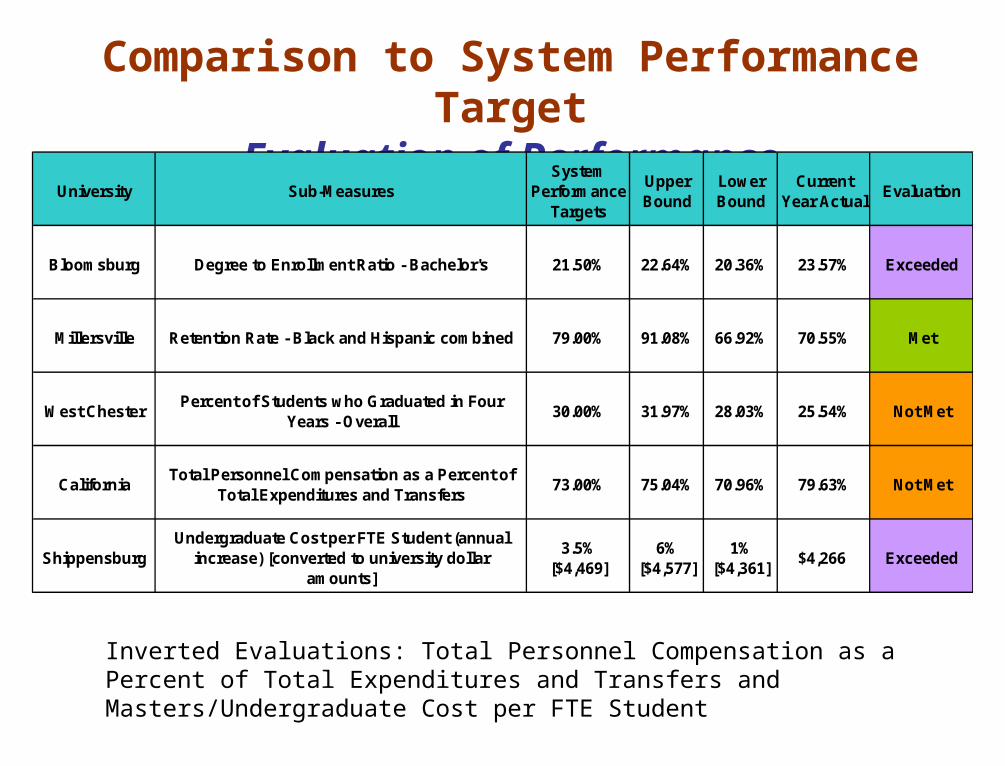
Comparison to System Performance TargetEvaluation of Performance
University Sub-MeasuresSystem
PerformanceTargets
Upper Bound
Lower Bound
Current Year Actual
Evaluation
Bloomsburg Degree to Enrollment Ratio - Bachelor's 21.50% 22.64% 20.36% 23.57% Exceeded
Millersville Retention Rate - Black and Hispanic combined 79.00% 91.08% 66.92% 70.55% Met
West ChesterPercent of Students who Graduated in Four
Years - Overall30.00% 31.97% 28.03% 25.54% Not Met
CaliforniaTotal Personnel Compensation as a Percent of
Total Expenditures and Transfers73.00% 75.04% 70.96% 79.63% Not Met
ShippensburgUndergraduate Cost per FTE Student (annual
increase) [converted to university dollar amounts]
3.5% [$4,469]
6% [$4,577]
1% [$4,361]
$4,266 Exceeded
Inverted Evaluations: Total Personnel Compensation as a Percent of Total Expenditures and Transfers and Masters/Undergraduate Cost per FTE Student

System Performance Targets and Performance Evaluations
Questions and Answers

Afternoon Session Topics Covered
Performance Funding Methodology:Performance and Distribution MethodologyReview of FY 2004-2005 Performance Funding Calculations and Distributions Question and Answer Period
Wrap-up Session: 3:30 p.m. to 4:00 p.m.
Comments:University PresidentsChancellor

Afternoon Session Topics Covered
Afternoon Session: 1:00 p.m. to 3:30 p.m.
Performance Funding Methodology:Performance and Distribution Methodology
Review of FY 2004-2005 Performance Funding Calculations and Distributions Question and Answer Period
Closing Comments: 3:30 p.m. to 4:00 p.m.
Comments:University PresidentsChancellor
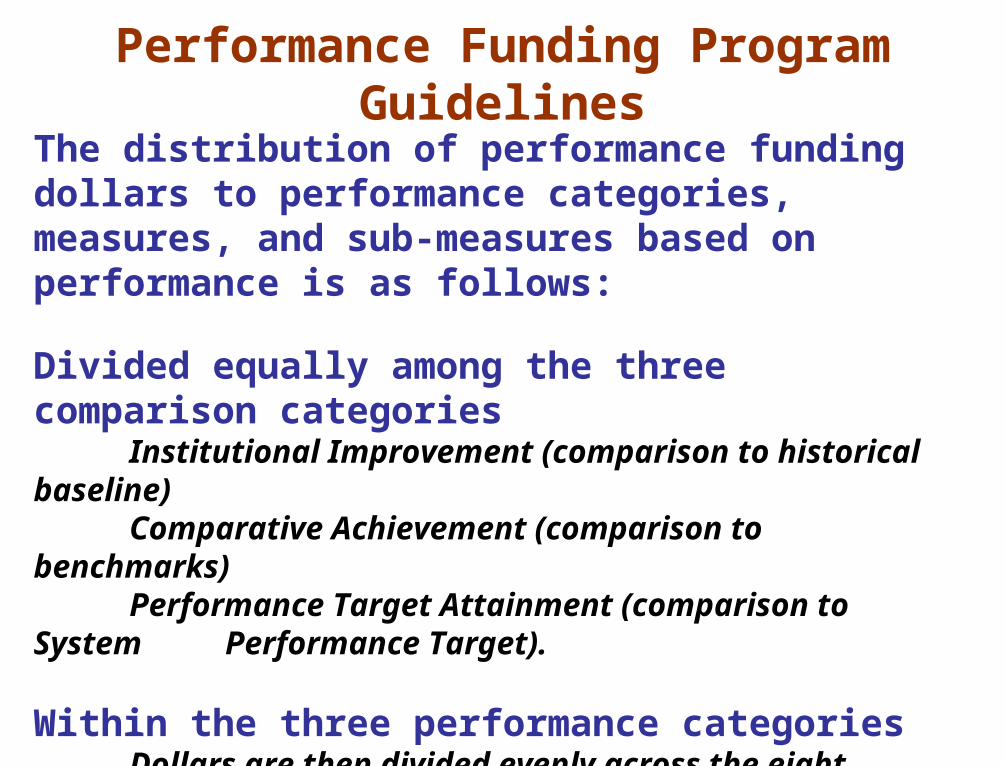
Performance Funding Program Guidelines
The distribution of performance funding dollars to performance categories, measures, and sub-measures based on performance is as follows:
Divided equally among the three comparison categoriesInstitutional Improvement (comparison to historical baseline)Comparative Achievement (comparison to benchmarks)Performance Target Attainment (comparison to System
Performance Target).
Within the three performance categoriesDollars are then divided evenly across the eight measures, and, equally across the sub-measures.
Performance Funding Program Guidelines
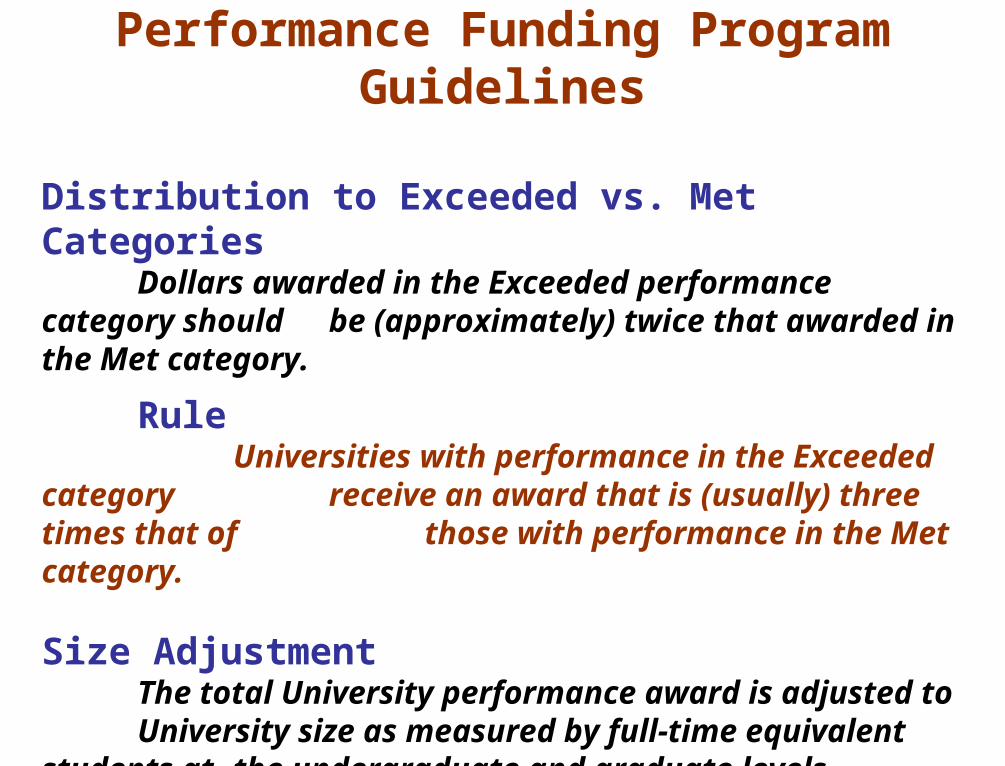
Distribution to Exceeded vs. Met CategoriesDollars awarded in the Exceeded performance category should be (approximately) twice that awarded in the Met category.
RuleUniversities with performance in the Exceeded category receive an award that is (usually) three times that of those with performance in the Met category.
Size AdjustmentThe total University performance award is adjusted to
University size as measured by full-time equivalent students at the undergraduate and graduate levels.
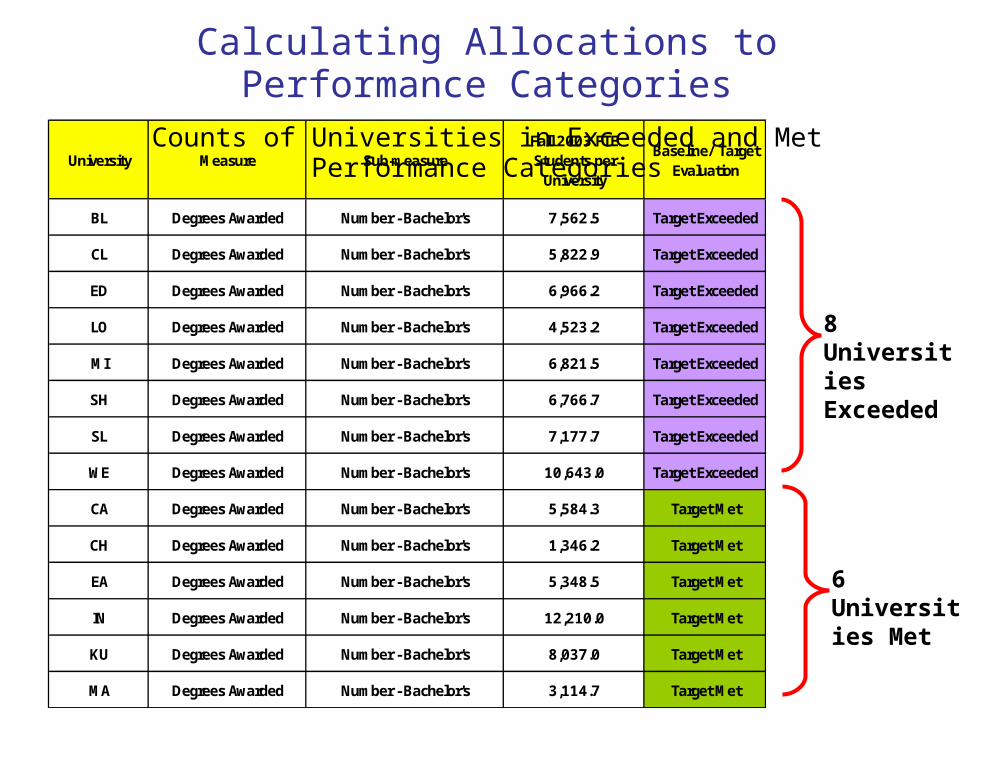
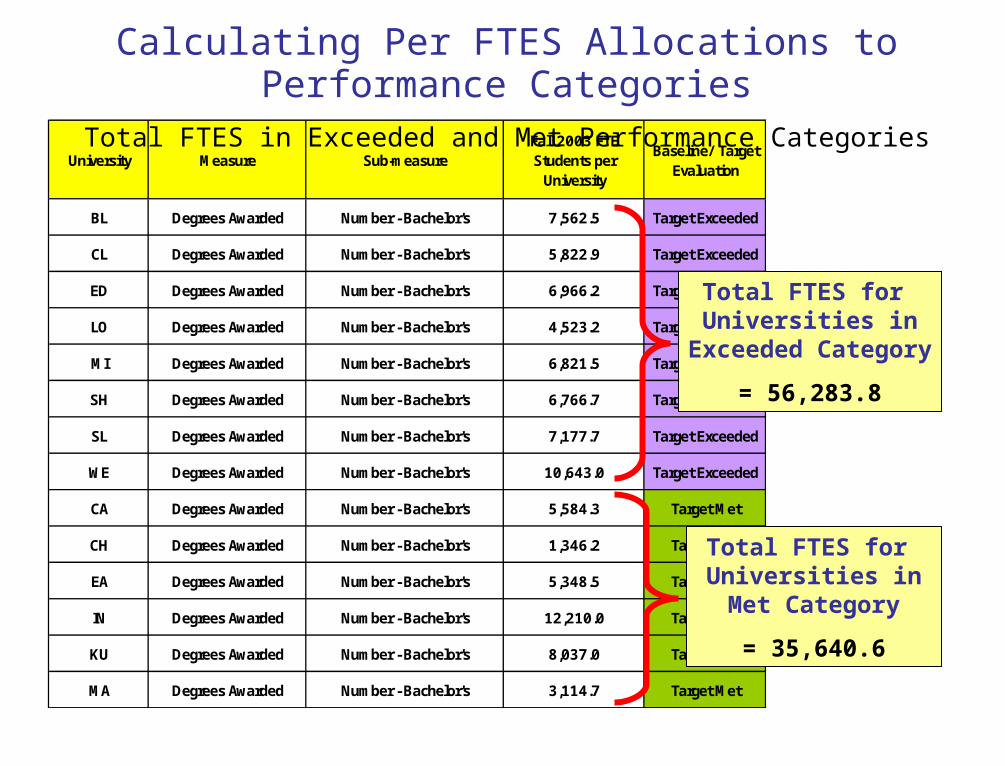
University Measure Sub-measureFall 2003 FTE Students per University
Baseline/ Target Evaluation
BL Degrees Awarded Number - Bachelor's 7,562.5 Target Exceeded
CL Degrees Awarded Number - Bachelor's 5,822.9 Target Exceeded
ED Degrees Awarded Number - Bachelor's 6,966.2 Target Exceeded
LO Degrees Awarded Number - Bachelor's 4,523.2 Target Exceeded
MI Degrees Awarded Number - Bachelor's 6,821.5 Target Exceeded
SH Degrees Awarded Number - Bachelor's 6,766.7 Target Exceeded
SL Degrees Awarded Number - Bachelor's 7,177.7 Target Exceeded
WE Degrees Awarded Number - Bachelor's 10,643.0 Target Exceeded
CA Degrees Awarded Number - Bachelor's 5,584.3 Target Met
CH Degrees Awarded Number - Bachelor's 1,346.2 Target Met
EA Degrees Awarded Number - Bachelor's 5,348.5 Target Met
IN Degrees Awarded Number - Bachelor's 12,210.0 Target Met
KU Degrees Awarded Number - Bachelor's 8,037.0 Target Met
MA Degrees Awarded Number - Bachelor's 3,114.7 Target Met
8 Universities Exceeded
6 Universities Met
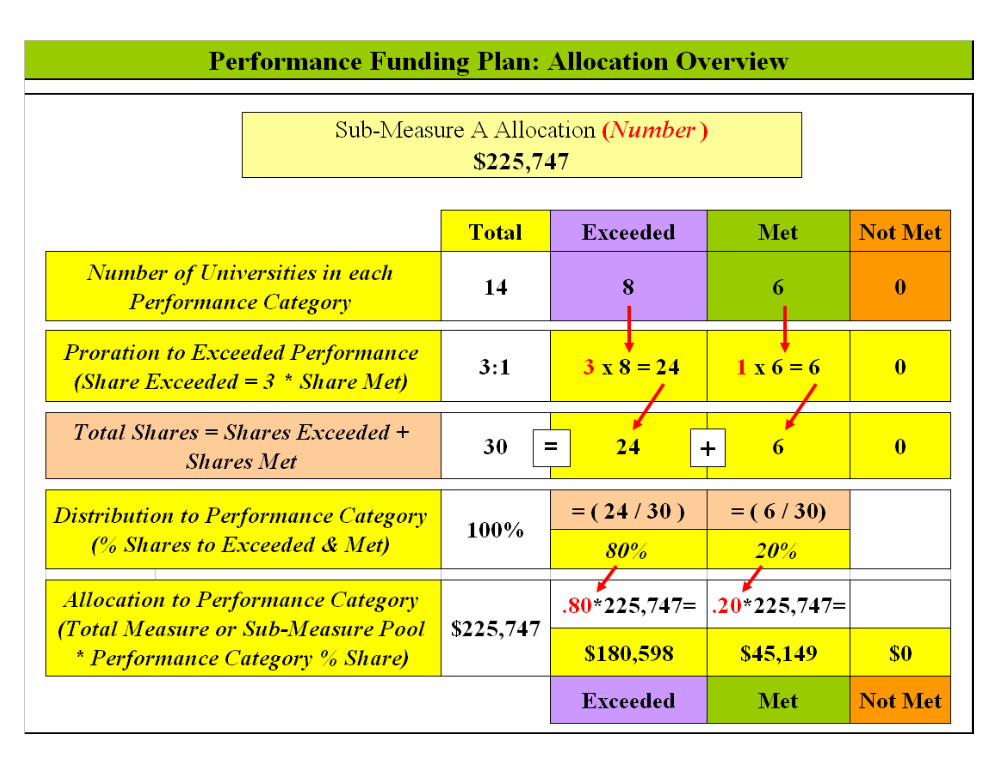
Calculating Allocations to Performance CategoriesCounts of Universities in Exceeded and Met Performance Categories
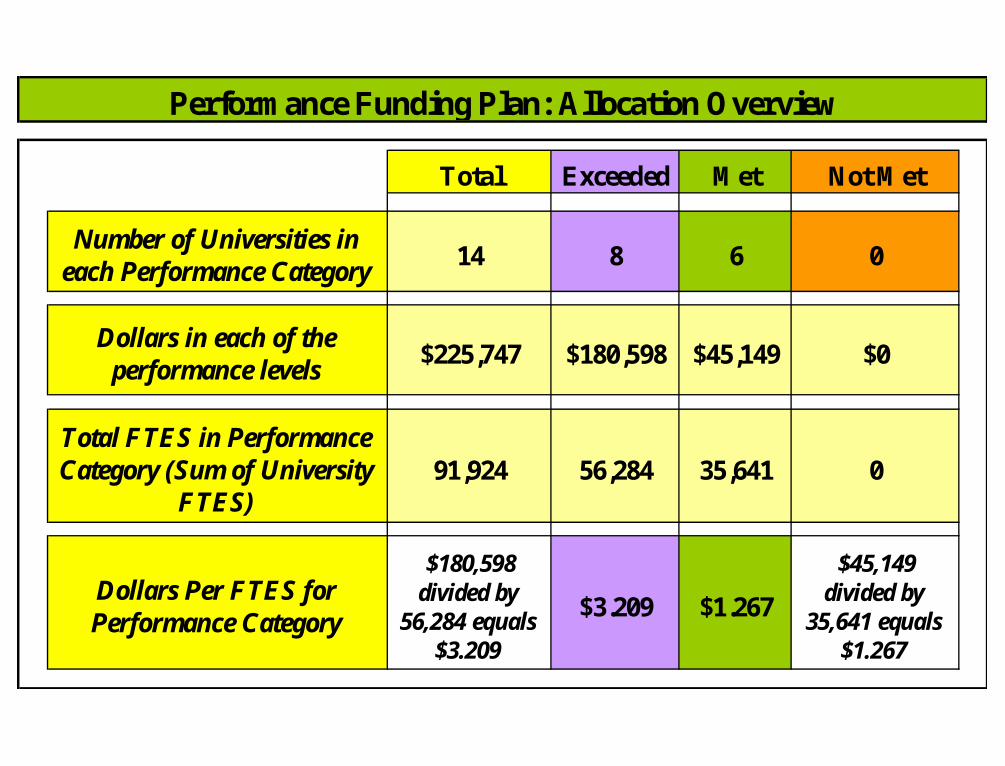
Total Exceeded Met Not Met
14 8 6 0
$225,747 $180,598 $45,149 $0
91,924 56,284 35,641 0
$180,598 divided by
56,284 equals $3.209
$3.209 $1.267
$45,149 divided by
35,641 equals $1.267
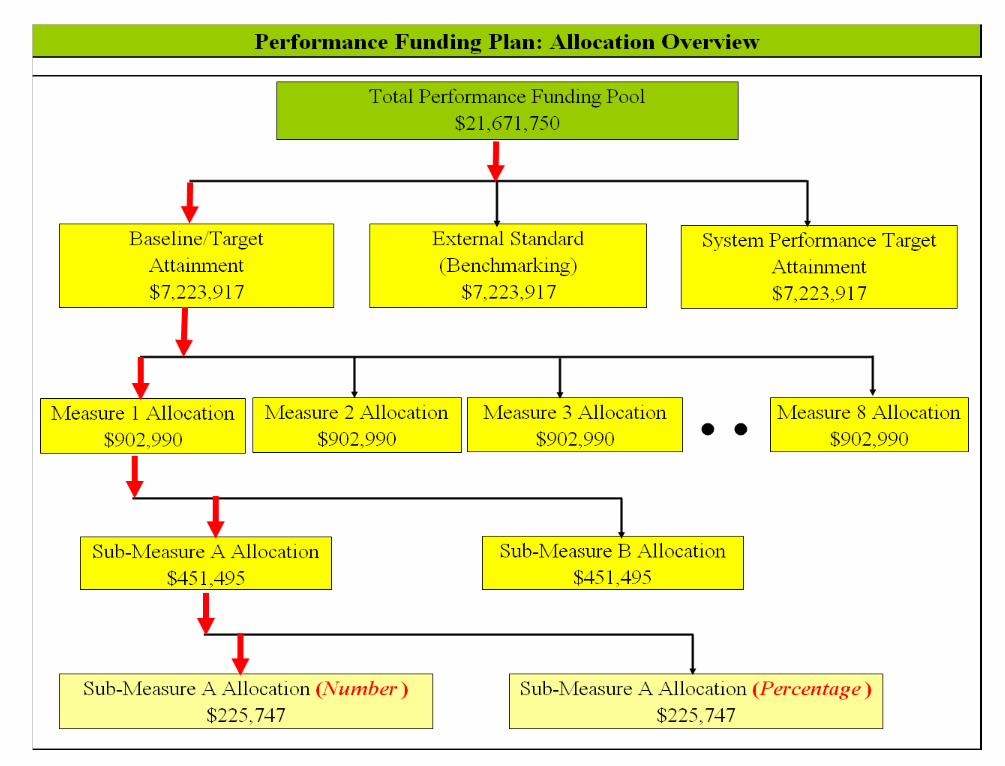
Performance Funding Plan: Allocation Overview
Total FTES in Performance Category (Sum of University
FTES)
Dollars Per FTES for Performance Category
Number of Universities in each Performance Category
Dollars in each of the performance levels
University Measure Sub-measureFall 2003 FTE Students per University
Baseline/ Target Evaluation
BL Degrees Awarded Number - Bachelor's 7,562.5 Target Exceeded
CL Degrees Awarded Number - Bachelor's 5,822.9 Target Exceeded
ED Degrees Awarded Number - Bachelor's 6,966.2 Target Exceeded
LO Degrees Awarded Number - Bachelor's 4,523.2 Target Exceeded
MI Degrees Awarded Number - Bachelor's 6,821.5 Target Exceeded
SH Degrees Awarded Number - Bachelor's 6,766.7 Target Exceeded
SL Degrees Awarded Number - Bachelor's 7,177.7 Target Exceeded
WE Degrees Awarded Number - Bachelor's 10,643.0 Target Exceeded
CA Degrees Awarded Number - Bachelor's 5,584.3 Target Met
CH Degrees Awarded Number - Bachelor's 1,346.2 Target Met
EA Degrees Awarded Number - Bachelor's 5,348.5 Target Met
IN Degrees Awarded Number - Bachelor's 12,210.0 Target Met
KU Degrees Awarded Number - Bachelor's 8,037.0 Target Met
MA Degrees Awarded Number - Bachelor's 3,114.7 Target Met
Total FTES for Universities in
Exceeded Category
= 56,283.8
Calculating Per FTES Allocations to Performance CategoriesTotal FTES in Exceeded and Met Performance Categories
Total FTES for Universities in Met
Category
= 35,640.6
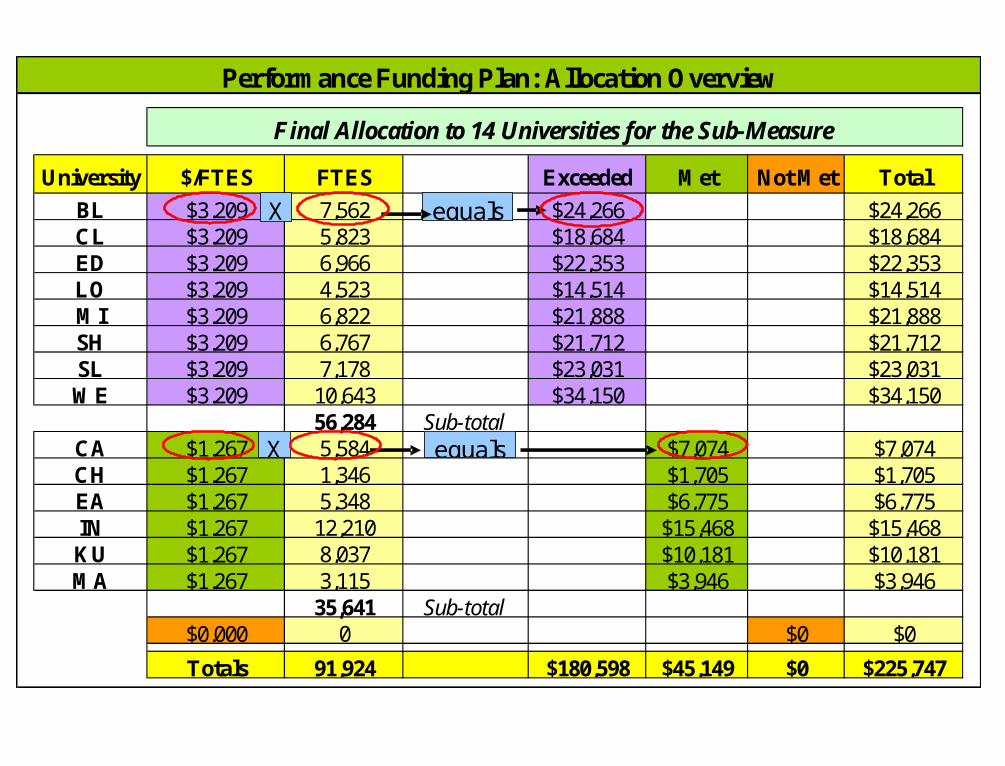
University $/FTES FTES Exceeded Met Not Met Total
BL $3.209 7,562 $24,266 $24,266CL $3.209 5,823 $18,684 $18,684ED $3.209 6,966 $22,353 $22,353LO $3.209 4,523 $14,514 $14,514MI $3.209 6,822 $21,888 $21,888SH $3.209 6,767 $21,712 $21,712SL $3.209 7,178 $23,031 $23,031WE $3.209 10,643 $34,150 $34,150
56,284 Sub-totalCA $1.267 5,584 $7,074 $7,074CH $1.267 1,346 $1,705 $1,705EA $1.267 5,348 $6,775 $6,775IN $1.267 12,210 $15,468 $15,468KU $1.267 8,037 $10,181 $10,181MA $1.267 3,115 $3,946 $3,946
35,641 Sub-total$0.000 0 $0 $0
Totals 91,924 $180,598 $45,149 $0 $225,747
Final Allocation to 14 Universities for the Sub-Measure
Performance Funding Plan: Allocation Overview
X equals
X equals
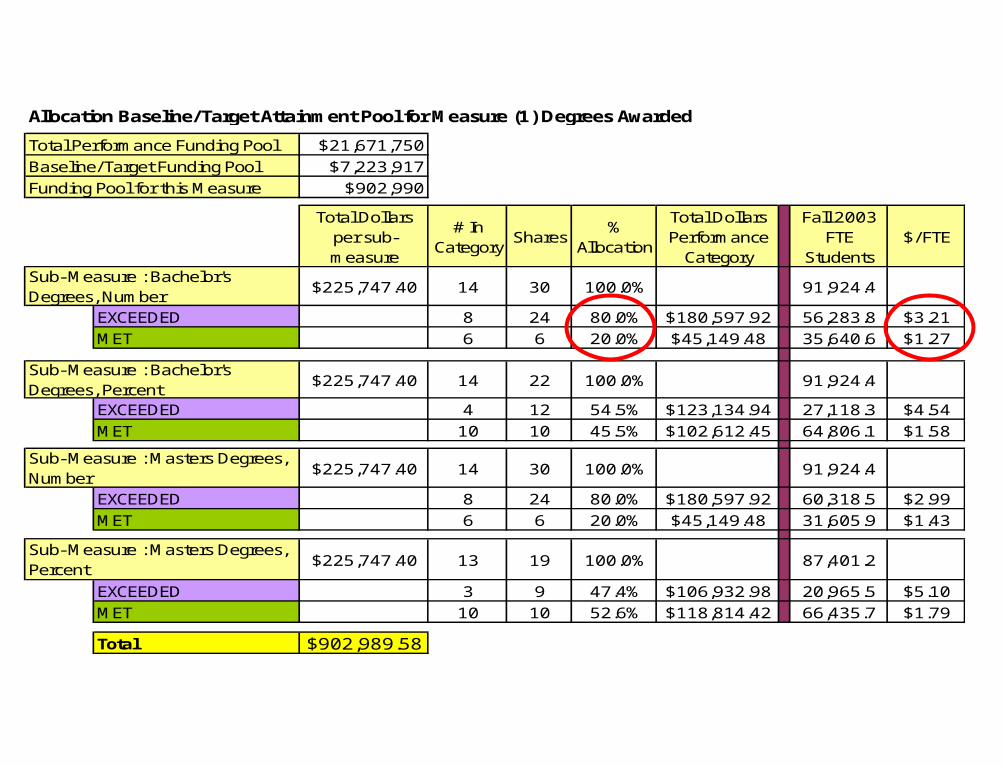
Allocation Baseline/Target Attainment Pool for Measure (1) Degrees Awarded
Total Performance Funding Pool $21,671,750Baseline/Target Funding Pool $7,223,917Funding Pool for this Measure $902,990
Total Dollars per sub-measure
# In Category
Shares%
Allocation
Total Dollars Performance
Category
Fall 2003 FTE
Students$/FTE
$225,747.40 14 30 100.0% 91,924.4
EXCEEDED 8 24 80.0% $180,597.92 56,283.8 $3.21MET 6 6 20.0% $45,149.48 35,640.6 $1.27
$225,747.40 14 22 100.0% 91,924.4
EXCEEDED 4 12 54.5% $123,134.94 27,118.3 $4.54MET 10 10 45.5% $102,612.45 64,806.1 $1.58
$225,747.40 14 30 100.0% 91,924.4
EXCEEDED 8 24 80.0% $180,597.92 60,318.5 $2.99MET 6 6 20.0% $45,149.48 31,605.9 $1.43
$225,747.40 13 19 100.0% 87,401.2
EXCEEDED 3 9 47.4% $106,932.98 20,965.5 $5.10MET 10 10 52.6% $118,814.42 66,435.7 $1.79
Total $902,989.58
Sub- Measure : Bachelor's Degrees, Percent
Sub- Measure : Masters Degrees, Number
Sub- Measure : Masters Degrees, Percent
Sub- Measure : Bachelor's Degrees, Number
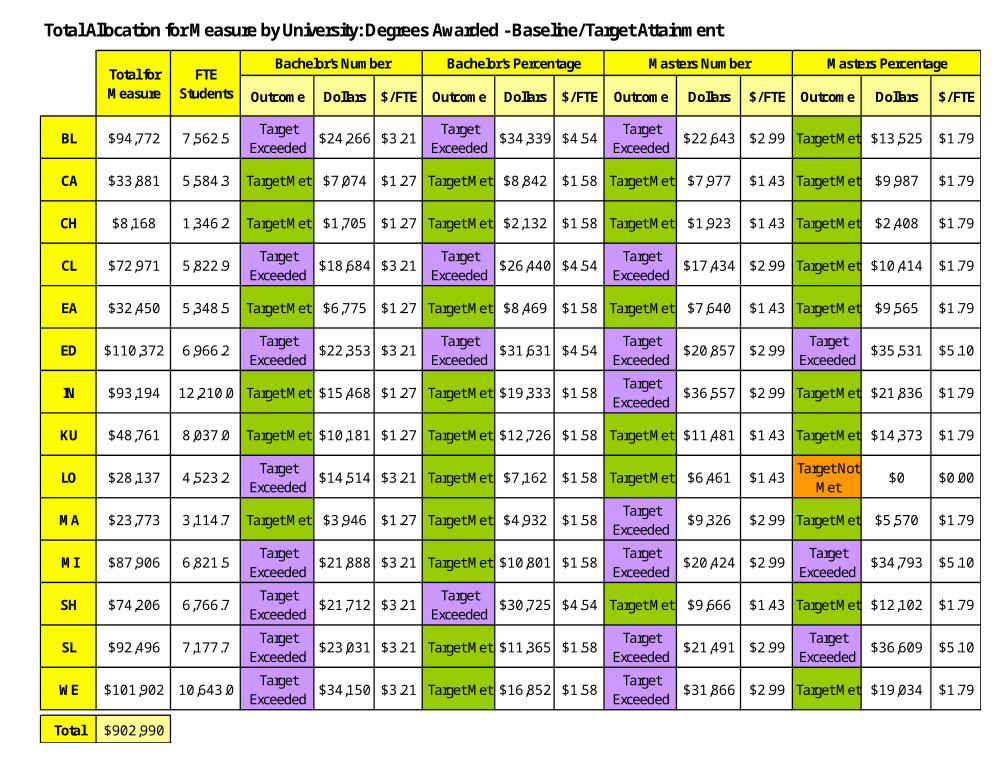
Total Allocation for Measure by University: Degrees Awarded - Baseline/Target Attainment
Outcome Dollars $/FTE Outcome Dollars $/FTE Outcome Dollars $/FTE Outcome Dollars $/FTE
BL $94,772 7,562.5Target
Exceeded$24,266 $3.21
Target Exceeded
$34,339 $4.54Target
Exceeded$22,643 $2.99 Target Met $13,525 $1.79
CA $33,881 5,584.3 Target Met $7,074 $1.27 Target Met $8,842 $1.58 Target Met $7,977 $1.43 Target Met $9,987 $1.79
CH $8,168 1,346.2 Target Met $1,705 $1.27 Target Met $2,132 $1.58 Target Met $1,923 $1.43 Target Met $2,408 $1.79
CL $72,971 5,822.9Target
Exceeded$18,684 $3.21
Target Exceeded
$26,440 $4.54Target
Exceeded$17,434 $2.99 Target Met $10,414 $1.79
EA $32,450 5,348.5 Target Met $6,775 $1.27 Target Met $8,469 $1.58 Target Met $7,640 $1.43 Target Met $9,565 $1.79
ED $110,372 6,966.2Target
Exceeded$22,353 $3.21
Target Exceeded
$31,631 $4.54Target
Exceeded$20,857 $2.99
Target Exceeded
$35,531 $5.10
IN $93,194 12,210.0 Target Met $15,468 $1.27 Target Met $19,333 $1.58Target
Exceeded$36,557 $2.99 Target Met $21,836 $1.79
KU $48,761 8,037.0 Target Met $10,181 $1.27 Target Met $12,726 $1.58 Target Met $11,481 $1.43 Target Met $14,373 $1.79
LO $28,137 4,523.2Target
Exceeded$14,514 $3.21 Target Met $7,162 $1.58 Target Met $6,461 $1.43
Target Not Met
$0 $0.00
MA $23,773 3,114.7 Target Met $3,946 $1.27 Target Met $4,932 $1.58Target
Exceeded$9,326 $2.99 Target Met $5,570 $1.79
MI $87,906 6,821.5Target
Exceeded$21,888 $3.21 Target Met $10,801 $1.58
Target Exceeded
$20,424 $2.99Target
Exceeded$34,793 $5.10
SH $74,206 6,766.7Target
Exceeded$21,712 $3.21
Target Exceeded
$30,725 $4.54 Target Met $9,666 $1.43 Target Met $12,102 $1.79
SL $92,496 7,177.7Target
Exceeded$23,031 $3.21 Target Met $11,365 $1.58
Target Exceeded
$21,491 $2.99Target
Exceeded$36,609 $5.10
WE $101,902 10,643.0Target
Exceeded$34,150 $3.21 Target Met $16,852 $1.58
Target Exceeded
$31,866 $2.99 Target Met $19,034 $1.79
Total $902,990
Masters PercentageFTE
StudentsTotal for Measure
Bachelor's Number Bachelor's Percentage Masters Number
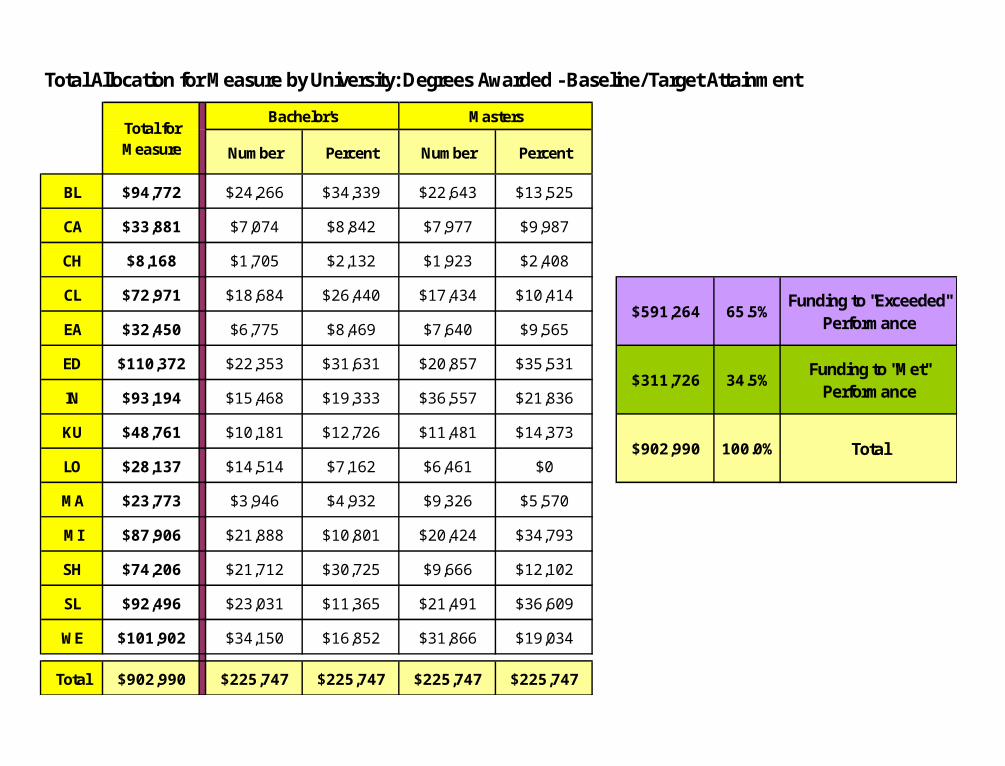
Total Allocation for Measure by University: Degrees Awarded - Baseline/Target Attainment
Number Percent Number Percent
BL $94,772 $24,266 $34,339 $22,643 $13,525
CA $33,881 $7,074 $8,842 $7,977 $9,987
CH $8,168 $1,705 $2,132 $1,923 $2,408
CL $72,971 $18,684 $26,440 $17,434 $10,414
EA $32,450 $6,775 $8,469 $7,640 $9,565
ED $110,372 $22,353 $31,631 $20,857 $35,531
IN $93,194 $15,468 $19,333 $36,557 $21,836
KU $48,761 $10,181 $12,726 $11,481 $14,373
LO $28,137 $14,514 $7,162 $6,461 $0
MA $23,773 $3,946 $4,932 $9,326 $5,570
MI $87,906 $21,888 $10,801 $20,424 $34,793
SH $74,206 $21,712 $30,725 $9,666 $12,102
SL $92,496 $23,031 $11,365 $21,491 $36,609
WE $101,902 $34,150 $16,852 $31,866 $19,034
Total $902,990 $225,747 $225,747 $225,747 $225,747
$902,990 Total
65.5%
34.5%
100.0%
$591,264Funding to "Exceeded"
Performance
$311,726Funding to "Met"
Performance
Total for Measure
Bachelor's Masters
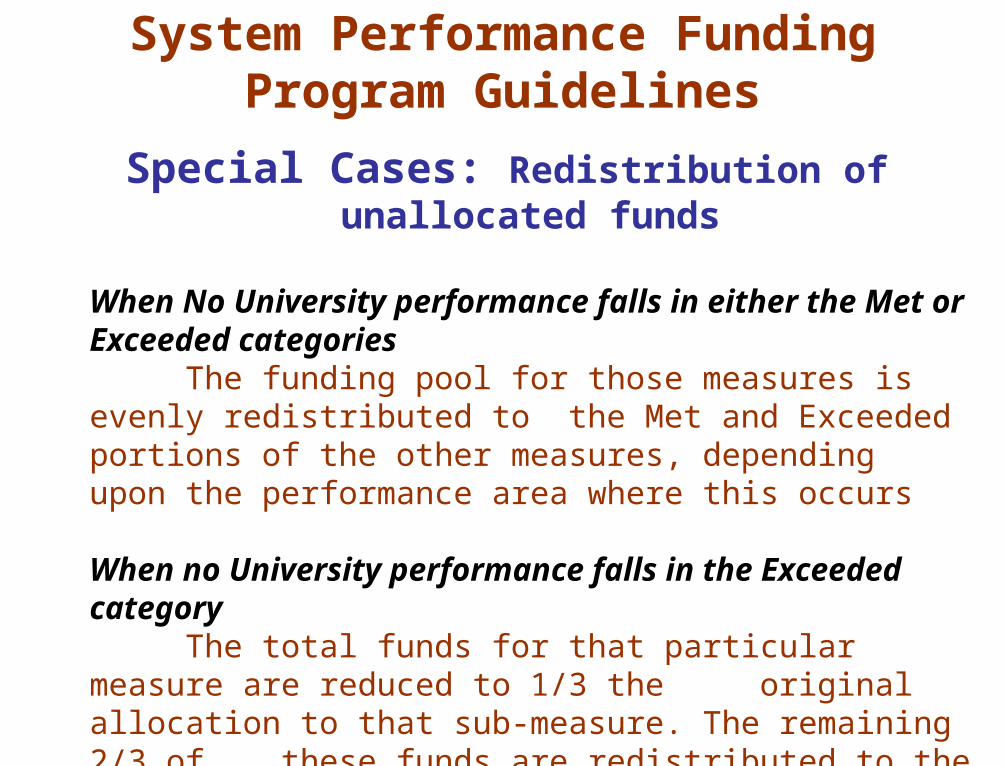
System Performance Funding Program Guidelines
Special Cases: Redistribution of unallocated funds
When No University performance falls in either the Met or Exceeded categories
The funding pool for those measures is evenly redistributed to the Met and Exceeded portions of the other measures, depending upon the performance area where this occurs
When no University performance falls in the Exceeded categoryThe total funds for that particular measure are reduced to 1/3
the original allocation to that sub-measure. The remaining 2/3 of these funds are redistributed to the Exceeded portions of the other measures, depending upon the performance area where
this occurs
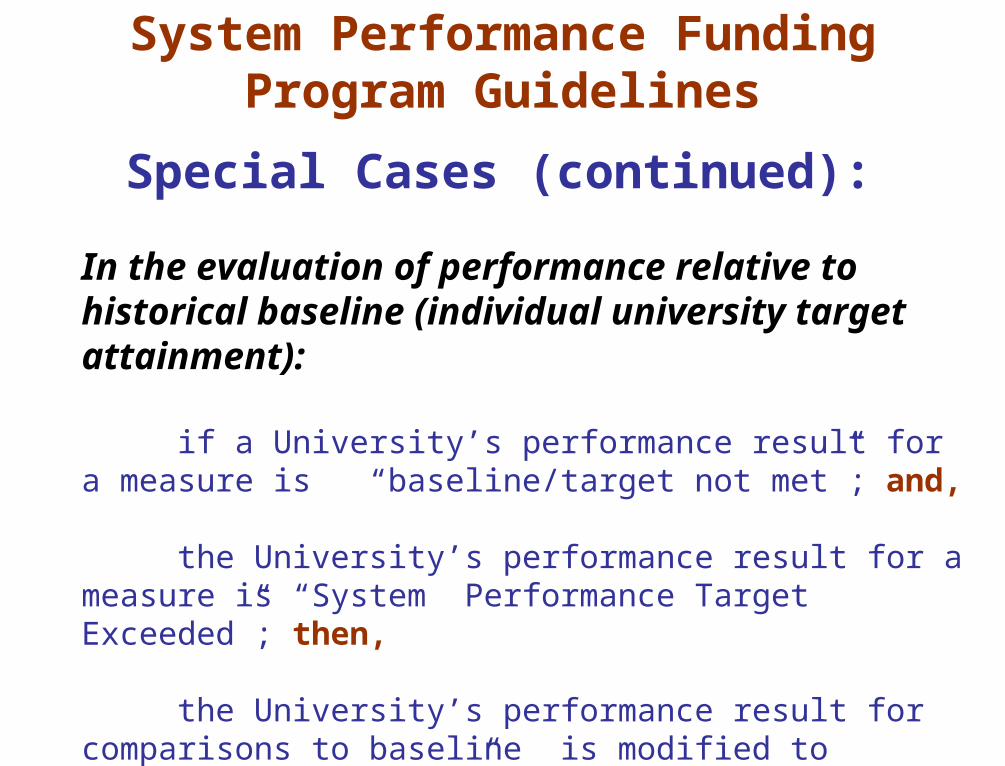
System Performance Funding Program Guidelines
Special Cases (continued):
In the evaluation of performance relative to historical baseline (individual university target attainment):
if a University’s performance result for a measure is “baseline/target not met”; and,
the University’s performance result for a measure is “System Performance Target Exceeded”; then,
the University’s performance result for comparisons to baseline is modified to “baseline/target met” for the purposes of performance funding.
Allocation of Undistributed
Performance Funds
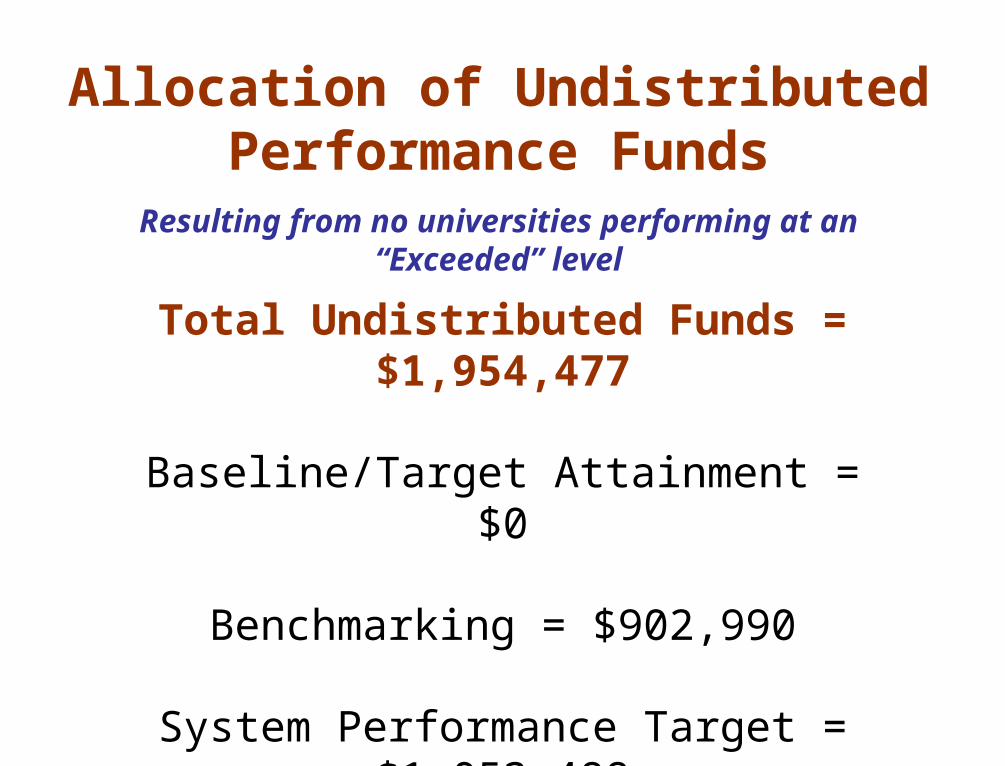
Allocation of Undistributed Performance Funds
Resulting from no universities performing at an “Exceeded” level
Total Undistributed Funds = $1,954,477
Baseline/Target Attainment = $0
Benchmarking = $902,990
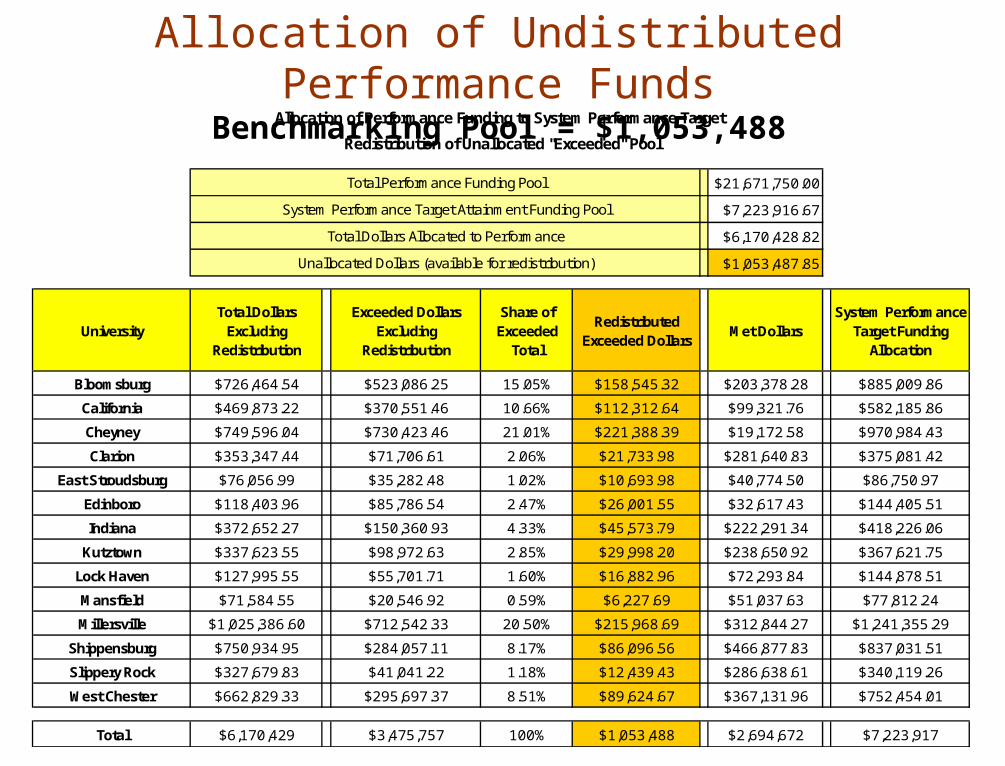
System Performance Target = $1,053,488
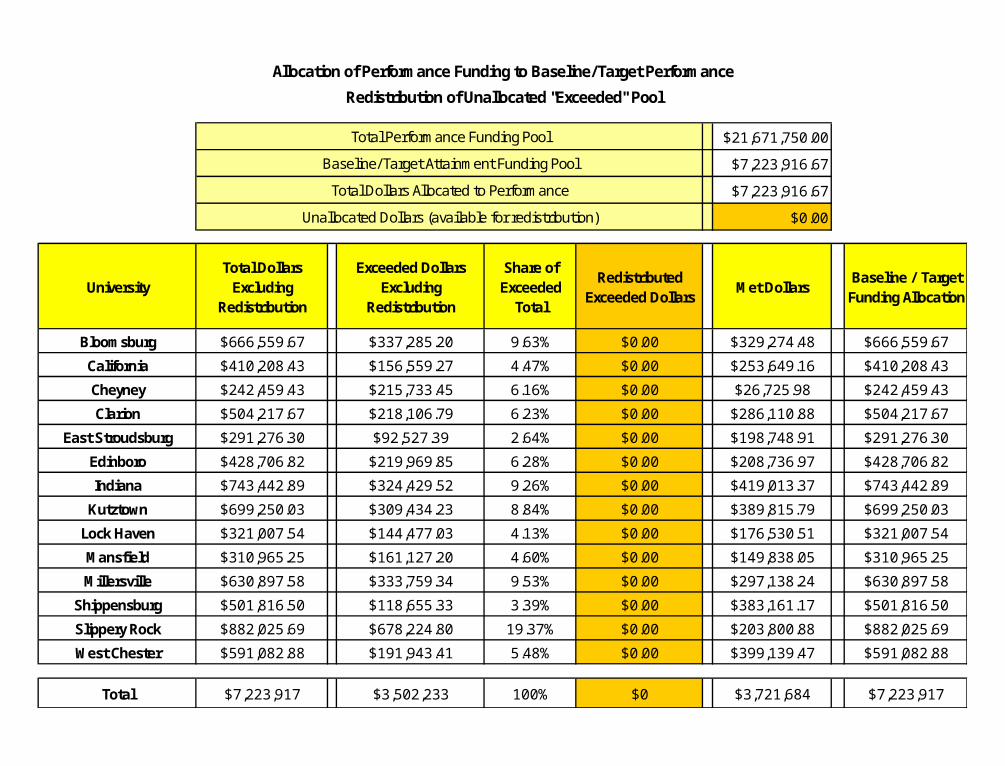
$21,671,750.00
$7,223,916.67
$7,223,916.67
$0.00
UniversityTotal Dollars Excluding
Redistribution
Exceeded Dollars Excluding
Redistribution
Share of Exceeded
Total
Redistributed Exceeded Dollars
Met DollarsBaseline / Target Funding Allocation
Bloomsburg $666,559.67 $337,285.20 9.63% $0.00 $329,274.48 $666,559.67
California $410,208.43 $156,559.27 4.47% $0.00 $253,649.16 $410,208.43
Cheyney $242,459.43 $215,733.45 6.16% $0.00 $26,725.98 $242,459.43
Clarion $504,217.67 $218,106.79 6.23% $0.00 $286,110.88 $504,217.67
East Stroudsburg $291,276.30 $92,527.39 2.64% $0.00 $198,748.91 $291,276.30
Edinboro $428,706.82 $219,969.85 6.28% $0.00 $208,736.97 $428,706.82
Indiana $743,442.89 $324,429.52 9.26% $0.00 $419,013.37 $743,442.89
Kutztown $699,250.03 $309,434.23 8.84% $0.00 $389,815.79 $699,250.03
Lock Haven $321,007.54 $144,477.03 4.13% $0.00 $176,530.51 $321,007.54
Mansfield $310,965.25 $161,127.20 4.60% $0.00 $149,838.05 $310,965.25
Millersville $630,897.58 $333,759.34 9.53% $0.00 $297,138.24 $630,897.58
Shippensburg $501,816.50 $118,655.33 3.39% $0.00 $383,161.17 $501,816.50
Slippery Rock $882,025.69 $678,224.80 19.37% $0.00 $203,800.88 $882,025.69
West Chester $591,082.88 $191,943.41 5.48% $0.00 $399,139.47 $591,082.88
Total $7,223,917 $3,502,233 100% $0 $3,721,684 $7,223,917
Total Dollars Allocated to Performance
Unallocated Dollars (available for redistribution)
Allocation of Performance Funding to Baseline/Target Performance
Redistribution of Unallocated "Exceeded" Pool
Total Performance Funding Pool
Baseline/Target Attainment Funding Pool
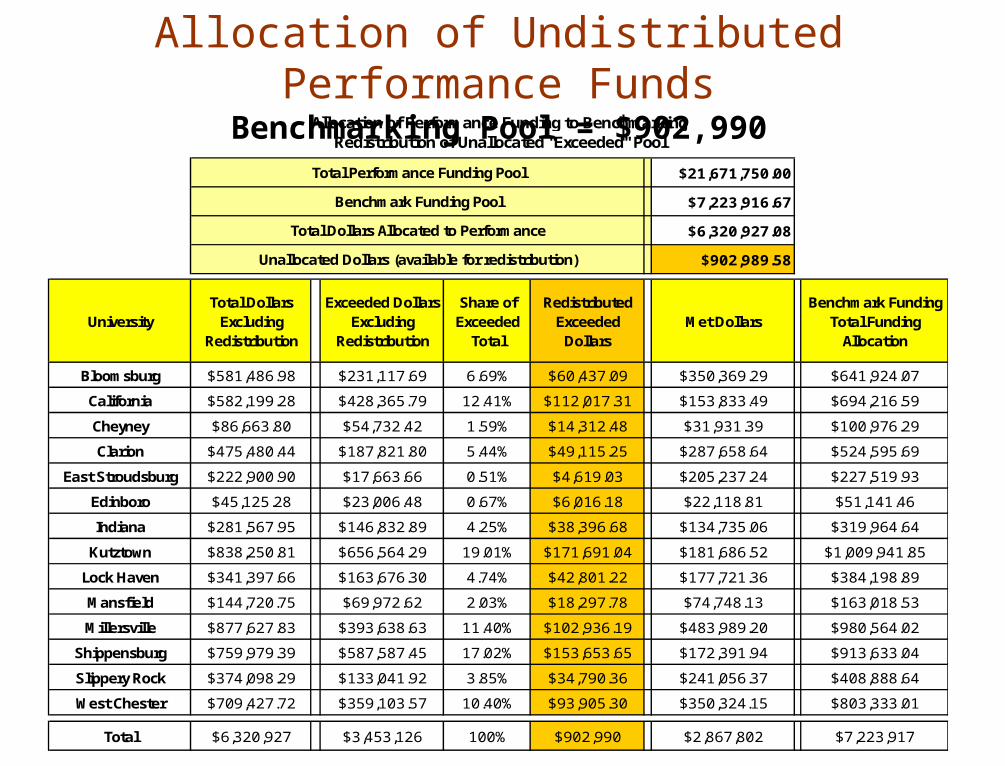
$21,671,750.00
$7,223,916.67
$6,320,927.08
$902,989.58
UniversityTotal Dollars Excluding
Redistribution
Exceeded Dollars Excluding
Redistribution
Share of Exceeded
Total
Redistributed Exceeded Dollars
Met DollarsBenchmark Funding
Total Funding Allocation
Bloomsburg $581,486.98 $231,117.69 6.69% $60,437.09 $350,369.29 $641,924.07
California $582,199.28 $428,365.79 12.41% $112,017.31 $153,833.49 $694,216.59
Cheyney $86,663.80 $54,732.42 1.59% $14,312.48 $31,931.39 $100,976.29
Clarion $475,480.44 $187,821.80 5.44% $49,115.25 $287,658.64 $524,595.69
East Stroudsburg $222,900.90 $17,663.66 0.51% $4,619.03 $205,237.24 $227,519.93
Edinboro $45,125.28 $23,006.48 0.67% $6,016.18 $22,118.81 $51,141.46
Indiana $281,567.95 $146,832.89 4.25% $38,396.68 $134,735.06 $319,964.64
Kutztown $838,250.81 $656,564.29 19.01% $171,691.04 $181,686.52 $1,009,941.85
Lock Haven $341,397.66 $163,676.30 4.74% $42,801.22 $177,721.36 $384,198.89
Mansfield $144,720.75 $69,972.62 2.03% $18,297.78 $74,748.13 $163,018.53
Millersville $877,627.83 $393,638.63 11.40% $102,936.19 $483,989.20 $980,564.02
Shippensburg $759,979.39 $587,587.45 17.02% $153,653.65 $172,391.94 $913,633.04
Slippery Rock $374,098.29 $133,041.92 3.85% $34,790.36 $241,056.37 $408,888.64
West Chester $709,427.72 $359,103.57 10.40% $93,905.30 $350,324.15 $803,333.01
Total $6,320,927 $3,453,126 100% $902,990 $2,867,802 $7,223,917
Total Dollars Allocated to Performance
Unallocated Dollars (available for redistribution)
Allocation of Performance Funding to BenchmarkingRedistribution of Unallocated "Exceeded" Pool
Total Performance Funding Pool
Benchmark Funding Pool
Allocation of Undistributed Performance FundsBenchmarking Pool = $902,990
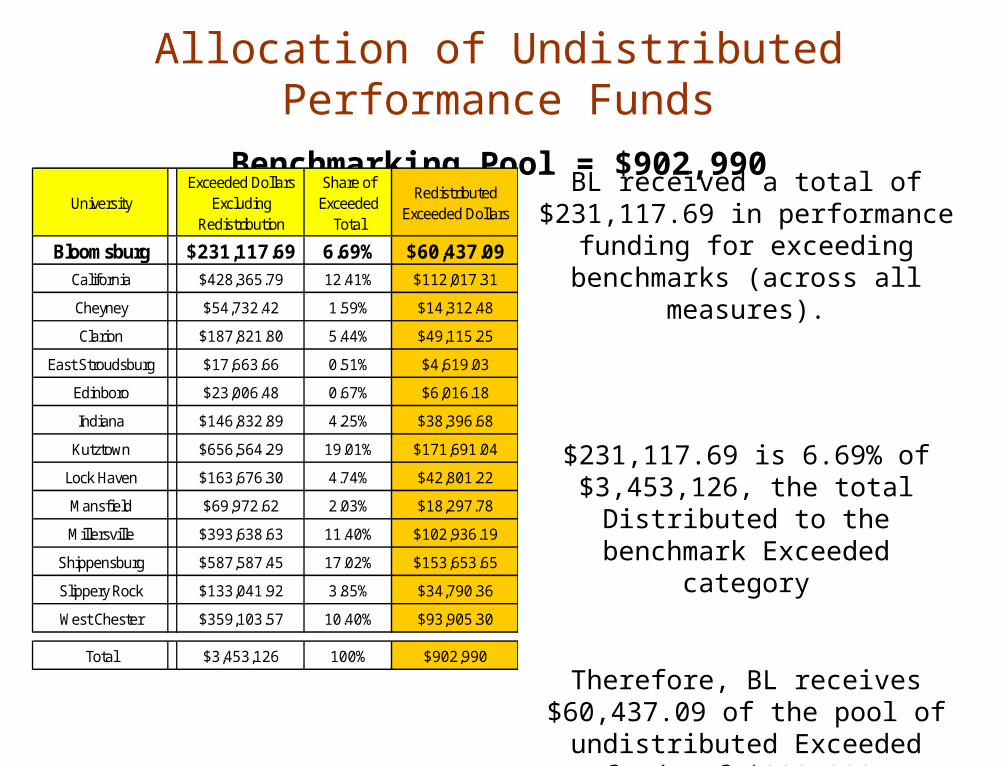
Allocation of Undistributed Performance Funds
Benchmarking Pool = $902,990
BL received a total of $231,117.69 in performance funding for exceeding benchmarks (across all measures).
$231,117.69 is 6.69% of $3,453,126, the total Distributed to the benchmark
Exceeded category
Therefore, BL receives $60,437.09 of the pool of undistributed Exceeded
funds of $902,990.
$902,990 * .0669 = $60,437.09
UniversityExceeded Dollars
Excluding Redistribution
Share of Exceeded
Total
Redistributed Exceeded Dollars
Bloomsburg $231,117.69 6.69% $60,437.09California $428,365.79 12.41% $112,017.31
Cheyney $54,732.42 1.59% $14,312.48
Clarion $187,821.80 5.44% $49,115.25
East Stroudsburg $17,663.66 0.51% $4,619.03
Edinboro $23,006.48 0.67% $6,016.18
Indiana $146,832.89 4.25% $38,396.68
Kutztown $656,564.29 19.01% $171,691.04
Lock Haven $163,676.30 4.74% $42,801.22
Mansfield $69,972.62 2.03% $18,297.78
Millersville $393,638.63 11.40% $102,936.19
Shippensburg $587,587.45 17.02% $153,653.65
Slippery Rock $133,041.92 3.85% $34,790.36
West Chester $359,103.57 10.40% $93,905.30
Total $3,453,126 100% $902,990
$21,671,750.00
$7,223,916.67
$6,170,428.82
$1,053,487.85
UniversityTotal Dollars Excluding
Redistribution
Exceeded Dollars Excluding
Redistribution
Share of Exceeded
Total
Redistributed Exceeded Dollars
Met DollarsSystem Performance
Target Funding Allocation
Bloomsburg $726,464.54 $523,086.25 15.05% $158,545.32 $203,378.28 $885,009.86
California $469,873.22 $370,551.46 10.66% $112,312.64 $99,321.76 $582,185.86
Cheyney $749,596.04 $730,423.46 21.01% $221,388.39 $19,172.58 $970,984.43
Clarion $353,347.44 $71,706.61 2.06% $21,733.98 $281,640.83 $375,081.42
East Stroudsburg $76,056.99 $35,282.48 1.02% $10,693.98 $40,774.50 $86,750.97
Edinboro $118,403.96 $85,786.54 2.47% $26,001.55 $32,617.43 $144,405.51
Indiana $372,652.27 $150,360.93 4.33% $45,573.79 $222,291.34 $418,226.06
Kutztown $337,623.55 $98,972.63 2.85% $29,998.20 $238,650.92 $367,621.75
Lock Haven $127,995.55 $55,701.71 1.60% $16,882.96 $72,293.84 $144,878.51
Mansfield $71,584.55 $20,546.92 0.59% $6,227.69 $51,037.63 $77,812.24
Millersville $1,025,386.60 $712,542.33 20.50% $215,968.69 $312,844.27 $1,241,355.29
Shippensburg $750,934.95 $284,057.11 8.17% $86,096.56 $466,877.83 $837,031.51
Slippery Rock $327,679.83 $41,041.22 1.18% $12,439.43 $286,638.61 $340,119.26
West Chester $662,829.33 $295,697.37 8.51% $89,624.67 $367,131.96 $752,454.01
Total $6,170,429 $3,475,757 100% $1,053,488 $2,694,672 $7,223,917
Total Dollars Allocated to Performance
Unallocated Dollars (available for redistribution)
Allocation of Performance Funding to System Performance Target
Redistribution of Unallocated "Exceeded" Pool
Total Performance Funding Pool
System Performance Target Attainment Funding Pool
Allocation of Undistributed Performance FundsBenchmarking Pool = $1,053,488
Performance Funding Allocations
Totals by University
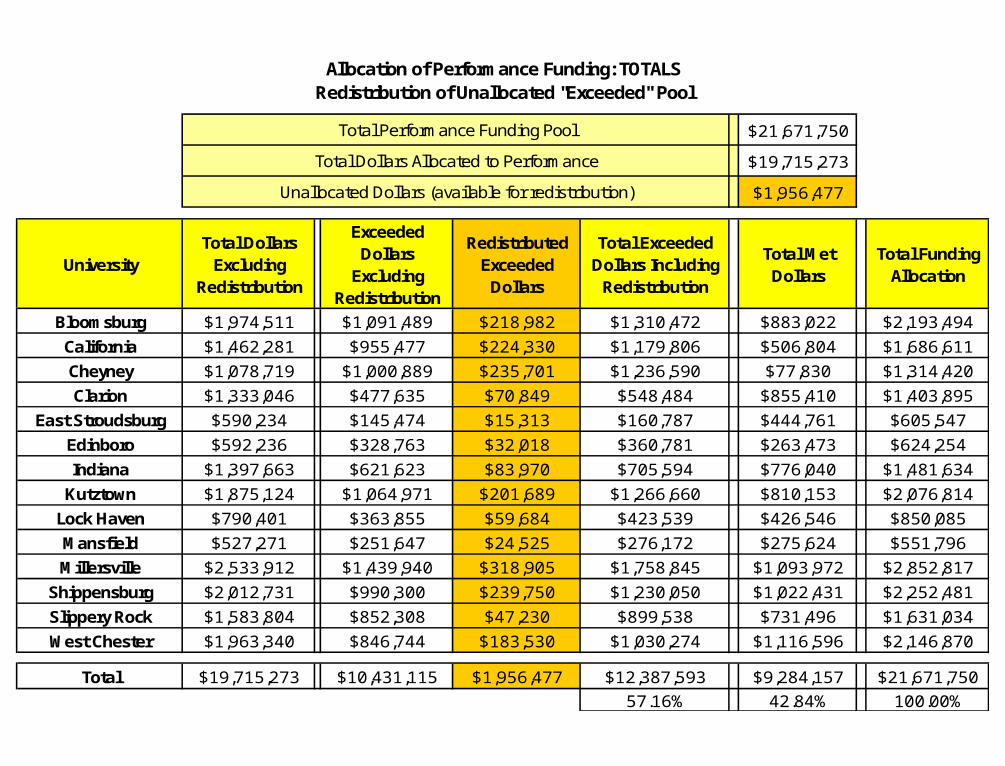
$21,671,750
$19,715,273
$1,956,477
UniversityTotal Dollars Excluding
Redistribution
Exceeded Dollars
Excluding Redistribution
Redistributed Exceeded Dollars
Total Exceeded Dollars Including Redistribution
Total Met Dollars
Total Funding Allocation
Bloomsburg $1,974,511 $1,091,489 $218,982 $1,310,472 $883,022 $2,193,494
California $1,462,281 $955,477 $224,330 $1,179,806 $506,804 $1,686,611
Cheyney $1,078,719 $1,000,889 $235,701 $1,236,590 $77,830 $1,314,420
Clarion $1,333,046 $477,635 $70,849 $548,484 $855,410 $1,403,895
East Stroudsburg $590,234 $145,474 $15,313 $160,787 $444,761 $605,547
Edinboro $592,236 $328,763 $32,018 $360,781 $263,473 $624,254
Indiana $1,397,663 $621,623 $83,970 $705,594 $776,040 $1,481,634
Kutztown $1,875,124 $1,064,971 $201,689 $1,266,660 $810,153 $2,076,814
Lock Haven $790,401 $363,855 $59,684 $423,539 $426,546 $850,085
Mansfield $527,271 $251,647 $24,525 $276,172 $275,624 $551,796
Millersville $2,533,912 $1,439,940 $318,905 $1,758,845 $1,093,972 $2,852,817
Shippensburg $2,012,731 $990,300 $239,750 $1,230,050 $1,022,431 $2,252,481
Slippery Rock $1,583,804 $852,308 $47,230 $899,538 $731,496 $1,631,034
West Chester $1,963,340 $846,744 $183,530 $1,030,274 $1,116,596 $2,146,870
Total $19,715,273 $10,431,115 $1,956,477 $12,387,593 $9,284,157 $21,671,750
57.16% 42.84% 100.00%
Total Dollars Allocated to Performance
Unallocated Dollars (available for redistribution)
Allocation of Performance Funding: TOTALSRedistribution of Unallocated "Exceeded" Pool
Total Performance Funding Pool
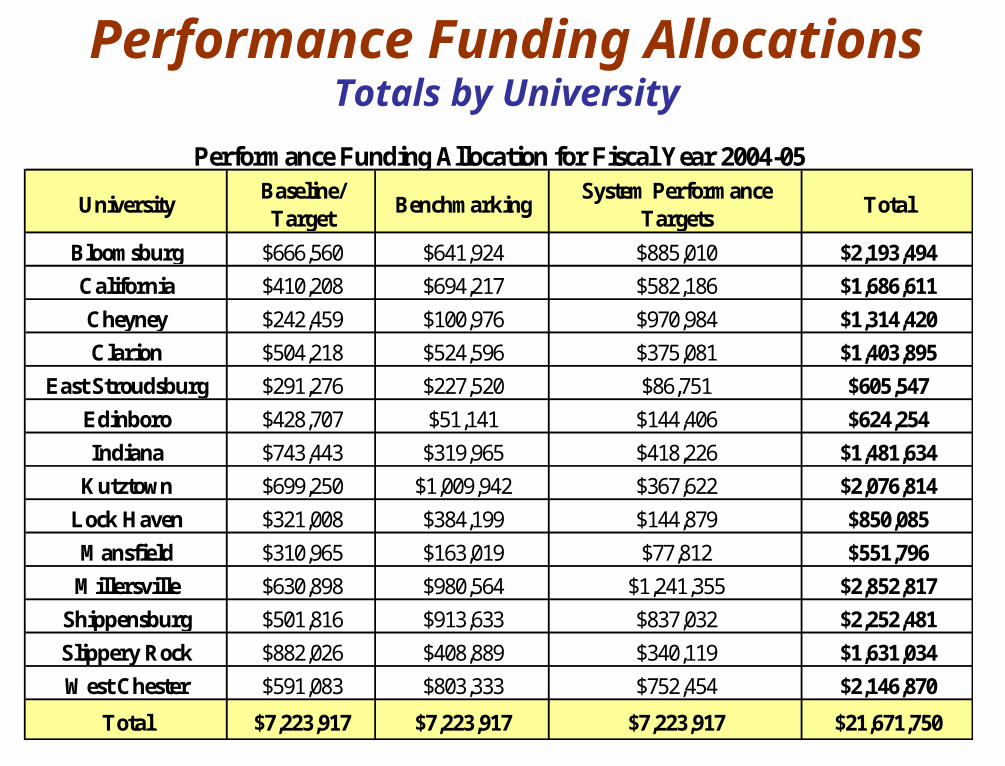
UniversityBaseline/ Target
BenchmarkingSystem Performance
TargetsTotal
Bloomsburg $666,560 $641,924 $885,010 $2,193,494
California $410,208 $694,217 $582,186 $1,686,611
Cheyney $242,459 $100,976 $970,984 $1,314,420
Clarion $504,218 $524,596 $375,081 $1,403,895
East Stroudsburg $291,276 $227,520 $86,751 $605,547
Edinboro $428,707 $51,141 $144,406 $624,254
Indiana $743,443 $319,965 $418,226 $1,481,634
Kutztown $699,250 $1,009,942 $367,622 $2,076,814
Lock Haven $321,008 $384,199 $144,879 $850,085
Mansfield $310,965 $163,019 $77,812 $551,796
Millersville $630,898 $980,564 $1,241,355 $2,852,817
Shippensburg $501,816 $913,633 $837,032 $2,252,481
Slippery Rock $882,026 $408,889 $340,119 $1,631,034
West Chester $591,083 $803,333 $752,454 $2,146,870
Total $7,223,917 $7,223,917 $7,223,917 $21,671,750
Performance Funding Allocation for Fiscal Year 2004-05
Performance Funding AllocationsTotals by University

System Performance Targets and Performance Evaluations
Questions and Answers

Closing Comments
University PresidentsChancellor