Embed Size (px)
Citation preview
The Deep S Wave in Leads V1, V2, and V3 in
Right Ventricular HypertrophyBy HERBERT SHUBIN, M.D., AND DAVID C. LEVIN SON, M.D.
Six patients with mitral stenosis, 3 with pulmonic stenosis, and 1 with pulmonaryhypertension are presented. All had isolated right ventricular hypertrophy and allhad deep S waves in V,, V2, or V3. In 3 cases the voltage of R in V1 was less than 0.5millivolt. In 3 cases R/S ratios in V1 of less than 1.0 were present. Veetorcardiogramnsshowed characteristic features and illustrated the reasons for the electrocardiographicfindings.
T HE presence of a deep S wave in leadsV1 or V2 is often interpreted as evidence
suggesting left ventricular hypertrophy.Since the maximal electric force in left ven-tricular hypertrophy usually moves to theleft and posteriorly, the presence of a deepS wave in leads V1 or V2 often correlateswell with this condition.
In the interpretation of hypertrophies ofcongenital or acquired heart disease, thepresence of a deep S wave in V1 or V2 may,however, not be due to left ventricular hyper-trophy, either isolated, or in combinationwith right ventricular hypertrophy.
Ten cases of isolated right ventricularhypertrophy in which deep S waves were pres-ent in either V1, V2, or V3 have been reviewed.There were 6 patients with pure mitral ste-nosis, 3 with isolated pulmonic stenosis, and 1with " primary " pulmonary hypertension.The mitral stenosis cases were diagnosed bycardiac catheterization (table 1), and wereconfirmed at surgery in 4 instances. Subse-quently one of these was also confirmed atautopsy and had right ventricular hyper-trophy, but no left ventricular hypertrophy.Of the 3 cases with isolated pulmonic stenosis2 were diagnosed at cardiac catheterization(table 1), and confirmed later at surgery. Thethird case of pulmonic stenosis was a rela-tively mild one and was diagnosed by cardiaccatheterization alone (table 1). The single
From the Cardio-Respiratory Laboratory, Cedars ofLebanon Hospital, Los Angeles, Calif.
This work was supported by the United Hostesses,Los Angeles, Calif.
TABLE 1. Hemodynamic Findings at CardiacCatheterization
cQ~ccw
1234567
be
33524436544945
8 11
9 8
10 110
Diagnosis
Mitral stenosisMitral stenosisMitral stenosisMitral stenosisMitral stenosisMitral stenosis"Primary" pulmonary
hypertensionPulmonic stenosis-
infundibularPulmonic stenosis-
valvularPulmonic stenosis-
valvular
Pressures (mm. Hg)
Main Peri-pul- pheral
Right mon- pul-ven- ary mon-tricle artery ary
artery
115/10110/10104/1684/1060/647/2125/10
120/6
78/12
40/4
115/55110/50104/5280/4460/2547/32130/50
22/17
17/10
15/5
25/2225/2025/1826/2311/7
Car-diacindex
1.51.71.51.91.92.22.9
3.3
3.7
3.1
case of " primary " pulmonary hypertensionwas diagnosed at cardiac catheterization.
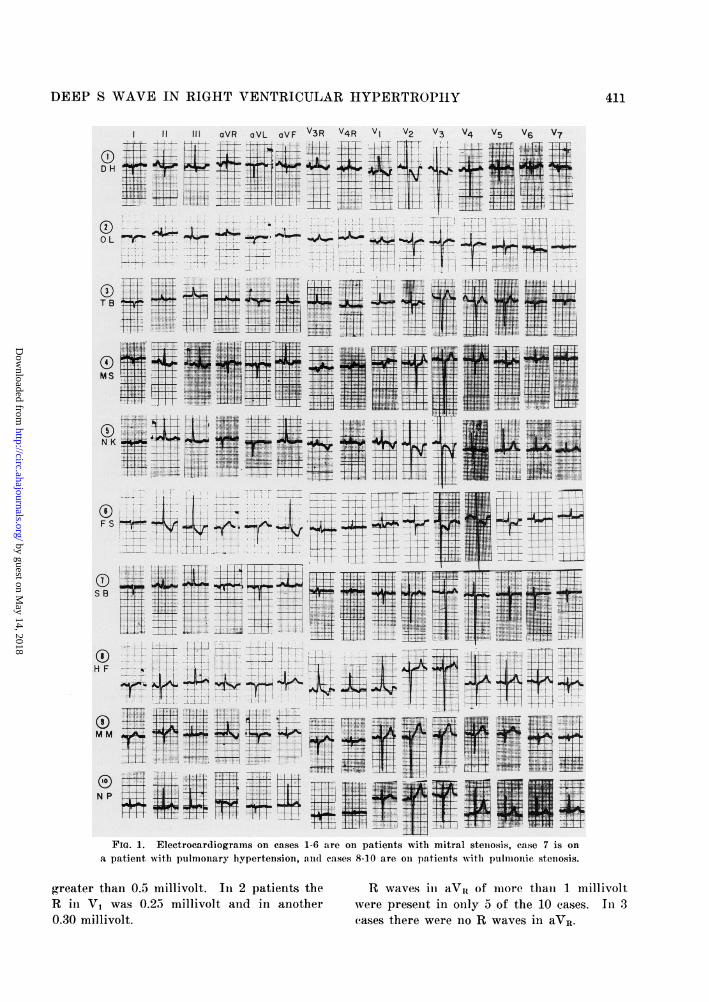
ElectrocardiogramsThe electrocardiograms on these patients
are shown in figure 1. Noteworthy here arethe deep S waves in V1, V2, or V3. Of the6 cases with mitral stenosis the R/S ratio inlV1, V3R, and V4R was greater than 1.0 in allinstances. Of the 3 cases with pulmonic ste-nosis the R/S ratio in V1 was less than 1.0 in2 instances, but reached 1.0 in either V3R orV4R. Similarly in the case with "primary"pulmonary hypertension the R/S ratio, al-thougfh less than 1.0 in V1, was 1.0 in V4R.
In 7 of the 10 cases the R wave in V1 was
Circulation, Volume XVIII, September 1958410
by guest on May 14, 2018
http://circ.ahajournals.org/D
ownloaded from
DEEP S WAVE IN RIGHT VENTRICULAR HYPERTROPHY 411
11Ill oVR oVL oVF V3R V4R V1 V2 V3 V4 V5 V6 V7
gg~~~~~~~~ ITT g ]i 5tllt .i !
...... 4+-4-tvL l::
0~~~~~~~~~~~~~~~~~~~~~~~~~~~~~~~~~~
--r-- -~-+- -1- 1l- i xt 4--w--N -- Ti1 1
U1W1-__;I:lTUretf:*;^,^~oIIllID _l
TB~~~~~~~~~~~~~~~~~~~~~~~~
'I III ItiI~iMS
N K
HF S jf
~~ T 1 + 4 7=-4W+HX7
FSB 4 et + t~f 1 f t'-~~~~~~~~~~~~~~~~~~~~~~~~~~~~~~~~~~~~~~~~~~~~~~. .l.._ .l....t .
FIG 1:||i!i|. Electrocardiograms on cae 1..-6|re o1 paientslwth mitrl stenosis cas 7 1is on I13patIe- withI.,li'la.oilarhype1rtenion,ss al.l( case8.111~.0 re onpatHientwoith- pu- looic st.ens.
greater tan0.5 illivolt. In 2 l1.t ts the B waves in a of oe tha 1 millivollit - t$ .1 .::t:
Ri V1171wa 0.2 millvt al inaothr weeprsn in oly ;of the 10 eae. Iii
00 m 1 mw
FIG. 1. Electrocardiogramns on cases> 1-6 are oll patients witll mitral steiiosis, cas:e 7 is3 on
.a pa~tielt, withl puflull<)lar~Yllyperteii.,;ioii, .111(1 ease; 8-1() are oii pa;tieitts sitli 1)111111.iiie. stesllsois.
,Preater thanil 0).. mlillivolt. Inl 2 patielits the R. waveUs inl aVtC of1'1)( thaull :1 liiilli,,,oltR inl V, wa1s 0.25) millivolt, and~in aniother were presenit inl only 5 of the 10 eases. Inl 30.30 millivolt. cases there were nlo R waves inl aVI.
by guest on May 14, 2018
http://circ.ahajournals.org/D
ownloaded from
SHUBIN, LEVINSON
HORIZONTAL FRONTAL SASITTAL
a L a : LAT
ANTIMF IMF
MS ~~~~~~~~~.. ~
14 a~~~~~~~~~~~~~~~~~~~~~~~~1
NK 4
'.... lit
FS
PIBST$u
4.,:'R'- POST ANT
ANT #OF INF
0i lvX0
HF
4C--
so.:.
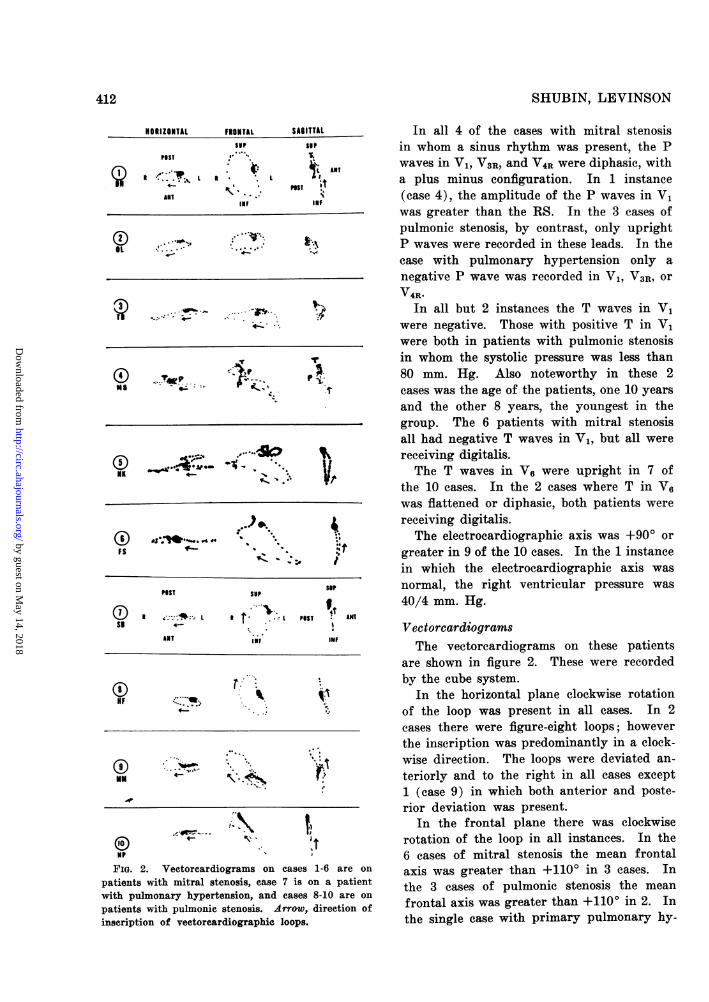
0pFIG. 2. Vectorcardiograms on cases 1-6 are on
patients with mitral stenosis, case 7 is on a patientwith pulmonary hypertension, and cases 8-10 are on
patients with pulmonic stenosis. Arrow, direction ofinscription of vectorcardiographic, loops.
In all 4 of the cases with mitral stenosisin whom a sinus rhythm was present, the Pwaves in V1, V3R, and V4R were diphasic, witha plus minus configuration. In 1 instance(case 4), the amplitude of the P waves in V1was greater than the RS. In the 3 cases ofpulmonic stenosis, by contrast, only uprightP waves were recorded in these leads. In thecase with pulmonary hypertension only anegative P wave was recorded in V1, V3R, orV4R.
In all but 2 instances the T waves in V,were negative. Those with positive T in V1were both in patients with pulmonic stenosisin whom the systolic pressure was less than80 mm. Hg. Also noteworthy in these 2cases was the age of the patients, one 10 yearsand the other 8 years, the youngest in thegroup. The 6 patients with mitral stenosisall had negative T waves in V1, but all werereceiving digitalis.The T waves in VC were upright in 7 of
the 10 cases. In the 2 cases where T in Vswas flattened or diphasic, both patients werereceiving digitalis.The electrocardiographic axis was +90° or
greater in 9 of the 10 cases. In the 1 instancein which the electrocardiographic axis wasnormal, the right ventricular pressure was40/4 mm. Hg.
VectorcardiogramsThe vectorcardiograms on these patients
are shown in figure 2. These were recordedby the cube system.
In the horizontal plane clockwise rotationof the loop was present in all cases. In 2cases there were figure-eight loops; howeverthe inscription was predominantly in a clock-wise direction. The loops were deviated an-teriorly and to the right in all cases except1 (case 9) in which both anterior and poste-rior deviation was present.
In the frontal plane there was clockwiserotation of the loop in all instances. In the6 cases of mitral stenosis the mean frontalaxis was greater than +1100 in 3 cases. Inthe 3 cases of pulmonic stenosis the mean
frontal axis was greater than +1100 in 2. Inthe single case with primary pulmonary hy-
412
by guest on May 14, 2018
http://circ.ahajournals.org/D
ownloaded from
DEEP S WAVE IN RIGHT VENTRICULAR HYPERTROPHY
pertension the mean frontal axis was greaterthan +1100.
In the sagittal plane there was counter-clockwise rotation in 6 cases and figure-eightloops in 4. Three of the mitral cases showedcounterclockwise rotation of the loop, while3 showed a figure-eight loop. In the pulmon-ic stenosis cases the loop rotated counterclock-wise in 2 instances, and had a figure-eightconfiguration in the other. In the case withprimary pulmonary hypertension the rota-tion was counterclockwise. The loop was de-viated anteriorly in all cases except 1 (case9) in which both anterior and posterior devi-ation were present.The P wave is best shown in case 4, where
it has been labeled (fig. 2). Here the looplies posterior, predominantly to the left andinferior to the E point.
DIscussIoNElectrocardiogramsThe deep S wave in lead V1 may be found
in left ventricular hypertrophy, in trans-mural septal myocardial infarction, and inchronic cor pulmonale.The presence of a deep S in V1 is often
found in left ventricular hypertrophy. Tobe diagnostic of left ventricular hypertrophy,however, the S in V1 voltage plus the R inV5 or V6 voltage should exceed 35 mm.' Inthe present report a total combined voltageof this magnitude was not present in any ofthe cases.Transmural septal myocardial infarction
may also be associated with a small R wavein lead V1 and deep S waves in V1 3. Theelectrocardiogram here may closely resemblethat of left ventricular hypertrophy.2The presence of deep S waves in V1 and
across the left precordium in chronic cor pul-monale has been stressed by Sodi-Pallares3and Sokolow and Lyon.4 They note that theR wave may be small in all the precordialleads or may be absent in the right precordialleads. Sodi-Pallares attributes these R- andS-wave changes to the abnormal vertical andlow position of the heart.
Aside from chronic cor pulmonale, thepresence of a deep S wave in lead V1 or V2,
usually is not associated with right ventricu-lar hypertrophy although Lasser and co-work-ers5 and Donoso and associates" noted its pres-ence in the right ventricular hypertrophy ofcongenital heart disease. The criteria forright ventricular hypertrophy of a numberof authors4' 7, 8 include an R/S ratio in V1which is 1.0 or greater. By this criterionalone 30 per cent of the patients in this re-port would not have been diagnosed as havingright ventricular hypertrophy. If an R/Sratio of 1.0 or greater in either V1, V3R, orV4R were regarded as evidence for right ven-tricular hypertrophy, then all 10 cases wouldhave been so diagnosed. However, for rea-sons that are more apparent by vectorcardio-graphic analysis, it is quite possible that theR/S ratio in these leads may be less than 1.0and right ventricular hypertrophy may stillbe present.
VectorcardiogramsThe orientation and direction of inscription
of the vectorcardiographic loops are of con-siderable assistance in determining the pres-ence of hypertrophy, either right, left, orcombined.
Horizontal PlaneClockwise or figure-eight rotation of the
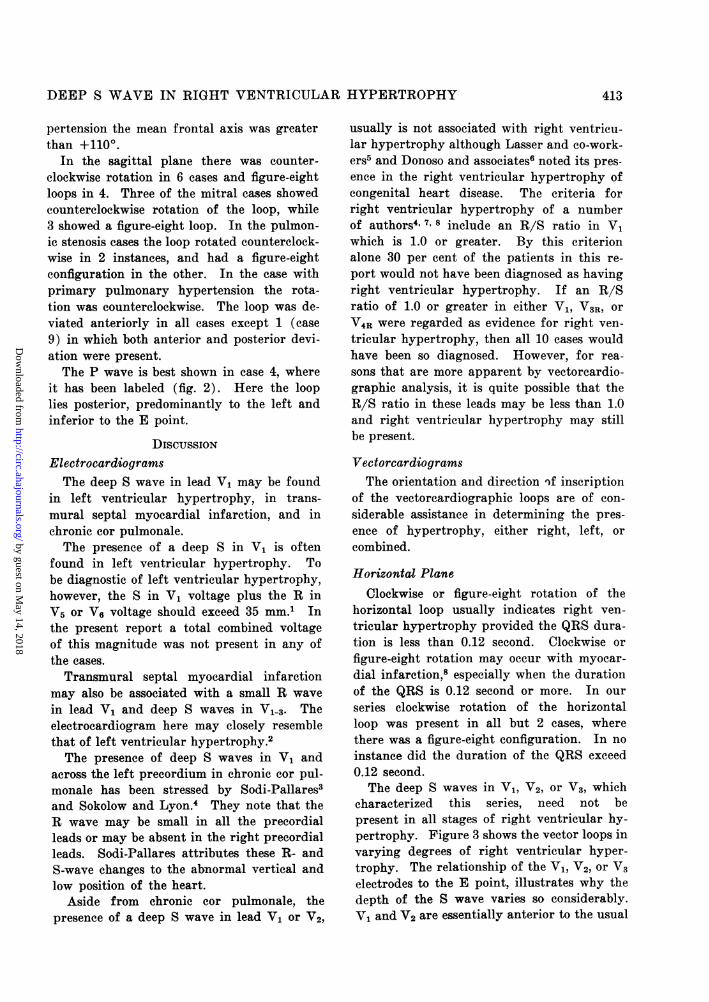
horizontal loop usually indicates right ven-tricular hypertrophy provided the QRS dura-tion is less than 0.12 second. Clockwise orfigure-eight rotation may occur with myocar-dial infarction,8 especially when the durationof the QRS is 0.12 second or more. In ourseries clockwise rotation of the horizontalloop was present in all but 2 cases, wherethere was a figure-eight configuration. In noinstance did the duration of the QRS exceed0.12 second.The deep S waves in V1, V2, or V3, which
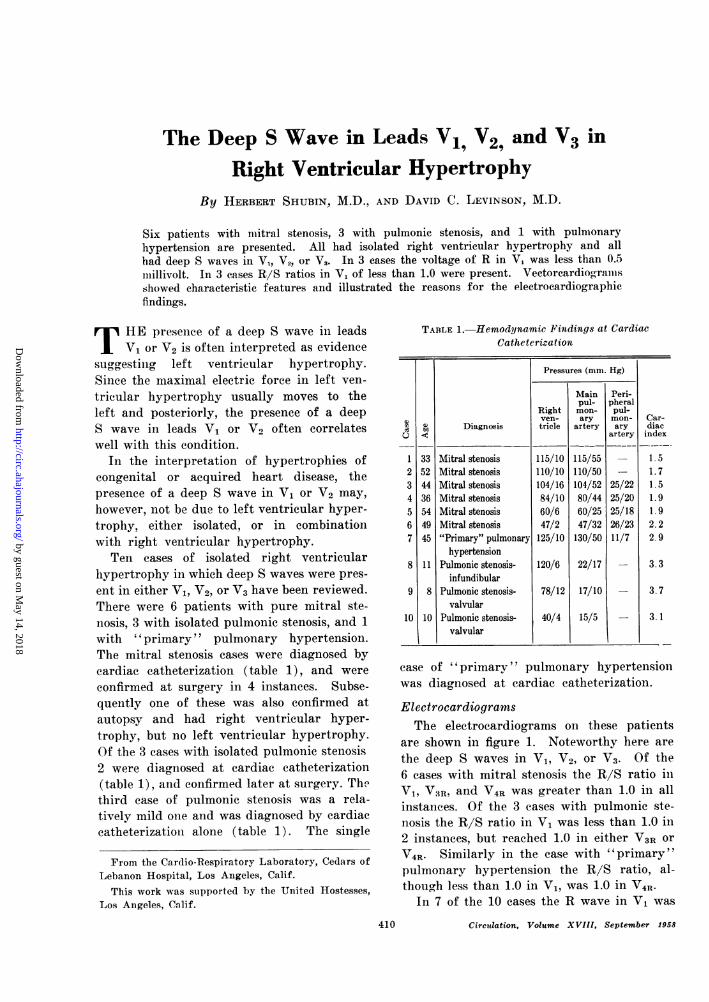
characterized this series, need not bepresent in all stages of right ventricular hy-pertrophy. Figure 3 shows the vector loops invarying degrees of right ventricular hyper-trophy. The relationship of the V1, V2, or V3electrodes to the E point, illustrates why thedepth of the S wave varies so considerably.V1 and V2 are essentially anterior to the usual
413
by guest on May 14, 2018
http://circ.ahajournals.org/D
ownloaded from
SHUBIN, LEVINSON
HORIZONTAL XPOST
A R 17TAT
FRONTAL SAGITTALhe$up
R C I
IMF
SUP
POST CJ ANT ~
INF
FIG. 3. The vectorcardiographic loops A throughE are on cases with progressively more marked rightventricular hypertrophy. Arrow, direction of inscrip-tion of the vectorcardiographic loop.
location of the E point, but lie 10° to eitherside of the midline of the chest. Thus dis-placement of the vector loop anteriorly, as
occurs in early right ventricular hypertrophy,will be associated with increased positive vol-tage in V, and V2. S waves will occur if thevector loop moves posteriorly, as occurs inmore advanced right ventricular hypertrophy.The areas of positivity and negativity may
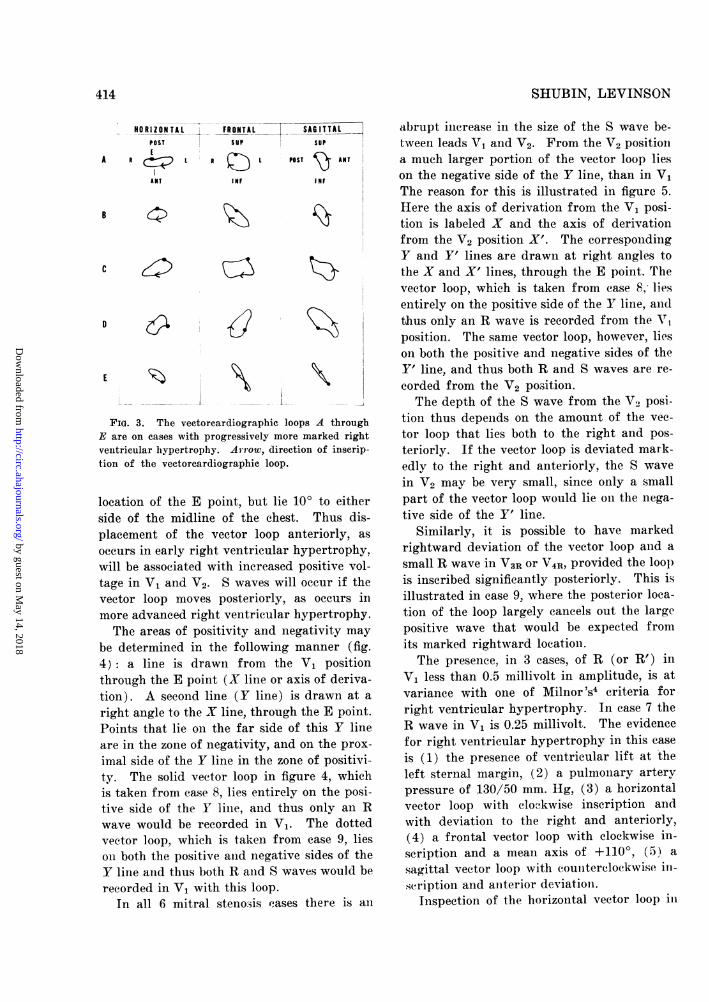
be determined in the following manner (fig.4): a line is drawn from the V1 positionthrough the E point (X line or axis of deriva-tion). A second line (Y line) is drawn at a
right angle to the X line, through the E point.Points that lie on the far side of this Y lineare in the zone of negativity, and on the prox-
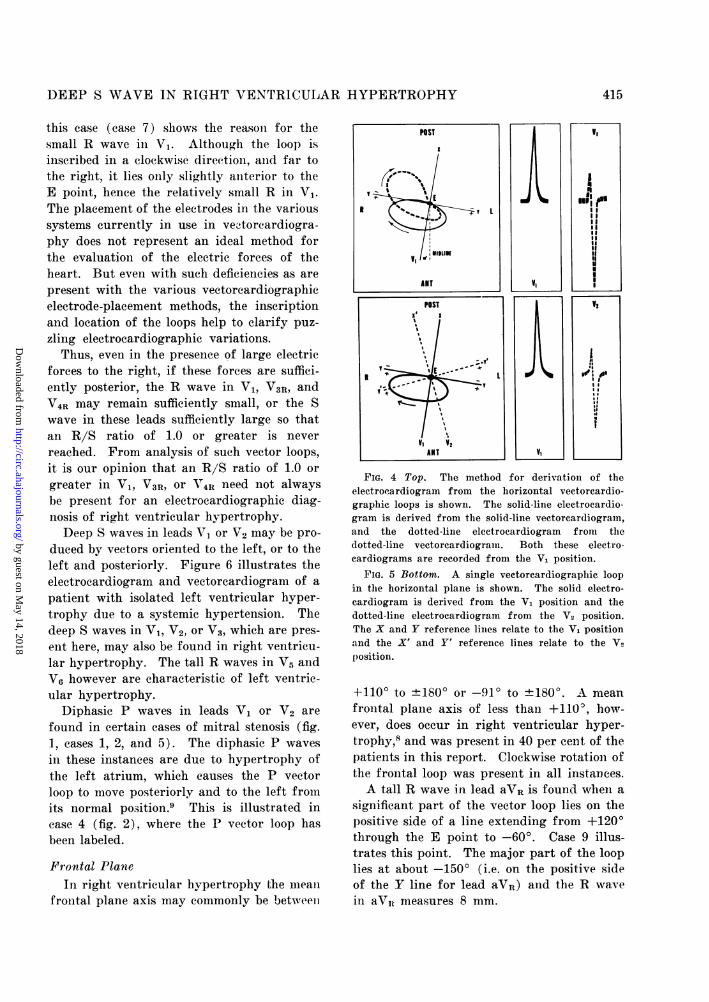
imal side of the Y line in the zone of positivi-ty. The solid vector loop in figure 4, whichis taken from case 8, lies entirely on the posi-tive side of the Y line, and thus only an Rwave would be recorded in V1. The dottedvector loop, which is taken from case 9, lieso01 both the positive and negative sides of theY line and thus both R and S waves would berecorded in V1 with this loop.
In all 6 mitral stenosis ases there is an
abrupt increase in the size of the S wave be-tween leads V1 and V2. From the V2 positiona much larger portion of the vector loop lieson the negative side of the Y line, than in V,The reason for this is illustrated in figure 5.Here the axis of derivation from the V1 posi-tion is labeled X and the axis of derivationfrom the V2 position X'. The correspondingY and Y' lines are drawn at right angles tothe X and X' lines, through the E point. Thevector loop, which is taken from case 8; liesentirely on the positive side of the l' line, andthus only an R wave is recorded from the V,position. The same vector loop, however, lieson both the positive and negative sides of theY' line, and thus both R and S waves are re-corded from the V2 position.The depth of the S wave from the V,, posi-
tion thus depends on the amount of the vec-tor loop that lies both to the right and pos-teriorly. If the vector loop is deviated mark-edly to the right and anteriorly, the S wavein V2 may be very small, since only a smallpart of the vector loop would lie on the nega-tive side of the Y' line.
Similarly, it is possible to have markedrightward deviation of the vector loop and asmall R wave in V3R or V4R, provided the loopis inscribed significantly posteriorly. This isillustrated in case 9, where the posterior loca-tion of the loop largely cancels out the largepositive wave that would be expected fromits marked rightward location.The presence, in 3 cases, of R (or R') in
V1 less than 0.5 millivolt in amplitude, is atvariance with one of Milnor 'S4 criteria forright ventricular hypertrophy. In case 7 theR wave in V1 is 0.25 millivolt. The evidencefor right ventricular hypertrophy in this case
is (1) the presence of ventricular lift at theleft sternal margin, (2) a pulmonary arterypressure of 130/50 mm. Hg, (3) a horizontalvector loop with clockwise inscription andwith deviation to the right and anteriorly,(4) a frontal vector loop with clockwise in-scription and a mean axis of +110°, (5) a
sagittal vector loop with counterclockwise in-scription and anterior deviation.
Inspection of the horizontal vector loop in
414
L
by guest on May 14, 2018
http://circ.ahajournals.org/D
ownloaded from
DEEP S WAVE IN RIGHT VENTRICULAR HYPERTROPHY
this case (ease 7) shows the reason for thesmall R wave in V1. Although the loop isinscribed in a clockwise direction, and far tothe right, it lies only slightly anterior to theE point, hence the relatively small R in V1.The placement of the electrodes in the varioussystems currently in use in ve.toreardiogra-phy does not represent an ideal method forthe evaluation of the electric forces of theheart. But even with such deficiencies as arepresent with the various vectorcardiographicelectrode-placement methods, the inscriptionand location of the loops help to clarify puz-zling electrocardiographic variations.
Thus, even in the presence of large electricforces to the right, if these forces are suffici-ently posterior, the R wave in V1, V3R, andV4R may remain sufficiently small, or the Swave in these leads sufficiently large so thatan R/S ratio of 1.0 or greater is neverreached. From analysis of such vector loops,it is our opinion that an R/S ratio of 1.0 orgreater in V1, V3R, or V4x need not alwaysbe present for an electrocardiographic diag-nosis of right ventricular hypertrophy.Deep S waves in leads V1 or V2 may be pro-
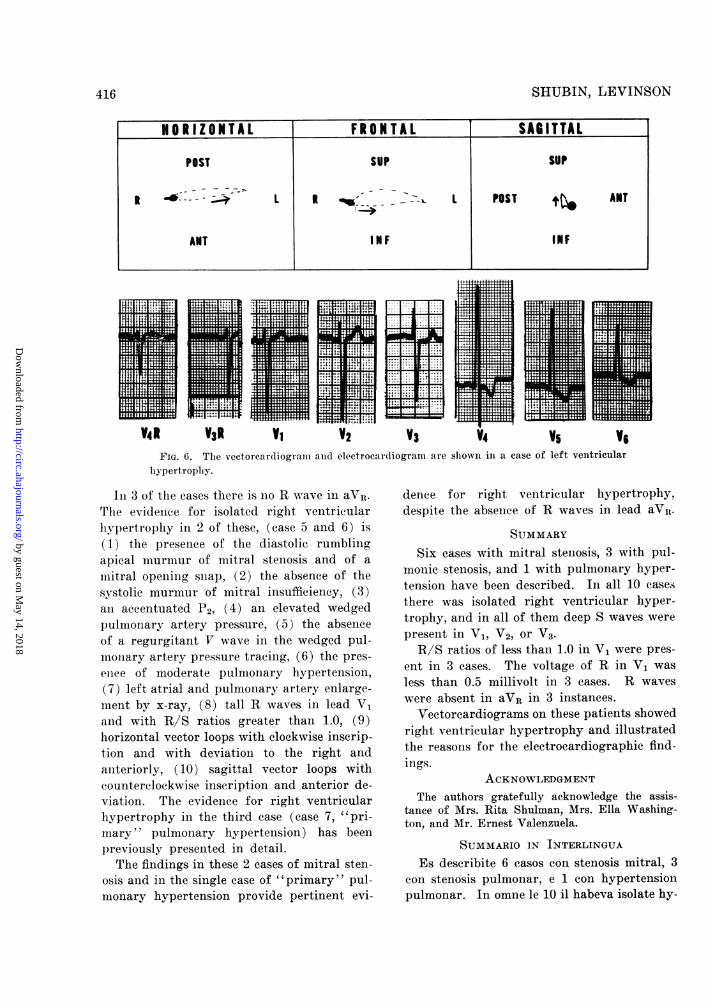
duced by vectors oriented to the left, or to theleft and posteriorly. Figure 6 illustrates theelectrocardiogram and vectorcardiogram of apatient with isolated left ventricular hyper-trophy due to a systemic hypertension. Thedeep S waves in V,, V2, or V3, which are pres-ent here, may also be found in right ventricu-lar hypertrophy. The tall R waves in V5 andV6 however are characteristic of left ventric-ular hypertrophy.
Diphasic P waves in leads V1 or V2 arefound in certain cases of mitral stenosis (fig.1, cases 1, 2, and 5). The diphasic P wavesin these instances are due to hypertrophy ofthe left atrium, which causes the P vectorloop to move posteriorly and to the left fromits normal position.9 This is illustrated incase 4 (fig. 2), where the P vector loop hasbeen labeled.
Frontal PlaneIn right ventricular hypertrophy the mean
frontal plane axis may commonly be betweei
POST
( ?I@II E
*1 %
1 1~~~*.E 1R vL~~~.
ANT
DIV,
A,
vI
'Ia
A:1a, .. a
l,1
EI
II
VI
iI.II
00a toIIml11ml:II1U11U
FIG. 4 Top. The method for derivation of theelectrocardiogram from the horizontal vectoreardio-graphic loops is shown. The solid-line electrocardio-gram is derived from the solid-line vectorcardiograin,and the dotted-line electrocardiogram from thedotted-line vectorcardiograma. Both these electro-cardiograms are recorded from the V1 position.
FIG. 5 Bottom. A single vectoreardiographic loopin the horizontal plane is shown. The solid electro-cardiogram is derived from the V, position and thedotted-line electrocardiogram from the V2 position.The X and Y reference lines relate to the V1 positionand the X' and Y' reference lines relate to the V2position.
+1100 to +1800 or -9l. to ±1800. A meanfrontal plane axis of less than +1 l0, how-ever, does occur in right ventricular hyper-trophy,8 and was present in 40 per cent of thepatients in this report. Clockwise rotation ofthe frontal loop was present in all instanees.A tall R wave in lead aVR is found when a
significant part of the vector loop lies on thepositive side of a line extending from +1200through the E point to -60°. Case 9 illus-trates this point. The major part of the looplies at about -150° (i.e. on the positive sideof the Y line for lead aVn) and the R wavein aVIt measures 8 mm.
1
415
by guest on May 14, 2018
http://circ.ahajournals.org/D
ownloaded from
SHUBIN, LEVINSON
.1X1-E1.
flV41W
i 1~~~~~~~~~~~ ii:lXi1:13R Vi 2 V3 V4 V5 Vs
FIG. 6. The vectoreardiogram and electrocardiograin are shown in a case of left ventricularhypertrophy.
In 3 of the cases there is no R wave in aVR.The evidence for isolated right ventricularhypertrophy in 2 of these, (case 5 and 6) is(1) the presence of the diastolic rumblingapical murmur of mitral stenosis and of a
iniitral opening snap, (2) the absence of thesystolic murmur of mitral insufficiency, (3)an accentuated P2, (4) an elevated wedgedpulmonary artery pressure, (5) the absenceof a regurgitant V wave in the wedged pul-mnonary artery pressure tracing, (6) the pres-
ence of moderate pulmonary hypertension,(7) left atrial and pulmonary artery enlarge-mnent by x-ray, (8) tall R waves in lead V,anid with R/S ratios greater than 1.0, (9)horizontal vector loops with clockwise inscrip-tion and with deviation to the right andanteriorly, (10) sagittal vector loops withcounterelockwise inscription and anterior de-viation. The evidence for right ventricularhypertrophy in the third case (case 7, "pri-mary" pulmonary hypertension) has beenpreviously presented in detail.The findings in these 2 cases of mitral sten-
osis and in the single case of "primary" pul-monary hypertension provide pertinent evi-
dence for right ventricular hypertrophy,despite the absence of R waves in lead aVi.
SUMMARYSix cases with mitral stenosis, 3 with pul-
monic stenosis, and 1 with pulmonary hyper-tension have been described. In all 10 cases
there was isolated right ventricular hyper-trophy, and in all of them deep S waves were
present in V1, V2, or V3.R/S ratios of less than 1.0 in V1 were pres-
ent in 3 cases. The voltage of R in V1 was
less than 0.5 millivolt in 3 cases. R waves
were absent in aVR in 3 instances.Vectoreardiograms on these patients showed
right ventricular hypertrophy and illustratedthe reasons for the electrocardiographic find-ings.
ACKNOWLEDGMENTThe authors gratefully acknowledge the assis-
tance of Mrs. Rita Shulman, Mrs. Ella Washing-ton, and Mr. Ernest Valenzuela.
SUMMARIO IN INTERLINGUA
Es describite 6 casos con stenosis mitral, 3con stenosis pulmonar, e 1 con hypertensionpulmonar. In omne le 10 il habeva isolate hy-
HORIZONTAL FRONTAL SABITTAL
POST SUP SUP
** -
L |R i -- L POST ANT
ANT 1NF INF
416
by guest on May 14, 2018
http://circ.ahajournals.org/D
ownloaded from
DEEP S WAVE IN RIGHT VENTRICULAR HYPERTROPHY
pertrophia dextero-ventricular, e in omnesprofunde undas S esseva presents in V1, V.,o V3.
Proportiones R/S de minus que 1,0 in V1esseva presente in 3 easos. lie voltage de Rin V1 esseva infra 0,5 millivolt in 3 casos.lUndas R in aVR esseva absente in 3 casos.
Le vectocardiogrammas de iste patientieindicava hypertrophia dextero-ventricular eillustrava le rationes pro le constatationeselectrocardiographic.
REFERENCES1. SOKOLOW, M., AND LYON, T. P.: The ven-
tricular complex in left ventricular hyper-trophy as obtained by unipolar precordialand limb leads. Am. Heart J. 37: 161,1949.
2. GARDBERG, M.: Clinical Electrocardiography,Ed. 1. New York, Hoeber-Harper, 1957.
3. SODI-PALLARES, D., AND CALDER, R. M.: NewBases of Electrocardiography, Ed. 3. St.Louis, C. V. Mosby, 1956.
4. SOKOLOW, M., AND LYON, T. P.: The ven-tricular complex in right ventricular hyper-
trophy as obtained by unipolar precordialand limb leads. Am. Heart J. 38: 273,1949.
5. LASSER, R. P., BORUN, E. R., AND GRISHMAN,A.: Spatial vectorcardiography: Right ven-tricular hypertrophy as seen in congenitalheart disease. VII. Am. Heart J. 42: 370,1951.
6. Dososo, E., SAPIN, S. 0., BRAUNWALD, E.,AND GRISHMAN, A.: A study of the elec-trocardiogram, and vectoreardiogram incongenital heart disease. Am. Heart J. 50:674, 1955.
7. MYERS, G. B., KLEIN, H. A., AND STOFER,B. E.: The electrocardiographic diagnosisof right ventricular hypertrophy. Am.Heart J. 35: 1, 1948.
8. MILNOR, N. R.: Electrocardiogram and vec-torcardiogram in right ventricular hyper-trophy and right bundle-branch block. Cir-culation 16: 348, 1957.
9. SANO, T., HELLERSTEIN, H. K., AND VAYDA,E.: P vector loop in health and disease asstudied by the technique of electrical dis-section of the vectorcardiogram. Ara. HeartJ. 53: 854, 1957.
Heinz, R., and Hultgren, H.: Atrial Fibrillation Following Mitral Valvulotomy.Arch. Int. Med. 99: 896 (June), 1957.Atrial fibrillation appeared following mitral valvulotomy in 47 per cent of 77 patients
who had a normal sinus rhythm prior to surgery. Fibrillation appeared most frequent-ly on the second postoperative day and rarely on the day of surgery. Spontaneous re-sumption of sinus rhythm occurred in 10 patients, and quinidine restored sinus rhythmin 16 patients, leaving 10 who had persistent postoperative atrial fibrillation. Since theventricular rate is high in patients not receiving digitalis, and since additional digitaliswas needed to slow the ventricular rate of most patients who developed postoperativeatrial fibrillation, all patients should probably be fully digitalized prior to valvulotomy.Since spontaneous resumption of sinus rhythm occurs in many patients, quinidine maybe withheld until the seventh postoperative day. It also may be more effective at thattime, since factors responsible for the onset of atrial fibrillation have by then apparent-ly diminished.
SIMON
417
by guest on May 14, 2018
http://circ.ahajournals.org/D
ownloaded from
HERBERT SHUBIN and DAVID C. LEVINSON in Right Ventricular Hypertrophy3, and V2, V1The Deep S Wave in Leads V
Print ISSN: 0009-7322. Online ISSN: 1524-4539 Copyright © 1958 American Heart Association, Inc. All rights reserved.
75231is published by the American Heart Association, 7272 Greenville Avenue, Dallas, TXCirculation
doi: 10.1161/01.CIR.18.3.4101958;18:410-417Circulation.
http://circ.ahajournals.org/content/18/3/410located on the World Wide Web at:
The online version of this article, along with updated information and services, is
http://circ.ahajournals.org//subscriptions/
is online at: Circulation Information about subscribing to Subscriptions:
http://www.lww.com/reprints Information about reprints can be found online at: Reprints:
document. Permissions and Rights Question and Answer
of the Web page under Services. Further information about this process is available in thewhich permission is being requested is located, click Request Permissions in the middle columnClearance Center, not the Editorial Office. Once the online version of the published article for
can be obtained via RightsLink, a service of the CopyrightCirculationoriginally published in Requests for permissions to reproduce figures, tables, or portions of articlesPermissions:
by guest on May 14, 2018
http://circ.ahajournals.org/D
ownloaded from