Embed Size (px)
Citation preview

1 ©Stephen Vincent 2015
Problem Orientated Project
“An Investigation into the causes and management of absenteeism
among hourly contracted staff at ACME – Canterbury.”
Report by:
Stephen Vincent
BSc Business Management
April 2015
Presented as part of the requirement of the degree of BSc
Business Management, Canterbury Christ Church University
Word Count:
6996
2 ©Stephen Vincent 2015
i Declaration and Acknowledgements:
This project is the product of my own work and has not been presented for any other award.
I declare also that this Problem Orientated Project is available for reference purposes and
inter-library loan.
Photocopying rights are reserved by the author and permission must be obtained prior to
any copies being reproduced.
The author of this report would like to extend their gratitude to Bob Smith, Store Manager of
ACME, for allowing the research to be conducted.
The author would like to thank the employees of ACME for their participation in the
“Employee Well-being Survey 2015”.
Also gratitude is extended to CCCU mentor Robert Mikecz for supporting this report.

3 ©Stephen Vincent 2015
Contents:
i Declaration and Acknowledgements 2
ii Executive Summary 4
1.0 Introduction 5
1.1 The Problem Defined and the Organisational Impact 5
1.2 Aims 5
1.3 Objectives 5
2.0 Literature Review 6
2.1 Causes of absenteeism - The individual and motivation to attend 6
2.2 Causes of absenteeism - Physiological and psychological influences 7
2.3 Management of absence - HRM concepts 11
3.0 Methodology of the Report 14
3.1 Data Collection Method 14
3.2 Validity 15
3.3 Questionnaire Design 16
3.4 Sampling 18
3.5 Testing 18
4.0 Data Analysis and Findings 19
4.1 Employee Absence Statistics 19 4.2 The Working Environment’s Impact on Absence 23 4.3 Employee Absence - Health and Non-Health Issues 27
4.4 Application of Absence Management Procedures 31 4.5 Absence Management - A Managerial Perspective 32
5.0 Conclusions 35
6.0 Recommendations 36
7.0 Bibliography 37
8.0 Appendix 38

4 ©Stephen Vincent 2015
ii Executive Summary:
This report was commissioned to provide an analysis and calculate the
cost to the organisation that unapproved absence incurs within a single
store (ACME- Canterbury).
The author conducted primary research, in the form of an “Employee Well-
being” self-administered questionnaire*, to gather quantifiable data to
ascertain the nature of the issue. This data identifies the internal and
external causes of absence, isolates the problem within the attitudes and
attributes of employees; and audits the managerial attitude and response
towards this cost.
Presented below are several key findings of the report that are of concern
to the researcher:
The average number of incidents of health related absence per
employee at ACME is 8.44 days, P/A; which is 2.34 days P/A higher
than the 6.1 national average. The total of 8.44 days puts the
estimated cost of health related absence at an average of £822.90
per employee, P/A.
The total cost to ACME is estimated to be £22,218.30 P/A.
93% of employees experience stress, 70% of employees have
suffered from stress, 93% of employees perceive their workload to
be “unmanageable” and 100% of employees perceive time limits for
completion of tasks to be “unachievable” (% of respondents).
100% of managers stated that they did not have the time to conduct
absence management procedures effectively.
Key recommendations:
Set a target in line with the CIPD’s (2013) target of 2.3 days per
employee, P/A; saving ACME and estimated £16,163.55 P/A
(estimated national savings of £9,762,784.20).
Staff absence figures to be measured as part of the monthly KPIs at
Area Managers’ cost meetings.
Workload and times for tasks require revisiting; retraining or
reengineering where required.
*Data collected via the questionnaire is subject to the employees’
perceptions, interpretation of the questions and estimations.

5 ©Stephen Vincent 2015
1.0 Introduction:
ACME UK operates 604 retail sites in the UK, competing in the grocery
sector. Key to the firm’s competitive advantage is a strategy of cost-
leadership.
1.1 The Problem Defined and the Organisational Impact:
According to the CIPD (2013), as cited by Leatherbarrow et al. (2014),
private sector employees in the UK average 6.1 days unapproved absence
P/A. The store manager was concerned as ACME’s average appears to
exceed this.
Figures presented by the CIPD (2013) state that the average cost to a UK
organisation due to unapproved absence is £595 per employee, P/A.
Store ACME employs 29 hourly contracted members of staff, this equates
to £17,255.00 P/A of un-utilised labour costs to the firm using the CIPD’s
(2013) figure. However this cost is based on the store having a normative
absence average.
1.2 Aims of the Report:
Identify the most frequently reoccurring causes of absenteeism.
Calculate the cost of absence at ACME.
Analyse the level to which current absence management procedures
are implemented.
Provide management with recommendations to reduce the problem.
1.3 Objectives:
Gather data to ascertain how many days of absence ACME
experiences in a 12 month period, (Questionnaire section one).
Investigate the correlation between employee attributes (age, gender,
tenure, role and shift-patterns) and absence, (Questionnaire section
one).
Conduct an overall well-being (physiological/psychological) audit of
employees, (Questionnaire section one part two and section two).
Establish the level of contact between line managers and subordinates
regarding absence, (Questionnaire section three).
Ascertain the attitudes towards absence management procedures from
the management’s perspective, (Questionnaire section four).

6 ©Stephen Vincent 2015
2.0 Literature Review:
The cost of absence, as estimated by the CIPD (2013), as cited by
Leatherbarrow et al. (2014), of £595 per employee, P/A, is made up of the
cost of – statutory sick pay, managerial time re-organising the working day,
covering the absent employee, loss of productivity and lower customer
service.
The literature reviewed for this report researched the - demographic,
psychographic, physiological and psychological - influencers of absence
and HRM concepts to effectively manage this problem.
2.1 Causes of absenteeism - The individual and motivation to attend:
Torrington et al. (2011. P. 311) state that “the causes of absence are
complex and interrelated” so managerial understanding of an attribute and
attitude model, such as The Rhodes and Steers process model of
attendance (1990), gives managers an insight into the factors that
influence absenteeism (see figure 2.1.1).
Figure 2.1.1

7 ©Stephen Vincent 2015
The 1990 model suggests that “employee attendance” comes under
pressure from a multitude of variable and interrelated factors such as -
“personal characteristics”, “job expectations”, “job situation”, “opportunity
for advancement”, “role stress” and “job scope”.
The Personal characteristics identified for research comprised of age,
gender and tenure.
In relation to age Truss et al. (2012) state that HRM has had to adapt to
demographic changes. According the Truss et al. (2012) generation Y
employees value free time, seek progression and are more inclined to
change career paths or organisations to achieve their goals than previous
generations. This generational change in attitude is supported by
Leatherbarrow et al. (2014), as the authors’ state that younger members of
the workforce also seek a greater work-life balance, which has made
flexibility a key area of modern HRM.
All the factors identified by Rhodes and Steers (1990), as cited by
Torrington et al. (2011), influence whether an employee can and/or is
motivated to attend; coupled with to what extent there is internal/external
pressure to attend.
2.2 Causes of absenteeism - Physiological and psychological influences:
Research correlated from the LFS (2012) and the ONS (2012), as cited by
Leatherbarrow et al. (2014. P. 394), lists “musculoskeletal disorders”,
“stress, depression or anxiety” and “minor illness” as the most frequent
reasons for employees failing to attend work.
According to the CIPD (2013), as cited by Leatherbarrow et al. (2014. P.
397), stress equated to 40% of “all work-related illness” and “depression
and anxiety are…affecting 20% of the working population”. Leatherbarrow
et al. (2014. P. 398) define the causes of stress as “stressors”, the key
factors generating workplace “stressors” are those of employee workload
and work schedule. Leatherbarrow et al. (2014) present a model to
highlight the potential stressors and the potential impact upon both the
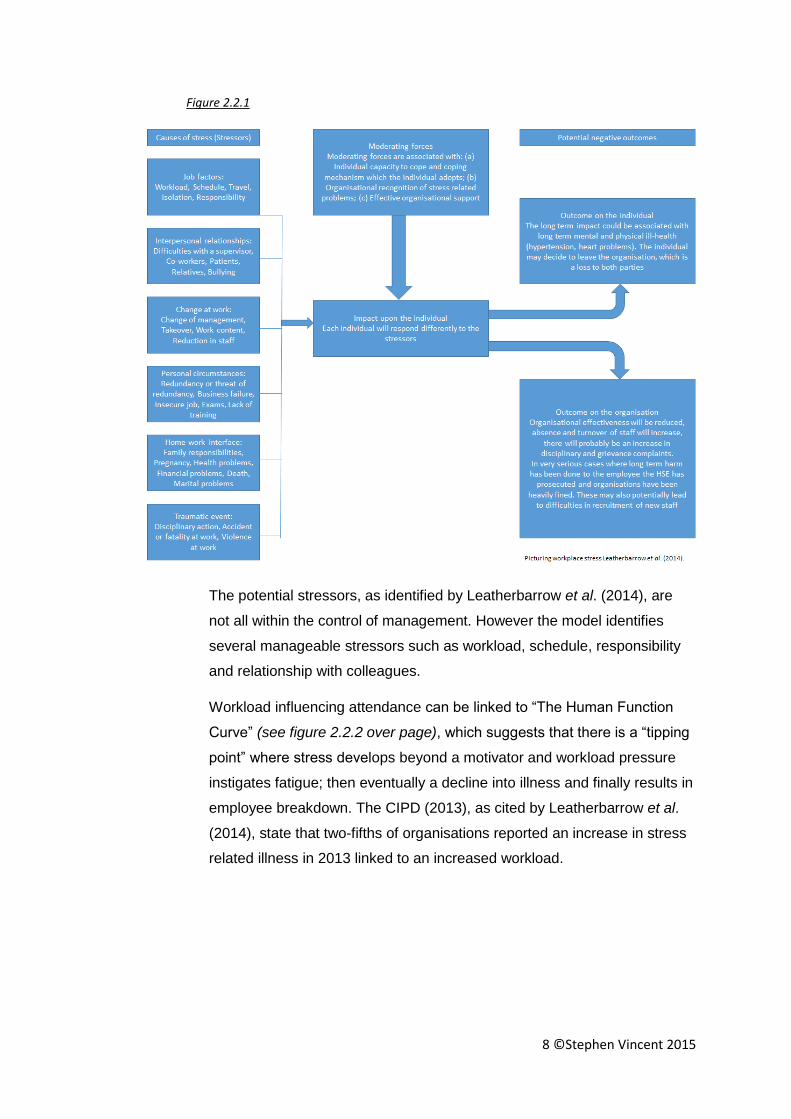
individual and organisation (see figure 2.2.1).
8 ©Stephen Vincent 2015
Figure 2.2.1
The potential stressors, as identified by Leatherbarrow et al. (2014), are
not all within the control of management. However the model identifies
several manageable stressors such as workload, schedule, responsibility
and relationship with colleagues.
Workload influencing attendance can be linked to “The Human Function
Curve” (see figure 2.2.2 over page), which suggests that there is a “tipping
point” where stress develops beyond a motivator and workload pressure
instigates fatigue; then eventually a decline into illness and finally results in
employee breakdown. The CIPD (2013), as cited by Leatherbarrow et al.
(2014), state that two-fifths of organisations reported an increase in stress
related illness in 2013 linked to an increased workload.

9 ©Stephen Vincent 2015
Figure 2.2.2
The notion of breakdown, as stated by Leatherbarrow et al. (2014), can
also be defined as “burnout”, Truss et al. (2012. P. 222) state this is argued
to be the opposite of engagement; if “burnout” is defined as the opposite of
engagement this has significant impact upon the problem of absenteeism.
MacLeod and Clarke (2009), as cited by Truss et al. (2012. P. 220), state
that “engaged employees take, on average, 2.7 days of sick leave per year
compared with 6.2 for disengaged employees”,
Absence is not the only cost as a result of “burnout”, according to Truss et
al. (2012), the level of employee engagement impacts on the focused and
productive completion of tasks. Leiter and Maslach (2005), as cited by
Truss et al. (2012. P. 222), developed the “Maslach Burnout Inventory”
(see figure 2.2.3 over page) as a HRM tool to measure “psychological
burnout”. This “burnout” according to Maslach and Leiter (2008), as cited
by Truss et al. (2012), consists of “exhaustion”, “cynicism” and “inefficacy”.
All of which can impose a negative impact upon productivity and service
quality; which represent additional costs to an organisation. Also “Burnout”
in one employee can increase stress in the workplace as a whole. Gross
(1996) states stress is a commuter and can spread from employee to
employee through negative co-worker relations.

10 ©Stephen Vincent 2015
Figure 2.2.3
Gross (1996) also states that stress and the human immune system are
invariably linked. Employees who experience stress will suffer from
symptoms which are often mistaken for viral infections or colds. However
prolonged exposure to stress weakens the body’s natural defences
therefore increasing an individual’s propensity to contract a virus.
Cox (1978), as cited by Gross (1996. P. 135), developed the engineering
model. This model claimed that stress is inflicted upon an individual by
external factors (i.e. workload) and stress is the internal manifestation of
these external pressures, this in turn gives rise to a stress reaction or
strain; therefore the “stress is located in the stimulus…stress is what
happens to a person (not what happens within a person)”. Supporting this
theory Goetsch and Fuller (1995) state, as cited by Gross (1996. P.135),
“stress [is] an interaction between an organism and its environment”.
Organisations are able to manage the working environment, and as
Leatherbarrow et al. (2014) state, are obligated to provide a safe working
environment conforming to HSE (2014) legislation.
Based upon these viewpoints it would suggest identifying the extent to
which the stress, both psychological and physiological, of an employee’s
workload/deadlines/time constraints impacts their rate of attendance is key
to the research. Finding a correlation between these factors can allow
management to identify work processes that require improved training or
the reorganising of activities to lessen the exposure to, or the perception
of, stress.

11 ©Stephen Vincent 2015
As well as stress being a cause of illness Gross (1996) suggests that pain
is heightened when there is the presence of a stressor. The higher the
stress level of an employee the lower their tolerance or acceptance of pain.
According to the HSE (2013), as cited by Leatherbarrow et al. (2014),
manual workers are susceptible to more incidences of absence than non-
manual workers. Based upon this it would be prudent to address the issue
of absence due to musculoskeletal problems not simply from an angle of
Health and Safety in the work place, for example training in manual
handling, but the impact of stress influencing the zone of pain
tolerance/acceptance.
Just as workload and stress influence an employee’s potential attendance,
or lack thereof, an employee’s work schedule may place pressure upon
their circadian rhythm. According to Gross (1996) the circadian rhythm
regulates the body’s blood pressure, body temperature and hormonal
stability. Gross (1996) highlights how shift workers suffer from increased
psychological disorders such as stress and depression as a consequence
of irregular cycles of sleep. This theory can be applied to identify to what
extent erratic or routine shift patterns impact upon an individual’s rate of
attendance.
2.3 Management of absence - HRM concepts:
Leatherbarrow et al. (2014) state that, although employee absence will be
noticed by management and colleagues, without monitoring and measuring
the problem cannot be quantified nor addressed effectively.
According to the CIPD (2013), as cited by Leatherbarrow et al. (2014. p.
373), managing absence can be aided by “return-to-work interviews”; with
86% of organisations using this method. This process according to the
CIPD (2013), as cited by Leatherbarrow et al. (2014), affords line
managers the opportunity to record details on the causes of absence and
discuss the issues with subordinates.
The return-to-work interview is the only official absence management
procedure implemented by ACME (2014). Although return-to-work
interviews are part of company policy, and the academic sources support
their merit, there are other methods available to managers.

12 ©Stephen Vincent 2015
According to Torrington et al. (2011) management can utilise Huczynski
and Fitzpatrick’s (1989) ALIEDIM process in order to address the problem
of short-term absence. Huczynski and Fitzpatrick (1989), as cited by
Torrington et al. (2011. p. 314) recommend a 7 step process comprising of:
1. Assess the absence problem.
2. Locate the absence problem.
3. Identify and prioritise absence causes.
4. Evaluate the current absence control methods.
5. Design the absence control programme.
6. Implement the absence control programme.
7. Monitor the effectiveness of the absence control programme.
Armstrong (2009) suggests that incidences of absence are not all equal in
their impact. The Bradford Factor offers a formula allowing managers to
quantify the impact that each spell of absence (over a 52 week period, in
terms of number of absences and number of days) has on the daily
operations of an organisation (see figure 2.3.1). Leatherbarrow et al.
(2014) claim that predictability is linked to manageability, therefore utilising
the Bradford Factor it can be seen that an employee experiencing multiple
absences of one day places more pressure on the organisation than an
individual taking an extended period of time off from work on one occasion.
Armstrong (2009) states the benefit of this tool is that the Bradford Factor
scoring system allows for trigger points for intervention to be set,
intervention suggested at 250 points. This would allow managers to not
only conduct return-to-work interviews once the employee returns, but also
monitor and evaluate the disruption caused by an individual’s attendance
record over the course of 52 weeks; and have evidence to support possible
disciplinary action.
Figure 2.3.1

13 ©Stephen Vincent 2015
In relation to stress, as discussed in the previous section, the HSE (2013),
as cited by Leatherbarrow et al. (2014. p. 401), produced “The
Management Standards for Work Related Stress” guide for organisations.
As with Huczynski and Fitzpatrick’s (1989) ALIEDIM process, as cited by
Torrington et al. (2011), the HSE (2013) suggest management adopt a
stepped approach:
1. Identify the main risk factors for work-related stress.
2. Employers focus on the underlying causes and their prevention.
3. Provide a yardstick by which organisations can gauge their
performance in tackling the key causes of stress.
Activities and procedures, as presented, isolating personal/organisational
causes of absence, combined with the implementation of processes
designed to limit the problem, inevitably lead to lower costs in the long-
term; with the CIPD (2013) suggesting a target of 2.3 days absence per
employee, P/A. Line managers should be proactive in addressing the
problem.
Truss et al. (2012) state that the devolution of HR powers to line managers
is an integral element of modern strategic HRM. However managers,
according to Truss et al. (2012), are not always convinced that HRM
procedures are of value and often do not view HRM tools useful, often
opting to retain a dated ad-hoc approach. An argument, however, can be
made that certain employees are not strategic, as Truss et al. (2012) also
state specific workers may not be considered VRIN and therefore require
low-commitment HR. Contrary to this view The CIPD (2013) suggest that
employee well-being should be embedded into an organisation’s culture,
with no mention of strategic value being a factor.
“The cultural web’s” element relating to control systems, according to
Johnson et al. (2012. P. 101), sets out how an organisation monitors and
supports employees; and defines what is “important to the organisation”.
An organisational culture without employee well-being as a KPI (part of
Control Systems) will develop a culture of figures over employees, as has
been suggested by Leatherbarrow et al. (2014). ACME UK LTD (2014) do
not mention HR in relation to a stores’ key performance indicators.

14 ©Stephen Vincent 2015
3.0 Methodology of the Report:
Although a self-administered questionnaire was finally selected as the
optimum method for data collection, one disadvantage of this method of
research, as Saunders et al. (2012) state, is that all data collected for
analysis had to be derived from one source. Therefore careful
consideration had to be taken in regards to this selected method of the
data collection.
Sections 3.1 to 3.5 detail said considerations and the subsequent
decisions in order to meet the reports objectives.
3.1 Data Collection Method:
In order to gather data primary research was required to investigate the
nature and aspects of the absenteeism problem. A questionnaire was
selected, as according to Saunders et al. (2012. p. 417), it is a method
which “provides an efficient way of collecting responses from a large
sample prior to quantitative analysis”.
Through research into data collection a self-administered questionnaire
was identified as the most appropriate method. Saunders et al. (2012. P.
420) suggest that other methods may have been considered, such as
interviewer-completed questionnaires, however in order to protect the
validity of the data required “respondents’ answers not being contaminated
or distorted” was a key consideration.
Bryman and Bell (2003) support this view stating that interviewer led
questionnaires can return bias or socially desirable responses as
anonymity is lost; and as, Leatherbarrow et al. (2014) state, absence in the
workplace is a sensitive area of research, anonymity was considered vital.
Although there is a valid argument that a self-administered questionnaire,
that is delivered and collected upon completion, has the added value of
anonymity protecting against socially desirable responses on a sensitive
subject, Bryman and Bell (2003) state that issues could arise from false
respondents.

15 ©Stephen Vincent 2015
This was an issue as by protecting validity through anonymity there was no
way to identify who had produced the responses and possibly corrupted
the data.
In order to maintain a balance between validity through anonymity and
validity through genuine responses, a sign off sheet was included in the
questionnaire pack. This meant that 33 questionnaires (only one for each
of the 29 hourly contracted employees and 4 managers) were delivered
along with a separate sign off sheet. Upon completion the employees were
instructed to seal their questionnaires and submit them via the collection
box, then sign to state that they had participated. This allowed for the
number of returned questionnaires to be cross referenced with the number
of signatures (sign off sheet was destroyed on site in accordance with
ACME UK LTD’s (2014) data protection policy once the numbers had been
verified). Although not a fool proof method it did result in 31 questionnaires
returned and 31 corresponding signatures due to ACME UK LTD’s (2014)
disciplinary policy on falsifying company records.
3.2 Validity:
As well as the previously discussed notion of validity through anonymity,
there were multiple key concepts surrounding research validity in relation
to the findings from a questionnaire. Several considerations from academic
sources were taken into account with regards to these issues when
developing the “Employee Well-being Survey 2015” - sections, questions
and wording.
The general overarching debate when it comes to research relates to the
internal validity of the results, or their reliability. The concept of internal
validity, according to Saunders et al. (2012), suggests that the researcher
must consider the questionnaire’s ability to measure what is intended to be
measured. Saunders et al. (2012. P. 428) state that “the internal validity
and reliability of the data [and] the response rate…depend…on the design
of [the] questions.” Therefore due care was taken when it came to linking
both the literature reviewed and the methodology to the report’s objectives.
As well as internal validity there is the concept of content validity.
According to Saunders et al. (2012. P. 429) the principles behind content
validity required the questionnaire to “provide adequate coverage” of the
key issues being investigated.

16 ©Stephen Vincent 2015
Therefore, as Saunders et al. (2012) state, it was vital that all questions
were conscientiously designed to gather essential data, data that was
required to meet the objectives and the aims of the report and nothing
further. This was key to the development of the survey as, according to
Foddy (1994), as cited by Saunders et al. (2012. P. 429), the “researcher
[must be] clear about the data required” before designing the questions;
which ultimately provided the data for analysis. Achieving this required
breaking down the issue of absenteeism into four areas of HRM -
employee attributes (demographics), employee attitudes (psychographics),
managerial application of procedures and managerial attitude to
procedures - and basing questions around the core theoretical concepts of
HRM relating to absence from the literature reviewed. As well as
customised questions, developed from the key concepts reviewed,
questions were adopted and adapted from the Department for Work and
Pensions (2011) “Health and Well-being at work: a survey of employees”
report 2011 produced by Young and Bhaumik (2011). This method, as
Saunders et al. (2012) state, allowed the author to compare and contrast
certain results with that of the national average if required.
3.3 The Questionnaire Design:
The questionnaire consisted of a mixture of “List questions” to identify
“attribute variables” (Dillman, 2009, as cited by Saunders et al. 2012. P.
425) such as age, gender and contracted hours. This method, as
suggested by Saunders et al. (2012), was appropriate to collect data of a
clearly defined nature. Data defining the attributes of the workforce was
identified as being necessary to the findings based upon The Rhodes and
Steers (1990) process model of attendance.
However Saunders et al. (2012. p. 433) state that unpredicted responses
may arise from questions deemed “intrusive”, therefore prudent care was
taken when wording questions and only attributes highlighted by Rhodes
and Steers (1990), as cited by Torrington et al. (2011), were collected.
Attributes such as race or religion have no theoretical merit to the Rhodes
and Steers’ (1990) model so were superfluous to requirement. The
sensitive nature of the issues investigated resulted in certain questions,
although adapted from a governmental survey, not being completed by all
respondents (see data analysis and findings figures 4.1.6-4.1.8).

17 ©Stephen Vincent 2015
Rating questions, Likert-style, were utilised in order to gauge the
employees’ opinion on key identified issues on a range from - strongly
agree, agree, neither agree nor disagree, disagree or strongly disagree.
This order was kept consistent throughout the questionnaire as Dillman
(2009), as cited by Saunders et al. (2012), state that altering the order
throughout the survey can result in confusion on the part of the
respondent, which could corrupt the data.
Based upon the literature reviewed (Rhodes and Steers (1990) and
picturing workplace stress) certain constructs were identified as having a
theoretical impact upon employee absence rates. The Likert-style
questions, as stated by Saunders et al. (2012. P. 430), aimed to measure
the feelings towards “those constructs” that the researcher deemed
appropriate. In order to derive quantitative data from the attitude related
Likert-style responses, each selectable answer was converted into a
number (+1, +0.5, 0, -0.5 and -1). “Strongly Agree” was given a ranking
score of +1 and “Strongly Disagree” measured as -1, since “Strongly
Agree” represents a perfect positive correlation and “Strongly Disagree” a
perfect negative correlation. This aimed to produce an intuitive set of
graphs based upon a correlation coefficient (positive and negative
correlation). Also this method aided in simplifying the questionnaire, as it
required less explanation directed at the respondents and limits any
possible confusion; as Foddy (1994) states, as cited by Saunders et al.
(2012. P. 429), validity and reliability pivots on the questions, and therefore
the answers, “making sense”. Respondents opting to select N/A are
inferred as responding 0 and factored into the mean. Those individuals
selecting “Prefer Not to Disclose” are counted as a respondent; however
they are not factored into individual means as no numerical amount can be
inferred from this response.

18 ©Stephen Vincent 2015
3.4 Sampling:
Questionnaires also encounter validity issues when the sample size is
open to scrutiny. Sampling, as stated by Saunders et al. (2012), is a cost
effective way to gather data to derive a set of statistics that can be
estimated to be representative of a wider population. However suitable
sample size is dependent on several key points - the researcher’s
tolerance for a margin of error (accuracy of the results), the size of the
population, nature of research and the confidence in the data being
statistically applicable across the total population. Saunders et al. (2012. P.
260) state that time and financial constraints often require samples of
populations, however due to the number of employees at ACME (29 hourly
contracted employees and 4 managers) a census was possible as this
population was “of a manageable size.”
3.5 Testing:
During the development of the questionnaire it was necessary to trial
several drafts. The initial trial constituted of one student, working in the
grocery sector. The student completed the questionnaire with no
researcher assistance required. However upon reflection it was decided
that although section two of the questionnaire was able to effectively
gather data on health issues, it would have provided no data as to the
frequency to which these issues afflict the respondent; therefore there was
no potential to develop a risk matrix.
According to Mitchell (1996), as cited by Saunders et al. (2012), the validity
of results obtained from a questionnaire are enhanced if the sample
returns the same responses on more than one occasion. However due to
time limits and the motivation of respondents to participate in a
questionnaire twice this was not possible for the final study. In order to
apply the test/re-test principles as suggested by Mitchell (1996), as cited by
Saunders et al. (2012), the questionnaire was piloted by a panel of three
students. Each respondent completed the questionnaire on a Monday
morning and then repeated the process the following Monday. The second
Monday morning was selected to simulate the conditions of the initial trial
as much as controllably possible. The data obtained was 93% identical, the
7% margin of error can be attributed to the week time gap.

19 ©Stephen Vincent 2015
4.0 Data Analysis and Findings:
The final questionnaire (see Appendix) consisted of four sections (three
sections developed for hourly contracted employees and one for
management only) with a total of 32 questions. Data - collected, correlated
and analysed - from the individual responses to the questionnaire has
been presented in sections 4.1 to 4.5 of this report. The data has been
compiled from 31 respondents (27 hourly contracted employees and 4
managers) a response rate of 93%.
4.1 Employee Absence Statistics:
Data from section one has been correlated to identify links between
attributes and incidents of absence. Section One: Part One, questions a to
d, identified the four attributes of each respondent being investigated
(gender, age group, contract and length of service) with Qe gathering the
number of days of absence.
Figures 4.1.1 to 4.1.4 present the attribute group in the primary left column
and the data in the tables.
Figure 4.1.1
Gender Number of Respondents
Total Sick Days
Absence*
Mean
Male 22 185 8.4 Female 5 43 8.6 Totals 27 228 8.44
*Denotes estimates of respondents
Figure 4.1.1 presents the data to identify a link between gender and
absence. Store ACME’s workforce comprises of 81% male, while only 19%
of hourly contracted staff are female. This in turn leads to males having the
highest number of days of absence related to health issues, however the
means for both genders are within 0.2 of each other, at 8.4 days P/A and
8.6 days P/A respectively. The total mean of 8.44 is 2.34 days higher than
the 6.1 national average, however it should remain noted throughout this
report that the data is based upon the estimations of respondents.

20 ©Stephen Vincent 2015
Figure 4.1.2
Age Group Number of Respondents
Total Sick Days
Absence*
Mean
18-21 7 66 9.42 22-25 12 112 9.33 26-29 5 29 5.8 30-33** 1 4 4.0 45+** 2 17 8.5 Totals 27 228 8.44
*Denotes estimates of respondents
**Data from a small sample
The data presented by figure 4.1.1 highlighted that the impact gender
imposed upon the mean absence was negligible. However when the data
for number of days of absence was correlated against the respondent’s
age grouping attribute significant differences can be seen in the means of
each age bracket. These findings suggest that, as Truss et al. (2012) state,
age is major contributing factor to an employee’s attendance or lack
thereof. Employees 18-25 years of age reported an average of 9.37 days
absence P/A compared to 5.5 days for employees 26-33 years of age.
Figure 4.1.3
Contract Number of Respondents
Total Sick Days
Absence*
Mean
20 Hours 22 199 9.05 30 Hours 5 29 5.8 Totals 27 228 8.44
*Denotes estimates of respondents
As with age groupings, the hourly contract that employees are signed up to
appears to have an impact on their rate of attendance. Respondents on the
lower 20 hours (see figure 4.1.3) contracts take 3.25 more days off than
those on the 30 hours contract; this can be linked to Rhodes and Steers’
(1990) model. Thirty hours contracts, as stated by ACME UK LTD (2014. p.
14.), are given to employees for “taking on managerial responsibilities”.
Therefore employees on 30 hours contracts have a more diverse role and
greater scope of activities.

21 ©Stephen Vincent 2015
Figure 4.1.4
Years of Service Number of Respondents
Contract Total Sick Days
Absence*
Mean
Less than a year 10 0@30hrs 97 9.7 1-2 Years 10 0@30hrs 87 8.7 3-4 Years 3 3@30hrs 17 5.66 5-6 Years 4 2@30hrs 27 6.75 Totals 27 5@30hrs 228 8.44
*Denotes estimates of respondents
Rhodes and Steers’ (1990) model suggested that length of service should
be viewed as an influencing factor in relation to attendance. The data
indeed presents a set of figures which conclude that respondents for whom
employment is less than 3 years average 9.2 incidents of absence P/A,
compared to 6.3 days P/A for employees with 3+ years of service.
However it was prudent to add the contract factor into the chart to highlight
that the notion of tenure influencing absenteeism can be linked back to the
concept of responsibility and role. As evident from the table (see figure
4.1.4) length of service and contract are interlinked.
From the findings it can be calculated (based upon the CIPD’s (2013)
average figure for employee absence and the average cost of £595 per
employee, P/A) that the cost of absence in store ACME is estimated at
£822.90 per employee, P/A (see figure 4.1.5 for calculations).
Figure 4.1.5
This higher than average number of unauthorised days of absence costs
store ACME an estimated extra £6,153.30 more than the CIPD (2013)
average for a private sector firm; this equates to £22,218.30 in costs
related to staff absence. Setting a goal to meet the CIPD’s (2013) target of
an average of 2.3 days per employee, P/A, would save the store
£16,163.55 P/A.
£595/6.1=£97.5 (national average cost per day of absence)
£97.5x8.44=£822.90 P/E, P/A (£227.90^ on national average)
£822.90x27=£22,218.30 (£6,153.30^ on national average)

22 ©Stephen Vincent 2015
As well as absence as the result of health related issues, Young and
Bhaumik’s (2011) research for the DfWP (2011) identified non-health
related issues resulting in employees being unable to attend. The report
suggested that factors including - child care, transportation, duvet day
culture and family dynamic - added to the total number of days lost in the
workplace.
Figure 4.1.6
Gender Number of Respondents*
Total Non-Sick Days
Absence**
Mean
Male 13 (11) 23 2.09 Female 5 (4) 16 4.0 Totals 18 (15) 39 2.6
*Nine questionnaires left blank, one N/A
and three “Prefer not to Disclose”
**Denotes estimates of respondents
Figure 4.1.6 highlights that female employees take an average of 1.91
more days off P/A due to non-health related issues (see figures 4.3.3 and
figure 4.3.4 for full details).
Figure 4.1.7
Age Group Number of Respondents*
Total Non-Sick Days
Absence**
Mean
18-21 3 (2) 2 1.0 22-25 8 (7) 24 3.42 26-29 4 6 1.5 30-33 1 1 1.0 45+ 2 (1) 6 6.0 Totals 18 (15) 39 2.6
*Nine questionnaires left blank, one N/A
and three “Prefer not to Disclose”
**Denotes estimates of respondents
Figure 4.1.7 presents the relationship between age and non-health related
absence (see figures 4.3.3 and figure 4.3.4 for full details). The mean can
be seen to start at 1 and rise throughout the 20’s to level back out at 1.
However the number of respondents dropped from 27 to 18, with 3
respondents opting to disclose no data (“Prefer not to Disclose”).

23 ©Stephen Vincent 2015
It should be noted that the data for the age group 45+ has been taken from
2 respondents, 1 of which selected “Prefer not to Disclose”. It should also
be noted that the drop off in respondents coincided with questions (see
questionnaire Section Two: questions d and e) attempting to gather non-
workplace information and therefore may have been perceived as too
intrusive; however data of this nature had been collected by Young and
Bhaumik (2011) so it was deemed necessary.
Figure 4.1.8
Contract Number of Respondents*
Total Non-Sick Days
Absence**
Mean
20 Hours 13 (10) 33 3.3 30 Hours 5 6 1.2 Totals 18 (15) 39 2.6
*Nine questionnaires left blank, one N/A
and three “Prefer not to Disclose”
**Denotes estimates of respondents
Hourly contracts once again provide significant data (see figure 4.1.8).
Although taken from a reduced number of respondents, employees on the
lower 20 hours contract are absent for 2.1 days more for non-health related
issues than those on 30 hours contracts.
When non-health related absences are added to the total mean of 8.44 the
total means becomes 9.88; adding an additional estimated £3,790.80 to
the total cost of absence, taking the total to an estimated £26,009.10.
4.2 The Working Environment’s Impact on Absence:
Section Two comprised of 10 questions designed to gauge hourly
contracted employee’s attitudes towards factors identified in the literature
(see Rhodes and Steers (1990) model, figure 2.1.1) as drivers of
absenteeism.
The first batch of questions (questionnaire Section One: Part Two,
questions a to f, see figure 4.2.1 over page) aimed to assess the hourly
contracted respondents’ attitudes towards factors influencing an
employee’s relationship with store management, the organisation and
colleagues.
24 ©Stephen Vincent 2015
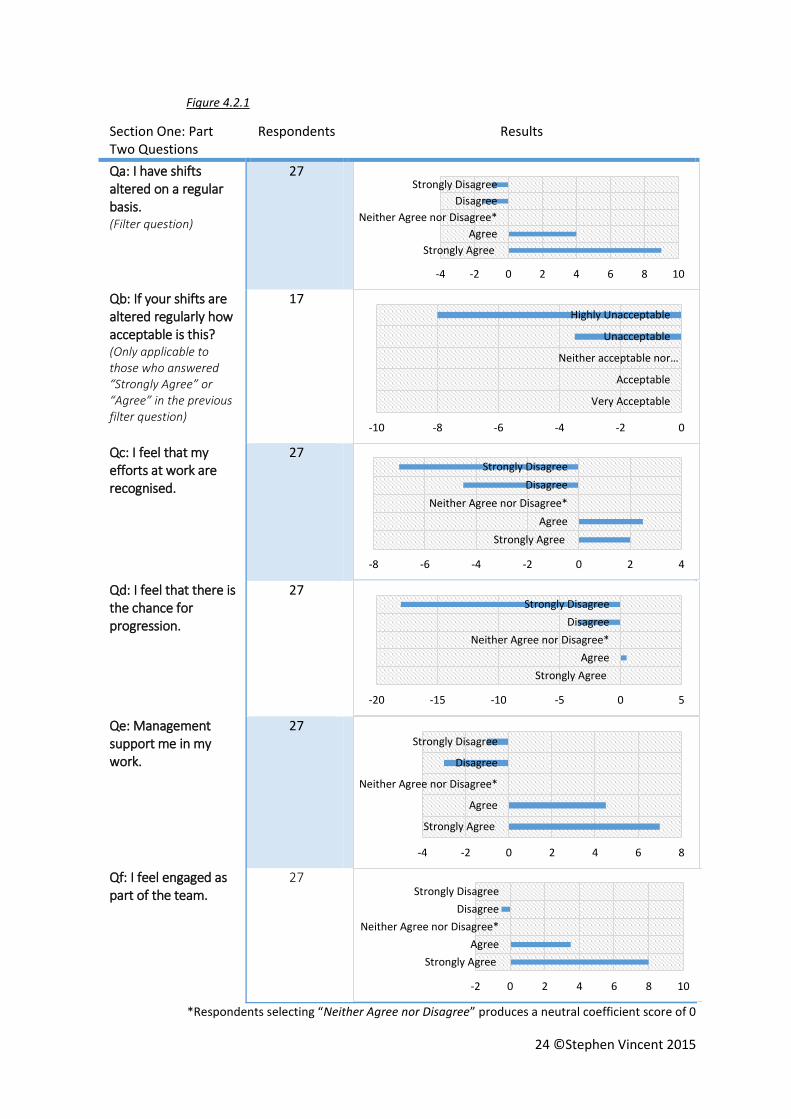
Figure 4.2.1
Section One: Part Two Questions
Respondents Results
Qa: I have shifts altered on a regular basis. (Filter question)
27
Qb: If your shifts are altered regularly how acceptable is this? (Only applicable to those who answered “Strongly Agree” or “Agree” in the previous filter question)
17
Qc: I feel that my efforts at work are recognised.
27
Qd: I feel that there is the chance for progression.
27
Qe: Management support me in my work.
27
Qf: I feel engaged as part of the team.
27
*Respondents selecting “Neither Agree nor Disagree” produces a neutral coefficient score of 0
-4 -2 0 2 4 6 8 10
Strongly Agree
Agree
Neither Agree nor Disagree*
Disagree
Strongly Disagree
-10 -8 -6 -4 -2 0
Very Acceptable
Acceptable
Neither acceptable nor…
Unacceptable
Highly Unacceptable
-8 -6 -4 -2 0 2 4
Strongly Agree
Agree
Neither Agree nor Disagree*
Disagree
Strongly Disagree
-20 -15 -10 -5 0 5
Strongly Agree
Agree
Neither Agree nor Disagree*
Disagree
Strongly Disagree
-4 -2 0 2 4 6 8
Strongly Agree
Agree
Neither Agree nor Disagree*
Disagree
Strongly Disagree
-2 0 2 4 6 8 10
Strongly Agree
Agree
Neither Agree nor Disagree*
Disagree
Strongly Disagree

25 ©Stephen Vincent 2015
The question “I have shifts altered on a regular basis” was designed to
ascertain to what extent there is a measure of stability in the working week.
Seventeen employees (9 “Strongly Agree and 8 “Agree”) claimed their
shifts were altered (see figure 4.2.1, Qa). This question acted as a filter
question to assess to what extent this practice causes grievance amongst
staff (“If your shifts are altered regularly how acceptable is this?”). Of the
17 who passed through the filter question 8 found this practice to be
“Highly Unacceptable”, 7 “Unacceptable”, with 2 expressing no opinion +/-
on the issue (see figure 4.2.1, Qb).
Question c aimed to identify to what extent employees feel their work is
valued. “I feel my efforts at work are recognised” returned a negative
response, with 16 employees experiencing no perception of recognition (7
“Strongly Disagree, 9 “Disagree”) opposed to 7 (2 “Strongly Agree”, 5
“Agree”) who feel recognised (see figure 4.2.1, Qc).
According to Rhodes and Steers (1990) the potential for career
advancement factors into the motivation to attend. Respondent’s
overwhelmingly rejected the statement “I feel that there is a chance for
progression”, with 18 selecting “Strongly Disagree” and 7 selecting
“Disagree” (see figure 4.2.1, Qd).
However when asked whether “Management support me in my work” 7
respondents selected “Strongly Agree” and 9 “Agree”. This suggests that
the response to recognition may have been interpreted as relating to the
organisation as a whole and not store level (see figure 4.2.1, Qe).
The final question posed looked to investigate co-worker relations, as
suggested by Rhodes and Steers (1990), which impacts upon attendance
motivation. This returned a positive result, with 15 employees (8 “Strongly
Agree”, 7 “Agree”) feeling engaged as part of a team (see figure 4.2.1, Qf).

26 ©Stephen Vincent 2015
The second batch of questions that made up Section One: Part Two were
designed to assess the general level of stress in the workplace, identify the
main stressors and how they are perceived by employees.
Figure 4.2.2
Section One Part Two Questions
Respondents Results
Qg: I regularly experience stress at work.
27
Qh: Time-limits for tasks are achievable.
27
Qi: I feel that my workload is manageable.
27
Qj: I am satisfied with my work life balance.
27
*Respondents selecting “Neither Agree nor Disagree” produces a neutral coefficient score of 0
Out of 27 respondents 25 (17 “Strongly Agree”, 8 “Agree”) regularly
experience stress at work (see figure 4.2.2, Qg). Three further questions
were asked to isolate which stressors were most prevalent. The three
stressors identified from the literature reviewed were time-limits for tasks,
workload and work-life balance.
-5 0 5 10 15 20
Strongly Agree
Agree
Neither Agree nor Disagree*
Disagree
Strongly Disagree
-25 -20 -15 -10 -5 0
Strongly Agree
Agree
Neither Agree nor Disagree*
Disagree
Strongly Disagree
-20 -15 -10 -5 0 5
Strongly Agree
Agree
Neither Agree nor Disagree*
Disagree
Strongly Disagree
-8 -6 -4 -2 0 2 4 6
Strongly Agree
Agree
Neither Agree nor Disagree*
Disagree
Strongly Disagree

27 ©Stephen Vincent 2015
The results are of concern (see figure 4.2.2, Qh, Qi, Qj) as 100% of
respondents do not perceive time-limits for task as achievable (21
“Strongly Disagree”, 6 “Disagree”). Of the 27 employees questioned 93%
of respondents stated that their workload was unmanageable (16 “Strongly
Disagree”, 9 “Disagree”) with 56% of respondents being dissatisfied with
their work-life balance (6 “Strongly Disagree”, 9 “Disagree”).
4.3 Employee Absence - Health and Non-Health Issues:
The researcher asked several questions aimed at identifying the
causes/reasons for respondents missing shifts, both health and non-health
related.
S2/Qa: Which of these conditions have you experienced in the last 12
months or are currently experiencing?
Figure 4.3.1
Condition Number of Respondents
Minor Illness 21 Musculoskeletal Problems 16 Stress/Depression/Anxiety 21 Headaches and Migraines 2 Prefer not to Disclose 6 Total 27*
*Each respondent could select multiple conditions
S2/Qb: Which of these conditions have caused you to miss a
scheduled shift in the past 12 months?
S2/Qc: If a scheduled shift has been missed due to one or more of the
above conditions please state the most frequent condition/s and
number of shifts missed below?
Figure 4.3.2
Condition Number of Respondents
Total Sick Days
Absence*
Minor Illness 21 117 Musculoskeletal Problems 10 38 Stress/Depression/Anxiety 9 24 Headaches and Migraines 2 2 Prefer not to Disclose 6 - Totals 27** 181
*Denotes estimates of respondents
**Each respondent could select top two conditions

28 ©Stephen Vincent 2015
As can be seen by reviewing figure 4.3.2 “Minor Illness” is the predominant
cause of absence (117 days) with “Musculoskeletal Problems” (38) and
“Stress/Depression/Anxiety” (24) as the number two and three causes
respectively.
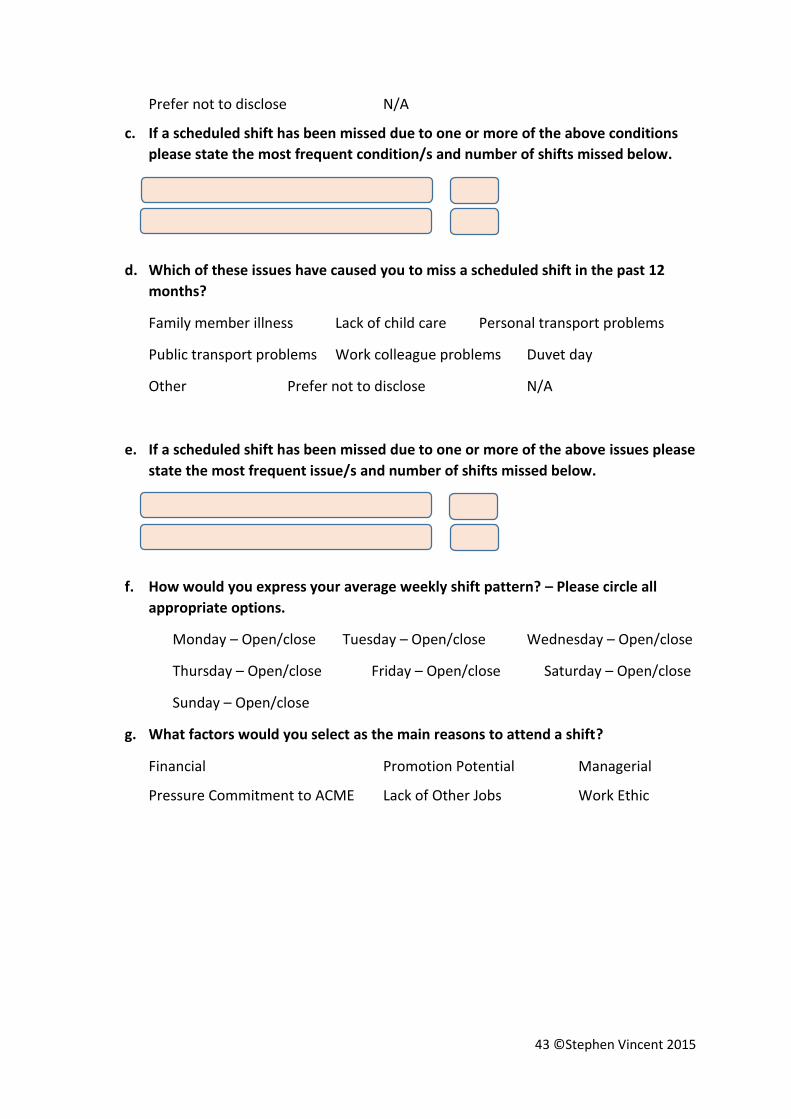
S2/Qd: Which of these issues have caused you to miss a scheduled
shift in the past 12 months?
S2/Qe: If a scheduled shift has been missed due to one or more of the
above issues please state the most frequent issues/s and number of
shifts missed below?
Figure 4.3.3
Non Health Related Issues Number of Respondents*
Total Non-Sick Days
Absence**
Family Member Illness 7 7 Lack of Child Care 10 32
*Each respondent could select top two conditions.
**Denotes estimates of respondents
The two causes of non-health absence identified where those of “Family
Member Illness” and “Lack of Child Care”. As with health related conditions
the non-health issues causing shifts to be missed were correlated against
the attributes of the respondents.
Figure 4.3.4
Attribute Groups Number of Respondents
Family Member
Illness
Lack of Child Care
Male 13 (11) 6 17 Female 5 (4) 1 15 18-21 3 (2) 1 1 22-25 8 (7) 2 22 26-29 4 2 4 30-33 1 1 0 45+ 2 (1) 1 5 20 Hours 13 (10) 5 28 30 Hours 5 2 4
*Nine questionnaires left blank, one N/A
and three “Prefer not to Disclose”
**Denotes estimates of respondents

29 ©Stephen Vincent 2015
Using the data presented in this report the causes of absence due to
health related conditions have been plotted on a risk matrix (see figure
4.3.5); along with non-health related issues.
Upon completing the questionnaire 21 respondents, when asked which
conditions they were currently or had recently experienced, selected
“Stress/Depression/Anxiety” (see figure 4.3.1). However only 9 (42%)
subsequently listed it as the reason for missing a shift. Therefore there is a
high probability that employees will suffer from stress at work, yet the
impact on the absence problem is low.
Figure 4.3.5
Though only 42% of those respondents who stated they had suffered from
“Stress/Depression/Anxiety” at one point in the last 12 months
subsequently attributed stress as the cause leading to their time off, the
literature reviewed states that stress affects the human immune system
and leads to symptoms that are often similar with those of “Minor Illness”.
Therefore an employee taking time off work with “flu like” symptoms may
have been unaware that stress was the primary contributing factor.
A review of figure 4.2.2 clearly highlights that stress should be a key area
for concern. The author is concerned with the number of respondents
stating that they experience stress (93% of employees), have suffered from
stress (70% of employees), perceive their workload to be “unmanageable”
(93% of employees) and time limits for tasks to be “unachievable” (100% of
employees).

30 ©Stephen Vincent 2015
Responses of this nature suggest that this level of perceived stress can be
inferred as being directly responsible for a number of absences that have
been reported as “Minor Illnesses”.
This leads to “Stress/Depression/Anxiety” also being placed as high
probability and high impact if it is, as suggested by the data, a contributing
factor leading to incidents of “Minor Illness”.
This level of stress can be linked backed to the Human Function Curve,
Maslach Burnout Inventory and Picturing Workplace Stress models. The
CIPD (2013) state that three fifths of UK organisations, public and private
sector, have implemented a process to monitor workplace stress and have
set reduction targets.
Rhodes and Steers (1990) Process Model of Attendance (see figure 2.1.1-
node 5) suggests certain factors influence an individual’s motivation/need
to attend. Question g, Section Two, asked respondents to select factors
which they perceived to influence their motivation/necessity to attend.
Figure 4.3.6
*Respondents could select multiple factors
In response to this line of questioning, financial needs and the job market
were selected as the main two factors behind attendance, with “promotion
potential” once again ranked low. “Commitment to ACME” received 0
responses.
Question f, from Section Two, “How would you express your average
weekly shift pattern?” (see questionnaire - Appendix) returned no
responses.
0
5
10
15
20
25
S2/Qg: What factors would you select as the main reasons to attend a shift?*
Financial Promotion Managerial Pressure Commitment Job Market Work Ethic

31 ©Stephen Vincent 2015
4.4 Application of Absence Management Procedures:
In order to effectively manage absence recording and monitoring is vital.
Figure 4.4.1:
Section 3 Questions Respondents Results
Qa: When you return to work after an absence do you have formal contact with your line manager? (Filter Question)
27
Qb: When you return to work after an absence do you have informal contact with your line manager?
27
Qc: The absence management policies, such as return-to-work interviews, of ACME are professionally applied? (Only applicable to those who answered “Yes” to the previous filter question)
6
*Respondents selecting “Neither Agree nor Disagree” produces a neutral coefficient score of 0
When asked if respondents had formal contact with their line manager
upon returning to work after absence only 6 employees replied “Yes”, this
acted as a filter question (see figure 4.4.1, Qa). This meant that 21
respondents had received some form of informal contact upon their return
to work (see figure 4.4.1, Qb). Of the 6 respondents who passed through
the filter question 3 perceived that their return-to-work interviews were
conducted professionally (2 “Strongly Agree”, 1 “Agree”). However an
equal number (2 “Strongly Disagree”, 1 “Disagree”) experienced a
perception of unprofessionalism (see figure 4.4.1, Qc).
0
5
10
15
20
25
Yes No
0
5
10
15
20
Yes No
-3 -2 -1 0 1 2 3
Strongly Agree
Agree
Niether Agree nor Disagree*
Disagree
Strongly Disagree

32 ©Stephen Vincent 2015
4.5 Absence Management - A Managerial Perspective:
As stated by Truss et al. (2012) line managers have had to adopt HR
responsibilities, in order for this to be effective they require training in their
new duties.
Figure 4.5.1
Section 4 Questions Respondents Results
Qa: Have you received formal training in the company's absence management procedures?
4
Qb: Have you received formal training in the company's HR procedures?
4
Qc: Do you have support from your line manager when dealing with HR issues?
4
Only one manager claimed to have received training in absence
management procedures and HR policies (see figure 4.5.1, Qa and Qb).
Section Four, Qc, referred to support offered to ACME’s management
team, 1 SM and 3 DSMs, from the manager to whom they report. The
response was negative, with all four managers expressing that they
perceive no support when it comes to issues of HR (see figure 4.5.1, Qc).
It should be noted that the responses are subjective and based upon the
store team’s interpretation/perception of support. ACME UK LTD (2014) did
not allow the researcher to pose any questions to management above that
of store level.
0
1
2
3
4
Yes No
0
1
2
3
4
Yes No
0
1
2
3
4
5
Yes No

33 ©Stephen Vincent 2015
The responses suggest that too much responsibility is placed upon a single
manager, it is unlikely that one individual will be able to effectively apply
return-to-work interviews across 27 members of staff with 228 incidents of
absence. This would equate to a return-to-work interview being conducted
once every 0.6 days, on average.
Figure 4.5.2
Section 4 Questions Respondents Results
Qd: HR is a Key area of store management.
4
Qe: Return-to-work interviews are important.
4
Qf: I have time to conduct absence management procedures.
4
Qg: I would benefit from another absence management procedure.
4
*Respondents selecting “Neither Agree nor Disagree” produces a neutral coefficient score of 0
0 1 2 3 4 5
Strongly Agree
Agree
Neither Agree nor Disagree*
Disagree
Strongly Disagree
0 1 2 3 4 5
Strongly Agree
Agree
Neither Agree nor Disagree*
Disagree
Strongly Disagree
-5 -4 -3 -2 -1 0
Strongly Agree
Agree
Neither Agree nor Disagree*
Disagree
Strongly Disagree
-3 -2 -1 0 1 2 3
Strongly Agree
Agree
Neither Agree nor Disagree*
Disagree
Strongly Disagree

34 ©Stephen Vincent 2015
As highlighted by the research ACME’s management team consider HR
(4 “Strongly Agree”) a vital aspect of their role (see figure 4.5.2, Qd).
The CIPD (2013) state that return-to-work interviews are the most used
and effective tool to manage absence, with 86% of all organisations
utilising this method. Based upon the data there is no case to suggest HR
apathy; management, by consensus, support the return-to-work interview
procedure (see figure 4.5.2, Qe).
When asked to rate their level of agreement with the statement “I have time
to conduct absence management procedures” 4/4 managers responded
“Strongly Disagree” (see figure 4.5.2, Qf). This is represented in the
responses from the hourly contracted employees (see figure 4.4.1, Qa),
with only 6 confirming that they had formal contact with a manager upon
returning to work after a period of absence
In response to the option of having another absence management
procedure (see figure 4.5.2, Qg) managers were divided 50/50 on whether
this would be of benefit to them. This could be due to the fact that there is
no perceived time to conduct the current procedure, therefore an
alternative tool (see literature review - 2.3) would potentially have equally
little time afforded to its implementation.

35 ©Stephen Vincent 2015
5.0 Conclusions:
This report concludes that the absenteeism problem in store ACME is in
excess of the national statistics presented by the CIPD (2013).
Minor illness is cited as the most frequently occurring reason for
unauthorised absence, with stress suspected to be the major
contributor.
Employees on 20 hours contracts, with less than 3 years employment
aged between 18-25 take >40% more sick days than those 26+, on 30
hours contracts and with 3+ years of tenure.
The average number of incidents of health related absence per
employee at ACME is 8.44 days P/A, which is 2.34 days P/A higher
than the 6.1 national average. The total of 8.44 days puts the estimated
cost of health related absence at an average of £822.90 per employee,
P/A.
The total estimated cost to ACME is £22,218.30 P/A.
The problem is multifaceted with failings in several key areas with significant
impact.
Stress levels are perceived to be too high due to pressure of workload
and timescales - 93% of employees experience stress, 70% of
employees have suffered from stress, 93% of employees perceive their
workload to be “unmanageable” and 100% of employees perceive time
limits for completion of tasks to be “unachievable” (% of respondents).
There is inadequate training in HR and absence management
procedures among the store management team.
Too much responsibility is delegated to one in-store manager to
conduct effective HR procedures linked to absence management.
Management perceive that there is no support from senior
management on HR issues.
100% of managers stated that they did not have the time to conduct
absence management procedures effectively.
Although all 27 respondents received some form of return-to-work
contact, informal contact is ineffective in managing the problem. All the
literature reviewed states absence management procedures require
professional application in order to evaluate, measure and monitor any
issues in order to be effective.

36 ©Stephen Vincent 2015
6.0 Recommendations:
The S-A-F (Suitability-Acceptability-Feasibility) model has been applied to
the recommendations made in this section.
To follow up this report internal data should be analysed to score each
case of absence using the Bradford Factor in order to fully gauge the
disruption and potential higher cost of absence at ACME. (S-F).
Staff absence figures to be measured as part of the monthly KPIs at
Area Managers’ cost meetings. (S-A-F).
AMs to be monitored on HR procedure implementation, employee
absence to be measured as part of the monthly KPIs at Regional
Managers’ cost meeting. (S-A-F).
A target set in line with the CIPD’s (2013) suggested target of 2.3 days
per employee, P/A; would save ACME and estimated £16,163.55 P/A
(estimated national savings of £9,762,784.20). (S-A).
All managers are to attend centralised HR training at RDC, training to
be delivered by a HR professional. (S-A-F).
Return-to-Work interviews must be conducted by a trained manager,
every case of absence must be investigated and the causes recorded.
(S-A-F).
Workload and times for tasks require revisiting; retraining or
reengineering where required (time-motion studies should be
conducted). (S-A-F).
Employees should be offered the opportunity to increase the scope of
their duties in order to develop a more diverse role within the company,
increasing the propensity to attend. (S-F).
The lack of “Commitment to ACME” issue, raised by question g,
Section Two, requires a follow up study using the same methodology,
in order to investigate employee engagement, commitment and the
perception of the organisation as an employer. (S-A-F).

37 ©Stephen Vincent 2015
7.0 Bibliography:
Armstrong, M. (2009). Armstrong’s Handbook of Human Resource
Management Practice. 11th Ed. Kogan Page. London.
Bryman, A. Bell, E. (2003). Business Research Methods. Oxford. Oxford
University Press.
CIPD (2013). Absence Management: Annual Survey Report 2013. [Online]
Available: http://www.cipd.co.uk/binaries/absence-management_2013.pdf
(Accessed: 11 Nov 2014).
Gross, R. (1996). Psychology: The Science of Mind and Behaviour. 3rd Ed.
Hodder & Stoughton Educational. London.
Johnson, G. Whittington, R. Scholes, K, (2012). Fundamentals of Strategy.
2nd ed. Pearson Education Limited. Harlow.
Leatherbarrow, C. Fletcher, J. (2014). Introduction to Human Resource
Management: A Guide to HR in Practice. 3rd Ed. Chartered Institute of
Personnel Development. London.
ACME UK LTD (2014). Store Management Training Handbook. Version 1.
Saunders, M. Lewis, P. Thornhill, A. (2012), Research Methods for
Business Students. 6th ed. Pearson Education Limited. Harlow.
Torrington, D. Hall, L. Taylor, S. Atkinson, C. (2011). Human Resource
Management. 8th Ed. Pearson Education Limited. Harlow.
Truss, C. Mankin, D. Kelliher, C. (2012). Strategic Human Resource
Management. Oxford University Press. Oxford.
Young, V. Bhaumik, C. (2011). Health and Well-being at Work: A Survey of
Employees. [Online] Available at:
https://www.gov.uk/government/uploads/system/uploads/attachment_data/f
ile/214526/rrep751.pdf (Accessed: 11 Nov 2014).

38 ©Stephen Vincent 2015
8.0 Appendix:
Employee Well-being Survey 2015. 1.0 Overview:
Dear member of Team ACME,
The company values all employees who make ACME the success it is and as
an employer ACME strives to continually improve every aspect of store life. ACME
believes that a united, vibrant and healthy team enjoys their time at work; and
offers our customers the highest experience possible. This survey is your
opportunity to express your views on a range of work place situations and issues.
The survey is being conducted by a third party researcher, so all answers and views
expressed will remain 100% confidential. DO NOT INCLUDE NAME OR EMPLOYEE
NUMBER.
So please take this wonderful opportunity to help us improve your work place.
Feel free to be as honest as you see fit, remember the more you speak, the more
we listen and the more improvements can be made by working together.
Now that’s TEAM WORK!
Yours Sincerely
S Vincent – Canterbury Christ Church University
2.0 How to complete the survey:
This survey is simple.
There are no trick questions, so do not be scared, this is not being marked. Simply
select the answer that best represents you.
Example One:
Which gender do you consider yourself? Female
Male
Transgender
Simply circle the answer that best matches you.
Now that wasn’t so bad was it? Okay same principle for our next example.
With certain questions there will be a statement and you have to select to what
extent you agree or disagree with it. In order not to suggest any potential answers
the following question does not represent any of the questions in the survey.
Example Two:

39 ©Stephen Vincent 2015
I enjoy the smell of freshly cut grass? Strongly Agree
Agree
Neither Agree nor Disagree
Disagree
Strongly Disagree
So now we would know that the staff room should smell like a fresh spring
afternoon.
Now some questions you will be given the option to select more than one answer.
Example Three:
In the last week when have you been to the cinema?
Monday – Morning/afternoon Tuesday – Morning/afternoon
Wednesday – Morning/afternoon Thursday – Morning/afternoon
Friday – Morning/afternoon Saturday – Morning/afternoon
Sunday – Morning/afternoon
As you can tell we enjoy movies so, as in the example, you will be offered similar
questions relating to shifts and other job related elements, simply circle the answers
that relate to you.
3.0 What to do when you have finished:
When you have completed the survey just pop it into the envelope provided and
seal it tight. Once sealed post it into the collection box in the office labelled
“Employee Survey 2015”.
Questions begin over page.

40 ©Stephen Vincent 2015
Section One - Part One:
Please select one answer from the options given.
a. Which gender do you consider yourself? Female
Male
Transgender
b. Which age group do you fit into? 18-21
22-25
26-29
30-33
34-37
38-41
42-45
45+
c. What is your current hourly contract? 10 hours
20 hours
30 hours
40 hours
d. How long have you worked for ACME? Less than 1 year
1-2 years
3-4 years
5-6 years
7-8 years
8+ years
e. To the best of your knowledge how many days of absence have you taken in the
past 12 months? (If more than 10 please enter amount in the box).
None 1 2 3 4 5 6 7 8 9 10

41 ©Stephen Vincent 2015
Section One - Part Two:
To what extent do you agree or disagree with the statements below.
a. I haven shifts altered on a regular basis. Strongly Agree
Agree
Neither Agree nor Disagree
Disagree
Strongly Disagree
b. If your shifts are altered regularly how Very Acceptable
acceptable is this to you? Acceptable
Neither Acceptable nor Unacceptable
Unacceptable
Highly Unacceptable
c. I feel that my efforts at work are recognised. Strongly Agree
Agree
Neither Agree nor Disagree
Disagree
Strongly Disagree
d. I feel that there is the chance for progression. Strongly Agree
Agree
Neither Agree nor Disagree
Disagree
Strongly Disagree
e. I feel engaged as part of the team. Strongly Agree
Agree
Neither Agree nor Disagree
Disagree
Strongly Disagree
f. Management support me in my work. Strongly Agree
Agree
Neither Agree nor Disagree
Disagree
Strongly Disagree

42 ©Stephen Vincent 2015
g. I regularly experience stress at work. Strongly Agree
Agree
Neither Agree nor Disagree
Disagree
Strongly Disagree
h. Time limits for tasks are achievable. Strongly Agree
Agree
Neither Agree nor Disagree
Disagree
Strongly Disagree
i. I feel that my workload is manageable. Strongly Agree
Agree
Neither Agree nor Disagree
Disagree
Strongly Disagree
j. I am satisfied with my work life balance. Strongly Agree
Agree
Neither Agree nor Disagree
Disagree
Strongly Disagree
Section Two:
Please select all options that are relevant to you.
a. Which of these conditions have you experienced in the last 12 months or are
currently experiencing?
Musculoskeletal problems Minor illness Stress/Depression/Anxiety
Gastrointestinal problems Respiratory conditions Headaches and
migraines
Ear/ Nose/Throat/ Dental/Eye Heart/Blood pressure Other
Prefer not to disclose N/A
b. Which of these conditions have caused you to miss a scheduled shift in the past 12
months?
Musculoskeletal problems Minor illness Stress/Depression/Anxiety
Gastrointestinal problems Respiratory conditions Headaches and
migraines
Ear/ Nose/Throat/ Dental/Eye Heart/Blood pressure Other
43 ©Stephen Vincent 2015
Prefer not to disclose N/A
c. If a scheduled shift has been missed due to one or more of the above conditions
please state the most frequent condition/s and number of shifts missed below.
d. Which of these issues have caused you to miss a scheduled shift in the past 12
months?
Family member illness Lack of child care Personal transport problems
Public transport problems Work colleague problems Duvet day
Other Prefer not to disclose N/A
e. If a scheduled shift has been missed due to one or more of the above issues please
state the most frequent issue/s and number of shifts missed below.
f. How would you express your average weekly shift pattern? – Please circle all
appropriate options.
Monday – Open/close Tuesday – Open/close Wednesday – Open/close
Thursday – Open/close Friday – Open/close Saturday – Open/close
Sunday – Open/close
g. What factors would you select as the main reasons to attend a shift?
Financial Promotion Potential Managerial
Pressure Commitment to ACME Lack of Other Jobs Work Ethic

44 ©Stephen Vincent 2015
Section Three:
Select the answers that you feel most appropriate.
a. When you return to work after an absence do you have formal contact with your
line manager?
Yes
No
N/A
If NO please answer question 3.b if YES please answer question 3.c
b. When you return to work after an absence do you have informal contact with
your line manager?
Yes
No
c. The absence management policies, such as
return-to-work interviews, of ACME are
professionally applied? Strongly Agree
Agree
Neither Agree nor Disagree
Disagree
Strongly Disagree
Section Four:
This section applies to DSMs, TSMs and SMs only.
a. Have you received formal training relating to the company’s absence management
procedures?
Yes
No
b. Have you received formal training in the companies HR procedures?
Yes
No
If YES please state which areas of HR.

45 ©Stephen Vincent 2015
c. Do you have support from your line manager when dealing with HR issues?
Yes
No
d. HR is a key area of store management. Strongly Agree
Agree
Neither Agree nor Disagree
Disagree
Strongly Disagree
e. Return-to-work interviews are important. Strongly Agree
Agree
Neither Agree nor Disagree
Disagree
Strongly Disagree
f. I have time to conduct absence management Strongly Agree
Procedures. Agree
Neither Agree nor Disagree
Disagree
Strongly Disagree
g. I would benefit from another Strongly Agree
Procedure. Agree
Neither Agree nor Disagree
Disagree
Strongly Disagree
END.