Embed Size (px)
Citation preview

STREET SCALE MODELLING OF NANOPARTICLES USING A SIMPLIFIED
APPROACH AND AN OPERATIOAL MODEL
7TH INT. CONF. ON AIR QUALITY – SCIENCE & APPLICATION, ISTANBUL, 24-27 MARCH 09
PRASHANT KUMAR
MATTHIAS KETZEL
ALAN ROBINS
REX BRITTER

POINTS FOR DISCUSSION
BACKGROUND
MEASUREMENTS
Application of a DMS500 for street canyon measurements
MODELLING
Formulation of a simple dispersion model (a modified Box model)
CFD (FLUENT) simulations, and OSPM
Comparison of measurements with CFD, OSPM and Box models
SUMMARY AND CONCLUSIONS
ACKNOWLEDGEMENTS
PRASHANT KUMAR UAQ 2009, ISTANBUL, TURKEY, 24-27 MARCH 09 2

BACKGROUND
Stringent emissions: particle mass emissions (↓), number (↑)
Current regulations address atmospheric particulate matter as PM10, PM2.5 mass concentration; not particle number concentration (PNC)
Ultrafine particles (< 100 nm); main component of ambient particles by number, produced mainly by vehicles, contribute most to PNC but little to PMC; these
are more toxic than coarse particles per unit mass (Brugge et al., 2007)
Progress hampered by lack of proven methods and instrumentation to measure PNCs
1 of 1
This work addresses:
Application of a fast response DMS500, its suitability and best operating conditions for the measurements of PNDs in street canyons
To apply an operational (OSPM), a CFD (using FLUENT) and the modified Box model to one of our previously studied street canyon and to compare the model predictions with measured PNCs
To investigate the effect of different sizes of emission sources on the distribution of the mean PNCs in CFD simulations
To compare measured and modelled vertical PNC profilesPRASHANT KUMAR UAQ 2009, ISTANBUL, TURKEY, 24-27 MARCH 09 3

MEASUREMENTS
Measurements: Street canyon (Pembroke Street, Cambridge)
Instrument: Differential Mobility Spectrometer (DMS500) Response: 10 Hz, real time continuous (used 0.5 Hz) Sampling flow rate: 8.0 lpm at 250 mb for 5-1000 nm
2.5 lpm at 160 mb for 5-2738 nm
Movie: Diesel drive by (Courtesy: Cambustion Ltd.)
1 of 3
PRASHANT KUMAR UAQ 2009, ISTANBUL, TURKEY, 24-27 MARCH 09 4

APPLICATION OF DMS500
Check the sensitivity level of the instrument
Identify the suitable operating conditions (mainly sampling frequency) of the instrument which maximised its utility
2 of 3MEASUREMENTS
0.E+00
2.E+04
4.E+04
6.E+04
8.E+04
1.E+05
1 10 100 1000D p (nm)
0.1 s Av Noise (10 Hz)1 s Av Noise (1 Hz)10 s Av Noise (0.1 Hz)0.1 s Av Roadside background (10 Hz)0.1 s Roadside (10 Hz)
0.E+00
2.E+04
4.E+04
6.E+04
8.E+04
1.E+05
1 10 100 1000
dN/d
logD
p (#
cm
–3)
0.8
0.6
0.4
0.2
0.0
1.0 105
Sensitivity of the DMS500. Both typical roadside and background PNDs were measured at the fastest (10 Hz) sampling frequency.
Smaller (1 Hz or lower) rather than maximal (10 Hz) sampling frequencies found appropriate, unless experiments relied critically upon fast response data
Suggested sampling frequencies used in later experiments (Kumar et al., 2008a-c, 2009a-c):
measured PNDs well above instrument’s noise level
reduced size of data files to manageable proportions
PRASHANT KUMAR UAQ 2009, ISTANBUL, TURKEY, 24-27 MARCH 09 5
See Kumar et al. (2009d) for details

STREET CANYON 3 of 3MEASUREMENTS
PRASHANT KUMAR UAQ 2009, ISTANBUL, TURKEY, 24-27 MARCH 09 6
4-way solenoid switching system
Pembroke Street, Cambridge
Pseudo-simultaneous measurements Measurements at four heights z/H = 0.09, 0.19, 0.4
and 0.64 Lengths of sampling tubes: 5.17, 5.55, 8.9 and 13.4 m Switching time: 60 s; Sampling frequency: 0.5 Hz Size range: 5–2738 nm (range considered here 10-
300 nm) Sampling tunes i.d.: 7.85 mm Cross-canyon winds (NW)
See Kumar et al. (2008b) for details

br
x
n
xjix
CzkWUb
TEC
11
1,
exp
THE MODIFIED BOX MODEL
Vertical Concentration profile
Empirical constant for exchange velocity 1% of Ur
(Bentham and Britter, 2005)
1 of 5
when z = max (z , h0), Ur = max (Ur, Ur,crit) and k1 = 0.11 m–1
PRASHANT KUMAR UAQ 2009, ISTANBUL, TURKEY, 24-27 MARCH 09 7
MODELLING
C and Cb are the predicted and background PNCs (# cm-3)
Ur and Ur,crit are in cm s-1, k1 is exponential decay coefficient in cm-1
b1 = σ0 = 11 dimensionless parameter (Rajaratnam, 1976)
Ex,i-j (PNEF # veh-1cm-1 in any particle size range of any vehicle class x )
Tx = veh s-1 of a certain class
h0 (= 2 m) is assumed initial dispersion height close to road level
W (width in cm); z (vertical height in cm above road level)
04/1

CFD SIMULATIONS – COMPUTATIONAL DOMAIN
CFD code: FLUENT
Standard k- model
2D domain; Ht. = 6H
Inlet Ur profile: constant
53824 grid cells, expansion factor 1.10 near walls
TKE profile k = IUin2 (I = 0.1)
Turbulent dissipation profile
115.175.0 zkCz
Constant discharge emission sources of 4 various sizes used
24 set of simulations were made for 24 h selected data
ρ and Ta changed every hour
with Cμ = 0.09 and κ = 0.40
2 of 5
PRASHANT KUMAR UAQ 2009, ISTANBUL, TURKEY, 24-27 MARCH 09 8
MODELLING
Vortex
0.20 m
Ws
Input Length (5H) Output Length (5H) W
Symmetry
H
Inlet velocity profile
Shear Layer
Hs
Roof (downstream) Roof (upstream)
Side Wall Side Wall
Outflow
Winds from NW
Sampling points

CFD SIMULATIONS – EFFECT OF SOURCE SIZE 3 of 5
(a) (b)
(d)(c)
Sa (0.53 x 0.11 m)
Sb (5.08 x 1.98 m)
Sc (1 x 0.75 m)
Sd (2 x 1.5 m)
Shows the advection of PNCs from the sources to the leeward side of the canyon; selection of the source size is critical to determine PNC distributions
In case of smallest source Sa largest concentrations in the bottom corner of the canyon and the region near to the street wall up to 0.50 m in the leeward side
In other cases with larger source area, particles first accumulate on the leeward side corner of the source, where concentrations are largest, and then advected upwards in the leeward side by the canyon vortex.
PRASHANT KUMAR UAQ 2009, ISTANBUL, TURKEY, 24-27 MARCH 09 9
MODELLING
Wind

COMPARISON OF VERTICAL PNC PROFILES 4 of 5
Important aspects shape and magnitude; General trend – conc. (↓) with (↑) height
Box and OSPM assume constant PNCs up to 2 m and then follows general trend, but CFD profiles does not show this decrease, suggesting that it does not predict enough mixing in region of leeward wall
Measurements showed positive concentration gradient; reasons identified were: dry deposition, recirculating vortex, trailing vortices (Kumar et al., 2008b)
This gradient was not shown by Box and OSPM, but reproduced by CFD suggesting that size of source which is closest to vehicle dimensions may be a better representation for setting up a source in CFD simulations
See Kumar et al. (2009c) for details
PRASHANT KUMAR UAQ 2009, ISTANBUL, TURKEY, 24-27 MARCH 09 10
MODELLING
0.0
0.3
0.6
0.9
1.2
1.5
0 20 40 60 80Normalised concentration (C * )
z/H
OSPMCFD_ScBox
0.0
0.3
0.6
0.9
1.2
1.5
0 20 40 60 80
z/H
MeasuredOSPMCFD_ScBox
0.0
0.3
0.6
0.9
1.2
1.5
0 20 40 60 80Normalised concentration (C * )
(a) Leeward (b) Windward

COMPARISON OF MEASURED AND MODELLED PNCs 5 of 5
0.0E+00
4.0E+04
8.0E+04
1.2E+05
1.6E+05
0.0E+00 4.0E+04 8.0E+04 1.2E+05 1.6E+05
0.0E+00
4.0E+04
8.0E+04
1.2E+05
1.6E+05
0.0E+00 4.0E+04 8.0E+04 1.2E+05 1.6E+05
0.0E+00
4.0E+04
8.0E+04
1.2E+05
1.6E+05
0.0E+00 4.0E+04 8.0E+04 1.2E+05 1.6E+050.0E+00
4.0E+04
8.0E+04
1.2E+05
1.6E+05
0.0E+00 4.0E+04 8.0E+04 1.2E+05 1.6E+05
OSPM
CFD_Sc
Box
0
0.4
0.8
1.2
1.6
0 0.4 0.8 1.2 1.6
0
0.4
0.8
1.2
1.6
0 0.4 0.8 1.2 1.6
0
0.4
0.8
1.2
1.6
0 0.4 0.8 1.2 1.6
0
0.4
0.8
1.2
1.6
0 0.4 0.8 1.2 1.6
105
105
(a) (b)
(d)(c)
z/H = 0.40 z/H = 0.64
z/H = 0.09 z/H = 0.19
0
0.4
0.8
1.2
1.6
0 0.4 0.8 1.2 1.6
Measured N 10-300 (# cm-3)
0
0.4
0.8
1.2
1.6
0 0.4 0.8 1.2 1.6
Mo
del
led
N1
0-3
00
(# c
m-3)
The measured PNCs at different heights compared well within a factor of 2-3 to those modelled using OSPM, Box model and CFD simulations, suggesting that if model inputs are given carefully, even the simplified approach can predict the concentrations as well as more complex models.
See Kumar et al. (2009c) for details
PRASHANT KUMAR UAQ 2009, ISTANBUL, TURKEY, 24-27 MARCH 09 11
MODELLING

SUMMARY AND CONCLUSIONS
An advanced particle spectrometer was successfully applied to measure PNDs and PNCs in street canyons and was found to be quite useful when fast response nature of an instrument is essential.
Model comparison suggested that If model inputs are given carefully, a simplified approach can predict the PNCs to accuracy comparable with that obtained using more complex models.
Study for the selection of the source size in CFD simulations showed that a source size scaling the vehicle dimension, not the size of the exhaust pipe, better represented the measured PNC profiles.
The PNC differences were largest between idealised (CFD and Box) and operational (OSPM) models at upper sampling heights; these were attributed to weaker exchange of clean air between street and roof-above in the upper part of canyon in case of idealised models.
1 of 1
PRASHANT KUMAR UAQ 2009, ISTANBUL, TURKEY, 24-27 MARCH 09 12
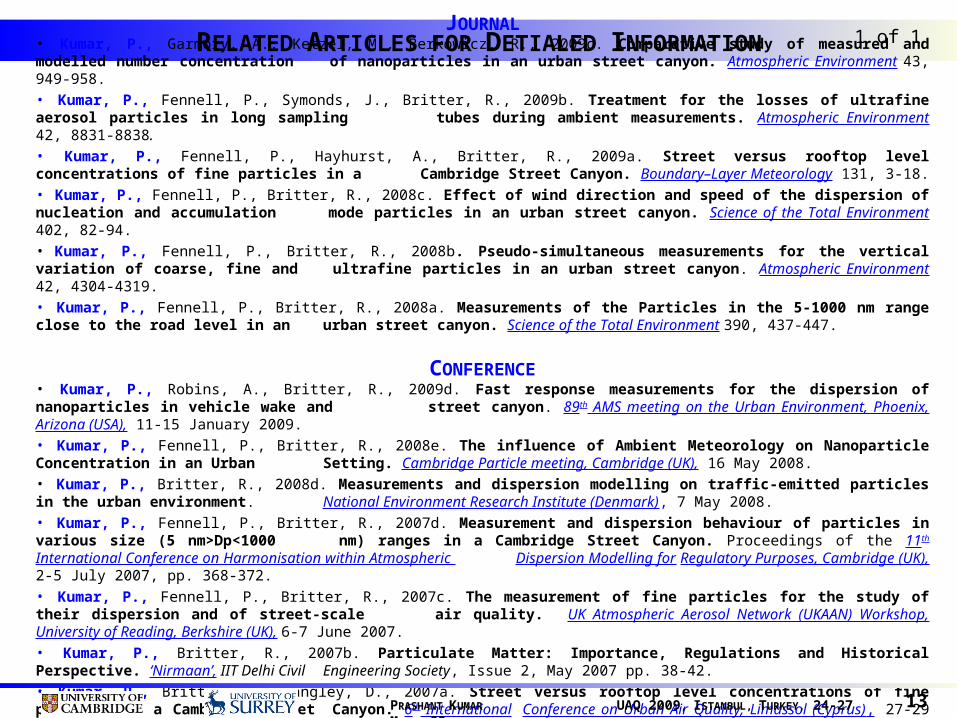
RELATED ARTICLES FOR DETIALED INFORMATION 1 of 1
JOURNAL• Kumar, P., Garmory, A., Ketzel, M., Berkowicz, R., 2009c. Comparative study of measured and modelled number concentration
of nanoparticles in an urban street canyon. Atmospheric Environment 43, 949-958.• Kumar, P., Fennell, P., Symonds, J., Britter, R., 2009b. Treatment for the losses of ultrafine aerosol particles in long sampling
tubes during ambient measurements. Atmospheric Environment 42, 8831-8838.• Kumar, P., Fennell, P., Hayhurst, A., Britter, R., 2009a. Street versus rooftop level concentrations of fine particles in a Cambridge Street Canyon. Boundary–Layer Meteorology 131, 3-18. • Kumar, P., Fennell, P., Britter, R., 2008c. Effect of wind direction and speed of the dispersion of nucleation and accumulation
mode particles in an urban street canyon. Science of the Total Environment 402, 82-94.• Kumar, P., Fennell, P., Britter, R., 2008b. Pseudo-simultaneous measurements for the vertical variation of coarse, fine and
ultrafine particles in an urban street canyon. Atmospheric Environment 42, 4304-4319.• Kumar, P., Fennell, P., Britter, R., 2008a. Measurements of the Particles in the 5-1000 nm range close to the road level in an
urban street canyon. Science of the Total Environment 390, 437-447.
CONFERENCE• Kumar, P., Robins, A., Britter, R., 2009d. Fast response measurements for the dispersion of nanoparticles in vehicle wake and
street canyon. 89th AMS meeting on the Urban Environment, Phoenix, Arizona (USA), 11-15 January 2009.• Kumar, P., Fennell, P., Britter, R., 2008e. The influence of Ambient Meteorology on Nanoparticle Concentration in an Urban
Setting. Cambridge Particle meeting, Cambridge (UK), 16 May 2008.• Kumar, P., Britter, R., 2008d. Measurements and dispersion modelling on traffic-emitted particles in the urban environment .
National Environment Research Institute (Denmark), 7 May 2008. • Kumar, P., Fennell, P., Britter, R., 2007d. Measurement and dispersion behaviour of particles in various size (5 nm>Dp<1000
nm) ranges in a Cambridge Street Canyon. Proceedings of the 11th International Conference on Harmonisation within Atmospheric Dispersion Modelling for Regulatory Purposes, Cambridge (UK), 2-5 July 2007, pp. 368-372.
• Kumar, P., Fennell, P., Britter, R., 2007c. The measurement of fine particles for the study of their dispersion and of street-scale air quality. UK Atmospheric Aerosol Network (UKAAN) Workshop, University of Reading, Berkshire (UK), 6-7 June 2007.
• Kumar, P., Britter, R., 2007b. Particulate Matter: Importance, Regulations and Historical Perspective. ‘Nirmaan’, IIT Delhi Civil Engineering Society, Issue 2, May 2007 pp. 38-42.
• Kumar, P., Britter, R., Langley, D., 2007a. Street versus rooftop level concentrations of fine particles in a Cambridge Street Canyon. 6th International Conference on Urban Air Quality, Limassol (Cyprus), 27-29 March 2007, pp. 135-138.
PRASHANT KUMAR UAQ 2009, ISTANBUL, TURKEY, 24-27 MARCH 09 13

ACKNOWLEDGEMENTS
World Meteorological Organisation – bursary award
Cambridge Nehru Scholarship and ORS Award – PhD funding
Dr. Paul Fennell (Imperial College, London) – helping in experiments
1 of 1
PRASHANT KUMAR UAQ 2009, ISTANBUL, TURKEY, 24-27 MARCH 09 14

THANK YOU
CONTACT
PRASHANT KUMAR
Email: [email protected]
Webpage: http://people.pwf.cam.ac.uk/pp286

CFD SIMULATIONS – EFFECT OF SOURCE SIZE Extra slide
See Kumar et al. (2009c) for details
PRASHANT KUMAR UAQ 2009, ISTANBUL, TURKEY, 24-27 MARCH 09 16
MODELLING
0.0
0.3
0.6
0.9
1.2
1.5
0 20 40 60 80
Normalised concentration (C * )
0.0
0.3
0.6
0.9
1.2
1.5
0 20 40 60 80
z/H
CFD_SaCFD_SbCFD_ScCFD_Sd
At W = 0.40 m from leeward side wall
0.0
0.3
0.6
0.9
1.2
1.5
0 20 40 60 80
CFD_SaCFD_SbCFD_ScCFD_Sd
At W = 0.40 m from windward side wall
0.0
0.3
0.6
0.9
1.2
1.5
0 20 40 60 80
z/H
At W = 1.50 m from leeward side wall
0.0
0.3
0.6
0.9
1.2
1.5
0 20 40 60 80Normalised concentration (C*)
z/H
At W = 2.50 m from leeward side wall
0.0
0.3
0.6
0.9
1.2
1.5
0 20 40 60 80
At W = 1.50 m from windward side wall
0.0
0.3
0.6
0.9
1.2
1.5
0 20 40 60 80Normalised concentration (C * )
At W = 2.50 m from windward side wall0.0
0.3
0.6
0.9
1.2
1.5
0 20 40 60 80
Nor
mal
ised
hei
ght
(z/H
)
At W = 2.50 m from windward side wall
(a) (b)
(e) (f)
(c) (d)
At w/H = 0.034 (0.40 m) from leeward side wall
At w/H = 0.13 (1.50 m) from leeward side wall
At w/H = 0.034 from windward side wall
At w/H = 0.22 from windward side wall
At w/H = 0.13 from windward side wall
At w/H = 0.22 (2.50 m) from leeward side wall
Considerably larger PNC variations in leeward side, but modest on windward side ( 0.50 m), while changing size of the source
PNCs increases from road level to a certain height; the height at which this maximum occurs could be related to the height of various sources used
The largest sources shows similar profile suggesting that effect of source size is minimal after a certain cross-sectional area
Unlike leeward side, concentration profiles in windward side shows similar trend with consistent increase in concentrations with increasing distance from windward wall