Embed Size (px)
Citation preview

1
U.S. Department of Health and Human Services Food and Drug Administration Center for Drug Evaluation and Research Office of Translational Sciences Office of Biostatistics
S T A T I S T I C A L R E V I E W A N D E VA L U A T I O N CLINICAL STUDIES
NDA #:
205,489
Drug Name: Cotempla XR-ODT (Methylphenidate extended release ODT) 10, 20, and 30 mg tablets
Indication(s): Attention-Deficit Hyperactivity Disorder (ADHD)
Applicant: NEOS Therapeutics
Dates: Submitted: 01/09/2015 PDUFA: 11/09/2015
Review Priority: Standard
Biometrics Division: Division of Biometrics I
Statistical Reviewer: Thomas Birkner, Ph.D.
Concurring Reviewers: Peiling Yang, Ph.D. (Team leader) H.M. James Hung, Ph.D. (Division director)
Medical Division: Division of Psychiatry Products
Clinical Team: Glenn Mannheim, M.D. Jing Zhang, M.D.
Project Manager: William Bender, Pharm.D.
Keywords: Analysis of covariance, baseline imbalance, randomization
Reference ID: 3829245
2
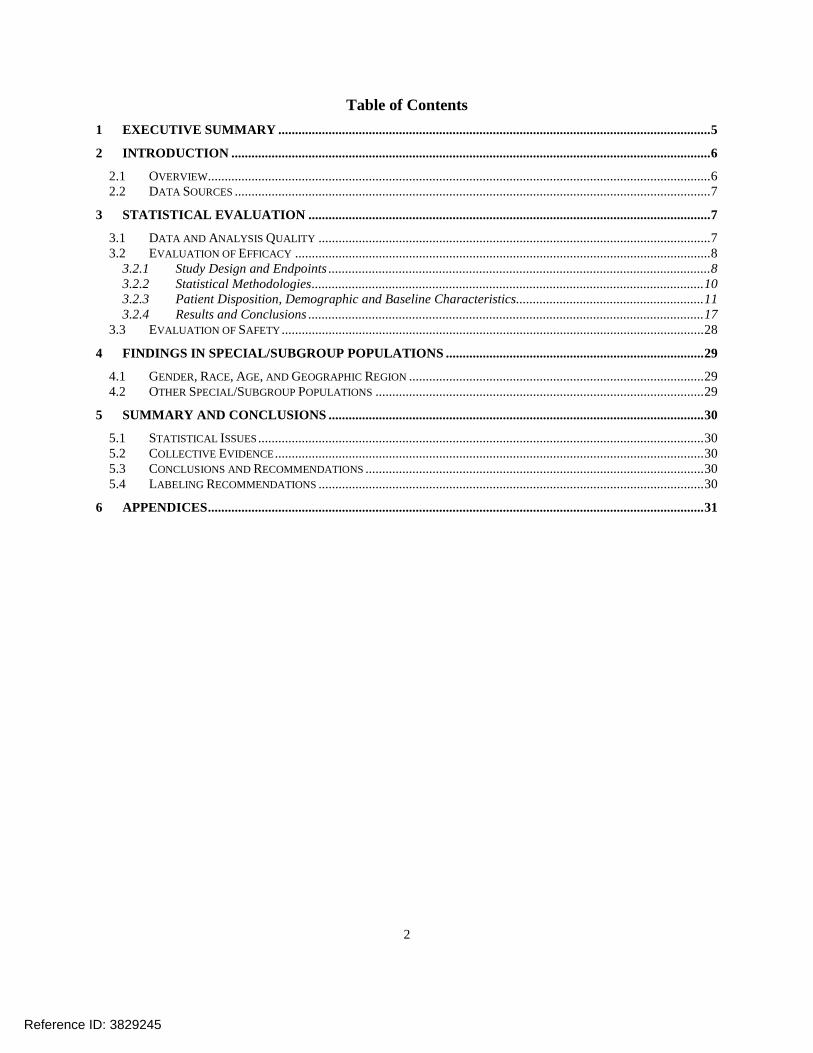
Table of Contents 1 EXECUTIVE SUMMARY ................................................................................................................................. 5
2 INTRODUCTION ............................................................................................................................................... 6 2.1 OVERVIEW ...................................................................................................................................................... 6 2.2 DATA SOURCES .............................................................................................................................................. 7
3 STATISTICAL EVALUATION ........................................................................................................................ 7 3.1 DATA AND ANALYSIS QUALITY ..................................................................................................................... 7 3.2 EVALUATION OF EFFICACY ............................................................................................................................ 8
3.2.1 Study Design and Endpoints .................................................................................................................. 8 3.2.2 Statistical Methodologies ..................................................................................................................... 10 3.2.3 Patient Disposition, Demographic and Baseline Characteristics........................................................ 11 3.2.4 Results and Conclusions ...................................................................................................................... 17
3.3 EVALUATION OF SAFETY .............................................................................................................................. 28
4 FINDINGS IN SPECIAL/SUBGROUP POPULATIONS ............................................................................. 29 4.1 GENDER, RACE, AGE, AND GEOGRAPHIC REGION ........................................................................................ 29 4.2 OTHER SPECIAL/SUBGROUP POPULATIONS .................................................................................................. 29
5 SUMMARY AND CONCLUSIONS ................................................................................................................ 30 5.1 STATISTICAL ISSUES ..................................................................................................................................... 30 5.2 COLLECTIVE EVIDENCE ................................................................................................................................ 30 5.3 CONCLUSIONS AND RECOMMENDATIONS ..................................................................................................... 30 5.4 LABELING RECOMMENDATIONS ................................................................................................................... 30
6 APPENDICES .................................................................................................................................................... 31
Reference ID: 3829245

3
LIST OF TABLES Table 1. Study Included in Analysis ............................................................................................................. 7 Table 2. Study Schedule ............................................................................................................................... 9 Table 3. Site and ADHD Classification Summaries ................................................................................... 12 Table 4. Disposition - Enrolled Population ................................................................................................. 13 Table 5. Demographic and Baseline Characteristics - FAS ........................................................................ 15 Table 6. Pre-dose SKAMP Combined Scores - FAS .................................................................................. 16 Table 7. Pre-dose SKAMP Combined Scores by Site – FAS ..................................................................... 16 Table 8. Optimal Doses Used During the Double-Blind Phase .................................................................. 17 Table 9. Visit 8 Pre-dose SKAMP Scores by Optimized Dose .................................................................. 17 Table 10. Primary Analysis Results for the SKAMP-Combined Scores Averaged Over the Classroom Testing Day ................................................................................................................................................. 18 Table 11. Sensitivity Analysis for Primary Endpoint ................................................................................. 20 Table 12. Least Squares Mean SKAMP-Combined Scores at All Time Points - FAS ............................... 21 Table 13. PERMP Efficacy Assessments - FAS ......................................................................................... 23 Table 14. Tests for Normality for SKAMP Mean Residuals ...................................................................... 24 Table 15. Visit 8 Post-dose SKAMP Raw Mean Scores by Optimized Dose – FAS ................................. 26 Table 16. Baseline (Screening) Weight in kg vs. Optimized Dose - FAS .................................................. 27 Table 17. Baseline (Screening) BMI vs. Optimized Dose - FAS ............................................................... 28
Reference ID: 3829245

4
LIST OF FIGURES Figure 1. Study Populations ........................................................................................................................ 14 Figure 2. Mean Profiles for SKAMP-Combined Score During the Classroom Testing Day - FAS ........... 22 Figure 3. Studentized Residuals for SKAMP-Combined Mean Scores ...................................................... 24 Figure 4. Visit 8 SKAMP-Attention Raw Mean Scores - FAS ................................................................... 25 Figure 5. Visit 8 SKAMP-Deportment Raw Mean Scores - FAS ............................................................... 25 Figure 6. Baseline (Screening) Weight in kg vs. Optimized Dose - FAS ................................................... 27 Figure 7. Baseline (Screening) BMI vs. Optimized Dose - FAS ................................................................ 28
Reference ID: 3829245

5
1 EXECUTIVE SUMMARY This 505(b)(2) application contains one efficacy trial: Study NT0102.1004. This trial provides
strong statistical evidence that Methylphenidate XR-ODT is superior to placebo in the treatment
of ADHD in the pediatric population (6-12 years) on the endpoints studied. The sponsor’s results
for both the primary (Average of SKAMP-Combined Scores over duration of the classroom day)
as well as for the key secondary (onset and duration) outcome measure were confirmed by this
reviewer. The mean over the seven post-dose measurements of the SKAMP-Combined Score
during the full day laboratory classroom session is estimated to be 11 points lower (i.e., better)
for the MPH XR-ODT treated group compared to the placebo group. The effect of this extended
release product is estimated to last from hour 1 to hour 12, with the difference between the
groups being greatest in the first half of the day and narrowing towards the later part of the
testing session (Figure 2).
Reference ID: 3829245

6
2 INTRODUCTION Methylphenidate XR-ODT (MPH XR-ODT; proposed trade name Cotempla XR-ODT) is an
extended release formulation of methylphenidate hydrochloride (HCl) as orally disintegrating
tablet (ODT) for the treatment of ADHD. Neos, the sponsor, is requesting approval for three
strengths: 10 mg, 20 mg and 30 mg. These three tablet strengths would allow dosing up to 60 mg
by a combination of one or two tablets. METADATE CD (methylphenidate hydrochloride USP)
Extended-Release Capsules, UCB Inc., NDA 21,259 is the reference listed drug for this
505(b)(2) New Drug Application. However, the sponsor based its draft labeling text on
QUILLIVANT XR, since it is the most recently approved methylphenidate product. The
505(b)(2) approval pathway relies on FDA’s previous finding of safety and efficacy of the
reference listed drug (in this case: METADATE CD). Neos conducted three
Bioavailability/Bioequivalence (BA/BE) studies (NT0102.1001, NT0102.1002, and
NT0102.1003) and one efficacy and safety study (NT0102.1004) to provide a scientific bridge
between MPH XR-ODT (the new product) and METADATE CD (the reference product). Only
Study NT0102.1004 is subject of this review.
2.1 Overview Study NT0102.1004 (hereafter referred to as Study 1004) is a randomized, multicenter, double-
blind, placebo-controlled, parallel group study of MPH XR-ODT (equivalent to 20, 30, 40, or 60
mg of methylphenidate hydrochloride) in children (ages 6-12 years) with attention-deficit
hyperactivity disorder (ADHD). MPH XR-ODT is also referred to as NT0102 in this review.
The primary objective of this study was to determine the efficacy, safety, and tolerability of
MPH XR-ODT in children with ADHD in a laboratory classroom setting. Efficacy measures
include the Swanson, Kotkin, Agler, M-Flynn, and Pelham (SKAMP) and the Permanent Product
Measure of Performance (PERMP). The study was initiated on 07/17/2013 and completed on
05/04/2014. The study report date is 12/03/2014.
Reference ID: 3829245

7
Table 1. Study Included in Analysis Study Number
Phase and Design
Treatment Period
# of Subjects per Arm
Study Population
NT0102.1004 Phase 3 Randomized, multicenter, double-blind, placebo-controlled, parallel group study
4-week dose optimization, 1 week dose stabilization, 1 week randomized treatment period
Placebo: 39 NT0102: 43
Children 6-12 years of age with ADHD
2.2 Data Sources Original Submission: \\CDSESUB1\evsprod\NDA205489\0000
Study Report: \\CDSESUB1\evsprod\NDA205489\0000\m5\53-clin-stud-rep\535-rep-
effic-safety-stud\treatment-\5351-stud-rep-contr\nt01021004
Response to 1st information request (analysis datasets, SAS code):
\\CDSESUB1\evsprod\NDA205489\0004
\\CDSESUB1\evsprod\NDA205489\0006 (SAS code, datasets)
Response to 2nd information request (randomization):
\\CDSESUB1\evsprod\NDA205489\0005
3 STATISTICAL EVALUATION 3.1 Data and Analysis Quality The original submission did contain legacy converted SDTM datasets, but no analysis datasets
and no SAS programs. Those items were provided by the sponsor per FDA request. This
reviewer replicated the sponsor’s primary ANCOVA analysis for the SKAMP-Combined scores
as well as for the SKAMP components of Attention and Deportment starting with the legacy
converted SDTM dataset “QS” (Questionnaire). This reviewer could also replicate the key
secondary outcomes of onset and duration of MPH XR-ODT (defined as the first and last time
Reference ID: 3829245

8
points, during which active drug consecutively separates from placebo on the SKAMP-
Combined scores) based on the same SDTM dataset.
Randomization was stratified by site. Sites 1 and 3 randomized subjects in several “batches”
utilizing a new randomization list for each batch (two and three “batches” respectively). For
information on randomization and blinding see the appendix to this review and page 23 of the
study report.
The sponsor performed audits of the two investigator sites with the highest number of enrolled
subjects, Dr. Childress’s and Dr. Cutler’s sites. The audit reports were not included with the
original submission, but were provided per request and did not contain any critical findings. FDA
inspections of Dr. Childress’s and Dr. Cutler’s sites did not uncover any major issues.
The study protocol was amended twice (June, 6 2013 and October, 15 2013). The following
Statistics relevant changes were implemented:
• A clarification that the statistical analysis would be conducted by treatment, not by
treatment received.
• A modification to the statistical methods stating that only one statistical analysis
approach (i.e., ANCOVA) will be used based on feedback from the Food and Drug
Administration (FDA).
3.2 Evaluation of Efficacy
3.2.1 Study Design and Endpoints All subjects were required to meet the DSM-IV-TR criteria for ADHD and all subtypes of
ADHD were allowed in this study. However, the majority of subjects were diagnosed with
predominantly hyperactive-impulsive or combined subtypes of ADHD. At screening, children
were on a stable dose of 20 mg/day to 60 mg/day of Metadate CD or equivalent dose of another
immediate release (IR) or extended release (XR) MPH medication.
There were 5 periods in this study: a screening period (approximately 4 weeks), a washout period
(3-7 days), an open-label stepwise dose optimization period (4 weeks), a dose stabilization
Reference ID: 3829245

9
period (1 week), and a double-blind parallel group treatment period, culminating in a full-day
laboratory classroom assessment (1 week). The overall study schedule is displayed in Table 2.
After the washout period, subjects received the study drug once daily for 4 weeks during the
dose optimization period. At the end of each week, subjects were evaluated for safety,
tolerability, and efficacy and a decision was made to increase, decrease, or maintain the previous
week’s dose (note that only 1 dose decrease was permitted during the optimization phase). After
completion of the 4-week dose optimization period, the optimized dose of the study drug was
selected, and subjects stayed on that dose for one week (dose stabilization period). On the last
day of the dose stabilization period, which was also the Laboratory Classroom Practice Day
(Visit 7), subjects were randomly assigned (1:1) to one of two treatments for the 1-week, double-
blind, parallel-group treatment period: either MPH XR-ODT at the optimized daily dose or the
matching placebo treatment. Subjects took their assigned treatment once daily for 1 week leading
up to the full length classroom testing day. Table 2. Study Schedule
Study Periods
Period Duration
Screening Washout a Dose
Optimization Dose
Stabilization Practice Session
Double- Blind
Treatment Classroom
Session Final Visit
Follow-up Call
Up to 4 weeks 1 week 4 weeks 1 week 1 day 6 days 1 day 1 day 1 day
Study Days -34 to -7 -6 to -0 1-28 29-34 35 36-41 42 43** 75
Visit(s)* 1 2-5 6 7b 8c 9 Follow-up
*Note: Visits 3 through 6 include a window of ± 2 days **Note: Final visit is Day 43 (+2 days) a Washout of at least 3 days (up to 1 week) b Visit 7 is the “practice” classroom testing day. c Visit 8 is the “actual” classroom testing day. (Source: Study Report p. 17) Subjects were assessed at baseline (pre-dose), and 1, 3, 5, 7, 10, 12, and 13 hours post-dose on
the testing day (Visit 8). The primary efficacy objective was to evaluate the efficacy of MPH
XR-ODT compared to placebo as measured by the SKAMP-Combined post-dose score averaged
across the test day for active drug versus placebo. The treatment average score is defined as the
mean daily average across the 7 post-dose measurements.
The key secondary objectives were the following:
Reference ID: 3829245

10
• Evaluation of the onset of effect (defined as the first time point at which MPH XR-ODT
separates from placebo on the SKAMP-Combined scores).
• Evaluation of the duration of effect (defined as the last consecutive time point at which MPH
XR-ODT separates from placebo on the SKAMP-Combined scores).
3.2.2 Statistical Methodologies
The primary statistical analyses were conducted on the Full Analysis Set (FAS) defined as all
subjects randomized who have at least one post-dose SKAMP-Combined treatment assessment
during the classroom testing session at Visit 8.
Primary Efficacy Endpoint
The primary efficacy endpoint was derived from the SKAMP-Combined score (total score of all
13 items). The SKAMP-Combined score is based on a 0 to 78 point scale for which a lower
score indicates less symptomatology (i.e., is better). The SKAMP is a rating scale that
specifically measures the classroom manifestations of ADHD. The SKAMP ratings were
completed for all subjects at baseline (pre-dose) and at 1, 3, 5, 7, 10, 12, and 13 hours post-dose
on the classroom testing day (Visit 8). The primary efficacy endpoint was the average of all post-
dose SKAMP scores during the 13-hour period.
Null Hypotheses: The post-dose SKAMP-Combined scores averaged over the classroom testing
day for MPH XR-ODT and placebo are equal.
Alternative Hypotheses: The post-dose SKAMP-Combined scores averaged over the classroom
testing day for MPH XR-ODT and placebo are not equal.
The SKAMP Rating Scale is comprised of two behavioral subscales, “Attention” and
“Deportment,” from which sub scores are calculated (see appendix for a brief description of
those two subscales). These sub scores were derived from 20 minutes of direct observations of
subject behavior, by trained raters, during Visit 7 (practice session: at baseline, and at 1, 3, and 5
hours post-dose) and Visit 8 (pre-dose, and at 1, 3, 5, 7, 10, 12, and 13 hours post-dose). Ratings
were based on the frequency and quality of behaviors, as observed by experienced, independent
Reference ID: 3829245

11
raters who were trained on SKAMP rating instruments by an instructor not involved in the study
[Study Report p. 30].
Key Secondary Efficacy Parameters
Key secondary endpoints were identified in the SAP to include the onset and duration of MPH
XR-ODT (defined as the first and last points, respectively, during which active drug
consecutively separates from placebo on SKAMP-Combined scores).
A mixed model repeated measures (MMRM) approach was used to assess whether the effect of
treatment on the SKAMP-Combined Score post-dose was dependent on the time of assessment
post-dose. Terms for treatment, site, pre-dose SKAMP-Combined Score at the classroom testing
session, time of assessment post-dose, and treatment-by-time interaction were included in this
model as fixed effects and subject was included as a random effect. In addition, this model was
used to estimate the differences in the SKAMP-Combined Score between treatments at each
post-dose assessment. An unstructured covariance matrix was used to model the covariance of
within-subject scores; and the Kenward-Roger approximation to estimate denominator degrees of
freedom.
Formal hypothesis testing commenced at the 5-hour time point. Since significance at the 5%
level was achieved at this time point, the next time point tested was at 3 hours post-dose. The
testing sequence then proceeded as follows: 7, 1, 10, 12, and 13-hour time points. If at any time
point significance at the 5% level was not achieved, formal statistical testing had to cease. The
onset of effect of MPH XR-ODT and duration of effect of MPH XR-ODT were estimated using
the individual p-value for each post-dose assessment.
Other secondary endpoints were the PERMP-Attempted and PERMP-Correct averages of the
classroom day. The PERMP consists of 400 math problems and is graded as number of problems
“Attempted” and number of problems “Correct”.
3.2.3 Patient Disposition, Demographic and Baseline Characteristics Eighty-seven boys and girls, aged 6 to 12 years, diagnosed with any subtype of ADHD and
taking a stable dose of 20-60 mg METADATE CD or comparable dose of another MPH IR or
Reference ID: 3829245

12
XR medication were enrolled in 4 centers across the US. A majority of subjects had the
combined type ADHD (65 subjects [74.7%]), followed by inattentive ADHD (21 subjects
[24.1%]), and hyperactive/impulsive ADHD (1 subject [1.1%]).
As shown in Table 3, of the 87 subjects enrolled in the study, the majority (57.5%) were enrolled
at Dr. Childress’s site, followed by Dr. Cutler’s (21.8%), Dr. Marraffino’s (12.6%), and Dr.
Kollins’s (8.0%) sites.
Table 3. Site and ADHD Classification Summaries
(Source: Study Report p. 35) The disposition of the patients enrolled in the study and the analysis populations are shown in
Table 4 and Figure 1. Of the 87 subjects, there were 2 subjects who did not complete dose
optimization (Subject 1012 withdrew due to an AE [abdominal pain upper], and Subject 3039
withdrew consent). 85 subjects were randomized and entered dose stabilization (2 subjects did
not complete dose stabilization: Subject 1011 withdrew due to an AE [influenza] and Subject
1013 withdrew consent; both were randomized to placebo treatment).
Of the 83 subjects who completed dose stabilization, 1 subject (Subject 1007 randomized to
MPH XR-ODT) did not have a baseline SKAMP assessment due to noncompliance with the
testing procedures on the classroom testing day and was also positive at Visit 8 for
amphetamines.
Reference ID: 3829245

13
The Full Analysis Set (FAS) is comprised of 82 subjects. The Per Protocol Set (PPS) includes 80
subjects, with 2 subjects from the FAS removed (Subjects 3001 and 5002, randomized to MPH
XR-ODT and placebo treatments, respectively, used excluded medications).
Table 4. Disposition - Enrolled Population Period Parameter Statistic Not
Randomized Placebo (N=41)
NT0102 (N=44)
Overall (N=87)
Safety Set Completed Classroom Visit
N (%) 2 (100) 41 (100) 44 (100) 87 (100) FAS N (%) 0 39 (95.1) 43 (97.7) 82 (94.3) PPS N (%) 0 38 (92.7) 38 (95.5) 80 (92.0) Screening/Washout Entered N (%) 2 (100) 41 (100) 44 (100) 87 (100) Period Withdrew N (%) 0 0 0 2 (2.3) Dose Optimization Entered N (%) 2 (100) 41 (100) 44 (100) 87 (100) Period Withdrew N (%) 2 0 0 2 (2.3) Due to
Adverse Event
N (%) 1 (50)
Due to Consent Withdrawal
N (%) 1 (50)
Dose Stabilization Entered N (%) 0 41 (100) 44 (100) 85 (97.7) Withdrew N (%) 0 0 0 0 Double-Blind Period
Entered N (%) 0 41 (100) 44 (100) 85 (97.7)
Withdrew N (%) 0 2 (4.9) 0 2 (2.3) Due to
Adverse Event
N (%) 0 1 (2.4) 1 (1.1)
Due to Consent Withdrawal
N (%) 0 1 (2.4) 0 1 (1.1)
(Source: Study Report p. 69-70)
Reference ID: 3829245

14
Figure 1. Study Populations
(Source: Study Report p. 36) Overall, there were 54 males (65.9%) enrolled in the study with a slightly higher percentage in
the MPH XR-ODT arm (69.8%) compared to the placebo (61.5%) arm. Age, race, ethnicity,
height, weight, and body mass index (BMI) were similar in both groups (Table 5).
The mean (standard deviation [SD]) age in years was 9.2 (1.75) across both groups, with a range
of 6 to 12 and a median of 9 years in both treatment groups. The majority of the subjects were
Reference ID: 3829245

15
White (79.3%), followed by Black or African American (12.2%), Other (4.9%), Asian (2.4%),
and Native Hawaiian or Other Pacific Islander (1.2%). There were 34.1% of subjects who were
Hispanic or Latino. The average (SD) weight was 36.3 (12.73) kg, with a range from 15.4 to 82.6
kg. Demographic characteristics appear similar for both treatment groups.
Table 5. Demographic and Baseline Characteristics - FAS
(Source: Study Report p. 39) It is interesting to compare the SKAMP baseline score at Visit 7 (the practice classroom session
before one week of DB treatment) with the pre-dose score at Visit 8 (classroom session at the
end of one week of DB treatment). Leading up to visit 7 all subjects were taking NT0102 (i.e.,
Reference ID: 3829245

16
finishing up one week of dose stabilization after four weeks of dose optimization). Note that the
baseline mean scores are fairly similar at visit 7 (Table 6), however at visit 8 (after one week of
double-blind treatment with placebo or NT0102) we observe a pre-dose imbalance (with drug
treated subject having a worse SKAMP Combined score compared to placebo subjects possibly
due to a withdrawal effect 24 hours after last dose received).
Table 6. Pre-dose SKAMP Combined Scores - FAS SKAMP Scale
Visit 7 SKAMP Scores Raw Mean (Std)
Visit 8 SKAMP Scores Raw Mean (Std)
“Placebo”* (N = 39)
NT0102 (N = 43)
Placebo (N = 39)
NT0102 (N= 43)
Combined 20.4 (9.09) 21.1 (9.56) 19.1 (11.04) 26.8 (11.52) (Source: Study Report p. 130; Reviewer)
The difference in pre-dose scores at Visit 8 is observed at each site (Table 7).
Table 7. Pre-dose SKAMP Combined Scores by Site – FAS Site # (Investigator)
Visit 7 SKAMP Combined Scores
Raw Mean (Std)
Visit 8 SKAMP Combined Scores
Raw Mean (Std) “Placebo”*
(N=39) NT0102 (N=43)
Placebo (N=39)
NT0102 (N=43)
1 (Cutler)
16.9 (7.38) (7)
15.6 (6.91) (8)
14.7 (5.65) (7)
19.9 (9.57) (8)
3 (Childress)
22.4 (9.26) (23)
21.7 (8.93) (26)
20.8 (12.2) (23)
28.2 (10.66) (26)
5 (Kollins)
19.3 (8.62) (3)
20.5 (7.59) (4)
10.7 (2.08) (3)
18.0 (5.83) (4)
6 (Maraffino)
17.7 (10.50) (6)
27.0 (15.07) (5)
21.7 (11.83) (6)
37.4 (13.07) (5)
(Source: Study report p. 138, Reviewer [V7_Exploration_1004]; “Placebo”* stands for group of subjects that are randomized to NT0102 at Visit 8) Table 8 provides a breakdown of the optimized dose levels. Each dose level (i.e., 20, 30, 40, and
60 mg) was “optimal” for at least some of the pediatric patients. The 20 mg dose was “optimal”
for the fewest number of patients, whereas the proportion of subjects at each of the other three
dose levels was higher and fairly similar.
Reference ID: 3829245

17
Table 8. Optimal Doses Used During the Double-Blind Phase
(Source: Study Report p. 42)
Note that the SKAMP pre-dose score at the laboratory classroom day (after one week of double-
blind treatment) for the NT0102 group was numerically worse at each optimized dose level
compared to placebo (Table 9).
Table 9. Visit 8 Pre-dose SKAMP Scores by Optimized Dose Group ID Optimal Dose N Mean Std Dev Minimum Maximum
NT0102 20 mg/day 6 23.33 14.39 5.00 49.00
30 mg/day 13 28.08 9.86 10.00 42.00
40 mg/day 11 26.91 10.63 13.00 46.00
60 mg/day 13 27.00 13.39 7.00 54.00
Placebo 20 mg/day 5 9.20 2.17 8.00 13.00
30 mg/day 8 21.63 8.05 9.00 31.00
40 mg/day 11 21.55 10.48 8.00 42.00
60 mg/day 15 19.20 13.23 4.00 49.00 (Source: Reviewer)
3.2.4 Results and Conclusions
Sponsor’s Results
Primary Endpoint
Reference ID: 3829245

18
The primary efficacy endpoint is the average of all post-dose SKAMP-Combined scores assessed
at 1, 3, 5, 7, 10, 12, and 13 hours post-dose during the classroom testing day on Visit 8.
The primary analysis was carried out on the Full Analysis Set (FAS) population using an
Analysis of Covariance (ANCOVA) model with factors for treatment and site and with a
covariate for pre-dose SKAMP-Combined Score. A lower SKAMP-Combined score indicates
less symptomatology (i.e., is better). The model estimated a treatment effect of -11.0 (95%CI: -
13.9, -8.2) at a significance level of p<0.0001.
Table 10 summarizes the differences in least squares means (LS means) between MPH XR-ODT
and placebo treatment groups for SKAMP-Combined scores. There was no significant site-level
effect for the SKAMP-Combined Score (p-value = 0.1216 [FAS]). Of note, there was a
significant difference at pre-dose in the SKAMP-Combined score (p<0.0001 for FAS), as already
described in section 3.2.3 of this review.
Table 10. Primary Analysis Results for the SKAMP-Combined Scores Averaged Over the Classroom Testing Day
(Source: Study Report p. 44; Results [SKAMP-Combined, SKAMP-Attention, and SKAMP-Deportment] for FAS replicated by reviewer [Primary_Analysis_1004.sas and SKAMP_Deport_Att_1004.sas])
Reference ID: 3829245

19
Missing data: Not an issue
The SAP stated that if individual item scores were missing from the questionnaire they were
replaced by the adjacent score (estimated by last observation carried forward) for that question
and that if more than 20% of the item scores were missing at any time point, the total score was
set to missing; however, there were no missing scores, so these adjustments were not performed.
The SAP also stated that if a subject had more than 2 of the 7 post-dose scores missing, they
were omitted from the analysis; however, no subjects were omitted from the analysis as a result
of this missing data criterion [Study Report p. 42].
Sensitivity Analyses for primary endpoint
1) Per Protocol Set (PPS)
Table 10 above displays the results for the per protocol population. The PPS has two
fewer patients compared to the FAS. Hence it is no surprise that the results of this
supportive analysis are in line with the analysis results on the FAS.
2) Non-parametric model
Normality assumptions for the ANCOVA were tested by an examination of the residual plots and
the Shapiro-Wilk test of normality. The results of those explorations were submitted per FDA
request. The normality approximation appears adequate (Figure 3 in reviewer’s analysis section).
A sensitivity analysis was performed on the primary model using a non-parametric model
ranking the average post-dose SKAMP-Combined scores. Subjects who withdrew during the
double-blind phase due to treatment-related reasons were assigned the worst possible outcome
(worst rank), subjects withdrawing due to non-treatment-related reasons were assigned the next
worst outcome (second worst rank), subjects without an adequate number of SKAMP scores but
completing the classroom visit were assigned the third worst rank, and subjects with SKAMP
data were ranked according to their average of all post-dose SKAMP scores (i.e., the highest
score was assigned the fourth worst rank and the lowest score was assigned the best rank). These
outcome rankings were compared between treatment groups via analysis of covariance of ranked
data with factors for treatment group and site and a covariate for pre-dose SKAMP-Combined
score (Table 11). The results are in line with the results of the primary analysis.
Reference ID: 3829245

20
Reviewer’s note: Most of the ranking rules are not relevant given the data (almost no
withdrawals). Also, the clinical meaningfulness of bins in 20 point increments is not clear.
Table 11. Sensitivity Analysis for Primary Endpoint
(Source: Study Report p. 129) Additional sensitivity analyses were planned using different approaches to adjust for missing
data; however, in this study there were no missing data and no further sensitivity analyses were
performed.
Key Secondary Efficacy Endpoint Analyses: Onset and Duration of Effect
Onset of efficacy was met at the first post-dose assessment of 1 hour, and duration of efficacy
was consecutively observed through Hour 12, but not at Hour 13 (Table 12).
Reference ID: 3829245

21
Figure 2 displays summary profiles for the SKAMP-Combined score during the classroom
testing day for the FAS [Study Report p. 45].
Table 12. Least Squares Mean SKAMP-Combined Scores at All Time Points - FAS
(Source: Study Report p. 46; Key secondary results replicated by reviewer [Key_Second_Analysis_1004.sas])
Reference ID: 3829245

22
Figure 2. Mean Profiles for SKAMP-Combined Score During the Classroom Testing Day - FAS
(Source: Study Report p. 47) Note the aforementioned pre-dose mean difference in the SKAMP combined score with the
NT0102 subjects scoring worse compared to the placebo subjects (Figure 2). This phenomenon
reverses rapidly after drug administration. The sponsor provided similar figures separately for
the SKAMP Attention and Deportment results.
Other secondary endpoints: PERMP-A and PERMP-C
Both PERMP endpoints (Attempted and Correct) showed significant treatment effects in the FAS
(Table 13) based on the ANCOVA model. The average post-dose scores over the classroom day
Reference ID: 3829245

23
by treatment group were compared adjusting for the pre-dose score and site. Of note, as with the
SKAMP assessment, there was a significant difference at pre-dose in the PERMP score.
Table 13. PERMP Efficacy Assessments - FAS
(Source: Study Report p. 54)
Reference ID: 3829245

24
Reviewer’s analysis
Assessment of normality assumption underlying primary analysis (ANCOVA)
Figure 3. Studentized Residuals for SKAMP-Combined Mean Scores
(Source: Reviewer [Normality_1004])
Table 14. Tests for Normality for SKAMP Mean Residuals Test Statistic p Value
Shapiro-Wilk W 0.993245 Pr < W 0.9497
Kolmogorov-Smirnov D 0.046536 Pr > D >0.1500
Cramer-von Mises W-Sq 0.01806 Pr > W-Sq >0.2500
Anderson-Darling A-Sq 0.142517 Pr > A-Sq >0.2500 (Source: Reviewer [Normality_1004])
Conclusion: Given the residual diagnostics displayed in Figure 3 and the tests for normality in
Table 14 the normality assumption underlying the ANCOVA (primary analysis) appears to hold.
Reference ID: 3829245

25
Explore effect on SKAMP deportment vs. attention score
Figure 4. Visit 8 SKAMP-Attention Raw Mean Scores - FAS
(Source: Reviewer [SKAMP_Deport_Att_1004])
Figure 5. Visit 8 SKAMP-Deportment Raw Mean Scores - FAS
(Source: Reviewer [SKAMP_Deport_Att_1004])
Reference ID: 3829245

26
Note that a numerically slightly stronger impact on the deportment score compared to the
attention score can be observed when comparing Figure 4 and Figure 5.
Efficacy by optimized dose
Table 15. Visit 8 Post-dose SKAMP Raw Mean Scores by Optimized Dose – FAS Group ID Optimal Dose N Mean Std Dev Minimum Maximum
NT0102 20 mg/day 6 17.36 12.67 5.57 38.86
30 mg/day 13 18.15 6.97 7.29 29.29
40 mg/day 11 18.30 6.26 9.00 28.71
60 mg/day 13 15.60 6.54 7.00 28.43
Placebo 20 mg/day 5 13.80 2.90 9.86 17.57
30 mg/day 8 25.43 9.52 10.86 41.14
40 mg/day 11 24.94 8.09 12.14 35.14
60 mg/day 15 26.61 10.14 9.43 47.86 (Source: Reviewer [Primary_Analysis_by_optimized_dose_1004.sas]) The SKAMP raw mean scores are fairly similar within treatment group (with the exception of
the optimized dose of 20 mg in the placebo group) regardless of optimized dose.
Section 14 of the proposed label contains
Reference ID: 3829245
(b) (4)
(b) (4)

27
Baseline Weight versus Optimized Dose
Table 16. Baseline (Screening) Weight in kg vs. Optimized Dose - FAS
Opt_dose (mg) N Mean Std Dev Minimum Maximum
20 11 39.52 18.13 22.30 82.60
30 21 35.24 10.91 15.40 57.80
40 22 33.36 10.39 20.40 52.60
60 28 38.11 13.31 15.60 62.70 (Source: Reviewer [Primary_Analysis_by_optimized_dose_1004.sas])
Figure 6. Baseline (Screening) Weight in kg vs. Optimized Dose - FAS
(Source: Reviewer [Primary_Analysis_by_optimized_dose_1004.sas]) Given the results displayed in Table 16 and Figure 6 there appears to be no correlation between
baseline weight and optimized dose.
Reference ID: 3829245

28
Baseline BMI versus Optimized Dose Table 17. Baseline (Screening) BMI vs. Optimized Dose - FAS
Opt_dose (mg) N Mean Std Dev Minimum Maximum
20 11 19.01 5.12 13.90 30.50
30 21 18.25 3.62 13.20 25.80
40 22 17.46 3.12 14.30 25.40
60 28 19.31 4.31 12.40 30.40 (Source: Reviewer [Primary_Analysis_by_optimized_dose_1004.sas])
Figure 7. Baseline (Screening) BMI vs. Optimized Dose - FAS
(Source: Reviewer [Primary_Analysis_by_optimized_dose_1004.sas])
Again, there seems to be no evidence of a correlation between baseline BMI and optimized dose
(Table 17 and Figure 7).
3.3 Evaluation of Safety The reader is referred to the clinical review for the evaluation of safety.
Reference ID: 3829245

29
4 FINDINGS IN SPECIAL/SUBGROUP POPULATIONS 4.1 Gender, Race, Age, and Geographic Region Race
The full analysis set included 65 White, 10 Black or African American and 7 Other patients.
Any analysis by such small race subgroups would not produce meaningful results and hence has
not been conducted.
Age
The sponsor formed three age subgroups: 6-7 years, 8-10 years, and 11-12 years. Although this
classification could be criticized as arbitrary a trend favoring MPH XR-ODT in each of those age
subgroups is apparent (Sponsor Table 14.2.1.12).
Gender
The full analysis set included 28 female and 54 male patients. The effect of MPH XR-ODT is
trending in the same direction (i.e., improvement for both males and females; Sponsor Table
14.2.1.13).
Region: Patients were enrolled at four sites in the United States.
No firm conclusions can be drawn from those exploratory subgroup analyses due to the limited
sample size.
4.2 Other Special/Subgroup Populations No other subgroups were analyzed.
Reference ID: 3829245

30
5 SUMMARY AND CONCLUSIONS 5.1 Statistical Issues No statistical issues that impact the overall conclusions were identified.
5.2 Collective Evidence Patients randomized to MPH XT-ODT in the laboratory classroom study (NT0102.1004), the
only efficacy study under this 505(b)(2) application, achieved on average better results on the
SKAMP compared to the placebo patients. The primary analysis estimates a difference of -11
points (95% CI: -13.9, -8.2) when averaging the results over the 13 hour classroom session
(primary endpoint). This difference is highly statistically significant. 5.3 Conclusions and Recommendations
The statistical results provide adequate evidence to support the claims proposed in the NDA. 5.4 Labeling Recommendations This reviewer could not confirm the relationship between optimized dose and body weight as
implicated from the
efficacy data of Study NT0102.1004. There appears to be no relationship in the age segment
studied (i.e., 6-12 years; Table 16, Table 17, Figure 6, and Figure 7). After consulting with the
ClinPharm team, this reviewer recommends the removal
Other issues pertaining to in the label are the following:
.
Reference ID: 3829245
(b) (4)
(b) (4)
(b) (4) (b) (4)
31
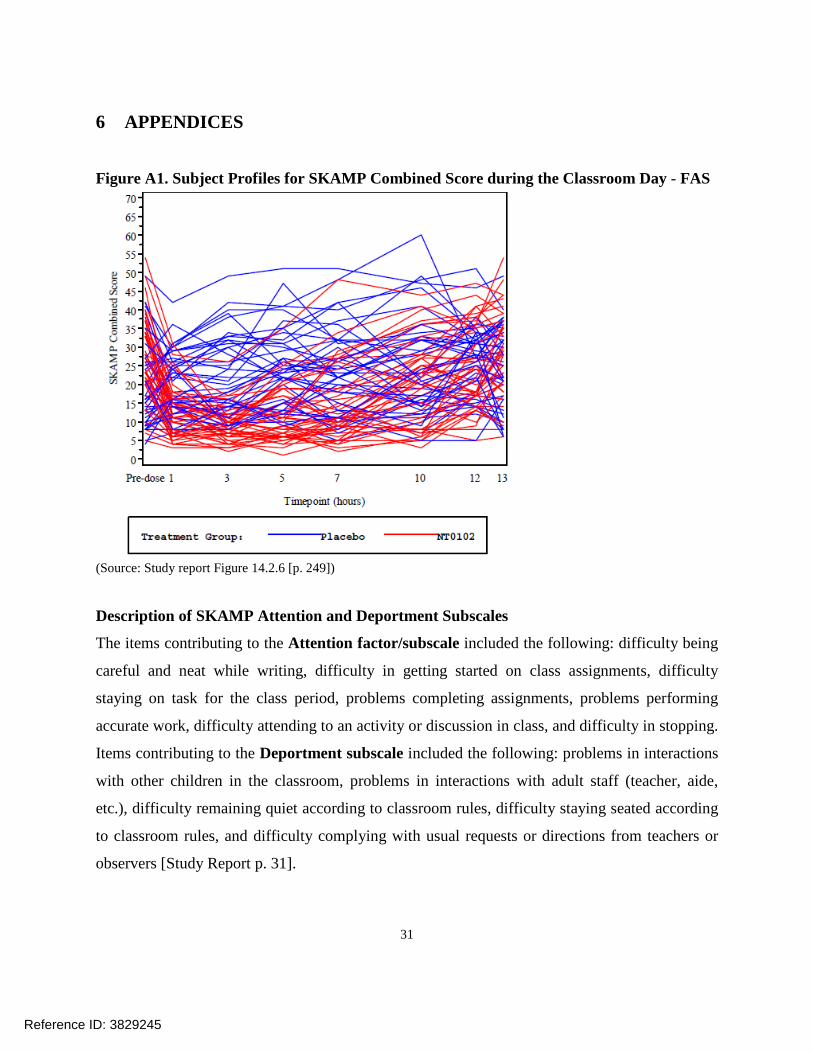
6 APPENDICES
Figure A1. Subject Profiles for SKAMP Combined Score during the Classroom Day - FAS
(Source: Study report Figure 14.2.6 [p. 249]) Description of SKAMP Attention and Deportment Subscales
The items contributing to the Attention factor/subscale included the following: difficulty being
careful and neat while writing, difficulty in getting started on class assignments, difficulty
staying on task for the class period, problems completing assignments, problems performing
accurate work, difficulty attending to an activity or discussion in class, and difficulty in stopping.
Items contributing to the Deportment subscale included the following: problems in interactions
with other children in the classroom, problems in interactions with adult staff (teacher, aide,
etc.), difficulty remaining quiet according to classroom rules, difficulty staying seated according
to classroom rules, and difficulty complying with usual requests or directions from teachers or
observers [Study Report p. 31].
Reference ID: 3829245

32
Table A1: Randomization Process for Study NT0102.1004 Site 1 (Cutler) Site 3 (Childress) Site 5 (Kollins) Site 6 (Marraffino) Rand Date Rand
Schedule n Rand Date Rand Schedule n Rand Date Rand
Schedule n Rand Date Rand Schedule n
Randomization 1st Batch 2013/09/14 Site 01 12 2013/09/07 Site 03 18 2013/11/02 Site 05 7 2013/10/26 Site 02 11
Randomization 2nd Batch 2013/12/07 Site 04 6 2014/02/22 Group 06 18
Randomization 3rd Batch 2014/04/26 Group 07 13
N 18 49 7 11 (Source: Reviewer; Rand = Randomization; Randomization Schedule as listed in Appendix 16.1.7 to Study NT0102.1004 Report; Note the initial randomization schedule [Site 01 – Site 05 with 20 randomization numbers each] was created on 06/15/2013, a randomization schedule extension [Group 06 – Group 08 with 20 randomization numbers each] was created 12/12/2013)
Reference ID: 3829245

33
Exploration of Attention versus Comportment scores
Figure A2. Visit 8 SKAMP-Attention Raw Mean Scores by Site
(Source: Reviewer [SKAMP_Deport_Att_1004]; Note that the sample size differed substantially between sites.)
Reference ID: 3829245

34
Figure A3. Visit 8 SKAMP-Deportment Raw Mean Scores by Site
(Source: Reviewer [SKAMP_Deport_Att_1004]; Note that the sample size differed substantially between sites.)
Reference ID: 3829245

35
Low screen failure rate
The study report contains no information about how many patients were screened to enter the
study. This information (A2) was received per FDA request:
Table A2. Number of Screened Subjects and Screen Failures by Site
(Source: Sponsor submission SN05 [Response to 2nd information request]) It is appears somewhat unusual to this reviewer that Site 03 (Childress) screened 51 subjects and
only had one screen failure. However, the FDA inspection of clinical site 3 did not reveal
anything concerning.
Primary Efficacy at the Site level
Table A3. Post-dose SKAMP Combined Scores by Site, Visit 7 and Visit 8 – FAS Site # (Investigator)
Visit 7 SKAMP Combined Scores
Raw Meana) (Std)
Visit 8 SKAMP Combined Scores
Raw Meanb) (Std) “Placebo”*
(N=39) NT0102 (N=43)
Placebo (N=39)
NT0102 (N=43)
1 (Cutler)
8.3 (2.60) (7)
8.0 (3.46) (8)
18.3 (6.92) (7)
14.3 (5.64) (8)
3 (Childress)
11.2 (4.48) (23)
13.5 (5.81) (26)
27.6 (9.86) (23)
18.3 (7.88) (26)
5 (Kollins)
9.1 (3.01) (3)
8.3 (3.30) (4)
16.5 (6.71) (3)
13.3 (4.23) (4)
6 (Maraffino)
6.6 (3.13) (6)
10.6 (5.26) (5)
22.5 (6.19) (6)
20.0 (8.98) (5)
(Source: Study report p. 138, Reviewer [V7_Exploration_1004]; Placebo* equals group of subjects that are randomized to NT0102 at Visit 8; a) average over hours 1, 3, 5, b) average over hours 1, 3, 5, 7, 10, 12 and 13)
Reference ID: 3829245

---------------------------------------------------------------------------------------------------------This is a representation of an electronic record that was signedelectronically and this page is the manifestation of the electronicsignature.---------------------------------------------------------------------------------------------------------/s/----------------------------------------------------
THOMAS BIRKNER10/05/2015
PEILING YANG10/06/2015I concur with the review.
HSIEN MING J HUNG10/14/2015
Reference ID: 3829245