Embed Size (px)
Citation preview

S. R. Rubenstein
Engineering and Research Center Bureau of Reclamation
October 1970

Petrographic and Physical Properties Techniques for Study of Foundation Rock - ~ I T w Point Damsite
7 . AUTHOR(S) 8. PERFORMING ORGANIZATION
S. R. Rubenstein REPORT NO.
REC-OCE-70- 39 9. PERFORMING ORGANIZATION NAME AND ADDRESS 10. WORK UNIT NO.
Division of General Research Engineering and Research Center 11. CONTRACT OR GRANT NO.
Bureau of Reclamation Denver, Colorado 80225 13. TYPE OF REPORT AND PERIOD
12. SPONSORING AGENCY NAME AND ADDRESS COVERED
14. SPONSORING AGENCY CODE
I 15. SUPPLEMENTARY NOTES
16. ABSTRACT
k i n g the foundation investigation of schists and gneisses at M o m Point damsite, the rock (Pix cores) was petrographically described and classified for structural tests. Petrographic and physical tests of the core were grouped to give an overall picture of the foundation. Methods are described for determining the petrographic characteristics such as articulation, mineral composition, and microstructure of the rock. Ar- ticulation and texture of the grains were determined on the basis of microscope examination for evaluation of bond strength. Composition of the rock was determined by modal analysis (by a method of intercept distances) and the rocks were grouped according to minerals present. Oriented microstructures in foliated rocks were determined by the photo- meter method for analysis of structure. The relationship between elas- ticity and the texture composition, and structure was compared. The relationship between ~.bsorption and seismic wave velocity w9e examined. Physical properties by means of laboratory and seismic methods were measured for individual rock types.
( 7 . K E Y WORDS AND DOCUMENT ANALYSIS
a . DESCRIPTORS--/ Wtrographic investigations/ *rock f oundations/ rock mechanics/ gneisses/ mineralogy/ petrofabrics/ compressive strength/ elas ticity/ geology/ micros tructurea/ mica/ *physical properties/ *rock properties/ absorption/ schists/ specific gravity/ static tests
1 a. IDENTIFIERS-4 Morrow Point Bm, ~olo/ photomicrographs/ thin sections
C. COSATI Fleld/Group . 18. DISTRIBUTION STATEMENT 19. SECURITY CLASS '21. NO. OF PAGE
(THIS REPORT) Available from the Material Technical Information U N ~ ~ ~ ~ ~ l ~ l E D 23 Service, Operations Mvision, Springfield, '20. SECURITY CLASS 22 . PRICE
Virginia 22151. (THIS CAGE) UNCLASSIFIED 53.00
REC-OCE-70-39
PETROGRAPH IC AND
PHYSICAL PROPERTIES TECHN IQUES
FOR STUDY OF FOUNDATION ROCK
MORROW POINT DAMSITE
Determining petrographic characteristics of the
rock and their relationship to modulus of elasticity.
byS. R. Rubenstein
October 1970
Applied Sciences BranchDivision of General ResearchEngineering and Research CenterDenver, Colorado
UNITED STATES DEPARTMENT OF THE INTERIOR * BUREAU OF RECLAMATIONEllis L. ArmstrongCommissioner

ACKNOWLEDGMENT
I:-,10.
This study was conducted by S. R. Rubenstein under the s:Jpervision ofW. Y. Holland, Head, Applied Physics Section (retired). L. O. Timblin,Jr., is Chief of the Applied Sciences Branch. The author extends hisappreciation to members of the Petrographic Laboratory, RockMechanics and Structures Unit, Concrete and Structural Branch, andGeophysics Branch. The work was done at the Bureau of Reclamation,Division of General Research, Denver, Colorado.
Reprint or republication of any of this material shall give appropriatecredit to the Bureau of Reclamation, Department of the Interior.
CONTENTS
Introduction. . . . . . . . . . . . . . . . . . . . . . . . .Conclusion. . . . . . . . . . . . . . . . . . . . . . . . . .Application. . . . . . . . . . . . . . . . . . . . . . .Test methods. . . . . . . . . . . . . . . . . . . . . . . . . . . .
Chemical Analysis and Correlation. . . . . . . . . . . . . . . . . . . .Rock Groupings by Hardness. . . . . . . . . . . . . . . . . . . . . .Rock Classification by Texture. . . . . . . . .Macrostructure (foliation and fractures) . . . . . . . . . . . . . . . . . .Modal Analysis (composition) ,...Photometer Method of Petrofabric Study. . . . . . . .Specific Gravity and Absorption. . . . . . . . . . . . . .Compressive Strength and Elasticity. . . . . . . . . .Comparison of Petrographic and Structural Properties . . . . . . . . . .References. . . . . . . . . . . . . . . . . . . . . .
LIST OF TABLES
Table
12A2B
Chemical composition. . . . . . . . . . . . . . .Modal analysis of Pre-Cambrian rocks. . . . . . . . .Results of combined rock and thin section analysis of
specimen. . . . . . . . . . . . . . . . . . . . . . . . .Preferredorientation of quartz in foundation rock. . . . . . . . . . .Physicalproperties. . . . . . . . . . . . .Static laboratorytests. . . . . . . . . . . . . . .Articulationcomparedto elasticity. . . . . . . . . . . . .Textural and mineralogical classification of rocks versus
physicalproperties. . . . . . . . . . . . . . . . . .Angleof foliationcomparedto elasticity. . . . . . . . . . . . . .Micacomparedwith elasticityand strength. . . . . . . . . . . . .Absorption compared to elasticity . . . . . . . . . .
3456A6B
789
LIST OF FIGURES
Figure
1234
Photograph of hand specimens of schist. . . . . . . . . . . . . . .Photograph of hand specimens of schist. . . . . . . . . . . .Rock classification relationshipf'. . . . . . . . . . . . . . . . . .Comparison of percent mica and angle of foliation with
strength. . . . . . . . . . . . . . . . . . . . . . . . .Rock texture versus elasticity. . . . . . . . . . . . . . . . . .Comparison of percent quartz with elasticity . . . .Absorption versus elasticity. . . . . . . . . . . . . . . . . . .
567
Page
1112
2222222234
55
66778
8899
101011
12131415

CONTENTS-Continued
.:..'-
APPENDIX
Lithologic logs of drill holes. . . . . . . . . . . . . . . . . . . . . . .Photomicrographs of biotite schist, mica schist, and. . . . . . . . . . . .
hornblende schist. . . . . . . . . . . . . . . . . . . .Stereopair of scheared rock surface. . . . . . . . . . . . . . . . . . . .Geology section-seismic measurements of rock elasticity. . . . . . . . . . . . .Conversion factors-British to metric units of measurement
Page
1719202122

iNTRODUCTION
In the investigation of foundation rocks at MorrowPoint Damsite, Colorado,! rock cores werepetrographically classified and logged. Certain physicaltests were also performed and related to engineeringproperties of design.
Morrow Point damsite is located on the GunnisonRiver, upstream from the confluence with CimarronCreek. Geologically, the Gunnison River cuts throughPre-Cambrian gneisses, sch ists, and pegmatite at thedamsite.
Because the dam will be a thin arch, double-curvaturedesigned dam, extensive geologic investigations wereundertaken. In addition to the geological studies,structural properties of the rock were determined. Thispaper is concerned with the description of some of thepetrographic techniques which are used in theinvestigation of geological conditions in rockfoundations and the manner in which such informationcan be presented in engineering terms.
Twenty-nine representative samples of Nx (2-1/8inches) core from exploration drill holes and tunnelswere examined. For the petrographic examination,each piece was selected so that its location in the drillhole was as close as possible to another core piecewhich was tested for compressive strength, elasticity,and other properties by the Rock Mechanics andStructures Unit of the Division of Research.
Microscopic examination was performed fordetermination of composition, internal structure,texture, secondary minerals, and microcracks. Modalanalysis was used to provide a quantitative compositionof the rock. The photometer technique provide amethod to determine the lineation and microstructureof the rock by the orientation of the quartz grains.
X-ray diffraction analysis for determination offine-grained minerals was made as well asspectrograph ic analysis for sem iquantitativedeterm ination of elements. Clay stain ing tests forqualitative determination of clay were done whennecessary. Determinations of porosity, absorption, andbulk specific gravity (specific gravity with thepermeable voids filled with water) by the immersionmethod were made to obtain these physical propertiesof the rock. Elasticity and unconfined compressivestrength tests were performed.2
! Numbers refer to references at end of paper.
CONCLUSIONS
1. The rock grouping of the cores by hammer hardnessfrom soft, moderately hard, to hard showed fairly goodcorrelation with elasticity. Those wh ich had a good"ring" were harder than those with a duller "ring." Thesoft group had a lower elasticity.
a. The petrographic identification and classificationwas a good method for determining thecharacteristics that effect the engineering propertiesof the rock. Trends were obtained between texture,structure, composition, and strength and elasticity.Strength increased as the amount of quartzincreased and mica decreased. The increase instrength appears to result from greater locking ofthe crystals as the transition from parallel toanhedral (shapeless crystals) to euhedral (boundedby its own crystal faces) fabric occurs.
b. Modal compositional analysis by the thin sectionmethod gave more accurate mineral percentages ascompared to visual estimation. The mineralpercentages then can be used in the identification ofthe rock. The data can also be used in thecorrelation with structural properties. There was adecrease in strength when the quantity of mica wasgreater than 40 to 50 percent.
c. The anistropy of the biotite schists causednotable differences in strength in core samplestested along their isotropic planes of weakness.
2. Absorption data was related to the elasticity of therock. The absorption was low and when compared toelasticity showed the lower the absorption the higherthe elasticity.
3. Photomicrographs can be an. aid to determiningtexture and articulation in the classification of rocktypes. Stereo photomicrographs can be an aid toexplain surface roughness.
APPliCATION
Petrographic techniques such as classification, modalanalysis, petrofabric study, chemical analysis, andhardness tests with strength and modulus of elasticitytests provided a good method for determining thebehavior of the foundation rock at Morrow Point site.

TEXTURAL CLASSIFICATION
Group Rock Articu lation Textun
Biotite schist Very poorly Sch istosinterlocked
II Mica schist Very poorly Sch istosand quartz. interlocked tomica schist banded
III Micaceous Very poorly Bandedquartzite to poorly granula
interlockedIV Quartzite Poorly Granular
interlockedV Pegmatite Poorly Granular
interlocked
TEST METHODS
Chemical Analysis and Correlation
~.~
It was important in the investigation of the foundationto determine the petrogenesis of the rock forexcavation and structural purposes. The chem icalcompounds were obtained from the thin sectionmineral analysis of the metamorphic rocks. Certaingroups of compounds (Si02 and A1203) were thencompared with a chemical analysis of averagesedimentary rock types (Table 1).
Rock Groupings by Hardness
In order to resolve the complex data into usableengineering units, five different rock types werederived based on approximate hammer hardness,foliation, and grain size grouped as follows:
Group IGroup IIGroup I"Group IVGroup V
Biotite schistMica schist + mica augen schistQuartz.mica schistQuartzitePegmatite
Rock Classification by Texture
The petrographic analysis is a rapid method forinvestigating the characteristics of foundationmaterials. The petrographic description andclassification of foundation rock also serves as a guidefor correlation of the strength and elastic properties. Ithas been found that rocks with almost identicalgeological classification (name, age, formation) mayvary widely in their physical characteristics. Therefore,designs should be based on physical and elasticproperties of foundation rocks that have actually beentested or compared with a petrographically similar typeof rock whose characteristics correlate closely with theone being considered.
Under the microscope, the rocks were classified on thebasis of articulation (manner in which adjacent mineralgrains join) and texture. The grain boundaries areeither sutured, sinuous, or smooth to planer. Thetextures vary from schistose and banded to granularand are interlocking rather than cemented compared tosedimentary rocks. The articulation varies from verypoorly locked to poorly locked as shown in thefollowing table:
Grain size was measured with the aid of a calibrateeyepiece fitted to the microscope. The thin section w;randomly scanned and measurements made. This Wicompared to a representative thin section in which 3Cgrains were measured.
Macrostructure (Foliationand Fractures)
The angle of foliation with the vertical axis of the coras measured with a protractor varied from 300 to 90cThe amount of foliation estimated varied frorwell.foliated to nonfoliated. The foliation wacompared with the strength (Figure 4) and elasticity
For correlation purposes, the type and frequency 0fractures in the rock cores from DH 31 and 12 wennoted. A relatively small number of fractures (13 to 3Lin 250 feet of core) were present, they were parallel tcthe foliation, and generally they occurred more thar10 feet apart (see log of drill holes-Appendix).
Modal Analysis (Composition)
A modal analysis for the determination of thecomposition of the rock for classification anddescription was performed. This was done by amodified Rosiwal (1898)4 method, which is atechnique of determining volume percentage ofminerals by measurements in thin section. Instead ofmeasuring every grain, a method of intercept distances(Chayes 1949)5 for making rapid estimates of mineralcomposition from thin sections and slabs (Plafker1956)6 was used, Table 2A.
2

A statistical analysis was made to determine the limitsof error between the thin section and slab results,Table 2B.
Photometer Method ofPetrofabric Study
Orientation of the quartz grains was determined by thephotometer method, which consists of measuring bymeans of an attached photometer the variation inintensity of monochromatic light passed throughindividual grains of a thin section on the stage of apetrographic microscope, with gypsum plate insertedand nicols crossed during 3600 rotation of themicroscope stage. A light intensity minimum occurswhen the trend of the optic axis of the quartz grains isparallel with the slow direction of vibration of thegypsum plates. Petrofabric analysis by the photometermethod7 was performed to investigate rock foliation,deformation, as well as genesis of the rocks, Table 3.
Specific Gravity and Absorption
Bulk specific gravity and absorption were determinedby the suspension method described in the ConcreteManual (1963).8 Using absorption as an index ofalterability, absorption was compared to elasticity.
Photomicrographs were taken to illustrate the textureof the rock. The schistose texture was seen as parallelalinement of the elongated mica flakes (Appendix).The banded texture showed alternating layers of lightand dark minerals, while the granular texture wasindicated by the grains of equal size without preferredorientation. Granular texture was also indicated in thegranite pegmatite.
Compressive Strength and Elasticity
Compressive strength, as used in this report, is theultimate unit load a cylinder will support in the axialdirection when it is unconfined laterally. It is aparticular case of triaxial testing with a zero lateralstress.
Static elastic properties are determined by loading thecores axially in compression and measuringlongitudinal and lateral strains. These strains aremeasured for loads applied continuously up toapproximately one-third of the ultimate compressivestrength (Table 4).
Comparison of Petrographicand Structural Properties
Application and development of the foundationgeology was directed at detecting, delineating, and
three dimensionally. defining natural suites or patternsin the foundation rock.
These rock types were developed from megascopicfield classification and refined by petrographic andlaboratory methods (Figures 1,2, and 3).
In order to resolve the detailed and complexfoundation data into useable field and constructionunits, five different rock types were distinguished (I toV).
Physical properties by means of laboratory and seismicmethods were then developed for individual rocktypes. These properties were evaluated and applied tonatural suites which existed in the foundation rock(Seismic Measurements of Rock Elasticity-Appendix).Emphasis was placed on comparative analysis ofquantitative data in order to produce for the designingengineer localized and composite indications of theengineering properties and anticipated behavior of rockfoundations.
The rock groups based on hardness (soft to hard) werecompared with elasticity values of samples from Drill
.
Holes 7 and 12 and correlation was good, Table 5.
Group I (soft) had the lowest elasticity values.
Elasticity was affected by variations in (a) interlockingof constituent grains, (b) direction of foliation of therock, and (c) amount of compressible minerals. Thearticulation or locking of the grains of the schist,gneiss, and quartzite was compared to elasticity, Table6A, Figure 5. The texture ranged from very poorly(biotite schist) to poorly locked (quartzite). The verypoorly locked samples had the low elasticity values.This compared favorably with a textural andmineralogical classification of metamorphic rocks fromother Bureau projects, Table 6B. Variations in thedirection of foliation ranged from 00 to 900. The rockwith the low angle (00 to 350 from the vertical) offoliation had the low elasticity, Table 7. The results ofthe petrofabric analysis indicated that the rocks withpreferred orientation of quartz grains had the lowerelasticity values in the samples (mica quartzschist-quartz mica schist) tested. Mica was the chiefcompressible mineral. The results of the mineralanalysis indicated that the percentage of mica, whichranged from 10 to 90 percent, varied with percentquartz and inversely with elasticity. Table 8, Figure 6,shows a comparison of quartz and mica with elasticity.
The laboratory absorptions in general were low andranged from 0.06 to 2.4 percent. This indicates fairlyuniform rock. The low values were due to the verysmall amount of pores and microcracks present.
3

.e.\0.
Although iron stained microcracks are evident in theserocks, apparently they are tight. For the purpose ofcorrelation, values from 0.06 to 0.9 percent were used,as no elasticity data were available for values over 0.9percent, Table 9, Figure 7. The mica schists and biotiteschists generally had the high absorptions.
It is known that seismic velocities are effected bymoisture content. Absorption percentages werecompared with seismic values from a 153-foot drillhole (DH 31) and generally showed the rocks with thelower absorptions had the higher elasticity value.
Bulk specific gravity ranged from 2.68 to 2.83 for thesch ist. The pegmatite ranged from 2.62 to 2.69. Thehigher specific gravity was due to the higher percentageof heavier mica in the rock. The average (2.73)consisted of rocks containing 60 percent quartz. Thehigher specific gravities had the lower elasticity values.
Stereo photomicrographs were taken to show surfaceroughness after shear tests. It was found that biotite, ifit is not alined in the plane of foliation, presented arough place in the surface (asperites) (Appendix).
REFERENCES
1 U.S. Bureau of Reclamation, Morrow Point Dam andPo werplan t Foundation Investigations, Denver,Colorado, (1965)
2 U.S, Bureau of Reclamation, Materials Laborator
Procedures Manual, Denver, Colorado, (1957)
3Hunter, J. F., "Pre-cambrian Rocks of the GunnisoRiver," Colorado. U.S. Geological Survey Bulletin 77;1925, "describes these rocks as quartz mica shis1although the irregular foliation might be described cgneissose rather than schistose."
4 Rosiwal, A., "Uber geometriche GesteinsanalyserVerhandl der KK," Geol. Reichsanstalt, Wein, (1898
SChayes, F., "A simple point counter for thin-sectioanalysis," Amer. Mineralogist, Vol. 35, (1949)
6 Plaker, G., "A technique for modal analysis of somfine and medium grained rocks." Amer. Mineralogis1Vol. 4, (1956)
7Martinez, J. D., "Photometer method for study in!quartz grain orientation," Bulletin of AAPG, Vol. 42No.3, (1958)
8U.S. Bureau of Reclamation, Concrete ManualSeventh Edition, Denver, Colorado, (1963)
4

Graywacke Schist*
63.9 71.06
0.4 0.60
14.1 13.23
3.5 1.17
1.6 3.570.13
1.7 0.95
2.6 1.48
1.5 3.98
4.0 2.74
3.5 0.321.16
0.1 0.16
1.90.02
Table 1
CHEMICAL COMPOSITION
Orthoquartzite
Si02
Ti02
AI203Fe203FeOMnOMgO
CaO
Na20
K20H20+0
H2O
P205CO2Zr02
92.30.01.4
0.2
0.3
0.13.0
0.10.10.2
2.3
*River Portal mica schist (GC 58), three-fourths of a mile south of NyswanverSpring, Vernal Mesa, Montrose County, Colorado, Analyst George Steiger, (J. F.Hunter-Pre-Cambrian Rocks of Gunnison River, Colorado, USGS Bulletin 777,1925)
As evidence favoring sedimentary origin, the mineralogical analysis from the table of average modes shows that therelative quantities of alumina for the muscovite-biotite schist are significantly high (12 percent, based on 38.5percent of the muscovite is aluminum). Also as shown by this table, the minor quantities of sodium and potassium(present in feldspar and mica) tend to relate to sedimentary origin.
Table 2A
MODAL ANALYSIS OF PRE-CAMBRIAN ROCKS
3Minerals
Qu artzK feldsparPlagioclaseBiotiteMuscoviteSillimaniteClayZirconGarnetGrain size (mm)
42.32.3
20.331.4
1.02.7
TraceTrace
4.2
1. Biotite schist2. Mica quartz and mica augen schist3. Quartz mica schist
2
64.26.0
73.15.2
16.611.2
Trace2.0
TraceTrace2.7
12.5
9.0
2.2
5

~.'-
Qu artz}Feldspar
BiotiteSillimanite
}MuscoviteOthers
*RockHThin section
No.
P.7081P.7116P.7121P.7117P-7119P-7080
Table 2B
RESULTS OF COMBINED ROCK ANDTHIN SECTION ANALYSIS OF SPECIMEN
*1
69.5
25.0
5.5
Lim its (percent)**2 *3
66.1
28.5
5.2
68.0
22.0
10.0
Mean
67.8
25.3
6.9
Standarddeviation(percent)
1.39
2.54
2.17
PREFERRED ORIENTATION OF QUARTZ IN FOUNDATION ROCKMORROW POINT DAMSITE
Drill hole
926122631
7
*(P) Parallel to the lineationH(R) Random
Depth
142.042.325.852.626.0
177.0
Table 3
Rock
Quartz-m ica sch istQuartz-mica augen schistMica-quartz schistQuartz-mica schistQuartz-m ica sch istQuartz-mica schist
Grain orientation
Mica (P)* Quartz (R)**Mica (P). Quartz 450Mica (P), Quartz (P)Mica (P), Quartz (R)Mica (P), Quartz (R)Mica (P), Quartz (R)
Note: Muscovite-biotite schist is both linear and foliated with mica and quartz parallel to foliation.
6

Table 4
PHYSICAL PROPERTIES
Drili Depth Specific CompressiveGroup Rock type hole (feet) gravity strength psi Elasticity*
Biotite 7 103.0 2.78 4,350 0.65
sch ist 7 97.0 2.81 4,350
II Mica schist 26 96.0 3,030
31 132.0 3,530
9 92.1 4,850
Tun. 5,300
12 25.8 2.70 7,980 2.33III Quartz. 12 164.0 8,320 1.52
mica 26 42.3 12,190 6.06sch ist 26 52:6 2.70 10,860 3.23
7 177.0 2.71 14,400 2.7531 26.0 2.70 14,600 4.67
9 142.5 2.68 14,89012 92.1 15,880 2.40
IV Quartzite 7 62.7 21,210 6.4932 117.2 23,630 7.49
7 135.0 25,860 4.4812 183.0 28,900 5.68
Hornblende- 12 96.0 12,440sch ist
V Granite. 32 27.0 8,520 2.81pegmatite 10 103.7 13.140
*E x 106 psi
Table 5
STATIC LABORATORY TESTS
Drill Holes 7 and 12*
Group Rock Elasticity x 106 psi
I Soft 0.65II Moderately hard 1.3-2.2
III, V Moderately hard to hard 2.4-6.4IV Very hard
*Morrow Point Dam and Powerplant Investigations, Bureau of Reclamation, October1965 (Appendix C, Table 6)
7
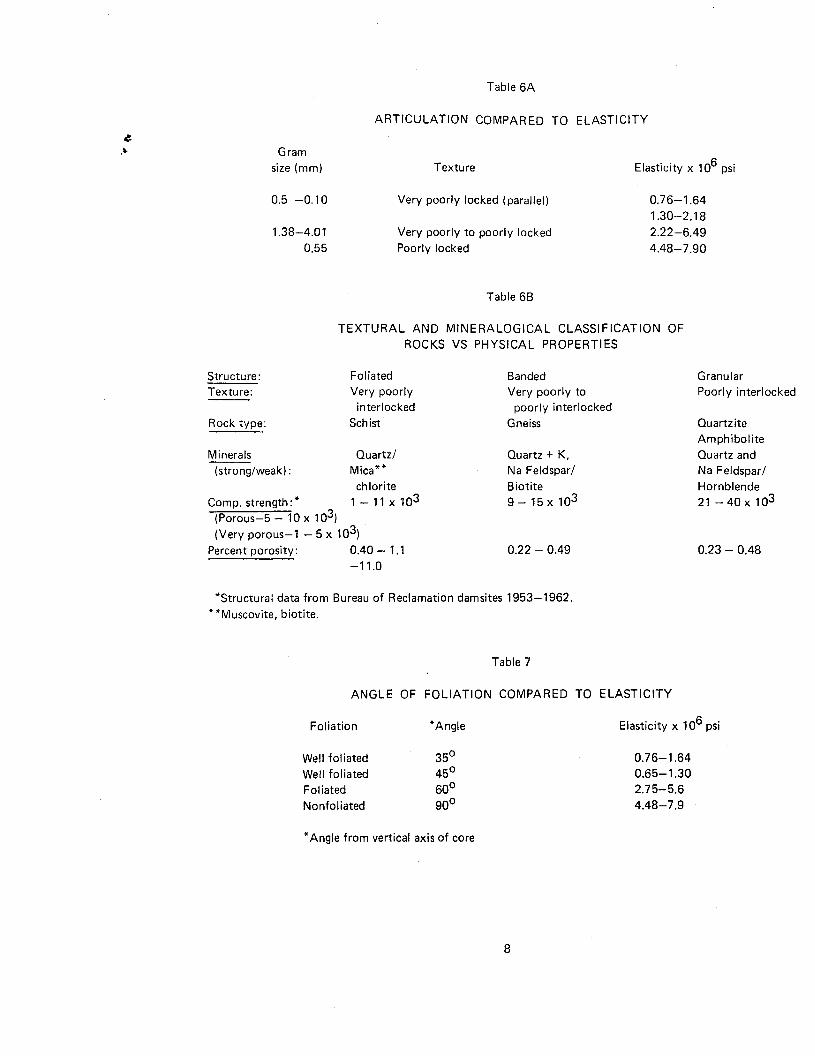
Table 6A
ARTICULATION COMPARED TO ELASTICITY
~,to. Gram
size (mm) Texture Elasticity x 106 psi
0.5 -0.10 Very poorly locked (parallel) 0.76-1.641.30-2.182.22-6.494.48-7.90
1.38-4.010.55
Very poorly to poorly lockedPoorly locked
Table 6B
TEXTURAL AND MINERALOGICAL CLASSIFICATION OFROCKS VS PHYSICAL PROPERTIES
Rock type;
FoliatedVery poorly
interlockedSch ist
BandedVery poorly to
poorly interlockedGneiss
GranularPoorly interlocked
Structure:Texture:
Minerals(strong/weak) :
Quartz/
Mica**chlorite
1 - 11 x 103
Quartz + K,Na Feldspar!Biotite9 - 15 x 103
QuartziteAmphiboliteQuartz andNa Feldspar/Hornblende21 - 40 x 103Compo strength: *
(Porous-5 - 10 x 103)(Very porous-1 - 5 x 10³)
Percent porosity: 0.40 - 1.1-11.0
0.22 - 0.49 0.23 - 0.48
*Structural data from Bureau of Reclamation dam sites 1953-1962.**Muscovite, biotite.
Table 7
ANGLE OF FOLIATION COMPARED TO ELASTICITY
Foliation *Angle Elasticity x 106 psi
Well foliatedWell foliatedFoliatedNonfoliated
350450600900
0.76-1.640.65-1.302.75-5.64.48-7.9
*Angle from vertical axis of core
8

AbsorptionGroup percen t Elasticity x 106 psi
I 0.900 2.40II 0.115 2.18
III 0.332 2.75III 0.066 3.06III 0.060 4.52III 0.066 5.88
Table 8
MICA COMPARED WITH ELASTICITY AND STRENGTHMORROW POINT DAM
Percentmica Elasticity x 106 psi Strength x 103 psi
58-6830-4010-16None
0.65-0.761.3 -5.82.2 -5.67.9
3.5- 4.53 -12
10 -2823
Table 9ABSORPTION COMPARED TO ELASTICITY
9

Figure 1. Photograph of quartz, mica-augen schist and mica quartz schist (viewing from top to bottom),
Photo PX-D.36286
Figure 2. Photograph of horneblende schist and quartz-mica schist (viewing from top to bottom). Photo
PX-D-36285
10

MINERALOGICAL BIOTITE MICA SCHIST MICACEOUS QUARTZITE OR QUARTZIT EC lASSIFICA TION SCHIST QUARTZ - MICA SCH 1ST
STRUCTURAL I Ik-- ------AUGEN GNEISS--------->j(TEXTURAL) l...c-- INC RE ASING SIZE OF EYESn_-. ICLASSIFICATION f-<u_I___- I
BECOMING PROGRESSIVELY COARSER GRAINED --------If.<n1--- -------INCREASING FOLIATION------- ------- ILl
I f-I i="
I
:
f-I f-I f-I I-' I-' I -I 1/1
1/11/11 1/11 ~I I f-11/11/1 1/1 N N
I~:r I i;j I I/I-II/Ii xl f- f- I c:(_x 1/1 U 1 0 0 ::;£SUPPLE- I Z f- lLIul'" I :i;1 II ILIU 1/1 Izl/I ~ZI/II ~1/11 1/1 C>MENTAL I a:- I 1/1 II~ILI 1 ::> ::> ILlCLASSIFICATION I zOx ~ILII~~I ILl I 0 0 I Q..
1 Z t: ILl U I Z f- I -I ~I ILl ILl II ILl f- 1 ~1/1
I ILl; Z f- U U 1~o I ::> I ~O I ILl 01 ~I ct c:{I::>in
Ict ~inl g inl aJl ~U IIct- 1 '. I ct (,QI I I :i II N :i
I I ~I ~I f- I II I I01 NI °1I i I
I ~i 1 II I I I
ROCK TYPE I II m Dr :1Z:OR GROUP
80%
FELDSPAR AND
100%
MUSCOVIT E
~l..-
60%
40%III QUARTZII
20%
0.1.
Figure 3. Rock classification relationship-Morrow Point Dam and Powerplant Investigations Bureau ofReclamation. October 1965
I J
a
6 /7'
//
~)/v
/
<:>
(
/'/"
V./
/'
,v(
i- ___"'hn_.~.
, a
(~ O
, ""'~f'
i
'"~a I
I! " i'-.I
'"-
<9 """ "~a
~i "" "I
~-
I
15000
a
~ 12000
....
."J:I-<.!)
f5 9000crI-(f)
W~ 6000(f)(f)
W
crCl.
~ 3000()
20 30 70 8040 50 60
FOLIATION (DEGREES)
-:::: 15000(f)Cl.
J:
t; /20002wcrI-(f)
w 9000>(f)(f)wcrCl. 6000~0()
3000
/0 50 7020 30 40
MICA OJo
60
Figure 4. Comparison of percent mica and angle of foliation with strength.
12

! D. BIOTITE SCHIST -I0 MICA SCHISTI
I
! + QUARTZ MICA SCHISTI
QUARTZ ITE -:
0
I III
i i +
iI
I---.--
II
i
II
I
I
[
I: '
,,i
i I
I !I
I i II
III
ii!
+ I
I~I
I
i()
i-- ----
I I jI
,. '~!~~.(
9
8
7
6
(0
0
X 5
>-I-()
I-(j) 4c:t-.IW
3
2
0POORLY
INTERLOCKEDVERY POORLY TO
POORLY INTERLOCKEp
ARTIGUL A TION
VERY POORLYINTERLOCKED
Figure 5. Rock texture versus elasticity.
13

It ESTIMATED QUARTZ
Ir-I
;
/jo
/<1:; 0
// 0
/ ()
...
( /'
,./"v
('
v -- .-.----I /
J"
.-'..-
-< .,....-'. ..
~,\0.
60
MICA (PERCENT)
40 20
8
0 70X
>-~ 6Q
~(J)
<t-I 5w
4
3
2
30 40 50 60 70
QUARTZ (PERCENT)
80 90
Figure 6. Comparison of percent quartz with elasticity.
14

I
I
----- 1------ f---m - /----------~._n_.
~BIOTITESCHIST0 MICA SCHIST -(
i + QUARTZ MICA SCHIST0 QUARTZITE
\
--'"'--\-\ +
~~j~
...........to--
--- 1-----
I..
\D
0
x 4
>-l-t)
I-en 3<:r-1W
7
6
5
2
00.2 0.4 0.6 0.8 1.0
ABSORPTION PERCENT
Figure 7. Absorption versus elasticity.
15

~.~

APPENDIX
LITHOLOGIC LOG OF DRILL HOLE 12MORROW POINT DAMSITE
Rock Intervalgroup (feet) Dip 0
Description Condi,tion
0-25II 25-52 79 Mica Quartz Schist-medium grained-Micaceous, Moderately
well foliated, very poorly interlocked fractu red *53,-55 feet, at 41-42 pegmatite, at 42-52highly micaceous
III 56-63 Quartz Mica Schist-medium grained poorlyinterlocked, quartzose
II 63-91 72 Mica Quartz Schist-medium grained, very Slightlypoorly interlocked, highly micaceous, well fracturedfoliated, small amount of biotite schist,mica augen schist, at 88-90 feet pegmatite
III 91-100 Quartz Mica Schist-medium grained, poorlyinterlocked, quartzose, at 98-100 micaquartz schist
100-109 74 Muscovite Biotite Schist-medium to coarsegrained, highly micaceous, well foliated,very poorly interlocked
II 109-170 76 Mica Quartz Schist-coarse grained, very Slight topoorly interlocked highly micaceous, well moderatelyfoliated at 129 feet muscovite-biotite fracturedschist, at 150 feet, 167 -170 feet pegmatite,164 feet mica augen schist
III 170-202 55 Quartz Mica Schist-medium grained, poorly Slightly
interlocked, quartzose, at 178-181 feet fracturedmuscovite-biotite schist highly micaceous,185-190 feet mica quartz schist, 195-197hornblende schist
202-209 72 Alternating Lavers of Schist and Pegmatite-hard, medium to coarse grained
209-236 45 Muscovite Biotite Schist-med ium grained,highly micaceous, well fol iated, verypoorly interlocked, some pegmatite
III 236-246 Quartz Mica SchIst-fine grained, poorly Moderatelyinterlocked quartzose fractu red
III 246-266 Mica Augen SchIst-medium grained, very poorlyinterlocked, quartzose, small amount ofpegmatite, quartzite
* Fractu red: Slight-Spacing more than 10 feetModerate-Spacing 3 to 10 feetHighly-Spacing less than 12 inches
17
Total PercentGroup (feet) total E x 106 psi (average)
I 10 6 0.86I: II 4 3 1.20
~III 42 27 4.14II and III 59 38 1.79III and IV 18 11 1.94
IV 20 13 8.84V 3 2 2.68
18

Plate 1. Photomicrograph of Muscovite-biotite Schist (P-7O75) composed of coarse-grained euhedral mica
(showing cleavage planes) and anhedral quartz. Minor sillimanite, clay and iron oxide also occur. The grains
are poorly interlocked and the rock is well foliated.
Polarized light Magnification 1OX Photo PX-D-36283
Plate 2. Photomicrograph of Mica-quartz Schist (P-7O74) composed of medium-grained euhedral mica andanhedral quartz. The grains have smooth grain boundaries and are poorly interlocked. The mica is
frequently alined.Polarized light Magnification 1OX Photo PX-D-36284
19
Plate 3. Photomicrograph of Ouartz-mica Schist (P-7079) composed of medium-grained anhedral quartzand euhedral mica. The grains exhibit a sutured texture. The mica is alined parallel to itself .
Polarized light Magnification 10X Photo PX-D-36281
Plate 4. Photomicrograph of Horneblende Schist (P-7O77) composed of anhedral quartz and subhedral
horneblende. The rock is medium-grained with a sutured texture.
Polarized light Magnification 1OX Photo PX-D-36282
20

Plate 5. Stereo-pair of sheared surface of rock (Block No.1) Leftside. Photo PX-D-45609NA
Plate 6. Stereo-pair of rock surface showing rough places (Asperites) (Magnification 16X) .Photo
PX-D-45610NA
21

7000
6980
6960
6940
Z0
l-e(6920 >w
~w
6900
6880
6860
ft-
.'-
DH 3\
I
"",
I \,IIII
-ml III
I:
m IIII
m II I
I
I
I
m:l
>(
1IIII
I
IIII
I
I
I
I
I
I
II
/-
II
II,
-mII-III
I
-ill
-II I
II-mI I
LJ
STATIC LABORATORY TESTS OF CORES
ROCK *Exlo.p.S.i.
GROUPING
1- ----..Biotite Schilt Avera;. 0.86IL MicoSchiltAvero;e 1.20m Micoceous Quartzite or
Quartz-Mica Schist Avero;e 4.14
E = 3.1 x 10. p.s.i.
Apportioned overagelaboratory value fromstatic tests of core.
Geophone------
\
\
\
\
r\~:. \.~\
~\
3\
~\- <=
\.=. ~
- -:=~ u
'E<J>L--- '4)
L~-'" _r.f'J' Total depth_
\153'
Shot point--_~
,}E 110. Based on 1st cycle of loadin; at 1000 p...1.
---
?----?----
~~- 2~?-----=:= =::-----
EXPLORATORY TUNNEL--- u_-->-
0+20 0+60 0+800+40
TUNNEL STATIONS
RIGHT ABUTMENT
MORROW POINT DAM
Seismic measurements of rock elasticity.
Morrow Point Dam andPowerplant Investigations
Bureau of Reclamation, October 1965
22
7040
7020
6840
1+00

7.17500-70)Bureau oC Reclamation
cmNERSION FACTORS--BRITISH TO METRIC UNITS OF MEASUREMENT
The following conversIon fa.::tors aiopted ':)y the Bureau of Reclamatio:1 are those published 'oy the American Society forTestin;, and Materials (ASTM Metric Practice Guide, E 380-68) except that additional fa~tors (*) commonly u.oed inthe Bureau have been added. Further discussion of definitions of quan:ities and units is given in 'he ASTM MetricPra~tice GuIde.
The metric units and '~onversion factors adopted by the ASTM are based ::m the "International S>Jstem of Units" (designatedSI for i:>'ysteme International d'Unites), fixed by the International Committee for Weights and Measures; this system isalso known as the Giorgi or MKSA (meter-kilogram (mass)-second-ampere) system. This system has been adopted bythe International Organization for Standardization in ISO Recommendation R-31.
The metric technical unit of force is the kilogram-force; this is the force which, when applied to a body having amass of 1 kg, gives it an acceleration of 9.80665 m/sec/see, the standard acceleration of free fall toward the earth'scenter for sea level at 45 deg latitude. The metric unit of force in SI units is the newton (N), which is defined asthat force which, when applied to a body having a mass of 1 kg, gives it an acceleration of 1 m/se~/sec. These unitsmust be distinguished from the (in~onstant) local weight of a body havIng a mass of 1 kg; that is, the weight of abody is that force with which a body is attracted to the earth and is equal to the mass of a body multiplied by theacceleration due to gravity. However, because it is general practice to use "pound" rather than the technicallycorreet term "pound-force,
"the term "kilogram" (or derived mass unit) has been used in this guide instead of "kilogram-
force" in expressing the conversion factors for forces. The newton unit of force will find in,:reasing use, and isessential in SI units.
Where approximate or nominal English units are used to express a value or range of values, the con-verted metric unitsin parentheses are also approximate or nJminal. Where precise English units are '-Ised, the converted metric unitsare expressed as equally significant values.
Multiply
~QUANTITIES AND UNITS OF SPACE
By
LENGTH
To obtain
Mil. . . . . . . . . . . . .Inches . . . . . . .
. . . . . . .Feet.
. . . . . . . .
. . . . . . . .Yards. . . . . . .Miles (statute),
. . . . . . . . . . . .
25.4 (exactly). . . . Micron25.4 (exactly). . . . . . . . Millimeters2.54 (exactly)*. . . . . . . Centimeters
30.48 (exactly). . . . Centimeters0.3048 (exactly)*. . . . . . Meters0.0003048(exactly)* . KilometersO.9144(exactly). . . Meters
1,609.344(exactly)*. . . Meters1.609344(exactly). . Kilometers
AREA
Squareinches. . . . . . . .Squarefeet. . . . . . . . .
. . . . .Squareyards. . . . . . . .Acres. . . .
. . . . . . .Squa.remiles. . . . .
6.4516(exactly). . Squarecentimeters929.03*. . . . . . . Squarecentimeters
O.092903. . . Squaremeters0.836127 . . . . . . . . . Squaremeters0.40469*. . . . . . Hectares
4,046.9*. . . . . SquaremetersO.0040469*. . . . Squarekilometers2.58999. . . . SQua.rekllometers
VOLUME
Cubic inches. . . .Cubic feet. . . . . . . . . .Cubic yards. .
16.3871. . . . . . . . . . Cubiccentimeters0.0283168.. . . . . . . . CubicmetersO.764555. . . . . . . . . Cubicmeters
CAPACITY
Fluid ounces (U. S. )
Liquid pints (U. S. )
Quarts (U. S.) .. . . . . .
Gallons(U.S.). . . . . . .. . . . . . .
. . . . . .Gallons (U. K.)
. . . . . .Cubicfeet. . . . . . . . .Cubicyards.Acre-feet. . . . .
. . . . .
29.5737. . . . . . . Cubiccentlmeters29.5729. . . . . . . . . . Milliliters0.473179. . . . . . . . . Cubicdecimeters0.473166. . . . . . . . . Liters
946.358*. . . . . . . . . . Cubiccentimeters0.946331*.. . . . . . . . Liters
3,785.43* . . . . . . Cubiccentimeters3.78543. . . Cubicdecimeters3.78533.. . . . . . Liters0.00378543*.. . . . . . . Cubicmeters4.54609 . . . . . . Cubicdecimeters4.54596 . . . . . . . . . Liters
28.3160 . . . . . . Liters764.55* . . . . . . Liters
. 1,233.5*. . . . . . . . . . . Cubicmeters
.1,233,500* . . . . . . . Liters

I!Qk1!QUANTITIES AND UNITS OF MECHANICS
MultlplV BV
MASS
To obtain
Gra1ns (1/7,000 lb) . . . . . 64.79891(exactly). . MilligramsTroy ounces (480 grains). . . . . .. 31. 1035. . . . . . . GramsOunces (avdpl. . . . 28.3495. . . . . . . Grams
~~~;td~o:-,v1tooo ib): . . . . . . .. 90~:!~~5~2~7.(exa~t~y):. . . . ~li~~::::~
. . . . . .. 0.907185 Metric tonsLonq tons (2,240 lb):
.. . . .1.016.05. . . . . . . . . . . . Kilograms
FORCE/AREA
Poundsper square inch. . . . . .. 0.070307 Kilograms per square cenUmeter. . . . . .. 0.889476.. . . . Newtonsper square centimeter
Poundsper square foot. . . . . ., 4. 88243 . . . . . . . . . . Kllcqrams per square meter. . . . . ., 47.8803.. Newtonsper square meter
MASS/VOLUME(DENSITY)
1.72999 . . . . . . . . . . Grams per cubic centimeter16.0185 . . . . . . . . . . Kilograms per cub1cmeter0.0160185 . . . . Grams per cubic centimeter1. 32894 Grams Per cubic centimeter
MASS/CAPACITY
Ounces per cubic inch. . . .Poundsper cubic fool. . . .
Tons (lonq)per cub1cyard.
Ounces per gallon (D.S.) . .Ounces per gallon (U.K.) . . . . . .Pounds per gallon (D.S.) . . . . . .Pounds per gallon CU,K.} . . . . . .
7.4893.. . . . . . . . . . Gramsperliter6.2362.. . . . . . . . . . 'Gramsperliter
119.829. . . . . . . . . . . Gramsperliter99.779. . . . . . . . . . . Gramsperliter
BENDING MOMENT OR TORQUE
Inch-Pounds:: : : : : : . . . .. 7:m~~\;106:: : : : : : : ~':~~I';;;~~~'t;:sFoot-pounds.
. : : : : : :: nm~5,;107:. . ifet~r~loq~amsFoot-poundsperlnch 5.4431. . '. . . . . . . : : C:~t1~:t:~=~~amspercentimeterOunce-inches.. . . . . . . 72.008. . . . . . Gram-centimeters
Feetpersecond. . . . . . . . . . .
VELOCITY
. . . . . . .Feetperyear.. . . . . . . . . . .Milesperh\)ur. . . . . . . . . . .
. . . . . . . . . . .
30.48 (exactly),. . . . . . . Centimetersper second
8:~gi~7~~~gX~: : : if:~~{~J:~;~~~n~econd1. 609344 (exactl l. . Kilometers per hourO.44704 exacU . . . . Meters r second
ACCELERATION.
FLOW
Feet per second2 . . . . . . . . . . 0.3048* . . . . . . . . . . MetersDeTsecond2
Cubic feet per second (second-feet). . . . . . . . . . . . . . .
Cubicfeel per minute. . . . . . . .Gallons CU.S. } per minute. . . . . .
Pounds. . . . . . . . . .. . . . . .. . . . . . . . . . . . . . .
0.028317*. . . . Cubicmeterspersecond0.4719 . . . . . . . . . . Litersper secondO.06309 . . . . . . Liters per second
FORCE.
0.453592.. . . . . . . . . Kilogramst ::g~*x10-5*:" .. g~~ns
'.. ~
Multlplv To obtainBy
WORK AND ENERGY.-Britishthermalunits(Btu). . 0.252* Kilogramcalories
. 1,055.08""'"
. . . . JoulesBtuper pound. . 2.328 (exactly). . . . . . . Joulesper gramFoot-pounds. . . . . .. 1.35582.. . . . . . . . . . Joules
POWERHorsepower.. . . . . .Btuperhour. . . . . . . . . . . .Foot-pounds per second. . . . . . .
745.700. . . . . . . . . . . WattsO.293071.. . . . . . . . . Watts1.35582. . . . . Watts
HEAT TRANSFER
Btu In. /hr ft2 deg F (k.tbermal conducttvlty) . . . . . . .
Btu ftjhr ft2 de~ F . . : : :B~%%~~n~~!.(~, .t~er.m~.
DegF hr ft2/Bt~(i<;the~~' . . . .resistance). . . . . . . . . . . .
Btu/lb deg F (C. heat capacity). . . .
~~~~ ~~e;~l'diff~sivtiy)'
6:mo: : : : : : : : : : : ~l~:fi:;:/':;'::edetC
1. 4880. . . . . . . . . . . Kg cal m/hr mq deg C
0.568 MllI!watts/cff'2 deg C4. 882
"""""Kg cal/hr m deg C
1. 761"""""
Deg C cm2/mIlitwalt4.1868 .. . . . . . . . . J/~,degC1.000. . . . . . . . . . . Can2gramdegC8:~~~~.:: . . . . . . . . ~w~;ec
WATER VAPCR TRANSMISSION
Gra1ns/hr ft2 (water vaportransmission).. . . . . . . . . .Perms(permeance).. . . . . . . .Perro-inches (permeabilitv) .
MultlplV
Cubicfeet per square foot perday (seepage) . . . . . . . , . . .
Pound-seconds per square foot(viscosity) . . . . . , . . . . . .
Square feet per second (viscosity). . .Fahrenbett degrees (change).. . . . .Voltsper mIl... . . . . . . . . . .L~~~:s)r. s:u~r~ ~oo.t ~fo~t~Ohm-circular mUs per foot.Mlliicuries per cubic foot.Mllilamps per square foot. . . . . .Gallons per square yard. . . . . . .Poundsperinch. . . . . . . . . . .
16.7 . . . Grams/24hr m2O.659 . . . . . . . . . . . Metricperms1.87 . . Metricperm-centimeters
~OTHER QUANTITIES AND UNITS
By To obtain
304. 8. . . . . . . . Liters per square meter per day
Kllogram second per square meterSquare meters per secondCelsius or Kelvin degrees (change)*Kilovolts per mIllimeter
4.8824.. . . . . . . . . .0.092003*.. . . . . . . .5/9exactly. . . . . . . .0.03937.. . . .
10.764.. . . . . . . . . .O.001662. . . . . . . . .35.3147*. . . . . . . . .10.7639.. . . . . . . . .4.527219.. . . . . . . .O.17858... . . . . . . .
Lumens per square meterOhm- square millimeters per meterMUlicurles per cubic meterMilliamps per square meterUters per square meterKiloqrams per centimeter
GPO 832-013
'. . . . . . . . . . . . . . . . . . . . . . . . . . . . . . . . . . . . . . . . . . . . . . . . . . . . . . . . . . . . . . . . . . . . . . . . . . . . . . . . . . . . . . . . . . . . . . . . . . . . . . . . . . . . . . . . . . . . . . . . . . . . . . . . . . . . . . . . . . . . . . . . . . . . . . . . . . . . . . . . . . . . . . .
ABSTRACT
During the foundation investigation of schists and gneisses at Morrow Point damsite, the rock(Nx cores) was petrographically described and classified for structural tests. Petrographic andphysical tests of the core were grouped to give an overall picture of the foundation. Methodsare described for determining the petrographic characteristics such as articulation, mineralcomposition, and microstructure of the rock. Articulation and texture of the grains weredetermined on the basis of microscope examination for evaluation of bond strength.Composition of the rock was determined by modal analysis (by a method of interceptdistances) and the rocks were grouped according to minerals present. Oriented microstructuresin foliated rocks were determined by the photometer method for analysis of structure. Therelationship between elasticity and the texture, composition, and structure was compared. Therelationship between absorption and seismic wave velocity was examined. Physical propertiesby means of laboratory and seismic methods were measured for individual rock types.
.. . . . . . . . . . . . . . . . . . . . . . . . . . . . . . . . . . . . . . . . . . . . . . . . . . . . . . . . . . . . . . . . . . . . . . . . . . .. . . . . . . . . . . .. . . . . . . . . . . . . . . . . . . . . . . . . . . . . . . . . . . . . . . . . . . . . . . . . . . . . . . . . . . . . . . . . . . . . . . . . . . . . . . . . . ..
ABSTRACT
During the foundation investigation of schists and gneisses at Morrow Point damsite, the rock(Nx cores) was petrographically described and classified for structural tests. Petrographic andphysical tests of the core were grouped to give an overall picture of the foundation. Methodsare described for determining the petrographic characteristics such as articulation, mineralcomposition, and microstructure of the rock. Articulation and textUre of the grains weredetermined on the basis of microscope examination for evaluation of bond strength.Composition of the rock was determined by modal analysis (by a method of interceptdistances) and the rocks were grouped according to minerals present. Oriented microstructuresin foliated rocks were determined by the photometer method for analysis of structure. Therelationship between elasticity and the texture, composition, and structure was compared. Therelationship between absorption and seismic wave velocity was examined. Physical propertiesby means of laboratory and seismic methods were measured for individual rock types.
ABSTRACT
During the foundation investigation of schists and gneisses at Morrow Point damsite, the rock(Nx cores) was petrographically described and classified for structural tests. Petrographic andphysical tests of the core were grouped to give an overall picture of the foundation. Methodsare described for determining the petrographic characteristics such as articulation, mineralcomposition, and microstructure of the rock. Articulation and texture of the grains weredetermined on the basis of microscope examination for evaluation of bond strength.Composition of the rock was determined by modal analysis (by a method of interceptdistances) and the rocks were grouped according to minerals present. Oriented microstructuresin foliated rocks were determined by the photometer method for analysis of structure. Therelationship between elasticity and the texture, composition, and structure was compared. Therelationship between absorption and seismic wave velocity was 'examined. Physical propertiesby means of laboratory and seismic methods were measured for individual rock types. .

-.,.(\-
REC-OCE-70-39Rubenstein, S RPETROGRAPHIC AND PHYSICAL PROPERTIES TECHNIQUES FOR STUDY OFFOUNDATION ROCK-MORROW POINT DAMSITEBur Reclam Lab Rep REC-OCE-70-39, Appl Sci Br, Oct 1970. Bureau of Reclamation, Denver,23 p, 8 fig, 12 tab, 6 plate, 8 ref, append
REC-OCE-70-39Rubenstein, S RPETROGRAPHIC AND PHYSICAL PROPERTIES TECHNIQUES FOR STUDY OFFOUNDATION ROCK-MORROW POINT DAMSITEBur Reclam Lab Rep REC.OCE-70-39, Appl Sci Br, Oct 1970. Bureau of Reclamation, Denver,23 p, 8 fig, 12 tab, 6 plate, 8 ref, append
DESCRIPTORS-/ *petrographic investigations/ *rock 'foundations/ rock mechanics/ gneisses/mineralogy/ petrofabrics/ compressive strength/ elasticity/ geology/ microstructures/ mica/'physical properties/ 'rock properties/ absorption/ schists/ specific gravity/ static testsIDENTI F I ERS-/ Morrow Point Dam, Colo/ photomicrographs/ thin sections
DESCRIPTORS-/ *petrographic investigations/ 'rock foundations/ rock mechanics/ gneisses/mineralogy/ petrofabrics/ compressive strength/ elasticity/ geology/ microstructures/ mica/*physical properties/ *rock properties/ absorption/ schists/ specific gravity/ static testsIDENTIFIERS-/ Morrow Point Dam, Colo/ photomicrographs/ thin sections
REC-OCE-70-39Rubenstein, S RPETROGRAPHIC AND PHYSICAL PROPERTIES TECHNIQUES FOR STUDY OFFOUNDATION ROCK-MORROW POINT DAMSITEBur Reclam Lab Rep REC-OCE-70-39, Appl Sci Br, Oct 1970. Bureau of Reclamation, Denver,23 p, 8 fig, 12 tab, 6 plate, 8 ref, append
REC-OCE-70-39Rubenstein, S RPETROGRAPHIC AND PHYSICAL PROPERTIES TECHNIQUES FOR STUDY OFFOUNDATION ROCK-MORROW POINT DAMSITEBur Reclam Lab Rep REC.OCE.70.39, Appl Sci Br, Oct 1970. Bureau of Reclamation, Denver,23 p, 8 fig, 12 tab, 6 plate, 8 ref, append
DESCRIPTORS-/ *petrographic investigations/ *rock foundations/ rock mechanics/ gneisses/mineralogy/ petrofabrics/ compressive strength/ elasticity/ geology/ microstructures/ mica/*physical properties/ *rock properties/ absorption/ schists/ specific gravity/ static testsIDENTIFIERS-/ Morrow Point Dam, Colo/ photomicrographs/ thin sections
DESCRIPTORS-/ *petrographic investigations/ *rock foundations/ rock mechanics/ gneisses/mineralogy/ petrofabrics/ compressive strength/ elasticity/ geology/ microstructures/ mica/*physical properties/ *rock properties/ absorption/ schists/ specific gravity/ static testsIDENTIFIERS-/ Morrow Point Dam, Colo/ photomicrographs/ thin sections