Embed Size (px)
Citation preview

S & P 500 Financials Sector7/21/2009
Jerod TiltonJon Verworn
Zachary Wang

Agenda
• Sector Weighting• Condition of Sector (5 Forces)• Economic Drivers• Performance• Relevant Facts• Recommendation• Questions
7/21/2009 2S & P 500 Financials Sector

Historical Sector Weighting
• Information Technology: Largest 18.4%• Materials: Smallest 3.2%• Financials: 13.7%• Financial Sector Weighting Trending Upwards
0%
5%
10%
15%
20%
25%
Axi
s Ti
tle
Financial Sector Relative S & P 500 Weighting
Sector Weigthing
Eight Year Average
7/21/2009 3S & P 500 Financials Sector

Sector Weighting• Financial Sector
Underweight Relative to S&P 500 by 4.4%– 4.0% excl cash
Consumer Discretionary
7.5%Consumer Staples
12.4%
Energy10.7%
Financials9.3%
Health Care13.6%
Industrials11.6%
Information Technology
20.2%
Materials4.1%
Telecommunication Services
3.3%Utilities
3.9%Cash3.5%
SIM WeightConsumer
Discretionary9.0%
Consumer Staples12.3%
Energy12.0%
Financials13.7%
Health Care14.1%
Industrials9.8%
Information Technology
18.4%
Materials3.2%
Telecommunication Services
3.4%
Utilities4.1% Cash
0.0%
S & P 500 Weight
7/21/2009 4S & P 500 Financials Sector
S&P 500 Sector Weighting
Rank Name
Market Capitalization
Billions Percentage
Percentage of SIM Shares
1 Information Technology 1,463 18.43% 28.69%2 Health Care 1,116 14.06% 9.52%3 Financials 1,088 13.70% 9.33%4 Consumer Staples 978 12.32% 6.87%5 Energy 956 12.05% 6.38%6 Industrials 778 9.79% 14.93%7 Consumer Discretionary 712 8.97% 9.27%8 Utilities 325 4.10% 2.29%9 Telecommunications Services 269 3.39% 2.86%10 Materials 254 3.20% 9.86%
S&P 500 7,939

Industry Breakout
• Industries showing declining growth
Industry Breakdown Financial Sector (as of 7/17/09)
INDUSTRY Price Per Index
Percentage in Relation to Market Cap
PRICE % CHG 1 DAY
PRICE % CHG 12 MTHS
PRICE % CHG 2 YR
PRICE % CHG 3 YR
PRICE % CHG 5 YR
PRICE % CHG 10
YRS Largest Stock
Stock Capitalization
(MM)ASSET MANAGEMENT 118.23 10.33% 0.00 -0.28 -0.41 -0.25 0.02 - BANK OF NY MELLON 35,134CONSUMER FINANCE 248.57 4.96% -0.01 -0.36 -0.63 -0.60 -0.51 -0.51 AMER EXPRESS 33,284DIVERSE FIN'L SVC 41.85 24.25% 0.00 -0.43 -0.69 -0.67 -0.63 - JPMORGAN CHASE & CO 143,914DIVERSIFIED BANKS 186.64 13.72% 0.00 -0.26 -0.56 -0.55 -0.49 -0.43 WELLS FARGO 116,400DIVERSIFIED REITS 46.51 0.62% -0.04 -0.51 -0.60 -0.54 -0.23 0.26 VORNADO REALTY TRUST 7,810INDUSTRIAL REITS 15.19 0.30% -0.02 -0.85 -0.87 -0.85 -0.78 -0.62 PROLOGIS 3,377INSURANCE-BROKERS 172.92 1.84% -0.01 -0.27 -0.26 -0.13 -0.31 -0.31 AON 10,441INSURANCE-LIFE/HLTH 155.33 6.88% -0.01 -0.43 -0.55 -0.46 -0.25 -0.28 METLIFE 24,924INSURANCE-MULTI-LINE 38.86 1.89% 0.00 -0.82 -0.92 -0.90 -0.91 -0.90 LOEWS 11,920INSURANCE-PROP/CAS 158.74 6.22% -0.01 -0.23 -0.48 -0.42 -0.30 -0.22 TRAVELERS COS (THE) 23,663INV BANK & BROKERAGE 86.15 11.96% -0.01 -0.28 -0.61 -0.51 -0.25 -0.29 GOLDMAN SACHS GROUP 78,957MULTI-SECTOR HLDGS 45.50 0.33% -0.01 -0.56 -0.43 -0.31 0.18 1.39 LEUCADIA NAT'L 4,827OFFICE REITS 64.78 0.59% -0.01 -0.50 -0.50 -0.40 -0.10 0.01 BOSTON PROPERTIES 6,609REAL ESTATE SERVICES 71.16 0.20% 0.00 -0.52 -0.75 -0.63 0.47 - CB RICHARD ELLIS GRP 2,589REGIONAL BANKS 33.81 5.83% -0.04 -0.43 -0.74 -0.73 -0.71 -0.68 PNC FIN'L SVCS GRP 17,343RESIDENTIAL REITS 45.88 0.96% -0.04 -0.50 -0.58 -0.55 -0.29 -0.17 EQUITY RESID'L 5,485RETAIL REITS 31.00 1.47% -0.04 -0.65 -0.72 -0.69 -0.51 -0.05 SIMON PROPERTY GROUP 13,875SPECIALIZED FINANCE 86.62 3.59% 0.01 -0.27 -0.63 -0.60 -0.39 0.55 CME GROUP 18,219SPECIALIZED REITS 62.31 2.92% -0.02 -0.31 -0.39 -0.37 -0.16 0.01 PUBLIC STORAGE 11,197THRIFTS&MORTGAGE FIN 5.30 1.14% -0.01 -0.76 -0.95 -0.95 -0.95 -0.94 HUDSON CITY BANC 7,442
7/21/2009 5S & P 500 Financials Sector

Top Stocks• SIM Class has 5 Financial Stocks• 3 of five in top four regarding capitalization• Capitalization has decreased significantly since 2007
S & P 500 Financial Sector Top Stocks by Market Capitalization (As of 7/17/2009)
Rank Company Name IndustryP/E 2009 % Of Total Share Price ROE
Price to Book 1 Day 12 Months 5 Years 10 Years
1 JPMORGAN CHASE & CO DIVERSE FIN'L SVC 23.8 143,914 12.58% 36.89 0.01 1.00 1.39 0.02 -0.08 0.16 -0.13BERKSHIRE HATHAWAY INSURANCE-PROP/CAS 18.3 140,004 12.24% 90,500.00 0.08 1.40 1.17 0.00 -0.22 0.04 0.31
2 WELLS FARGO DIVERSIFIED BANKS 17.6 116,400 10.18% 25.00 0.16 1.50 1.42 0.00 -0.06 0.06 0.563 BANK OF AMERICA DIVERSE FIN'L SVC 17.3 111,375 9.74% 12.89 0.04 0.50 0.87 -0.02 -0.48 -0.47 -0.224 GOLDMAN SACHS GROUP INV BANK & BROKERAGE 10.1 78,957 6.90% 156.84 0.06 1.70 1.90 0.00 -0.13 0.85 1.305 MORGAN STANLEY INV BANK & BROKERAGE 68.4 37,834 3.31% 27.99 0.07 1.00 - -0.02 -0.25 -0.20 -0.126 BANK OF NY MELLON ASSET MANAGEMENT 13.2 35,134 3.07% 29.39 0.13 1.30 2.67 -0.01 -0.15 0.17 0.017 U.S. BANCORP DIVERSIFIED BANKS 22.7 34,084 2.98% 17.96 0.13 1.60 2.12 0.00 -0.31 -0.13 0.038 AMER EXPRESS CONSUMER FINANCE 20.8 33,284 2.91% 28.03 0.26 2.60 1.34 -0.01 -0.31 -0.29 -0.149 METLIFE INSURANCE-LIFE/HLTH 12.3 24,924 2.18% 30.45 0.08 1.10 0.54 -0.02 -0.40 -0.06 -
10 STATE STREET ASSET MANAGEMENT 12.0 23,754 2.08% 48.11 0.21 1.70 2.79 0.01 -0.29 0.21 0.2733 HUDSON CITY BANC THRIFTS&MORTGAGE FIN 13.6 7,442 0.65% 14.27 0.11 1.50 6.22 0.00 -0.19 0.48 -
Financial Sector Sum* 1,143,829 Average* 14,298 29.39 0.14 1.82 2.20 (0.01) (0.36) (0.05) 0.35
*Excludes Berkshire Hathaway A Shares
Market Capitalization
(MM)
Total ReturnPrice to Sales (Current Year)
7/21/2009 6S & P 500 Financials Sector
Porters Five Forces
• Barriers to Entry– Little to none
• Competition– High
• Substitution– Little, but can be a pain
• Supplier Power– High, the Fed has a lot of control
• Buyer Power– Can go to a number of banks
7/21/2009 7S & P 500 Financials Sector
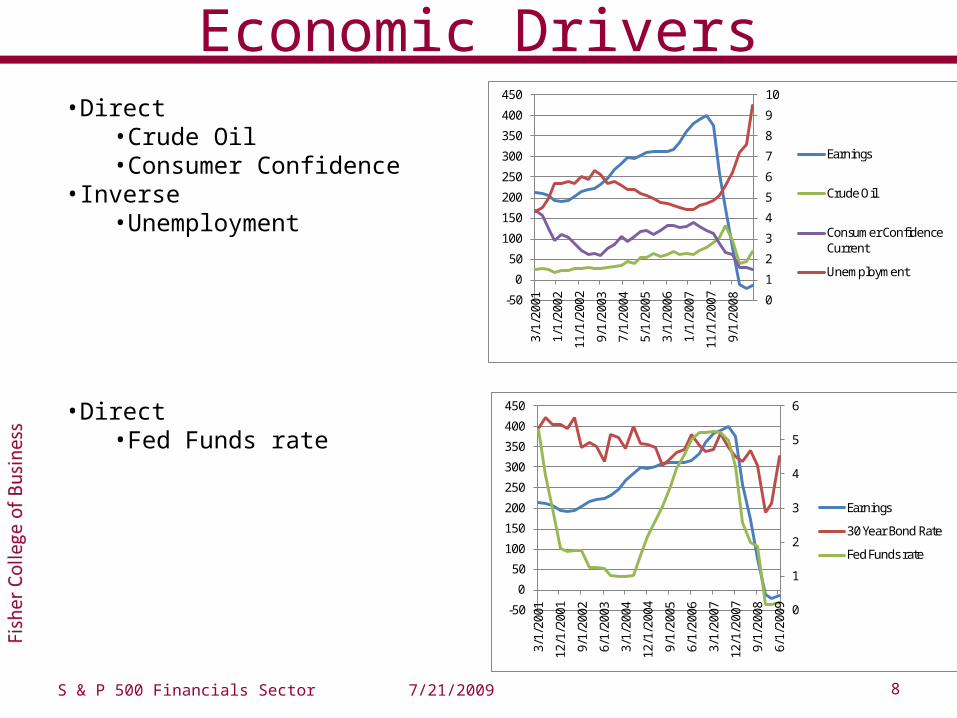
Economic Drivers
7/21/2009S & P 500 Financials Sector 8
0
1
2
3
4
5
6
7
8
9
10
-50
0
50
100
150
200
250
300
350
400
450
3/1/
2001
1/1/
2002
11/1
/200
2
9/1/
2003
7/1/
2004
5/1/
2005
3/1/
2006
1/1/
2007
11/1
/200
7
9/1/
2008
Earnings
Crude Oil
Consumer Confidence Current
Unemployment
0
1
2
3
4
5
6
-50
0
50
100
150
200
250
300
350
400
450
3/1/
2001
12/1
/200
1
9/1/
2002
6/1/
2003
3/1/
2004
12/1
/200
4
9/1/
2005
6/1/
2006
3/1/
2007
12/1
/200
7
9/1/
2008
6/1/
2009
Earnings
30 Year Bond Rate
Fed Funds rate
•Direct•Crude Oil•Consumer Confidence
•Inverse•Unemployment
•Direct•Fed Funds rate

Economic Drivers Cont’d• Direct
– Home Price– Mortgage Applications
• Directional
• Direct– Housing Starts
7/21/2009S & P 500 Financials Sector 9
-30
-20
-10
0
10
20
30
-50
0
50
100
150
200
250
300
350
400
450
3/1/
2001
12/1
/200
1
9/1/
2002
6/1/
2003
3/1/
2004
12/1
/200
4
9/1/
2005
6/1/
2006
3/1/
2007
12/1
/200
7
9/1/
2008
6/1/
2009
Earnings
Case Schiller Home Price
Mortgage Apps Purchase
0
0.5
1
1.5
2
2.5
3
3.5
4
4.5
-50
0
50
100
150
200
250
300
350
400
450
3/1/
2001
11/1
/200
1
7/1/
2002
3/1/
2003
11/1
/200
3
7/1/
2004
3/1/
2005
11/1
/200
5
7/1/
2006
3/1/
2007
11/1
/200
7
7/1/
2008
3/1/
2009
Earnings
Average Hourly Earnings
Dol to Eur
Housing Starts

Performance relative to the S&P 500
•Relative to the market (S&P 500), the financial sector has performed relatively well on average within the past decade.•However, due to the banking crisis and the recession, performance dropped significantly within the last two years.
In 2008, the financial sector’s performance fell to -30% when compared to the market.Currently, the sector has rebound a little to -27%
Financial Sector in Relation to S&P 500 10 Yr
Financial Sector in Relation to S&P 500 2 Yr
7/21/2009 10S & P 500 Financials Sector

Performance relative to other sectors
S&P 500 Operating Earnings by Economic Sector: Bottom-Up Estimates as of 07/14/2009
2007A 2008A 2009E 2010E KEY
S&P 500 82.54 49.51 56.05 74.98 A - Actual
Consumer Discretionary 13.31 5.27 7.54 13.09 E - Estimate
Consumer Staples 15.62 17.18 17.43 19.13
Energy 46.30 50.92 17.37 33.81
Financials 22.79 (21.24) 7.52 13.69
Health Care 23.31 24.48 26.53 29.03
Industrials 21.28 21.18 14.16 15.44
Information Technology 17.35 16.13 15.05 19.84
Materials 15.97 8.10 4.70 9.96
Telecommunication Services 8.27 8.22 8.36 8.51
Utilities 11.67 12.25 11.93 13.12
Operating Earnings• Relative to the other sectors, the financial sector suffered the most last year
Operating Earnings fell nearly 200% in 2008Actual earnings per share fell 108%
Potential Growth• The S&P 500 index projects a rebound of the earnings in the financial sector in 2009 to 7.52 and 13.69 in 2010.
•This increase signals a projection that inflation could set in within the next two years.
7/21/2009 11S & P 500 Financials Sector

Earnings ValuationEPS
•Prior to the recession, performance from EPS has been relatively stable during the past decade.•After the start of the banking crisis, the EPS flow has followed the market trend
ROE•ROE has been volatile during the past decade but has been downward sloping on average.
EPS
ROE
7/21/2009 12S & P 500 Financials Sector

Valuation AnalysisPrice/Book and Price/Earnings Ratios
•The P/B ratio has shown a decline in the sector within the last two years.The reason behind this decline can be tied to the banking crisisThe first quarter of 2009 has shown projections of a possible growth in the financials as the recession comes to an end.
•The increase can be attributed to FASB 157 as banks start to correctly value their assets
Price/Book
Forward P/E
7/21/2009 13S & P 500 Financials Sector

Economic IndicatorThe Federal Funds Rate has dropped to .15%
•This low rate shows that the government is attempting to stimulate the market and promote banks to lend more money in attempt to combat the recession.•Effects from the change in the Federal Funds Rate are slightly lagged.
The first quarter of 2009 shows the first sign of a rebound within the financial sector (partly due to the increase in revenue from the low federal funds rate)
Federal Funds Rate
Financial Sector Index Value
7/21/2009 14S & P 500 Financials Sector

Relevant Facts
• Top 15 issuers of general purpose credit cards for 2008 based on outstandings1. Chase - $183.32 billion2. Bank of America - $166.32 billion3. Citi - $106.74 billion4. American Express - $88.02 billion5. Capital One - $60.08 billion6. Discover - $49.69 billion7. Wells Fargo - $36.36 billion8. HSBC - $29.97 billion9. US Bank - $18.53 billion10. USAA - $17.48 billion(Source: Nilson Report, March 2009)
7/21/2009 15S & P 500 Financials Sector

Relevant Facts Cont’d• According to data from the U.S. Census Bureau, there were 159 million credit
cardholders in the United States in 2000, 173 million in 2006, and that number is projected to grow to 181 million Americans by 2010. (Source: Census Bureau)
• As of March 2009, U.S. revolving consumer debt, made up almost entirely of credit card debt, was about $950 Billion. In the fourth quarter of 2008, 13.9 percent of consumer disposable income went to service this debt. (Source: U.S. Congress' Joint Economic Committee, "Vicious Cycle: How Unfair Credit Card Company Practices Are Squeezing Consumers and Undermining the Recovery," May 2009)
• 44 percent of small-business owners identified credit cards as a source of financing that their company had used in the previous 12 months —- more than any other source of financing, including business earnings. In 1993, only 16 percent of small-businesses owners identified credit cards as a source of funding they had used in the preceding 12 months. (Source: National Small Business Association survey, 2008)
7/21/2009 16S & P 500 Financials Sector

Relevant Facts Cont’d
• Ranking of U.S. banks' reputations 1. Washington Mutual -- 64.04 2. SunTrust Banks -- 63.563. Wachovia -- 61.224. National City -- 58.835. Wells Fargo -- 57.386. US Bancorp -- 54.187. Bank of America -- 50.94NOTE: Rankings were part of a survey of 600 of the world's largest companies.(Source: Reputation Institute Global Pulse survey, June 2008)
= JPMorgan Chase
= Wells Fargo = PNC
7/21/2009 17S & P 500 Financials Sector

Relevant Facts Cont’d• Cuomo v. The Clearing House Association 6/29/09
– States can regulate nationally chartered banks
• Goldman Sachs Reports Record Earnings 7/14/09– $4.93 a share, up from $2.09 billion, or $4.58 a share, a year earlier
• JPMorgan Chase’s earnings beat expectations 7/16/09– 28c/share versus expected 4c/share
• CIT in talks with Goldman and JPMorgan Chase 7/17/09– Financier of small and middle market businesses need funds
• CIT Receives Bailout 7/20/09– From private sources
• Hudson City Earning 7/21/09– Up 18.2% to $0.26 versus expected $0.25
• Wells Fargo Earnings 7/22/09
7/21/2009S & P 500 Financials Sector 18

Potential Causes for Downside• More Bank Failures• Deeper Recession
– e.g. Double-dip Recession
• Low Investor Confidence• Federal Funds Rate Increase• Increased Regulation• Credit Card Defaults Due to unemployment• Lack of Dividends• Toxic Assets
7/21/2009 19S & P 500 Financials Sector

Potential Causes for Upsides
• Systemic recovery—high beta • Less competition for those left = more market
share• Potential privatization of Social Security
savings• Increased savings trends• Purging of toxic assets
7/21/2009 20S & P 500 Financials Sector

Recommendation
• Keep financials services underweight• In the short term, returns will poor. Financial services will not out perform
the market, however, once the credit crisis and other issues are resolved, then returns will increase
• Currently risk outweighs reward. We feel that a systemic rebound can be experienced in other sectors without as much risk.
• We are bullish long term, however for the short term, we are bearish. We recommend leaving the financial services at 440 basis points underweight
7/21/2009 21S & P 500 Financials Sector

Financial Sector
Questions??
7/21/2009 22S & P 500 Financials Sector


![A PProblems[1]Tilton](https://img.pdfslide.us/doc/110x75/577d35b01a28ab3a6b912292/a-pproblems1tilton.jpg)