Embed Size (px)
Citation preview
Musti Group’s October 2020 – March 2021 Half-Year Financial Report Q2 2021
4 May 2021
1
October 2020 –
March 2021
Half-Year Financial Report
Q2/2021
1 October 2020 –
31 March 2021
Musti Group’s October 2020 – March 2021 Half-Year Financial Report Q2 2021
4 May 2021
2
Half-Year Financial Report 1 October 2020 – 31 March 2021
Accelerating growth
The figures in parentheses refer to the comparison period, i.e. the same period in the previous year, unless stated otherwise.
Musti Group’s financial year is from 1 October to 30 September.
Key figures
*) Interest and other finance income received has been reclassified from net cash flow operating activities to net cash flow from financing activities.
EUR million or as indicated 1-3/2021 1-3/2020 Change % 10/2020-
3/2021
10/2019-
3/2020 Change % FY2020
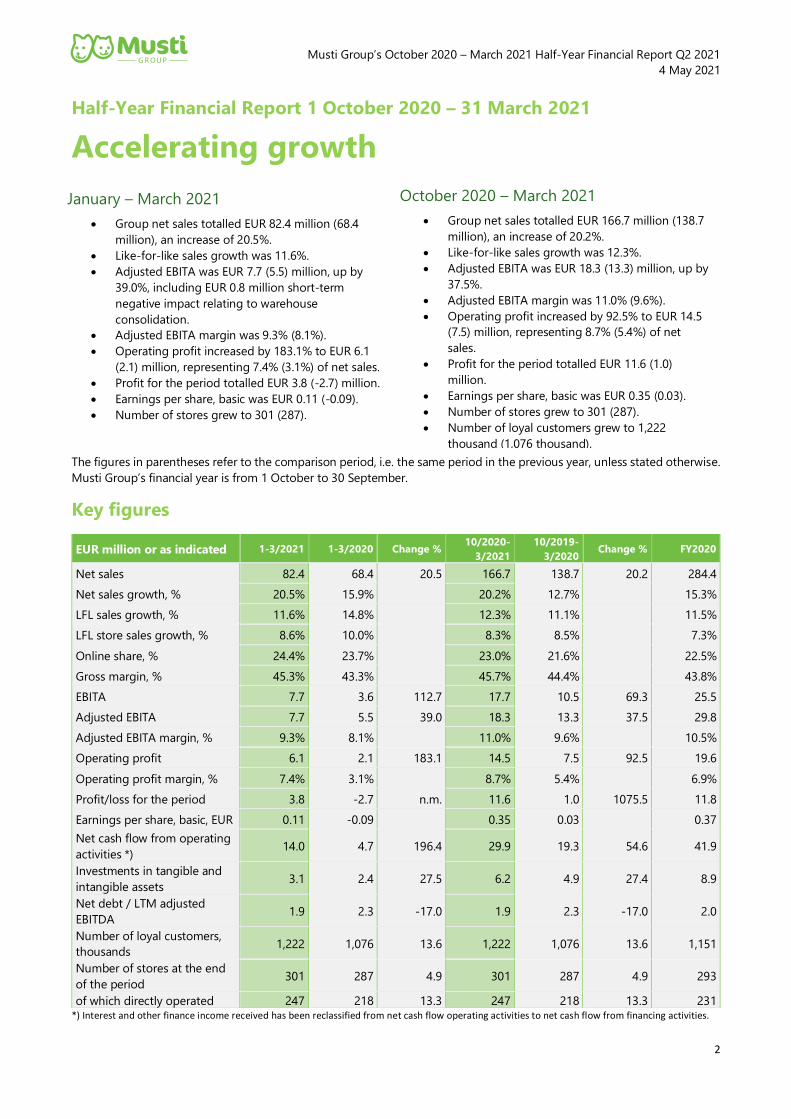
Net sales 82.4 68.4 20.5 166.7 138.7 20.2 284.4
Net sales growth, % 20.5% 15.9% 20.2% 12.7% 15.3%
LFL sales growth, % 11.6% 14.8% 12.3% 11.1% 11.5%
LFL store sales growth, % 8.6% 10.0% 8.3% 8.5% 7.3%
Online share, % 24.4% 23.7% 23.0% 21.6% 22.5%
Gross margin, % 45.3% 43.3% 45.7% 44.4% 43.8%
EBITA 7.7 3.6 112.7 17.7 10.5 69.3 25.5
Adjusted EBITA 7.7 5.5 39.0 18.3 13.3 37.5 29.8
Adjusted EBITA margin, % 9.3% 8.1% 11.0% 9.6% 10.5%
Operating profit 6.1 2.1 183.1 14.5 7.5 92.5 19.6
Operating profit margin, % 7.4% 3.1% 8.7% 5.4% 6.9%
Profit/loss for the period 3.8 -2.7 n.m. 11.6 1.0 1075.5 11.8
Earnings per share, basic, EUR 0.11 -0.09 0.35 0.03 0.37
Net cash flow from operating
activities *) 14.0 4.7 196.4 29.9 19.3 54.6 41.9
Investments in tangible and
intangible assets 3.1 2.4 27.5 6.2 4.9 27.4 8.9
Net debt / LTM adjusted
EBITDA 1.9 2.3 -17.0 1.9 2.3 -17.0 2.0
Number of loyal customers,
thousands 1,222 1,076 13.6 1,222 1,076 13.6 1,151
Number of stores at the end
of the period 301 287 4.9 301 287 4.9 293
of which directly operated 247 218 13.3 247 218 13.3 231
October 2020 – March 2021
• Group net sales totalled EUR 166.7 million (138.7
million), an increase of 20.2%.
• Like-for-like sales growth was 12.3%.
• Adjusted EBITA was EUR 18.3 (13.3) million, up by
37.5%.
• Adjusted EBITA margin was 11.0% (9.6%).
• Operating profit increased by 92.5% to EUR 14.5
(7.5) million, representing 8.7% (5.4%) of net
sales.
• Profit for the period totalled EUR 11.6 (1.0)
million.
• Earnings per share, basic was EUR 0.35 (0.03).
• Number of stores grew to 301 (287).
• Number of loyal customers grew to 1,222
thousand (1,076 thousand).
January – March 2021
• Group net sales totalled EUR 82.4 million (68.4
million), an increase of 20.5%.
• Like-for-like sales growth was 11.6%.
• Adjusted EBITA was EUR 7.7 (5.5) million, up by
39.0%, including EUR 0.8 million short-term
negative impact relating to warehouse
consolidation.
• Adjusted EBITA margin was 9.3% (8.1%).
• Operating profit increased by 183.1% to EUR 6.1
(2.1) million, representing 7.4% (3.1%) of net sales.
• Profit for the period totalled EUR 3.8 (-2.7) million.
• Earnings per share, basic was EUR 0.11 (-0.09).
• Number of stores grew to 301 (287).
Musti Group’s October 2020 – March 2021 Half-Year Financial Report Q2 2021
4 May 2021
3
CEO’s commentsAs Nordic societies are slowly starting to reopen and adapt to a time after the pandemic, we couldn’t be better positioned
for it. Pet adoption surged in 2020 and that surge continues as people seek for companionship and joy of pet parenthood.
The number of pet-owning households is clearly increasing leading to an expanding market opportunity for Musti Group
for many years to come. We are excited about this, as it leads to a long-lasting relationship with our new customers for years
to come. Understanding and anticipating our customers’ needs helps us create sustainable advantages to strengthen our
position further.
Looking back to recent development, I am very pleased to report our second quarter results today:
• Group net sales increased by 20.5% to EUR 82.4 million (EUR 68.4 million). The increase was largely due to like-for-
like growth in all countries and the increasing number of new customers and an increased number of directly
operated stores. Like-for-like growth amounted to 11.6% (14.8%).
• Store sales increased by 21.5% to EUR 59.3 million (EUR 48.8 million), driven by an increased number of stores and
strong like-for-like store sales growth especially in Sweden and Norway. Like-for-like store sales growth amounted
to 8.6% (10.0%).
• Online sales increased by 24.1% to EUR 20.1 million (EUR 16.2 million). Online sales accounted for 24.4% (23.7%)
of total net sales. Online sales growth was strong in Finland and Norway. In Sweden, the growth was slower due
to a short-term negative impact related to the platform change, warehouse consolidation and meeting strong
channel shift caused by the COVID-19 pandemic during the corresponding quarter previous year.
• Net cash flow from operating activities was strong and totaled EUR 14.0 million (EUR 4.7 million).
• Musti Group’s underlying growth has continued strong after the second quarter.
The puppy registrations have continued to be on a high level with 31% growth in registrations in Sweden in March 2021.
Compared to the corresponding quarter previous year, the number of Musti Group’s new puppy customers increased by
44% during the second quarter and we are clearly getting more than our share of the new puppies. What is exciting is that
we can clearly see that puppies joining the Musti system being more active and loyal and spending more. Thus, the inflow
of new customers we are getting will bring a predictable and recurring sales stream for many years to come. Growing the
share of wallet of our customers is a key part of our growth strategy. The customer groups we acquired in the last four
quarters were the best in Musti Group’s history: bigger in number, and highly engaged displaying stronger repurchase
behavior compared to any customers groups before.
Profitable growth continued in the second quarter as Musti Group’s adjusted EBITA increased by 39.0% to EUR 7.7 million
from the corresponding quarter previous year. Adjusted EBITA margin was 9.3% (8.1%). Adjusted EBITA growth was partly
offset by EUR 0.8 million additional costs due to low efficiency in Eskilstuna central warehouse as a result of the warehouse
consolidation project. This is non-recurring by nature and the efficiency is expected to normalize during the second half of
the financial year. Excluding these costs adjusted EBITA increased by 53.0% to 8.5 million. Gross margin increased to 45.3%
(43.3%) due to more efficient marketing campaigns, favourable product mix and efficient supply chain management.
Operating profit increased by 183.1% to EUR 6.1 million (EUR 2.1 million).
Adjusted EBITA margin increased to 12.5% in Sweden and was on the previous year’s level in Finland at 22.8%. In Norway,
the overall growth and profitability trend has been exceeding our expectations. The latest opened stores and won new
customers have turned out even more profitable than earlier as our brand awareness is growing nationwide and we have
finetuned our location strategy. In the second quarter, the adjusted EBITA margin increased to 16.0% in Norway.
The board has reviewed the long-term financial targets as published earlier today. We are well on track and committed on
delivering on our plan and the updated long-term financial targets. We continue to focus on our priorities: growing
profitably, winning new customers, and systematically growing the share of wallet with our customers, supported by the
expanding selection of products and services in our continuously developing Musti Group ecosystem. In doing so, we will
strengthen our position as the market leader as we move towards time after the pandemic – and beyond. We look forward
to a future marked by ongoing innovation, winning customer hearts and minds and growing market share.
David Rönnberg,
CEO
Musti Group’s October 2020 – March 2021 Half-Year Financial Report Q2 2021
4 May 2021
4
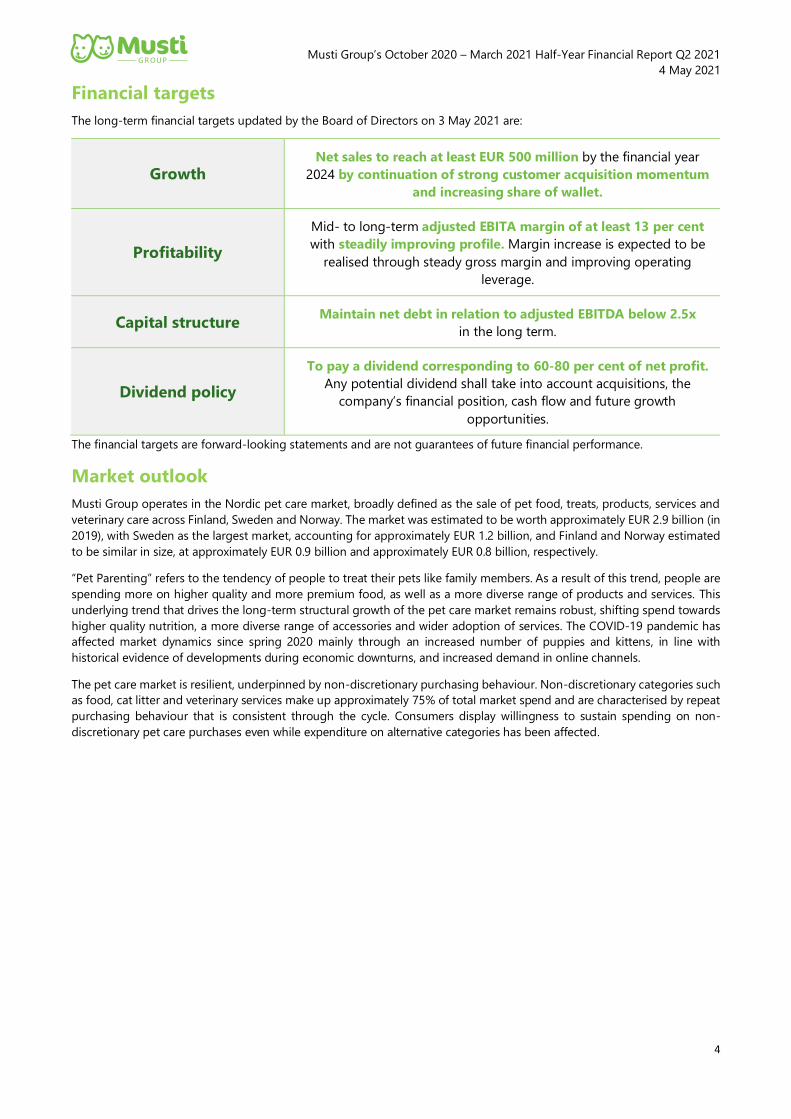
Financial targets
The long-term financial targets updated by the Board of Directors on 3 May 2021 are:
Growth Net sales to reach at least EUR 500 million by the financial year
2024 by continuation of strong customer acquisition momentum
and increasing share of wallet.
Profitability
Mid- to long-term adjusted EBITA margin of at least 13 per cent
with steadily improving profile. Margin increase is expected to be
realised through steady gross margin and improving operating
leverage.
Capital structure Maintain net debt in relation to adjusted EBITDA below 2.5x
in the long term.
Dividend policy
To pay a dividend corresponding to 60-80 per cent of net profit.
Any potential dividend shall take into account acquisitions, the
company’s financial position, cash flow and future growth
opportunities.
The financial targets are forward-looking statements and are not guarantees of future financial performance.
Market outlook
Musti Group operates in the Nordic pet care market, broadly defined as the sale of pet food, treats, products, services and
veterinary care across Finland, Sweden and Norway. The market was estimated to be worth approximately EUR 2.9 billion (in
2019), with Sweden as the largest market, accounting for approximately EUR 1.2 billion, and Finland and Norway estimated
to be similar in size, at approximately EUR 0.9 billion and approximately EUR 0.8 billion, respectively.
“Pet Parenting” refers to the tendency of people to treat their pets like family members. As a result of this trend, people are
spending more on higher quality and more premium food, as well as a more diverse range of products and services. This
underlying trend that drives the long-term structural growth of the pet care market remains robust, shifting spend towards
higher quality nutrition, a more diverse range of accessories and wider adoption of services. The COVID-19 pandemic has
affected market dynamics since spring 2020 mainly through an increased number of puppies and kittens, in line with
historical evidence of developments during economic downturns, and increased demand in online channels.
The pet care market is resilient, underpinned by non-discretionary purchasing behaviour. Non-discretionary categories such
as food, cat litter and veterinary services make up approximately 75% of total market spend and are characterised by repeat
purchasing behaviour that is consistent through the cycle. Consumers display willingness to sustain spending on non-
discretionary pet care purchases even while expenditure on alternative categories has been affected.
Musti Group’s October 2020 – March 2021 Half-Year Financial Report Q2 2021
4 May 2021
5
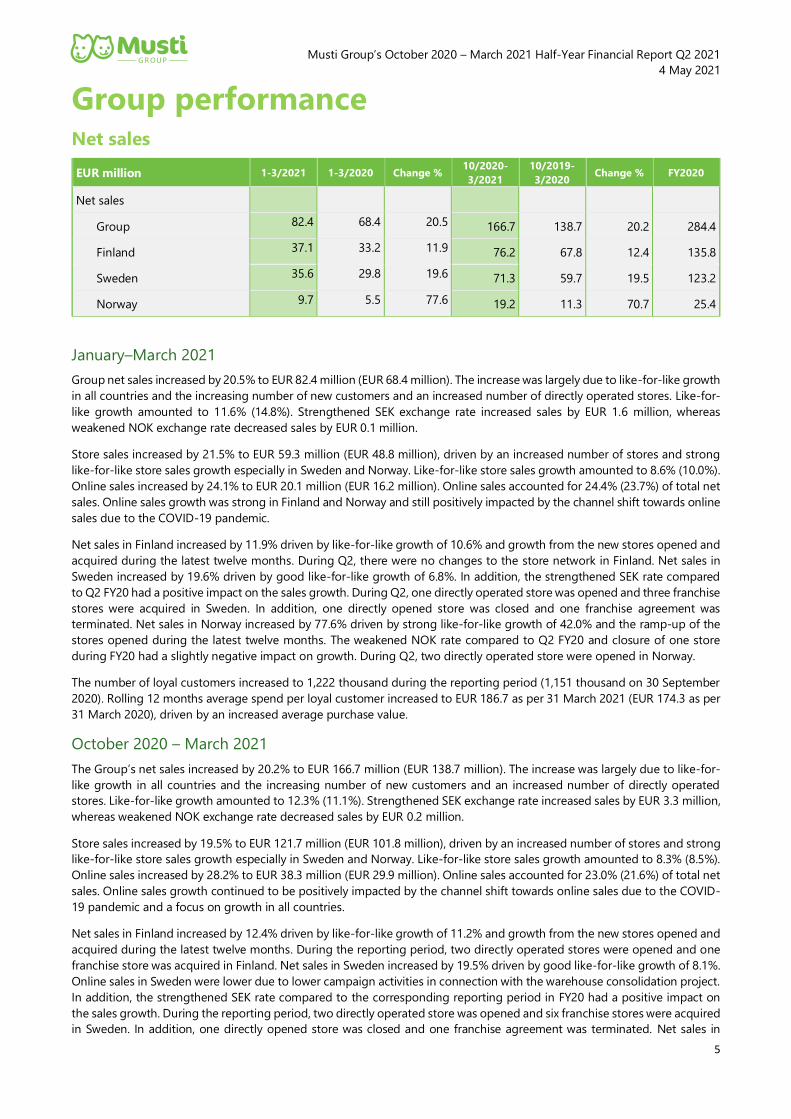
Group performance Net sales
EUR million 1-3/2021 1-3/2020 Change % 10/2020-
3/2021 10/2019-
3/2020 Change % FY2020
Net sales
Group 82.4 68.4 20.5 166.7 138.7 20.2 284.4
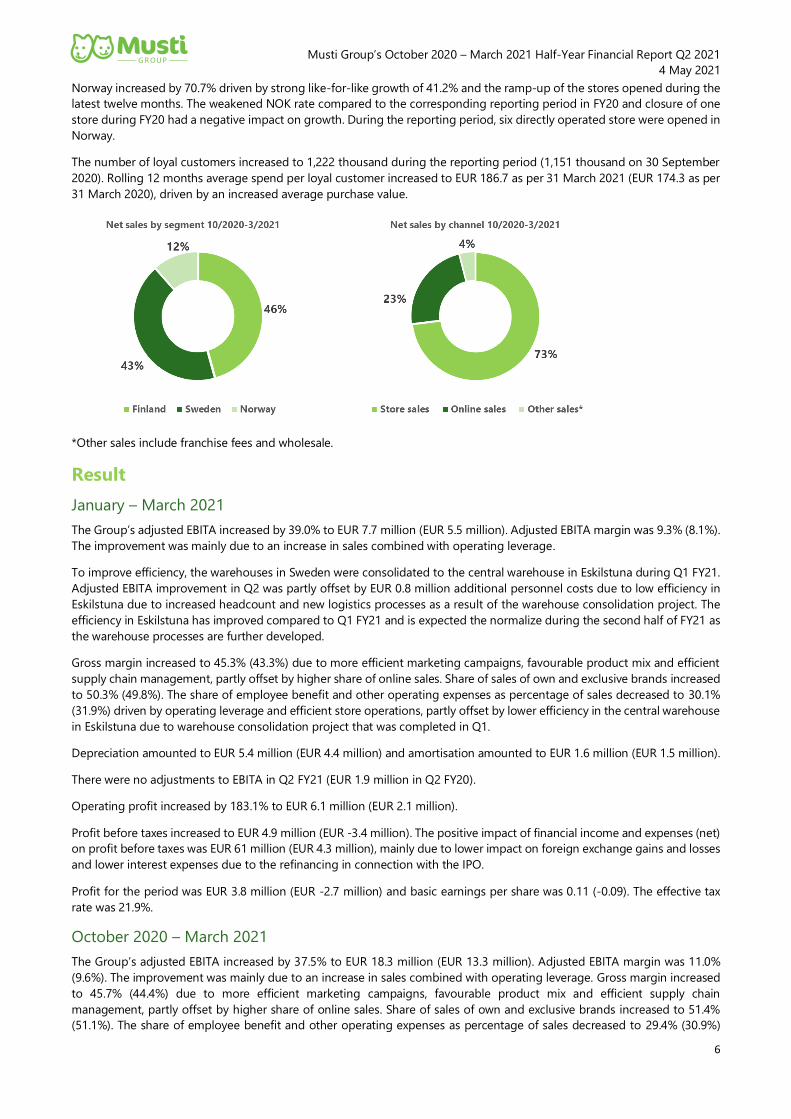
Finland 37.1 33.2 11.9 76.2 67.8 12.4 135.8
Sweden 35.6 29.8 19.6 71.3 59.7 19.5 123.2
Norway 9.7 5.5 77.6 19.2 11.3 70.7 25.4
January–March 2021
Group net sales increased by 20.5% to EUR 82.4 million (EUR 68.4 million). The increase was largely due to like-for-like growth
in all countries and the increasing number of new customers and an increased number of directly operated stores. Like-for-
like growth amounted to 11.6% (14.8%). Strengthened SEK exchange rate increased sales by EUR 1.6 million, whereas
weakened NOK exchange rate decreased sales by EUR 0.1 million.
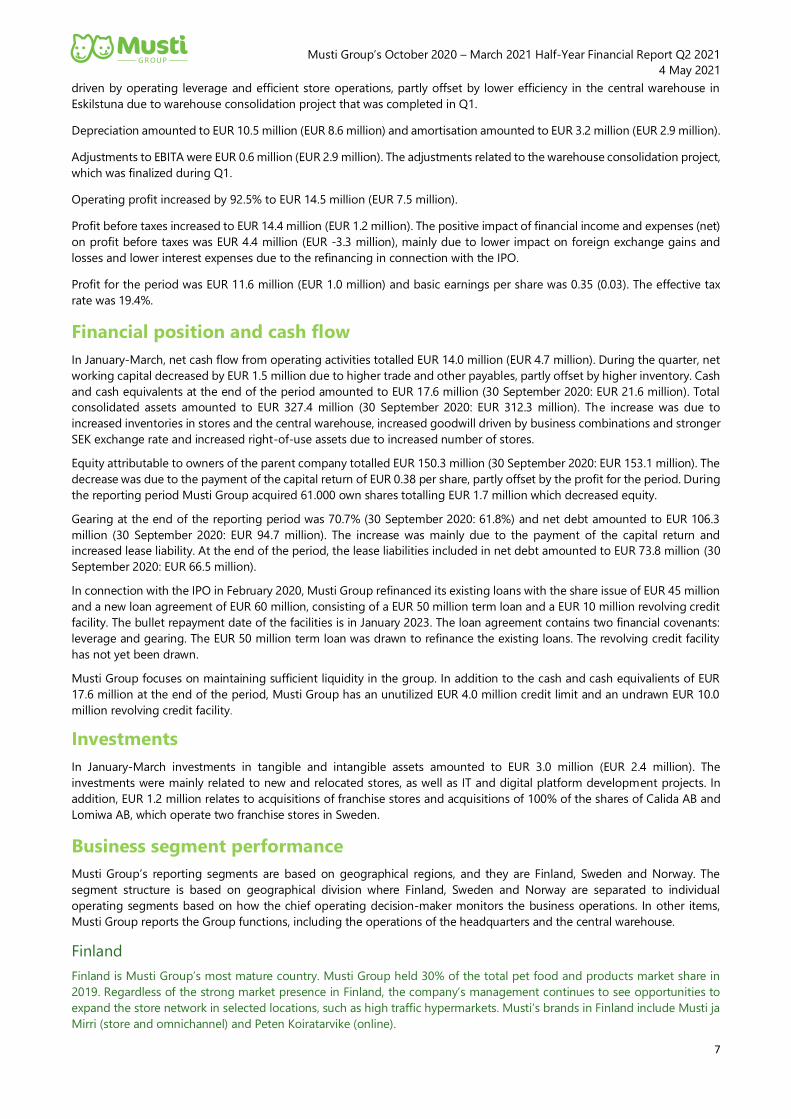
Store sales increased by 21.5% to EUR 59.3 million (EUR 48.8 million), driven by an increased number of stores and strong
like-for-like store sales growth especially in Sweden and Norway. Like-for-like store sales growth amounted to 8.6% (10.0%).
Online sales increased by 24.1% to EUR 20.1 million (EUR 16.2 million). Online sales accounted for 24.4% (23.7%) of total net
sales. Online sales growth was strong in Finland and Norway and still positively impacted by the channel shift towards online
sales due to the COVID-19 pandemic.
Net sales in Finland increased by 11.9% driven by like-for-like growth of 10.6% and growth from the new stores opened and
acquired during the latest twelve months. During Q2, there were no changes to the store network in Finland. Net sales in
Sweden increased by 19.6% driven by good like-for-like growth of 6.8%. In addition, the strengthened SEK rate compared
to Q2 FY20 had a positive impact on the sales growth. During Q2, one directly operated store was opened and three franchise
stores were acquired in Sweden. In addition, one directly opened store was closed and one franchise agreement was
terminated. Net sales in Norway increased by 77.6% driven by strong like-for-like growth of 42.0% and the ramp-up of the
stores opened during the latest twelve months. The weakened NOK rate compared to Q2 FY20 and closure of one store
during FY20 had a slightly negative impact on growth. During Q2, two directly operated store were opened in Norway.
The number of loyal customers increased to 1,222 thousand during the reporting period (1,151 thousand on 30 September
2020). Rolling 12 months average spend per loyal customer increased to EUR 186.7 as per 31 March 2021 (EUR 174.3 as per
31 March 2020), driven by an increased average purchase value.
October 2020 – March 2021
The Group’s net sales increased by 20.2% to EUR 166.7 million (EUR 138.7 million). The increase was largely due to like-for-
like growth in all countries and the increasing number of new customers and an increased number of directly operated
stores. Like-for-like growth amounted to 12.3% (11.1%). Strengthened SEK exchange rate increased sales by EUR 3.3 million,
whereas weakened NOK exchange rate decreased sales by EUR 0.2 million.
Store sales increased by 19.5% to EUR 121.7 million (EUR 101.8 million), driven by an increased number of stores and strong
like-for-like store sales growth especially in Sweden and Norway. Like-for-like store sales growth amounted to 8.3% (8.5%).
Online sales increased by 28.2% to EUR 38.3 million (EUR 29.9 million). Online sales accounted for 23.0% (21.6%) of total net
sales. Online sales growth continued to be positively impacted by the channel shift towards online sales due to the COVID-
19 pandemic and a focus on growth in all countries.
Net sales in Finland increased by 12.4% driven by like-for-like growth of 11.2% and growth from the new stores opened and
acquired during the latest twelve months. During the reporting period, two directly operated stores were opened and one
franchise store was acquired in Finland. Net sales in Sweden increased by 19.5% driven by good like-for-like growth of 8.1%.
Online sales in Sweden were lower due to lower campaign activities in connection with the warehouse consolidation project.
In addition, the strengthened SEK rate compared to the corresponding reporting period in FY20 had a positive impact on
the sales growth. During the reporting period, two directly operated store was opened and six franchise stores were acquired
in Sweden. In addition, one directly opened store was closed and one franchise agreement was terminated. Net sales in
Musti Group’s October 2020 – March 2021 Half-Year Financial Report Q2 2021
4 May 2021
6
Norway increased by 70.7% driven by strong like-for-like growth of 41.2% and the ramp-up of the stores opened during the
latest twelve months. The weakened NOK rate compared to the corresponding reporting period in FY20 and closure of one
store during FY20 had a negative impact on growth. During the reporting period, six directly operated store were opened in
Norway.
The number of loyal customers increased to 1,222 thousand during the reporting period (1,151 thousand on 30 September
2020). Rolling 12 months average spend per loyal customer increased to EUR 186.7 as per 31 March 2021 (EUR 174.3 as per
31 March 2020), driven by an increased average purchase value.
*Other sales include franchise fees and wholesale.
Result
January – March 2021
The Group’s adjusted EBITA increased by 39.0% to EUR 7.7 million (EUR 5.5 million). Adjusted EBITA margin was 9.3% (8.1%).
The improvement was mainly due to an increase in sales combined with operating leverage.
To improve efficiency, the warehouses in Sweden were consolidated to the central warehouse in Eskilstuna during Q1 FY21.
Adjusted EBITA improvement in Q2 was partly offset by EUR 0.8 million additional personnel costs due to low efficiency in
Eskilstuna due to increased headcount and new logistics processes as a result of the warehouse consolidation project. The
efficiency in Eskilstuna has improved compared to Q1 FY21 and is expected the normalize during the second half of FY21 as
the warehouse processes are further developed.
Gross margin increased to 45.3% (43.3%) due to more efficient marketing campaigns, favourable product mix and efficient
supply chain management, partly offset by higher share of online sales. Share of sales of own and exclusive brands increased
to 50.3% (49.8%). The share of employee benefit and other operating expenses as percentage of sales decreased to 30.1%
(31.9%) driven by operating leverage and efficient store operations, partly offset by lower efficiency in the central warehouse
in Eskilstuna due to warehouse consolidation project that was completed in Q1.
Depreciation amounted to EUR 5.4 million (EUR 4.4 million) and amortisation amounted to EUR 1.6 million (EUR 1.5 million).
There were no adjustments to EBITA in Q2 FY21 (EUR 1.9 million in Q2 FY20).
Operating profit increased by 183.1% to EUR 6.1 million (EUR 2.1 million).
Profit before taxes increased to EUR 4.9 million (EUR -3.4 million). The positive impact of financial income and expenses (net)
on profit before taxes was EUR 61 million (EUR 4.3 million), mainly due to lower impact on foreign exchange gains and losses
and lower interest expenses due to the refinancing in connection with the IPO.
Profit for the period was EUR 3.8 million (EUR -2.7 million) and basic earnings per share was 0.11 (-0.09). The effective tax
rate was 21.9%.
October 2020 – March 2021
The Group’s adjusted EBITA increased by 37.5% to EUR 18.3 million (EUR 13.3 million). Adjusted EBITA margin was 11.0%
(9.6%). The improvement was mainly due to an increase in sales combined with operating leverage. Gross margin increased
to 45.7% (44.4%) due to more efficient marketing campaigns, favourable product mix and efficient supply chain
management, partly offset by higher share of online sales. Share of sales of own and exclusive brands increased to 51.4%
(51.1%). The share of employee benefit and other operating expenses as percentage of sales decreased to 29.4% (30.9%)
Musti Group’s October 2020 – March 2021 Half-Year Financial Report Q2 2021
4 May 2021
7
driven by operating leverage and efficient store operations, partly offset by lower efficiency in the central warehouse in
Eskilstuna due to warehouse consolidation project that was completed in Q1.
Depreciation amounted to EUR 10.5 million (EUR 8.6 million) and amortisation amounted to EUR 3.2 million (EUR 2.9 million).
Adjustments to EBITA were EUR 0.6 million (EUR 2.9 million). The adjustments related to the warehouse consolidation project,
which was finalized during Q1.
Operating profit increased by 92.5% to EUR 14.5 million (EUR 7.5 million).
Profit before taxes increased to EUR 14.4 million (EUR 1.2 million). The positive impact of financial income and expenses (net)
on profit before taxes was EUR 4.4 million (EUR -3.3 million), mainly due to lower impact on foreign exchange gains and
losses and lower interest expenses due to the refinancing in connection with the IPO.
Profit for the period was EUR 11.6 million (EUR 1.0 million) and basic earnings per share was 0.35 (0.03). The effective tax
rate was 19.4%.
Financial position and cash flow
In January-March, net cash flow from operating activities totalled EUR 14.0 million (EUR 4.7 million). During the quarter, net
working capital decreased by EUR 1.5 million due to higher trade and other payables, partly offset by higher inventory. Cash
and cash equivalents at the end of the period amounted to EUR 17.6 million (30 September 2020: EUR 21.6 million). Total
consolidated assets amounted to EUR 327.4 million (30 September 2020: EUR 312.3 million). The increase was due to
increased inventories in stores and the central warehouse, increased goodwill driven by business combinations and stronger
SEK exchange rate and increased right-of-use assets due to increased number of stores.
Equity attributable to owners of the parent company totalled EUR 150.3 million (30 September 2020: EUR 153.1 million). The
decrease was due to the payment of the capital return of EUR 0.38 per share, partly offset by the profit for the period. During
the reporting period Musti Group acquired 61.000 own shares totalling EUR 1.7 million which decreased equity.
Gearing at the end of the reporting period was 70.7% (30 September 2020: 61.8%) and net debt amounted to EUR 106.3
million (30 September 2020: EUR 94.7 million). The increase was mainly due to the payment of the capital return and
increased lease liability. At the end of the period, the lease liabilities included in net debt amounted to EUR 73.8 million (30
September 2020: EUR 66.5 million).
In connection with the IPO in February 2020, Musti Group refinanced its existing loans with the share issue of EUR 45 million
and a new loan agreement of EUR 60 million, consisting of a EUR 50 million term loan and a EUR 10 million revolving credit
facility. The bullet repayment date of the facilities is in January 2023. The loan agreement contains two financial covenants:
leverage and gearing. The EUR 50 million term loan was drawn to refinance the existing loans. The revolving credit facility
has not yet been drawn.
Musti Group focuses on maintaining sufficient liquidity in the group. In addition to the cash and cash equivalients of EUR
17.6 million at the end of the period, Musti Group has an unutilized EUR 4.0 million credit limit and an undrawn EUR 10.0
million revolving credit facility.
Investments
In January-March investments in tangible and intangible assets amounted to EUR 3.0 million (EUR 2.4 million). The
investments were mainly related to new and relocated stores, as well as IT and digital platform development projects. In
addition, EUR 1.2 million relates to acquisitions of franchise stores and acquisitions of 100% of the shares of Calida AB and
Lomiwa AB, which operate two franchise stores in Sweden.
Business segment performance
Musti Group’s reporting segments are based on geographical regions, and they are Finland, Sweden and Norway. The
segment structure is based on geographical division where Finland, Sweden and Norway are separated to individual
operating segments based on how the chief operating decision-maker monitors the business operations. In other items,
Musti Group reports the Group functions, including the operations of the headquarters and the central warehouse.
Finland
Finland is Musti Group’s most mature country. Musti Group held 30% of the total pet food and products market share in
2019. Regardless of the strong market presence in Finland, the company’s management continues to see opportunities to
expand the store network in selected locations, such as high traffic hypermarkets. Musti’s brands in Finland include Musti ja
Mirri (store and omnichannel) and Peten Koiratarvike (online).
Musti Group’s October 2020 – March 2021 Half-Year Financial Report Q2 2021
4 May 2021
8
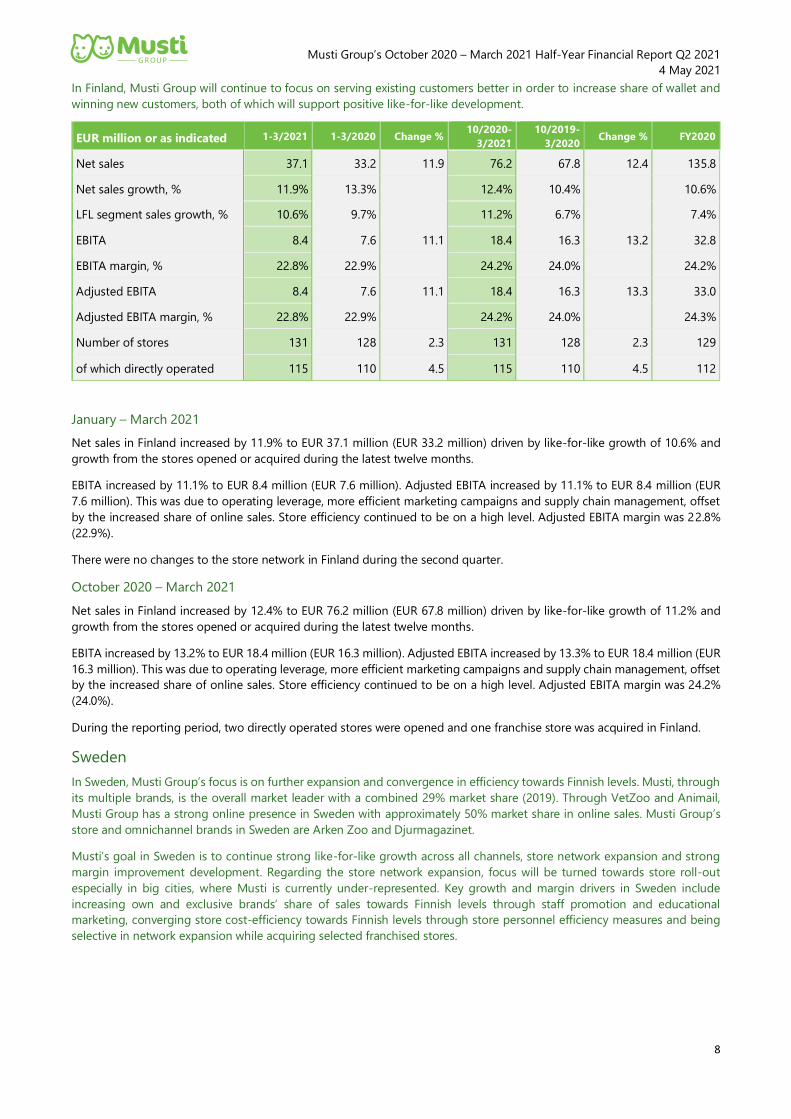
In Finland, Musti Group will continue to focus on serving existing customers better in order to increase share of wallet and
winning new customers, both of which will support positive like-for-like development.
EUR million or as indicated 1-3/2021 1-3/2020 Change % 10/2020-
3/2021
10/2019-
3/2020 Change % FY2020
Net sales 37.1 33.2 11.9 76.2 67.8 12.4 135.8
Net sales growth, % 11.9% 13.3% 12.4% 10.4% 10.6%
LFL segment sales growth, % 10.6% 9.7% 11.2% 6.7% 7.4%
EBITA 8.4 7.6 11.1 18.4 16.3 13.2 32.8
EBITA margin, % 22.8% 22.9% 24.2% 24.0% 24.2%
Adjusted EBITA 8.4 7.6 11.1 18.4 16.3 13.3 33.0
Adjusted EBITA margin, % 22.8% 22.9% 24.2% 24.0% 24.3%
Number of stores 131 128 2.3 131 128 2.3 129
of which directly operated 115 110 4.5 115 110 4.5 112
January – March 2021
Net sales in Finland increased by 11.9% to EUR 37.1 million (EUR 33.2 million) driven by like-for-like growth of 10.6% and
growth from the stores opened or acquired during the latest twelve months.
EBITA increased by 11.1% to EUR 8.4 million (EUR 7.6 million). Adjusted EBITA increased by 11.1% to EUR 8.4 million (EUR
7.6 million). This was due to operating leverage, more efficient marketing campaigns and supply chain management, offset
by the increased share of online sales. Store efficiency continued to be on a high level. Adjusted EBITA margin was 22.8%
(22.9%).
There were no changes to the store network in Finland during the second quarter.
October 2020 – March 2021
Net sales in Finland increased by 12.4% to EUR 76.2 million (EUR 67.8 million) driven by like-for-like growth of 11.2% and
growth from the stores opened or acquired during the latest twelve months.
EBITA increased by 13.2% to EUR 18.4 million (EUR 16.3 million). Adjusted EBITA increased by 13.3% to EUR 18.4 million (EUR
16.3 million). This was due to operating leverage, more efficient marketing campaigns and supply chain management, offset
by the increased share of online sales. Store efficiency continued to be on a high level. Adjusted EBITA margin was 24.2%
(24.0%).
During the reporting period, two directly operated stores were opened and one franchise store was acquired in Finland.
Sweden
In Sweden, Musti Group’s focus is on further expansion and convergence in efficiency towards Finnish levels. Musti, through
its multiple brands, is the overall market leader with a combined 29% market share (2019). Through VetZoo and Animail,
Musti Group has a strong online presence in Sweden with approximately 50% market share in online sales. Musti Group’s
store and omnichannel brands in Sweden are Arken Zoo and Djurmagazinet.
Musti’s goal in Sweden is to continue strong like-for-like growth across all channels, store network expansion and strong
margin improvement development. Regarding the store network expansion, focus will be turned towards store roll-out
especially in big cities, where Musti is currently under-represented. Key growth and margin drivers in Sweden include
increasing own and exclusive brands’ share of sales towards Finnish levels through staff promotion and educational
marketing, converging store cost-efficiency towards Finnish levels through store personnel efficiency measures and being
selective in network expansion while acquiring selected franchised stores.
Musti Group’s October 2020 – March 2021 Half-Year Financial Report Q2 2021
4 May 2021
9
EUR million or as indicated 1-3/2021 1-3/2020 Change % 10/2020-
3/2021
10/2019-
3/2020 Change % FY2020
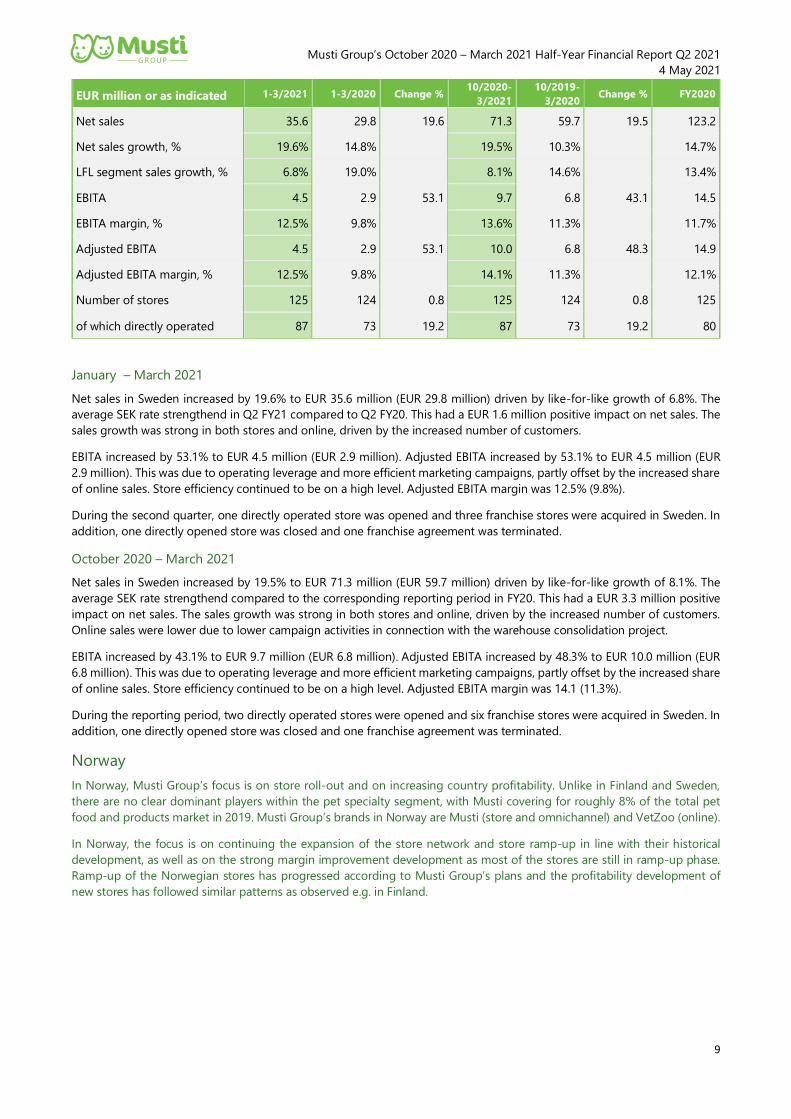
Net sales 35.6 29.8 19.6 71.3 59.7 19.5 123.2
Net sales growth, % 19.6% 14.8% 19.5% 10.3% 14.7%
LFL segment sales growth, % 6.8% 19.0% 8.1% 14.6% 13.4%
EBITA 4.5 2.9 53.1 9.7 6.8 43.1 14.5
EBITA margin, % 12.5% 9.8% 13.6% 11.3% 11.7%
Adjusted EBITA 4.5 2.9 53.1 10.0 6.8 48.3 14.9
Adjusted EBITA margin, % 12.5% 9.8% 14.1% 11.3% 12.1%
Number of stores 125 124 0.8 125 124 0.8 125
of which directly operated 87 73 19.2 87 73 19.2 80
January – March 2021
Net sales in Sweden increased by 19.6% to EUR 35.6 million (EUR 29.8 million) driven by like-for-like growth of 6.8%. The
average SEK rate strengthend in Q2 FY21 compared to Q2 FY20. This had a EUR 1.6 million positive impact on net sales. The
sales growth was strong in both stores and online, driven by the increased number of customers.
EBITA increased by 53.1% to EUR 4.5 million (EUR 2.9 million). Adjusted EBITA increased by 53.1% to EUR 4.5 million (EUR
2.9 million). This was due to operating leverage and more efficient marketing campaigns, partly offset by the increased share
of online sales. Store efficiency continued to be on a high level. Adjusted EBITA margin was 12.5% (9.8%).
During the second quarter, one directly operated store was opened and three franchise stores were acquired in Sweden. In
addition, one directly opened store was closed and one franchise agreement was terminated.
October 2020 – March 2021
Net sales in Sweden increased by 19.5% to EUR 71.3 million (EUR 59.7 million) driven by like-for-like growth of 8.1%. The
average SEK rate strengthend compared to the corresponding reporting period in FY20. This had a EUR 3.3 million positive
impact on net sales. The sales growth was strong in both stores and online, driven by the increased number of customers.
Online sales were lower due to lower campaign activities in connection with the warehouse consolidation project.
EBITA increased by 43.1% to EUR 9.7 million (EUR 6.8 million). Adjusted EBITA increased by 48.3% to EUR 10.0 million (EUR
6.8 million). This was due to operating leverage and more efficient marketing campaigns, partly offset by the increased share
of online sales. Store efficiency continued to be on a high level. Adjusted EBITA margin was 14.1 (11.3%).
During the reporting period, two directly operated stores were opened and six franchise stores were acquired in Sweden. In
addition, one directly opened store was closed and one franchise agreement was terminated.
Norway
In Norway, Musti Group’s focus is on store roll-out and on increasing country profitability. Unlike in Finland and Sweden,
there are no clear dominant players within the pet specialty segment, with Musti covering for roughly 8% of the total pet
food and products market in 2019. Musti Group’s brands in Norway are Musti (store and omnichannel) and VetZoo (online).
In Norway, the focus is on continuing the expansion of the store network and store ramp-up in line with their historical
development, as well as on the strong margin improvement development as most of the stores are still in ramp-up phase.
Ramp-up of the Norwegian stores has progressed according to Musti Group’s plans and the profitability development of
new stores has followed similar patterns as observed e.g. in Finland.
Musti Group’s October 2020 – March 2021 Half-Year Financial Report Q2 2021
4 May 2021
10
EUR million or as indicated 1-3/2021 1-3/2020 Change % 10/2020-
3/2021
10/2019-
3/2020 Change % FY2020
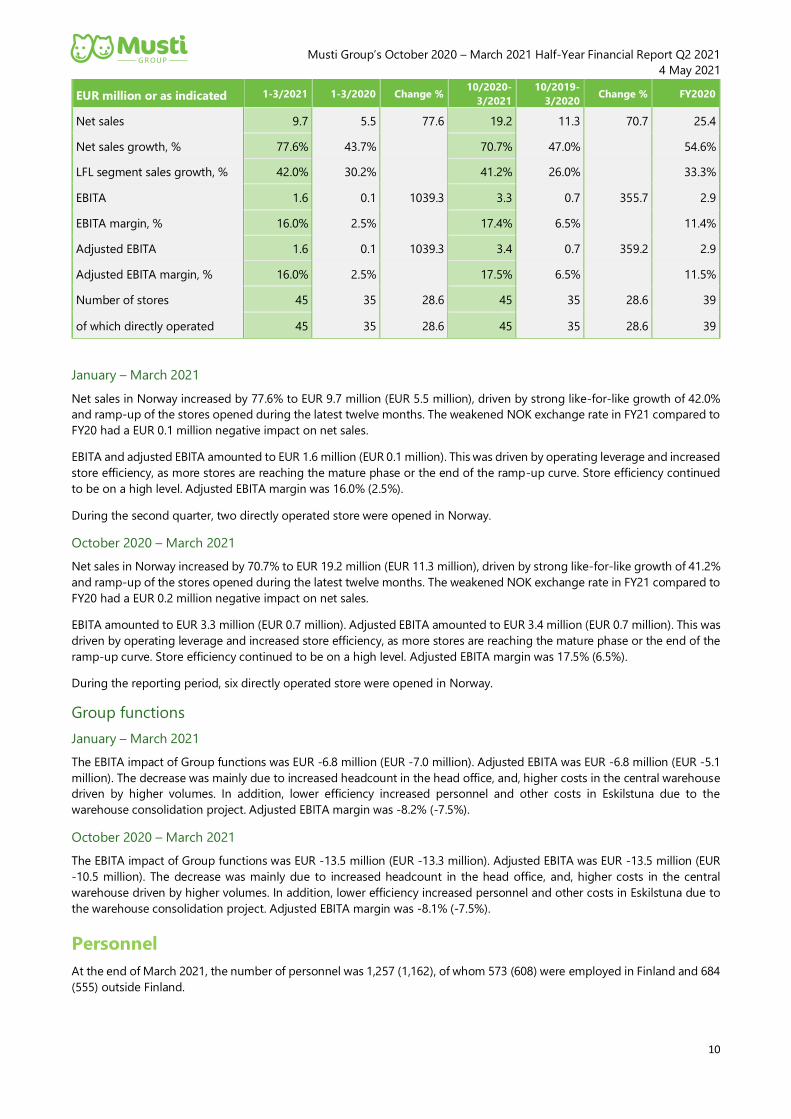
Net sales 9.7 5.5 77.6 19.2 11.3 70.7 25.4
Net sales growth, % 77.6% 43.7% 70.7% 47.0% 54.6%
LFL segment sales growth, % 42.0% 30.2% 41.2% 26.0% 33.3%
EBITA 1.6 0.1 1039.3 3.3 0.7 355.7 2.9
EBITA margin, % 16.0% 2.5% 17.4% 6.5% 11.4%
Adjusted EBITA 1.6 0.1 1039.3 3.4 0.7 359.2 2.9
Adjusted EBITA margin, % 16.0% 2.5% 17.5% 6.5% 11.5%
Number of stores 45 35 28.6 45 35 28.6 39
of which directly operated 45 35 28.6 45 35 28.6 39
January – March 2021
Net sales in Norway increased by 77.6% to EUR 9.7 million (EUR 5.5 million), driven by strong like-for-like growth of 42.0%
and ramp-up of the stores opened during the latest twelve months. The weakened NOK exchange rate in FY21 compared to
FY20 had a EUR 0.1 million negative impact on net sales.
EBITA and adjusted EBITA amounted to EUR 1.6 million (EUR 0.1 million). This was driven by operating leverage and increased
store efficiency, as more stores are reaching the mature phase or the end of the ramp-up curve. Store efficiency continued
to be on a high level. Adjusted EBITA margin was 16.0% (2.5%).
During the second quarter, two directly operated store were opened in Norway.
October 2020 – March 2021
Net sales in Norway increased by 70.7% to EUR 19.2 million (EUR 11.3 million), driven by strong like-for-like growth of 41.2%
and ramp-up of the stores opened during the latest twelve months. The weakened NOK exchange rate in FY21 compared to
FY20 had a EUR 0.2 million negative impact on net sales.
EBITA amounted to EUR 3.3 million (EUR 0.7 million). Adjusted EBITA amounted to EUR 3.4 million (EUR 0.7 million). This was
driven by operating leverage and increased store efficiency, as more stores are reaching the mature phase or the end of the
ramp-up curve. Store efficiency continued to be on a high level. Adjusted EBITA margin was 17.5% (6.5%).
During the reporting period, six directly operated store were opened in Norway.
Group functions
January – March 2021
The EBITA impact of Group functions was EUR -6.8 million (EUR -7.0 million). Adjusted EBITA was EUR -6.8 million (EUR -5.1
million). The decrease was mainly due to increased headcount in the head office, and, higher costs in the central warehouse
driven by higher volumes. In addition, lower efficiency increased personnel and other costs in Eskilstuna due to the
warehouse consolidation project. Adjusted EBITA margin was -8.2% (-7.5%).
October 2020 – March 2021
The EBITA impact of Group functions was EUR -13.5 million (EUR -13.3 million). Adjusted EBITA was EUR -13.5 million (EUR
-10.5 million). The decrease was mainly due to increased headcount in the head office, and, higher costs in the central
warehouse driven by higher volumes. In addition, lower efficiency increased personnel and other costs in Eskilstuna due to
the warehouse consolidation project. Adjusted EBITA margin was -8.1% (-7.5%).
Personnel
At the end of March 2021, the number of personnel was 1,257 (1,162), of whom 573 (608) were employed in Finland and 684
(555) outside Finland.
Musti Group’s October 2020 – March 2021 Half-Year Financial Report Q2 2021
4 May 2021
11
Changes in Group composition
On 1 January 2021, Musti Group acquired Calida AB and Lomiwa AB, which operate two franchise stores in Sweden. The
acquisitions complements Musti Group’s existing Arken Zoo chain in Sweden.
Changes in Group management
There were no changes in the Group management during October 2020 – March 2021.
On 16 April Musti Group announced, that Robert Berglund, CFO and member of the Management Team of Musti Group, has
announced that he will resign from the company. The resignation will take effect in October 2021.
Governance
Annual General Meeting
Musti Group plc's Annual General Meeting was held on 21 January 2021 at Musti Group headquarters in Helsinki, Finland.
Shareholders and their proxy representatives could participate in the Annual General Meeting and exercise their rights only
by voting in advance and by making counterproposals and presenting questions in advance. It was not possible to participate
at the meeting venue in person. The Annual General Meeting was arranged in accordance with an exceptional meeting
procedure based on the temporary legislation to limit the spread of the COVID-19 pandemic approved by the Finnish
Parliament.
The Annual General Meeting adopted the financial statements for the financial year 1 October 2019 – 30 September 2020,
discharged the Company's management from liability and resolved to support the remuneration policy for governing bodies.
The Annual General Meeting decided in accordance with the proposal of the Board of Directors that shareholders be paid a
capital return of EUR 0.38 per share to be distributed from the invested unrestricted equity reserve. The capital return was
paid to the shareholders who were registered in the shareholders’ register of Musti Group maintained by Euroclear Finland
Ltd. on the capital return record date of 25 January 2021. The capital return payment date was 2 February 2021.
The Annual General Meeting decided in accordance with the proposal of the Board of Directors that the members of the
Board of Directors be paid the following annual remuneration:
• Chairman of the Board: EUR 60,000;
• Vice-Chairman of the Board: EUR 35,000; and
• Other members of the Board of Directors: EUR 30,000.
In addition, members of the Audit Committee and the Remuneration Committee of Board of Directors will be paid the
following annual remuneration:
• Chairman of the Committee: EUR 5,000; and
• Other Committee members: EUR 2,500.
The Annual General Meeting decided that the number of members of the Board of Directors shall be four. Jeffrey David,
Ingrid Jonasson Blank and Juho Frilander were re-elected as members of the Board of Directors for a term of office expiring
at the end of the next Annual General Meeting. Further, Ilkka Laurila was elected as the new member of the Board of Directors
for a corresponding term of office.
Ernst & Young Oy, Authorized Public Accountants, was re-elected auditor of the company for a term of office ending at the
end of the next Annual General Meeting. Ernst & Young Oy has notified that Johanna Winqvist-Ilkka, Authorized Public
Accountant, will act as responsible auditor. It was decided that the remuneration to the auditor shall be paid against a
reasonable invoice approved by the Audit Committee.
The Annual General Meeting authorized the Board of Directors to decide on the repurchase of the Musti Group’s own shares
and/or on the acceptance as pledge of the company's own shares. The amount of own shares to be repurchased and/or
accepted as pledge based on this authorization shall not exceed 3,185,000 shares in total, which corresponds to
approximately 9.5 per cent of all of the shares in Musti Group. The authorization is effective until the next Annual General
Meeting, however, no longer than until 21 July 2022.
The Annual General Meeting also authorized the Board of Directors to decide on the issuance of shares as well as the issuance
of special rights entitling to shares referred to in chapter 10 section 1 of the Finnish Companies Act as follows. The amount
of shares to be issued based on this authorization shall not exceed 3,185,000 shares, which corresponds to approximately
Musti Group’s October 2020 – March 2021 Half-Year Financial Report Q2 2021
4 May 2021
12
9.5 per cent of all of the shares in Musti Group. The authorization covers both the issuance of new shares as well as the
transfer of own shares held by the company. The authorization cancels previous unused authorizations to decide on the
issuance of shares as well as on the issuance of special rights entitling to shares. The authorization is effective until the next
Annual General Meeting, however, no longer than until 21 July 2022.
Shares and shareholders
Share capital
At the end of the reporting period on 31 March 2021, Musti Group’s share capital was EUR 11,001,853.68 and total number
of shares outstanding was 33,535,453. The company has one share class. Each share carries one vote and entitles to the same
dividend.
Trading of shares
Trading of Musti Group’s share commenced on the Prelist of Nasdaq Helsinki Ltd on 13 February 2020 and on the Official
List on 17 February 2020.
The opening price of the share was EUR 24.60 on the first trading day of the second quarter on 4 January 2021. The closing
price of the share on the last trading day of the reporting period on 31 March 2021 was EUR 27.52. The highest price of the
share during January – March 2021 was EUR 28.92, the lowest EUR 23.96 and the average closing price was EUR 26.43. Share
turnover on Nasdaq Helsinki during January – March 2021 was approximately 6.07 million shares.
Musti Group’s market capitalization was EUR 923 million on 31 March 2021.
Own shares
On 31 March 2021 Musti Group held 122,000 (0) own shares representing 0.36% (0.00%) of the total number of shares and
votes. During the reporting period Musti Group excercised the authorisation granted by the AGM on 21 January 2021 to the
Board of Directors to acquire own shares and acquired in total 61 000 own shares.
Authorizations of the Board of Directors
The Annual General Meeting authorized the Board of Directors to decide on the repurchase of the Musti Group’s own shares
and/or on the acceptance as pledge of the company's own shares. The amount of own shares to be repurchased and/or
accepted as pledge based on this authorization shall not exceed 3,185,000 shares in total, which corresponds to
approximately 9.5 per cent of all of the shares in Musti Group. However, the company together with its subsidiaries cannot
at any moment own and/or hold as pledge more than 10 per cent of all the shares.
Own shares can be repurchased only using the unrestricted equity of the company at a price formed in public trading on the
date of the repurchase or otherwise at a price determined by the markets. The Board of Directors decides on all other matters
related to the repurchase and/or acceptance as pledge of own shares. Own shares can be repurchased using, inter alia,
derivatives. Own shares can be repurchased otherwise than in proportion to the shareholdings of the shareholders (directed
repurchase). This authorization cancels previous unused authorizations to repurchase the Company’s own shares and/or to
accept the Company’s own shares as pledge. The authorization is effective until the next Annual General Meeting, however,
no longer than until 21 July 2022.
The Annual General Meeting also authorized the Board of Directors to decide on the issuance of shares as well as the issuance
of special rights entitling to shares referred to in chapter 10 section 1 of the Finnish Companies Act as follows. The amount
of shares to be issued based on this authorization shall not exceed 3,185,000 shares, which corresponds to approximately
9.5 per cent of all of the shares in Musti Group.
The authorization covers both the issuance of new shares as well as the transfer of own shares held by the company. The
Board of Directors decides on all the conditions of the issuance of shares and of special rights entitling to shares. The issuance
of shares and of special rights entitling to shares may be carried out in deviation from the shareholders' pre-emptive rights
(directed issue). This authorization cancels previous unused authorizations to decide on the issuance of shares as well as on
the issuance of special rights entitling to shares. The authorization is effective until the next Annual General Meeting,
however, no longer than until 21 July 2022.
Shareholders and flagging notifications
At the end of the reporting period, the number of registered shareholders was 9,650. The proportion of nominee-registered
and foreign shareholders was 69.68% of the company’s shares. The 20 largest shareholders registered in the book-entry
Musti Group’s October 2020 – March 2021 Half-Year Financial Report Q2 2021
4 May 2021
13
register maintained by Euroclear Finland Oy held a total of 21.00% of Musti Group’s shares and votes at the end of the
reporting period.
During October 2020-March 2021, Musti Group received the following announcement under Chapter 9, Section 5 of the
Securities Markets Act:
• On 16 November 2020 Musti Group plc received a notification according to which Millan Holding S.à.r.l., a company
ultimately owned by EQT and its co-investors, had sold a total number of 1,878,862 company's shares. As a result
of the share sale, EQT's indirect holding of the shares and votes of the Musti Group decreased below 5 percent and
totalled to 0 shares and votes in the company.
A list of the largest shareholders is available on the company’s website at www.mustigroup.com/investors
Managers’ transactions
Musti Group’s managers’ transactions as of the listing have been published as stock exchange releases, and they are available
on the company’s website at www.mustigroup.com
Remuneration schemes
The Board of Directors decides on Musti Group’s remuneration schemes and plans, such as short- and long-term incentive
schemes as well as pension arrangements, upon the recommendation of the Remuneration Committee and in accordance
with the company’s effective remuneration policy. Musti Group will present a remuneration policy for approval to the
shareholders for the first time at the Annual General Meeting 2021.
Bonus scheme
The company operates a bonus scheme, which is determined by the Board of Directors of the company upon the
recommendation of the Remuneration Committee and in accordance with the company’s effective remuneration policy. The
CEO and the members of the management team are eligible to participate in the bonus scheme in accordance with the
company’s bonus policy. The payment of annual bonuses is conditional upon attainment of key performance targets of the
company.
The bonuses of the CEO and the management team are based on personal targets and certain profitability targets set for
the financial year. The maximum performance bonus is equivalent to an eight months’ full salary for the CEO and a four
months’ full salary for the members of the management team.
Long-term incentives
In May 2020, Musti Group plc’s Board decided on two new share-based long-term incentive plans for the management team
and key employees. The plans consist of a performance share plan (PSP) as the main structure, and of a restricted share plan
(RSP), which is a complementary share plan for special situations. The new share-based compensation schemes were
communicated in a stock exchange release on 7 May 2020. The plans will form a part of Musti Group plc’s remuneration
programs for its key employees, and the aim of the PSP is to align the objectives of the shareholders and key employees for
increasing the value of the Company in the long-term, to commit the key employees to the Company and to offer them
competitive incentive schemes that are based on earning and accumulating shares.
The performance share plan consists of three performance periods of three years each 2020-2022, 2021-2023 and 2022-
2024. The Board of Directors will decide separately for each performance period the plan participants, performance criteria,
and the related targets, as well as the minimum, target, and maximum reward potentially payable based on target attainment.
The Restricted Share Plan (RSP) consists of plans on which the vesting period is 12-36 months based on decisions made by
the Board of Musti Group plc. The possible rewards are paid partly in Musti Group plc’s shares and partly in cash. As of 31
March 2021, there were no participants added to the RSP plan.
In the performance period FY2020-2022, the plan has 11 participants at most and the targets for the performance period
relates to company´s total shareholder return (TSR) and adjusted EBITA. The maximum number of shares to be paid based
on the performance period FY2020-2022 is approximately 250.000 Musti Group plc´s shares. The number of shares represents
gross earning, from which the withholding of tax and possible other applicable contributions are deducted, and the
remaining net amount is paid in shares. However, the company has the right to pay the reward fully in cash under certain
circumstances. Potential rewards from the performance period FY2020-2022 will be paid out during autumn of 2022.
In the performance period FY2021-2023, the plan has 29 participants at most and the targets for the performance period
relates to company´s total shareholder return (TSR) and adjusted EBITA. The maximum number of shares to be paid based
on the performance period FY2021-2023 is approximately 130,000 Musti Group plc´s shares. The number of shares represents
Musti Group’s October 2020 – March 2021 Half-Year Financial Report Q2 2021
4 May 2021
14
gross earning, from which the withholding of tax and possible other applicable contributions are deducted, and the
remaining net amount is paid in shares. However, the company has the right to pay the reward fully in cash under certain
circumstances. Potential rewards from the performance period FY2021-2023 will be paid out during autumn of 2023.
Responsibility
Musti Group is committed to developing its responsibility policies and best practices on a long-term basis, and it is
committed to being a responsible forerunner in its industry. Musti Group is the only pet specialty company to have
committed to the United Nations Global Compact. The company is in the process of building a robust responsibility
foundation and setting targets and key performance indicators to measure the results.
Conducting operations in a sustainable, responsible and environmentally friendly way requires focused and purposeful
actions at all levels of the organization. The basis of all Musti Group’s social responsibility is a responsible supply chain,
diminishing environmental impact as well as good governance and high ethics. In addition, the company has identified three
particular focus areas in order to communicate with its stakeholders: pets and their parents, employees and communities.
The most important themes under pets and their parents are high-quality and safe products and services as well as satisfied
and loyal customers. Under employees, the most important themes are thriving experts and well-being at work, and under
communities, working for the common good and openness for new inventions.
Musti Group sets high standards for quality, safety and expertise, putting the welfare of pets, people and the environment
first. The company has already taken concrete actions to this end, having been a member of amfori Business Social
Compliance Initiative (amfori BSCI) since 2017. The company also expects its suppliers to commit to Musti’s requirements on
responsible business practices. Following the Musti Group Supplier Code of Conduct and all national laws and regulations is
imperative. The company's dedicated employee team visits the supplier sites in Europe, and also the BSCI also visits the
company's supplier sites. Furthermore, the company has a third-party partner in China who visits and audits the sites in Asia.
The company has initiated more systematic processes for supply chain sustainability especially in high-risk countries and set
the target of having all tier one suppliers in high-risk countries audited.
Musti Group’s first Non-Financial Information Report was published on 18 December 2020 and is available at
https://www.mustigroup.com/investors/reports-and-presentations/.
Risks and uncertainties
Musti Group’s risk profile follows the general risk level of the retail and grocery trade. The industry is not particularly cyclical
and not subject to rapid changes. The company regularly monitors changes in the risks and their impact on the business.
The company implements risk management continuously and systematically according to a scheduled process. The risk
management process ensures that risks related to the Group are identified, estimated and controlled in a proactive way and
the management of risks is monitored. The company’s risk management includes, among others: identification and review
of risks, risk assessment, determining and implementing control measures for the identified risks, and monitoring and
reporting of risks.
Musti Group’s risk management and risks related to the company’s operations are described in more detail in the Board of
Directors’ Report and Annual Financial Statements published on 18 December 2020 which is available at
https://www.mustigroup.com/investors/reports-and-presentations/.
Seasonality
Musti Group’s business is characterised by a generally limited seasonality effect, with the high share of recurring food and
stable products of net sales translating into low seasonality within years. However, there are certain intra-year fluctuations
that affect cash flows, sales and profitability, which are made evident by Musti Group’s financial year being from 1 October
to 30 September. Usually, the period between July to December has higher sales and profitability margins compared to
January to June, driven by higher sales of accessories and other seasonal products.
The volumes and timing of Musti Group’s sales may somewhat vary somewhat due to weather conditions, with sales of pet
clothing being primarily impacted. Cold winters and rainy weather generally result in higher sales of coats and shoes for
pets.
Significant events after the reporting period
There were no significat events after the reporting period.
Musti Group’s October 2020 – March 2021 Half-Year Financial Report Q2 2021
4 May 2021
15
Financial calendar
Musti Group’s Interim Report for October 2020-June 2021 will be pubished on 10 August 2021.
Webcast for analysts and media
A live webcast for analysts and media will be arranged on 4 May 2021 at 14:00 EEST. The event will be held in English. The
report will be presented by CEO David Rönnberg and CFO Robert Berglund.
The webcast can be followed at https://mustigroup.videosync.fi/2021-q2-results.
A recording of the webcast will be available later at the company’s website at www.mustigroup.com/investors/reports-and-
presentations/.
You can participate in the telephone conference by calling:
Finland: +358 981710310
Sweden: +46 856642651
United Kingdom: +44 3333000804
United States: +1 6319131422
The participants will be asked to provide the following PIN code: 16121928#
Helsinki, 4 May 2021
Board of Directors
The information in this Half-Year Financial Report is unaudited.
Further information:
David Rönnberg, CEO, tel. +46 70 896 6552
Robert Berglund, CFO, tel. +358 50 534 8657
Essi Nikitin, Head of IR and Communications, tel +358 50 581 1455
Distribution:
Nasdaq Helsinki
Main media
www.mustigroup.com
Musti Group’s October 2020 – March 2021 Half-Year Financial Report Q2 2021
4 May 2021
16
Condensed financial information
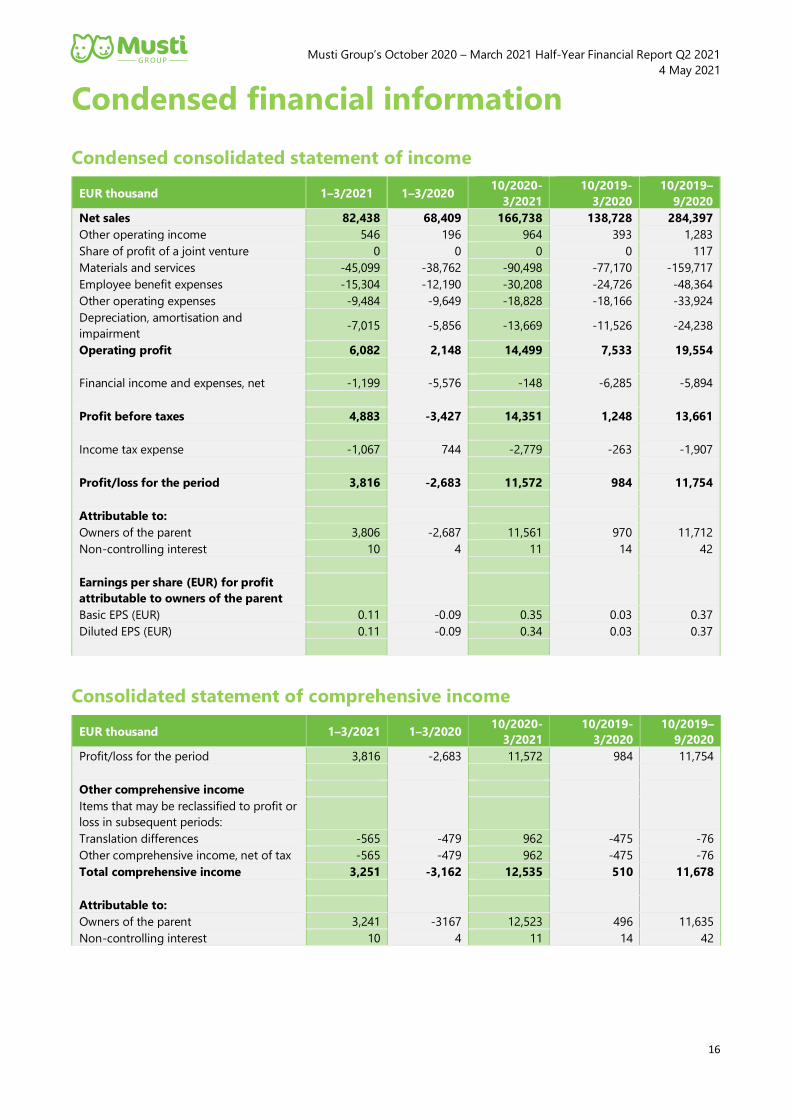
Condensed consolidated statement of income
EUR thousand 1–3/2021 1–3/2020 10/2020-
3/2021
10/2019-
3/2020
10/2019–
9/2020
Net sales 82,438 68,409 166,738 138,728 284,397
Other operating income 546 196 964 393 1,283
Share of profit of a joint venture 0 0 0 0 117
Materials and services -45,099 -38,762 -90,498 -77,170 -159,717
Employee benefit expenses -15,304 -12,190 -30,208 -24,726 -48,364
Other operating expenses -9,484 -9,649 -18,828 -18,166 -33,924
Depreciation, amortisation and
impairment -7,015 -5,856 -13,669 -11,526 -24,238
Operating profit 6,082 2,148 14,499 7,533 19,554
Financial income and expenses, net -1,199 -5,576 -148 -6,285 -5,894
Profit before taxes 4,883 -3,427 14,351 1,248 13,661
Income tax expense -1,067 744 -2,779 -263 -1,907
Profit/loss for the period 3,816 -2,683 11,572 984 11,754
Attributable to:
Owners of the parent 3,806 -2,687 11,561 970 11,712
Non-controlling interest 10 4 11 14 42
Earnings per share (EUR) for profit
attributable to owners of the parent
Basic EPS (EUR) 0.11 -0.09 0.35 0.03 0.37
Diluted EPS (EUR) 0.11 -0.09 0.34 0.03 0.37
Consolidated statement of comprehensive income
EUR thousand 1–3/2021 1–3/2020 10/2020-
3/2021
10/2019-
3/2020
10/2019–
9/2020
Profit/loss for the period 3,816 -2,683 11,572 984 11,754
Other comprehensive income
Items that may be reclassified to profit or
loss in subsequent periods:
Translation differences -565 -479 962 -475 -76
Other comprehensive income, net of tax -565 -479 962 -475 -76
Total comprehensive income 3,251 -3,162 12,535 510 11,678
Attributable to:
Owners of the parent 3,241 -3167 12,523 496 11,635
Non-controlling interest 10 4 11 14 42
Musti Group’s October 2020 – March 2021 Half-Year Financial Report Q2 2021
4 May 2021
17
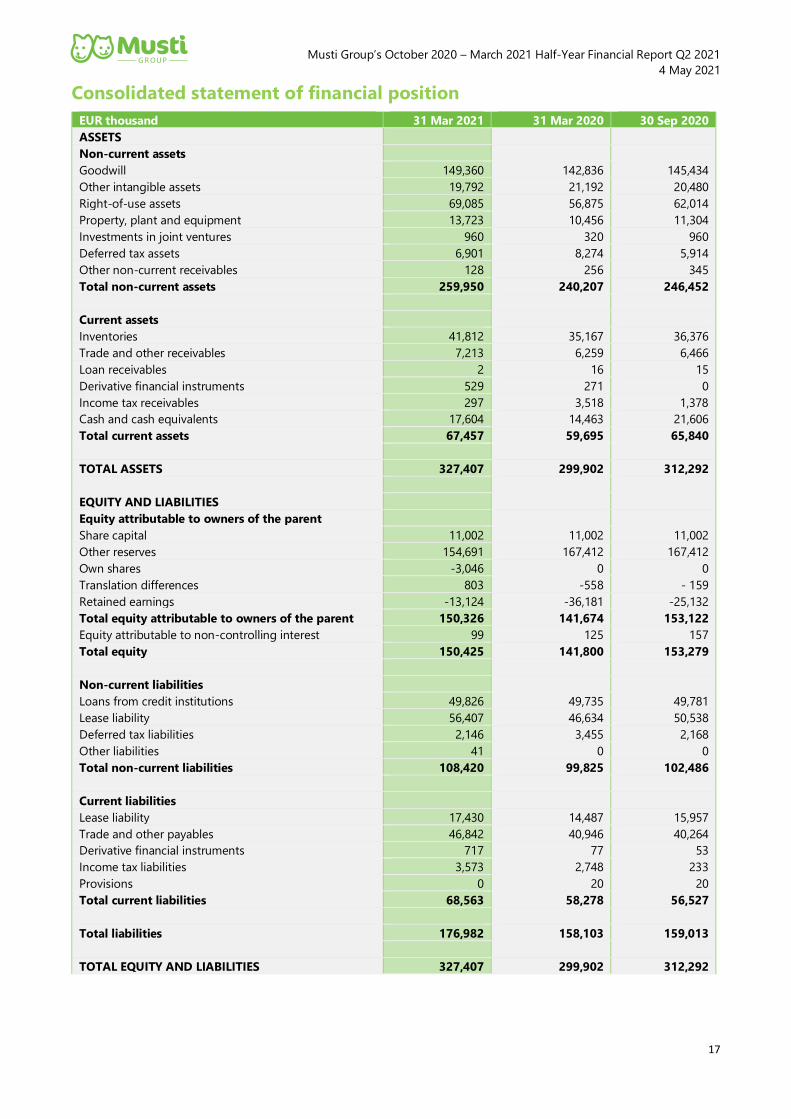
Consolidated statement of financial position
EUR thousand 31 Mar 2021 31 Mar 2020 30 Sep 2020
ASSETS
Non-current assets
Goodwill 149,360 142,836 145,434
Other intangible assets 19,792 21,192 20,480
Right-of-use assets 69,085 56,875 62,014
Property, plant and equipment 13,723 10,456 11,304
Investments in joint ventures 960 320 960
Deferred tax assets 6,901 8,274 5,914
Other non-current receivables 128 256 345
Total non-current assets 259,950 240,207 246,452
Current assets
Inventories 41,812 35,167 36,376
Trade and other receivables 7,213 6,259 6,466
Loan receivables 2 16 15
Derivative financial instruments 529 271 0
Income tax receivables 297 3,518 1,378
Cash and cash equivalents 17,604 14,463 21,606
Total current assets 67,457 59,695 65,840
TOTAL ASSETS 327,407 299,902 312,292
EQUITY AND LIABILITIES
Equity attributable to owners of the parent
Share capital 11,002 11,002 11,002
Other reserves 154,691 167,412 167,412
Own shares -3,046 0 0
Translation differences 803 -558 - 159
Retained earnings -13,124 -36,181 -25,132
Total equity attributable to owners of the parent 150,326 141,674 153,122
Equity attributable to non-controlling interest 99 125 157
Total equity 150,425 141,800 153,279
Non-current liabilities
Loans from credit institutions 49,826 49,735 49,781
Lease liability 56,407 46,634 50,538
Deferred tax liabilities 2,146 3,455 2,168
Other liabilities 41 0 0
Total non-current liabilities 108,420 99,825 102,486
Current liabilities
Lease liability 17,430 14,487 15,957
Trade and other payables 46,842 40,946 40,264
Derivative financial instruments 717 77 53
Income tax liabilities 3,573 2,748 233
Provisions 0 20 20
Total current liabilities 68,563 58,278 56,527
Total liabilities 176,982 158,103 159,013
TOTAL EQUITY AND LIABILITIES 327,407 299,902 312,292
Musti Group’s October 2020 – March 2021 Half-Year Financial Report Q2 2021
4 May 2021
18
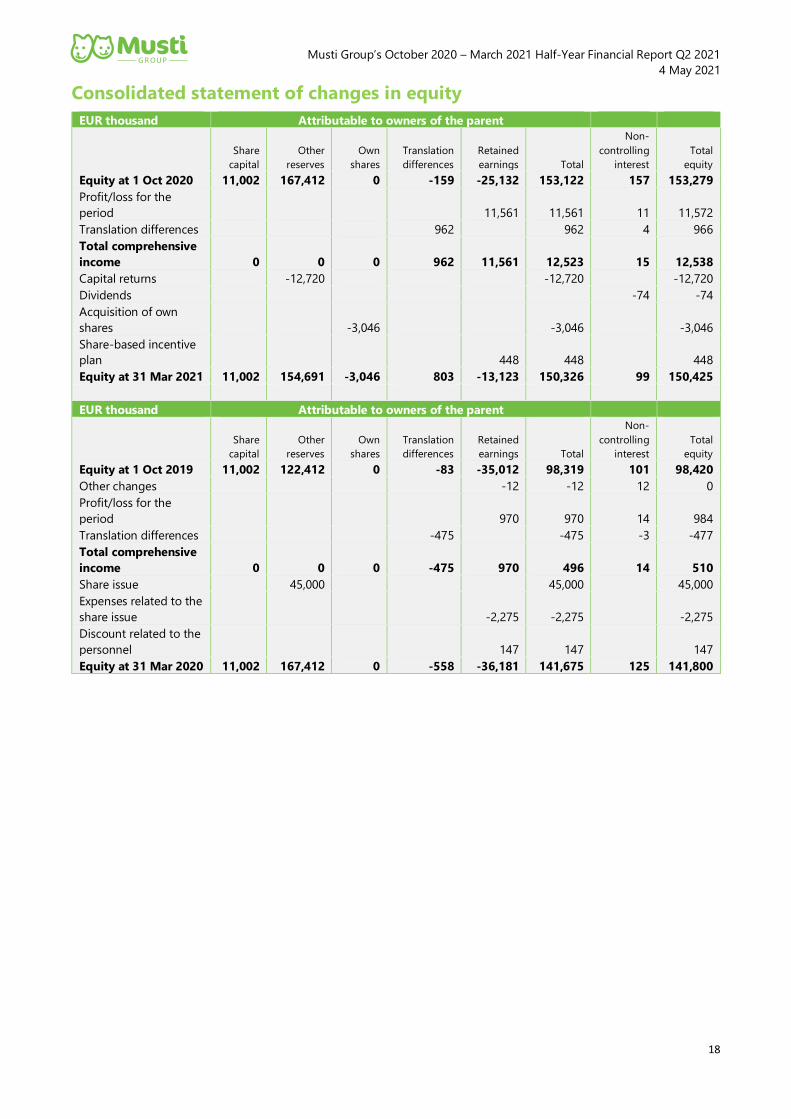
Consolidated statement of changes in equity
EUR thousand Attributable to owners of the parent
Share
capital
Other
reserves
Own
shares
Translation
differences
Retained
earnings
Total
Non-
controlling
interest
Total
equity
Equity at 1 Oct 2020 11,002 167,412 0 -159 -25,132 153,122 157 153,279
Profit/loss for the
period
11,561 11,561 11 11,572
Translation differences 962 962 4 966
Total comprehensive
income 0 0
0 962 11,561 12,523 15 12,538
Capital returns -12,720 -12,720 -12,720
Dividends -74 -74
Acquisition of own
shares
-3,046 -3,046 -3,046
Share-based incentive
plan
448 448 448
Equity at 31 Mar 2021 11,002 154,691 -3,046 803 -13,123 150,326 99 150,425
EUR thousand Attributable to owners of the parent
Share
capital
Other
reserves
Own
shares
Translation
differences
Retained
earnings
Total
Non-
controlling
interest
Total
equity
Equity at 1 Oct 2019 11,002 122,412 0 -83 -35,012 98,319 101 98,420
Other changes -12 -12 12 0
Profit/loss for the
period
970
970
14
984
Translation differences -475 -475 -3 -477
Total comprehensive
income 0 0
0 -475 970 496 14 510
Share issue 45,000 45,000 45,000
Expenses related to the
share issue
-2,275 -2,275 -2,275
Discount related to the
personnel
147 147 147
Equity at 31 Mar 2020 11,002 167,412 0 -558 -36,181 141,675 125 141,800
Musti Group’s October 2020 – March 2021 Half-Year Financial Report Q2 2021
4 May 2021
19
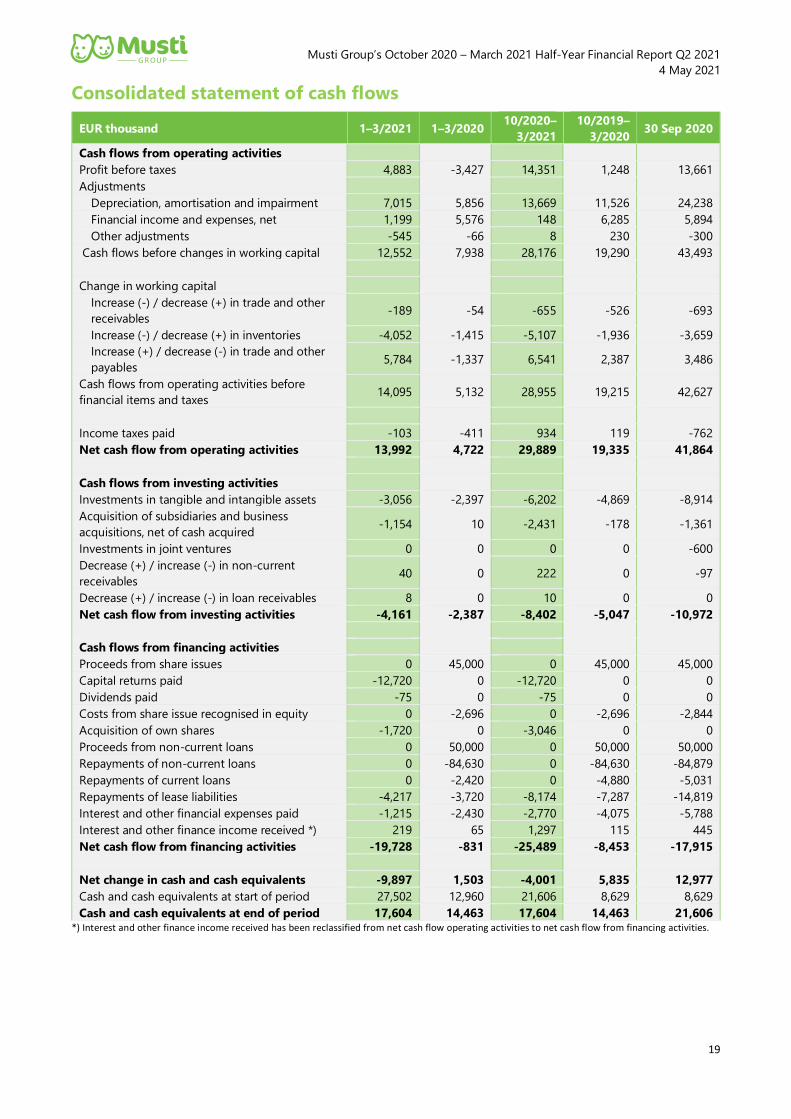
Consolidated statement of cash flows
EUR thousand 1–3/2021 1–3/2020 10/2020–
3/2021
10/2019–
3/2020 30 Sep 2020
Cash flows from operating activities
Profit before taxes 4,883 -3,427 14,351 1,248 13,661
Adjustments
Depreciation, amortisation and impairment 7,015 5,856 13,669 11,526 24,238
Financial income and expenses, net 1,199 5,576 148 6,285 5,894
Other adjustments -545 -66 8 230 -300
Cash flows before changes in working capital 12,552 7,938 28,176 19,290 43,493
Change in working capital
Increase (-) / decrease (+) in trade and other
receivables -189 -54 -655 -526 -693
Increase (-) / decrease (+) in inventories -4,052 -1,415 -5,107 -1,936 -3,659
Increase (+) / decrease (-) in trade and other
payables 5,784 -1,337 6,541 2,387 3,486
Cash flows from operating activities before
financial items and taxes 14,095 5,132 28,955 19,215 42,627
Income taxes paid -103 -411 934 119 -762
Net cash flow from operating activities 13,992 4,722 29,889 19,335 41,864
Cash flows from investing activities
Investments in tangible and intangible assets -3,056 -2,397 -6,202 -4,869 -8,914
Acquisition of subsidiaries and business
acquisitions, net of cash acquired -1,154 10 -2,431 -178 -1,361
Investments in joint ventures 0 0 0 0 -600
Decrease (+) / increase (-) in non-current
receivables 40 0 222 0 -97
Decrease (+) / increase (-) in loan receivables 8 0 10 0 0
Net cash flow from investing activities -4,161 -2,387 -8,402 -5,047 -10,972
Cash flows from financing activities
Proceeds from share issues 0 45,000 0 45,000 45,000
Capital returns paid -12,720 0 -12,720 0 0
Dividends paid -75 0 -75 0 0
Costs from share issue recognised in equity 0 -2,696 0 -2,696 -2,844
Acquisition of own shares -1,720 0 -3,046 0 0
Proceeds from non-current loans 0 50,000 0 50,000 50,000
Repayments of non-current loans 0 -84,630 0 -84,630 -84,879
Repayments of current loans 0 -2,420 0 -4,880 -5,031
Repayments of lease liabilities -4,217 -3,720 -8,174 -7,287 -14,819
Interest and other financial expenses paid -1,215 -2,430 -2,770 -4,075 -5,788
Interest and other finance income received *) 219 65 1,297 115 445
Net cash flow from financing activities -19,728 -831 -25,489 -8,453 -17,915
Net change in cash and cash equivalents -9,897 1,503 -4,001 5,835 12,977
Cash and cash equivalents at start of period 27,502 12,960 21,606 8,629 8,629
Cash and cash equivalents at end of period 17,604 14,463 17,604 14,463 21,606 *) Interest and other finance income received has been reclassified from net cash flow operating activities to net cash flow from financing activities.
Musti Group’s October 2020 – March 2021 Half-Year Financial Report Q2 2021
4 May 2021
20
Basis of preparation and accounting policies
The Group’s consolidated interim financial statements are prepared in accordance with the International Financial Reporting
Standards (IFRS) as implemented within the EU.
The interim report of 1 October 2020 – 31 March 2021 has been prepared in accordance with the IAS 34 Interim Financial
Reporting standard and the accounting principles applied in the interim report are the same as in the financial statement of
2020.
The figures of the interim report have not been audited.
The Group's consolidated financial statements are prepared in euros, which is the company's operating currency and the
company's and the Group's reporting currency. The interim report is presented in thousand euros unless otherwise stated.
Critical accounting estimates and judgments
An IFRS-compliant interim report requires the Group's management to exercise judgment and make estimates and
assumptions that affect the reported amounts of assets and liabilities and other information such as the amounts of income
and expense. Although these estimates are based on the management’s best knowledge at the time, it is possible that actual
results differ from the estimates used in the interim report.
There have not been any major changes regarding the uncertainty requiring the Group's management to exercise judgment
and make estimates and assumptions compared to the financial statement of 2020.
Key accounting considerations related to COVID-19
During the reporting period Musti Group received but didn’t apply for any financial assistance under governmental scheme.
However, the amount of the assistance was not material from a Group perspective. The group also negotiated some rent
reductions during the reporting period for which the group has not applied the IFRS 16 Covid-19 amendment. The Group's
management has assessed COVID-19 impacts by reviewing the carrying values of the balance sheet items, the review did
not indicate need for asset impairments.
Events after the reporting period
No significant events after the reporting period.
Musti Group’s October 2020 – March 2021 Half-Year Financial Report Q2 2021
4 May 2021
21
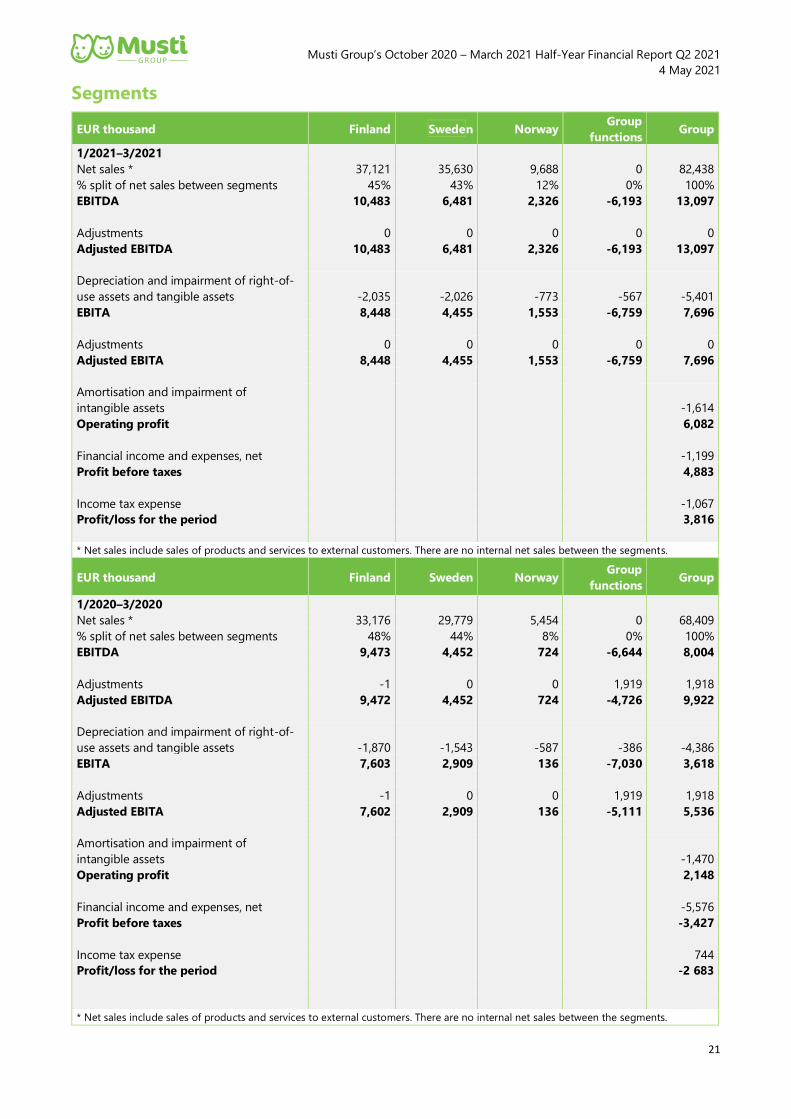
Segments
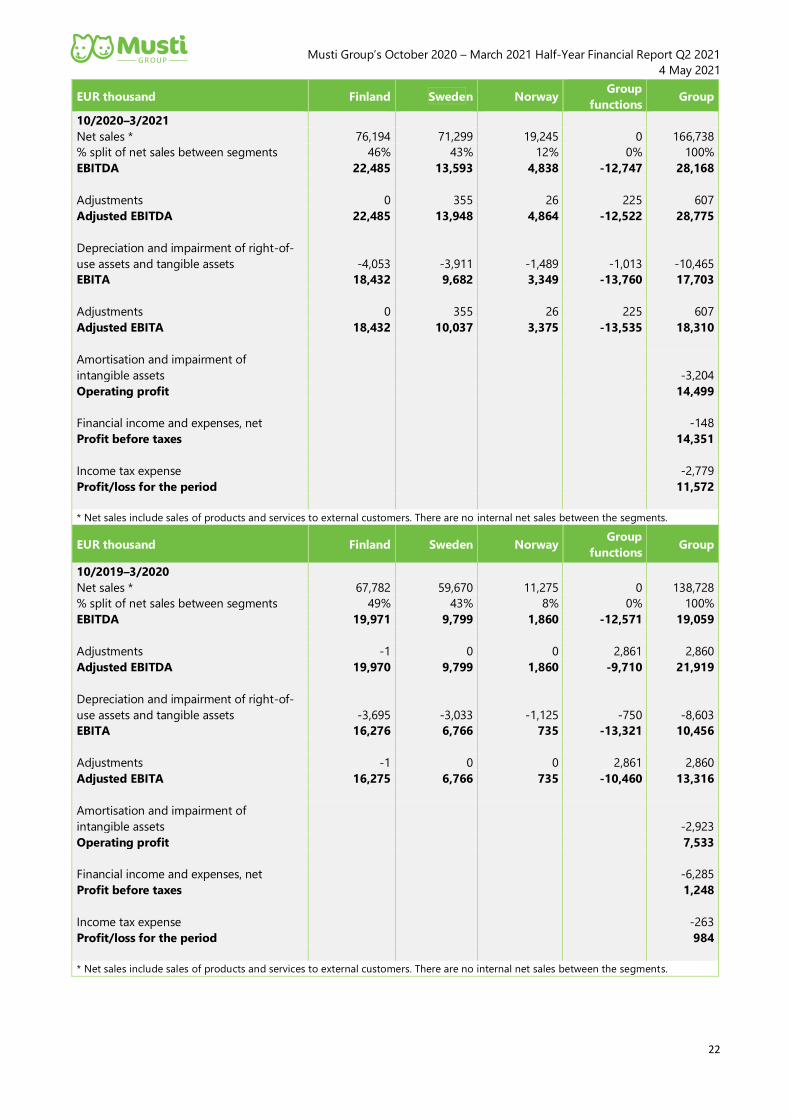
EUR thousand Finland Sweden Norway Group
functions Group
1/2021–3/2021
Net sales * 37,121 35,630 9,688 0 82,438
% split of net sales between segments 45% 43% 12% 0% 100%
EBITDA 10,483 6,481 2,326 -6,193 13,097
Adjustments 0 0 0 0 0
Adjusted EBITDA 10,483 6,481 2,326 -6,193 13,097
Depreciation and impairment of right-of-
use assets and tangible assets -2,035 -2,026 -773 -567 -5,401
EBITA 8,448 4,455 1,553 -6,759 7,696
Adjustments 0 0 0 0 0
Adjusted EBITA 8,448 4,455 1,553 -6,759 7,696
Amortisation and impairment of
intangible assets
-1,614
Operating profit 6,082
Financial income and expenses, net -1,199
Profit before taxes 4,883
Income tax expense -1,067
Profit/loss for the period 3,816
* Net sales include sales of products and services to external customers. There are no internal net sales between the segments.
EUR thousand Finland Sweden Norway Group
functions Group
1/2020–3/2020
Net sales * 33,176 29,779 5,454 0 68,409
% split of net sales between segments 48% 44% 8% 0% 100%
EBITDA 9,473 4,452 724 -6,644 8,004
Adjustments -1 0 0 1,919 1,918
Adjusted EBITDA 9,472 4,452 724 -4,726 9,922
Depreciation and impairment of right-of-
use assets and tangible assets -1,870 -1,543 -587 -386 -4,386
EBITA 7,603 2,909 136 -7,030 3,618
Adjustments -1 0 0 1,919 1,918
Adjusted EBITA 7,602 2,909 136 -5,111 5,536
Amortisation and impairment of
intangible assets
-1,470
Operating profit 2,148
Financial income and expenses, net -5,576
Profit before taxes -3,427
Income tax expense 744
Profit/loss for the period -2 683
* Net sales include sales of products and services to external customers. There are no internal net sales between the segments.
Musti Group’s October 2020 – March 2021 Half-Year Financial Report Q2 2021
4 May 2021
22
EUR thousand Finland Sweden Norway Group
functions Group
10/2020–3/2021
Net sales * 76,194 71,299 19,245 0 166,738
% split of net sales between segments 46% 43% 12% 0% 100%
EBITDA 22,485 13,593 4,838 -12,747 28,168
Adjustments 0 355 26 225 607
Adjusted EBITDA 22,485 13,948 4,864 -12,522 28,775
Depreciation and impairment of right-of-
use assets and tangible assets -4,053 -3,911 -1,489 -1,013 -10,465
EBITA 18,432 9,682 3,349 -13,760 17,703
Adjustments 0 355 26 225 607
Adjusted EBITA 18,432 10,037 3,375 -13,535 18,310
Amortisation and impairment of
intangible assets
-3,204
Operating profit 14,499
Financial income and expenses, net -148
Profit before taxes 14,351
Income tax expense -2,779
Profit/loss for the period 11,572
* Net sales include sales of products and services to external customers. There are no internal net sales between the segments.
EUR thousand Finland Sweden Norway Group
functions Group
10/2019–3/2020
Net sales * 67,782 59,670 11,275 0 138,728
% split of net sales between segments 49% 43% 8% 0% 100%
EBITDA 19,971 9,799 1,860 -12,571 19,059
Adjustments -1 0 0 2,861 2,860
Adjusted EBITDA 19,970 9,799 1,860 -9,710 21,919
Depreciation and impairment of right-of-
use assets and tangible assets -3,695 -3,033 -1,125 -750 -8,603
EBITA 16,276 6,766 735 -13,321 10,456
Adjustments -1 0 0 2,861 2,860
Adjusted EBITA 16,275 6,766 735 -10,460 13,316
Amortisation and impairment of
intangible assets -2,923
Operating profit 7,533
Financial income and expenses, net -6,285
Profit before taxes 1,248
Income tax expense -263
Profit/loss for the period 984
* Net sales include sales of products and services to external customers. There are no internal net sales between the segments.
Musti Group’s October 2020 – March 2021 Half-Year Financial Report Q2 2021
4 May 2021
23
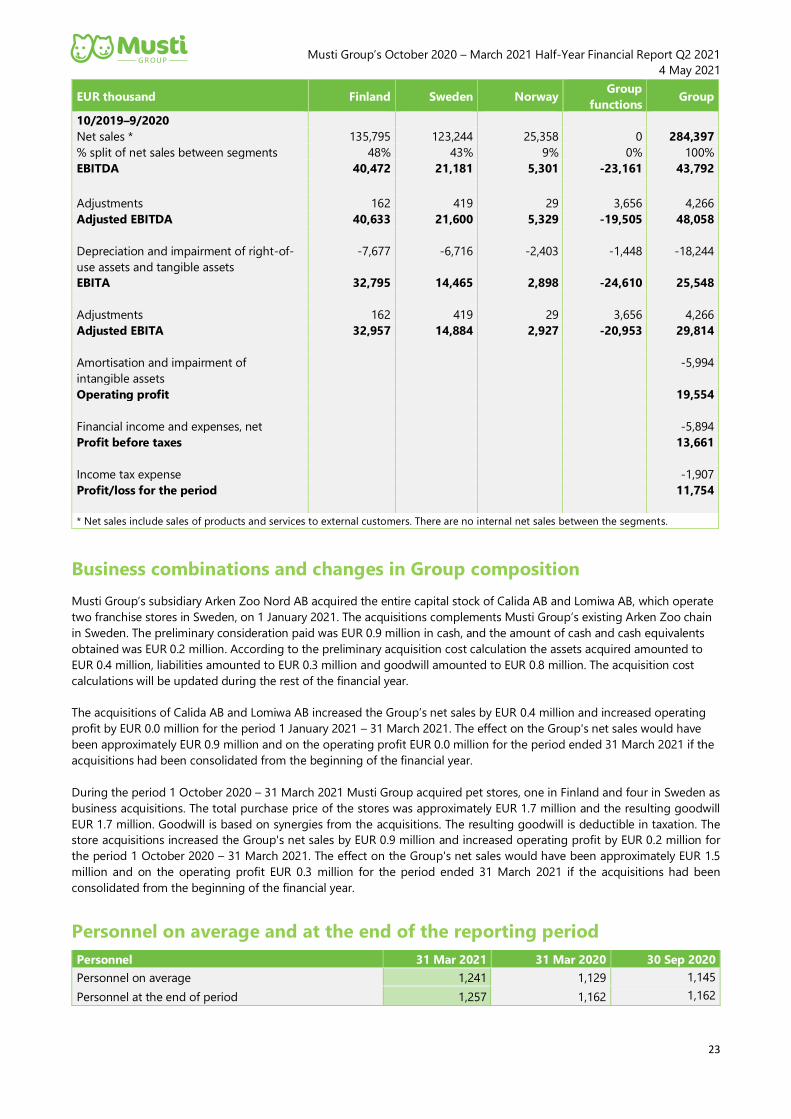
EUR thousand Finland Sweden Norway Group
functions Group
10/2019–9/2020
Net sales * 135,795 123,244 25,358 0 284,397
% split of net sales between segments 48% 43% 9% 0% 100%
EBITDA 40,472 21,181 5,301 -23,161 43,792
Adjustments 162 419 29 3,656 4,266
Adjusted EBITDA 40,633 21,600 5,329 -19,505 48,058
Depreciation and impairment of right-of-
use assets and tangible assets
-7,677 -6,716 -2,403 -1,448 -18,244
EBITA 32,795 14,465 2,898 -24,610 25,548
Adjustments 162 419 29 3,656 4,266
Adjusted EBITA 32,957 14,884 2,927 -20,953 29,814
Amortisation and impairment of
intangible assets
-5,994
Operating profit 19,554
Financial income and expenses, net -5,894
Profit before taxes 13,661
Income tax expense -1,907
Profit/loss for the period 11,754
* Net sales include sales of products and services to external customers. There are no internal net sales between the segments.
Business combinations and changes in Group composition
Musti Group’s subsidiary Arken Zoo Nord AB acquired the entire capital stock of Calida AB and Lomiwa AB, which operate
two franchise stores in Sweden, on 1 January 2021. The acquisitions complements Musti Group’s existing Arken Zoo chain
in Sweden. The preliminary consideration paid was EUR 0.9 million in cash, and the amount of cash and cash equivalents
obtained was EUR 0.2 million. According to the preliminary acquisition cost calculation the assets acquired amounted to
EUR 0.4 million, liabilities amounted to EUR 0.3 million and goodwill amounted to EUR 0.8 million. The acquisition cost
calculations will be updated during the rest of the financial year.
The acquisitions of Calida AB and Lomiwa AB increased the Group’s net sales by EUR 0.4 million and increased operating
profit by EUR 0.0 million for the period 1 January 2021 – 31 March 2021. The effect on the Group's net sales would have
been approximately EUR 0.9 million and on the operating profit EUR 0.0 million for the period ended 31 March 2021 if the
acquisitions had been consolidated from the beginning of the financial year.
During the period 1 October 2020 – 31 March 2021 Musti Group acquired pet stores, one in Finland and four in Sweden as
business acquisitions. The total purchase price of the stores was approximately EUR 1.7 million and the resulting goodwill
EUR 1.7 million. Goodwill is based on synergies from the acquisitions. The resulting goodwill is deductible in taxation. The
store acquisitions increased the Group's net sales by EUR 0.9 million and increased operating profit by EUR 0.2 million for
the period 1 October 2020 – 31 March 2021. The effect on the Group's net sales would have been approximately EUR 1.5
million and on the operating profit EUR 0.3 million for the period ended 31 March 2021 if the acquisitions had been
consolidated from the beginning of the financial year.
Personnel on average and at the end of the reporting period
Personnel 31 Mar 2021 31 Mar 2020 30 Sep 2020
Personnel on average 1,241 1,129 1,145
Personnel at the end of period 1,257 1,162 1,162
Musti Group’s October 2020 – March 2021 Half-Year Financial Report Q2 2021
4 May 2021
24
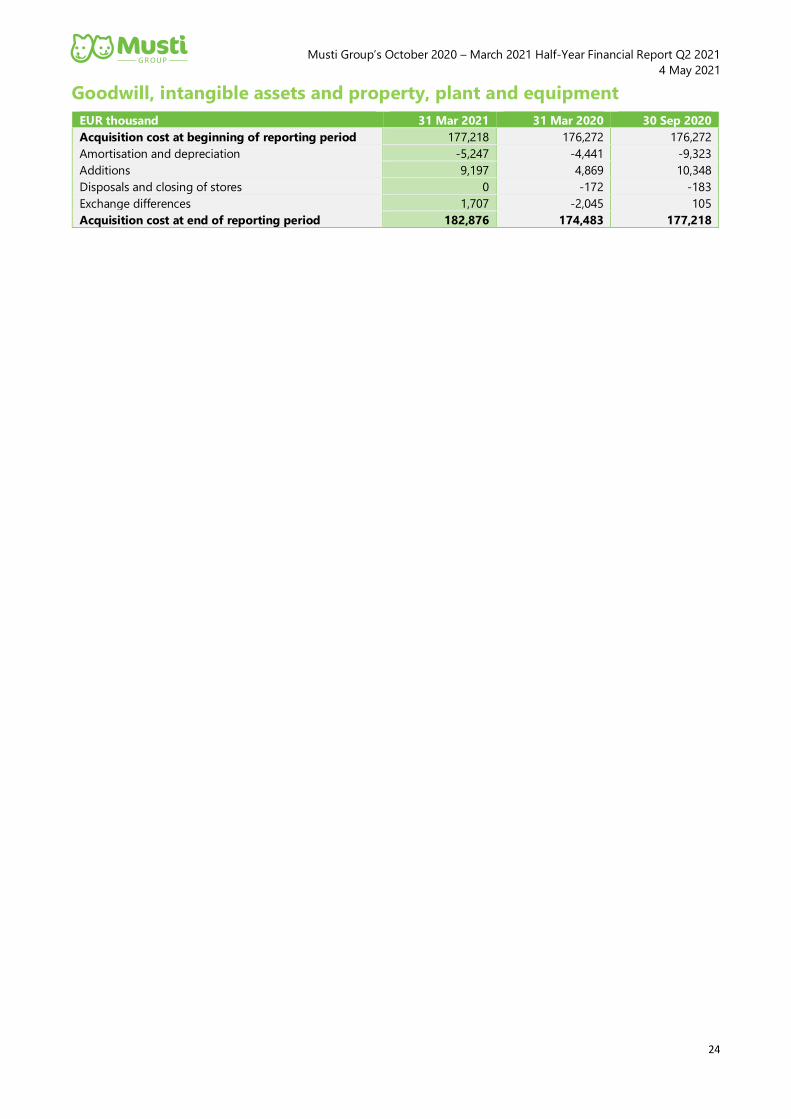
Goodwill, intangible assets and property, plant and equipment
EUR thousand 31 Mar 2021 31 Mar 2020 30 Sep 2020
Acquisition cost at beginning of reporting period 177,218 176,272 176,272
Amortisation and depreciation -5,247 -4,441 -9,323
Additions 9,197 4,869 10,348
Disposals and closing of stores 0 -172 -183
Exchange differences 1,707 -2,045 105
Acquisition cost at end of reporting period 182,876 174,483 177,218
Musti Group’s October 2020 – March 2021 Half-Year Financial Report Q2 2021
4 May 2021
25
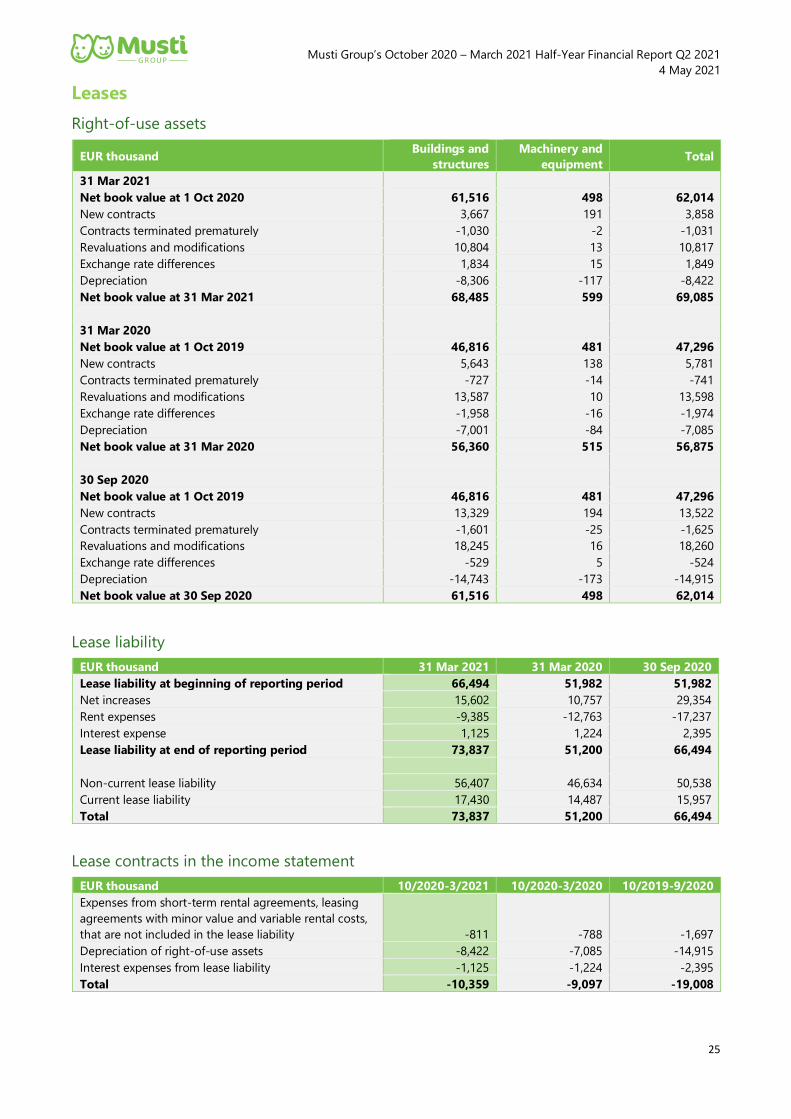
Leases
Right-of-use assets
EUR thousand Buildings and
structures
Machinery and
equipment Total
31 Mar 2021
Net book value at 1 Oct 2020 61,516 498 62,014
New contracts 3,667 191 3,858
Contracts terminated prematurely -1,030 -2 -1,031
Revaluations and modifications 10,804 13 10,817
Exchange rate differences 1,834 15 1,849
Depreciation -8,306 -117 -8,422
Net book value at 31 Mar 2021 68,485 599 69,085
31 Mar 2020
Net book value at 1 Oct 2019 46,816 481 47,296
New contracts 5,643 138 5,781
Contracts terminated prematurely -727 -14 -741
Revaluations and modifications 13,587 10 13,598
Exchange rate differences -1,958 -16 -1,974
Depreciation -7,001 -84 -7,085
Net book value at 31 Mar 2020 56,360 515 56,875
30 Sep 2020
Net book value at 1 Oct 2019 46,816 481 47,296
New contracts 13,329 194 13,522
Contracts terminated prematurely -1,601 -25 -1,625
Revaluations and modifications 18,245 16 18,260
Exchange rate differences -529 5 -524
Depreciation -14,743 -173 -14,915
Net book value at 30 Sep 2020 61,516 498 62,014
Lease liability
EUR thousand 31 Mar 2021 31 Mar 2020 30 Sep 2020
Lease liability at beginning of reporting period 66,494 51,982 51,982
Net increases 15,602 10,757 29,354
Rent expenses -9,385 -12,763 -17,237
Interest expense 1,125 1,224 2,395
Lease liability at end of reporting period 73,837 51,200 66,494
Non-current lease liability 56,407 46,634 50,538
Current lease liability 17,430 14,487 15,957
Total 73,837 51,200 66,494
Lease contracts in the income statement
EUR thousand 10/2020-3/2021 10/2020-3/2020 10/2019-9/2020
Expenses from short-term rental agreements, leasing
agreements with minor value and variable rental costs,
that are not included in the lease liability -811 -788
-1,697
Depreciation of right-of-use assets -8,422 -7,085 -14,915
Interest expenses from lease liability -1,125 -1,224 -2,395
Total -10,359 -9,097 -19,008
Musti Group’s October 2020 – March 2021 Half-Year Financial Report Q2 2021
4 May 2021
26
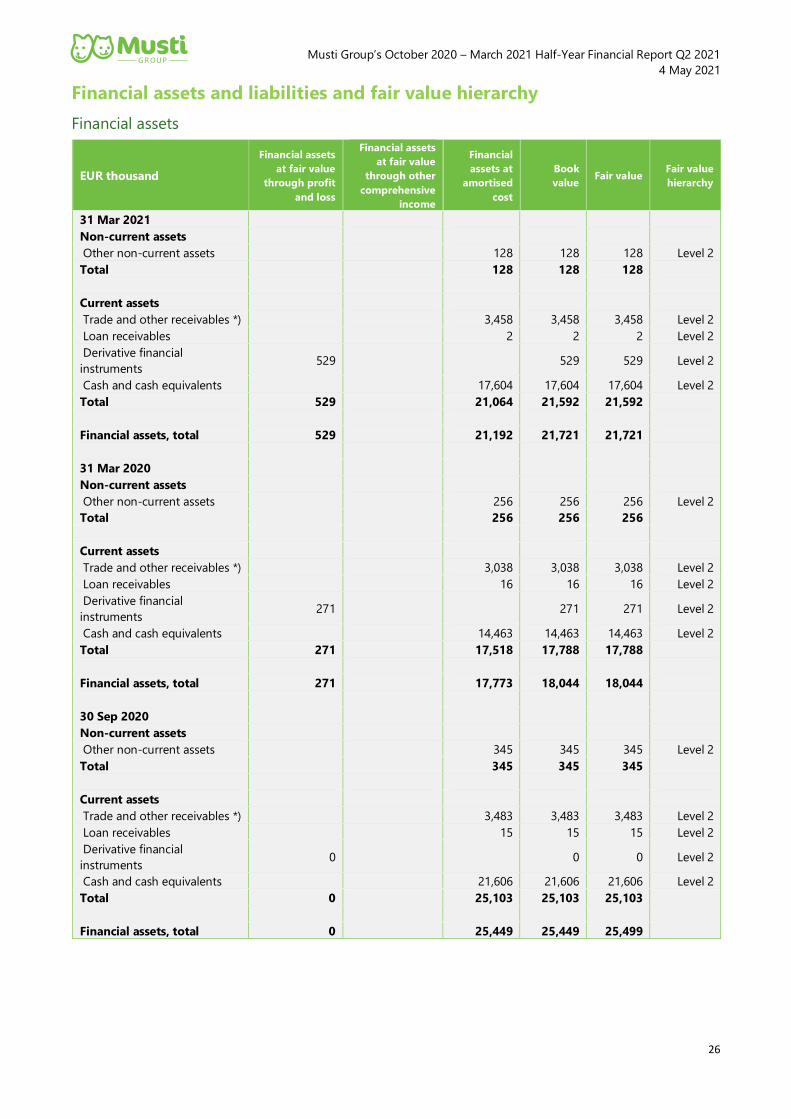
Financial assets and liabilities and fair value hierarchy
Financial assets
EUR thousand
Financial assets
at fair value
through profit
and loss
Financial assets
at fair value
through other
comprehensive
income
Financial
assets at
amortised
cost
Book
value Fair value
Fair value
hierarchy
31 Mar 2021
Non-current assets
Other non-current assets 128 128 128 Level 2
Total 128 128 128
Current assets
Trade and other receivables *) 3,458 3,458 3,458 Level 2
Loan receivables 2 2 2 Level 2
Derivative financial
instruments 529 529 529 Level 2
Cash and cash equivalents 17,604 17,604 17,604 Level 2
Total 529 21,064 21,592 21,592
Financial assets, total 529 21,192 21,721 21,721
31 Mar 2020
Non-current assets
Other non-current assets 256 256 256 Level 2
Total 256 256 256
Current assets
Trade and other receivables *) 3,038 3,038 3,038 Level 2
Loan receivables 16 16 16 Level 2
Derivative financial
instruments 271 271 271 Level 2
Cash and cash equivalents 14,463 14,463 14,463 Level 2
Total 271 17,518 17,788 17,788
Financial assets, total 271 17,773 18,044 18,044
30 Sep 2020
Non-current assets
Other non-current assets 345 345 345 Level 2
Total 345 345 345
Current assets
Trade and other receivables *) 3,483 3,483 3,483 Level 2
Loan receivables 15 15 15 Level 2
Derivative financial
instruments 0 0 0 Level 2
Cash and cash equivalents 21,606 21,606 21,606 Level 2
Total 0 25,103 25,103 25,103
Financial assets, total 0 25,449 25,449 25,499
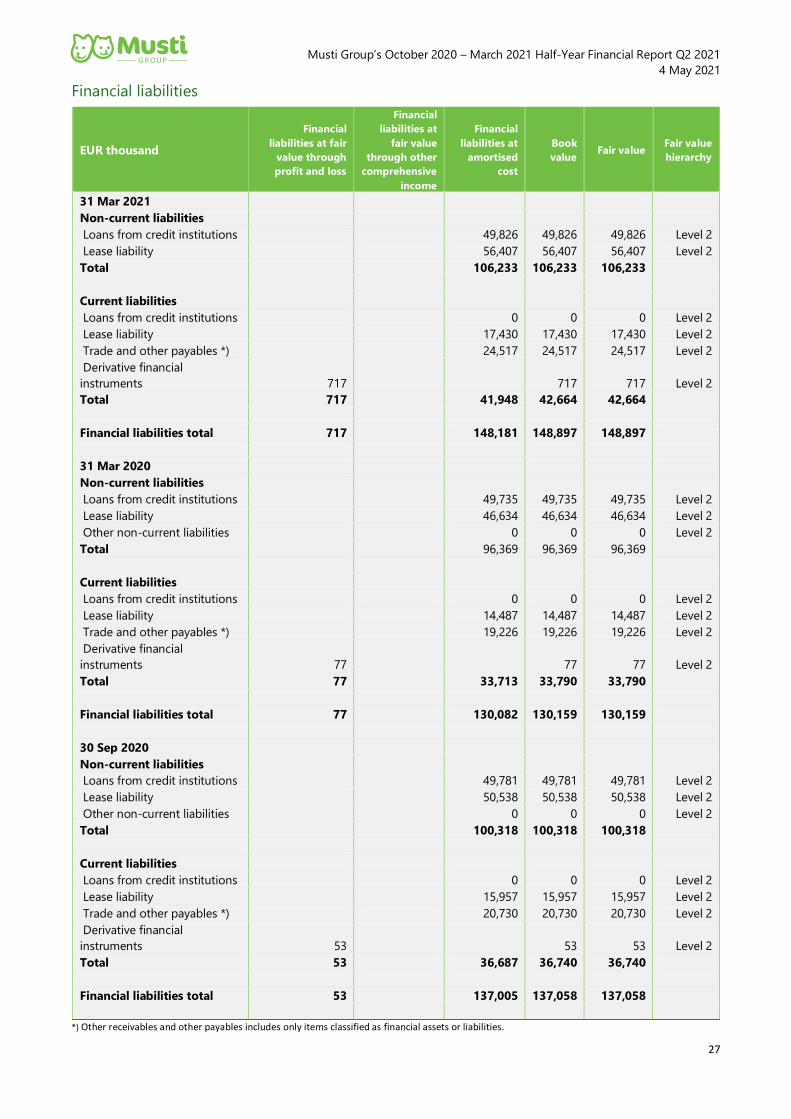
Musti Group’s October 2020 – March 2021 Half-Year Financial Report Q2 2021
4 May 2021
27
Financial liabilities
EUR thousand
Financial
liabilities at fair
value through
profit and loss
Financial
liabilities at
fair value
through other
comprehensive
income
Financial
liabilities at
amortised
cost
Book
value Fair value
Fair value
hierarchy
31 Mar 2021
Non-current liabilities
Loans from credit institutions 49,826 49,826 49,826 Level 2
Lease liability 56,407 56,407 56,407 Level 2
Total 106,233 106,233 106,233
Current liabilities
Loans from credit institutions 0 0 0 Level 2
Lease liability 17,430 17,430 17,430 Level 2
Trade and other payables *) 24,517 24,517 24,517 Level 2
Derivative financial
instruments 717 717 717 Level 2
Total 717 41,948 42,664 42,664
Financial liabilities total 717 148,181 148,897 148,897
31 Mar 2020
Non-current liabilities
Loans from credit institutions 49,735 49,735 49,735 Level 2
Lease liability 46,634 46,634 46,634 Level 2
Other non-current liabilities 0 0 0 Level 2
Total 96,369 96,369 96,369
Current liabilities
Loans from credit institutions 0 0 0 Level 2
Lease liability 14,487 14,487 14,487 Level 2
Trade and other payables *) 19,226 19,226 19,226 Level 2
Derivative financial
instruments 77 77 77 Level 2
Total 77 33,713 33,790 33,790
Financial liabilities total 77 130,082 130,159 130,159
30 Sep 2020
Non-current liabilities
Loans from credit institutions 49,781 49,781 49,781 Level 2
Lease liability 50,538 50,538 50,538 Level 2
Other non-current liabilities 0 0 0 Level 2
Total 100,318 100,318 100,318
Current liabilities
Loans from credit institutions 0 0 0 Level 2
Lease liability 15,957 15,957 15,957 Level 2
Trade and other payables *) 20,730 20,730 20,730 Level 2
Derivative financial
instruments 53 53 53 Level 2
Total 53 36,687 36,740 36,740
Financial liabilities total 53 137,005 137,058 137,058
*) Other receivables and other payables includes only items classified as financial assets or liabilities.
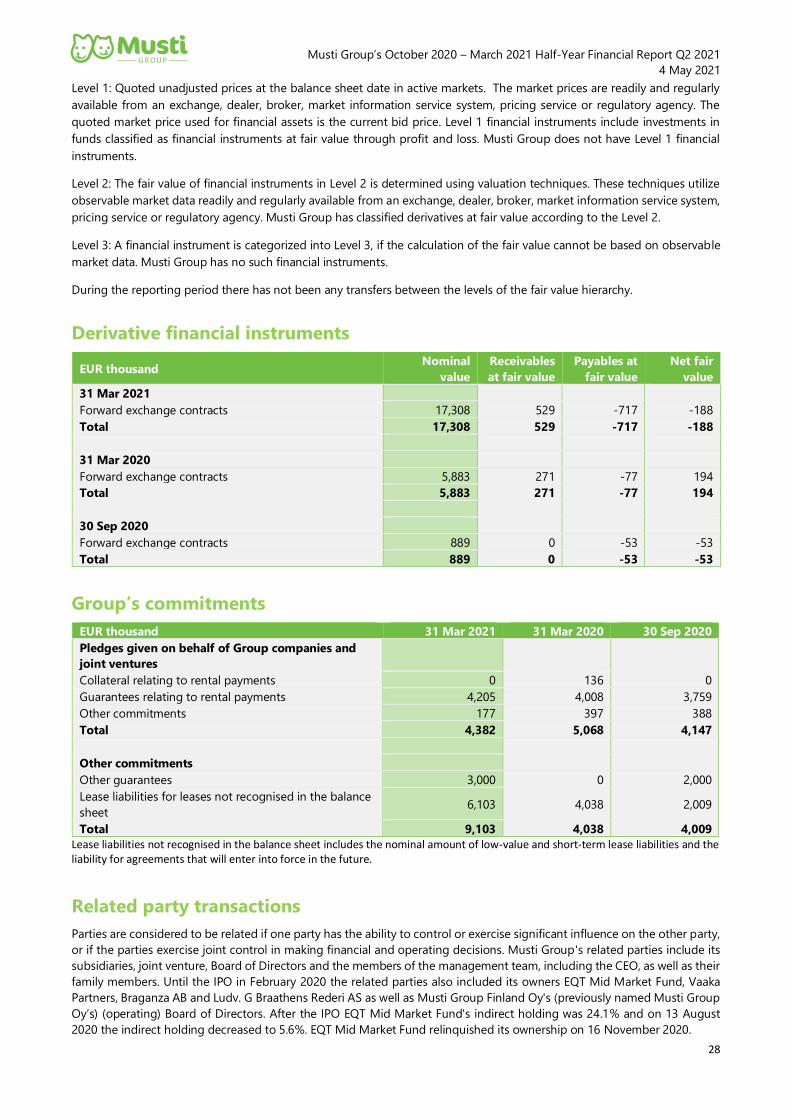
Musti Group’s October 2020 – March 2021 Half-Year Financial Report Q2 2021
4 May 2021
28
Level 1: Quoted unadjusted prices at the balance sheet date in active markets. The market prices are readily and regularly
available from an exchange, dealer, broker, market information service system, pricing service or regulatory agency. The
quoted market price used for financial assets is the current bid price. Level 1 financial instruments include investments in
funds classified as financial instruments at fair value through profit and loss. Musti Group does not have Level 1 financial
instruments.
Level 2: The fair value of financial instruments in Level 2 is determined using valuation techniques. These techniques utilize
observable market data readily and regularly available from an exchange, dealer, broker, market information service system,
pricing service or regulatory agency. Musti Group has classified derivatives at fair value according to the Level 2.
Level 3: A financial instrument is categorized into Level 3, if the calculation of the fair value cannot be based on observable
market data. Musti Group has no such financial instruments.
During the reporting period there has not been any transfers between the levels of the fair value hierarchy.
Derivative financial instruments
EUR thousand Nominal
value
Receivables
at fair value
Payables at
fair value
Net fair
value
31 Mar 2021
Forward exchange contracts 17,308 529 -717 -188
Total 17,308 529 -717 -188
31 Mar 2020
Forward exchange contracts 5,883 271 -77 194
Total 5,883 271 -77 194
30 Sep 2020
Forward exchange contracts 889 0 -53 -53
Total 889 0 -53 -53
Group’s commitments
EUR thousand 31 Mar 2021 31 Mar 2020 30 Sep 2020
Pledges given on behalf of Group companies and
joint ventures
Collateral relating to rental payments 0 136 0
Guarantees relating to rental payments 4,205 4,008 3,759
Other commitments 177 397 388
Total 4,382 5,068 4,147
Other commitments
Other guarantees 3,000 0 2,000
Lease liabilities for leases not recognised in the balance
sheet 6,103 4,038 2,009
Total 9,103 4,038 4,009
Lease liabilities not recognised in the balance sheet includes the nominal amount of low-value and short-term lease liabilities and the liability for agreements that will enter into force in the future.
Related party transactions
Parties are considered to be related if one party has the ability to control or exercise significant influence on the other party,
or if the parties exercise joint control in making financial and operating decisions. Musti Group's related parties include its
subsidiaries, joint venture, Board of Directors and the members of the management team, including the CEO, as well as their
family members. Until the IPO in February 2020 the related parties also included its owners EQT Mid Market Fund, Vaaka
Partners, Braganza AB and Ludv. G Braathens Rederi AS as well as Musti Group Finland Oy's (previously named Musti Group
Oy’s) (operating) Board of Directors. After the IPO EQT Mid Market Fund's indirect holding was 24.1% and on 13 August
2020 the indirect holding decreased to 5.6%. EQT Mid Market Fund relinquished its ownership on 16 November 2020.
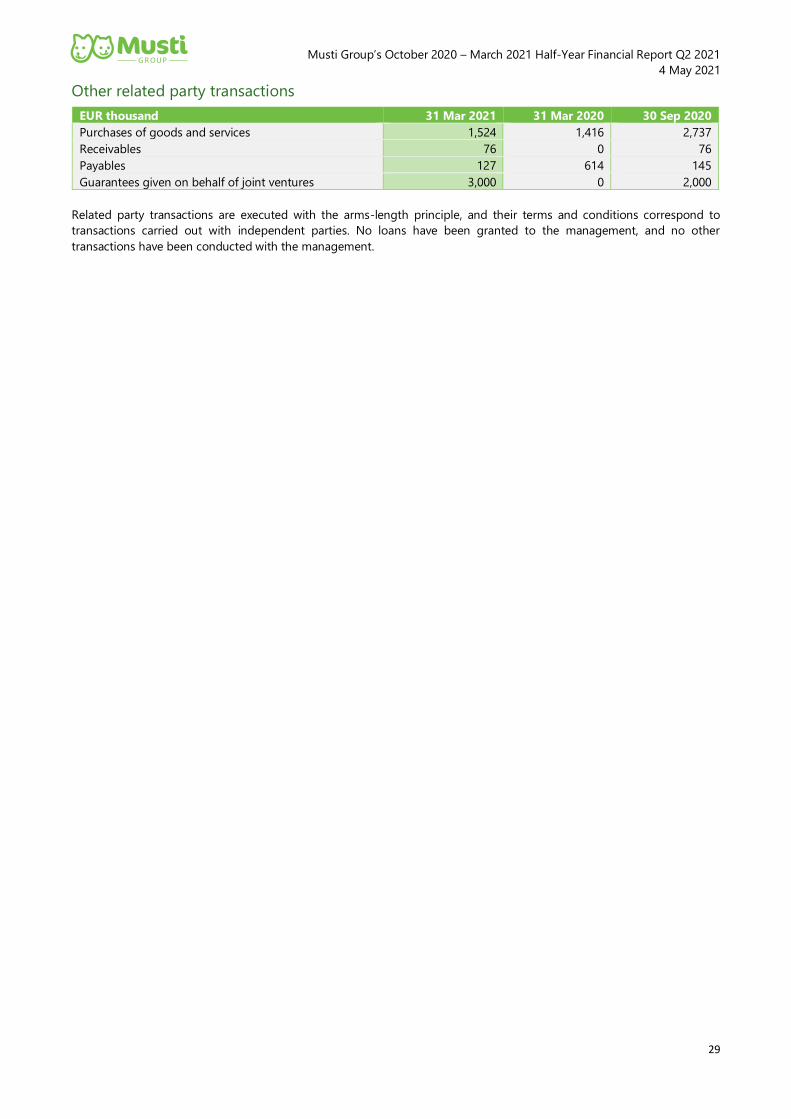
Musti Group’s October 2020 – March 2021 Half-Year Financial Report Q2 2021
4 May 2021
29
Other related party transactions
EUR thousand 31 Mar 2021 31 Mar 2020 30 Sep 2020
Purchases of goods and services 1,524 1,416 2,737
Receivables 76 0 76
Payables 127 614 145
Guarantees given on behalf of joint ventures 3,000 0 2,000
Related party transactions are executed with the arms-length principle, and their terms and conditions correspond to
transactions carried out with independent parties. No loans have been granted to the management, and no other
transactions have been conducted with the management.
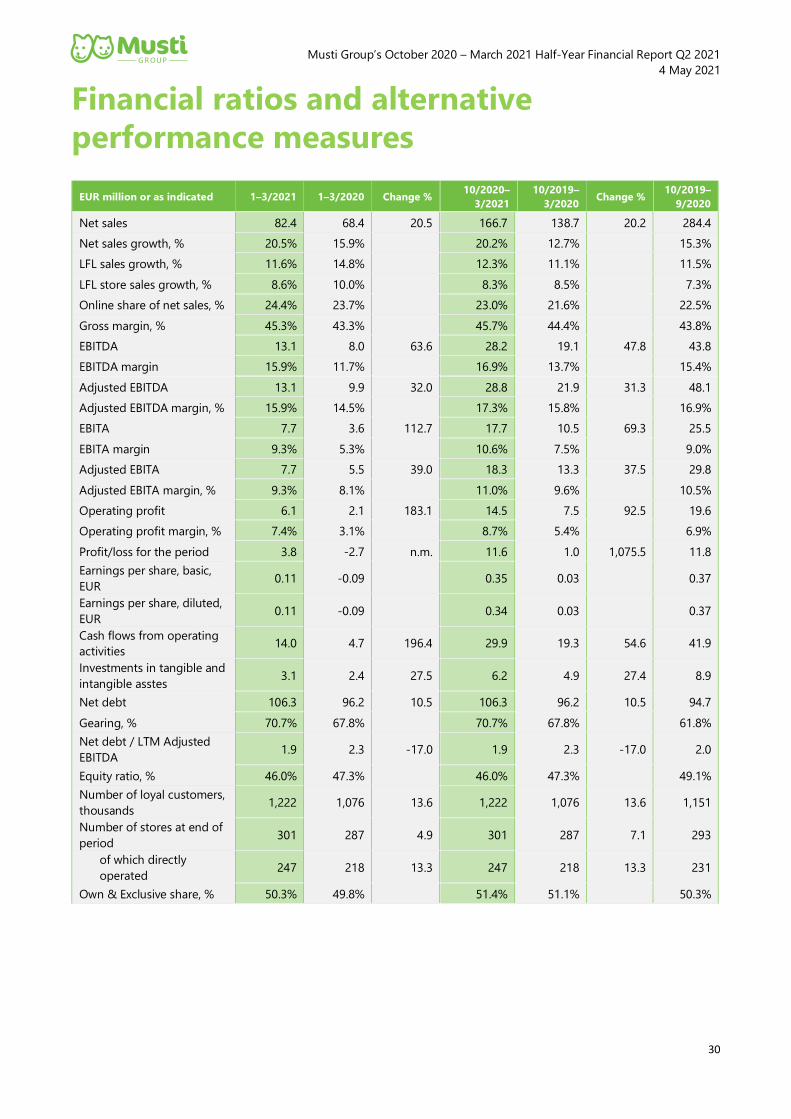
Musti Group’s October 2020 – March 2021 Half-Year Financial Report Q2 2021
4 May 2021
30
Financial ratios and alternative
performance measures
EUR million or as indicated 1–3/2021 1–3/2020 Change % 10/2020–
3/2021
10/2019–
3/2020 Change %
10/2019–
9/2020
Net sales 82.4 68.4 20.5 166.7 138.7 20.2 284.4
Net sales growth, % 20.5% 15.9% 20.2% 12.7% 15.3%
LFL sales growth, % 11.6% 14.8% 12.3% 11.1% 11.5%
LFL store sales growth, % 8.6% 10.0% 8.3% 8.5% 7.3%
Online share of net sales, % 24.4% 23.7% 23.0% 21.6% 22.5%
Gross margin, % 45.3% 43.3% 45.7% 44.4% 43.8%
EBITDA 13.1 8.0 63.6 28.2 19.1 47.8 43.8
EBITDA margin 15.9% 11.7% 16.9% 13.7% 15.4%
Adjusted EBITDA 13.1 9.9 32.0 28.8 21.9 31.3 48.1
Adjusted EBITDA margin, % 15.9% 14.5% 17.3% 15.8% 16.9%
EBITA 7.7 3.6 112.7 17.7 10.5 69.3 25.5
EBITA margin 9.3% 5.3% 10.6% 7.5% 9.0%
Adjusted EBITA 7.7 5.5 39.0 18.3 13.3 37.5 29.8
Adjusted EBITA margin, % 9.3% 8.1% 11.0% 9.6% 10.5%
Operating profit 6.1 2.1 183.1 14.5 7.5 92.5 19.6
Operating profit margin, % 7.4% 3.1% 8.7% 5.4% 6.9%
Profit/loss for the period 3.8 -2.7 n.m. 11.6 1.0 1,075.5 11.8
Earnings per share, basic,
EUR 0.11 -0.09 0.35 0.03 0.37
Earnings per share, diluted,
EUR 0.11 -0.09 0.34 0.03 0.37
Cash flows from operating
activities 14.0 4.7 196.4 29.9 19.3 54.6 41.9
Investments in tangible and
intangible asstes 3.1 2.4 27.5 6.2 4.9 27.4 8.9
Net debt 106.3 96.2 10.5 106.3 96.2 10.5 94.7
Gearing, % 70.7% 67.8% 70.7% 67.8% 61.8%
Net debt / LTM Adjusted
EBITDA 1.9 2.3 -17.0 1.9 2.3 -17.0 2.0
Equity ratio, % 46.0% 47.3% 46.0% 47.3% 49.1%
Number of loyal customers,
thousands 1,222 1,076 13.6 1,222 1,076 13.6 1,151
Number of stores at end of
period 301 287 4.9 301 287 7.1 293
of which directly
operated 247 218 13.3 247 218 13.3 231
Own & Exclusive share, % 50.3% 49.8% 51.4% 51.1% 50.3%
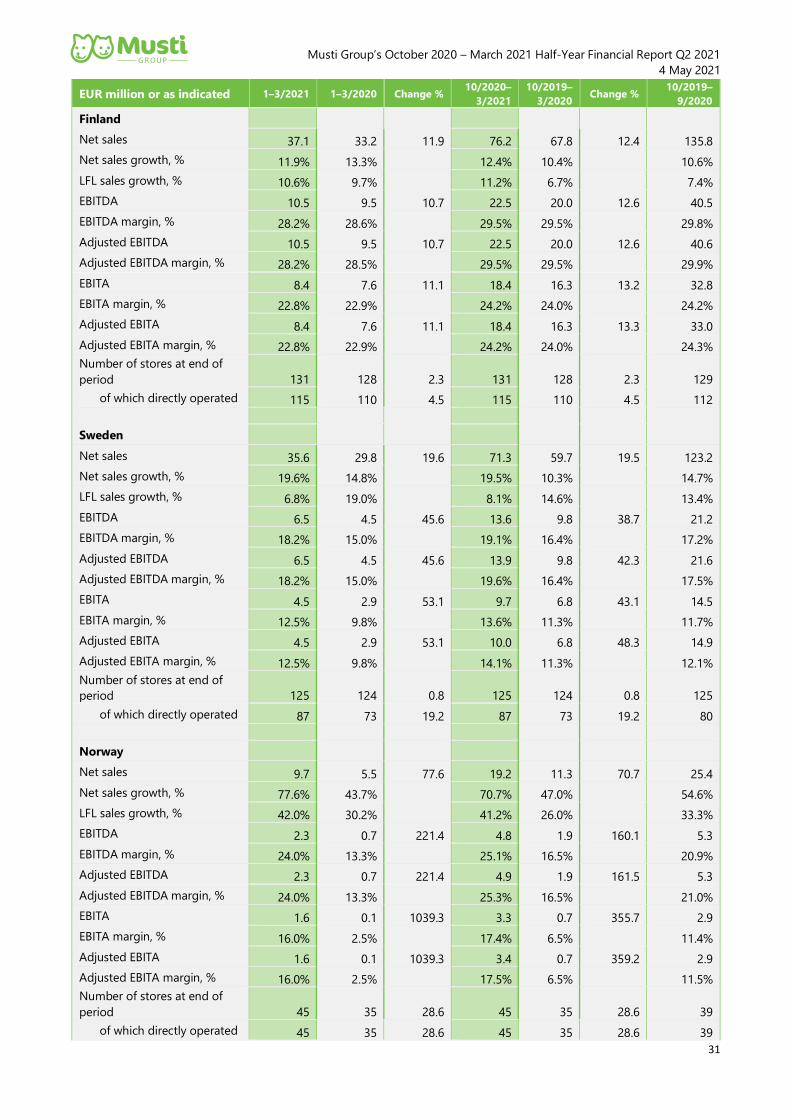
Musti Group’s October 2020 – March 2021 Half-Year Financial Report Q2 2021
4 May 2021
31
EUR million or as indicated 1–3/2021 1–3/2020 Change % 10/2020–
3/2021 10/2019–
3/2020 Change %
10/2019–
9/2020
Finland
Net sales 37.1 33.2 11.9 76.2 67.8 12.4 135.8
Net sales growth, % 11.9% 13.3% 12.4% 10.4% 10.6%
LFL sales growth, % 10.6% 9.7% 11.2% 6.7% 7.4%
EBITDA 10.5 9.5 10.7 22.5 20.0 12.6 40.5
EBITDA margin, % 28.2% 28.6% 29.5% 29.5% 29.8%
Adjusted EBITDA 10.5 9.5 10.7 22.5 20.0 12.6 40.6
Adjusted EBITDA margin, % 28.2% 28.5% 29.5% 29.5% 29.9%
EBITA 8.4 7.6 11.1 18.4 16.3 13.2 32.8
EBITA margin, % 22.8% 22.9% 24.2% 24.0% 24.2%
Adjusted EBITA 8.4 7.6 11.1 18.4 16.3 13.3 33.0
Adjusted EBITA margin, % 22.8% 22.9% 24.2% 24.0% 24.3%
Number of stores at end of
period 131 128 2.3 131 128 2.3 129
of which directly operated 115 110 4.5 115 110 4.5 112
Sweden
Net sales 35.6 29.8 19.6 71.3 59.7 19.5 123.2
Net sales growth, % 19.6% 14.8% 19.5% 10.3% 14.7%
LFL sales growth, % 6.8% 19.0% 8.1% 14.6% 13.4%
EBITDA 6.5 4.5 45.6 13.6 9.8 38.7 21.2
EBITDA margin, % 18.2% 15.0% 19.1% 16.4% 17.2%
Adjusted EBITDA 6.5 4.5 45.6 13.9 9.8 42.3 21.6
Adjusted EBITDA margin, % 18.2% 15.0% 19.6% 16.4% 17.5%
EBITA 4.5 2.9 53.1 9.7 6.8 43.1 14.5
EBITA margin, % 12.5% 9.8% 13.6% 11.3% 11.7%
Adjusted EBITA 4.5 2.9 53.1 10.0 6.8 48.3 14.9
Adjusted EBITA margin, % 12.5% 9.8% 14.1% 11.3% 12.1%
Number of stores at end of
period 125 124 0.8 125 124 0.8 125
of which directly operated 87 73 19.2 87 73 19.2 80
Norway
Net sales 9.7 5.5 77.6 19.2 11.3 70.7 25.4
Net sales growth, % 77.6% 43.7% 70.7% 47.0% 54.6%
LFL sales growth, % 42.0% 30.2% 41.2% 26.0% 33.3%
EBITDA 2.3 0.7 221.4 4.8 1.9 160.1 5.3
EBITDA margin, % 24.0% 13.3% 25.1% 16.5% 20.9%
Adjusted EBITDA 2.3 0.7 221.4 4.9 1.9 161.5 5.3
Adjusted EBITDA margin, % 24.0% 13.3% 25.3% 16.5% 21.0%
EBITA 1.6 0.1 1039.3 3.3 0.7 355.7 2.9
EBITA margin, % 16.0% 2.5% 17.4% 6.5% 11.4%
Adjusted EBITA 1.6 0.1 1039.3 3.4 0.7 359.2 2.9
Adjusted EBITA margin, % 16.0% 2.5% 17.5% 6.5% 11.5%
Number of stores at end of
period 45 35 28.6 45 35 28.6 39
of which directly operated 45 35 28.6 45 35 28.6 39
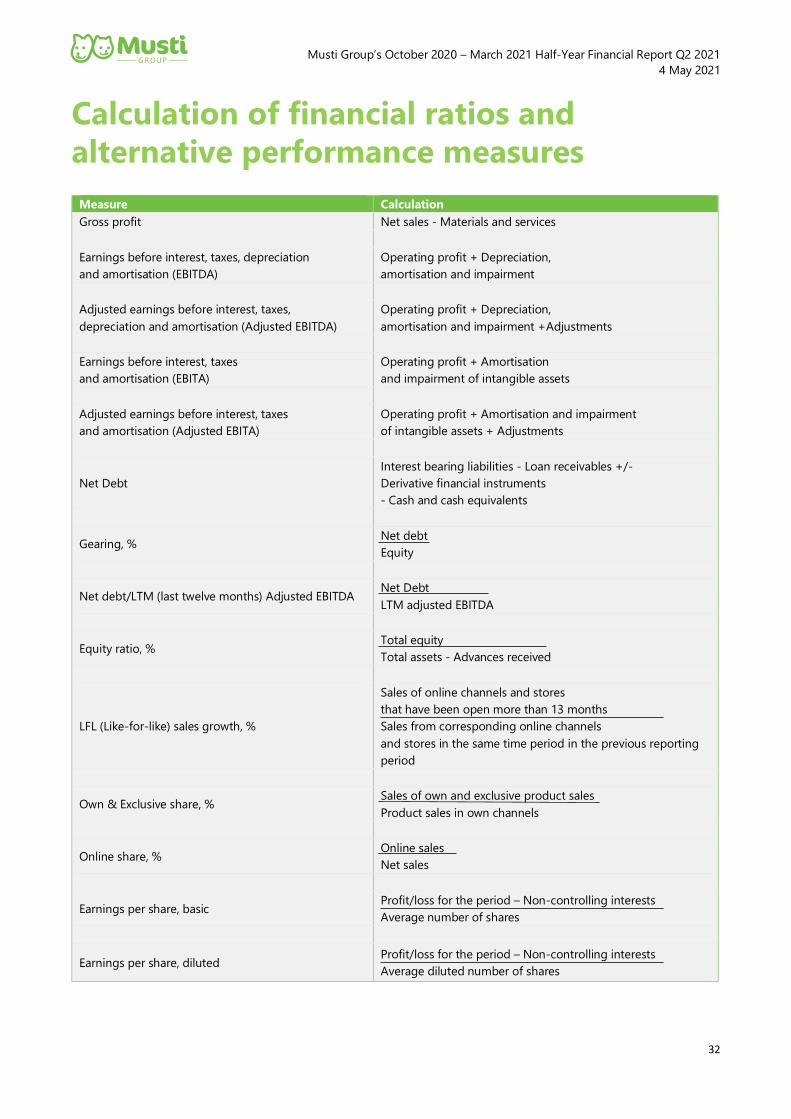
Musti Group’s October 2020 – March 2021 Half-Year Financial Report Q2 2021
4 May 2021
32
Calculation of financial ratios and
alternative performance measures
Measure Calculation
Gross profit Net sales - Materials and services
Earnings before interest, taxes, depreciation
and amortisation (EBITDA)
Operating profit + Depreciation,
amortisation and impairment
Adjusted earnings before interest, taxes,
depreciation and amortisation (Adjusted EBITDA)
Operating profit + Depreciation,
amortisation and impairment +Adjustments
Earnings before interest, taxes
and amortisation (EBITA)
Operating profit + Amortisation
and impairment of intangible assets
Adjusted earnings before interest, taxes
and amortisation (Adjusted EBITA)
Operating profit + Amortisation and impairment
of intangible assets + Adjustments
Net Debt
Interest bearing liabilities - Loan receivables +/-
Derivative financial instruments
- Cash and cash equivalents
Gearing, % Net debt
Equity
Net debt/LTM (last twelve months) Adjusted EBITDA Net Debt
LTM adjusted EBITDA
Equity ratio, % Total equity
Total assets - Advances received
LFL (Like-for-like) sales growth, %
Sales of online channels and stores
that have been open more than 13 months
Sales from corresponding online channels
and stores in the same time period in the previous reporting
period
Own & Exclusive share, % Sales of own and exclusive product sales
Product sales in own channels
Online share, % Online sales
Net sales
Earnings per share, basic Profit/loss for the period – Non-controlling interests
Average number of shares
Earnings per share, diluted Profit/loss for the period – Non-controlling interests
Average diluted number of shares
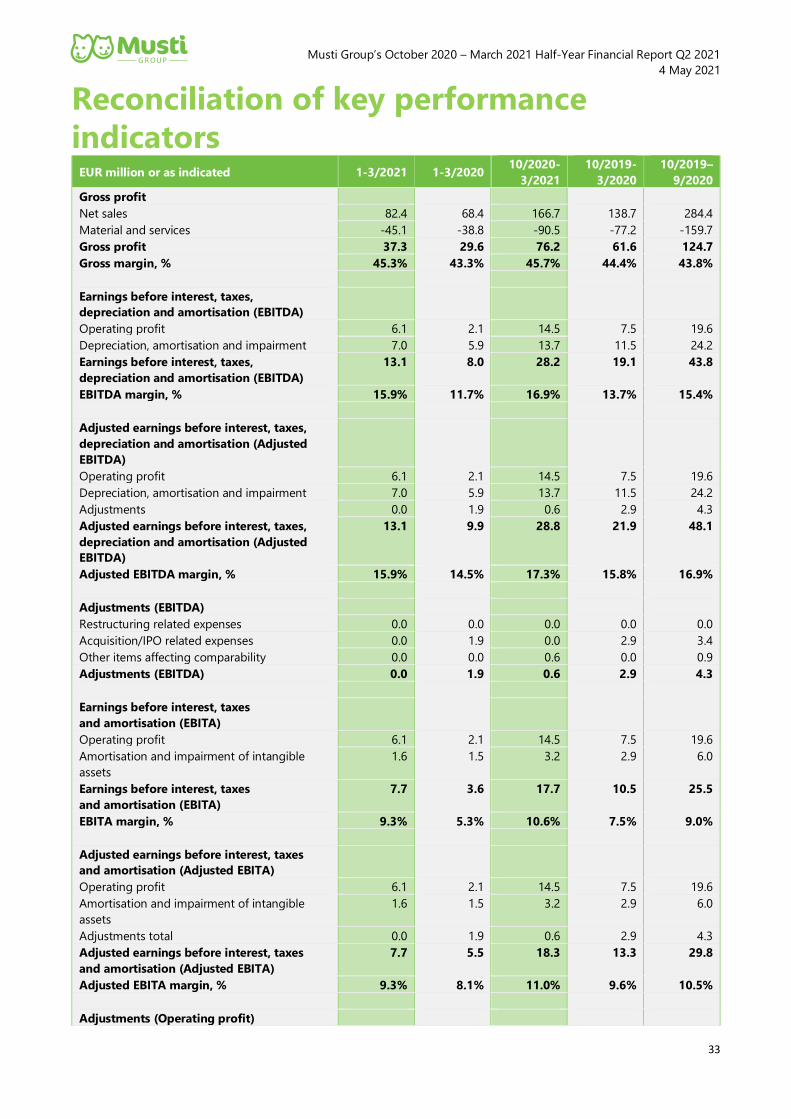
Musti Group’s October 2020 – March 2021 Half-Year Financial Report Q2 2021
4 May 2021
33
Reconciliation of key performance
indicators EUR million or as indicated 1-3/2021 1-3/2020
10/2020-
3/2021
10/2019-
3/2020
10/2019–
9/2020
Gross profit
Net sales 82.4 68.4 166.7 138.7 284.4
Material and services -45.1 -38.8 -90.5 -77.2 -159.7
Gross profit 37.3 29.6 76.2 61.6 124.7
Gross margin, % 45.3% 43.3% 45.7% 44.4% 43.8%
Earnings before interest, taxes,
depreciation and amortisation (EBITDA)
Operating profit 6.1 2.1 14.5 7.5 19.6
Depreciation, amortisation and impairment 7.0 5.9 13.7 11.5 24.2
Earnings before interest, taxes,
depreciation and amortisation (EBITDA)
13.1 8.0 28.2 19.1 43.8
EBITDA margin, % 15.9% 11.7% 16.9% 13.7% 15.4%
Adjusted earnings before interest, taxes,
depreciation and amortisation (Adjusted
EBITDA)
Operating profit 6.1 2.1 14.5 7.5 19.6
Depreciation, amortisation and impairment 7.0 5.9 13.7 11.5 24.2
Adjustments 0.0 1.9 0.6 2.9 4.3
Adjusted earnings before interest, taxes,
depreciation and amortisation (Adjusted
EBITDA)
13.1 9.9 28.8 21.9 48.1
Adjusted EBITDA margin, % 15.9% 14.5% 17.3% 15.8% 16.9%
Adjustments (EBITDA)
Restructuring related expenses 0.0 0.0 0.0 0.0 0.0
Acquisition/IPO related expenses 0.0 1.9 0.0 2.9 3.4
Other items affecting comparability 0.0 0.0 0.6 0.0 0.9
Adjustments (EBITDA) 0.0 1.9 0.6 2.9 4.3
Earnings before interest, taxes
and amortisation (EBITA)
Operating profit 6.1 2.1 14.5 7.5 19.6
Amortisation and impairment of intangible
assets
1.6 1.5 3.2 2.9 6.0
Earnings before interest, taxes
and amortisation (EBITA)
7.7 3.6 17.7 10.5 25.5
EBITA margin, % 9.3% 5.3% 10.6% 7.5% 9.0%
Adjusted earnings before interest, taxes
and amortisation (Adjusted EBITA)
Operating profit 6.1 2.1 14.5 7.5 19.6
Amortisation and impairment of intangible
assets
1.6 1.5 3.2 2.9 6.0
Adjustments total 0.0 1.9 0.6 2.9 4.3
Adjusted earnings before interest, taxes
and amortisation (Adjusted EBITA)
7.7 5.5 18.3 13.3 29.8
Adjusted EBITA margin, % 9.3% 8.1% 11.0% 9.6% 10.5%
Adjustments (Operating profit)
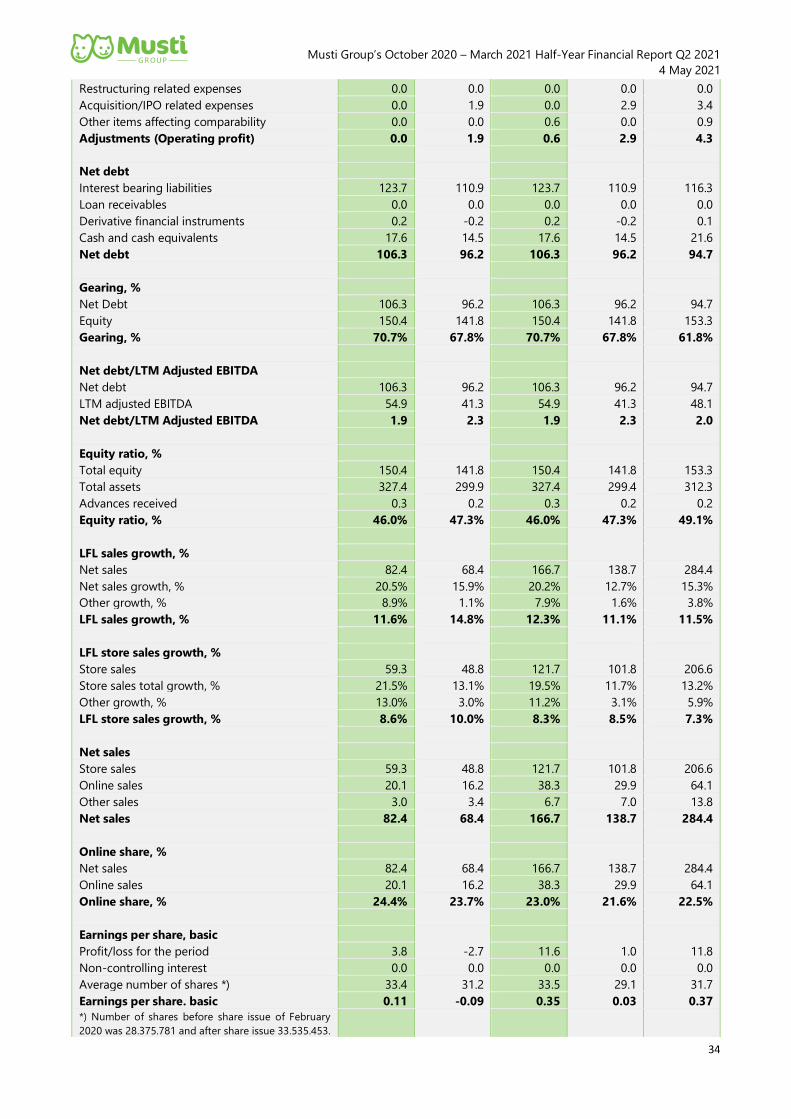
Musti Group’s October 2020 – March 2021 Half-Year Financial Report Q2 2021
4 May 2021
34
Restructuring related expenses 0.0 0.0 0.0 0.0 0.0
Acquisition/IPO related expenses 0.0 1.9 0.0 2.9 3.4
Other items affecting comparability 0.0 0.0 0.6 0.0 0.9
Adjustments (Operating profit) 0.0 1.9 0.6 2.9 4.3
Net debt
Interest bearing liabilities 123.7 110.9 123.7 110.9 116.3
Loan receivables 0.0 0.0 0.0 0.0 0.0
Derivative financial instruments 0.2 -0.2 0.2 -0.2 0.1
Cash and cash equivalents 17.6 14.5 17.6 14.5 21.6
Net debt 106.3 96.2 106.3 96.2 94.7
Gearing, %
Net Debt 106.3 96.2 106.3 96.2 94.7
Equity 150.4 141.8 150.4 141.8 153.3
Gearing, % 70.7% 67.8% 70.7% 67.8% 61.8%
Net debt/LTM Adjusted EBITDA
Net debt 106.3 96.2 106.3 96.2 94.7
LTM adjusted EBITDA 54.9 41.3 54.9 41.3 48.1
Net debt/LTM Adjusted EBITDA 1.9 2.3 1.9 2.3 2.0
Equity ratio, %
Total equity 150.4 141.8 150.4 141.8 153.3
Total assets 327.4 299.9 327.4 299.4 312.3
Advances received 0.3 0.2 0.3 0.2 0.2
Equity ratio, % 46.0% 47.3% 46.0% 47.3% 49.1%
LFL sales growth, %
Net sales 82.4 68.4 166.7 138.7 284.4
Net sales growth, % 20.5% 15.9% 20.2% 12.7% 15.3%
Other growth, % 8.9% 1.1% 7.9% 1.6% 3.8%
LFL sales growth, % 11.6% 14.8% 12.3% 11.1% 11.5%
LFL store sales growth, %
Store sales 59.3 48.8 121.7 101.8 206.6
Store sales total growth, % 21.5% 13.1% 19.5% 11.7% 13.2%
Other growth, % 13.0% 3.0% 11.2% 3.1% 5.9%
LFL store sales growth, % 8.6% 10.0% 8.3% 8.5% 7.3%
Net sales
Store sales 59.3 48.8 121.7 101.8 206.6
Online sales 20.1 16.2 38.3 29.9 64.1
Other sales 3.0 3.4 6.7 7.0 13.8
Net sales 82.4 68.4 166.7 138.7 284.4
Online share, %
Net sales 82.4 68.4 166.7 138.7 284.4
Online sales 20.1 16.2 38.3 29.9 64.1
Online share, % 24.4% 23.7% 23.0% 21.6% 22.5%
Earnings per share, basic
Profit/loss for the period 3.8 -2.7 11.6 1.0 11.8
Non-controlling interest 0.0 0.0 0.0 0.0 0.0
Average number of shares *) 33.4 31.2 33.5 29.1 31.7
Earnings per share. basic 0.11 -0.09 0.35 0.03 0.37
*) Number of shares before share issue of February
2020 was 28.375.781 and after share issue 33.535.453.
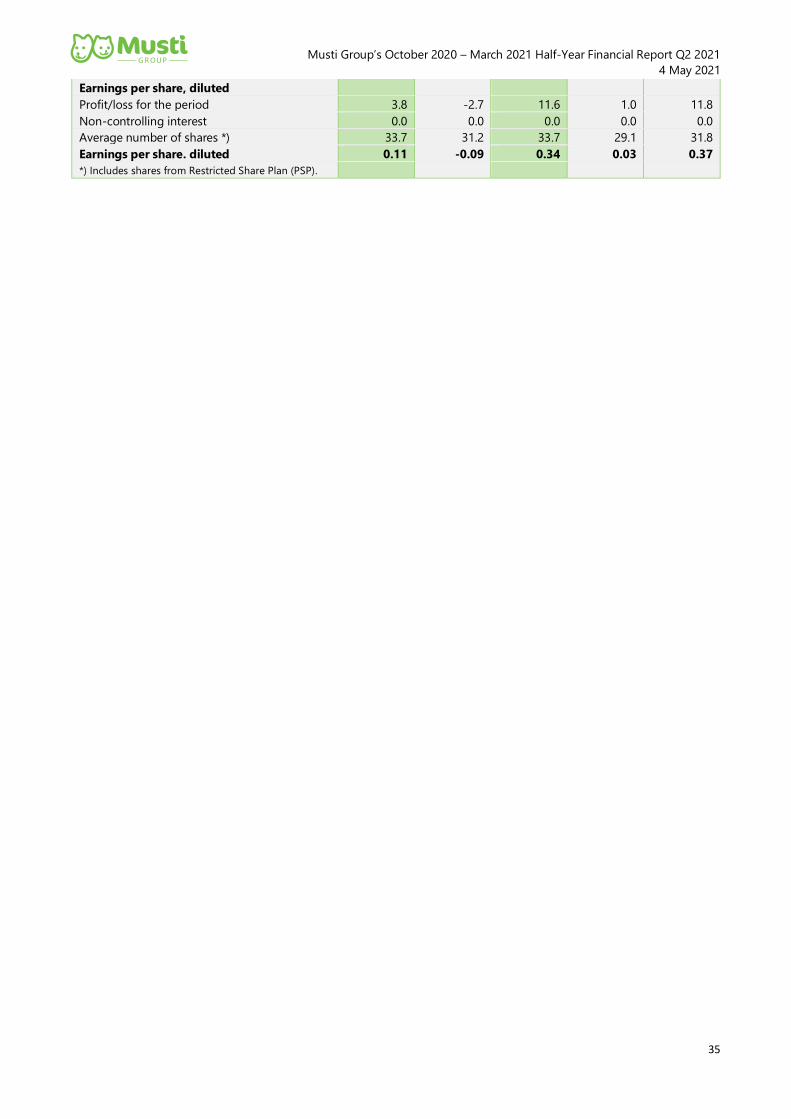
Musti Group’s October 2020 – March 2021 Half-Year Financial Report Q2 2021
4 May 2021
35
Earnings per share, diluted
Profit/loss for the period 3.8 -2.7 11.6 1.0 11.8
Non-controlling interest 0.0 0.0 0.0 0.0 0.0
Average number of shares *) 33.7 31.2 33.7 29.1 31.8
Earnings per share. diluted 0.11 -0.09 0.34 0.03 0.37
*) Includes shares from Restricted Share Plan (PSP).