Embed Size (px)
Citation preview
1
2
3
4
77
3D MODELING OF KARST CONDUIT AND GROUNDWATER FLOW
BELOW DAM SITE; CASE EXAMPLE VISEGRAD DAM
S. Milanović, PhD, Belgrade, Serbia, [email protected]
ABSTRACT
Already in the first year of the exploitation of the Visegrad dam, the occurrence
of submerged down streams springs was noticed. By the measurements of water
quantities that appear in the springs downstream from the dam it was established
that the quantity had increased from the 1.4 m3/s (in the year 1990) to 13.92 m
3/s
(in the year 2008), and 14.68 m3/s (in the year 2009). This paper present certain
investigations performed specially for needs of establishing position of karst
conduit below dam site.
Key words: Karst, dam, 3D, modeling, channel, groundwater
INTRODUCTION
In respect of risk factors in dam and reservoir construction in karst, particular
attention has to be paid to reservoir water tightness. An appropriate project
concept, prior to exploration, can significantly reduce the risks or minimize them
to acceptable levels (Zogovic D, 1980, Milanovic PT, 2000, Bruce D.A, 2003,
Fazeli, 2007, Milanovic S, 2010), while the reductions of exploration work can
increase them. Some of the inadequately explored reservoirs constructed in karst
have never fully filled up with water. One of the good example is problem of
water tightness of Visegrad dam.
The number of springs varied during the period of exploitation; occasionally
some smaller springs merged into a larger one; the change of the location of the
springs also occurred as well as the frequent appearance of muddled water on
the surface that indicates that washing out is still in progress. In the present state
there are 11 active springs. The losses began to increase constantly trough time.
The filtration beneath the dam is still going on through reactivated karst
channels, in the depths beneath the existing grout curtain, even beneath its
already deepened section.
Since it was established that it is a highly undesirable phenomenon, the increase
of which can lead a variety of damages, it has been assessed that it is necessary
to perform a certain number of special-purpose investigations, in order to
provide relevant data for the development and realization of the design of the
rehabilitation of the dam regarding seepage.
78
PREVIOUS INVESTIGATIONS – DURING CONSTRUCTION AND
EXPLOITATION
During the previous period of dam construction and exploitation were
performed certain multidisciplinary investigations, primarily with the goal of
definition of seepage. All these investigations have yielded a large body of
results, a part of which is significant for the solution of the seepage problem
beneath present conditions.
From performed detailed geological mapping of the dam site (in the 1:50 to
1:1000 scale), through more than 4470 m of drilling, as well as a lot of number
of tracer tests which is indicative of groundwater circulation, and constant
monitoring of 58 piezometers in dam abutment, was not enough to established
conditions of karstic network reactivation.
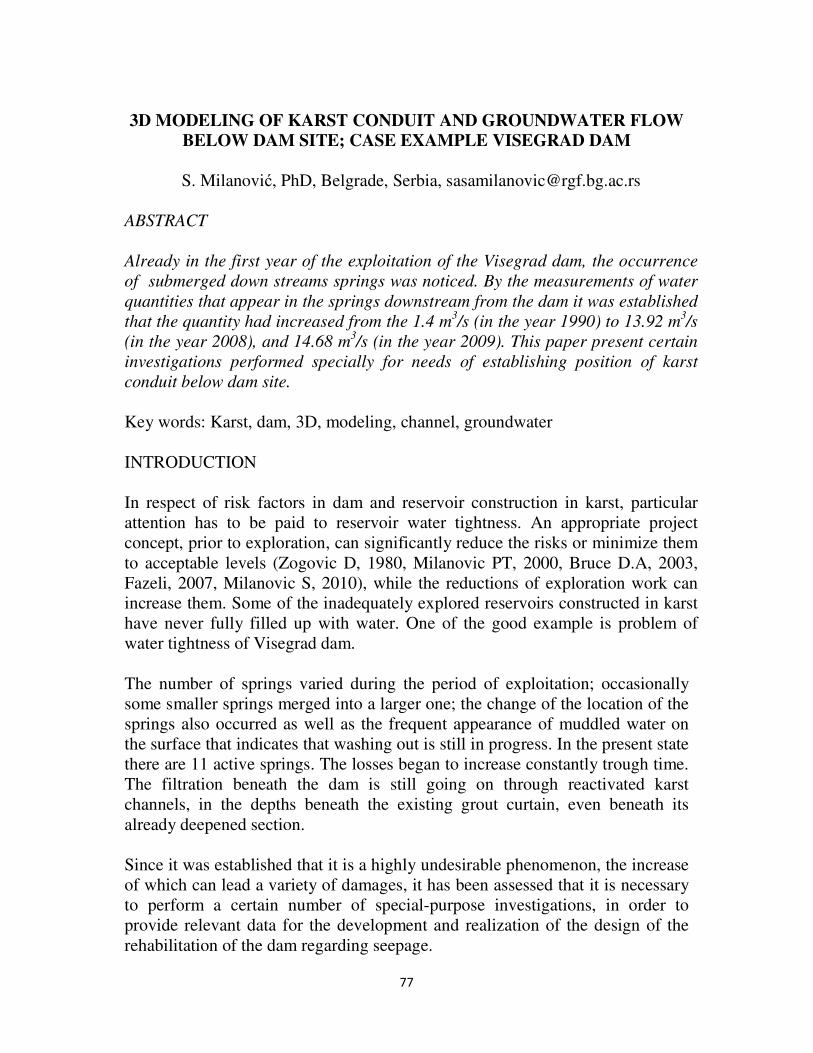
Water seepage beneath the dam
was systematically monitored
from the year 1991 to the year
2009. Measured values are
shown in the graph on Fig. 1.
Fig. 1. Water seepage measurements through time
MAIN RESULTS OF NEW SPECIAL INVESTIGATIONS
In order to define the positions of channels along which the groundwater
circulate under dam site, in the year 2009 were performed the special-purpose
investigations.
Detailed investigations of the narrow area around the dam site started with the
geodetical survey of the dam and the appurtenant structures, as well as of the
surrounding terrain, and by formation of the geodetic location plan in the
1:1000 scale, together with making maps of bottom topography of reservoir and
downstream. Also, geological investigations of the dam site started with new,
high-quality detailed geological mapping of the terrain. Parallel with these
investigations was performed cross-hole geo-electric scanning in the left and
right dam abutment and over the reservoir, as well as reflective seismic
79
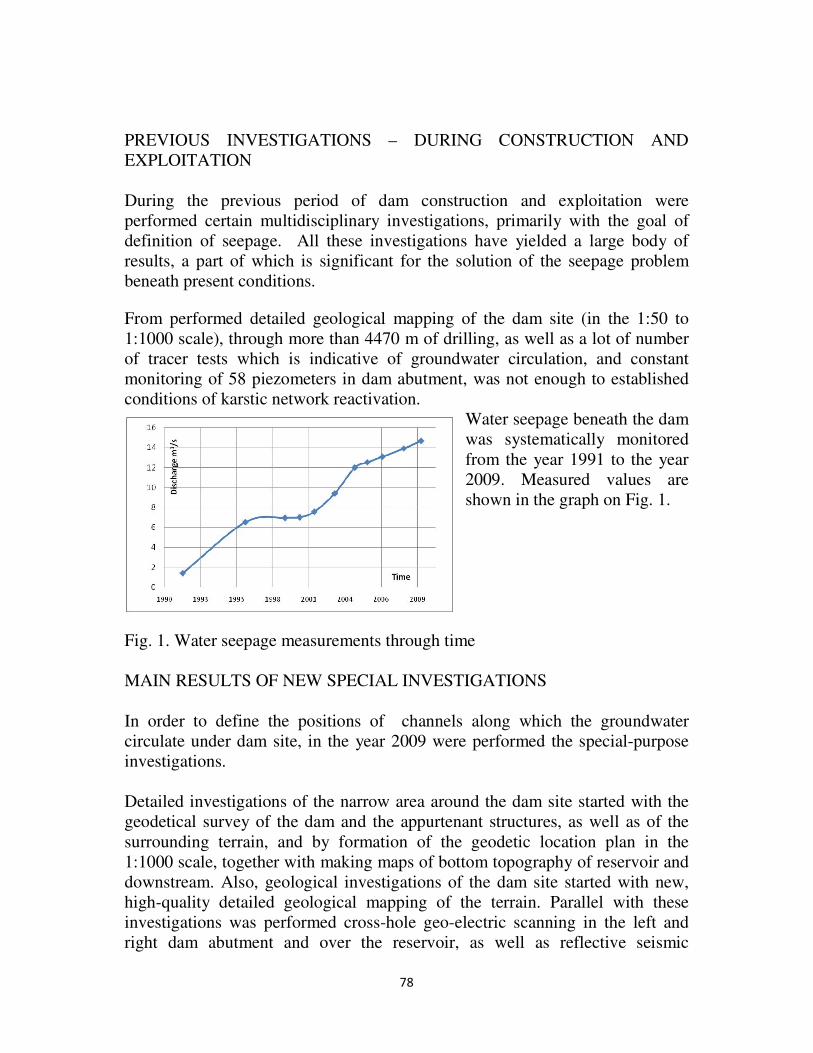
investigations in dam galleries. In the zone of the storage was simultaneously performed the bathyimetric
recording of the bottom of the part of the storage near the dam and of. By self-
potential measurement of reservoir bottom sinkhole of great size and capacity
was detected further investigated with underwater video equipment.
Immediately after the detection of the “large sinkhole” were performed its
measurement and determination of water inlet velocities. The entrance is area
about 15 m2 and 5 m deeper it become channel with diameter of 2m and
swallowing capacity of 9 m3/s Fig. 2.
In the meantime were performed the works on investigation drilling and
corresponding investigations in the boreholes (video endoscopy, carotage etc.).
The locations of these boreholes were determined is in succession, depending
on the results of all previously performed investigations Fig. 2.
Finally, after drilling of all boreholes and the completion of the corresponding
investigations in all 4 boreholes were conducted cross-hole geo-electric and
seismic tomography between the boreholes, as well as several times repeated
tracer tests in the large sinkhole (ponor) and boreholes.
80
Fig. 2. Hydrogeological characteristic of potential leaking below HPP Visegrad
according special investigations conducted in 2009
3D MODELING OF KARST CONDUIT
Geological investigations of the karst setting, required to address seepage
beneath the dam of the Višegrad Hydropower Plant (Višegrad HPP), were
focused on a rather narrow area containing a refill “sinking” zone and a
drainage “discharge” zone. The basic problem was how to perform a quality
analysis, or how to state the problem whose goal was to develop a model which
will be an analysis of the geometry of subsurface karst conduits, integrating
hydrogeological laws and basic geological characteristics.
The problem was approached from three parallel directions:
• Theoretical approach, which initially played a major role and provided
guidelines for field activities,
• Detailed and highly-complex field investigations and
81
• Development of a basic input 3D model, then an empirical approach and
later also a mathematical approach, aimed at producing the final form of the
model.
Based on the above problem statement, it was safe to assume that interactive
work and integrated use of known 2D and partly-defined 3D parameters will
produce an output of a three-dimensional nature.
By way of solution, evidence was needed that the method to be applied for the
construction of a 3D geometrical (or physical) model and a parametric model of
karst aquifer, aided by an incomplete data series, is feasible.
A 3D geological model was developed for the purposes of generating a network
of potential karst conduits running from the sinkhole zone to the spring zone, or
from the determined potential infiltration zone to the accurately defined karst
discharge zone.
The 3D geological model was developed using ArcGIS software and its
3DAnalyst, SpatialAnalyst and NetworkAnalyst extensions. All spatial data,
such as geological maps and profiles, as well as the positions of the dam, grout
curtain, grout galleries and piezometers, were converted into digital form, and
each spatial unit was defined by its x, y and z coordinates.
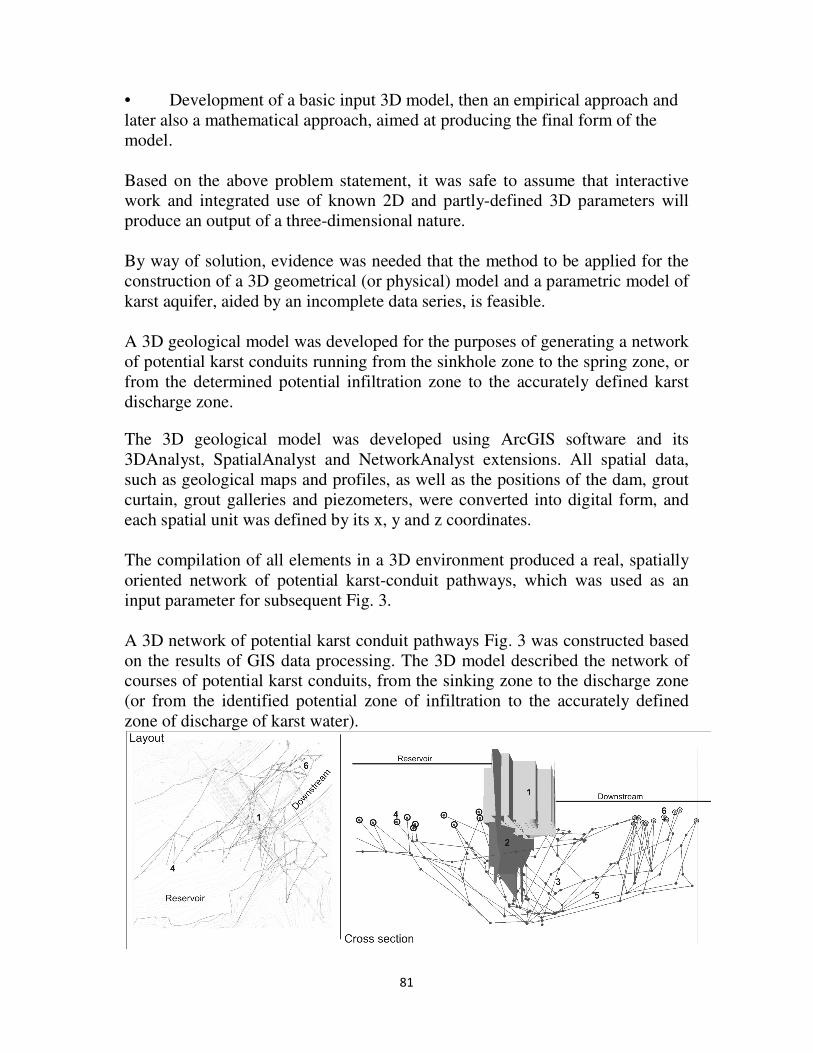
The compilation of all elements in a 3D environment produced a real, spatially
oriented network of potential karst-conduit pathways, which was used as an
input parameter for subsequent Fig. 3.
A 3D network of potential karst conduit pathways Fig. 3 was constructed based
on the results of GIS data processing. The 3D model described the network of
courses of potential karst conduits, from the sinking zone to the discharge zone
(or from the identified potential zone of infiltration to the accurately defined
zone of discharge of karst water).
82
Fig. 3. Spatially-oriented 3D network of potential karst conduits: 1. Dam, 2.
Grout curtain, 3. Network - karst conduits - link, 4. Node – sinking zone, 5.
Network node – link bifurcation, 6. Discharge zone - springs
As required by the numerical algorithms, this network was described by means
of model nodes and elements. They made up the topology of the numerical
model and spatially corresponded to the geological model.
Nodes were represented via x, y and z coordinates, where potentials were
computed. 1D elements were used for hydraulic calculations based on the finite
element method. The lengths of these elements were defined by the
corresponding nodes, and calculations were performed along them.
The network was comprised of 177 nodes, linked by 226 elements. From an
optimization algorithm perspective, the number of nodes, elements and free
parameters is indicative of the complexity of the problem. As a result, 207 x 5
(1130) parameters were determined and at the same time more than 100
computed values were compared with measured values. It is obvious that this
optimization problem required substantial processor time and a parallel genetic
algorithm was therefore used to arrive at a solution.
RESULTS OF MATHEMATICAL MODELING – OVERVIEW OF
GROUNDWATER FLOWS
The principal objective of the use of the mathematical model is to determine the
spatial layout of principal karst conduit
s and their physical characteristics. Taking into account the satisfactory degree
of congruence with the real system, the model defines all main groundwater
flows, with the corresponding parameters (dimensions, resistances, potentials,
velocities and discharges). This model, with its results, represents a foundation
for interpretation of geological data and determination of direction of
development of the dominant karst channels, i.e. water circulation paths.
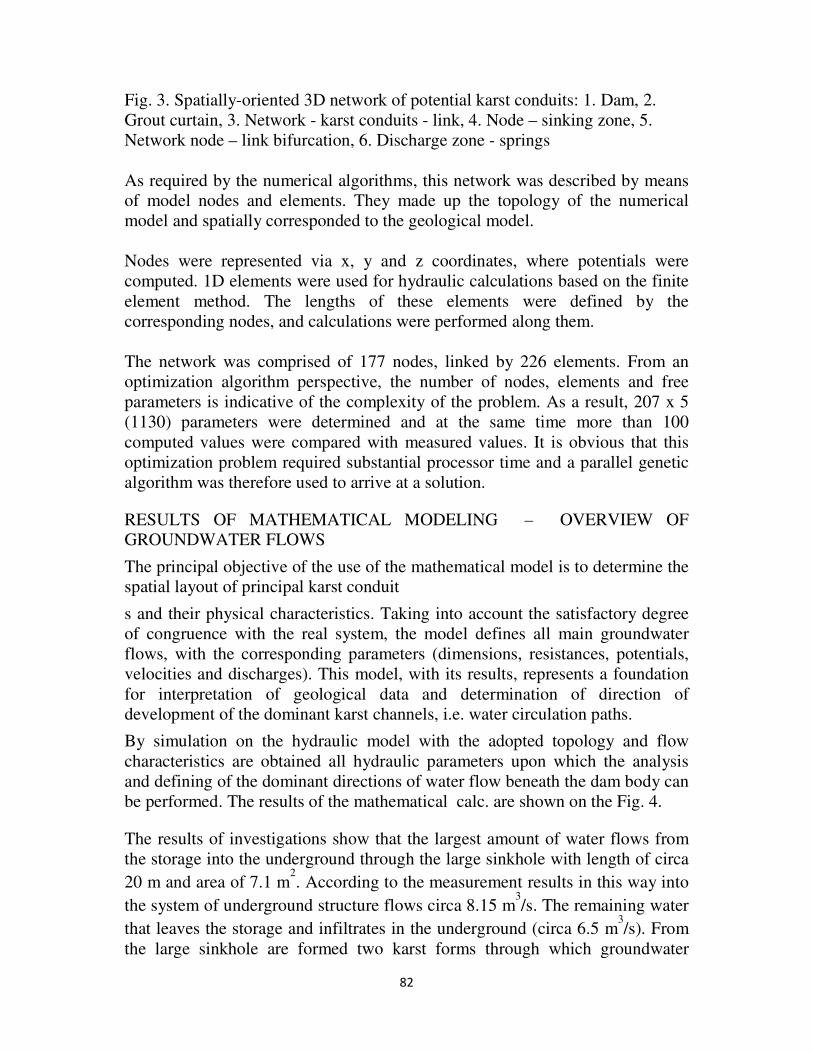
By simulation on the hydraulic model with the adopted topology and flow
characteristics are obtained all hydraulic parameters upon which the analysis
and defining of the dominant directions of water flow beneath the dam body can
be performed. The results of the mathematical calc. are shown on the Fig. 4.
The results of investigations show that the largest amount of water flows from
the storage into the underground through the large sinkhole with length of circa
20 m and area of 7.1 m2. According to the measurement results in this way into
the system of underground structure flows circa 8.15 m3/s. The remaining water
that leaves the storage and infiltrates in the underground (circa 6.5 m3/s). From
the large sinkhole are formed two karst forms through which groundwater
83
flows. The “left” direction of underground flow, i.e. the karst channel, was
formed along the dominant longitudinal fault structures. Along this direction
was formed a system of karst channels with two courses, that generally run
towards the boundary of the dam blocks
Fig. 4. Computational
values of discharges
along underground
courses.
By the performed special-purpose investigations were defined the underground
water courses and parameters necessary for development of the technical
solution for the permanent rehabilitation of seepage. However, the conduction
of the sealing rehabilitation works under such complex conditions is a very
complex process, so it must be followed by the elaborate special-purpose
monitoring from the very beginning of the process of conduction of
rehabilitation works.
REFERENCE
Group of authors, 2009: Design on rehabilitation regarding water seepage
beneath the dam of the Visegrad hydropower plant, Summary report on
performed investigations, Institute "Jaroslav Cerni", Belgrade
Milanovic S. 2010. Creation of physical model of karstic aquifer on example of
Beljanica mt. (Eastern Serbia),PhD work, FMG, Belgrade