Embed Size (px)
Citation preview
- 1 -
S. K. Ghosh Associates Inc.
Palatine, IL and Aliso Viejo, CA
www.skghoshassociates.com
SEISMIC DESIGN USING STRUCTURAL DYNAMICS
(PART ONE)
- 2 -
S. K. Ghosh Associates Inc.
www.skghoshassociates.com 1

- 3 -
ASCE 7-10 Table 12.6-1 Permitted Analytical Procedures
SeismicDesign
CategoryStructural Characteristics
EquivalentLateralForce
AnalysisSection 12.8
ModalResponseSpectrumAnalysis
Section 12.9
SeismicResponse
HistoryProceduresChapter 16
D, E and F
Structures with no structural irregularities and not exceeding 160 feet in structural height
P P P
Structures exceeding 160 feet in structural height with no structural irregularities and with T < 3.5 Ts
P P P
Structures not exceeding 160 feet in structural height and having only horizontal irregularities of Type 2, 3, 4, or 5 in Table 12.3-1 or vertical irregularities of Type 4, 5a, or 5b in Table 12.3-2
P P P
- 4 -
ASCE 7-10 Table 12.6-1 Permitted Analytical Procedures
S. K. Ghosh Associates Inc.
www.skghoshassociates.com 2
- 5 -
Design Ground Motion at Site
“Response Spectra”
- 6 -
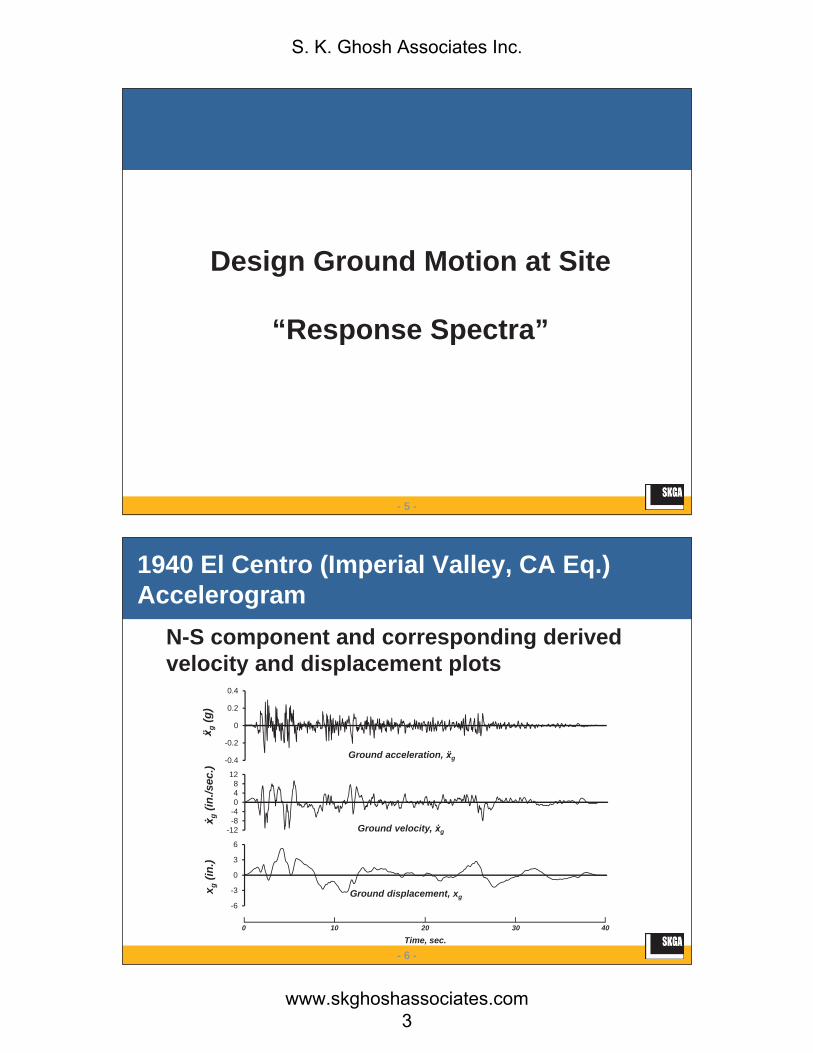
1940 El Centro (Imperial Valley, CA Eq.) Accelerogram
N-S component and corresponding derived velocity and displacement plots
-0.4
-0.2
0
0.2
0.4
-12-8-4048
12
-6
-3
0
3
6
g(g
)g
(in./s
ec.)
x g(in
.)
Ground acceleration, g
Ground velocity, g
Ground displacement, xg
0 4010 20 30
Time, sec.
S. K. Ghosh Associates Inc.
www.skghoshassociates.com 3
- 7 -
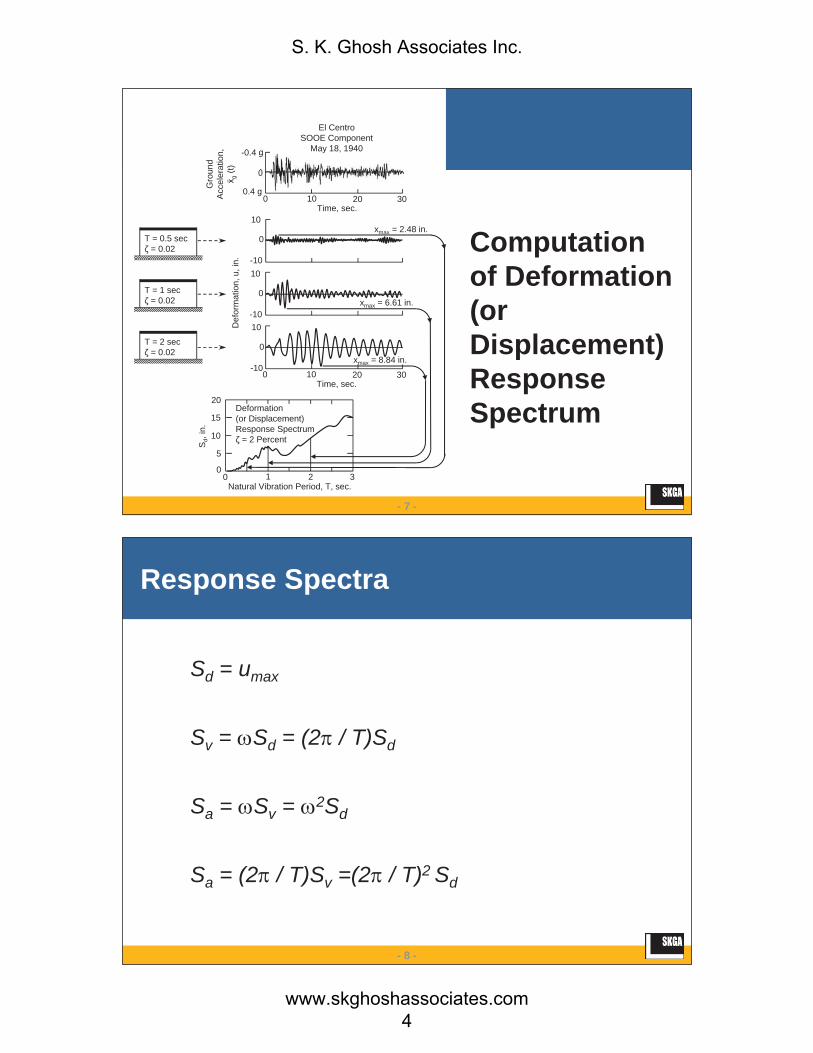
Computationof Deformation (orDisplacement)ResponseSpectrum
0.4 g
0
-0.4 g
Time, sec.0 10 20 30
-10
0
10
-10
0
10
-10
0
10
Time, sec.0 10 20 30
Def
orm
atio
n, u
, in.
Gro
und
Acc
eler
atio
n,g
(t)
Natural Vibration Period, T, sec.0 1 2 3
5
0
10
20
15
Sd,
in.
Deformation(or Displacement) Response Spectrum
= 2 Percent
El CentroSOOE Component
May 18, 1940
T = 0.5 sec= 0.02
T = 1 sec= 0.02
T = 2 sec= 0.02
xmax = 2.48 in.
xmax = 6.61 in.
xmax = 8.84 in.
- 8 -
Response Spectra
Sd = umax
Sv = Sd = (2 / T)Sd
Sa = Sv = 2Sd
Sa = (2 / T)Sv =(2 / T)2 Sd
S. K. Ghosh Associates Inc.
www.skghoshassociates.com 4
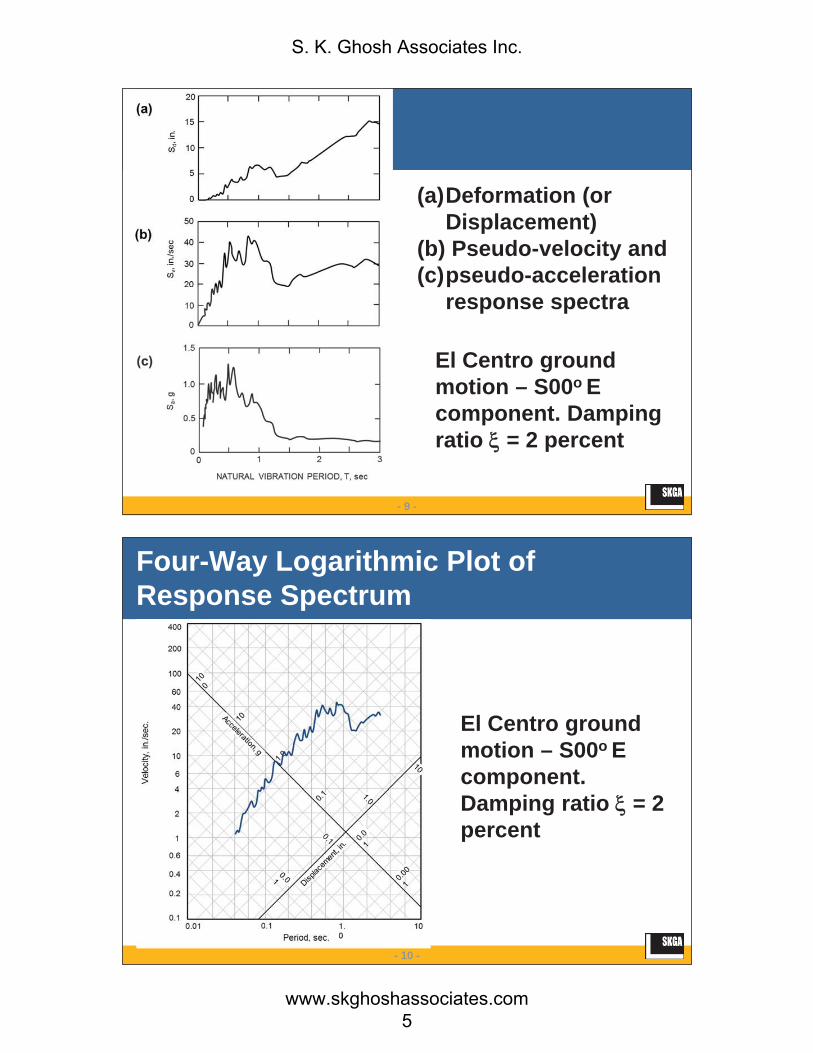
- 9 -
(a)Deformation (or Displacement)
(b) Pseudo-velocity and (c)pseudo-acceleration
response spectra
El Centro ground motion – S00o Ecomponent. Damping ratio = 2 percent
- 10 -
Four-Way Logarithmic Plot of Response Spectrum
El Centro ground motion – S00o Ecomponent.Damping ratio = 2 percent
S. K. Ghosh Associates Inc.
www.skghoshassociates.com 5
- 11 -
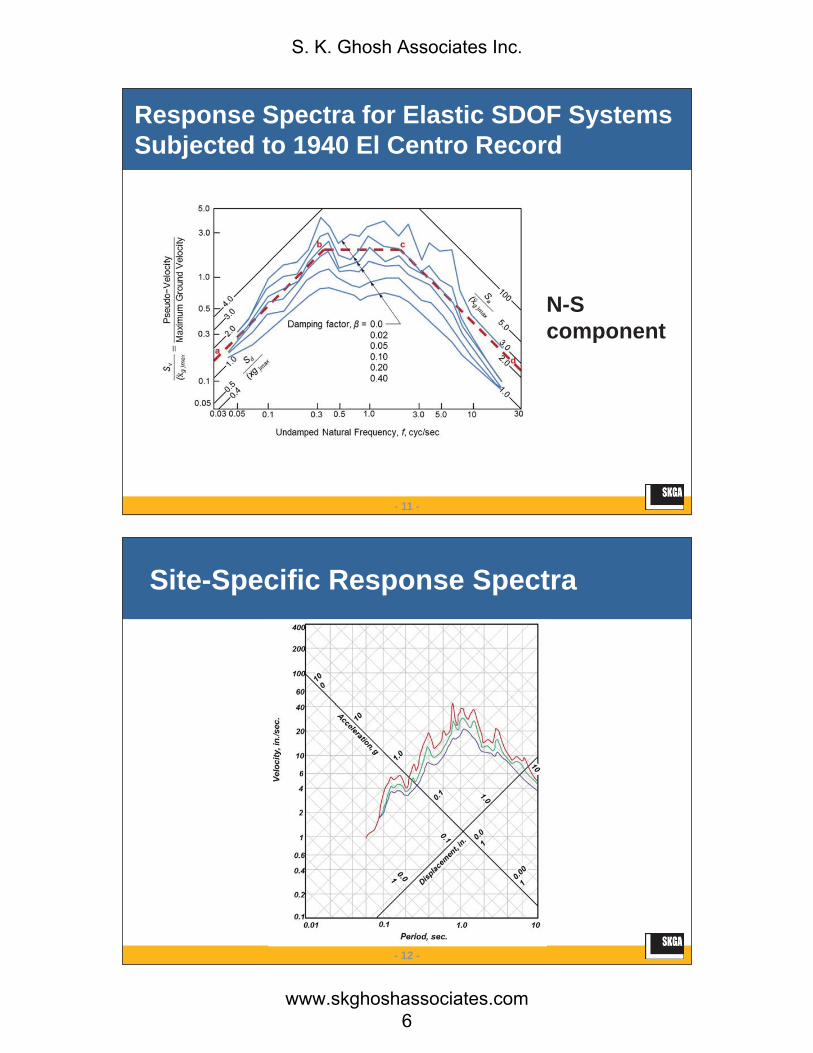
Response Spectra for Elastic SDOF Systems Subjected to 1940 El Centro Record
N-Scomponent
- 12 -
Site-Specific Response Spectra
S. K. Ghosh Associates Inc.
www.skghoshassociates.com 6

- 13 -
Smoothed Site-Specific ResponseSpectra
- 14 -
Applied Technology CouncilRecommendations for Specifying Ground Shaking at a Site
S. K. Ghosh Associates Inc.
www.skghoshassociates.com 7
- 15 -
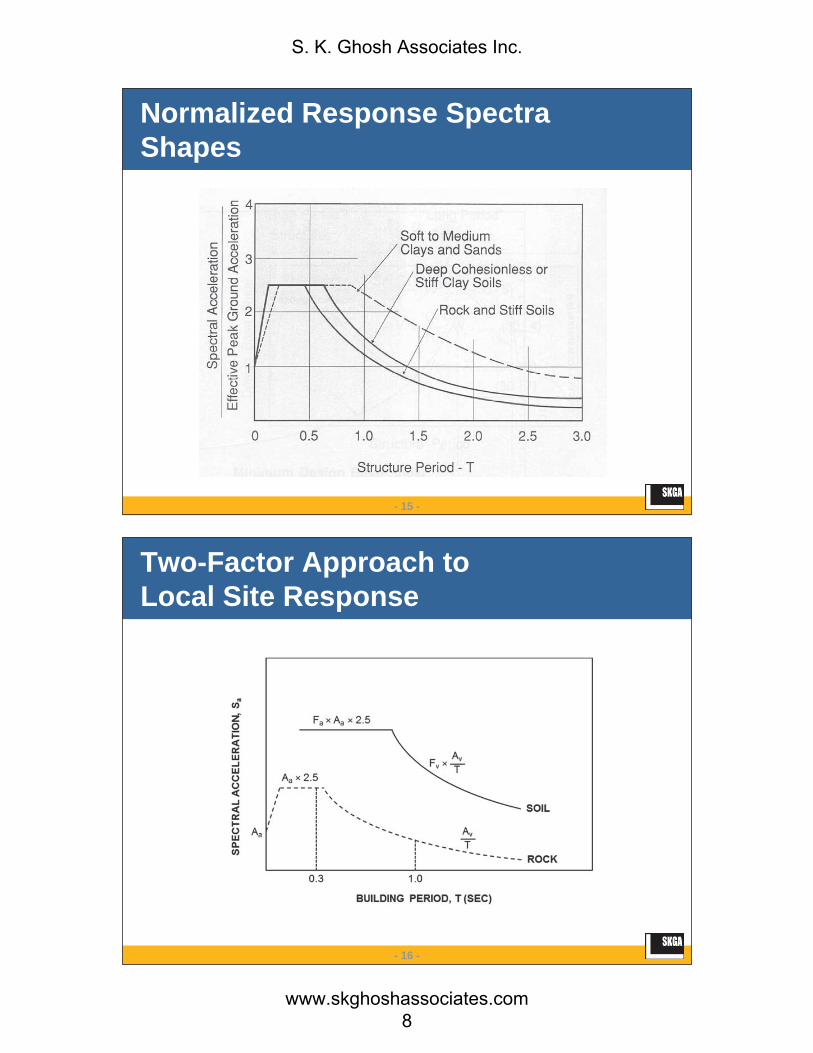
Normalized Response Spectra Shapes
- 16 -
Two-Factor Approach to Local Site Response
S. K. Ghosh Associates Inc.
www.skghoshassociates.com 8

- 17 -
1997 UBC Design Response Spectra
- 18 -
2000, 2003 IBCDesign Spectrum
S. K. Ghosh Associates Inc.
www.skghoshassociates.com 9

- 19 -
ASCE 7-05, -10 Figure 11.4-1: Design Response Spectrum (2006 – 2015 IBC)
- 20 -
Design Earthquake Ground Motion Prior to IBC
Approximately 90% probability of non-
exceedance in 50 years (approx. 475-year
return period)
S. K. Ghosh Associates Inc.
www.skghoshassociates.com 10
- 21 -
IBC/ASCE 7 Ground Motion Through 2009 IBC/ASCE 7-05
Maximum Considered Earthquake (MCE):
The maximum level of earthquake ground shaking
that is considered reasonable to design buildings to
resist.
- 22 -
Maximum Considered Earthquake (MCE):
2% probability of exceedance in 50 years
(approx, 2500 yr. return period) where
deterministic approach is not used.
IBC/ASCE 7 Ground Motion Through 2009 IBC/ASCE 7-05
S. K. Ghosh Associates Inc.
www.skghoshassociates.com 11

- 23 -
IBC/ASCE 7 Ground Motion Through 2009 IBC/ASCE 7-05
Maximum Considered Earthquake (MCE):
Deterministic earthquake (in coastal California) - best
estimate of ground motion from maximum magnitude
earthquakes on seismic faults with high probabilities
of occurrence.
- 24 -
IBC/ASCE 7 Design Ground Motion Through 2009 IBC/ASCE 7-05SS = MCE spectral acceleration in the short period range for Site Class B
S1 = MCE spectral acceleration at 1.0-sec period for Site Class B
SMS= FaSS, MCE spectral acceleration in the short period range adjusted for Site Class effects.
SM1 = FvS1, MCE spectral acceleration at 1.0-sec period adjusted for Site Class effects.
SDS = (2/3) SMS, spectral acceleration in the short period range for the design ground motion
SD1 = (2/3) SM1, spectral acceleration at 1.0-sec period for the design ground motion.
S. K. Ghosh Associates Inc.
www.skghoshassociates.com 12

- 25 -
BREAK!
If you are encountering technical difficulties, please call (847) 991-2700
If you have any questions, please type them in
- 26 -
Question andAnswer Session
If you are encountering technical difficulties, please call (847) 991-2700
If you have any questions, please type them in
S. K. Ghosh Associates Inc.
www.skghoshassociates.com 13
- 27 -
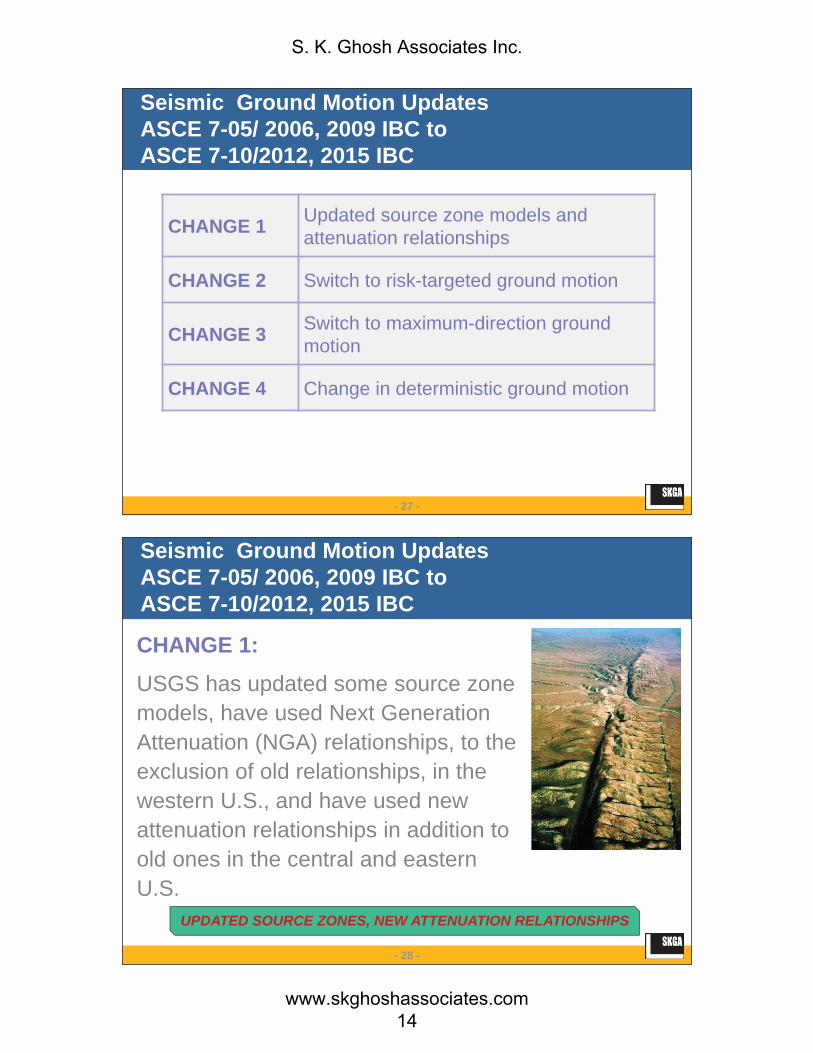
Seismic Ground Motion UpdatesASCE 7-05/ 2006, 2009 IBC to ASCE 7-10/2012, 2015 IBC
CHANGE 1 Updated source zone models and attenuation relationships
CHANGE 2 Switch to risk-targeted ground motion
CHANGE 3 Switch to maximum-direction ground motion
CHANGE 4 Change in deterministic ground motion
- 28 -
Seismic Ground Motion UpdatesASCE 7-05/ 2006, 2009 IBC to ASCE 7-10/2012, 2015 IBC
CHANGE 1:USGS has updated some source zone models, have used Next Generation Attenuation (NGA) relationships, to the exclusion of old relationships, in the western U.S., and have used new attenuation relationships in addition to old ones in the central and eastern U.S.
UPDATED SOURCE ZONES, NEW ATTENUATION RELATIONSHIPS
S. K. Ghosh Associates Inc.
www.skghoshassociates.com 14
- 29 -
Seismic Ground Motion UpdatesASCE 7-05/ 2006, 2009 IBC to ASCE 7-10/2012, 2015 IBC
CHANGE 2:Uniform-hazard ground motion has now been replaced by risk-targeted ground motion.
This switch from a 2% in 50-year hazard level to a 1% in 50-year collapse risk target has resulted in up to 30% decreases in ground motion in high-hazard areas of the central and eastern U.S. and in coastal Oregon and in some increases in other areas.
UNIFORM HAZARD RISK TARGETED
- 30 -
Seismic Ground Motion UpdatesASCE 7-05/ 2006, 2009 IBC to ASCE 7-10/2012, 2015 IBC
CHANGE 3:A switch has been made from “geo-mean” ground motions (square root of the product of ground motions in any two orthogonal directions) to maximum direction ground motions. This has resulted in increases in short-period ground motion by a factor of 1.1 and in long-period ground motion by a factor of 1.3.
GEO-MEAN MAXIMUM DIRECTION
S. K. Ghosh Associates Inc.
www.skghoshassociates.com 15
- 31 -
Seismic Ground Motion UpdatesASCE 7-05/ 2006, 2009 IBC to ASCE 7-10/2012, 2015 IBC
CHANGE 4:Deterministic ground motions have been changed from 150% of median ground motions to 84th
percentile ground motions, which are 180% of median ground motions.
150% OF MEDIAN 180% OF MEDIAN
- 32 -
ASCE 7-10 MCER Ground MotionResponse Accelerations11.2 DEFINITIONSRISK-TARGETED MAXIMUM CONSIDERED
EARTHQUAKE (MCER) GROUND MOTIONRESPONSE ACCELERATIONS The most severe earthquake effects considered by this standard determined for the orientation that results in the largest maximum response to horizontal ground motions and with adjustment for targeted risk.
S. K. Ghosh Associates Inc.
www.skghoshassociates.com 16
- 33 -
ASCE 7-10/2012, 2015 IBC Design Ground Motion SS = MCER spectral acceleration in the short period range for Site Class B
S1 = MCER spectral acceleration at 1.0-sec period for Site Class B
SMS= FaSS, MCER spectral acceleration in the short period range adjusted for Site Class effects.
SM1 = FvS1, MCER spectral acceleration at 1.0-sec period adjusted for Site Class effects.
SDS = (2/3) SMS, spectral acceleration in the short period range for the design ground motion
SD1 = (2/3) SM1, spectral acceleration at 1.0-sec period for the design ground motion.
- 34 -
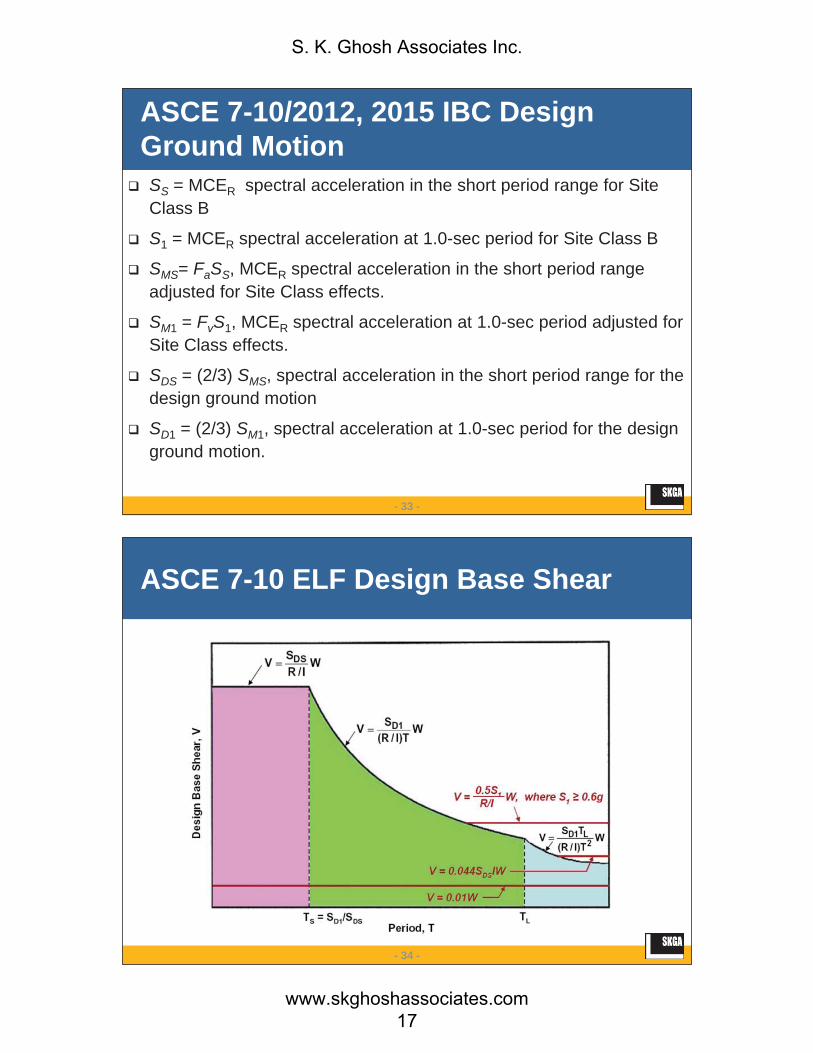
ASCE 7-10 ELF Design Base Shear
S. K. Ghosh Associates Inc.
www.skghoshassociates.com 17

- 35 -
ASCE 7-10 ELFMinimum Design Base Shear
All Seismic Design Categories…
Vmin = 0.044SDSIeW 0.01W (Eq. 12.8-5)
wherever S1 > 0.6g...
(Eq. 12.8-6)WR
IS.V emin
150
- 36 -
Mode Superposition Analysis of Earthquake Response
3
2
1
333231
232221
131211
3
2
1
XXX
xxx
3332321313
3232221212
3132121111
XXXxXXXx
XXXxor
orX
Xx 321
S. K. Ghosh Associates Inc.
www.skghoshassociates.com 18

- 37 -
Mode Superposition Analysis of Earthquake Response
- 38 -
Example
• Given
hs = 10 ft
w = 386.4 kips/floor
E = 4000 ksi
Icol = 4500 in.4 eachcolumn (0.7Ig )
S. K. Ghosh Associates Inc.
www.skghoshassociates.com 19

- 39 -
Determine Mass Matrix
m = w/g = 386.4 / 386.4
= 1.0 kip-sec.2/in.
100010001
m
- 40 -
Determine Stiffness Matrix
12EI/hs3 = 12 x 4000 x 9000 / (12x10)3 = 250 kips/in.
kij = force corresponding to displacement of coordinate iresulting from a unit displacement of coordinate j 110
121012
250k
S. K. Ghosh Associates Inc.
www.skghoshassociates.com 20
- 41 -
Equations of Motion
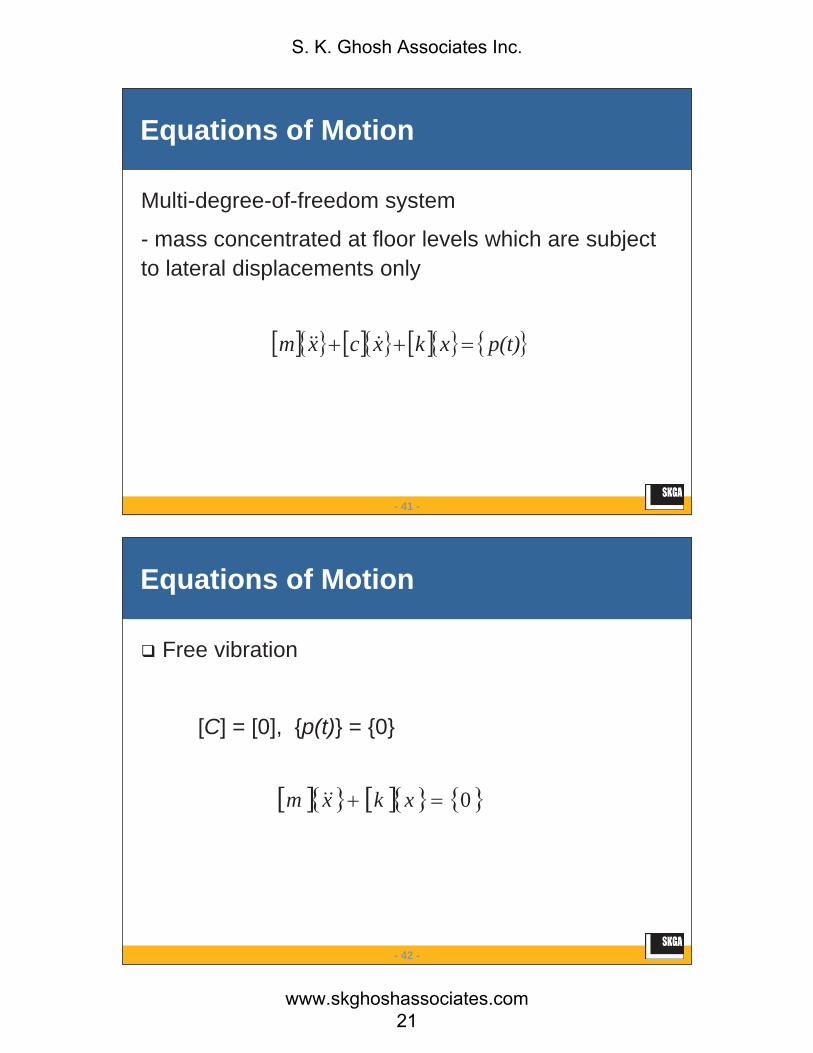
Multi-degree-of-freedom system
- mass concentrated at floor levels which are subject to lateral displacements only
p(t)xkxcxm
- 42 -
Equations of Motion
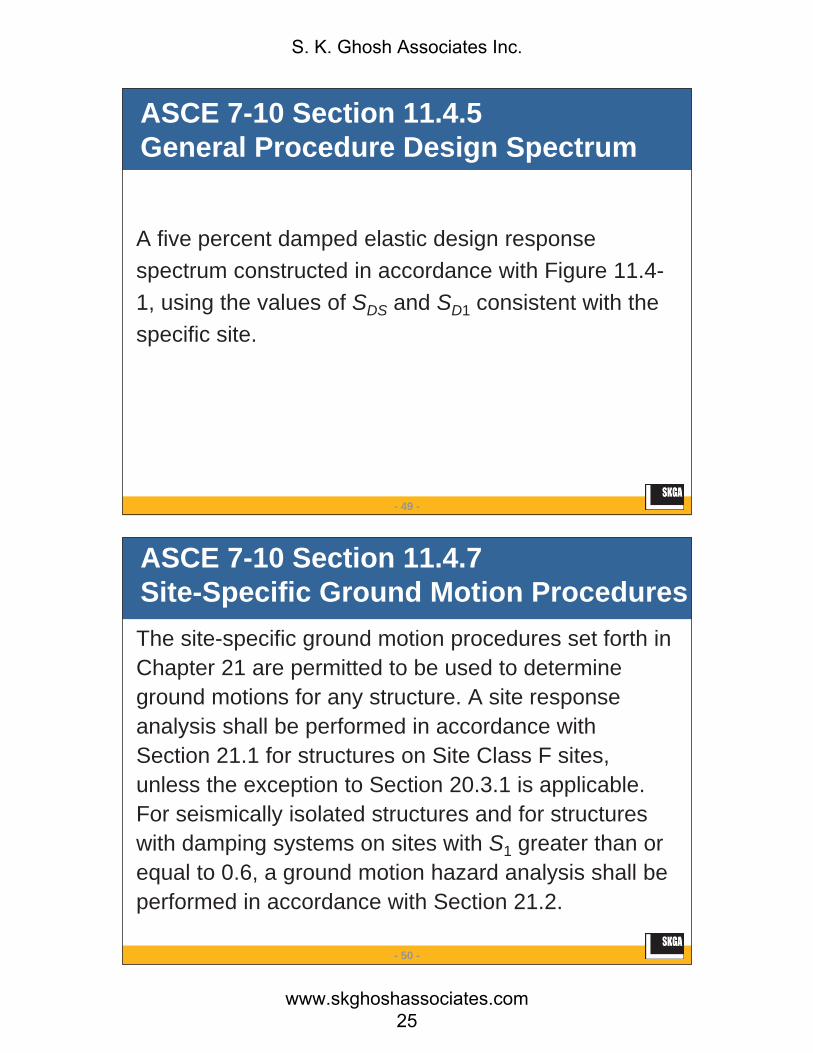
Free vibration
[C] = [0], {p(t)} = {0}
0xkxm
S. K. Ghosh Associates Inc.
www.skghoshassociates.com 21

- 43 -
Equations of Motion
Motion of a system in free vibration is simple harmonic
tsinAxtcosAx
tsinAx
2
- 44 -
Equations of Motion
00
2
2
AmkAkAm-
S. K. Ghosh Associates Inc.
www.skghoshassociates.com 22

- 45 -
Find Determinant for Matrix[k] - 2[m]
The period is equal to 2 / :
T1 = 0.893 sec.
T2 = 0.319 sec.
T3 = 0.221 sec.
Setting the determinant of the above matrix equal to zero yields the following frequencies:
2
2
2
2
25025002505002500250500
mk
1 = 7.036 radians/sec.
2 = 19.685 radians/sec.
3 = 28.491 radians/sec.
- 46 -
Find Mode Shapes
First Mode:
000
03672502500250036750025002500367500
11
21
31
2
2
2
).().(
).(
31 = 1.0, 21 = 0.802, 11 = 0.445
S. K. Ghosh Associates Inc.
www.skghoshassociates.com 23

- 47 -
Second Mode:
000
68519250250025068519500250025068519500
12
22
32
2
2
2
).().(
).(
32 = 1.0, 22 = -0.55, 12 = -1.22
Find Mode Shapes
- 48 -
33
23
13
Third Mode:
000
49128250250025049128500250025049128500
13
23
33
2
2
2
).().(
).(
33 = 1.0, 23 = -2.25, 13 = 1.802
Find Mode Shapes
S. K. Ghosh Associates Inc.
www.skghoshassociates.com 24
- 49 -
ASCE 7-10 Section 11.4.5General Procedure Design Spectrum
A five percent damped elastic design response spectrum constructed in accordance with Figure 11.4-1, using the values of SDS and SD1 consistent with the specific site.
- 50 -
ASCE 7-10 Section 11.4.7Site-Specific Ground Motion ProceduresThe site-specific ground motion procedures set forth in Chapter 21 are permitted to be used to determine ground motions for any structure. A site response analysis shall be performed in accordance with Section 21.1 for structures on Site Class F sites, unless the exception to Section 20.3.1 is applicable. For seismically isolated structures and for structures with damping systems on sites with S1 greater than or equal to 0.6, a ground motion hazard analysis shall be performed in accordance with Section 21.2.
S. K. Ghosh Associates Inc.
www.skghoshassociates.com 25
- 51 -
ASCE 7-10 Section 21.2Ground Motion Hazard Analysis
The ground motion hazard analysis shall account for the regional tectonic setting, geology, and seismicity, the expected recurrence rates and maximum magnitudes of earthquakes on known faults and source zones, the characteristics of ground motion attenuation, near source effects, if any, on ground motions, and the effects of subsurface site conditions on ground motions. The characteristics of subsurface site conditions shall be considered either using attenuation relations that represent regional and local geology or in accordance with Section 21.1.
- 52 -
ASCE 7-10 Section 21.4
Where the site-specific procedure is used to determine the design ground motion, the parameter SDS shall be taken as the spectral acceleration, Sa, obtained from the site-specific spectra at a period of 0.2 sec, except that it shall not be taken less than 90 percent of the peak spectral acceleration, Sa, at any period larger than 0.2 sec. The parameter SD1 shall be taken as the greater of the spectral acceleration, Sa, at a period of 1 sec or two times the spectral acceleration, Sa, at a period of 2 sec. The parameters SMS and SM1 shall be taken as 1.5 times SDS and SD1, respectively. The values so obtained shall not be less than 80 percent of the values determined by the general procedure.
S. K. Ghosh Associates Inc.
www.skghoshassociates.com 26
- 53 -
ASCE 7-10 Section 12.7.3 Mathematical Model
1. A mathematical model of the structure shall beconstructed for the purpose of determining member forces and structure displacements resulting from applied loads and any imposed displacements or P-delta effects. The model shall include the stiffness and strength of elements that are significant to the distribution of forces and deformations in the structure and represent the spatial distribution of mass and stiffness throughout the structure.
- 54 -
ASCE 7-10 Section 12.7.3Mathematical Model
2. In addition, the model shall comply with the following:
a. Stiffness properties of concrete and masonry elements shall include the effects of cracked sections.
b. For steel moment frame systems, the contribution of panel zone deformations to overall story drift shall be included.
S. K. Ghosh Associates Inc.
www.skghoshassociates.com 27
- 55 -
ASCE 7-10 Section 12.7.3Mathematical Model
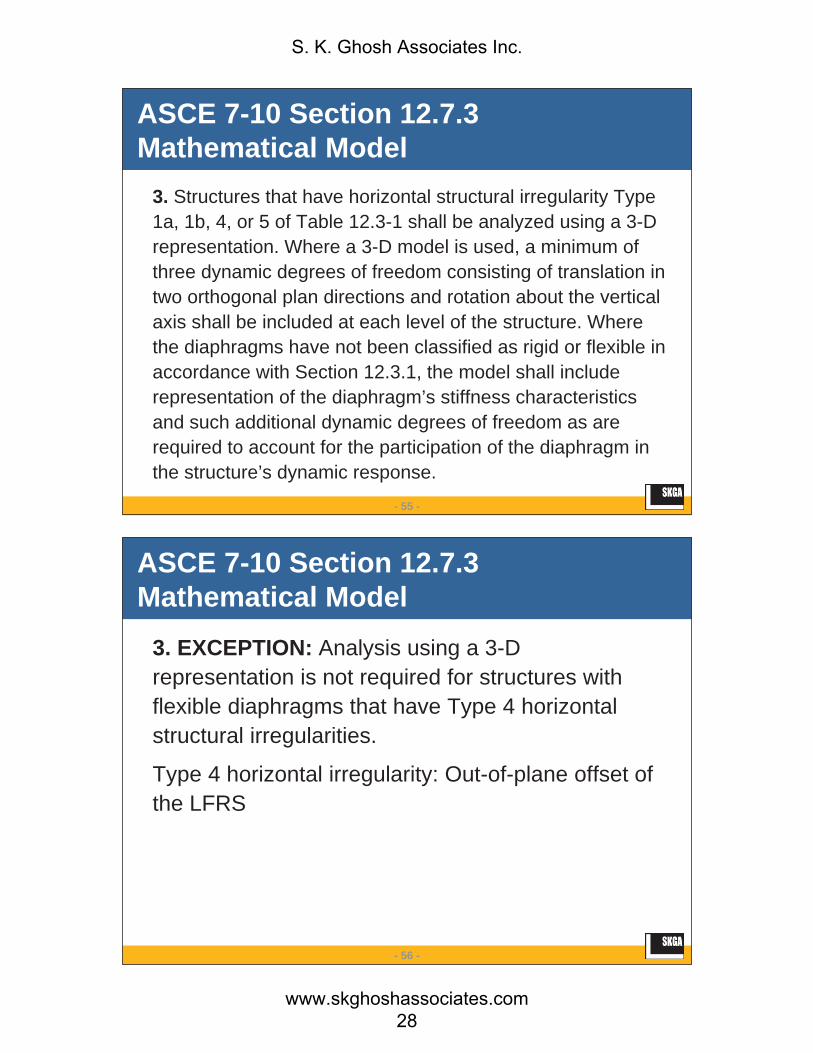
3. Structures that have horizontal structural irregularity Type 1a, 1b, 4, or 5 of Table 12.3-1 shall be analyzed using a 3-D representation. Where a 3-D model is used, a minimum of three dynamic degrees of freedom consisting of translation in two orthogonal plan directions and rotation about the vertical axis shall be included at each level of the structure. Where the diaphragms have not been classified as rigid or flexible in accordance with Section 12.3.1, the model shall include representation of the diaphragm’s stiffness characteristics and such additional dynamic degrees of freedom as are required to account for the participation of the diaphragm in the structure’s dynamic response.
- 56 -
ASCE 7-10 Section 12.7.3Mathematical Model
3. EXCEPTION: Analysis using a 3-D representation is not required for structures with flexible diaphragms that have Type 4 horizontal structural irregularities.
Type 4 horizontal irregularity: Out-of-plane offset of the LFRS
S. K. Ghosh Associates Inc.
www.skghoshassociates.com 28
- 57 -
12.7.3 Structural Modeling
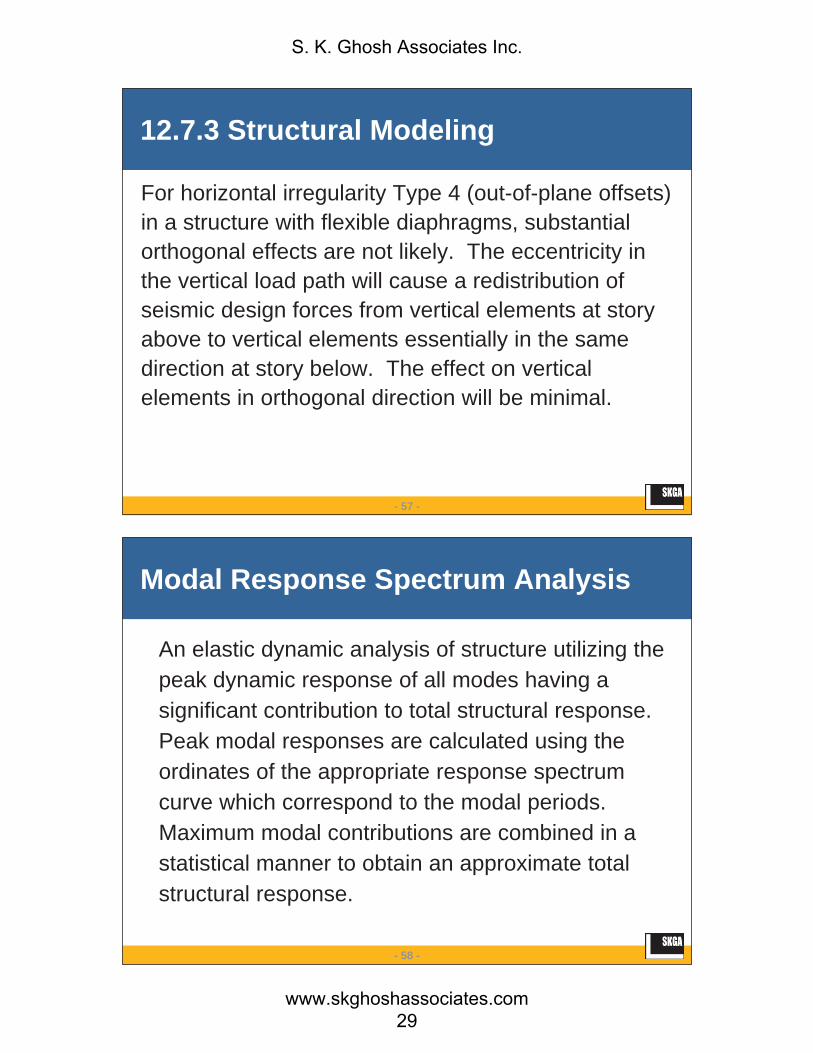
For horizontal irregularity Type 4 (out-of-plane offsets) in a structure with flexible diaphragms, substantial orthogonal effects are not likely. The eccentricity in the vertical load path will cause a redistribution of seismic design forces from vertical elements at story above to vertical elements essentially in the same direction at story below. The effect on vertical elements in orthogonal direction will be minimal.
- 58 -
Modal Response Spectrum Analysis
An elastic dynamic analysis of structure utilizing the peak dynamic response of all modes having a significant contribution to total structural response. Peak modal responses are calculated using the ordinates of the appropriate response spectrum curve which correspond to the modal periods. Maximum modal contributions are combined in a statistical manner to obtain an approximate total structural response.
S. K. Ghosh Associates Inc.
www.skghoshassociates.com 29
- 59 -
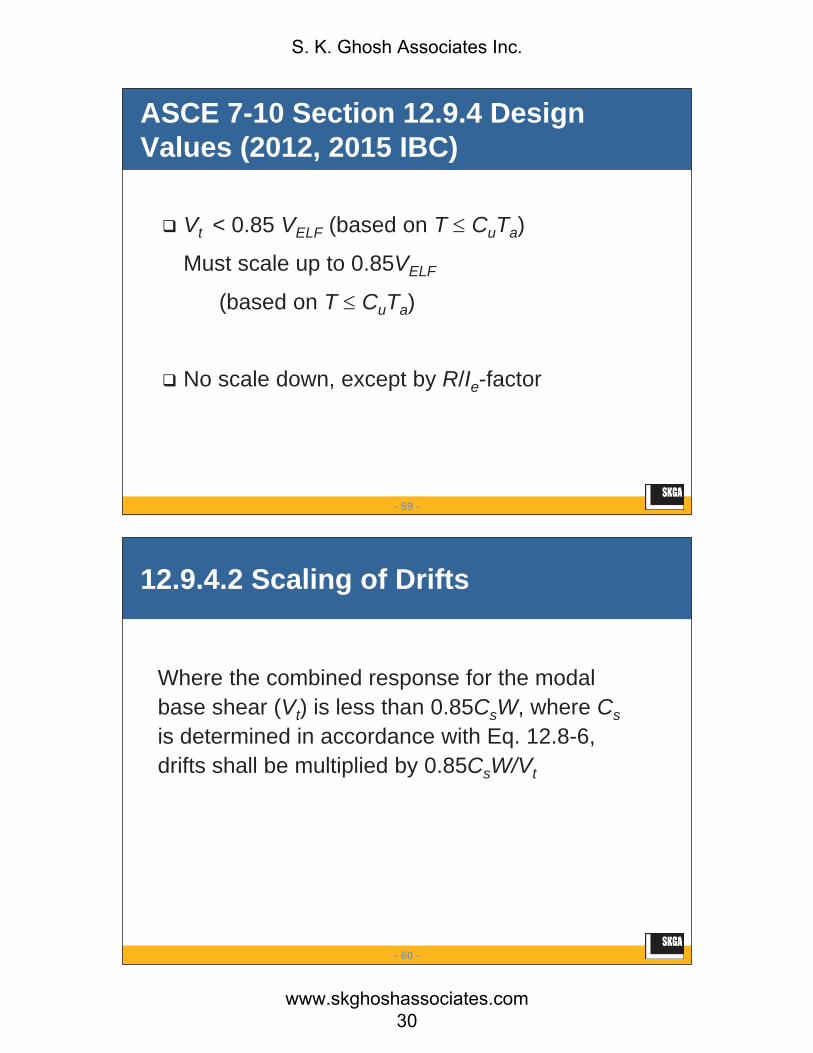
ASCE 7-10 Section 12.9.4 Design Values (2012, 2015 IBC)
Vt < 0.85 VELF (based on T CuTa)
Must scale up to 0.85VELF
(based on T CuTa)
No scale down, except by R/Ie-factor
- 60 -
12.9.4.2 Scaling of Drifts
Where the combined response for the modal base shear (Vt) is less than 0.85CsW, where Csis determined in accordance with Eq. 12.8-6, drifts shall be multiplied by 0.85CsW/Vt
S. K. Ghosh Associates Inc.
www.skghoshassociates.com 30

- 61 -
ASCE 7-10 ELF Design Base Shear
- 62 -
12.9.4.2 Scaling of Drifts
Added in ASCE 7-10 is scaling of drifts where the near-fault minimum base shear equation governs. There is general agreement that this was always the intent and that this requirement is important for long-period structures (for which minimum base shears control).
S. K. Ghosh Associates Inc.
www.skghoshassociates.com 31

- 63 -
Question andAnswer Session
If you are encountering technical difficulties, please call (847) 991-2700
If you have any questions, please type them in
- 64 -
Follow us on:
Thank You!!
For more information…
www.skghoshassociates.com
Phone: (847) 991-2700 / (949) 215-6560
Email: [email protected]
S. K. Ghosh Associates Inc.
www.skghoshassociates.com 32

- 65 -
SEISMIC DESIGN USING STRUCTURAL DYNAMICS
(PART TWO)
S. K. Ghosh Associates Inc.
Palatine, IL and Aliso Viejo, CA
www.skghoshassociates.com
- 66 -
Modal Response Spectrum Analysis
Step 1 – Develop mathematical model of structure... to represent proper spatial distribution of mass and stiffness of structure (ASCE 7-10 Section 12.7.3)
Step 2 – Determine mode shapes { m} and corresponding periods Tm of structure... by eigenvalue analysis
S. K. Ghosh Associates Inc.
www.skghoshassociates.com 33
- 67 -
Modal Response Spectrum Analysis
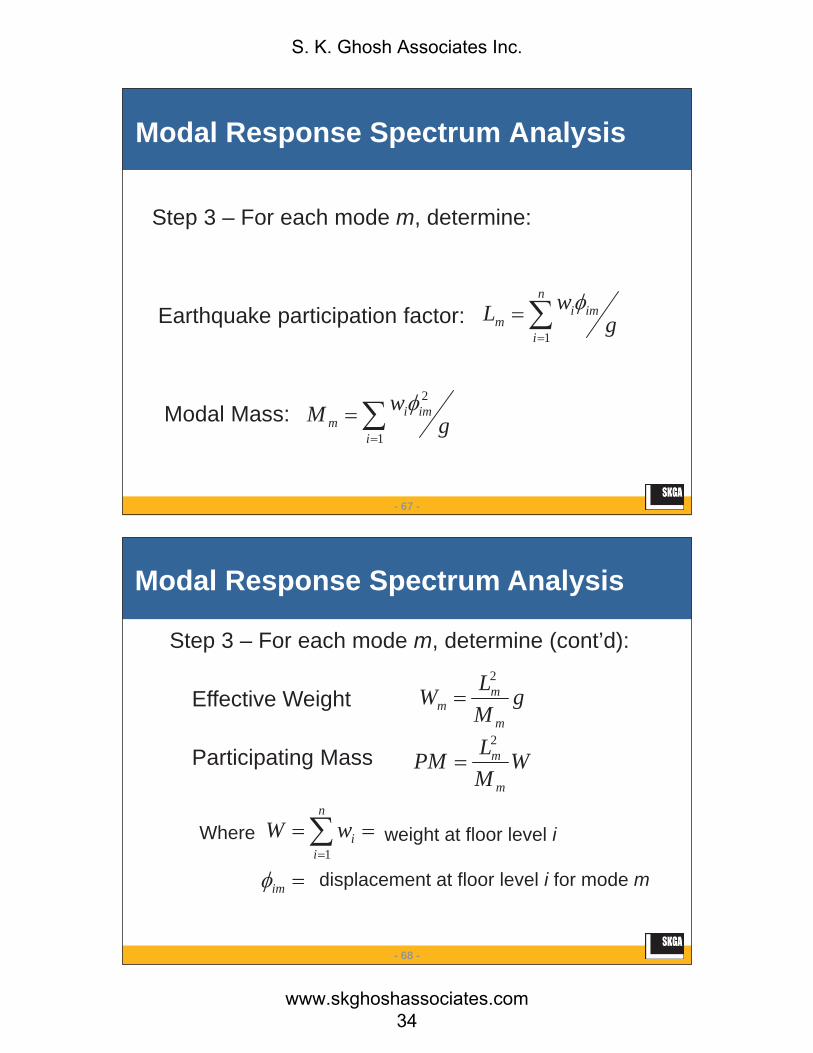
Step 3 – For each mode m, determine:
Earthquake participation factor:
Modal Mass:1
2
i
imim g
wM
n
i
imim g
wL1
- 68 -
Modal Response Spectrum Analysis
Step 3 – For each mode m, determine (cont’d):
Effective Weight
Participating Mass
gMLW
m
mm
2
WMLPM
m
m2
im
n
iiwW
1Where
displacement at floor level i for mode m
weight at floor level i
S. K. Ghosh Associates Inc.
www.skghoshassociates.com 34
- 69 -
Modal Response Spectrum Analysis
Step 4 – Determine number of modes to be considered... to represent at least 90% of participating mass of structure (ASCE 7-10 Section 12.9.1)
PM = (Wm/W) 0.90
- 70 -
Modal Response Spectrum Analysis
Step 5 – Determine spectral acceleration and seismic design coefficient for each mode
(1) From Design Response Spectrum (ASCE 7-10 Fig. 11.4-1), determine Sam for Tm,
S. K. Ghosh Associates Inc.
www.skghoshassociates.com 35
- 71 -
Modal Response Spectrum Analysis
(2) Determine modal seismic design coefficient,
Csm = (Sam x Ie) / R
where Ie = Importance Factor from ASCE 7-10 Table 1.5-2 and R = Response Modification Factor from Table 12.2-1
- 72 -
Modal Response Spectrum Analysis
Step 6 – Determine modal base shears, Vm, and total dynamic base shear, Vt
Vm = (Csm/g) x Wm
Vt = (V12 + V2
2 + ... + Vn2)1/2
S. K. Ghosh Associates Inc.
www.skghoshassociates.com 36
- 73 -
Modal Response Spectrum Analysis
Step 7 – Determine design base shear from Static Force Procedure (ASCE 7-10 Section 12.8) and compare with base shear from dynamic analysis.
- 74 -
Modal Response Spectrum Analysis
Step 8 – Scale dynamic analysis results (ASCE 7-10 Section 12.9.4)
Scale factor = 0.85(VELF /Vt) 1
VELF = the equivalent lateral force procedure base shear,
computed based on ASCE 7-10 Sections 12.9.4 and
12.8
Vt = the base shear from the required modal
combination
S. K. Ghosh Associates Inc.
www.skghoshassociates.com 37
- 75 -
Modal Response Spectrum Analysis
Step 8 (cont’d) – Scale dynamic analysis results (ASCE 7-10 Sec. 12.9.4)
Adjusted Vt = mean root square of adjusted Vm
values
Vt = (V12 + V2
2 + ... + Vn2)1/2
- 76 -
Modal Response Spectrum Analysis
Step 9 – Distribute base shear for each mode over height of structure
where Fim = lateral force at level ifor mode m
Vm = base shear for mode m
mimi
imiim V
wwF
S. K. Ghosh Associates Inc.
www.skghoshassociates.com 38

- 77 -
Modal Response Spectrum Analysis
Step 10 – Perform lateral analysis for each mode... to determine member forces for each mode of vibration being considered (ASCE 7-10 Section 12.9.2)
For rigid diaphragms... include accidental torsion (ASCE 7-10 Section 12.8.4.2) in the distribution of story shears to seismic force-resisting systems.
- 78 -
Modal Response Spectrum Analysis
Step 11 – Combine dynamic analysis results (moments, shears, axial forces, and displacements) for all considered modes using root mean square combination (SRSS)... to approximate total structural response (ASCE 7-10 Section 12.9.3) or resultant design values
S. K. Ghosh Associates Inc.
www.skghoshassociates.com 39

- 79 -
Example 1
- 80 -
Modal Response Spectrum Analysis Example
• Given
hs = 10 ft
w = 386.4 kips/floor
E = 4000 ksi
Icol = 4500 in.4 eachcolumn
S. K. Ghosh Associates Inc.
www.skghoshassociates.com 40
- 81 -
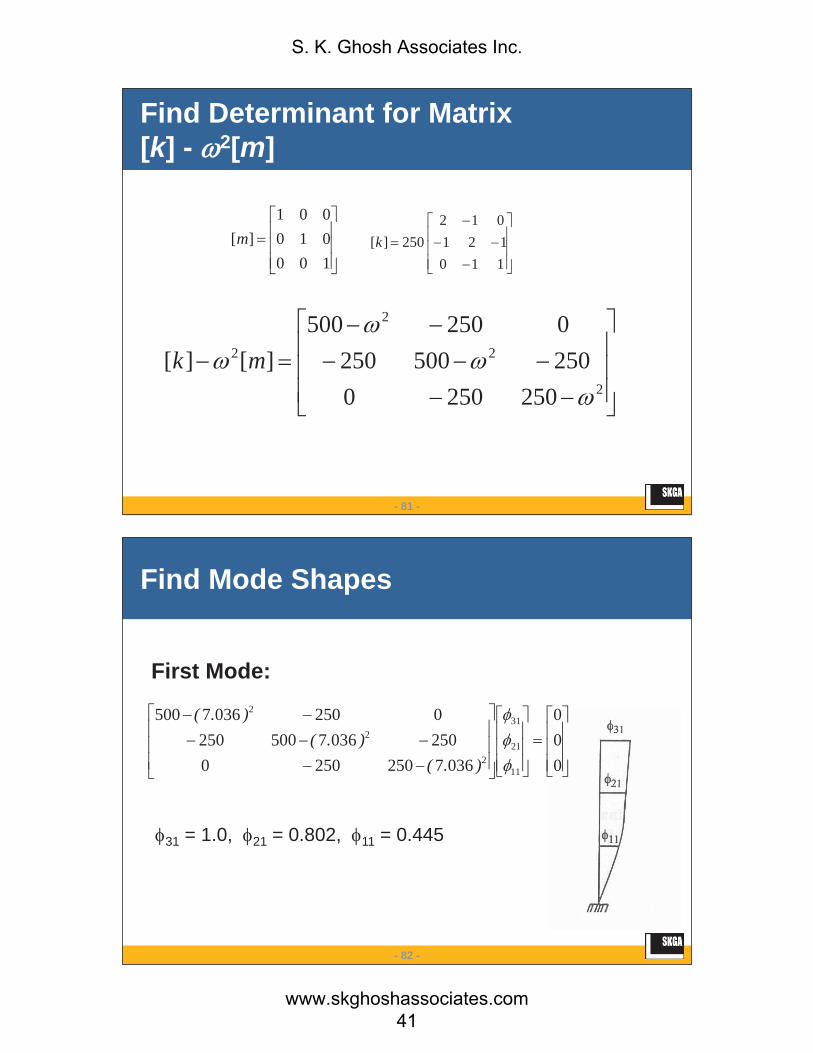
Find Determinant for Matrix [k] - 2[m]
2
2
2
2
25025002505002500250500
][][ mk
100010001
][m110121012
250][k
- 82 -
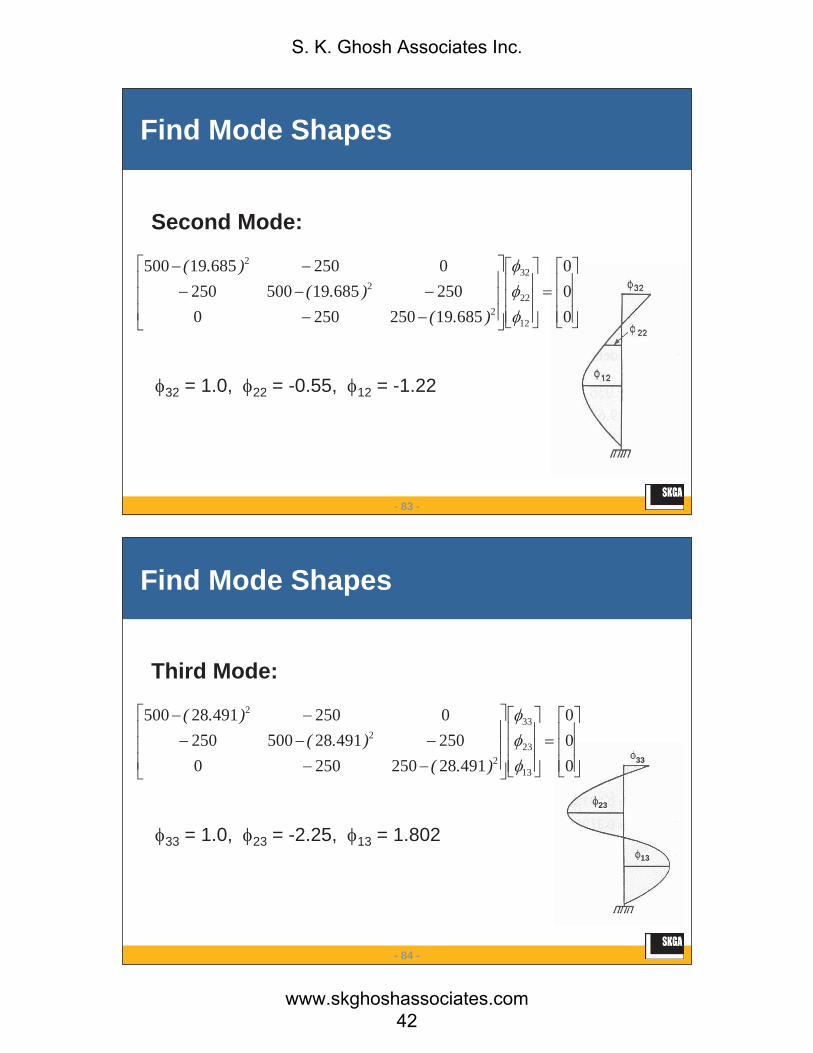
Find Mode Shapes
First Mode:
000
03672502500250036750025002500367500
11
21
31
2
2
2
).().(
).(
31 = 1.0, 21 = 0.802, 11 = 0.445
S. K. Ghosh Associates Inc.
www.skghoshassociates.com 41
- 83 -
Second Mode:
000
68519250250025068519500250025068519500
12
22
32
2
2
2
).().(
).(
32 = 1.0, 22 = -0.55, 12 = -1.22
Find Mode Shapes
- 84 -
33
23
13
Third Mode:
000
49128250250025049128500250025049128500
13
23
33
2
2
2
).().(
).(
33 = 1.0, 23 = -2.25, 13 = 1.802
Find Mode Shapes
S. K. Ghosh Associates Inc.
www.skghoshassociates.com 42
- 85 -
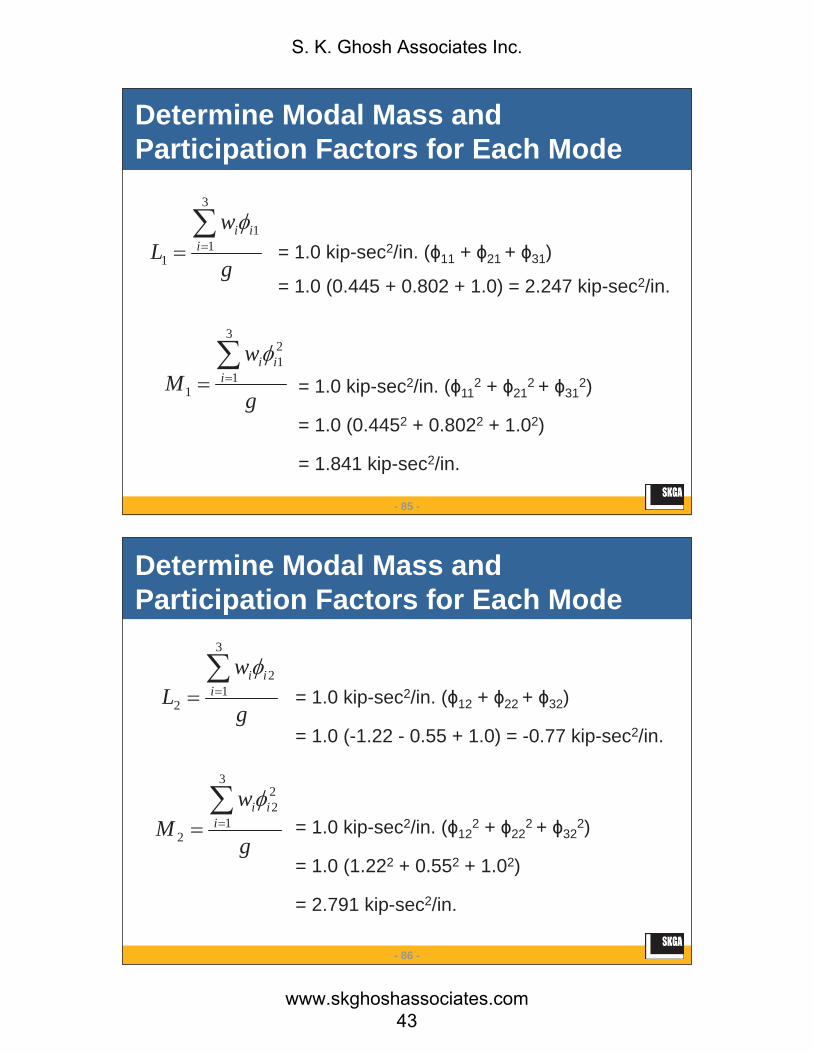
Determine Modal Mass and Participation Factors for Each Mode
= 1.0 kip-sec2/in. ( 11 + 21 + 31)
= 1.0 (0.445 + 0.802 + 1.0) = 2.247 kip-sec2/in.g
wL i
ii
3
11
1
= 1.0 kip-sec2/in. ( 112 + 21
2 + 312)
= 1.0 (0.4452 + 0.8022 + 1.02)
= 1.841 kip-sec2/in.
g
wM i
ii
3
1
21
1
- 86 -
= 1.0 kip-sec2/in. ( 12 + 22 + 32)
= 1.0 (-1.22 - 0.55 + 1.0) = -0.77 kip-sec2/in.g
wL i
ii
3
12
2
= 1.0 kip-sec2/in. ( 122 + 22
2 + 322)
= 1.0 (1.222 + 0.552 + 1.02)
= 2.791 kip-sec2/in.
g
wM i
ii
3
1
22
2
Determine Modal Mass and Participation Factors for Each Mode
S. K. Ghosh Associates Inc.
www.skghoshassociates.com 43
- 87 -
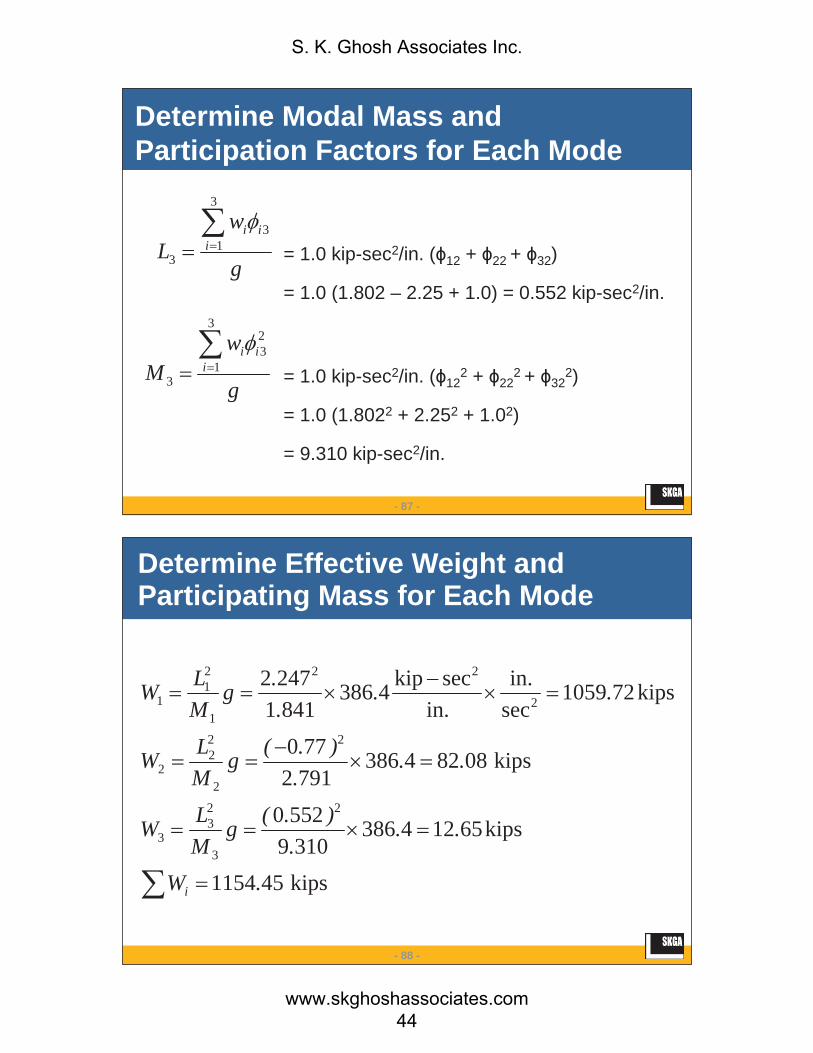
= 1.0 kip-sec2/in. ( 12 + 22 + 32)
= 1.0 (1.802 – 2.25 + 1.0) = 0.552 kip-sec2/in.g
wL i
ii
3
13
3
= 1.0 kip-sec2/in. ( 122 + 22
2 + 322)
= 1.0 (1.8022 + 2.252 + 1.02)
= 9.310 kip-sec2/in.
g
wM i
ii
3
1
23
3
Determine Modal Mass and Participation Factors for Each Mode
- 88 -
Determine Effective Weight and Participating Mass for Each Mode
kips451154
kips6512438631095520
kips088243867912770
kips721059secin.
in.seckip4386
84112472
2
3
23
3
2
2
22
2
2
22
1
21
1
.W
...
).(gMLW
...
).(gMLW
....g
MLW
i
S. K. Ghosh Associates Inc.
www.skghoshassociates.com 44
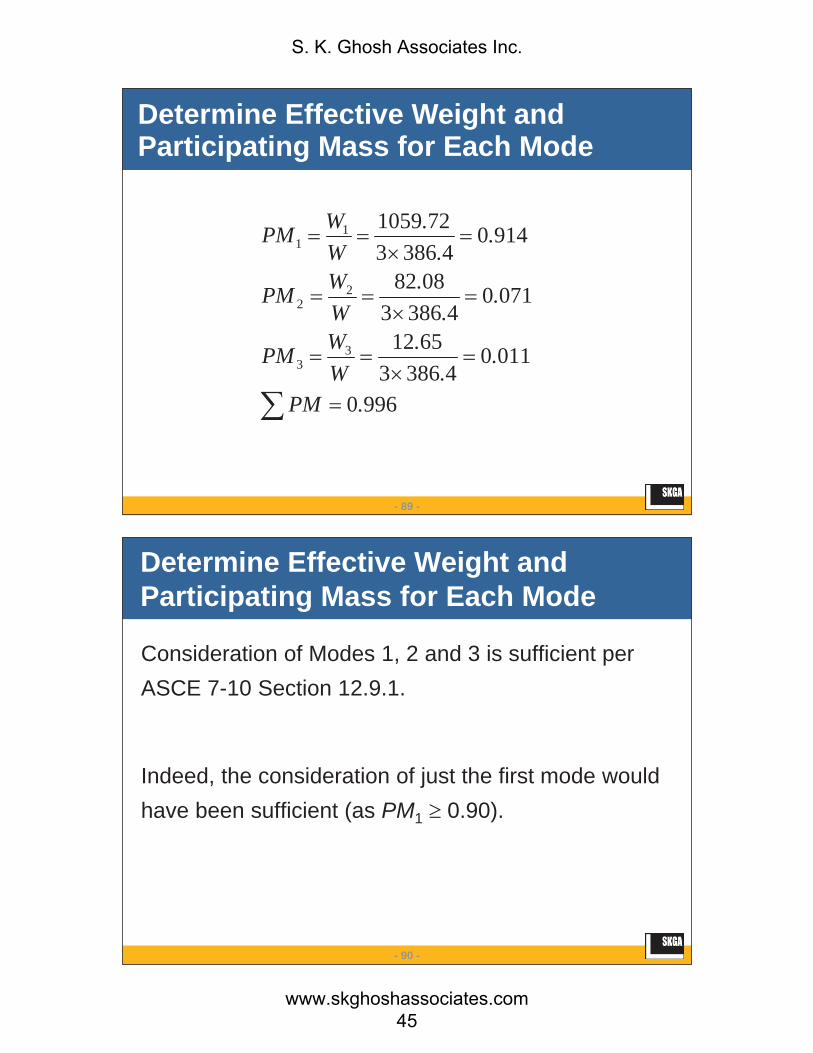
- 89 -
9960
011043863
6512
071043863
0882
914043863
721059
33
22
11
.PM
..
.WWPM
..
.WWPM
..
.WWPM
Determine Effective Weight and Participating Mass for Each Mode
- 90 -
Determine Effective Weight and Participating Mass for Each Mode
Consideration of Modes 1, 2 and 3 is sufficient per ASCE 7-10 Section 12.9.1.
Indeed, the consideration of just the first mode would have been sufficient (as PM1 0.90).
S. K. Ghosh Associates Inc.
www.skghoshassociates.com 45
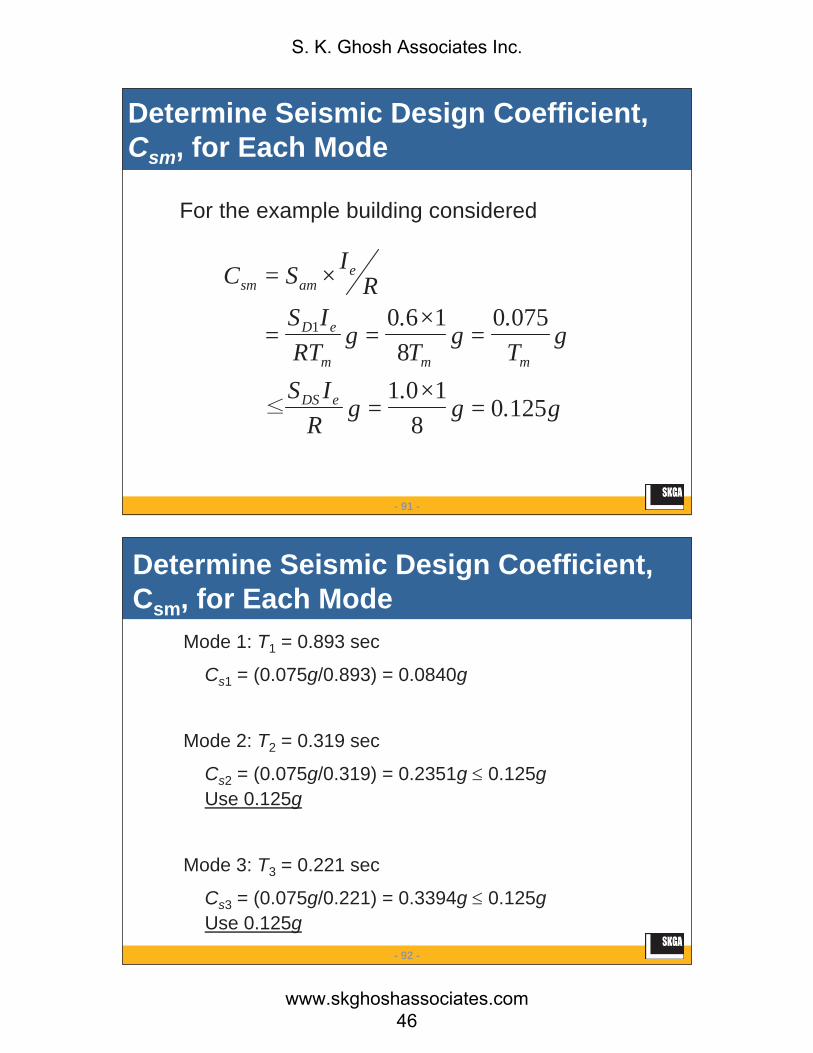
- 91 -
Determine Seismic Design Coefficient, Csm, for Each Mode
For the example building considered
g.g.
gR
IS
gT.
gT
.g
RTIS
RISC
eDS
mmm
eD
eamsm
1250=8
1×01=
0750=
81×60
==
×=
1
- 92 -
Determine Seismic Design Coefficient, Csm, for Each Mode
Mode 1: T1 = 0.893 sec
Cs1 = (0.075g/0.893) = 0.0840g
Mode 2: T2 = 0.319 sec
Cs2 = (0.075g/0.319) = 0.2351g 0.125gUse 0.125g
Mode 3: T3 = 0.221 sec
Cs3 = (0.075g/0.221) = 0.3394g 0.125gUse 0.125g
S. K. Ghosh Associates Inc.
www.skghoshassociates.com 46
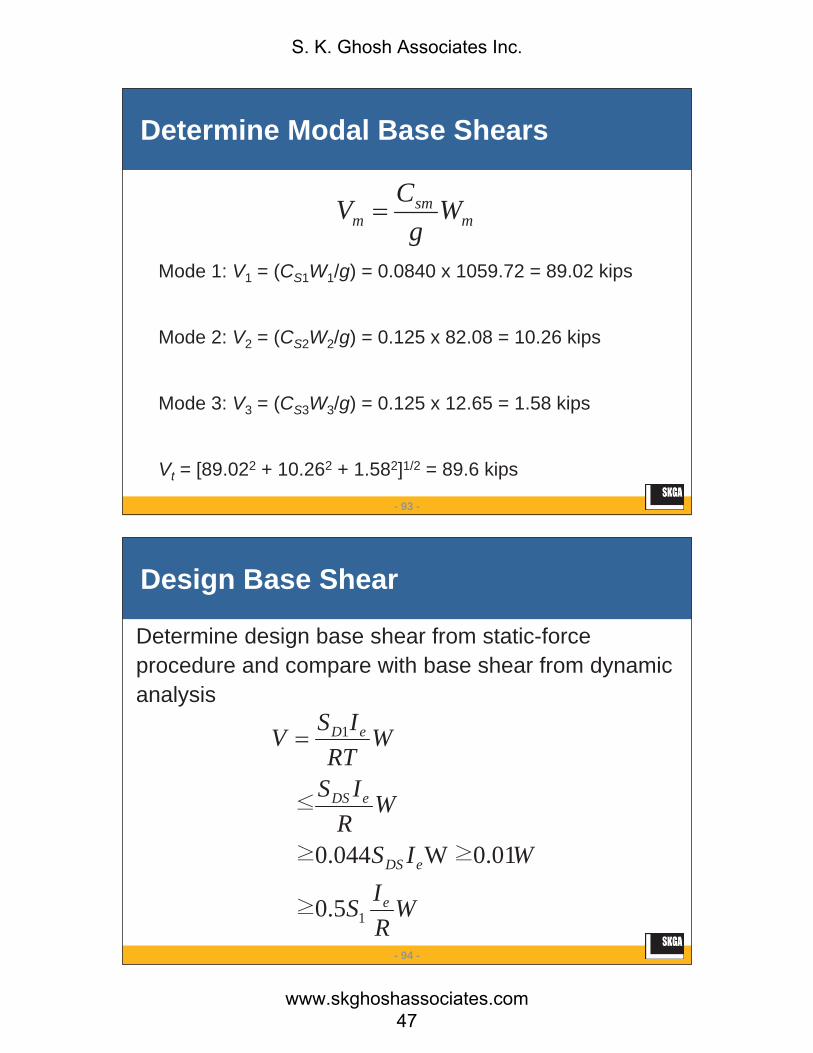
- 93 -
Determine Modal Base Shears
Mode 1: V1 = (CS1W1/g) = 0.0840 x 1059.72 = 89.02 kips
Mode 2: V2 = (CS2W2/g) = 0.125 x 82.08 = 10.26 kips
Mode 3: V3 = (CS3W3/g) = 0.125 x 12.65 = 1.58 kips
Vt = [89.022 + 10.262 + 1.582]1/2 = 89.6 kips
msm
m Wg
CV
- 94 -
Design Base Shear
Determine design base shear from static-force procedure and compare with base shear from dynamic analysis
WRIS
WIS
WR
IS
WRT
ISV
e
eDS
eDS
eD
1
1
5.0
01.0W0.044
S. K. Ghosh Associates Inc.
www.skghoshassociates.com 47

- 95 -
ASCE 7-10 Section 12.8.2.1Approximate Fundamental Period
Ta = Ct (hn)x
Ct = 0.016 (MRF system)
x = 0.9 (MRF systems)
hn = structural height = 30 ft
Ta = 0.016 x (30)0.9 = 0.342 sec
- 96 -
ASCE 7-10 Section 12.9.4Period of CuTa
T = CuTa = 1.4 x 0.342 = 0.479 sec < T1 = 0.893 sec
Vs = SD1I eW/(RT) = [0.60 x 1 / (8×0.479)]W = 0.157W
< SDSIeW / R = 1.0 × 1 × W / 8 = 0.125W governs
> 0.5S1IeW / R = 0.5x0.6x1xW =0.0375W
0.044SDSIeW = 0.044x1.0x1xW = 0.044W
Use V = 0.125 x 3 x 386.4 = 144.9 kips
S. K. Ghosh Associates Inc.
www.skghoshassociates.com 48
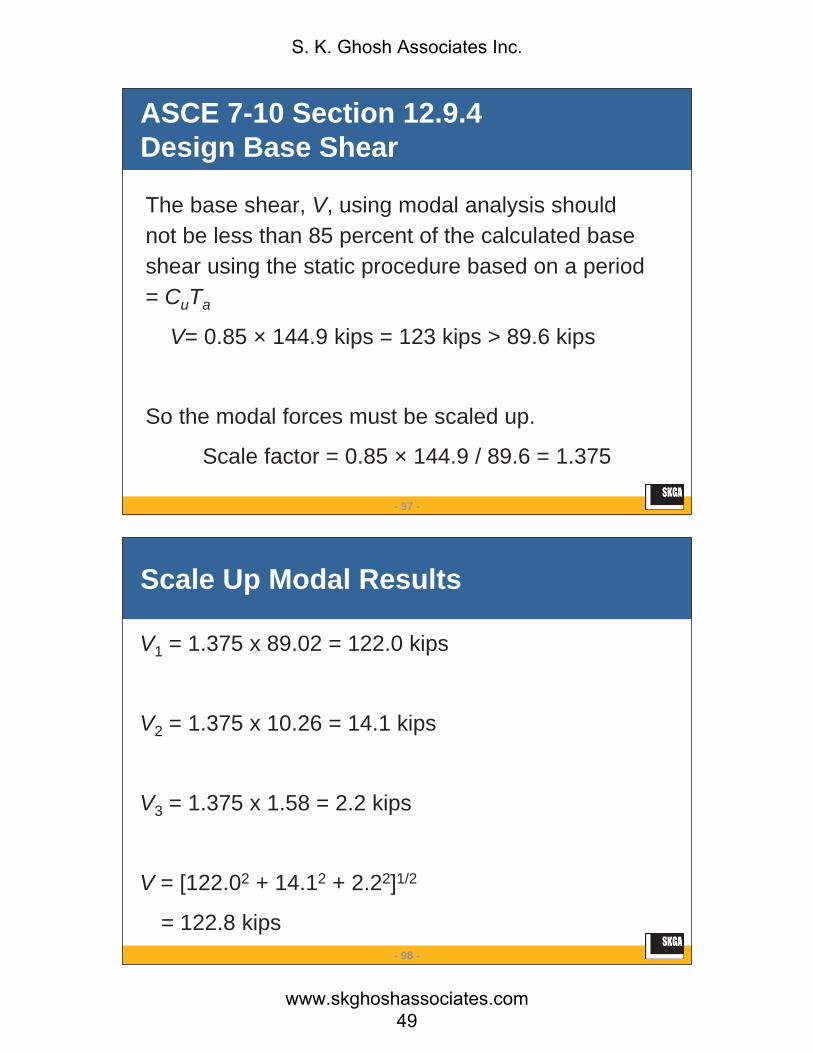
- 97 -
ASCE 7-10 Section 12.9.4 Design Base Shear
The base shear, V, using modal analysis should not be less than 85 percent of the calculated base shear using the static procedure based on a period = CuTa
V= 0.85 × 144.9 kips = 123 kips > 89.6 kips
So the modal forces must be scaled up.
Scale factor = 0.85 × 144.9 / 89.6 = 1.375
- 98 -
Scale Up Modal Results
V1 = 1.375 x 89.02 = 122.0 kips
V2 = 1.375 x 10.26 = 14.1 kips
V3 = 1.375 x 1.58 = 2.2 kips
V = [122.02 + 14.12 + 2.22]1/2
= 122.8 kips
S. K. Ghosh Associates Inc.
www.skghoshassociates.com 49

- 99 -
Distribute Base Shear for Each Mode over Height of Structure
Lateral force at level i for mode m
mimi
imiim V
wwF
- 100 -
Distribute Base Shear for Each Mode over Height of Structure
Level,i
Weight, wi
i1 wi i1 Fi1
3 386.4 1 386.4 54.3
2 386.4 0.802 309.9 43.5
1 386.4 0.445 171.9 24.2
= 868.2 122.0
Mode 1 V1 = 122.0 kips
S. K. Ghosh Associates Inc.
www.skghoshassociates.com 50
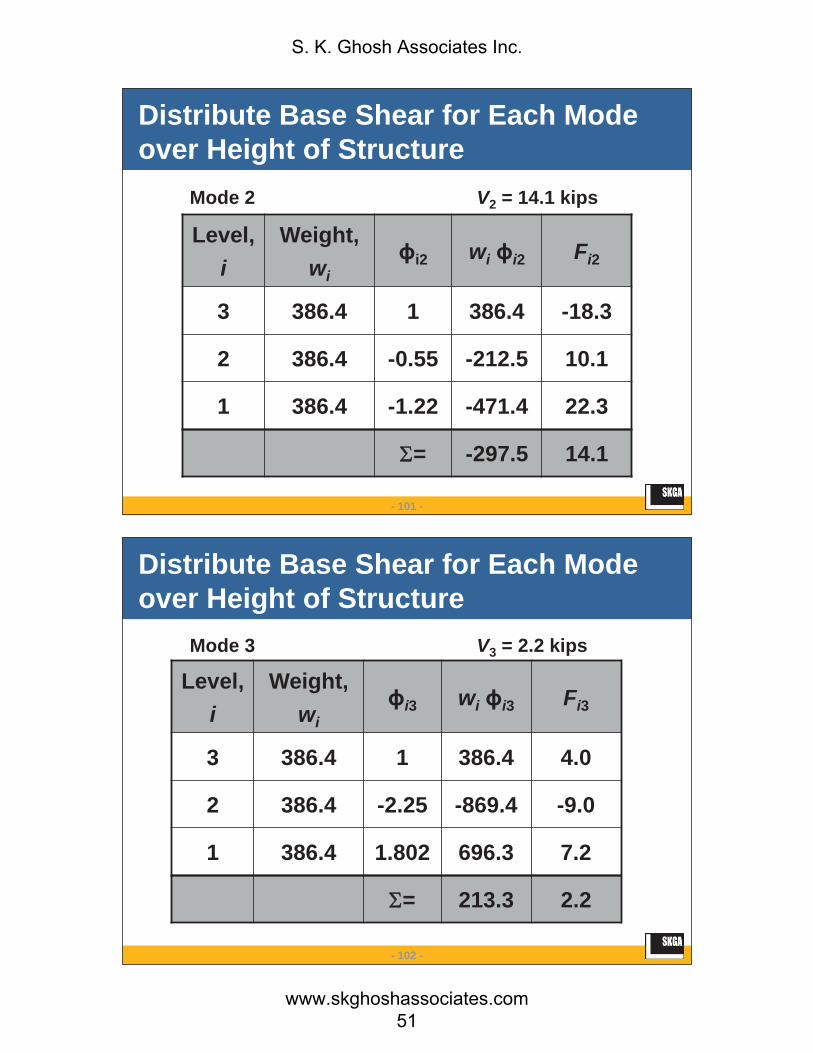
- 101 -
Level,i
Weight, wi
i2 wi i2 Fi2
3 386.4 1 386.4 -18.3
2 386.4 -0.55 -212.5 10.1
1 386.4 -1.22 -471.4 22.3
= -297.5 14.1
Mode 2 V2 = 14.1 kips
Distribute Base Shear for Each Mode over Height of Structure
- 102 -
Mode 3 V3 = 2.2 kips
Level,i
Weight, wi
i3 wi i3 Fi3
3 386.4 1 386.4 4.0
2 386.4 -2.25 -869.4 -9.0
1 386.4 1.802 696.3 7.2
= 213.3 2.2
Distribute Base Shear for Each Mode over Height of Structure
S. K. Ghosh Associates Inc.
www.skghoshassociates.com 51
- 103 -
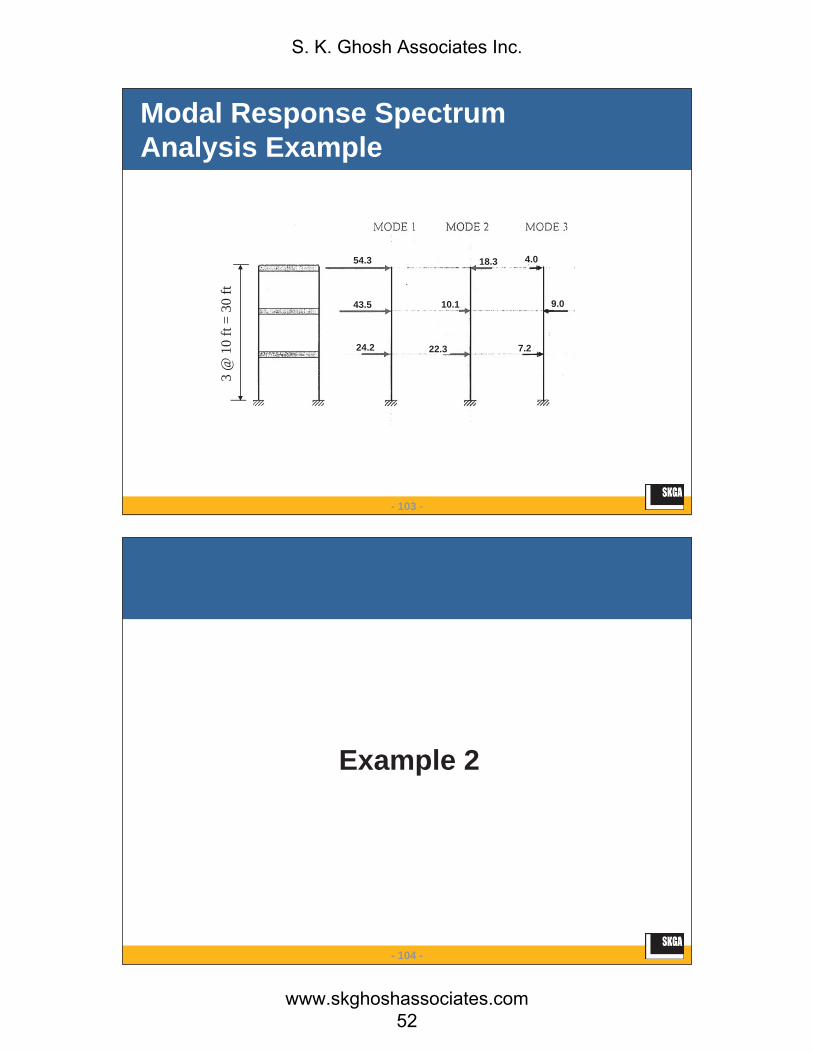
Modal Response Spectrum Analysis Example
3 @
10
ft =
30 ft
54.3
43.5
24.2
18.3
10.1
22.3
4.0
9.0
7.2
- 104 -
Example 2
S. K. Ghosh Associates Inc.
www.skghoshassociates.com 52
- 105 -
General
A 20-story reinforced concrete building is designed following the requirements of the 2012, 2015 International Building Codes (IBC) and ASCE 7-10.
Building is located on Site Class D.
- 106 -
The modal response spectrum analysis procedure is used as the basis of design.
Comparison with design forces given by the equivalent lateral force procedure is also shown.
General
S. K. Ghosh Associates Inc.
www.skghoshassociates.com 53
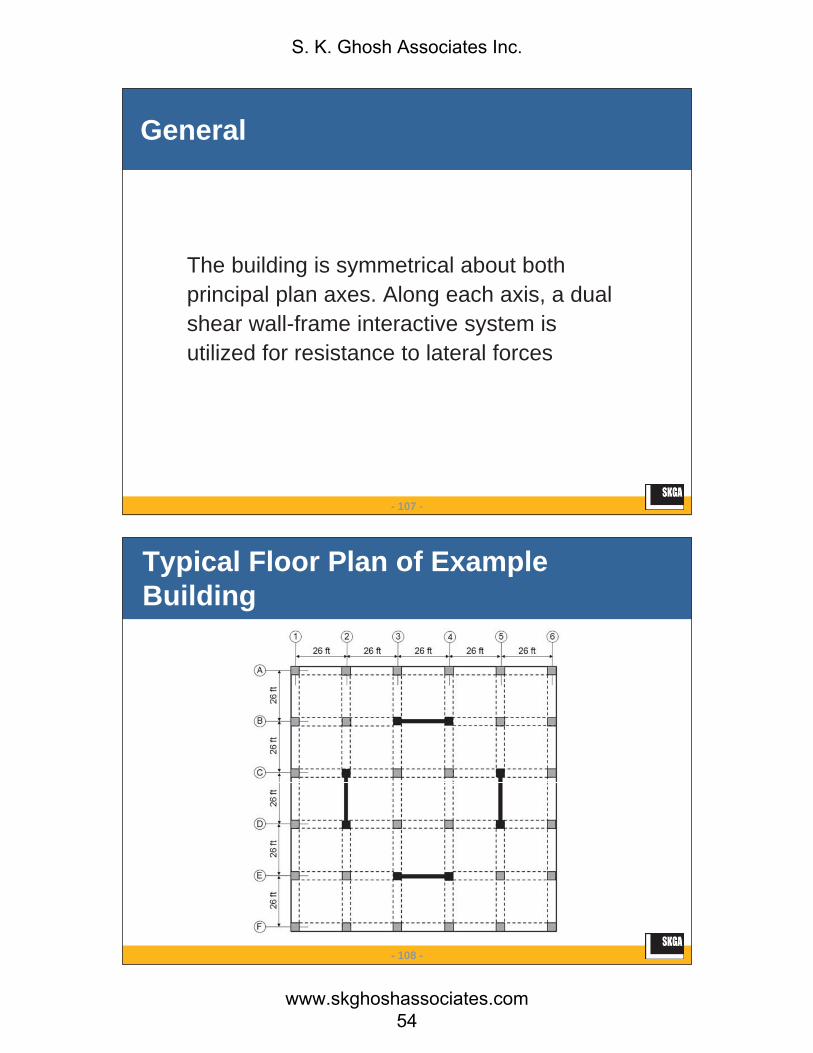
- 107 -
The building is symmetrical about both principal plan axes. Along each axis, a dual shear wall-frame interactive system is utilized for resistance to lateral forces
General
- 108 -
Typical Floor Plan of Example Building
S. K. Ghosh Associates Inc.
www.skghoshassociates.com 54

- 109 -
Elevation of Example Building
- 110 -
Design Criteria
Beams 34 in. x 24 in.
(width = 34 in.)
Interior Columns 40 in. x 40 in.
Exterior Columns 34 in. x 34 in.
S. K. Ghosh Associates Inc.
www.skghoshassociates.com 55
- 111 -
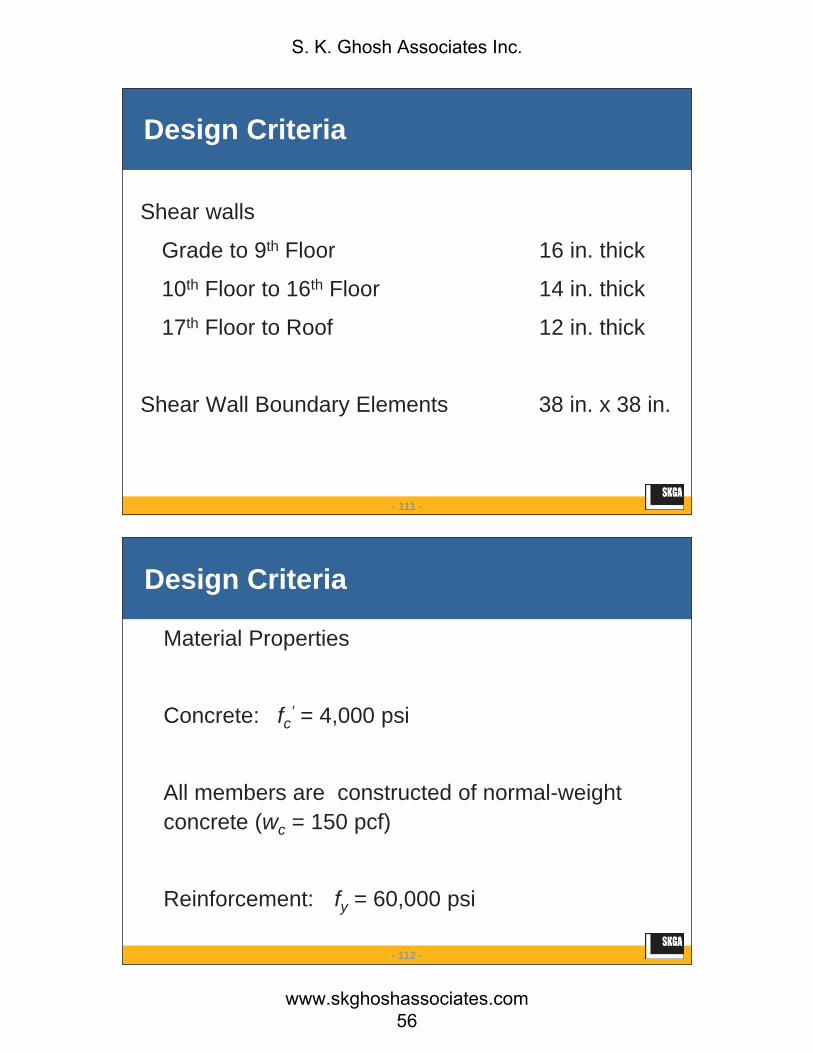
Design Criteria
Shear walls
Grade to 9th Floor 16 in. thick
10th Floor to 16th Floor 14 in. thick
17th Floor to Roof 12 in. thick
Shear Wall Boundary Elements 38 in. x 38 in.
- 112 -
Design Criteria
Material Properties
Concrete: fc’ = 4,000 psi
All members are constructed of normal-weight concrete (wc = 150 pcf)
Reinforcement: fy = 60,000 psi
S. K. Ghosh Associates Inc.
www.skghoshassociates.com 56
- 113 -
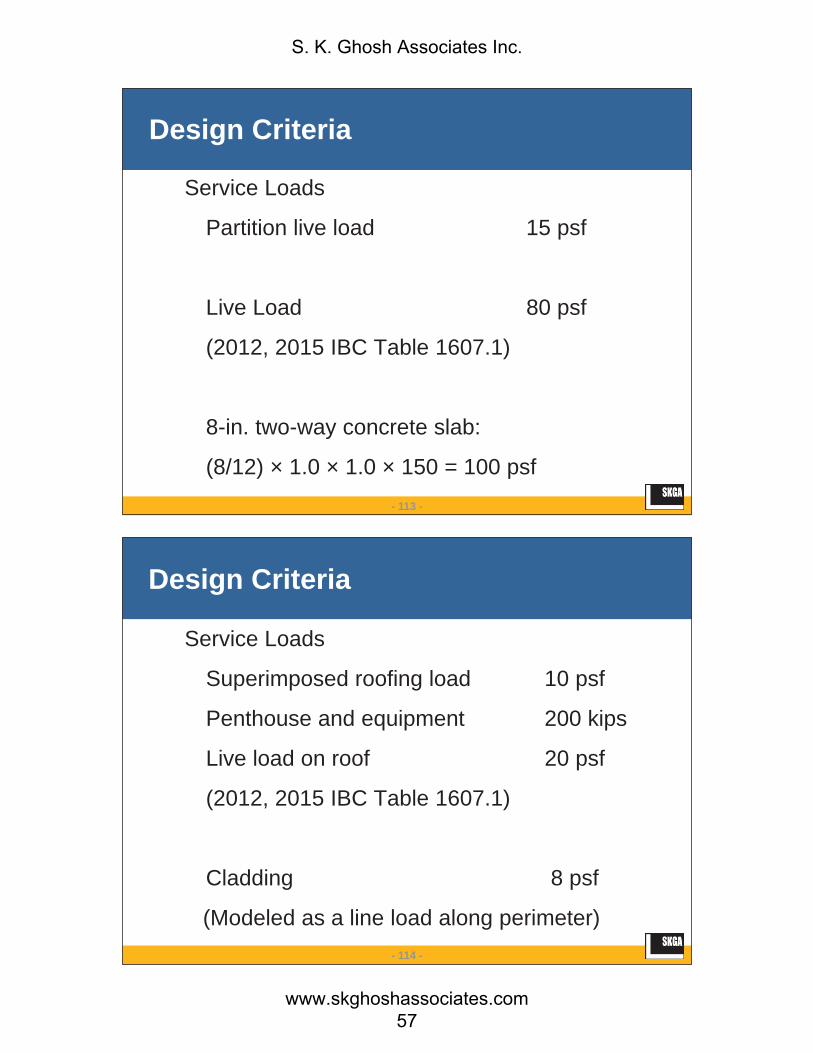
Design Criteria
Service Loads
Partition live load 15 psf
Live Load 80 psf
(2012, 2015 IBC Table 1607.1)
8-in. two-way concrete slab:
(8/12) × 1.0 × 1.0 × 150 = 100 psf
- 114 -
Design Criteria
Service Loads
Superimposed roofing load 10 psf
Penthouse and equipment 200 kips
Live load on roof 20 psf
(2012, 2015 IBC Table 1607.1)
Cladding 8 psf
(Modeled as a line load along perimeter)
S. K. Ghosh Associates Inc.
www.skghoshassociates.com 57

- 115 -
Seismic Design Data
It is assumed that, at the site of the structure,
Ss = 1.5g and S1 = 0.6g
Assume Risk Category II (2012, 2015 IBC Table 1604.5)
Seismic Importance Factor, Ie =1.0
(ASCE 7-10 Table 1.5-2)
Use Default Site Class D
- 116 -
Seismic Design Data
Site coefficient Fa = 1.0
(2012, 2015 IBC Table 1613.3.3(1) — ASCE 7-10 Table 11.4-1)
Site coefficient Fv = 1.5
(2012, 2015 IBC Table 1613.3.3(2) — ASCE 7-10 Table 11.4-2)
Soil modified SMS = FaSs = 1.0 x 1.5g = 1.5g
(2012, 2015 IBC Eq. 16-37 — ASCE 7-10 Table 11.4-1)
Soil modified SM1 = FvS1 = 1.5 x 0.6g = 0.9g
(2012, 2015 IBC Eq.16-38 — ASCE 7-10 Table 11.4-2)
S. K. Ghosh Associates Inc.
www.skghoshassociates.com 58
- 117 -
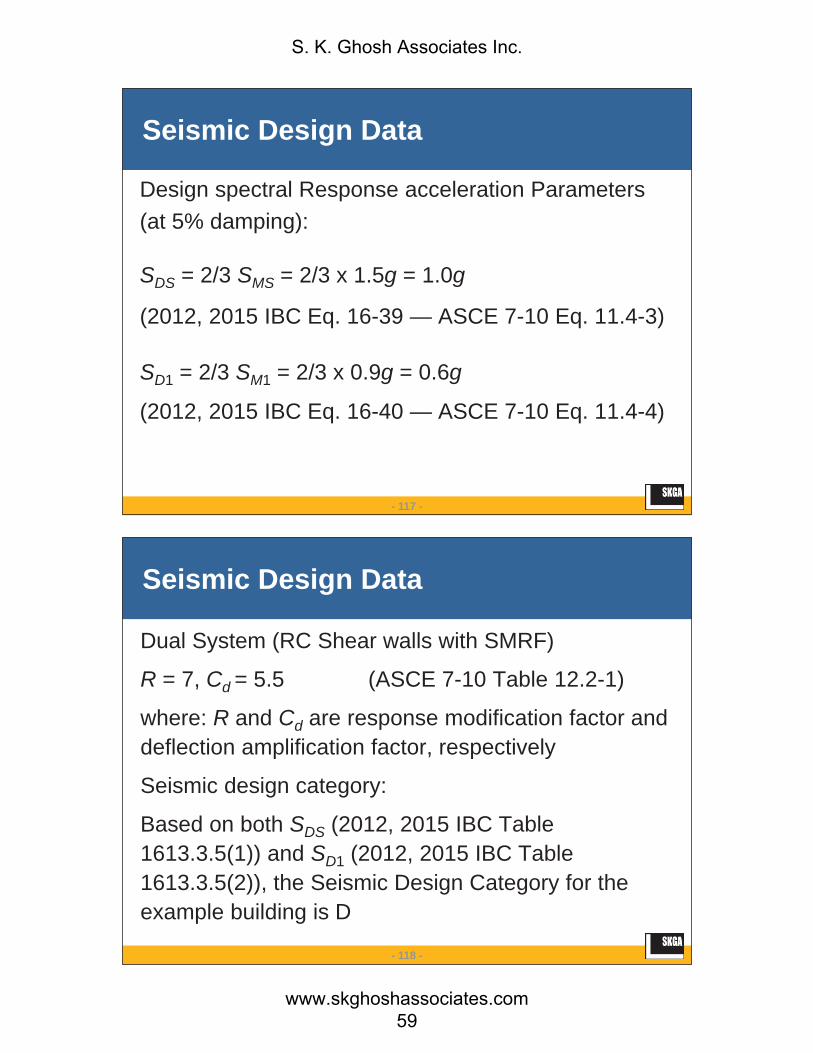
Seismic Design Data
Design spectral Response acceleration Parameters (at 5% damping):
SDS = 2/3 SMS = 2/3 x 1.5g = 1.0g
(2012, 2015 IBC Eq. 16-39 — ASCE 7-10 Eq. 11.4-3)
SD1 = 2/3 SM1 = 2/3 x 0.9g = 0.6g
(2012, 2015 IBC Eq. 16-40 — ASCE 7-10 Eq. 11.4-4)
- 118 -
Seismic Design Data
Dual System (RC Shear walls with SMRF)
R = 7, Cd = 5.5 (ASCE 7-10 Table 12.2-1)
where: R and Cd are response modification factor and deflection amplification factor, respectively
Seismic design category:
Based on both SDS (2012, 2015 IBC Table 1613.3.5(1)) and SD1 (2012, 2015 IBC Table 1613.3.5(2)), the Seismic Design Category for the example building is D
S. K. Ghosh Associates Inc.
www.skghoshassociates.com 59

- 119 -
Weights on each floor
Floors:
2nd – 20th floors: 100×132.82 / 1000 = 1764 kips
Roof: (100+10)×132.82 / 1000 + 200 = 2140 kips
Beams (portion below floor slab):
150×22.8×(34/12)×[(24-8)/12]×56 / 1000 = 724 kips
- 120 -
Weights on each floor
Cladding:
2nd floor: 8×15×130×4 / 1000 = 62 kips
3rd – 20th floors: 8×12.5×130×4 / 1000 = 52 kips
Roof: 8×6.25×130×4 / 1000 = 26 kips
Exterior Columns:
2nd floor: 150×15×(34/12)2×20 / 1000 = 361 kips
3rd – 20th floors: 150×12.5×(34/12)2×20 / 1000 = 301 kips
Roof: 150×6.25×(34/12)2×20 / 1000 = 151 kips
S. K. Ghosh Associates Inc.
www.skghoshassociates.com 60
- 121 -
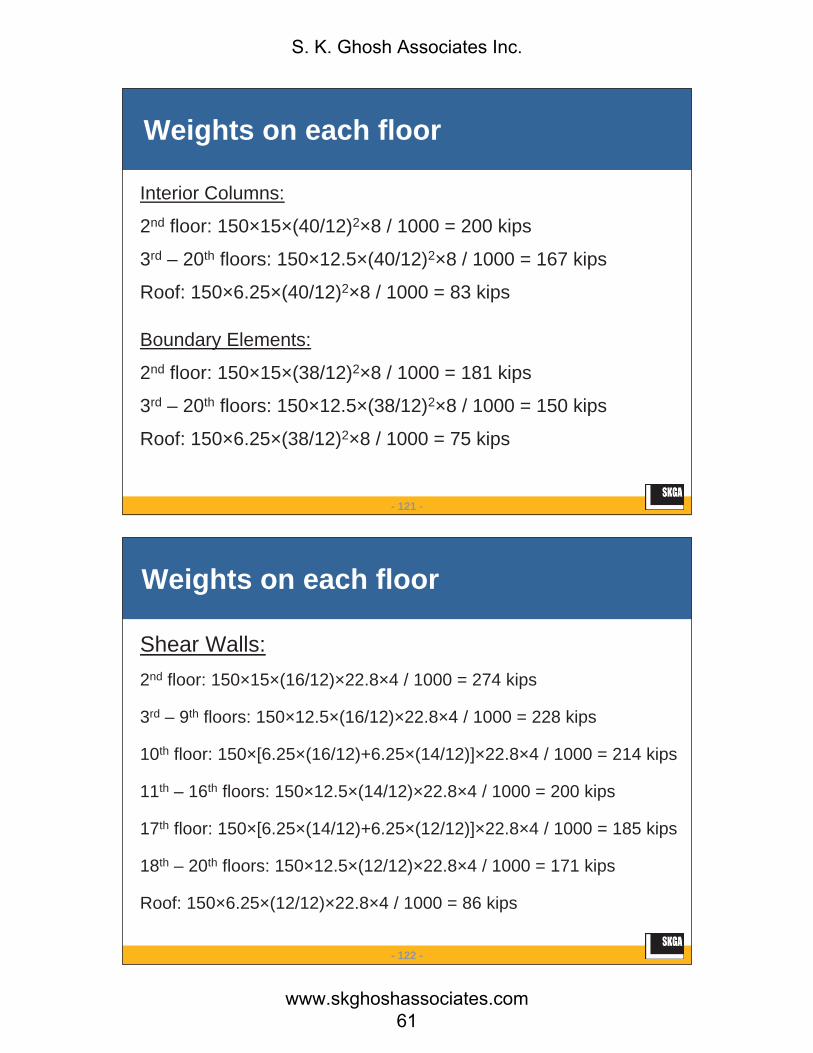
Weights on each floor
Interior Columns:
2nd floor: 150×15×(40/12)2×8 / 1000 = 200 kips
3rd – 20th floors: 150×12.5×(40/12)2×8 / 1000 = 167 kips
Roof: 150×6.25×(40/12)2×8 / 1000 = 83 kips
Boundary Elements:
2nd floor: 150×15×(38/12)2×8 / 1000 = 181 kips
3rd – 20th floors: 150×12.5×(38/12)2×8 / 1000 = 150 kips
Roof: 150×6.25×(38/12)2×8 / 1000 = 75 kips
- 122 -
Weights on each floor
Shear Walls:2nd floor: 150×15×(16/12)×22.8×4 / 1000 = 274 kips
3rd – 9th floors: 150×12.5×(16/12)×22.8×4 / 1000 = 228 kips
10th floor: 150×[6.25×(16/12)+6.25×(14/12)]×22.8×4 / 1000 = 214 kips
11th – 16th floors: 150×12.5×(14/12)×22.8×4 / 1000 = 200 kips
17th floor: 150×[6.25×(14/12)+6.25×(12/12)]×22.8×4 / 1000 = 185 kips
18th – 20th floors: 150×12.5×(12/12)×22.8×4 / 1000 = 171 kips
Roof: 150×6.25×(12/12)×22.8×4 / 1000 = 86 kips
S. K. Ghosh Associates Inc.
www.skghoshassociates.com 61

- 123 -
Weights on each floor
Total:2nd floor: 1764+724+62+361+200+181+274 = 3566 kips
3rd – 9th floors: 1764+724+52+301+167+150+228 = 3386 kips
10th floor: 1764+724+52+301+167+150+214 = 3372 kips
11th – 16th floors: 1764+724+52+301+167+150+200 = 3358 kips
17th floor: 1764+724+52+301+167+150+185 = 3343 kips
18th – 20th floors: 1764+724+52+301+167+150+171 = 3329 kips
Roof: 1764+724+26+151+83+75+86 = 3285 kips
Total weight of the building: W = Wi = 67,329 kips
- 124 -
Gravity Load Analysis
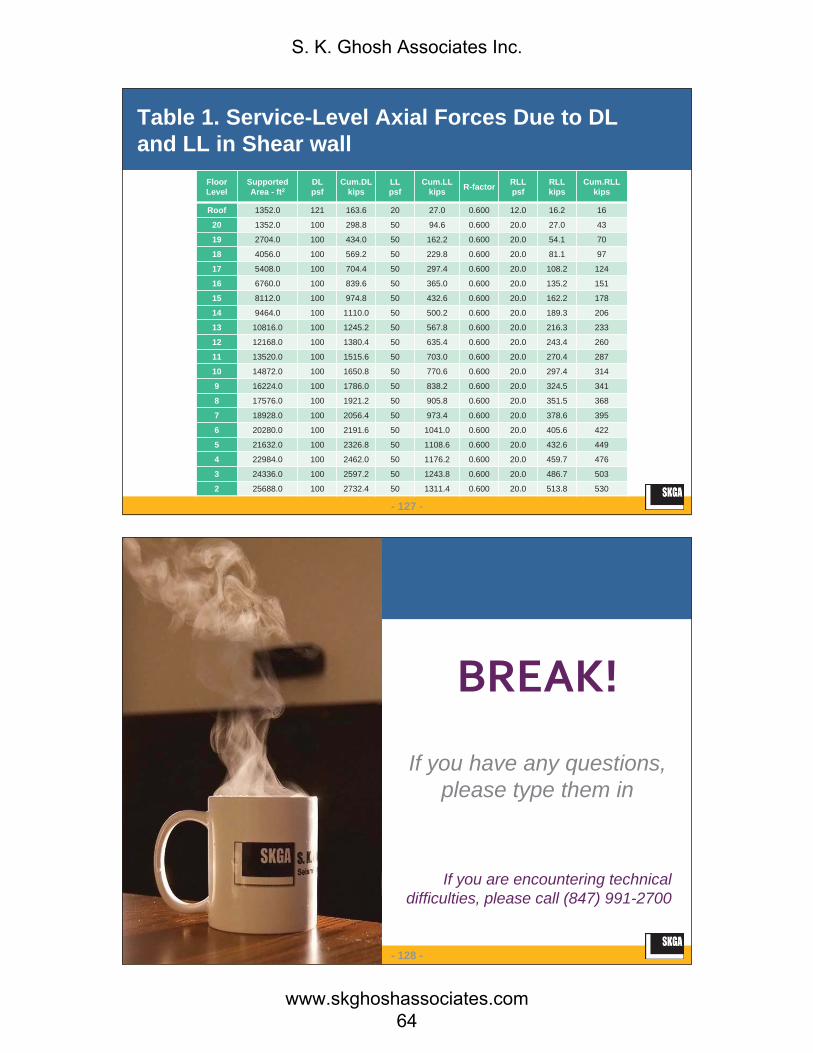
The service-level axial forces for each shear wall due to dead and live loads are given in Table 1.
Live load reduction factors were used as follows:
Floors (2012, 2015 IBC Section 1607.10.2):
R = 0.08 (A - 150)%
60% (for vertical members)
23.1 (1 + D/L0)% (D is calculated based on floor weight only)
S. K. Ghosh Associates Inc.
www.skghoshassociates.com 62
- 125 -
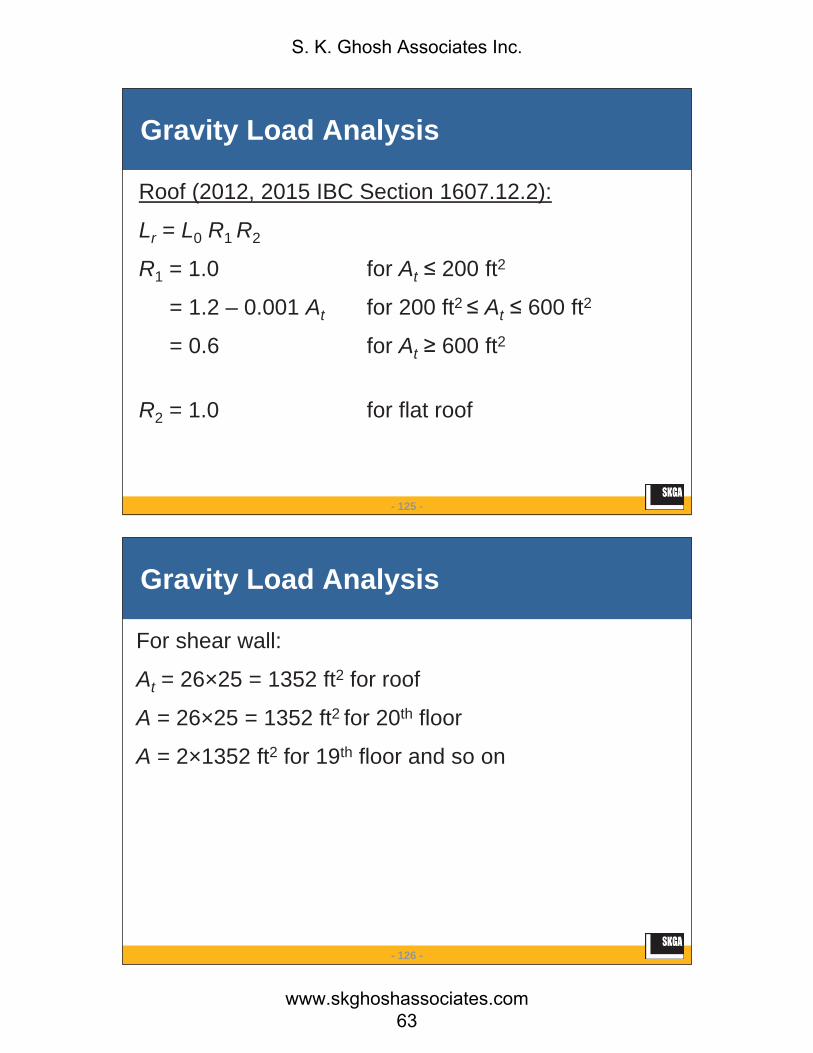
Gravity Load Analysis
Roof (2012, 2015 IBC Section 1607.12.2):
Lr = L0 R1 R2
R1 = 1.0 for At 200 ft2
= 1.2 – 0.001 At for 200 ft2 At 600 ft2
= 0.6 for At 600 ft2
R2 = 1.0 for flat roof
- 126 -
Gravity Load Analysis
For shear wall:
At = 26×25 = 1352 ft2 for roof
A = 26×25 = 1352 ft2 for 20th floor
A = 2×1352 ft2 for 19th floor and so on
S. K. Ghosh Associates Inc.
www.skghoshassociates.com 63
- 127 -
Table 1. Service-Level Axial Forces Due to DL and LL in Shear wall
FloorLevel
SupportedArea - ft2
DLpsf
Cum.DLkips
LLpsf
Cum.LLkips R-factor RLL
psfRLLkips
Cum.RLLkips
Roof 1352.0 121 163.6 20 27.0 0.600 12.0 16.2 16
20 1352.0 100 298.8 50 94.6 0.600 20.0 27.0 43
19 2704.0 100 434.0 50 162.2 0.600 20.0 54.1 70
18 4056.0 100 569.2 50 229.8 0.600 20.0 81.1 97
17 5408.0 100 704.4 50 297.4 0.600 20.0 108.2 124
16 6760.0 100 839.6 50 365.0 0.600 20.0 135.2 151
15 8112.0 100 974.8 50 432.6 0.600 20.0 162.2 178
14 9464.0 100 1110.0 50 500.2 0.600 20.0 189.3 206
13 10816.0 100 1245.2 50 567.8 0.600 20.0 216.3 233
12 12168.0 100 1380.4 50 635.4 0.600 20.0 243.4 260
11 13520.0 100 1515.6 50 703.0 0.600 20.0 270.4 287
10 14872.0 100 1650.8 50 770.6 0.600 20.0 297.4 314
9 16224.0 100 1786.0 50 838.2 0.600 20.0 324.5 341
8 17576.0 100 1921.2 50 905.8 0.600 20.0 351.5 368
7 18928.0 100 2056.4 50 973.4 0.600 20.0 378.6 395
6 20280.0 100 2191.6 50 1041.0 0.600 20.0 405.6 422
5 21632.0 100 2326.8 50 1108.6 0.600 20.0 432.6 449
4 22984.0 100 2462.0 50 1176.2 0.600 20.0 459.7 476
3 24336.0 100 2597.2 50 1243.8 0.600 20.0 486.7 503
2 25688.0 100 2732.4 50 1311.4 0.600 20.0 513.8 530
- 128 -
BREAK!
If you are encountering technical difficulties, please call (847) 991-2700
If you have any questions, please type them in
S. K. Ghosh Associates Inc.
www.skghoshassociates.com 64

- 129 -
Question andAnswer Session
If you are encountering technical difficulties, please call (847) 991-2700
If you have any questions, please type them in
- 130 -
Seismic Analysis Procedure Selection
In this example, the equivalent lateral force procedure (ASCE 7-10 Section 12.8) can be used as T < 3.5Ts and it is a regular structure assigned to SDC D.
However, modal response spectrum analysis of ASCE 7-10 Section 12.9 will be illustrated.
S. K. Ghosh Associates Inc.
www.skghoshassociates.com 65

- 131 -
Base Shear Using Equivalent Lateral Force Procedure (ASCE 7-10 Section 12.8)
WRT
TIS LeD2
1
ASCE 7-10 Eq. 12.8-1 and12.8-2WR
ISV eDS
ASCE 7-10 Eq. 12.8-4, for T TL
W.WIS. eDS 0100440 ASCE 7-10 Eq. 12.8-5
WR
IS. e150ASCE 7-10 Eq. 12.8-6, for S1 0.6g
- 132 -
Approximate Period(ASCE 7-10 Section 12.8.2.1)Ta = Ct (hn)x (ASCE 7-10 Eq. 12.8-7)
Ct = 0.02 for dual system
x = 0.75 for a dual system
hn = total height = 255 ft
Ta = 0.02 x (255)0.75 = 1.28 sec
S. K. Ghosh Associates Inc.
www.skghoshassociates.com 66
- 133 -
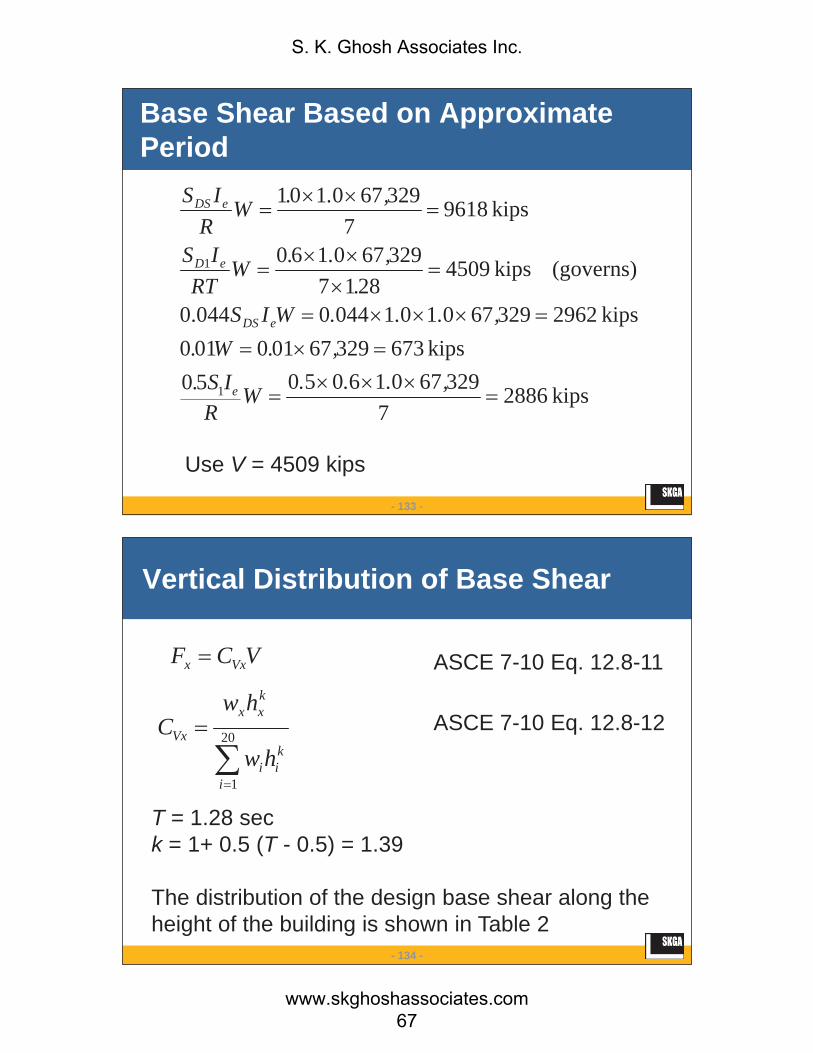
Base Shear Based on Approximate Period
kips28867
3296701605050kips67332967010010
kips296232967010104400.044
(governs)kips45092817
329670160
kips96187
329670101
1
1
,...WR
IS.,.W.
,...WIS.
,..WRT
IS
,..WR
IS
e
eDS
eD
eDS
Use V = 4509 kips
- 134 -
Vertical Distribution of Base Shear
20
1i
kii
kxx
Vx
hw
hwC
T = 1.28 seck = 1+ 0.5 (T - 0.5) = 1.39
The distribution of the design base shear along the height of the building is shown in Table 2
VCF Vxx ASCE 7-10 Eq. 12.8-11
ASCE 7-10 Eq. 12.8-12
S. K. Ghosh Associates Inc.
www.skghoshassociates.com 67

- 135 -
Table 2. Lateral Forces by Equivalent Lateral Force Procedure
V = 4509 kips T (sec.) = 1.28 k = 1.39
Floor Levelx
Weightwx, kips
Heighthx, ft
wxhxk, ft-kips Lateral Force
Fx, kipsStory Shear
Vx, kips
Roof 3285 255.0 7,271,537 490 49020 3329 242.5 6,871,683 463 95419 3329 230.0 6,384,332 431 138418 3329 217.5 5,907,207 398 178317 3343 205.0 5,463,541 368 215116 3358 192.5 5,028,511 339 249015 3358 180.0 4,580,464 309 279914 3358 167.5 4,144,396 279 307813 3358 155.0 3,720,846 251 332912 3358 142.5 3,310,422 223 355311 3358 130.0 2,913,815 196 374910 3372 117.5 2,542,378 171 39209 3312 105.0 2,135,716 144 40658 3386 92.5 1,830,729 123 41887 3386 80.0 1,496,174 101 42896 3386 67.5 1,181,460 80 43695 3386 55.0 888,773 60 44284 3386 42.5 621,080 42 44703 3386 30.0 382,724 26 44962 3566 17.5 190,548 13 4509
67,329 66,866,338 4509
- 136 -
Lateral AnalysisUsing ETABS computer program, a three-dimensional analysis of the structure was performed under the lateral forces shown in Table 2.
Rigid diaphragm at each level.
Rigid offsets at both ends of each beam.
Accidental torsion (ASCE 7-10 Section 12.8.4.2) accounted for by displacing the center of mass by a distance of 5% of the building dimension perpendicular to the force direction.
S. K. Ghosh Associates Inc.
www.skghoshassociates.com 68
- 137 -
Lateral Analysis
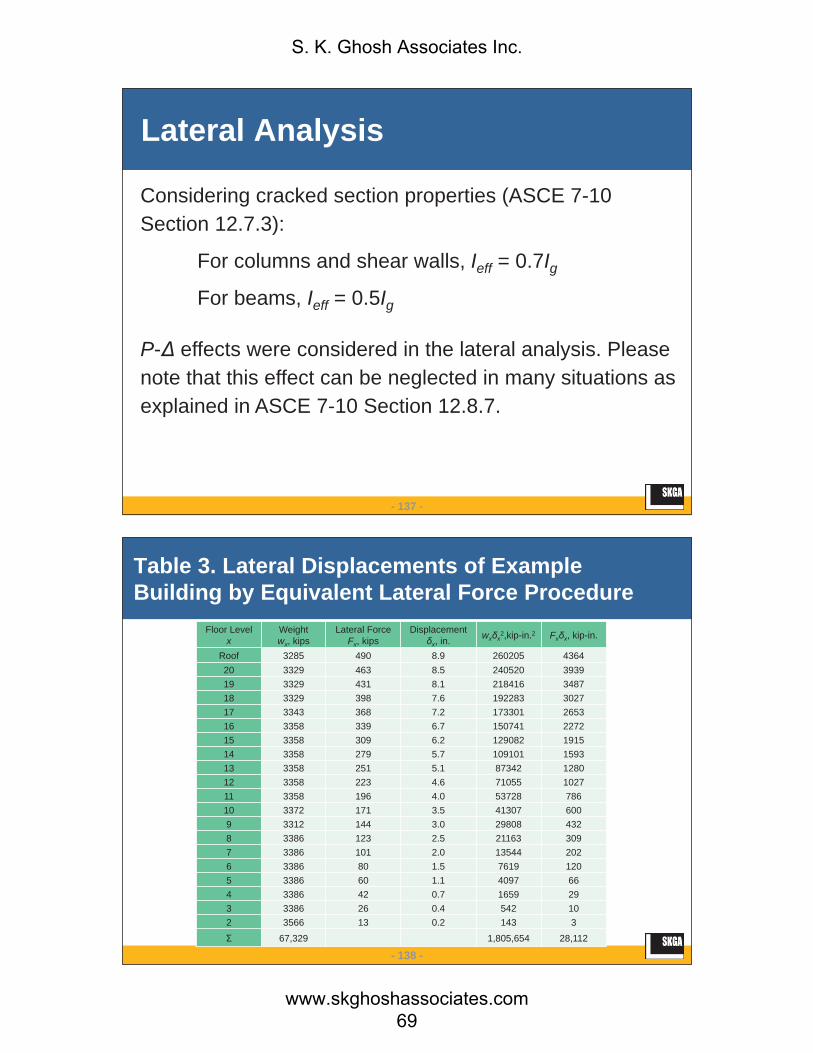
Considering cracked section properties (ASCE 7-10 Section 12.7.3):
For columns and shear walls, Ieff = 0.7IgFor beams, Ieff = 0.5Ig
P- effects were considered in the lateral analysis. Please note that this effect can be neglected in many situations as explained in ASCE 7-10 Section 12.8.7.
- 138 -
Table 3. Lateral Displacements of Example Building by Equivalent Lateral Force Procedure
Floor Levelx
Weightwx, kips
Lateral ForceFx, kips
Displacementx, in. wx x
2,kip-in.2 Fx x, kip-in.
Roof 3285 490 8.9 260205 436420 3329 463 8.5 240520 393919 3329 431 8.1 218416 348718 3329 398 7.6 192283 302717 3343 368 7.2 173301 265316 3358 339 6.7 150741 227215 3358 309 6.2 129082 191514 3358 279 5.7 109101 159313 3358 251 5.1 87342 128012 3358 223 4.6 71055 102711 3358 196 4.0 53728 78610 3372 171 3.5 41307 6009 3312 144 3.0 29808 4328 3386 123 2.5 21163 3097 3386 101 2.0 13544 2026 3386 80 1.5 7619 1205 3386 60 1.1 4097 664 3386 42 0.7 1659 293 3386 26 0.4 542 102 3566 13 0.2 143 3
67,329 1,805,654 28,112
S. K. Ghosh Associates Inc.
www.skghoshassociates.com 69
- 139 -
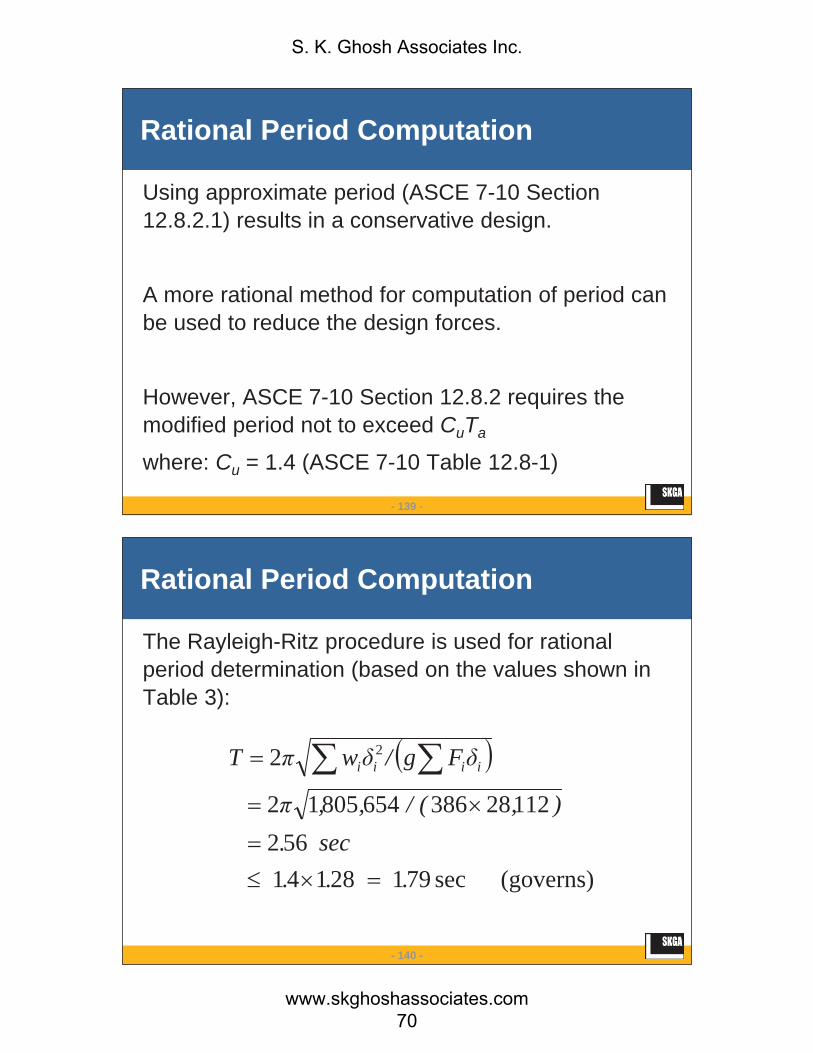
Using approximate period (ASCE 7-10 Section 12.8.2.1) results in a conservative design.
A more rational method for computation of period can be used to reduce the design forces.
However, ASCE 7-10 Section 12.8.2 requires the modified period not to exceed CuTa
where: Cu = 1.4 (ASCE 7-10 Table 12.8-1)
Rational Period Computation
- 140 -
The Rayleigh-Ritz procedure is used for rational period determination (based on the values shown in Table 3):
Rational Period Computation
(governs)sec79128141562
1122838665480512
2 2
...sec.
),( / ,,
Fg/wT iiii
S. K. Ghosh Associates Inc.
www.skghoshassociates.com 70
- 141 -
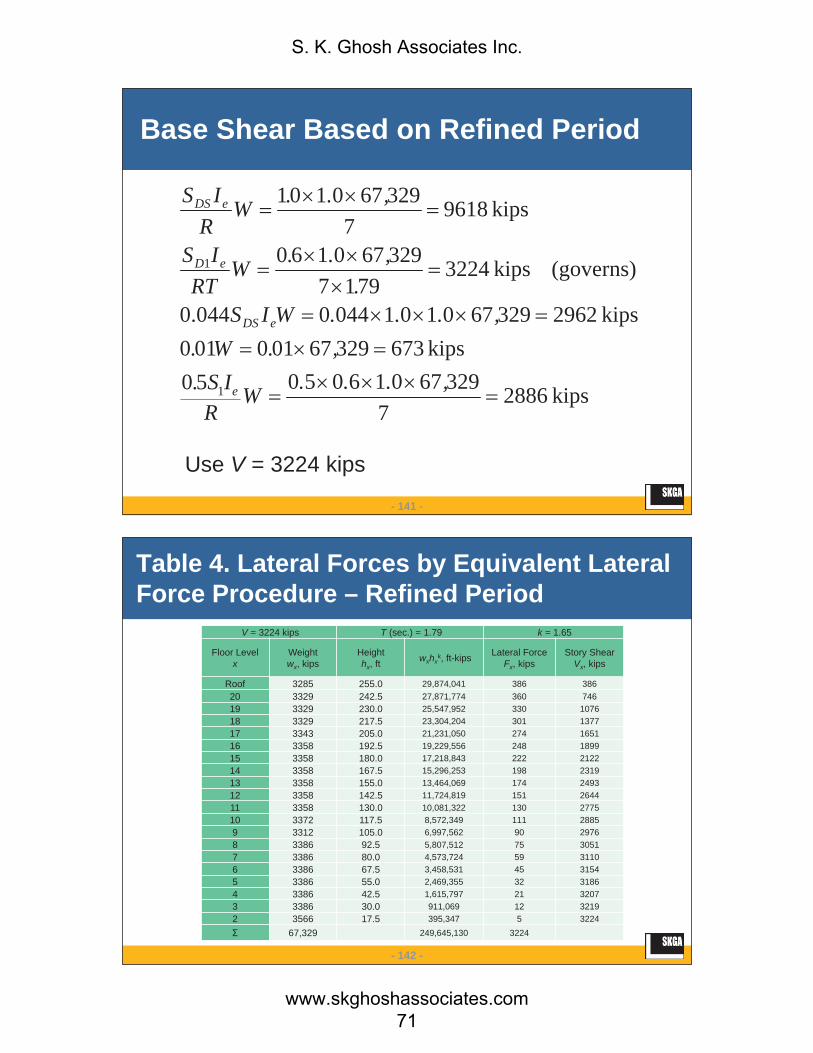
Base Shear Based on Refined Period
kips28867
3296701605050kips67332967010010
kips296232967010104400.044
(governs)kips32247917
329670160
kips96187
329670101
1
1
,...WR
IS.,.W.
,...WIS.
,..WRT
IS
,..WR
IS
e
eDS
eD
eDS
Use V = 3224 kips
- 142 -
Table 4. Lateral Forces by Equivalent Lateral Force Procedure – Refined Period
V = 3224 kips T (sec.) = 1.79 k = 1.65
Floor Levelx
Weightwx, kips
Heighthx, ft
wxhxk, ft-kips Lateral Force
Fx, kipsStory Shear
Vx, kips
Roof 3285 255.0 29,874,041 386 38620 3329 242.5 27,871,774 360 74619 3329 230.0 25,547,952 330 107618 3329 217.5 23,304,204 301 137717 3343 205.0 21,231,050 274 165116 3358 192.5 19,229,556 248 189915 3358 180.0 17,218,843 222 212214 3358 167.5 15,296,253 198 231913 3358 155.0 13,464,069 174 249312 3358 142.5 11,724,819 151 264411 3358 130.0 10,081,322 130 277510 3372 117.5 8,572,349 111 28859 3312 105.0 6,997,562 90 29768 3386 92.5 5,807,512 75 30517 3386 80.0 4,573,724 59 31106 3386 67.5 3,458,531 45 31545 3386 55.0 2,469,355 32 31864 3386 42.5 1,615,797 21 32073 3386 30.0 911,069 12 32192 3566 17.5 395,347 5 3224
67,329 249,645,130 3224
S. K. Ghosh Associates Inc.
www.skghoshassociates.com 71
- 143 -
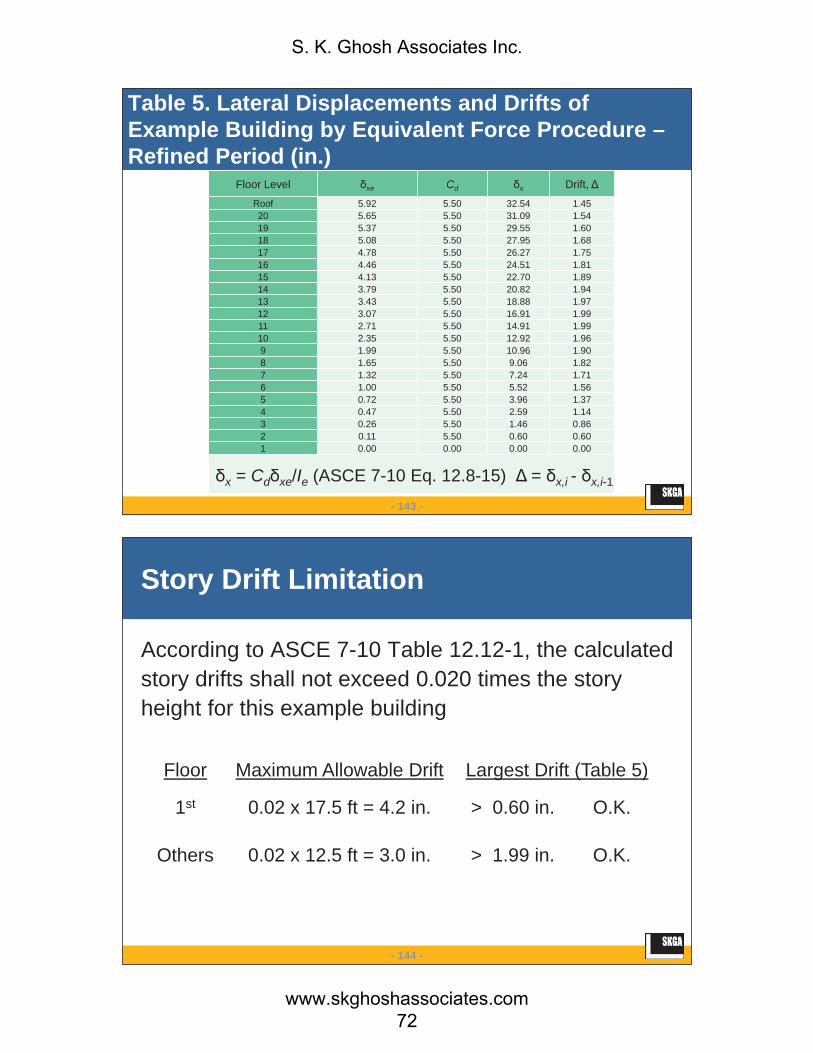
Table 5. Lateral Displacements and Drifts of Example Building by Equivalent Force Procedure –Refined Period (in.)
Floor Level xe Cd x Drift,
Roof 5.92 5.50 32.54 1.4520 5.65 5.50 31.09 1.5419 5.37 5.50 29.55 1.6018 5.08 5.50 27.95 1.6817 4.78 5.50 26.27 1.7516 4.46 5.50 24.51 1.8115 4.13 5.50 22.70 1.8914 3.79 5.50 20.82 1.9413 3.43 5.50 18.88 1.9712 3.07 5.50 16.91 1.9911 2.71 5.50 14.91 1.9910 2.35 5.50 12.92 1.969 1.99 5.50 10.96 1.908 1.65 5.50 9.06 1.827 1.32 5.50 7.24 1.716 1.00 5.50 5.52 1.565 0.72 5.50 3.96 1.374 0.47 5.50 2.59 1.143 0.26 5.50 1.46 0.862 0.11 5.50 0.60 0.601 0.00 0.00 0.00 0.00
x = Cd xe/Ie (ASCE 7-10 Eq. 12.8-15) = x,i - x,i-1
- 144 -
Story Drift Limitation
According to ASCE 7-10 Table 12.12-1, the calculated story drifts shall not exceed 0.020 times the story height for this example building
Floor Maximum Allowable Drift Largest Drift (Table 5)
1st 0.02 x 17.5 ft = 4.2 in. > 0.60 in. O.K.
Others 0.02 x 12.5 ft = 3.0 in. > 1.99 in. O.K.
S. K. Ghosh Associates Inc.
www.skghoshassociates.com 72

- 145 -
P- Effects (ASCE 7-10 Section 12.8.7)P- effects need not be considered when stability coefficient ( ) is equal to or less than 0.10:
Px = the total vertical design load at and above Level x
= the design story drift
Vx = the seismic shear force acting between Levels x and x 1
hsx = the story height below Level x
Cd = the deflection amplification factor in ASCE 7-10 Table 12.2-1
Ie = importance factor in ASCE 7-10 Table 1.5-2
dsxx
ex
ChVIP
- 146 -
Table 6. Calculation of Stability Coefficient
Max value < 0.1
So, P- effect could have been
neglected
StoryLevel
DLkips
Cum. DLkips
LLpsf
Areasq.ft
Pxkips
Vxkips
hsxft
Drift,in.
Roof 3285 3285 12 16900 3488 386 12.5 1.45 0.016
20 3329 6614 20 33800 7290 746 12.5 1.54 0.018
19 3329 9943 20 50700 10957 1076 12.5 1.60 0.020
18 3329 13272 20 67600 14624 1377 12.5 1.68 0.022
17 3343 16615 20 84500 18305 1651 12.5 1.75 0.024
16 3358 19973 20 101400 22001 1899 12.5 1.81 0.025
15 3358 23331 20 118300 25697 2122 12.5 1.89 0.028
14 3358 26689 20 135200 29393 2319 12.5 1.94 0.030
13 3358 30047 20 152100 33089 2493 12.5 1.97 0.032
12 3358 33405 20 169000 36785 2644 12.5 1.99 0.034
11 3358 36763 20 185900 40481 2775 12.5 1.99 0.035
10 3372 40135 20 202800 44191 2885 12.5 1.96 0.036
9 3312 43447 20 219700 47841 2976 12.5 1.90 0.037
8 3386 46833 20 236600 51565 3051 12.5 1.82 0.037
7 3386 50219 20 253500 55289 3110 12.5 1.71 0.037
6 3386 53605 20 270400 59013 3154 12.5 1.56 0.035
5 3386 56991 20 287300 62737 3186 12.5 1.37 0.033
4 3386 60377 20 304200 66461 3207 12.5 1.14 0.029
3 3386 63763 20 321100 70185 3219 12.5 0.86 0.023
2 3566 67329 20 338000 74089 3224 17.5 0.60 0.012
S. K. Ghosh Associates Inc.
www.skghoshassociates.com 73
- 147 -
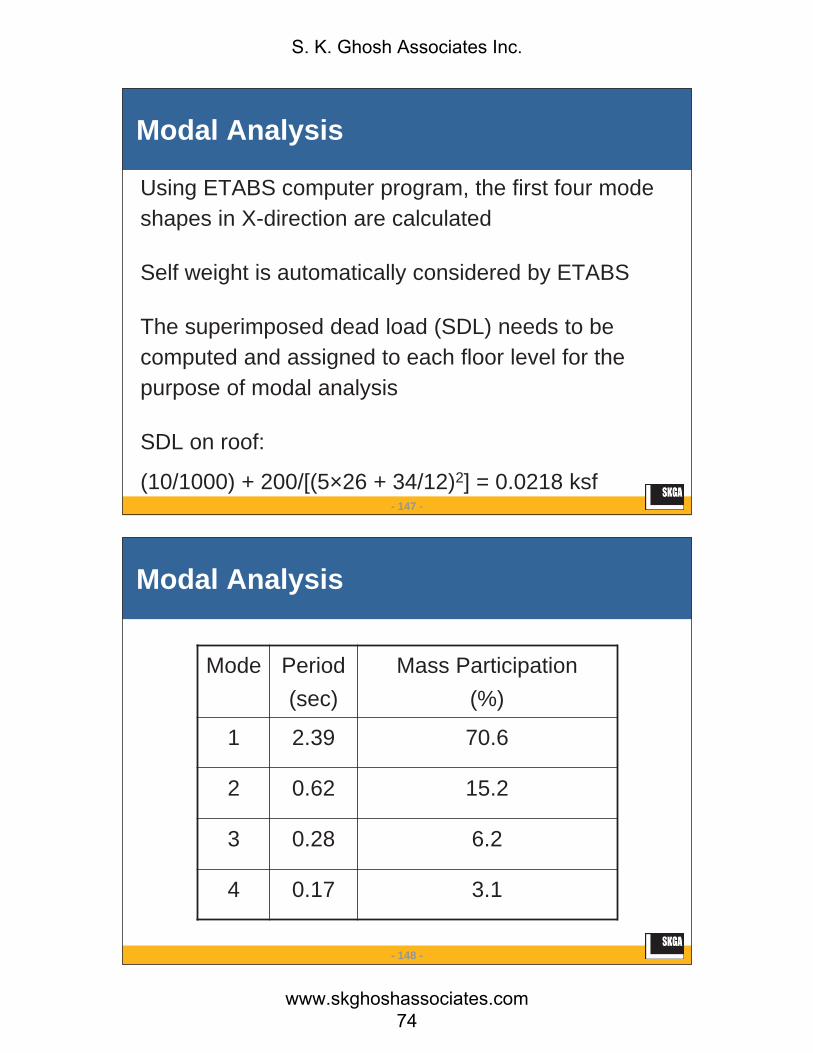
Modal Analysis
Using ETABS computer program, the first four mode shapes in X-direction are calculated
Self weight is automatically considered by ETABS
The superimposed dead load (SDL) needs to be computed and assigned to each floor level for the purpose of modal analysis
SDL on roof:
(10/1000) + 200/[(5×26 + 34/12)2] = 0.0218 ksf
- 148 -
Mode Period(sec)
Mass Participation (%)
1 2.39 70.6
2 0.62 15.2
3 0.28 6.2
4 0.17 3.1
Modal Analysis
S. K. Ghosh Associates Inc.
www.skghoshassociates.com 74
- 149 -
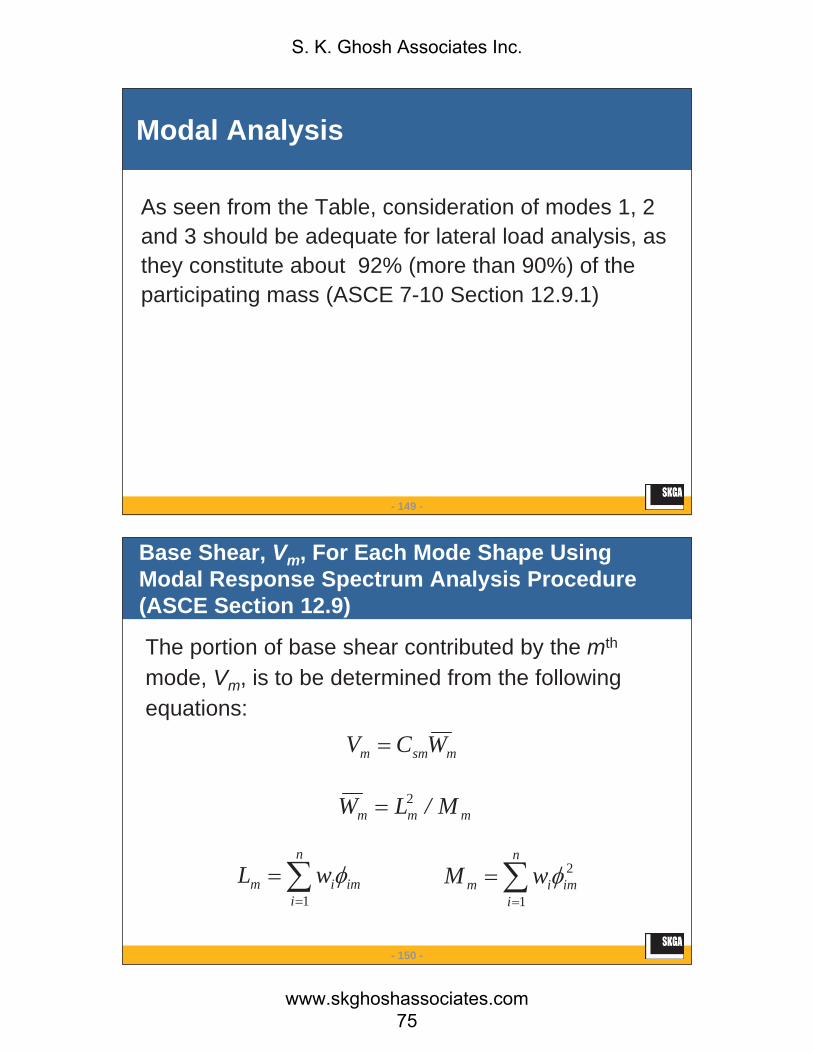
As seen from the Table, consideration of modes 1, 2 and 3 should be adequate for lateral load analysis, as they constitute about 92% (more than 90%) of the participating mass (ASCE 7-10 Section 12.9.1)
Modal Analysis
- 150 -
Base Shear, Vm, For Each Mode Shape Using Modal Response Spectrum Analysis Procedure (ASCE Section 12.9)
The portion of base shear contributed by the mth
mode, Vm, is to be determined from the following equations:
msmm WCV
mmm M/LW 2
n
iimim wL
1
n
iimim wM
1
2
S. K. Ghosh Associates Inc.
www.skghoshassociates.com 75
- 151 -
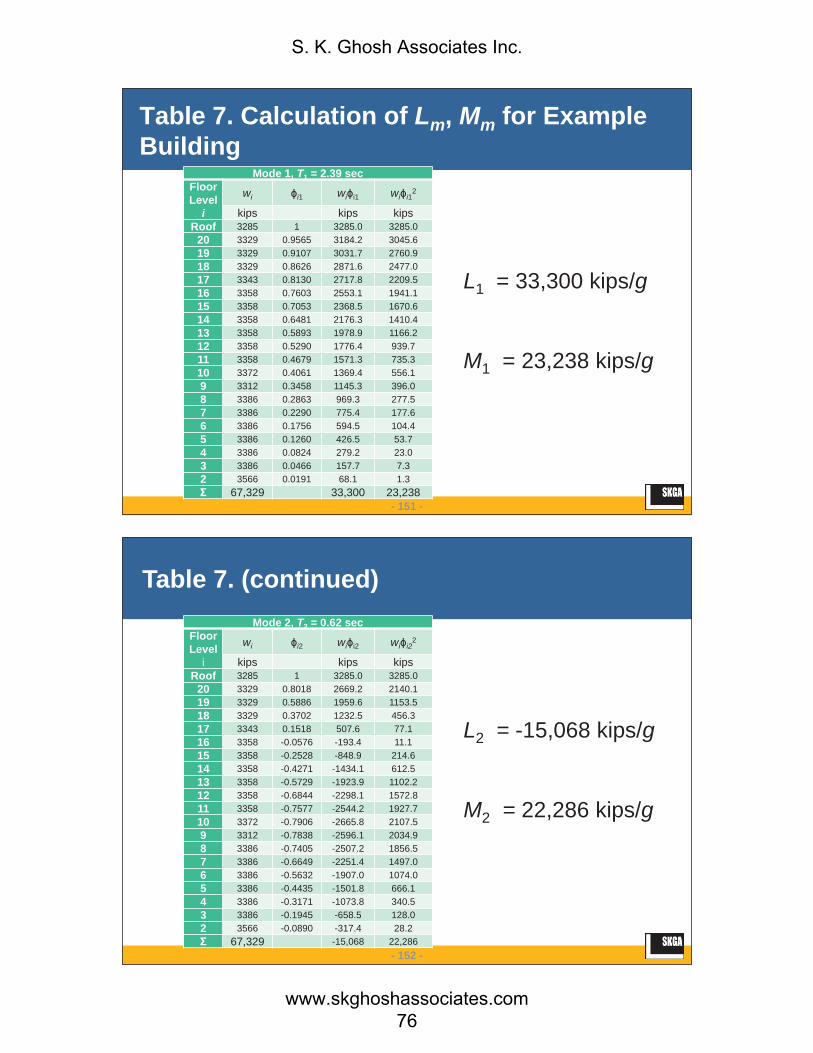
Table 7. Calculation of Lm, Mm for Example Building
Mode 1, T1 = 2.39 secFloorLevel
i
wi i1 wi i1 wi i12
kips kips kipsRoof 3285 1 3285.0 3285.0
20 3329 0.9565 3184.2 3045.619 3329 0.9107 3031.7 2760.918 3329 0.8626 2871.6 2477.017 3343 0.8130 2717.8 2209.516 3358 0.7603 2553.1 1941.115 3358 0.7053 2368.5 1670.614 3358 0.6481 2176.3 1410.413 3358 0.5893 1978.9 1166.212 3358 0.5290 1776.4 939.711 3358 0.4679 1571.3 735.310 3372 0.4061 1369.4 556.19 3312 0.3458 1145.3 396.08 3386 0.2863 969.3 277.57 3386 0.2290 775.4 177.66 3386 0.1756 594.5 104.45 3386 0.1260 426.5 53.74 3386 0.0824 279.2 23.03 3386 0.0466 157.7 7.32 3566 0.0191 68.1 1.3
67,329 33,300 23,238
L1 = 33,300 kips/g
M1 = 23,238 kips/g
- 152 -
Mode 2, T2 = 0.62 secFloorLevel
i
wi i2 wi i2 wi i22
kips kips kipsRoof 3285 1 3285.0 3285.0
20 3329 0.8018 2669.2 2140.119 3329 0.5886 1959.6 1153.518 3329 0.3702 1232.5 456.317 3343 0.1518 507.6 77.116 3358 -0.0576 -193.4 11.115 3358 -0.2528 -848.9 214.614 3358 -0.4271 -1434.1 612.513 3358 -0.5729 -1923.9 1102.212 3358 -0.6844 -2298.1 1572.811 3358 -0.7577 -2544.2 1927.710 3372 -0.7906 -2665.8 2107.59 3312 -0.7838 -2596.1 2034.98 3386 -0.7405 -2507.2 1856.57 3386 -0.6649 -2251.4 1497.06 3386 -0.5632 -1907.0 1074.05 3386 -0.4435 -1501.8 666.14 3386 -0.3171 -1073.8 340.53 3386 -0.1945 -658.5 128.02 3566 -0.0890 -317.4 28.2
67,329 -15,068 22,286
L2 = -15,068 kips/g
M2 = 22,286 kips/g
Table 7. (continued)
S. K. Ghosh Associates Inc.
www.skghoshassociates.com 76
- 153 -
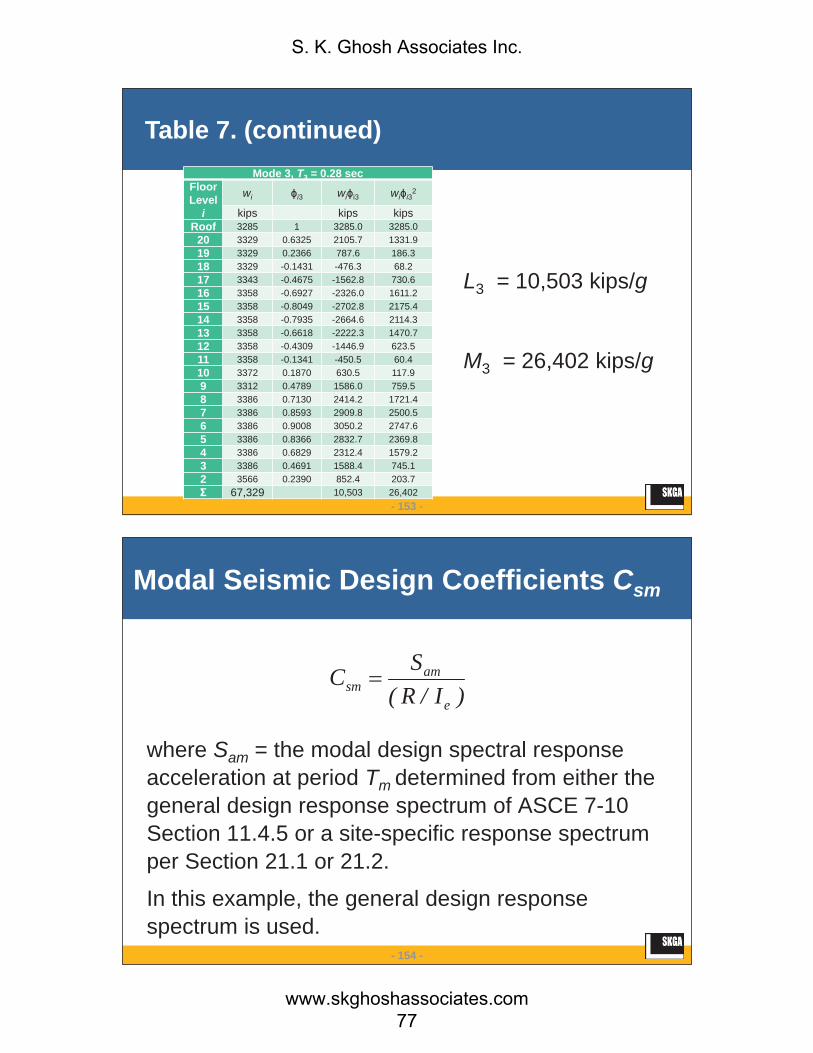
Mode 3, T3 = 0.28 secFloorLevel
i
wi i3 wi i3 wi i32
kips kips kipsRoof 3285 1 3285.0 3285.0
20 3329 0.6325 2105.7 1331.919 3329 0.2366 787.6 186.318 3329 -0.1431 -476.3 68.217 3343 -0.4675 -1562.8 730.616 3358 -0.6927 -2326.0 1611.215 3358 -0.8049 -2702.8 2175.414 3358 -0.7935 -2664.6 2114.313 3358 -0.6618 -2222.3 1470.712 3358 -0.4309 -1446.9 623.511 3358 -0.1341 -450.5 60.410 3372 0.1870 630.5 117.99 3312 0.4789 1586.0 759.58 3386 0.7130 2414.2 1721.47 3386 0.8593 2909.8 2500.56 3386 0.9008 3050.2 2747.65 3386 0.8366 2832.7 2369.84 3386 0.6829 2312.4 1579.23 3386 0.4691 1588.4 745.12 3566 0.2390 852.4 203.7
67,329 10,503 26,402
L3 = 10,503 kips/g
M3 = 26,402 kips/g
Table 7. (continued)
- 154 -
where Sam = the modal design spectral response acceleration at period Tm determined from either the general design response spectrum of ASCE 7-10 Section 11.4.5 or a site-specific response spectrum per Section 21.1 or 21.2.
In this example, the general design response spectrum is used.
Modal Seismic Design Coefficients Csm
)I/R(SC
e
amsm
S. K. Ghosh Associates Inc.
www.skghoshassociates.com 77
- 155 -
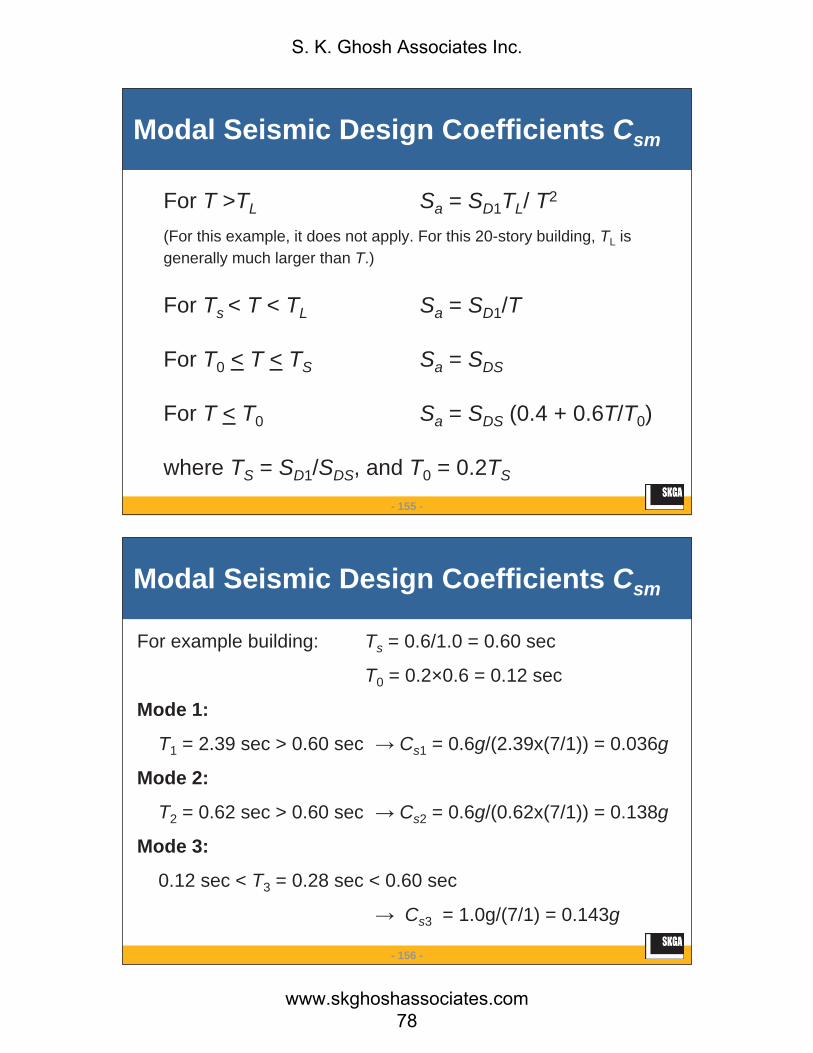
Modal Seismic Design Coefficients Csm
For T >TL Sa = SD1TL/ T2
(For this example, it does not apply. For this 20-story building, TL isgenerally much larger than T.)
For Ts < T < TL Sa = SD1/T
For T0 < T < TS Sa = SDS
For T < T0 Sa = SDS (0.4 + 0.6T/T0)
where TS = SD1/SDS, and T0 = 0.2TS
- 156 -
For example building: Ts = 0.6/1.0 = 0.60 sec
T0 = 0.2×0.6 = 0.12 sec
Mode 1:
T1 = 2.39 sec > 0.60 sec Cs1 = 0.6g/(2.39x(7/1)) = 0.036g
Mode 2:
T2 = 0.62 sec > 0.60 sec Cs2 = 0.6g/(0.62x(7/1)) = 0.138g
Mode 3:
0.12 sec < T3 = 0.28 sec < 0.60 sec
Cs3 = 1.0g/(7/1) = 0.143g
Modal Seismic Design Coefficients Csm
S. K. Ghosh Associates Inc.
www.skghoshassociates.com 78
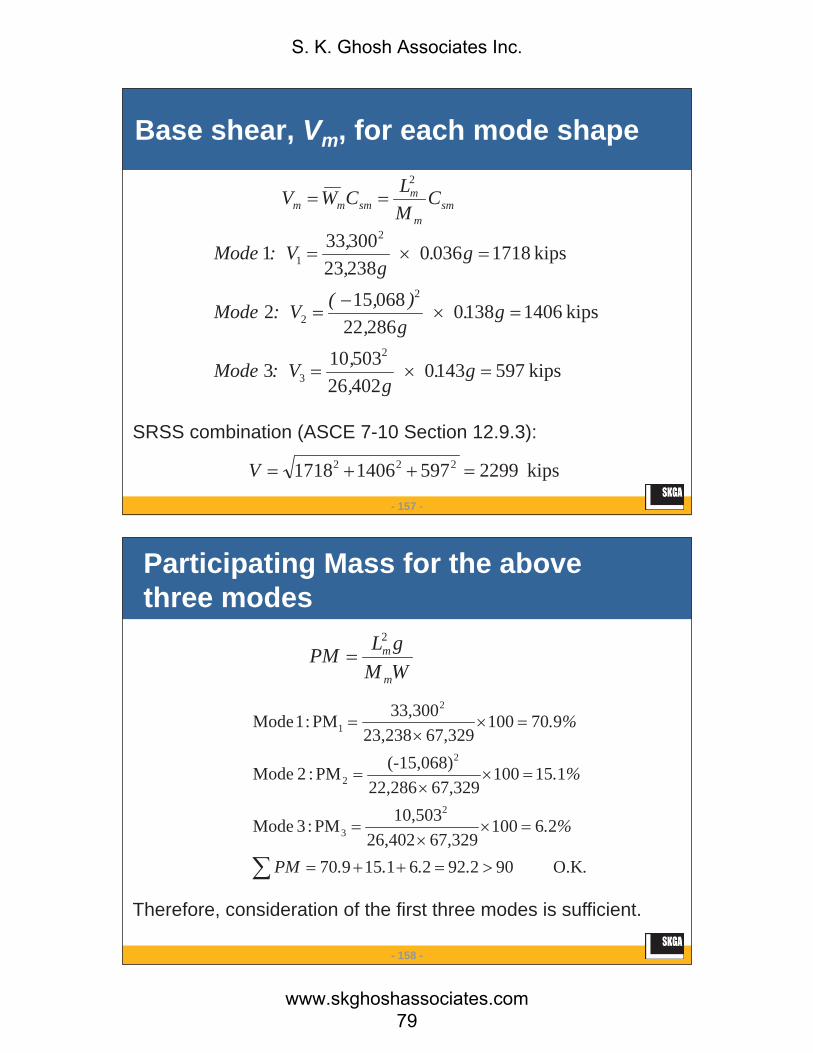
- 157 -
smm
msmmm C
MLCWV
2
Base shear, Vm, for each mode shape
kips597143040226503103
kips1406138028622068152
kips1718036023823300331
2
3
2
2
2
1
g.g,
,: VMode
g.g,
),(: VMode
g.g,
,: VMode
kips229959714061718 222V
SRSS combination (ASCE 7-10 Section 12.9.3):
- 158 -
Participating Mass for the above three modes
.....PM
%.
%.
%.
O.K9029226115970
2610067,32926,402
10,503PM:3Mode
11510067,32922,286
(-15,068)PM:2Mode
90710067,32923,238
33,300PM:1Mode
2
3
2
2
2
1
WMgLPM
m
m2
Therefore, consideration of the first three modes is sufficient.
S. K. Ghosh Associates Inc.
www.skghoshassociates.com 79

- 159 -
Scaling of Elastic Response Parameters for DesignASCE 7-10 Section12.9.4.1 stipulates that the base shear using modal analysis must be scaled up when the combined response for the modal base shear Vt isless than 85 percent of the calculated base shear VELFusing the equivalent lateral force procedure.
0.85 × 3224 (VELF from equivalent lateral force procedure) = 2740 kips 2299 kips (Vt from modal response spectrum procedure)
Therefore, the modal forces must be scaled up.
- 160 -
Scaling of Elastic Response Parameters for Design
Scale factor = 0.85VELF / Vt = 1.192
Modified modal base shears:
V1 = 1.192×1718 = 2048 kips
V2 = 1.192×1406 = 1676 kips
V3 = 1.192×597 = 712 kips
kips274071216762048 222V
S. K. Ghosh Associates Inc.
www.skghoshassociates.com 80
- 161 -
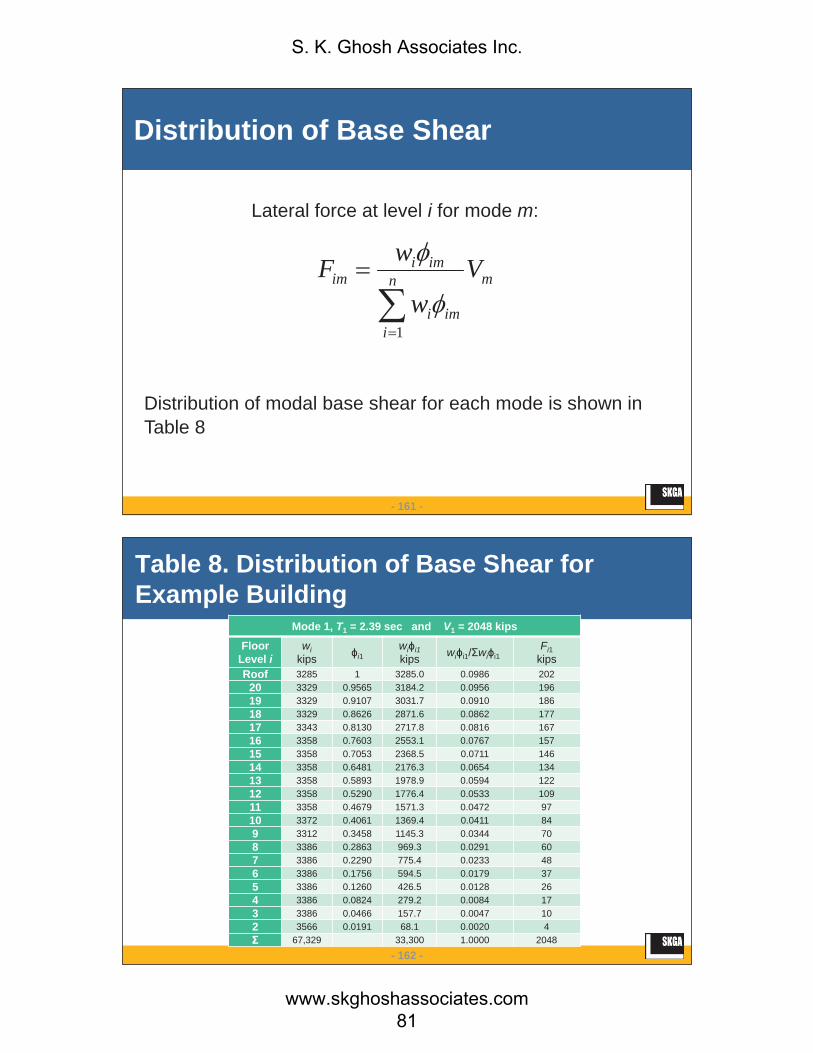
Distribution of Base Shear
mn
iimi
imiim V
w
wF
1
Lateral force at level i for mode m:
Distribution of modal base shear for each mode is shown in Table 8
- 162 -
Table 8. Distribution of Base Shear for Example Building
Mode 1, T1 = 2.39 sec and V1 = 2048 kips
FloorLevel i
wikips i1
wi i1kips wi i1/ wi i1
Fi1kips
Roof 3285 1 3285.0 0.0986 20220 3329 0.9565 3184.2 0.0956 19619 3329 0.9107 3031.7 0.0910 18618 3329 0.8626 2871.6 0.0862 17717 3343 0.8130 2717.8 0.0816 16716 3358 0.7603 2553.1 0.0767 15715 3358 0.7053 2368.5 0.0711 14614 3358 0.6481 2176.3 0.0654 13413 3358 0.5893 1978.9 0.0594 12212 3358 0.5290 1776.4 0.0533 10911 3358 0.4679 1571.3 0.0472 9710 3372 0.4061 1369.4 0.0411 849 3312 0.3458 1145.3 0.0344 708 3386 0.2863 969.3 0.0291 607 3386 0.2290 775.4 0.0233 486 3386 0.1756 594.5 0.0179 375 3386 0.1260 426.5 0.0128 264 3386 0.0824 279.2 0.0084 173 3386 0.0466 157.7 0.0047 102 3566 0.0191 68.1 0.0020 4
67,329 33,300 1.0000 2048
S. K. Ghosh Associates Inc.
www.skghoshassociates.com 81
- 163 -
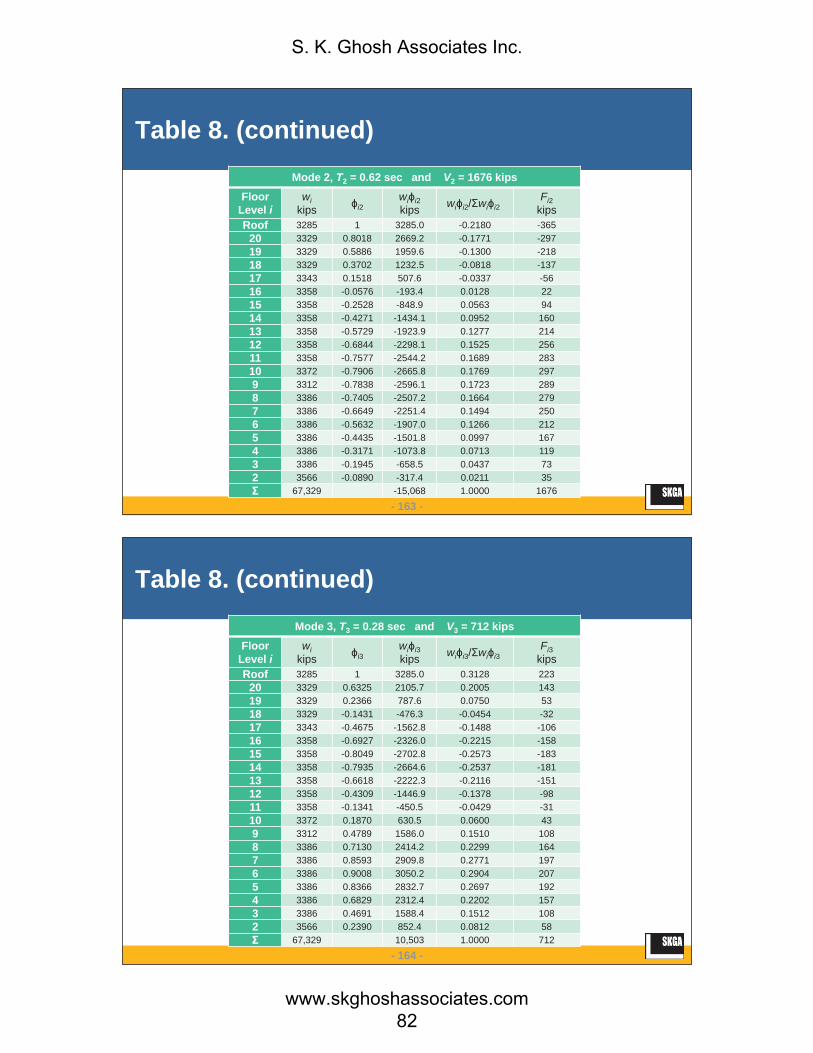
Table 8. (continued)Mode 2, T2 = 0.62 sec and V2 = 1676 kips
FloorLevel i
wikips i2
wi i2kips wi i2/ wi i2
Fi2kips
Roof 3285 1 3285.0 -0.2180 -36520 3329 0.8018 2669.2 -0.1771 -29719 3329 0.5886 1959.6 -0.1300 -21818 3329 0.3702 1232.5 -0.0818 -13717 3343 0.1518 507.6 -0.0337 -5616 3358 -0.0576 -193.4 0.0128 2215 3358 -0.2528 -848.9 0.0563 9414 3358 -0.4271 -1434.1 0.0952 16013 3358 -0.5729 -1923.9 0.1277 21412 3358 -0.6844 -2298.1 0.1525 25611 3358 -0.7577 -2544.2 0.1689 28310 3372 -0.7906 -2665.8 0.1769 2979 3312 -0.7838 -2596.1 0.1723 2898 3386 -0.7405 -2507.2 0.1664 2797 3386 -0.6649 -2251.4 0.1494 2506 3386 -0.5632 -1907.0 0.1266 2125 3386 -0.4435 -1501.8 0.0997 1674 3386 -0.3171 -1073.8 0.0713 1193 3386 -0.1945 -658.5 0.0437 732 3566 -0.0890 -317.4 0.0211 35
67,329 -15,068 1.0000 1676
- 164 -
Table 8. (continued)Mode 3, T3 = 0.28 sec and V3 = 712 kips
FloorLevel i
wikips i3
wi i3kips wi i3/ wi i3
Fi3kips
Roof 3285 1 3285.0 0.3128 22320 3329 0.6325 2105.7 0.2005 14319 3329 0.2366 787.6 0.0750 5318 3329 -0.1431 -476.3 -0.0454 -3217 3343 -0.4675 -1562.8 -0.1488 -10616 3358 -0.6927 -2326.0 -0.2215 -15815 3358 -0.8049 -2702.8 -0.2573 -18314 3358 -0.7935 -2664.6 -0.2537 -18113 3358 -0.6618 -2222.3 -0.2116 -15112 3358 -0.4309 -1446.9 -0.1378 -9811 3358 -0.1341 -450.5 -0.0429 -3110 3372 0.1870 630.5 0.0600 439 3312 0.4789 1586.0 0.1510 1088 3386 0.7130 2414.2 0.2299 1647 3386 0.8593 2909.8 0.2771 1976 3386 0.9008 3050.2 0.2904 2075 3386 0.8366 2832.7 0.2697 1924 3386 0.6829 2312.4 0.2202 1573 3386 0.4691 1588.4 0.1512 1082 3566 0.2390 852.4 0.0812 58
67,329 10,503 1.0000 712
S. K. Ghosh Associates Inc.
www.skghoshassociates.com 82

- 165 -
Lateral AnalysisUsing ETABS computer program, a three-dimensional analysis of the structure was performed under the lateral forces shown in Table 8.
Rigid diaphragm at each level.
Rigid offsets at both ends of each beam.
Accidental torsion (ASCE 7-10 Section 12.8.4.2) accounted for by displacing the center of mass by a distance of 5% of the building dimension perpendicular to the force direction.
- 166 -
Lateral Analysis
Considering cracked section properties (ASCE 7-10 Section 12.7.3):
For columns and shear walls, Ieff = 0.7IgFor beams, Ieff = 0.5Ig
P- effects were considered in the lateral analysis. Please note that this effect can be neglected in many situations as explained in ASCE 7-10 Section 12.8.7.
S. K. Ghosh Associates Inc.
www.skghoshassociates.com 83
- 167 -
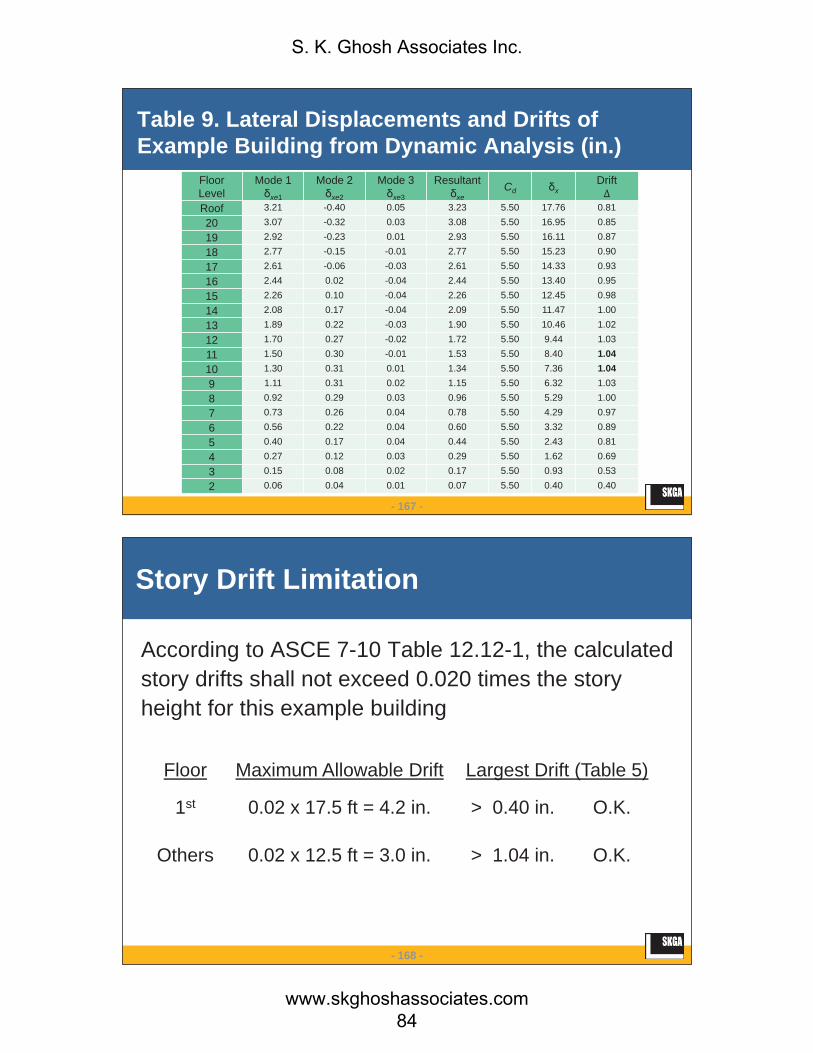
Table 9. Lateral Displacements and Drifts of Example Building from Dynamic Analysis (in.)
FloorLevel
Mode 1xe1
Mode 2xe2
Mode 3xe3
Resultantxe
Cd xDrift
Roof 3.21 -0.40 0.05 3.23 5.50 17.76 0.81
20 3.07 -0.32 0.03 3.08 5.50 16.95 0.85
19 2.92 -0.23 0.01 2.93 5.50 16.11 0.87
18 2.77 -0.15 -0.01 2.77 5.50 15.23 0.90
17 2.61 -0.06 -0.03 2.61 5.50 14.33 0.93
16 2.44 0.02 -0.04 2.44 5.50 13.40 0.95
15 2.26 0.10 -0.04 2.26 5.50 12.45 0.98
14 2.08 0.17 -0.04 2.09 5.50 11.47 1.00
13 1.89 0.22 -0.03 1.90 5.50 10.46 1.02
12 1.70 0.27 -0.02 1.72 5.50 9.44 1.03
11 1.50 0.30 -0.01 1.53 5.50 8.40 1.0410 1.30 0.31 0.01 1.34 5.50 7.36 1.049 1.11 0.31 0.02 1.15 5.50 6.32 1.03
8 0.92 0.29 0.03 0.96 5.50 5.29 1.00
7 0.73 0.26 0.04 0.78 5.50 4.29 0.97
6 0.56 0.22 0.04 0.60 5.50 3.32 0.89
5 0.40 0.17 0.04 0.44 5.50 2.43 0.81
4 0.27 0.12 0.03 0.29 5.50 1.62 0.69
3 0.15 0.08 0.02 0.17 5.50 0.93 0.53
2 0.06 0.04 0.01 0.07 5.50 0.40 0.40
- 168 -
Story Drift Limitation
According to ASCE 7-10 Table 12.12-1, the calculated story drifts shall not exceed 0.020 times the story height for this example building
Floor Maximum Allowable Drift Largest Drift (Table 5)
1st 0.02 x 17.5 ft = 4.2 in. > 0.40 in. O.K.
Others 0.02 x 12.5 ft = 3.0 in. > 1.04 in. O.K.
S. K. Ghosh Associates Inc.
www.skghoshassociates.com 84

- 169 -
Table 10 shows the shear force and bending moment at each floor level of each shear wall (the four shear walls are identical in every respect and are subject to the same forces) due to each considered mode and the resultant load effects
Lateral Analysis
- 170 -
Table 10. Internal Forces in a Shear Wall Due To Lateral Forces Given in Table 8
Story Location ShearV (kips)
MomentM (ft-kips)
Story 20
Mode 1 Top -314 -1,209Bottom -314 -5,129
Mode 2 Top 55 708Bottom 55 1,387
Mode 3 Top 61 -163Bottom 61 596
Resultant Top 324 1,411Bottom 324 5,347
Story 19
Mode 1 Top -94 -6,450Bottom -94 -7,614
Mode 2 Top -165 2,160Bottom -165 97
Mode 3 Top 147 419Bottom 147 2,262
Resultant Top 240 6,815Bottom 240 7,943
Story 18
Mode 1 Top -25 -8,984Bottom -25 -9,282
Mode 2 Top -267 887Bottom -267 -2,463
Mode 3 Top 176 2,089Bottom 176 4,294
Resultant Top 321 9,266Bottom 321 10,519
S. K. Ghosh Associates Inc.
www.skghoshassociates.com 85

- 171 -
Table 10. (continued)
Story Location ShearV (kips)
MomentM (ft-kips)
Story 17
Mode 1 Top 54 -10,719Bottom 54 -10,016
Mode 2 Top -339 -1,667Bottom -339 -5,923
Mode 3 Top 166 4,139Bottom 166 6,212
Resultant Top 382 11,610Bottom 382 13,190
Story 16
Mode 1 Top 115 -11,525Bottom 115 -10,053
Mode 2 Top -379 -5,146Bottom -379 -9,897
Mode 3 Top 124 6,092Bottom 124 7,639
Resultant Top 415 14,015Bottom 415 16,043
Story 15
Mode 1 Top 182 -11,635Bottom 182 -9,321
Mode 2 Top -378 -9,164Bottom -378 -13,907
Mode 3 Top 52 7,565Bottom 52 8,216
Resultant Top 423 16,631Bottom 423 18,650
- 172 -
Table 10. (continued)
Story Location ShearV (kips)
MomentM (ft-kips)
Story 14
Mode 1 Top 255 -10,974Bottom 255 -7,738
Mode 2 Top -355 -13,242Bottom -355 -17,690
Mode 3 Top -29 8,196Bottom -29 7,827
Resultant Top 438 19,051Bottom 438 20,835
Story 13
Mode 1 Top 312 -9,455Bottom 312 -5,506
Mode 2 Top -296 -17,117Bottom -296 -20,827
Mode 3 Top -111 7,860Bottom -111 6,466
Resultant Top 444 21,075Bottom 444 22,492
Story 12
Mode 1 Top 367 -7,276Bottom 367 -2,632
Mode 2 Top -214 -20,370Bottom -214 -23,055
Mode 3 Top -180 6,547Bottom -180 4,296
Resultant Top 461 22,599Bottom 461 23,600
S. K. Ghosh Associates Inc.
www.skghoshassociates.com 86
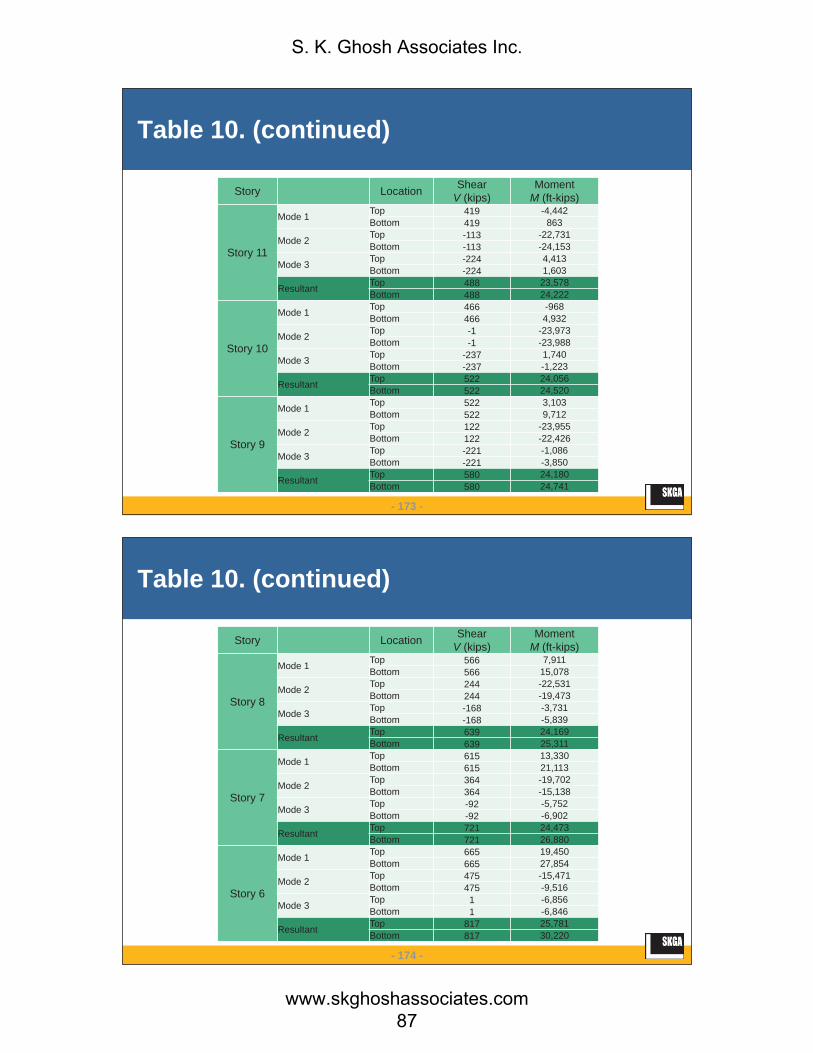
- 173 -
Table 10. (continued)
Story Location ShearV (kips)
MomentM (ft-kips)
Story 11
Mode 1 Top 419 -4,442Bottom 419 863
Mode 2 Top -113 -22,731Bottom -113 -24,153
Mode 3 Top -224 4,413Bottom -224 1,603
Resultant Top 488 23,578Bottom 488 24,222
Story 10
Mode 1 Top 466 -968Bottom 466 4,932
Mode 2 Top -1 -23,973Bottom -1 -23,988
Mode 3 Top -237 1,740Bottom -237 -1,223
Resultant Top 522 24,056Bottom 522 24,520
Story 9
Mode 1 Top 522 3,103Bottom 522 9,712
Mode 2 Top 122 -23,955Bottom 122 -22,426
Mode 3 Top -221 -1,086Bottom -221 -3,850
Resultant Top 580 24,180Bottom 580 24,741
- 174 -
Table 10. (continued)
Story Location ShearV (kips)
MomentM (ft-kips)
Story 8
Mode 1 Top 566 7,911Bottom 566 15,078
Mode 2 Top 244 -22,531Bottom 244 -19,473
Mode 3 Top -168 -3,731Bottom -168 -5,839
Resultant Top 639 24,169Bottom 639 25,311
Story 7
Mode 1 Top 615 13,330Bottom 615 21,113
Mode 2 Top 364 -19,702Bottom 364 -15,138
Mode 3 Top -92 -5,752Bottom -92 -6,902
Resultant Top 721 24,473Bottom 721 26,880
Story 6
Mode 1 Top 665 19,450Bottom 665 27,854
Mode 2 Top 475 -15,471Bottom 475 -9,516
Mode 3 Top 1 -6,856Bottom 1 -6,846
Resultant Top 817 25,781Bottom 817 30,220
S. K. Ghosh Associates Inc.
www.skghoshassociates.com 87
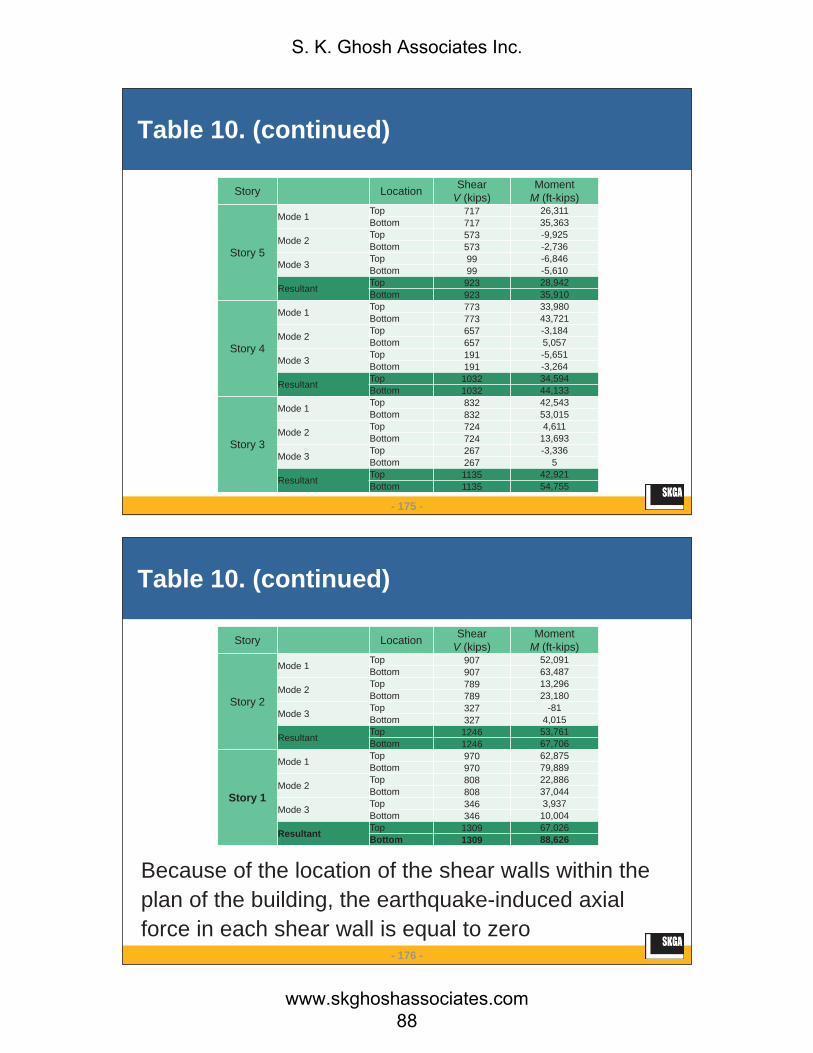
- 175 -
Table 10. (continued)
Story Location ShearV (kips)
MomentM (ft-kips)
Story 5
Mode 1 Top 717 26,311Bottom 717 35,363
Mode 2 Top 573 -9,925Bottom 573 -2,736
Mode 3 Top 99 -6,846Bottom 99 -5,610
Resultant Top 923 28,942Bottom 923 35,910
Story 4
Mode 1 Top 773 33,980Bottom 773 43,721
Mode 2 Top 657 -3,184Bottom 657 5,057
Mode 3 Top 191 -5,651Bottom 191 -3,264
Resultant Top 1032 34,594Bottom 1032 44,133
Story 3
Mode 1 Top 832 42,543Bottom 832 53,015
Mode 2 Top 724 4,611Bottom 724 13,693
Mode 3 Top 267 -3,336Bottom 267 5
Resultant Top 1135 42,921Bottom 1135 54,755
- 176 -
Table 10. (continued)
Story Location ShearV (kips)
MomentM (ft-kips)
Story 2
Mode 1 Top 907 52,091Bottom 907 63,487
Mode 2 Top 789 13,296Bottom 789 23,180
Mode 3 Top 327 -81Bottom 327 4,015
Resultant Top 1246 53,761Bottom 1246 67,706
Story 1
Mode 1 Top 970 62,875Bottom 970 79,889
Mode 2 Top 808 22,886Bottom 808 37,044
Mode 3 Top 346 3,937Bottom 346 10,004
Resultant Top 1309 67,026Bottom 1309 88,626
Because of the location of the shear walls within the plan of the building, the earthquake-induced axial force in each shear wall is equal to zero
S. K. Ghosh Associates Inc.
www.skghoshassociates.com 88
- 177 -
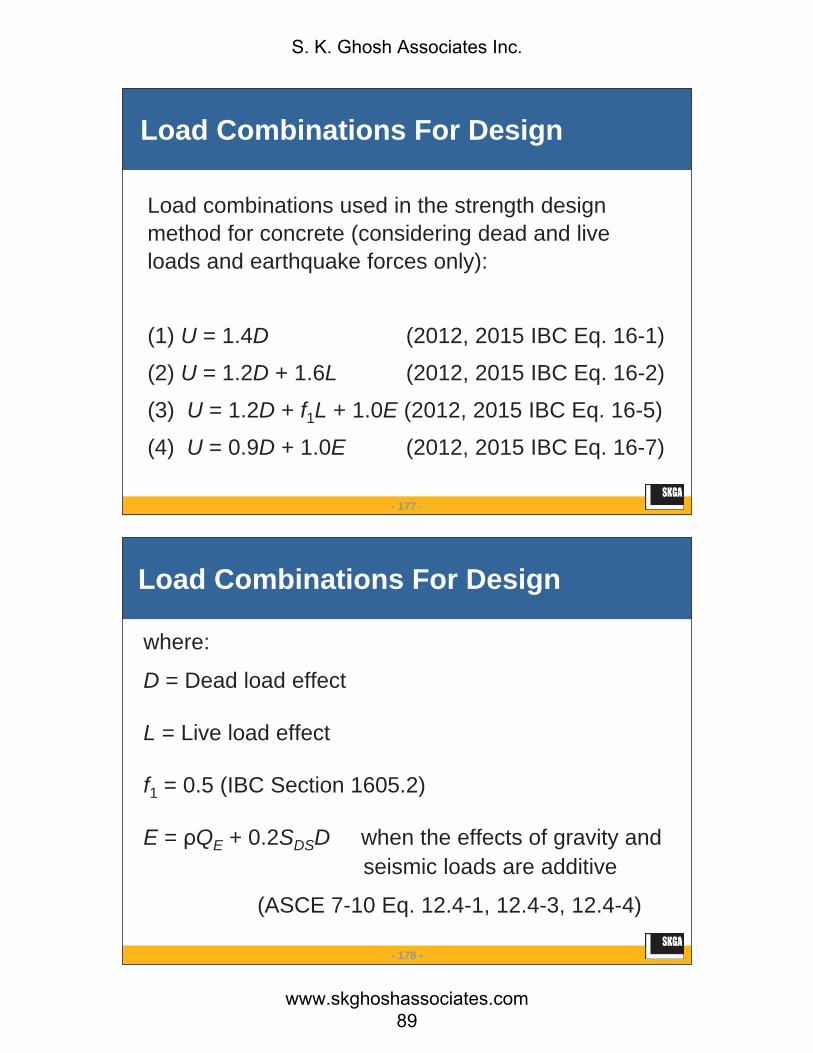
Load Combinations For Design
Load combinations used in the strength design method for concrete (considering dead and live loads and earthquake forces only):
(1) U = 1.4D (2012, 2015 IBC Eq. 16-1)
(2) U = 1.2D + 1.6L (2012, 2015 IBC Eq. 16-2)
(3) U = 1.2D + f1L + 1.0E (2012, 2015 IBC Eq. 16-5)
(4) U = 0.9D + 1.0E (2012, 2015 IBC Eq. 16-7)
- 178 -
Load Combinations For Design
where:
D = Dead load effect
L = Live load effect
f1 = 0.5 (IBC Section 1605.2)
E = QE + 0.2SDSD when the effects of gravity and seismic loads are additive
(ASCE 7-10 Eq. 12.4-1, 12.4-3, 12.4-4)
S. K. Ghosh Associates Inc.
www.skghoshassociates.com 89

- 179 -
Load Combinations For Design
E = QE - 0.2SDSD when the effects of gravity and seismic loads are counteractive
(ASCE 7-10 Eq. 12.4-2, 12.4-3, 12.4-4)
QE = Horizontal seismic forces effect
Use redundancy factor, = 1 (the configuration of this dual-system building qualifies for a factor of 1.0, according to ASCE 7-10 Section 12.3.4.2)
- 180 -
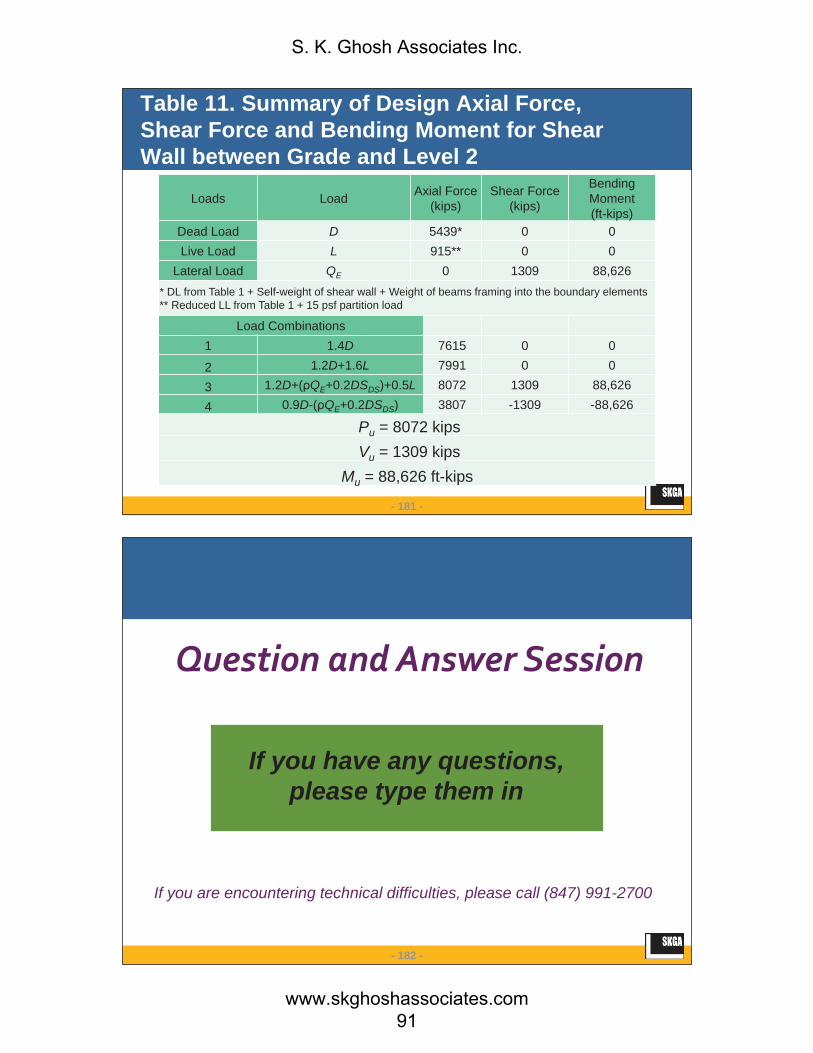
Design Loads
Table 11 shows a summary of the axial force, shear force and bending moment at the base of each shear wall
S. K. Ghosh Associates Inc.
www.skghoshassociates.com 90
- 181 -
Table 11. Summary of Design Axial Force, Shear Force and Bending Moment for Shear Wall between Grade and Level 2
Loads Load Axial Force(kips)
Shear Force(kips)
BendingMoment(ft-kips)
Dead Load D 5439* 0 0Live Load L 915** 0 0
Lateral Load QE 0 1309 88,626* DL from Table 1 + Self-weight of shear wall + Weight of beams framing into the boundary elements** Reduced LL from Table 1 + 15 psf partition load
Load Combinations1 1.4D 7615 0 0
2 1.2D+1.6L 7991 0 0
3 1.2D+( QE+0.2DSDS)+0.5L 8072 1309 88,626
4 0.9D-( QE+0.2DSDS) 3807 -1309 -88,626
Pu = 8072 kipsVu = 1309 kips
Mu = 88,626 ft-kips
- 182 -
Question andAnswer Session
If you are encountering technical difficulties, please call (847) 991-2700
If you have any questions, please type them in
S. K. Ghosh Associates Inc.
www.skghoshassociates.com 91

- 183 -
Follow us on:
Thank You!!
For more information…
www.skghoshassociates.com
Phone: (847) 991-2700 / (949) 215-6560
Email: [email protected]
S. K. Ghosh Associates Inc.
www.skghoshassociates.com 92