Embed Size (px)
Citation preview

See discussions, stats, and author profiles for this publication at: https://www.researchgate.net/publication/313874525
Simulation of RFID-based Folded Patched Antenna for Strain Sensing
Conference Paper · August 2016
CITATIONS
0
READS
44
5 authors, including:
Some of the authors of this publication are also working on these related projects:
Wood Frame Structure seismic performance View project
Wind-induced Fragility Analysis of Power Transmission Towers based on Monitored Data View project
Can Jiang
Keio University
2 PUBLICATIONS 0 CITATIONS
SEE PROFILE
Liyu Xie
Tongji University
12 PUBLICATIONS 60 CITATIONS
SEE PROFILE
Songtao Xue
Tohoku Institute of Technology
89 PUBLICATIONS 534 CITATIONS
SEE PROFILE
All content following this page was uploaded by Liyu Xie on 21 February 2017.
The user has requested enhancement of the downloaded file.

Simulation of RFID-based Folded Patched Antenna for Strain Sensing
Can Jiang1), *Liyu Xie2), Shicong Wang3), Guochun Wan4)
and Songtao Xue5)
1), 2), 5) Research Institute of Structure Engineering and Disaster Reduction, Tongji
University, Shanghai, China 3), 4) Department of Electronic Science and Technology, Tongji University, Shanghai,
China 2) [email protected]
ABSTRACT
RFID-based strain sensors with quarter-wave rectangular patched antennas were investigated for monitoring the strain in structures. When the patch antenna is under strain/deformation, causing electromagnetic resonance frequency of the antenna shifting, its resonance frequency varies accordingly. The RFID-based sensors can be interrogated by a wireless or wired interrogation equipment, and the variation of the resonance frequency can be identified by measuring the backscatter parameter of antenna, then the amount of the strain can be determined. This paper designed two folded patched antenna sensors with different material of the substrate, RT-5870 and FR4. A 2.4GHz quarter-wave patched antenna is used for minimizing the size of the sensor. The correlation between resonance frequency variation and the strain were simulated numerically via HFSSTM and the strain transfer efficiency of sensor were simulated via ABAQUS software. The simulation results showed that the variation of the resonance frequency of both sensors is due to the contribution of the strain in longitudinal direction. The width variation of the rectangular patched antenna has little influence on the variation of resonance frequency in transversal direction, therefore the resonance frequency shifting of strain sensors depends on the strain in longitudinal direction. To compare the difference between two antennas, the antenna with FR4 substrate has a better performance, it has smaller size, less impact of width strain and better strain transfer efficiency. KEYWORDS: strain sensor, RFID, antennas, RT-5870, FR4, resonance frequency,
1)
Graduate student 2)
Assistant professor 3)
Graduate student 4)
Associate professor 5)
Professor
1. INTRODUCTION
Strain measurement plays a very important role in the field of structural health monitoring. At present, there are three main kinds of traditional sensors to measure the strain on the structure, resistance strain gauges, vibrating wire strain gauges and fiber Bragg optic sensors. Resistance strain gauges can transform strain into a resistance change, and the change will be measured though Wheatstone bridge; vibrating wire strain gages utilize the relationship between strain and the resonance frequency of chord to measure strain; and Bragg grating sensors is based on the working principle that fiber grating Bragg wavelength will drift while undertaking a strain. Usually, any one kind of these three sensors is suitable for measuring the strain of structures under some certain circumstance, each of them has its own disadvantages and advantages. However, all kinds of these sensors require power supply for measuring and transmitting
the information, and require wires for power and information transmission. This will make sensor installation cost more labor work and investment. Recently, wireless communication systems are introduced to improve the data transmission functionality of these sensors, such as Zigbee and Wifi. However, these improvements cannot get rid of the wire requirement for power supply completely. And, the real-time power supply system may be disabled when disasters occur, which will shut down the sensors from measuring strain.
In order to overcome these disadvantages, Radio Frequency Identification technology (RFID) has been introduced to design and implementation of strain sensors recently. With RFID technology, sensors can measure strain passively and wirelessly. A typical RFID system consists of a reader and a transponder (tag), and a RFID tag include an antenna and a chip. At the center of the RFID strain sensor is sensing element, which usually is the antenna. When the antenna is under strain/deformation, causing electromagnetic resonance frequency of the antenna shifting, its resonance frequency varies accordingly. Such change can be interrogated by a test instrument, such as reader and network analyzer.
Using this theory, several RFID strain measurement systems have been designed and manufactured science the beginning of this century. In the aspect of sensors, (Mita 2002) developed strain sensors using the relationship between strain and antenna’s resonance frequency. (Occhiuzzi 2011) designed RFID strain sensors with a folding dipole antenna, and compared some antenna’s parameters (such as gain, antenna impedance, energy transfer coefficient and the echo reflected power) as an indicator to measure the strain. (Yi 2011) developed RFID strain sensors with a patch antenna which has above 915MHz-resonance frequency. (Bai 2013) studied RFID sensors with a dipole antenna to record the maximum strain of the structure. (Daliri 2012) and (Qian 2012) also developed deferent kinds of RFID strain sensors using the same theory. In the aspect of measurement equipment, to detect the resonance frequency of antennas
precisely, (Chuang 2004) developed an interrogation system which use the phase sensitive detection techniques. Measure strain with passive wireless RFID strain sensors will cut the cost and storage information easily and reliably, which can overcome the disadvantages of traditional strain sensors. It can be expected that RFID strain sensor will have a good

prospect in few years. 2. THEORY OF RFID STRAIN SENDOR RFID system consists of the reader and the transponder (tag). There are some transmissions of energy and information from reader to tag, during the period of system working. As Fig.1 shows, in the first phase, the reader radiate the electromagnetic wave and the tag receive it. The reader not only provide the energy but also transmit datum and instructions to the tag in this process. In the second phase, the tag will reply to the reader. The tag transmit the electromagnetic wave and the reader receive and analyze the replies. In this way, the reader can read the information which were stored in the tag. For RFID strain sensor, the reader usually work as an interrogation equipment, which can detect the shifting of antenna’s resonance frequency for acquiring the strain.
control system
reader
chip
tag
control
system
reader
chip
tag
power
datum
(the first phase)
datum
(the second phase) Fig.1 The operating principle of RFID system
The tag, which consists of the chip and the antenna, as Fig.2 shows, can receive, store and transmit the datum. Each chip has a unique identification code, some datum are code in general agreement. The antenna can emit and receive the electromagnetic wave at different operation frequencies, and it is very sensitive to the deformation, when experience a strain, its resonance frequency will shift. The antenna usually works as a sensing element of RFID strain sensor because of this property.
Fig. 2 A RFID tag (Canestri 2007) 2.1 The correlation between the size and the resonance frequency

With a RFID strain sensor, strain can be measured by detecting the change of antenna’s resonance frequency. The resonance frequency of the antenna is the frequency which antenna can operation best at. There are some correlation between the size and the resonance frequency of antenna. Usually, when the electrical length of the antenna increase, the resonance frequency of the antenna will become higher, while the electrical length decrease, the resonance frequency will become lower.
There are many type of antennas, all of them will change their resonance frequency when they resize themselves, but rectangular patched antennas are more suitable for strain sensors than many other antennas. The resonance frequency shifting of this antenna depend on the strain in longitudinal direction, while the deformation in another direction has little influence on the variation of resonance frequency. Thus it, the strain in longitudinal direction can be measured easily which is immunity to interference of strain in other directions. Moreover using the quarter-wave antenna can minimize the
size of antenna, so in this research, the RFID strain sensors are based on the quarter-wave rectangular patched antennas.
In this section, the correlation between the size and the resonance frequency of this antenna is introduced. As shown in Fig.3, the top side of the antennas contains a flat rectangular patched, a microstrip matching line, a feeding point and some vias, which are mounted on a dielectric substrate. The antenna can connect with the chip through patching line and feeding point, they will work together well only if they are impedance matched. The bottom side of antenna is the electronic ground plane. Usually, the top and bottom side are made of copper cladding while the dielectric substrate is made of some organic material. With the vias, the substrate is perforated and there is short-circuit between the top copper and the ground plane, therefore it changes the half-wave patched antenna to the quarter-wave patched antenna, and halves the resonance frequency or the length of antenna.
(a) (b)
Fig.3 The composition of quarter-wave patched rectangular antenna. (a) Vertical view. (b) Lateral view
This antenna has a low profile and small size, which can be manufactured easily. More importantly, the bandwidth of this antenna is narrow, which make the shifting of resonance frequency can be detected more easily.
The initial resonance frequency of the antennas is related to the length of it, which
ViasFeeding
point
Matching
line
Copper
patched
Substrate
Copper
patchedSubstrate
ViasGround
plane

can be estimated as Eq. (1).
0
1
24R
e
cf
L L
(1)
In this equation, 0R
f is the resonance frequency of the antennas at 0 strain level,
c is the speed of light in vacuum, e is the effective dielectric constant of the substrate,
L is the length of the copper patched in the top side, L , the additional electrical length
of the antenna, is related to the copper patched width, the substrate thickness and the
substrate material.
When the antennas undertaking strain in longitudinal direction, the resonance
frequencyR
f will change accordingly. And if L L ,R
f will change approximately
linearly with strain like Eq. (2).
0
0
1(1 )
(1 ) 14
R
R R
e
fcf f
L
(2)
This equation shows that the change of R
f is mainly affected by the deformation in
longitudinal direction. Moreover, R
f is linear related to and the slope is above0R
f , so
the bigger0R
f is, the more sensitive these sensors are.
2.2 How to detect the resonance frequency of antennas For measuring the strain, the resonance frequency must be found, an interrogation
equipment can detect the resonance frequency. With a special designed reader, resonance frequency can be detected wirelessly, it can analyze the signal which receive from the tag then compute the resonance frequency of antennas. But for the rectangular patched antennas which were investigated in this paper, their resonance frequencies are too high (about 2.45GHz) to match a popular chip. So it is difficult to measure the resonance frequency of these antennas wirelessly.
With a network analyzer, the resonance frequency can be measured in wired way. The network analyzer can be connected to the antenna through a coaxial cable, after that, it emit electromagnetic wave at different frequencies to the antenna, then the antenna backscatter part of the electromagnetic to the analyzer.
If the analyzer emit a electromagnetic wave at the frequency f , the emit power is
( )emP f , and the antenna backscatter the power ( )bsP f , the backscatter parameter at
different frequency can be calculated with Eq. (3).
11 10
( )( ) 10log ( )
( )
ref
in
P fS f
P f (3)
As mentioned above, the resonance frequency is the best operation frequency of
the antenna, the antenna can receive most energy and backscatter least energy at this
frequency. That means the backscatter parameter11S reaches the minimum at the
resonance frequencyR
f . So, R
f can be found by searching the minimum11S . When the
antenna size changes, the11S curve will shift due to strain as shown in Fig.4, the

resonance frequency will change accordingly.
Fig.4 Conceptual illustration of detecting the resonance frequency shifting by
measuring the11S curve
3. DESIGN AND SIMULATION OF RFID STRAIN SENSOR 3.1 Design of RFID strain sensor
In this section, two antennas was designed using the HFSSTM, both of them are quarter-wave rectangular patched antennas, but with different substrate (RT-5870 and FR4). Fig. 5 provides 3D prototypes of these two antennas.
(a) (b)
Fig. 5 3D prototypes of two patched antennas in HFSSTM. (a) RT-5870 substrate. (b) FR4 substrate
For measuring the11S parameter effetely with the network analyzer, there should be
an impendence match between antenna and coaxial cable. That means the impendence of antenna should be close to 50 , the impendence of coaxial cable. The impendence of antenna can be adjusted by change the size of matching line. After optimizing, the property of two antennas are shown in Fig.6 and Tab. 1.

Fig. 6 Illustration of detail dimension of patched antennas
Tab.1 Dimension and parameter of patched antennas
substrate ( )W mm ( )L mm ( )H mm 1( )W mm 2 ( )W mm
RT5870 39 45.5 0.51 35 2.1
FR-4 22 36.7 0.5 20 2.9
substrate 1( )L mm 2 ( )L mm
3( )L mm r tan
RT5870 20.6 18.7 4 2.33 0.02
FR-4 15.7 16 4 4.4 0.0012
H is the thickness of these antennas; tan is the loss tangent, which affect the quality factor of the antenna, the smaller the tan is, the bigger the quality factor is; r is the relative dielectric constant of substrate, the correlation between r and e is show as Eq. (4).
1
21 1 10
(1 )2 2
r re
h
W
(4)
e of FR4 is bigger than RT-5870, according to Eq.(1) and Eq.(4), when these two
antennas have a same0R
f , the size of the antenna with FR4 substrate will be smaller.
3.2 Electrical simulation of RFID strain sensor The impendence of the two antennas are shown in Fig. 7. Both of the two
antennas have little difference with coaxial cable in impendence, which will increase the
11S parameter then make the resonance frequencies of antennas more difficult to detect in practice. But, it is in an acceptable error range.
L1 L2 L3
W2
WW1
L

(a) (b)
Fig.7 The impendence matched of antennas. (a) RT-5870 substrate. (b) FR4 substrate
For the antenna with a RT-5870 substrate, by searching the minimum of11S
parameter, the resonance frequency at zero strain0R
f can be find, as Fig. 8 shows, it is
2.4608GHz.
Fig.8 The resonance frequency at zero strain of antenna with RT-5870 substrate
By changing the length of the antenna’s HFSS model, which means change the
value of L , 1L , 2L and 3L , the strain in longitudinal direction can be simulated. In this way,
the resonance frequencies of the antenna at nine different strain level are computed by
simulating their 11S curve as Fig. 9 shows. At 16 m strain in longitudinal direction, the
resonance frequency decreases to 2.4183GHz. There is a good linear relationship
between the resonance frequencies and the strains in longitudinal direction, the
coefficient of determination(2R ) is 0.9986 . The slope is -2.6 /KHz , which means 1
strain cause 2.6 KHz decrease in resonance frequency. According to Eq. (2), the

slope is above is above0R
f (2.46 /KHz ) , these two value are very close.
(a) (b)
Fig. 9 Simulation result for antenna with RT-5870 substrate. (a) Simulated different S11
curves at different strain levels. (b) Linear relationship between resonance frequency and strain in longitudinal direction
To investigate the influence of the strain in width direction, the same method was used in calculating the resonance frequency of antennas at different strain level in width direction. As Fig. 10 shows, the sensitivity in width direction is only -0.37 /KHz , which is only 14.2% of the sensitivity in longitudinal direction.
Fig. 10 The different impacts of length change and width change to resonance
frequency shifting (RT-5870 substrate)
In the same way, the resonance frequencies of the antenna with a FR4 substrate at different strain levels can be computed. As shown in Fig. 11, the resonance frequency

is 2.4524GHz at zero strain level, and it decrease to 2.4081GHz at strain level in longitudinal direction. There is also a good relationship between resonance frequencies and strains, the coefficient of determination (
2R ) is 0.9922. And the slope is -2.8/KHz , while
0Rf is 2.45.
(a) (b)
Fig. 11 Simulation result for antenna with FR4 substrate. (a) Simulated different S11
curves at different strain levels. (b) Linear relationship between resonance frequency
and strain in longitudinal direction
Fig. 12 shows, the sensitivity in width direction is only -0.057 /KHz , which is only 2.1% of the sensitivity in longitudinal direction. Compared with the antenna using RT-5870 substrate, width changes in the antenna using FR4 substrate have less influence in resonance frequency shifting than the antenna with RT-5870 substrate.
Fig. 10 The different impacts of length change and width change to resonance
frequency shifting (FR4 substrate)
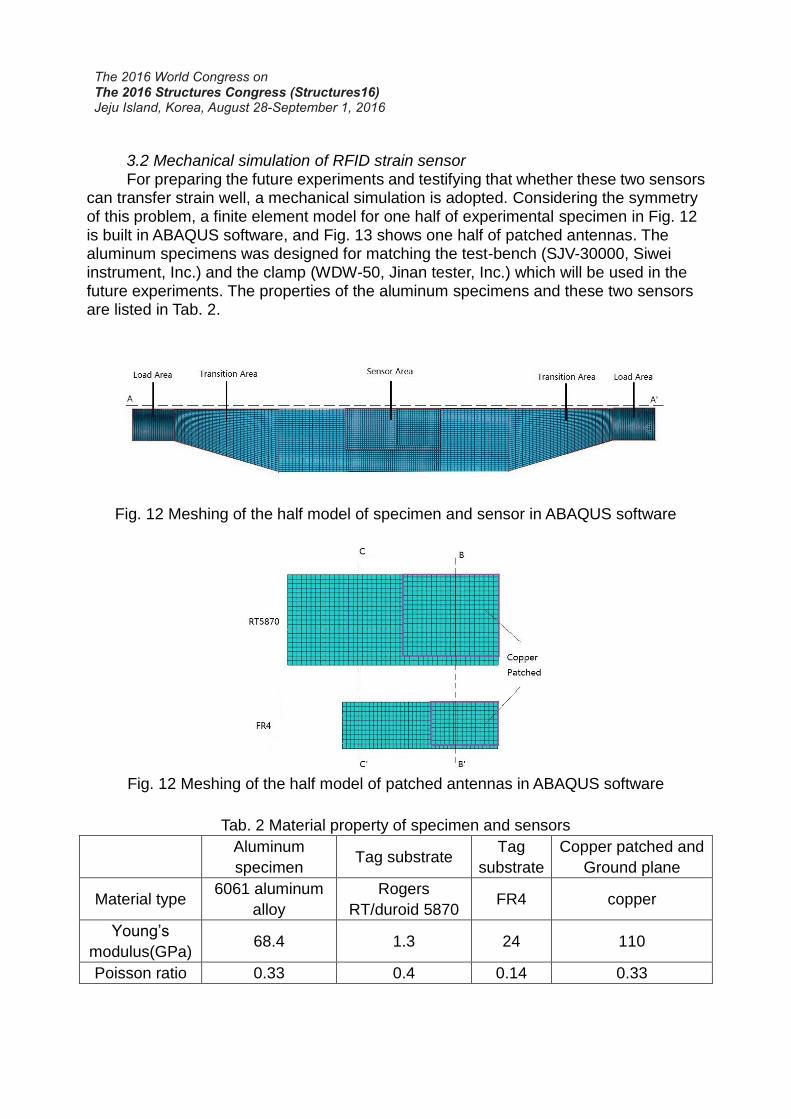
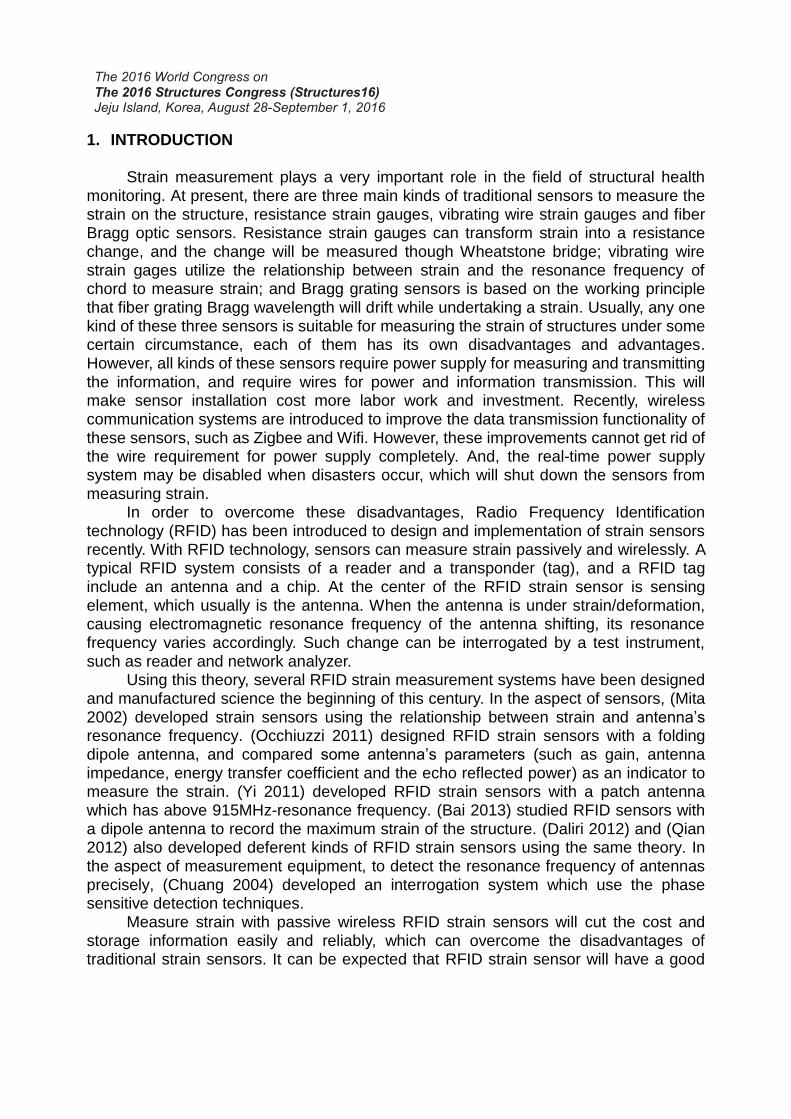
3.2 Mechanical simulation of RFID strain sensor For preparing the future experiments and testifying that whether these two sensors can transfer strain well, a mechanical simulation is adopted. Considering the symmetry of this problem, a finite element model for one half of experimental specimen in Fig. 12 is built in ABAQUS software, and Fig. 13 shows one half of patched antennas. The aluminum specimens was designed for matching the test-bench (SJV-30000, Siwei instrument, Inc.) and the clamp (WDW-50, Jinan tester, Inc.) which will be used in the future experiments. The properties of the aluminum specimens and these two sensors are listed in Tab. 2.
Fig. 12 Meshing of the half model of specimen and sensor in ABAQUS software
Fig. 12 Meshing of the half model of patched antennas in ABAQUS software
Tab. 2 Material property of specimen and sensors
Aluminum
specimen Tag substrate
Tag
substrate
Copper patched and
Ground plane
Material type 6061 aluminum
alloy
Rogers
RT/duroid 5870 FR4 copper
Young’s
modulus(GPa) 68.4 1.3 24 110
Poisson ratio 0.33 0.4 0.14 0.33

In this model, the superglue between the sensor and aluminum specimen is neglected, because compared with the thickness of substrate and cladding, the thickness of superglue is very small. To simulate the effect of clamp, there are pressures and frictions in the load area, and the forces is 10KN which not big enough to make the specimen yield. The high-resolution elements occupy whole model. The solid elements are used in the substrate and the specimen, while the shell elements are used in copper patched and ground plane. And the meshing in RFID sensor is finer than specimen. According to Eq. (2), the resonance frequency shifting is mainly determined by the longitudinal strain of the copper patched in top side of sensor. So, it is important that the transfer of longitudinal strain from the grounding plane in bottom side to the copper patched in top side. Fig. 13 shows the longitudinal strain field in both copper patched
and ground plane, and Fig. 14 shows the longitudinal strain of substrate in longitudinal section (A-A’ section).
Fig. 13 Simulation result of longitudinal strain field of copper patched and ground plane
of two antennas (vertical view)
Fig. 14 Simulation result of longitudinal strain field of substrate of two antennas (lateral view in A-A’ section)
For the antenna with RT-5870 substrate, on the line BB’, the strain level of copper patched is approximately 545 , and the strain level of ground plane is approximately

635 , the strain transfer efficiency is above 86%. On the line CC’, the strain level of ground plane is approximately 705 . In the substrate, the strains of most area are close to top and bottom copper, but extremely high strain levels appear in area A, the maximum is 1613 .For the antenna with FR4 substrate, on the line BB’, the strain level of copper patched is approximately 575 , and the strain level of ground plane is approximately 625 , the strain transfer efficiency is above 92%. On the line CC’, the strain level of ground plane is approximately 680 . In the substrate, the distribution of strain is more uniform than the antenna with RT-5870 substrate, no extremely high strains appear.
The reasons why strain fields of these two antennas are like these are that the area of the copper patched is about only half of the area of ground line and the Young’s modulus of substrate is far less than the Young’s modulus of copper. It cause the stiffness in B-B’ section is bigger than the stiffness in C-C’ section, which affects the
strain fields of sensors. For the FR4 substrate, its Young’s modulus is above 20 times of the Young’s modulus of RT-5870 substrate, which weaken this effect. By reduce the size of substrate and ground plane, which means adjust the size and shape of patching line, the strain transfer efficiency can be improve and the strain field can become more uniform.
4. CONCLUSION
In this research, two 2.4GHz rectangular folded patched antennas are designed and optimized. By electrical simulations and mechanical simulations, the results show that:
(1) Compared with RT-5870 substrate, using FR4 substrate can reduce the size of RFID sensor.
(2) For both two antennas, the results indicate good linearity between the resonance frequency shifting and the longitudinal strain, and the slopes are close to the opposite numbers of the initial resonance frequencies of antennas.
(3) The width strains have less impact to resonance frequency change. And for the antenna with FR4, this sensitivity is far less than the antennas with RT-5870.
(4) According to the mechanic simulation, the strain field of the antenna with FR4 substrate is more uniform than another antenna, and strain transfer efficiency of it is higher than the antenna with RT-5870 substrate.
(5) For ensuring a better strain transfer efficiency, the area of copper patched should be closed to the area of ground plane.
ACKNOWLEDGMENTS
This work is supported by the Fundamental Research Funds for the Central Universities, and the National Natural Science Foundation of China (No. 51478356).
REFERENCES

Bai, L., (2013). “RFID sensor-driven structural condition monitoring in integrated building information modeling environment”. University of Maryland.
Canestri, F. and Matsuoka, H., (2007). “RFID application overview and testing requirements”. Agilent Technologies.
Chuang, J., Thomson, D. J., and Bridges, G., (2004) “Wireless strain sensor based on resonant RF cavities” Smart. Struct. Mater. , Proc. SPIE Vol. 5390, 574-584.
Daliri, A., Galehdar, A., John, S., et al., (2012). “Wireless strain measurement using circular microstrip patch antennas”. Sens. Actuators, A. , Vol. (184): 86-92.
Mita, A. and Takahira, S., (2002). “Health monitoring of smart structures using damage index sensors”. Smart. Struct. Mater. , Proc. SPIE Vol. 4696, 92-99
Occhiuzzi, C., Paggi, C. and Marrocco, G., (2011). “Passive RFID strain-sensor based on meander-line antennas”. IEEE. Trans. Antennas. Propag. , Vol. 12(59): 4836-4840.
Qian, Z., Tang, Q., Li, J., et al. (2012). “Analysis and design of a strain sensor based on a microstrip atch antenna”. Proceedings of 2012 ICMMT International Conference, Shenzhen.
Yi, X., Wu, T., Wang, Y., Leon, R.T., et al., (2011). “Passive wireless smart-Skin sensor using RFID-based folded patch antennas”. Int. J. Smart. Nano. Mater. , Vol. 2(1), 22-38.
View publication statsView publication stats