Embed Size (px)
Citation preview

1420
S. HBG. 9-990
FAIRNESS AND THE REAGAN TAX CUTS
HEARINGBEFORE THE
JOINT ECONOMIC COMMITTEECONGRESS OF THE UNITED STATES
NINETY-EIGHTH CONGRESS
SECOND SESSION
JUNE 12, 1984
Printed for use of the Joint Economic Committee
U.S. GOVERNMENT PRINTING OFFICE
88-M7 0 WASHINGTON: 1984

JOINT ECONOMIC COMMITTEE
[Created pursuant to sec. 5(a) of Public Law 304, 79th Congress]
SENATE
ROGER W. JEPSEN, Iowa, ChairmanWILLIAM V. ROTH, JR., DelawareJAMES ABDNOR, South DakotaSTEVEN D. SYMMS, IdahoMACK MATTINGLY, GeorgiaALFONSE M. D'AMATO, New YorkLLOYD BENTSEN, TexasWILLIAM PROXMIRE, WisconsinEDWARD M. KENNEDY, MassachusettsPAUL S. SARBANES, Maryland
HOUSE OF REPRESENTATIVES
LEE H. HAMILTON, Indiana, Vice ChairmanGILLIS W. LONG, LouisianaPARREN J. MITCHELL, MarylandAUGUSTUS F. HAWKINS, CaliforniaDAVID R. OBEY, WisconsinJAMES H. SCHEUER, New YorkCHALMERS P. WYLIE, OhioMARJORIE S. HOLT, MarylandDANIEL E. LUNGREN, CaliforniaOLYMPIA J. SNOWE, Maine
DAN C. RoBERTS, Executive DirectorJAMES K. GALBRAITH, Deputy Director
(II)

CONTENTS
WITNESSES AND STATEMENTS
TUESDAY, JUNE 12, 1984Page
Jepsen, Hon. Roger W., chairman of the Joint Economic Committee: Open-ing statement ------------------------------------------------------- 1
Roth, Hon. William V., member of the Joint Economic Committee: Openingstatement--------------------------------------------------------- 2
Roberts, Paul Craig, Center for Strategic and International Studies_----- 3Gwartney, James, professor, Florida State University------------------ 44Rahn, Richard, vice president and chief economist, U.S. Chamber of Com-
merce ------------------------------------------------------------- 78Pratt, Lawrence, economic journalist, American Institute for Economic
Research---------------------------------------------------------- 91Vedder, Richard K., professor, Ohio University, accompanied by Lowell
Gallaway, professor, Ohio University--------------------------------- 104
SUBMISSIONS FOR THE RECORD
TUESDAY, JUNE 12, 1984
Gwartney, James: Prepared statement-------------------------------- 47Pratt, Lawrence: Prepared statement, together with attachments_-.____ 93Rahn, Richard: Prepared statement-SO _______-_______________ 80Roberts, Paul Craig:
Prepared statement --------------------------------------------- 6Articles entitled:
"What Ronald Reagan Doesn't Know About His Own Achieve-ments" -___________________________________________________ 36
"Tax Cut Debate Shows Reagan Staff Conflicts"---------------_ 40Vedder, Richard K., and Lowell Gallaway: Joint prepared statement_---- 108
(in)

FAIRNESS AND THE REAGAN TAX CUTS
TUESDAY, JUNE 12, 1984
CONGRESS OF THE UNITED STATES,JOINT EcoNoxic CGommiEE,
Washington, DO.The committee met, pursuant to notice, at 10 a.m., in room SR-428A,
Russell Senate Office Building, Hon. Roger W. Jepsen (chairman ofthe committee) presiding.
Present: Senators Jepsen, Roth, and Symms.Also present: Dan C. Roberts, executive director; Charles H. Brad-
ford, assistant director; and William R. Buechner and Christopher J.Frenze, professional staff members.
OPENING STATEMENT OF SENATOR JEPSEN, CHAIRMAN
Senator JEPSEN. It gives me great pleasure to welcome our distin-guished witnesses testifying before us today on "Fairness and theReagan Tax Cuts." The misinformation about this issue, spread forover 3 years, has established a need to set the record straight.
The Economic Recovery Tax Act of 1981 was designed to restoreincentives to work, to save, and to invest. Once implemented, the taxreductions would help lay the foundation for a sustained economicexpansion without high inflation. Unfortunately, the schedule of taxcuts was delayed for most taxpayers during congressional considera-tion of this tax legislation. However, part of an alternative measure,dropping the top marginal rate from 70 percent to 50 percent effective1982, was incorporated in ERTA. While watered down somewhat byCongress, ERTA did lift some of the tax burden then stifling theAmerican economy.
Though sidetracked for a while by an unduly harsh monetary policy,the current economic expansion has been remarkably robust as well asnoninflationary. The main objective of the administration's fiscal pol-icy-economic recovery-has been achieved. The stagfiation of thelate 1970's and early 1980's is now only a bad memory. Nonetheless,partisan attacks on the 1981 tax legislation continue. Opponents ofthe legislation make the argument that even when fully effective, theReagan tax cuts primarily benefit the rich. These critics allege thatunder ERTA, an enormous amount of tax revenues is being givenaway to the wealthiest taxpayers, thereby shifting the tax burdenonto the middle- and lower-income taxpayers. This morning we willcarefully examine this controversy over the impact of the marginaltax rate reductions on the tax payments of various income groups.
(1)

2
There is nothing new about the idea that marginal tax rates can behigh enough to shrink the tax base and depress tax revenues. In 1924,Treasury Secretary Andrew Mellon observed:
The history of taxation shows that taxes which are inherently excessive arenot paid. The high rates inevitably put pressure on the taxpayer to withdrawhis capital from productive business and invest it in tax-exempt securities or tofind some other lawful methods of avoiding the realization of taxable income.The result is that the sources of taxation are drying up, and capital is beingdiverted into channels which yield neither revenue to the government nor profitto the people.
The historical record suggests the validity of Mellon's views. Afterthe Mellon-1921, 1924, and 1926-and Kennedy-1964-65-tax cuts,the amount and share of taxes paid by the rich increased. Today wewill examine current revenue trends to see how well Mellon's theoryis holding up.
In closing, I would like to recognize the leadership demonstrated bySenator Roth in reducing the tax burden on the American people.The Roth-Kemp bill laid the foundation for a robust and sustainedeconomic expansion and job creation. Just in the last year, 5.5 millionnew jobs have been created and, as well all know, today we have morepeople employed in this country than we have ever had in our history.
Welcome, Senator Roth. You were a prophet and a pathfinder andyou blazed the way. Do you have any remarks I
OPENING STATEMENT OF SENATOR ROTH
Senator RoTr. Well, thank you, Mr. Chairman. Let me, if I may,just take a couple of minutes.
First of all, I'd like to express my appreciation to you for holdingthese hearings today and bringing such a distinguished panel to dis-cuss what I consider a very unfair and biased attack on the wholeapproach of lowering marginal tax votes.
I think behind all these attacks lies one very basic concept and thatis, bigger taxes are better. I really think the reason you see these verytough and inaccurate attacks coming from time to time is that thosewho believe in big government think you have to have high taxes,when in fact I think you probably get more revenue if you have agrowing economy.
Now I would just like to express some current concerns that I'vehad over the last 3 or 4 years since we did adopt the Kemp-Roth or Roth-Kemp tax cut, whatever you may want to call it. Really,it's Reaganomics: He's the one that put it through. But I am con-cerned that since then we have had a number of tax increases andthat basically, instead of being concerned in committee with the ques-tion of what kind of an impact do these taxes have on the economy, wehave only had one criterion, and that criterion has been how muchrevenue does it raise ?
We have had four or five tax increases since the big one at the begin-ning, and I don't know how the private businessman in the privatesector can plan. I can tell you right now they are already talking aboutanother tax proposal next year. If we have a tax reform next year,it's important that the primary criteria be how do we continue thisrecovery, and how do we maintain long-term growth.

3
I am going to have some proposals in the near future, Mr. Chair-man. I am a strong believer that we have got to continue the path oflowering taxes. The flat tax has a lot of merit. I don't think we willever arrive at that. But I also believe that we've got to build some realincentives to savings and that has to be a key part to any reform.
But I do want to go back to expressing my appreciation to you forhaving these hearings. I'd just like to make one final comment ifI might.
Talking about the fairness issue, it seems to me that nothing ismore unfair than a lack of economic growth because when the economyis stagnant it's the people on the lower end of the economic scale thatmost suffer. They are the ones that lose the jobs. They are the ones thatare paid less. So that any economic policy that increases economicgrowth creates opportunity. It's a strong recovery that gives jobs andthat's the point you made in your opening statement, Mr. Chairman,where you said that several million new jobs have been created.
But I was interested that in September 1983 in the National TaxJournal, there was an article by Alan Sinai, who has been in the pastquite hostile to so-called supply-side policy, yet he points out thatthe Roth-Kemp tax cuts were very influential in stimulating growthand he claims that real GNP in 1981 would have been $5 billion lessabsent the Roth-Kemp tax cuts and ACRS, and $24.6 billion less in1982. According to his research, personal savings would have been$12.7 billion less in 1981, $33 billion less in 1982, $86 billion less in1983, and $86.1 billion less in 1984.
According to this research, total investment would be less by $56.1billion over the period 1981-85 if the 1981 tax bill had not passed.
As I say, I think one of the interesting things is that here's a manwho was not an early supporter of our tax proposals, but he says nowthat it has played a significant role.
Thank you, Mr. Chairman.Senator JEPSEN. I thank you, Senator.Now we will go to the panel. We have Mr. Paul Craig Roberts, Cen-
ter for Strategic and International Studies; Richard Rahn, U.S.Chamber of Commerce; James Gwartney, professor from FloridaState; Richard K. Vedder, professor from Ohio University; and Law-rence Pratt, American Institute for Economic Research.
As you're seated, I think we should just follow from my right tomy left, and that calls first for the testimony of Paul Craig Roberts.The Chair would advise the distinguished panel members that yourprepared statements will be entered into the record. You may proceedin any manner you so desire.
STATEMENT OF PAUL CRAIG ROBERTS, CENTER FOR STRATEGICAND INTERNATIONAL STUDIES
Mr. ROBERTS. Mr. Chairman, I have a very brief opening statement.I would like to congratulate you for holding this hearing. Economic
growth is the only hope we have of meeting our national defense needs,maintaining the social security system, and absorbing the millions ofimmigrants that enter our country. Yet the Reagan-Kemp-Roth taxcut, which improved the longrun growth potential of our economy, has

4
been viciously attacked by people who may be misinformed or whomay be lying for political reasons.
The charge has been made that the Reagan-Kemp-Roth tax cuts are"tax cuts for the rich," and a campaign has been launched to portraythe President as "Reagan Hood" who robs the poor to give to the rich.All of the factual evidence contradicts these charges, which have fig-ured predominantly in the Washington Post.
Internal Revenue Service statistics clearly show that following thereduction in the top marginal tax rate from 70 to 50 percent, upperincome taxpayers are paying more in income taxes, both absolutely andas a percentage of total income tax collections. Lower income taxpayersare now paying less, both absolutely and as a percentage. The unam-biguous result was to shift the burden of the income tax toward higherincome taxpayers, not to create a "windfall for the rich." This resultwas correctly predicted by supplyside economists, and it repeats thepattern of the Kennedy and Mellon tax cuts.
Faced with the evidence, opponents of the tax cuts tried to cover itup. They argued that the tax burden on lower income people hadfallen because they lost their jobs and had no income to report as aresult of Reagan's economic policies. And they attributed the shift inthe tax burden toward upper income people to rising capital gainsincome due to the bull market.
These specious arguments are an indication that some people preferto discredit the tax cuts than to look carefully at the evidence. As theIRS figures show, less income was reported in lower brackets in1982-as compared to 1981-because of movement from lower bracketsto higher ones and because Individual Retirement Accounts [IRA's]expanded fivefold.
Capital gains income is too small a share of total income to accountfor the increase in taxes paid by upper income people. Normally, reces-sion impacts business income worse than personal income. Since busi-ness income is a larger share of upper bracket income, the drop in thetax burden on lower income people and the rise in tax burden on upperincome people cannot be attributed to the affects of the recession.
Mr. Chairman, the current economic recovery has some unusualfeatures that can only be attributed to the success of the supplysidetax cuts. During the first year of recovery measured from the fourthquarter of 1982 through the fourth quarter of 1983, the growth in con-sumption lagged the growth in the real GNP. Clearly, it was not aconsumption-led Keynesian-style recovery.
In contrast, real gross private domestic investment grew muchfaster than GNP. Nonresidential fixed investment contributed aboutthree times as much to the growth of real GNP than is typical of thefirst year of recovery. This is an indication that the economy's abilityto grow is increasing, which should help to maintain productivity andto ward off the capacity bottlenecks that lead to the resumption ofprice pressures. The swift decline in the unemployment rate from thehigh of a bad recession is record-level performance and exceeds allpredictions.
The mistaken economic policies of the 1970's, which pumped updemand while restraining the response of supply, brought persistentinflation to the U.S. economy and resulted in stagflation. The initialsupplyside reforms of the Reagan administration are a first step in

5
regaining economic health. We are not likely to take further necessarysteps if these positive policies are denigrated and their results mis-represented. The evidence presented at this hearing today will helpto keep the record honest.
Mr. Chairman, this completes my oral statement. I am submittingfor the hearing record a longer prepared statement entitled "Taxation,Relative Prices, and Capital Formation," which will later be publishedby the Pacific Institute for Public Policy Research in a book on taxa-tion and capital markets. I request permission to make revisions in mystatement, keeping, of course, to the committee's regular publicationschedule.
Mr. Chairman, I also would like to submit for the record a copyof a recent article by George Gilder and a recent article by WarrenBrookes.
Senator JEPSEN. They will be entered into the record. I thank you.[The prepared statement of Mr. Roberts, together with the articles
referred to, follows:]

6
PREPARED STATEMENT OF PAUL CRAIG ROBERTS
Taxation, Relatiue Prices, and Capital Formation
While the concept of relative prices is a foundation of
microeconomic theory, it has been ignored by Keynesian1/
macroeconomic policy. As a result, capital formation suffered.
Capital formation requires that real resources be saved from
current consumption and employed in investment. In the case of
human capital, time is a resource that must be diverted from
leisure and invested in improving skills. These decisions, which
determine the rate of capital formation, are influenced by
relative prices.
To begin with, consider the relative price that determines
the allocation of income between consumption and saving. The
cost to the individual of allocating a unit of income to current
consumption is the future income stream given up by not saving
and investing that unit of income. The value of that income
stream is determined by marginal tax rates. The higher the tax
rate, the less the value of the income stream. High tax rates
make consumption cheap in terms of foregone income, so saving
declines, leading to less investment.-
Consider a husband facing a 95 percent marginal tax rate on
investment income. He has, for example, the choice of investing
$20,000 at 10 percent or buying his wife a diamond necklace. On
a pre-tax basis the cost of giving his wife the necklace is to
*
I would like to thank Peter Barlerin, my research assistant, forhis help in preparing this article.

7
forego an income stream of $2,000 a year--not an insignificant
sum. Aftertax, however, the value of the additional income
stream is only $100 a year (the 5 percent of $2,000 remaining
after taxes). His tax bracket reduced the cost of the necklace
to one-twentieth of its pre-tax cost.
While this may seem like an unrealistically high tax rate,
until just a few years ago the top marginal income tax rate on
investment income in Great Britain was 98 percent. This explains
why there are so many Rolls.Royces and other fine automobiles on
the streets of London. The Rolls Royces have been mistaken as
signs that the rich are prospering, when in fact they are warning
signals that the tax rate on investment income is excessive. The
effect was to reduce the price of current consumption in terms of
foregone income almost to zero. As inflation and real economic
growth pushed taxpayers into higher tax brackets, consumption
became progressively cheaper, and saving more expensive, for
large numbers of people.
The other important relative price governs people's
decisions about how they allocate their time between work and
leisure or between leisure and improving their human capital by
upgrading skills. The cost to the individual of allocating an
additional hour to leisure is the current earnings sacrificed by
not working (for example, overtime on Saturdays) or the future
income given up by not improving human capital. The value of the
foregone income is determined by the rate at which additional
income is taxed. The higher the marginal tax rates, the cheaper
the price of leisure. Work attitudes deteriorate, absenteeism

8
rates go up, people are unwilling to accept overtime work and
devote less effort to improving work skills. In other words,
labor supply declines. With less labor to work with, the
marginal productivity of capital falls. This reduces capital
formation, and economic growth stalls.
High marginal tax rates shrink the tax base because they
discourage people from earning additional taxable income.
Professionals who reach the 50 percent tax bracket early in the
tax year are faced with working the additional months of the year
for only half of their pretax earnings. Such a low reward for
effort encourages professionals to share practices in order to
reduce their working hours and enjoy longer vacations. A tax
rate reduction would raise the relative price of leisure to
professionals and would give them the incentive to earn more
taxable income and increase the supply of professional services.
The effect of tax rates on the decision to earn additional
taxable income is not limited to professionals in the top
bracket. Carpenters and bricklayers prefer some of their
earnings to be paid "off the books" so they can avoid declaring
the portion of their income which falls into their highest
marginal tax bracket.
An alternative to taxable income is to use labor services to
produce non-taxable household services. Consider a carpenter
earning $100 a day whose take-home pay is $75. Suppose that his
house needs painting and that he can hire a painter for $80 a
day. Since the carpenter's take-home pay is only $75, he saves
$5 by painting his own house. In this case the tax base shrinks
by $180--$100 that the carpenter chooses not to earn and $80 that

9
he does not pay the painter. The higher the marginal tax rates,
the more likely it is that people can increase their income by
using their resources in non-market activities or in the
underground economy.
The progressive income tax is perverse because it mismatches
effort and reward. Each additional effort comes on top of
existing effort, so the disutility to the individual of
additional effort is high. But since the income from the
additional effort goes on top of existing income, it is taxed at
higher rates. As efforts rise, rewards fall. The tax system is
not only perverse but self-defeating. By raising the price of
activities that expand the tax base, progressive tax rates reduce
the tax base and frustrate the goal of raising revenues.
Tax Bias Against Saving
Capital formation is subject to additional burdens when
saving is taxed twice--once when it is earned and again when it
yields an income stream. If there is no deduction either for the
initial saving or for the income stream generated by the saving,
the portion of income saved is taxed at a higher effective rate2/
than the portion of income used for current consumption. The
income tax bias against saving is illustrated in the following
example. In the absence of taxes, the individual who earns an
additional $1,000 must decide whether he wants to consume it now
or save it at, for example, a 10 percent interest rate. The cost
of current consumption in terms of foregone income is $100 a
year. Now assume that the same individual is in a 50 percent
marginal income tax bracket, so that for every additional $1,000

10
he earns he is allowed to keep $500.
If the income stream from saving was not taxed, he would be
faced with the same relative price: the cost of $500 in current
consumption is a foregone income of $50 annually. But since the
income from saving is also taxed, the cost of consumption in
terms of foregone income drops by half to only $25 annually. For
an individual in the 50 percent marginal income tax bracket, the
inclusion of saving in the tax base cuts the relative price of
current consumption in half.
The disincentives in the progressive tax system are
aggravated by inflation, which pushes people into higher
marginal income tax brackets even though their real pre-tax
income does not change. Bracket creep served as an undebated and
hence ideal tax increase from the standpoint of big spenders in
the government, but its effects have been devastating to the
economy. In 1965 a median income family of four faced a 17
percent marginal income tax rate on personal income. By 1981,
the rate had jumped to 24 percent--a 41 percent increase in the
tax rate on additions to the family's income. If social security
taxes and state income taxes are included, the median income
family today is in the 40 percent marginal income tax bracket or
higher. A family with twice the median income saw its federal
marginal tax rate nearly double, rising from 22 percent in 1965
to 43 percent in 1981. The steep increases in marginal tax rates
hurt saving particularly, because income from saving and
investment is added to wage and salary income and is
automatically taxed at the taxpayer's top rate.

11
Tax law has interacted with inflation to erode saving in
other ways as well. Inflation favors borrowers at the expense of
lenders. A person who borrows $1,000 for one year at 10 percent
pays back $1,100 next year. If the inflation rate is also 10
percent, the $1,100 paid back purchases no more merchandise than
the $1,000 the year before, so the real, or inflation-adjusted,
interest rate is zero. It would seem like a reasonable goal for
tax policy to offset the unfair advantage inflation presents to
borrowers, but in fact tax policy has often worked in the
opposite direction to reinforce the advantage of the borrowers.
Borrowing cost are lowered by the interest deduction, which
rises with the marginal tax rate. As the marginal tax rate
increases, the price of saving increases while the price of
borrowing falls. The interest deduction for the 50 percent
marginal tax bracket, for example, cuts the aftertax interest
rate in half. When combined with inflation, interest
deductability frequently produces negative real aftertax interest
rates--a form of reverse usury. The government has offered many
carrots to borrowers, reserving the stick for savers.
Government-imposed ceilings on interest rates, such as
Regulation Q, forced a negative interest rate on savers when the
inflation rate rose above the fixed interest rate. Many people
found that the only way they could "save" at all was to go into
debt. The many disincentives to save that have afflicted the
economy, such as the double taxation of saving, bracket creep,
interest deductability and interest rate ceilings, come on top of
the bias against saving imposed by high marginal tax rates.

12
How Taxation Crowds Out Investment
As the price of saving increased rapidly relative to
consumption and borrowing, it is not surprising that the personal
saving rate averaged only 6.1 percent between 1976 and 1980--one
of the worst five-year periods in the postwar era and
substantially below the 7.8 percent average rate from 1966 to
1975. The decline in the saving rate reduced funds available to
the capital markets by $130 billion during 1976-80--a sum equal
to half of the cumulative budget deficits for the period.
Business saving and investment fared equally poorly.
Depreciation laws did not permit business to write off capital
investments rapidly enough to recover replacement costs for worn
out plant and equipment. A large portion of business saving that
should have gone towards the replacement of plant and equipment
was instead taxed away by the government. In the non-financial
corporate sector, the replacement values of inventories and fixed
assets were understated by $262 billion during 1976-80--a sum
equal to the cumulative budget deficits for the period. Note
that the total preemption of private sector saving by the tax
system was 50 percent greater than the preemption of private
saving by the federal deficit.
Understating depreciation overstated corporate profits,
which raised the effective corporate tax rate above the statutory
rate. When book depreciation allowances are adjusted to a
replacement cost basis, corporate profits were taxed at a higher
rate than the statutory rate for more than a decade, averaging 56
percent in the 1970s and reaching 77 percent in 1974 (see table
1).
I, II

13
As in the case of individuals, the tax system encouraged
businesses to accumulate debt instead of equity. Because
payments to equity are made from taxable income but debt service
costs are tax deductible, businesses joined individuals in
becoming 'debt junkies.'
Table 1Effective Corporate Tax Rates
1960 54.1%1961 53.41962 47.01963 46.21964 43.31965 42.01966 43.31967 43.31968 49.31969 53.81970 58.41971 53.61972 50.41973 55.91974 76.81975 53.91976 53.61977 49.71978 50.91979 56.41980 58.6
Nonfinancial corporate profits tax libalibities as percent ofcorporate profits with inventory valuation adjustment anddepreciation of fixed assets adjusted to replacement costs atdouble-declining balance over 75 percent of Bulletin F servicelives.
When the term 'crowding out" is used by conservative
Republicans, it is intended to convey the image of private
investment being pushed out of financial markets by Treasury
borrowing forcing up interest rates. But government also crowds
out by taxation. As noted above, during the Carter
Administration, the tax system crowded out private saving by an
38-037 0 - 84 - 2

14
a/amount substantially greater than the budget deficit. From an
investor's standpoint, interest rates are deductible, but tax
rates are not. A 50 percent tax rate doubles the rate of return
necessary for an investment to pay out. If an investor in the 50
percent marginal tax bracket requires a 10 percent return, he
will only undertake new projects that yield, before tax, a 20
percent return or higher. All investment projects that fall
between the 10 and 20 percent rate of return are effectively
crowded out by taxation.
The adverse change in relative prices, which made current
consumption and leisure cheaper in terms of foregone income,
followed from a demand management policy that saw taxation as a
tool to raise or lower the level of aggregate demand or spending
in the economy. In this view marginal tax rates do not carry any
significance. They can be as high as egalitarians and
politicians demand as long as government spends the money. The
effects of tax policy on the relative prices that influence
capital formation were simply ignored.
The theory behind the Keynesian economic model is best
reflected in the two alternative prescriptions for expansion--tax
cuts or increases in government spending. Tax cuts are seen to
have less impact or 'bang for the buck" because people save a
portion of their tax cuts while the government could be counted
on to spend the full amount. Keynesians believe that demand
creates its own supply and that if there is an adequate level of
aggregate demand in the economy, supply moves to meet it. With a
tax policy that concentrated on average tax rates and ignored the
marginal rates, no notice was taken of the rising disincentive to

15
produce. Consequently, demand pressures increasingly resulted in
increases in prices instead of real output.
The Keynesians believed that too much saving in the economy4/
was more of a danger than too little. The Keynesian bias
against saving led to declines in saving rates, capital
formation, and productivity growth and to a deteriorating
economic performance. The Keynesian Phillips curve postulated an
inverse relationship between inflation and unemployment--if
society wants less inflation it has to put up with more
unemployment. Over time the Phillips curve began to change its
slope so that there arose a direct relationship--more inflation
meant more unemployment and vice versa. The year 1979 capped a
four-year period of expansion, but the unemployment rate in that
year was nearly one full percentage point higher than the
recession year of 1970. From 1979's inflation rate of 13.3
percent, one could not help but look back wistfully to 1970, when
the inflation rate of 5.9 percent was regarded as so
'intolerable' that the Congress passed legislation enabling the
President to impose wage and price controls.
Neglect of the supply-side of the economy caused
productivity growth to decline. The rate of growth of labor
productivity fell off sharply starting in the late 1960s. The
annual growth of output per worker averaged 3.1 percent for the
two decades 1948-68 but declined to 2.1 percent between 1968-73.
From 1973-80, productivity growth in the private business sector
averaged only 0.6 percent per year--one fifth of the rate over
the 1948-68 period. Productivity actually declined in 1979 and

16
1980, when cyclical developments combined with a declining trend
in productivity growth.
The rate of growth in the capital-labor ratio and the real
net capital stock similarly declined. The capital/labor ratio is
the amount of capital available to each-worker in the labor
force. The more capital a worker has access to, the higher the
marginal productivity of his labor.
Between the years 1948-68 the capital-labor ratio grew at an
average annual rate of 3.2 percent. From 1968-73 it slowed to 1.7
percent and from 1973-80 it grew on average only 0.7 percent a
year. The standard explanation for the decline in the capital-
labor ratio is a rapidly growing labor force due to the coming of
age of the baby-boom generation and the influx of women and
immigrants as job-seekers.
The growth of the work force may serve as a partial
explanation, but it masks a slowdown in the rate of capital
formation. The slowdown in the growth of capital formation
occurred even though the ratio of gross business investment to
GNP has been increasing over the years. The measure of gross
investment is misleading, because an increasing share consists of
capital replacement. The composition of capital spending has
shifted over the years to shorter-lived assets, which depreciate
at a faster rate.
The gross investment measure also reflects a larger volume
of capital being depreciated. The share of net investment has
trended downward, and a portion of that net investment has been
directed towards meeting federally mandated regulations and
environmental standards. Annual growth of the net capital stock
38-037 25

17
averaged only 3.3 percent over the 1973-80 period, one percentage
point less than earlier in the postwar period.
Many people blame the Arab oil embargo in 1973 and the
subsequent energy price increases as the major cause of our
productivity slide, but this fails to explain why our leading
trading partners, almost all of whom are more dependent on
energy imports than the United States, outperformed us in
productivity growth.
International productivity data for the manufacturing
sectors prepared by the U.S. Department of Labor show a 1.7
percent rate of growth for the United States between 1973 and
1982 compared with 7.2 percent for Japan, 4.5 percent for France,
3.6 percent for the Federal Republic of.Germany, 3.7 percent for
Italy and 1.8 percent for the United Kingdom. Only Canada, with
a 1.6 percent growth rate, lagged behind the United States.
Kennedy Tax Cuts and Supply-Side Growth
Theory provides a clear link between the relative price
effects of taxation, the rate of capital formation, and -the
performance of the economy, and there is important empirical
evidence to back it up. The 1964 Kennedy tax rate reductions
have been thoroughly analysed from a Keynesian perspective which
ignores the supply-side effects and the changes in relative
prices that actually took place. The economic boom that resulted
from the Kennedy tax rate reductions has been misinterpreted as a
consumption-led expansion caused by higher spending from the tax
cuts. In reality, the opposite occurred. As the chart shows,
after the marginal tax rate reduction went into effect, people

18
Real Consumer ExpendituresActual Compared with Predicted Values
from a "Keynesian" Consumption Function
Billions of1972 Dollars(Ratio Scale)
Predicted .
600_
- { Actu~~al
550 _-.
50C _ /
450 -0
196.0 1961 1962 1963 1964 1965 1966 1967
Calendar Year

19
spent a smaller percentage of their income. In 1964, actual
consumer expenditures dipped below the trend rate predicted by a
Keynesian consumption function. By 1967, consumption was at
least $17.5 billion below the previous trend--a sum larger than
the size of the personal tax cut (measured in constant dollars).
People were actually consuming a smaller percentage of their
income and saving a larger percentage after the tax rate
reduction than before. Following the tax reduction there was a
signifcant increase in the real volume of personal saving, and
the personal saving rate reversed its decline since the early
1960s and rose sharply. The personal saving rate remained high
for nearly a decade until rising marginal tax rates pushed it
down.
In 1964 real personal saving rose $6.6 billion above the
trend growth prior to the reduction in marginal tax rates. The
gain in saving was 74 percent of the tax cut. In the next two
years saving increased $10.2 billion and $10.8 billion above the
previous trend, a gain equal to 72 percent of the tax cut. In
1967 saving was $19 billion above the previous trend--a gain
equal to 121 percent of the size of the tax cut.
The saving increase released real resources from consumption
and allowed a rapid growth of business investment. In real
terms, capital spending (for both the expansion of the capital
stock and the replacement of worn out capital stock) had grown at
an annual rate of 3.5 percent during the 1950s and early 1960s
through 1962. The remainder of the 1960s saw real capital
spending rise over twice as fast, increasing 7.2 percent

20
annually. The rate of growth from 1963 to 1966 was especially
marked. While growth was high in the corporate sector, small
business investment showed the greatest improvements.
The acceleration in investment greatly enhanced the
economy's ability to produce. The net stock of capital had grown
3.8 percent annually between 1949 and 1963, but with the tax cuts
it rose to a 5.5 percent growth rate for the remainder of the
decade. Keynesian economists claim that the investment boom
resulted from the investment tax credit, but the sharp rise in
investment could not have taken place if consumers had not
released resources from consumption by saving a larger share of
their incomes.
Keynesians developed a relationship between actual GNP and
what they call "potential' GNP. The relationship is based on
their belief that economic growth is determined by the level of
demand. The government can increase demand, either with a tax
cut or a boost in government spending, and thereby push actual
GNP closer to potential GNP. Once the ceiling of potential or
full-employment GNP has been reached, the Keynesians believe that
further attempts to stimulate the economy will result in
production bottlenecks and inflation.
Keynesians credit the 1964 tax cut with raising GNP by $25
billion by mid-1965 and by $30 billion by the end of the year.
But Edward Denison, who is known for his Keynesian models of the
economy, estimated that the gap between actual and potential GNP
was only $12 billion--the size of the Kennedy tax cut. How could
a $12 billion gap accomodate a $30 billion expansion based on
increased demand and unused capacity? If Denison's estimate is
21
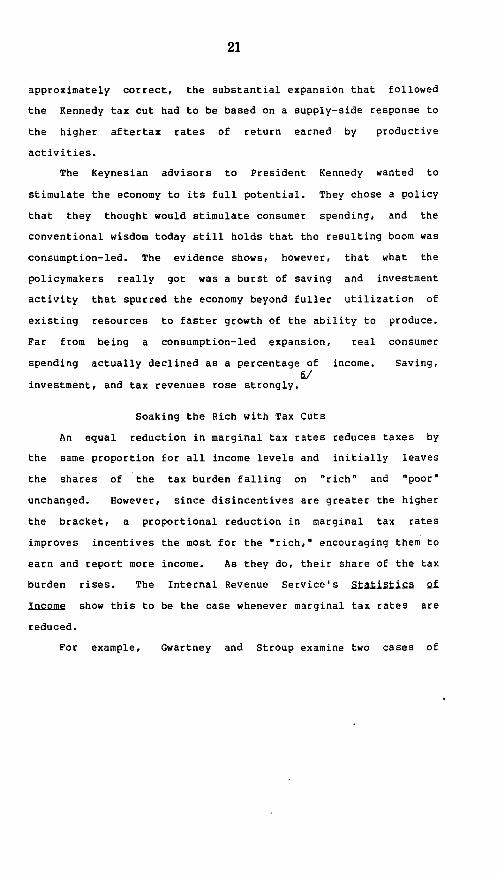
approximately correct, the substantial expansion that followed
the Kennedy tax cut had to be based on a supply-side response to
the higher aftertax rates of return earned by productive
activities.
The Keynesian advisors to President Kennedy wanted to
stimulate the economy to its full potential. They chose a policy
that they thought would stimulate consumer spending, and the
conventional wisdom today still holds that the resulting boom was
consumption-led. The evidence shows, however, that what the
policymakers really got was a burst of saving and investment
activity that spurred the economy beyond fuller utilization of
existing resources to faster growth of the ability to produce.
Far from being a consumption-led expansion, real consumer
spending actually declined as a percentage of income. Saving,
investment, and tax revenues rose strongly.
Soaking the Rich with Tax Cuts
An equal reduction in marginal tax rates reduces taxes by
the same proportion for all income levels and initially leaves
the shares of the tax burden falling on "rich' and "poor"
unchanged. However, since disincentives are greater the higher
the bracket, a proportional reduction in marginal tax rates
improves incentives the most for the "rich,' encouraging them to
earn and report more income. As they do, their share of the tax
burden rises. The Internal Revenue Service's itatiztiga Qf
Insms show this to be the case whenever marginal tax rates are
reduced.
For example, Gwartney and Stroup examine two cases of

22
proportional marginal income tax rate reductions, the Mellon tax71
cut of the 1920s and the Kennedy tax cuts of the 1960s. In the
case of the Mellon tax cut, named after Treasury Secretary Andrew
Mellon, marginal tax rates that reached 73 percent in 1921 were
reduced to a top rate of 25 percent by 1926. The effect on the
economy was positive: "The economy's performance during the 1921-
26 period was quite impressive. Price stability accompanied a
rapid growth in real output.'
Gwartney and Stroup found the shift in the tax burden
equally impressive. By 1926 personal income tax revenues from
returns reporting $10,000 or less dropped to 4.6 percent of total
collections, compared to 22.5 percent in 1921. In contrast,
the percentage of total income tax revenues from returns by
people with incomes of $100,000 or more rose to 50.9 percent in
1926 from 28.1 percent in 1921. The evidence supports the
conclusion that "as a result of the strong response of high-
income taxpayers, the tax cuts of the 1920s actually shifted the
tax burden to the higher income brackets even though the rate
reductions were greatest in this area.'
Their analysis of the Kennedy tax rate reductions (which
reduced the top rate from 91 to 70 percent) yields similar
results. In 1965, after the tax rate reductions, collections from
the highest 5 percent of income earners rose to 38.5 percent of
the total from 35,6 percent in 1963. In contrast, the proportion
of income tax revenues from the bottom 50 percent of tax returns
fell from 10.9 percent in 1963 to 9.5 percent in 1965.
In testimony before the Joint Economic Committee of

23
Congress on June 12, 1984, Gwartney noted that the Economic
Recovery Tax Act of 1981 (ERTA) is yielding similar results. The
reduction of the top marginal tax rate from 70 to 50 percent cut
the tax rates paid by high income earners by as much as 28.6
percent, but tax revenues collected from the rich increased.
Revenues from the top 1.36 percent of taxpayers, the group that
most benefited from the rate reductions, rose from $58.0 billion
in 1981 to $60.5 billion in 1982. The proportion of the total
income tax collected from the top 1.36 percent of taxpayers rose
to 21.8 percent in 1982 from 20.4 percent in 1981.
The tax liability of low income taxpayers fell both in
absolute terms and as a percent of the total. Taxes paid by the
bottom 50 percent of income earners fell from $21.7 billion in
1981 to $19.5 billion in 1982, and the share shrank from 7.6
percent in 1981 to 7.0 percent in 1982. Gwartney concludes that
far from creating a windfall gain for the rich, as some havecharged, ERTA actually shifted the burden of the income taxtoward taxpayers in upper brackets, including those whoreceived the largest rate reductions as the result of the 50percent rate ceiling.2/
This seems to be a general conclusion supported by the empirical
results of all marginal income tax rate reductions in the United
States. Far from 'soaking the rich,0 high marginal income tax
rates discourage people from making their best effort and serve
as a barrier to upward mobility and financial independence.
Economists Move to the Supply-Side
Despite the supply-side footprints left by previous tax rate
reductions, some Keynesians still argue that there is no proof
that people respond to marginal tax rate reductions by working or

24
saving more. Some Keynesians have begun to acknowledge that10/
society needs to save more, but many still see tax cuts as an
inefficient and ineffective tool. They argue that people have
relatively constant levels of saving which are inelastic to
changes in the aftertax rate of return. Similarly, they argue
that people will work no more, and perhaps even less, after a tax11/
cut because they experience an increase in aftertax income.
Several recent studies contradict this viewpoint, showing that
people can and do respond to better incentives by increasing
their saving and work efforts.
In 'Taxation, Saving, and the Rate of Interest,' Michael
Boskin found that the total elasticity of saving (income and
substitution effects combined) was positive and on the order of
0.3 to 0.4. While the size of this response has since been
disputed by other studies, his findings are nevertheless
interesting and valuable. On the basis of his research Boskin
predicted that raising the aftertax rate of return to capital
would 'increase income substantially' and 'remove an enormous
deadweight loss to society resulting from the distortion of the12/
consumption-saving choice.'
Another interesting conclusion of his study is that not only
will people respond positively to a change in the relative price
of saving but that a larger share of total income will be
transferred from capital to labor. Boskin confirms earlier
studies indicating that the elasticity of substitution between
capital and labor is less than one. If the elasticity of
substitution between capital and labor is less than one, then an
increase in the capital-labor ratio (following an increase in

25
saving) leads to a corresponding increase in labor's share of
total income. Boskin wrote that
the current tax treatment of income from capital induces anastounding loss in welfare due to the distortion of theconsumption/saving choice . . . reducing taxes on interestincome would in the long run raise the level of income andtransfer a substantial portion of capital's share of grossincome to labor.LV/
Larry Summers in a study for the National Bureau of Economic
Research modified three different theoretical models in order to
better monitor changes in saving as a result of changes in the
rate of return. Be then conducted empirical analysis using the
three alternative models, finding that 'all three suggest a
significant response of savings to changes in the rate of
return.'
In a recent study of the effects of the 1981 tax reduction,
Allen Sinai, Andrew Lin and Russel Robins found that private
saving is influenced by the aftertax rate of return and that the
economy would have performed much more poorly in 1981-82 had it
not been for the 1981 tax rate reduction. They also found
that the cash flow effects of the tax cuts reduce the burden of
loan repayment and interest charges on debt, thereby
strengthening home and business balance sheets.
Using an augmented Data Resources model of the U.S. economy
incorporating previously neglected effects of aftertax interest
rates on saving, investment and consumption, Sinai and his
associates found that the net tax reductions that were introduced
by the Reagan Administration raised business saving by $27
billion during 1981-82 and will add $181 billion over the 1981-85
period. The effect on personal saving is even more dramatic.

26
Saving rises above the baseline trend by $48 billion in 1982 and
$136 billion in 1985, producing a cumulative increase in personal
saving of $402 billion for the 1981-85 period.
In a powerful vindication of the position taken by Treasury
Department supply-siders, the economists conclude: "These results
illustrate the sensitivity of saving to the changes in taxes and
that ERTA is a program with major effects on personal saving.'
The economists found that in the absence of the tax cut, "the
U.S. economy would have performed considerably worse in 1981 and
1982 than actually was the case," with an additonal loss in real
GNP of about 1.6 percentage points. They concluded that the
.evidence indicates that ERTA has had a major impact on U.S.
economic growth."
In 1983, despite highly publicized fears expressed by the
chairman of the Council of Economic Advisors and the chairman of
the Federal Reserve Board that high interest rates would produce
a lopsided and weak recovery, the recovery was well-balanced and
the economy rebounded strongly. According to the 1984 £OQWmis
fleqQr 2L thz krgai _ nt, interest sensitive categories such as
consumer durables, business fixed investment, residential
investment and inventories all contributed to GNP growth in
proportions that either matched or bettered the average of
postwar recoveries. One category of nonresidential fixed
investment--investment in producer's durable equipment--performed
particularly well, making three times its average postwar
contribution to the first year of recovery.
The other component of nonresidential fixed investment--

structures--contributed slightly less to the first year of
recovery for the striking reason that it barely fell during the
recession. Throughout most of the recession, investment in
structures remained well above its pre-recession level, instead
of declining as it did in the seven previous cycles. Non-
residential construction showed little effects of recession
because structures was the sector least affected by the 1982 tax
increase.
As a result of improved cash flow from the 1981 tax cut, the
credit crunch, which many predicted would result from the budget
deficits, did not occur. According to the EDcnomij ftsLt 2f the
The nonfinancial corporate sector did not place significantdemands on the credit markets in 1983. As cash flow rosemarkedly due to the strength of the recovery, corporationsobtained most of their funds from internal sources. Despiteincreases in business fixed investment outlays and a movefrom inventory liquidation to accumulation within the year,the non-financial corporate sector is estimated to haveborrowed about $33 billion in the first three quarters of1983, well below the amount borrowed over the same period in1982. I.V
The source of the rise in interest rates was not Treasury
borrowing crowding the private sector out of the financial
markets, but the Federal Reserve Board's decision to. tlghten
money supply growth. According to the economic report, "In the
middle of 1983 the Federal Reserve became less accomodative in
its provision of reserves. As a result, interest rates rose
moderately."
Other recent studies and experiments show that people's
decisions about the allocation of time are affected by the
relative prices of work and leisure. Jerry Hausman, for example,

28
has devoted much time and energy to studying the effect of taxes
on work decisions. In a Brookings Institution study, Hausman
reports:
Although income and payroll taxes account for 75
percent of federal revenues, most economists have concludedthat they cause little reduction in the supply of labor anddo little harm to economic efficiency. The results of thisstudy contradict that comforting view. Direct taxes onincome and earnings significantly reduce labor supply andeconomic efficiency. Moreover, the replacement of thepresent tax structure by a rate structure thatproportionally taxes income above an exempt amount wouldeliminate nearly all of the distortion of labor supply andmore than half of the economic waste caused by tax-induceddistortions.12/
In another study Hausman finds that, using 1975 data,
desired labor supply was 8.2 percent lower than it would have
been without federal income taxes, FICA taxes and state income
taxes. He notes in particular that
the effect of the progressiveness of the tax system is to
cause high wage individuals to reduce their labor supplymore from the no tax situation than do low tax individuals.. . . Of course, this pattern of labor supply has an adverseeffect on tax revenues because of the higher tax rates thathigh income individuals pay tax at.20/
Measuring the effects on labor supply of the tax system and
of a 10 and 30 percent reduction in marginal income tax rates,
Hausman reports that a person earning a nominal wage of $3.15 an
hour worked 4.5 percent less than he would have in the absence of
taxes. He would choose to work 0.4 and 1.3 percent more after 10
and 30 percent tax rate reductions, respectively. As income
increases, the responses get larger. Taxes cause a person earning
$10 an hour to reduce the number of hours worked by 12.8 percent.
A 10 and 30 percent reduction would induce him to increase his
work time by 1.47 and 4.6 percent, respectively.
Another interesting result of Hausman's work is his

29
calculation of the 'deadweight loss' incurred by the imposition
of the progressive income tax system. He defines deadweight loss
as the amount an individual would need to be given to be as well
off after the tax less the amount of tax revenue raised.
Hausman finds that there is an average deadweight loss equivalent
to 22.1 percent of tax revenue collected, which is income that is
'lost' because of the presence of taxes. As income increases, so
does deadweight loss. A person earning $10.00 an hour, according
to Hausman, has a deadweight loss of 39.5 percent of tax revenue.
The impact of income maintenance programs on the work effort
of low income earners also clearly demonstrates the relative
price effects of taxation that supply-side economists have
stressed. The Seattle/Denver Income Maintenance Experiments
(SIME/DIME) was the fourth and most comprehensive of the
experiments undertaken by the government in the 1960s and 70s to
examine the effects of a cash transfer program or negative income
tax on low income earners. People were given cash transfers of
varying generosity which guaranteed them incomes whether they
worked or not. Their subsidies were taxed so that when they
began earning income above a certain level, the subsidy would
gradually be reduced to zero. The purpose of the study was to
determine whether a cash transfer would be a more efficient way
to transfzer income to the poor than the variety of welfare
programs that were already in existence.
The negative income tax lowers the relative price of leisure
and, not surprisingly, the SIME/DIME results, published in May
1983, show 'a significant negative effect on hours worked per
38-037 0 - 84 - 3

30
year.' Married males participating in the three-year cash
transfer programs worked an average of 7.3 percent less than they
would have in the absence of the negative income tax. Those who
participated in the five-year program reduced their labor supply
13.6 percent, demonstrating that work disincentives rise with the
permanence of income support programs. Wives and female heads
of household showed a larger response to the cash transfer
program. The report noted that
by the end of the first post-treatment year, labor supply
for NIT-eligible husbands had again returned essentially to
the same level as-that for controls, indicating strongly
both that the observed response was indeed a result of the
treatment and that husbands can adjust their labor supply
fairly rapidly to changed incentives.2I
Growth and Fairness through a Flat-Rate Tax
The existing U.S. tax code is unaffordable because of its
adverse effects on relative prices. A broad-based flat-rate tax,
especially one that exempted saving from the tax base, would
remove the current disincentives to earn additional income from
work, saving, investment and risk-taking. The cost to the
economy of the distortions caused by the differential treatment
of investment in the current tax code would also be eliminated by
a broad-based flat rate tax.
Any tax system should meet a minimum of three goals: it
should be simple and fair, it should collect adequate revenues,
and it should minimize its own burden on the economic vitality of
the tax base. Despite the reforms of 1981, the present tax
system still fails to meet any of these goals.
The present tax system is not based on the principle of
2airness but on the 'ability to pay" argument. Fairness says that

31
a person who earns twice the median income should pay twice as
much in taxes. The ability to pay argument claims that the
government should be able to extract, for example, five times as
much in taxes from a person who makes twice the median income
simply because he is better able to withstand the burden. The
ability to pay argument introduces massive economic disincentives
into the economy, because it increases the rate of penalty as
additional effort is expended. The current tax system even
violates the ability to pay argument. Bracket creep has pushed
middle income earners into marginal tax brackets that formerly
pertained only to the rich. As inflation and economic growth
moved the people higher into the progressive tax system, the
disincentives of progressivity spread into the population as a
whole. The fairness principle is further breached because
different kinds of income are taxed differently, as is marital
status.
The tax system also discourages revenue collection and
depresses the tax base. People are encouraged to make
investments that minimize their taxes rather than maximize their
income. In a recent publication the House Democratic Caucus,
echoing years of complaints by supply-side economists, noted the
heavy economic cost of the current tax system:
The current tax code distorts investment decisions so thateconomically desirable investments often appear lessattractive than those where tax incentives inflateprofitability. Section after section tells new investorswhat lines of business to enter, tells existing corporationshow to go about their work, and puts a heavy tax on theprofits of successful and productive corporations. Thewhole system makes no economic sense.22/
It is refreshing to see that at least some Democratic Congressmen

32
no longer think exclusively of redistribution when they call for
tax reform. Perhaps they are beginning to realize that
redistribution takes place through the expenditure, and not the
revenue, side of the budget.
The third goal for tax policy, collecting adequate revenue,
cannot be achieved independently of the other two goals. If
taxpayers feel that the system is unfair, they are more likely to
engage in tax avoidance. The large underground economy that has
developed in the United States is testimony that many Americans
no longer believe that the tax system is worthy of support. In
the United States today tax avoidance is a big business in which
many participate, from the carpenter who willingly accepts a
lower payment provided it is in cash, to the Wall Street
entrepreneur who devises ingenious but hopelessly unproductive
tax shelters, to the Washington lawyer/lobbyist who bargains for
special tax breaks for his clients.
The size and strength of the economy is the basis for the
government's budget. The economy's strength determines how much
the government must spend on such things as unemployment
benefits, public housing and income support programs and how much
it can spend on defense, education, and public investment in
roads and bridges. The size of the federal budget in relation to
GNP depends not only on the budget, but also on the economy.
Obviously, it is much easier for a government to "live within its
means" if the economy is large, healthy and growing.
In a broad-based low flat-rate system, marginal and average
tax rates are equivalent, and the economic distortions that

33
differential tax treatment causes are reduced to a minimum. A
revenue neutral' tax reform, in which the higher revenues from a
broader base are fully offset by lowering the tax rate, would
result in higher Treasury revenues because of the dynamic effect
on the economy of better incentives and reduced investment
distortions. This would allow the budget to be balanced without
raising the tax burden.
Exempting saving from the tax base would add a big boost to
investment, capital formation and productivity. For too long and
for too many people, the government's policies presented an
ultimatum: go into debt or go broke. Tax law that encourages
debt over equity is a source of high interest rates and low
capital formation. Exempting saving from the tax base would
treat income saved the same as income consumed.
Economic policymakers may be faced with an important
opportunity. The healthy results of the initial supply-side
reforms in 1981 are bound to add momentum to additional positive
reforms. Now is the time to guarantee the future by
fundamentally reforming the tax system.

34
Notes
1. See Paul Craig Roberts, "The Breakdown of the KeynesianModel,' £ubki In&n=rst, No. 52, Summer 1978.
2. See Norman Ture, "Supply-Side Analysis and Public Policy," in
David G. Raboy, ed., SupplySidf EQnami.is (Washington, D.C.:
Institute for Research on the Economics of Taxation, 1982), andJack Kemp, "The Tax Bias Against Savings Shrinks Everyone's Pie,"Wazhing"Qn Star, September 21, 1975.
3. In March 1984 the U.S. Treasury Department published a study,"The Effects of Deficits on Prices of Financial Assets: Theoryand Evidence," which suggests that in general taxes moreeffectively crowd out investment than do budget deficits.
4. See, for example, Congressional Budget Office, "Closing theFiscal Policy Loop: A Long-Run Analysis," (Washington, D.C.: U.S.Government Printing Office, 1977).
5. See Paul Craig Roberts, Thg auq21ySide EeYQlutinn: AnInsidr'IL Gaunt Qf Ecairymaking in WanhingZtn (Cambridge,Mass.: Harvard University Press, 1984), p. 79.
6. For a detailed discussion, see Thn 5.uply=.dne Rayanutian,pp. 69-81.
7. James Gwartney and Richard Stroup, "Tax Cuts: Who Shoulders
the Burden?," Zzno Rvinflw, Federal Reserve Bank of Atlanta,March 1982, pp. 20.
8. kbid, p. 26.
9. James Gwartney, "Tax Rates, Taxable Income and the
Distributional Effects of the Economic Recovery Tax Act of 1981,"testimony before the Joint Economic Committee, June 12, 1984, p.19.
10. See Alice M. Rivlin, ed. , Eaanamir Chgieaz 121A (Washington,D.C.: Brookings Institution, 1984).
11. These arguments are logically inconsistent. If people in
general respond to a tax cut by reducing their working hours,
total income would fall. See Roberts, "The Breakdown of theKeynesian Model" and 1h2 Siev1luSida Aaiuti nn.
12. Michael J. Boskin, "Taxation, Saving, and the Rate ofInterest," agurnal 2f gliticsal nQgQay, April 1978, Vol. 86, no.2, pt. 2, p. S 3.
13. Ibid, p. S 25.
35
14. Larry Summers, "Tax Policy, the Rate of Return, andSavings," 'Working Paper 0995," National Bureau of EconomicResearch, September 1982, p. 43.
15. Allen Sinai, Andrew Lin, and Russel Robins, "Taxes, Saving,and Investment: Some Empirical Evidence,' naiional 23x Jo~urna1,September 1983.
16. Ibid, p. 23.
17. Council of Economic Advisors, £FQnQmic Report of the2xidnt 1SAM (Washington, D.C.: U.S. Government PrintingOffice, 1984), p. 193.
18. kbid, p. 195.
19. Jerry Hausman, 'Labor Supply,' in Henry J. Aaron and JosephA. Pechman, eds., ELi TAseg &ffront Eangm1G Bhaior (Washington,D.C.: The Brookings Institution), 1981, p. 27.
20. Jerry Hausman, "Taxes and Labor Supply," "Working Paper#1102," National Bureau of Economic Research, March 1983, p.46.
21. Final Report of the Seattle-Denver Income MaintenanceExperiment, SRI International, U.S. Department of Health andHuman Services, May 1983, p. 13.
22. National House Democratic Caucus, "Renewing America'sPromise: A Democratic Blueprint for Our Nation's Future," January1984, p. 15.

36
TAX RATES AND REVENUES / (IEUK>k UIbLU)LK
What Ronald ReaganDOE.SN[ KNOW
about his own achievementsTHE U.S. ECONOmY is currently in the midst of a world-
leading surge of productivity growth, innovation, capi-tal formation, and employment The United States is
applying high technology nearly 50 per cent faster thanEurope or Japan. Spending on capital equipment-led byelectronic gear-set an all-time record for the first year ofa recovery, rising at three times the average pace of first-year upturns since World War 11. As a result of PresidentReagan's tax policies, the rich have been paying decisivelythe highest share of income taxes they have paid in IIyears. Outside of the desperate sloughs of the welfare cul-ture, which the politicians in their famous compassion re-fuse to change, the poor are rapidly leaving poverty andare paying their smallest share of income taxes in morethan a decade. In 1983 the U.S. created four million newjobs-a peacetime record-and is now employing a record61 per cent of the working-age population, a level some15 per cent higher than its European rivals'.
Why on earth doesn't President Reagan know all this?Why does he stumble and grope at a press conferencewhen asked a question about the fairness of his tax pro-gram or the performance of the economy? Why do lead-ing Republicans believe they have to raise tax rates toget more revenue when lowering rates in the high bracketshas achieved this result while expanding employment andgrowth? Why do leading economists speak of sluggish pro-ductivity growth and suggest that the U.S. continues to lagbehind Europe in this key index?
The answer to all these questions is simple. From thePresident on down, the Republicans see the economythrough the eyes of analysts who are blind to technologi-cal change, cannot measure a system on the move, andthus have no idea what is going on in America.
Take, for example, the recent silliness from the Congres-sional Budget Office (CBO), which made the front page ofseveral prominent newspapers, was snidely featured in theleading news weeklies, and was used by the press to harrythe President at a news conference.
At that conference, a reporter cited the CR0 findingthat families with incomes of more than $80,000 will gainS8,390 from the Reagan program in 1984 while familieswith incomes of less than S10,000 will lose $330. The
Mr. Gilder's new book is The Spirt of Enterprisem hick Wfil bepabluhked ia September by Simon & Schuster I1 is a, aitsemce
reetion of f. Bokf--Month ClWb and a nselertion ofthe Fornse Book Club.
22 NATIONAL REvIEw / JUNE 29, 1984
reporter asked, "Is this fair?" President Reagan began witha perfectly valid reference to "lies, blankety-blank lies, andstatistics." He should have left it at that. But then heasserted, debatably, that inflation hurts the poor the mostand that his Administration has conquered inflation. Final-ly, he accepted the essential premise of the question bypointing out, falsely, that it had been a proportionate taxcut and that therefore the rich, who pay the most, wouldget the largest absolute benefit In fact, the cut in the toprate came first, thus giving upper-bracket taxpayers thelargest cut and inducing them to increase their paymentsthe most
This is not altogether a case of a partisan CongressionalBudget Office attacking a Republican President Althoughthis particular study was commissioned by Democratic Sen-ator Lawton Chiles of Florida, the CBO is now led byRudolph Penner, a Republican, formerly at the AmericanEnterprise Institute. Nor did the President's ineffectual an-swer reflect a failure to be adequately briefed by his econ-omists. Most of the President's economists coald have an-swered no more effectively than he did. From the Bureauof Labor Statistics to the Council of Economic Advisors,most of the Administration's analysts essentially agree withthe President's answer-and with the CBO. They are con-founded by the dynamics of a entrepreneurial economywhere tax-rate cuts reliably improve the distribution of in-come and increase payments by the rich.
The CBO and the President's advisors both believe thatpeople stand still for taxes. Therefore if you drop the topbracket by 29 per cent, as the Administration did in 1981,top-bracket taxpayers will pay less. All world history showsthis proposition to be false, but nearly all the world's econ-omists believe it, including, most notably, the accountant-economists in the Administration.
In fact in a dynamically changing economy where fami-lies are continually moving in and out of wealth and pov-erty, people do not stand still for anything except possiblya Kodak or an economist, and nothing makes them movefaster than a tax hike. The very concept of a static bodyof "rich" and "poor" is a Marxist fantasy to begin with.The only way you can create a static class of poor peopleis through a welfare system that destroys their families andpays them to stay poor. The only way you can create astatic class of rich people is to lax new income so fierce-ly that entrepreneurs are prevented from challenging es-tablished wealth. Although U.S. policymakers have oftenmoved toward such a system, the Reagan Administration

37
has been attempting to dismantle the welfare trap for thepoor and the tax trap for the entrepreneurs. While thispolicy leads the rich to pay more taxes and the poor toescape poverty, the static models-utterly irrelevant to thereal world hut comfortable to tax raisers and convenientto ecionomists-cnn measure only a drop in payments bythe rich and a drop in benefits for the poor.
When tax rates are cut in the top brackets, people arnand report far more income at this level and pay fur more
xes. Highly progressive tax rates do not redistribute in-come; they redistribute taxpayers. Facing a rate above 25per cent, tagpayers simply report less taxable income. Theyflee to tax shelters or to the underground economy, intoforeign banks and tax havens, Mercedes Benzes and polit-ical-action committees, and onto yachts, beaches, and golfcourses. They twist their finances into low-calorie pretzelsand serve them to the IRS. Tax considerations impinge onevery investment decision they make.
When top-bracket tax rates are cut, taxpayers begin toinvest with a greater interest in the ultimate taxable yield.Even though they continue to invest in shelters, they focuson vehicles with a real return rather than simply a con-venient loss. The overall result is that they pay more taxes,even when, as over the lost two years, they increase theirparticipation in explicit shelters-even when, as in therecent recession, their real income actually drops. In 1982,for example, approximately S3.5 billion in additional fundswus invested in shelters-not a large amount compared tothe deficit but a sign l of seriously distorted investmentincentives. The bulk of the new shelter funds pouredthrough the chief loophole in the new tax act: 15-yearaccelerated depreciation of buildings that actually rise in
alue. But explicit shelter activity is dwurfed by the impactof high tax rates on every investment decision made in theeconomy. The drop in the top rate oriented investors in1982 toward seeking taxable returns to a greater degreethan they did in 1981. As a result the prices of real estate,gold, and collectibles dropped during 1982, and the priceof items with a taxable yield,, such as stocks and bonds,rose. The effect of these changes was a rise in the taxespaid in the top brackets even during a recession year thatsaw real incomes drop, particularly in the top brackets.
In 1982, for example, in the midst of recession, 48 percent more households reported adjusted gross incomes ofmore than SI million, and they paid 42 per cent more
.taxes and a 37.4 per cent higher share of taxes than in thepre-recession, pre-tax-cut year of 1981. Such a responsewas easily predictable. Afier the Kennedy tax cut of 1964,payments in the top brackets rose by 80 per cent, andafter the Coolidge tax cuts of the mid-1920s, payments bythe rich rose by some 200 per cent, and the share of taxespaid by the rich rose from 28 per cent to 63 per cent.
Yet this CBO study explicitly acknowledges that its'revenue estimates are static estimates: They are based on'he somewhat arbitrary assumption that such changes in.ne tax code do not have significant effects on generaltaxpayer behavior or otherwise on the economy at large."The assumption is certainly arbitrary. As Lawrence PratsOf the American Institute for Economic Research has writ-ten, the CBO approach is like assuming that "motorists'behavior is unaffected by police cans and street signs." Orthat housewives don't cut their purchases of asparagus inJanuary.
In other words, the CBO economists assume from theoutset that the only reason to change tax rates is to redis-tribute income, and they assume in the case of the Reagantax cut that the shift is from the poor to the rich. Theyutterly ignore the argument, made endlessly by advocatesof reduced rates, that lower rates, particularly in the topbrackets, foster economic growth and progress and inducethe rich to pay more taxes.
Now that the rich are indeed once again paying moretaxes after a tax-rate cut-and paying their highest sharein 11 years-the supply-side argument bas been entirelyvindicated. But neither the economists at the CBO northe economists within the Administration will accept thesedata. Both advocate tax hikes and fear that acceptance ofthese numbers would lead to further tax cuts-and largerdeficits-in 1984. Thus economists in the Administrationsystematically edit out of speeches all references to this keypolicy success by the Administration And allow PresidentReagan to flounder pathetically before the press-end thetelevision audience-on the so-called fairness issue, whichWalter Mondale has already indicated will be a central.theme of his campaign if he indeed receives the Demo-cratic nomination.
More disturbing ure the CBO estimates for the future.The CBO shows that through the predicted rise of incomesalone, net of inflation, the share of taxes paid by thosewith incomes of more than S40,000 will increase between1982 and 1985 from 46 to 65 per cent of total taxes.
If Congress is unwilling tocontrol spending, the only wayit can reduce the deficitis by further reductions inthe top tax rate
These estimates are disturbing because they suggest thatmarginal tax rates will rise on this group. As the ratesstatically considered do rise, the revenues will predictablyfall below expectations, and Rudolph Penner and his allieswill return for more taxes in 1986. The poor will end uppaying more, not less, of total taxes.
The problem is epitomized by the CBO assumption that"The percentage of income taxes paid by households inthe S80,000 and over category was reduced in 1982 large-ly by the ERTA [Economic Recovery and Tax Act] reduc-ton in the maximum statutory tax rate on all income from70 per cent to 50 per cent." Yet, in fact, from two setsof Treasury data it can be seen that this group substan-tially increased its share of tax payments in 1982. Thelatest Treasury data show that households with incomesabove 375,000 increased their payments by 7-per cent,while households with incomes below S75,000 decreasedtheir payments by 4.8 per cent. This result was affected byinflationary bracket creep at the lower end of the incomescale. But the increase in the share of payments was larg-est in the highest brackets. those farthest above the reachof bracket creep. In short, the CBO estimates are totallyunsupported by upper-bracken data. Since these data werefully available to the CBO, its failure no use them calls in-to question the competence of the entire study.
JuNE 29, 1984 / NATIONAL REyvew 23

8.8
Administration economists for the lbst two years havedismissed as a statistical anomaly all evidence that thePresident's tax cuts are working in accordance with theLaffer Curve In particular, they questioned the value ofthe only available index of payments by the rich-non-withheld receipts of the Treasury, net of refunds-as mis-leading on various technical grounds. They said the rise in1982 was attnbutable to higher penalties on shortfalls inestimated quarterly payments. Even if their argument werecorrect, however, the higher penalties would merely haveshifted payments into 1982 from April 1983. However, in-cluding April 1983, the rich still paid decisively their high-est share of income taxes in more than a decade More-over,. the share of income taxes paid by the rich rose spinfor all of 1983. Thus, all the contentions of liberal econ-omists that the higher share of taxes paid by the rich wasan anomaly of the recession are reflted by the evidencethat the rich increased their share of payments again dur-ing the recovery. Because this index of non-withheld pay-ments is less affected by inflation, it is probably more de-pendable as a measure of the share of payments by therich than the Treasury statistics by income group. Withtax rates rising in 1984 the share of payments by the richhas recently begun to decline, though it remains substantial-ly higher than as any time between the tax hikes of theearly 1970s and the tax cut of 1981.
All thin evidence leads inexorably to the conclusion thatif Congress is completely unwilling to control spending, theonly way it can reduce the deficit is by further reductionsin the top tax rate. Tax shelters and other tax-relatedinvestments, particularly depreciable buildings that actually
appreciate in value, still abound in the portfolios of oth-erwise productive Americans. It would be possible to spurnew growth and induce a veritable flood of new revenueby. dropping the top rate to a sensible level.
Missing all these key responses to taxation, the CBOstudy assumes that revenues would have been higher underthe old rates. Thus the CHO argues that if the Carter poli-cies of steadily rising tax rates had remained in effect, thedeficit would have dropped to $39 billion by 1987 ratherthan rising by $180 billion as an effect of Reagan's taxcots. However, Canada's per-capita deficits, for example,are nearly double ours, and its growth rate less than one-half ours, ufter allowing its income-tax rate to rise 10per cent since 1981. In fact, throughout the world, accord-ing to a recent World Bank study, countries with high taxrates raise less new revenue than countries with low taxrates. The CBO projections assume not only that rich peo-pie-and their accountants and tax planners-are stupidenough to pay 70 per cent tax rates, but also that, whenthey do, they remain rich enough and dumb enough thenext year to continue paying them. The CHO study imag-ines that the US. economy would have recovered us vigor-ously while tax rates on both individuals and corporationssoared by some 40 per cent in four years. Such assump-tions are not economics; they are either incompetence ordeceit
The other CBO contentions are equally fatuous. Accord-ing to the study, the average family earoing less than$10,000 lost S330 us a result of Reagan Administrationpolicies. This finding ignores the small matter of four mil-lion new jobs that took people out of poverty at a rapid
lte
k)ol 8 TE IN1 TRE w/ N O,lL~~~lu~lFM MLmr oiJj
24 NATIONAL Rxvtew / JucNE 29, 1984

39
pace in 1983, and the nearly five million net new john
created under the Reagan Administration. It ignores the
drop in inflation that slowed the move of the working
poor into the hottom bracket, which was occurring at a
rapid pace under Carter and would have continued undee
pre-Reagan tan policies and inflation rates. The finding
also ignores the current entrepreneurial boom, including
record minority business starts, venture-capital outlays, and
technological creativity. A 1981 study by the GAO of 72
companies begun with 3209 million in venture capital after
the 1978 cut in the capital-gains tan indicated that they
had directly generated 135,000 new john, £450 million in
new Lan revenues, and S900 million in new exports in
four years. By that standard the £7 hillion in new venture
outlays since the Reagan tan cuts wilt directly generate
four million new jobs, $15 billion in new taxes, and S27
billion in new exports. But the real benefits in innovation
and growth will be far greater. Similar guins can be ex-
pected from the growth of S8 billion in the total unex-
pended ventura-capital pool accumulated under Reagan. Al
these advances on the frontiers of technological change in
Despite all the ministrations ofthe welfare state, thegap between black andwhite family incomes hasscarcely changed in 25 years
the world economy will both enrich the coffers of the
government and accelerate the movement of the poor out
of poverty.Meanwhile the real twenty-fold increase in welfare and
other social spending over the last quarter-century has
achieved historic highs in family breakdown and unemploy-ment among poor blacks in America. In 1981, the ile-gitimacy rate, spurred on by giving 16-year-old girls wel-
fare payments and free apartments if they bear children outof wedlock, rose to 55 per cent of all black births. De-
spite all the ministrations of the welfare state, the gap
between black and white family incomes has scarcelychanged in 25 years, and the real gap, exclusive of wel-fare and in-kind benefits, has actually grown Anyone whohbs studied real ghetto conditions as opposed to povertystatistics recognizes that welfare plays a key role in thistragic wastage of ghetto lives. Meanwhile, the incomes ofintact black families have risen to more than 90 per centof the incomes of comparable white families. In the faceof this evidence it is simply outrageous for Democrats toattack the Reagan Administration for insensitivity to theplight of the poor.
The welfare issue has been woefully confused by thedebate over the deficit Welfare is not a significant causeof the deficit. The reason to cut welfare is not that itwastes money, but that it wastes lives. Welfare creates awreckage of broken hearts and families, crime and unem-ployment, and it intensifies and perpetuates poverty in thename of compassion.
The most recent statistics on tax receipts suggest that theeffects of the 1981 tax cuts are being graduaily counter-vailed by new tax increases. To fight the current deficit,
new reductions in magnlraten are needed. Otherwisethe economic results-as measured by the usual econo-mists-will appear sluggish as the election approaches. Pro-ductivity, for example, will appear to be languishing. TheAdministration is going to have to learn how to interpret
and explain an entrepreneurial economy.The U.S. economy is growing again in a healthy way
after the tumors and suppuratious of the mid-1970s. But
the thrust of ite growth-us manifested by increasing taxpayments by the rich-is entrepreneurial: a shift out ofgold, collectibles, and other diversionary investments intothe risks and challenges of productive activities. The key
indices of the shift are the record 600.000 new companiesbegun in 1983. in an entrepreneurial upsurge that acccler-ated into 1984; the 60 per cant rise over the lust four
years in public companies listed over-the-counter; and thetripling of venture-capital outlays. Most important has been
the world-leading surge in high-technology purchases, madeppsibsle by what is incomparably the world's most produc-tive and creative software industry, transforming computerhardware into ever more useful and versatile equipment.
The driving force in the recovery has been the pur-chases of producer durables, which rose in 1983 at threetimes the pace of previous recoveries of the post-WorldWar II era and were dominated by electronic gem. Not
only did these purchases rise steadily through the end of1982 and surge into the first quarter of 1983 at a recordpace while retail sales were actually declining. These com-puters and related gear also were radically improving theefficiency of the U.S. capital stock. But Washington iscompletely incapable of measuring the productivity of thisgear. In fact, the Bureau of Economic Statistics (BES) hasassumed for 25 years that computers have been rising inprice at a rate of I per cnt per year, when in fast com-puters have been dropping in price at an exponential pace
as measured by their explosive improvement in quality,power, and usefulness. Joel Popkin, formerly of the BES,estimates that the error in calculating the price of comput-ing has led to a 5 per cent cumulative underestimate ofreal GNP, a S150-billion-odd mistake. But the real errorin measuring the growth of an economy increasingly dom-inated by computers, semiconductors, and other productsunmeasurable by the BES is much greater.
The recent economic revival has not been a mere cycli-cal recovery; it has been an industrial renaissance. If theReagan Administration is going to respond effectively to itscritics, and sustain its successes, it had better hire someeconomists who know what's going on. With Martin Feld-stein's resignation as chairman of the Council of EconomicAdvisors, the Administration could bring on board a power-ful spokesman for its policies us the campaign- approaches.
Ye! the word in Washington is that the Administrationwilt refrain from naming a new chairman in order toavoid having to defend its economic policies before Con-gress. At the White House, so it often seems, the economyis seen us a game, scored by the deficit, and the Adminis-tration is losing. But there is a real-world economy outthere, beyond Washington's phantom numbers, and theAmerican people are winning again in the crucial realm ofindustrial creativity and progress. The rest of the world,from Franqois Mitterrand to myriad Japanese, from Sovietspies to Gary Hart's speechwriters, knows it. Why not theWhite H ouse? m
JuiNE 29, 1984 I NATMoNAL Review 25

40
fl Clkrltagt Catwvsryndjc a teApublic poliy cosfeau syodico
Andrew C. Seamans Sr. Hugh C. Newton &
Mmoncig Edt, Herb BerkowitEditoi Diroae
Editor's Note: ALL CAPS DENOTES ITAL.
Fpr National Release: June 10, 1984
"The Economy in Mind'
Tax Cut Debate Shows Reagan Staff Conflicts
By Warren T. Brookes
On June 12, the Joint Economic Committee of Congress (JEC) will
hold hearings on the actual effects of the Reagan tax cut, on the
"progressivity" of the tax burden, and the "fairness issue." The
hearing should be an ideological rebuke to the liberal Democrats, who
beat up on Reagan's "tax cuts for the rich." But, it could be an even
greater embarrassment to the White House if it shows that members of
the administration sought to discredit information politically helpful
to the president.
- This JEC hearing was prompted by a lively media debate over the
impact of the actual IRS 1982 tax distribution data, showing that the
effect of the first-year tax cut the rich paid a 14-percent larger
share of the income tax burden, while that paid by those earning
under-$20,000 dropped 12 percent, completely opposite to liberal
charges. The IRS table appeared first in this column (March 25), and
was subsequently presented by the WALL STREET JOURNAL (April 11), then
cited in TIME magazine (April 30).
The IRS data was so totally at variance with the WASHINGTON
POST's politics, it lost its cool on April 22, and published an
analytical article by John Berry with the headline "IRS figures for
'82 Don't vindicate the Supply Siders". Berry used a series of tables
to try and show that the primary reason the share of taxes paid by the
lower-incomes went down, was their incomes dropped, while those of the
rich rose.
The problem is Berry's long and tortured analysis turned out to
be fatuous. First, as the WALL STREET JOURNAL pointed out (May 7),
the primary reason incomes under 25,000 fell in 1982 was that there
were 2.5-million fewer taxpayers in this group. A like number-moved
to higher brackets due to inflation. On a per- taxpayer basis,
incomes rose, not fell, as Berry stated.

41
Second, if Berry had bothered to study the IRS release, he wouldhave found that another reason for the lower Adjusted Gross Income(AGI) figures was "a sharp increase in the amount of income placedinto individual retirement arrangements (IRAs) and the introduction ofthe two-earner married couple deduction...'
In other words, much of the Reagan tax cut was "off the top,"reducing the income taxed, especially among the low- to medium-incomeearners. As the IRS report stated, "total payments to [IRAs]increased by 492 percent [from $4.7 billion] to $28.4 billion." Thismeans IRAs alone accounted for nearly $24 billion in lower incomebeing reported in the AGI figure, more than enough by itself toaccount for the POST's mistake.
What is most troubling is that, through sources, we have learnedthat Berry's badly flawed analysis was leaked to him by a staff memberof the Treasury's Office of Tax Analysis at the instigation of DavidStockman's Office of Management and Budget (OMB).
Their urgency in doing this was tipped off in Berry's line, "Someadministration officials were urging that President Reagan cite the(IRS) number in--Aforthcoming speech as evidence that his tax cutswere working exactly as promised...."
In other words, the OMB's anti-supply-side insiders weredetermined not to let the president make that "mitake.'Unfortunately, their own analysis used by the POST was "mistaken."
Within ten days, the prestigious American Institute of EconomicResearch weighed in with its analysis in the WALL STREET JOURNALshowing that, on -an -individual tax-return basis, the 1982 tax cut wasactually 25- to 40-percent more favorable to low-income groups thanthe Congressional Budget Office (and OMB) had predicted, and74-percent LESS favorable to the rich. For example, where CBO hadestimated (as recently as April 3) that the 1982 tax cut provided anaverage reduction of $5,100 to the average over-$80,000 income-earner,the actual figure in 1982 for this group was only $1,210. Why?
"The data strongly suggest that the 'rich' chose to show moreincome to the IRS in 1982, a supply-side response to the Reagan taxcuts." Just as Arthur Laffer had forecast, lower rates produced

42
higher taxpaying by the rich.
But the most important rebuttal to the WASHINGTON POST and its
administration shills was an analysis by two former JEC economists,
Lowell Gallaway and Richard Vedder of Ohio University, provided to
this column recently (see Table). This analysis wipes out all of the
distortions caused by inflation, recession, and bracket creep, and
simply applies an income percentile basis to compare the 1981 and 1982
income groups.
It shows that in 1982, the tax share paid by the nation's top 1
percent (incomes over $80,000) rose 14.1 percent, while that paid by
the bottom 20 percent (incomes below $9,000) declined 12 percent, and
the bottom 40 percent dropped by 9 percent. A classic "progressive
re-distribution."
Taxes paid by the top 1 percent rose $6 billion, while taxes paid
by the bottom 40 percent dropped $1.9 billion. This means during the
first year of the Reagan tax cut -- the year when the rich got the
biggest percentage cut, the actual tax distribution got substantially
more "progressive."
Economists have a term for this called the Gini Coefficient that
measures the degree of -difference from. top., to bottom in any
distribution curve. In 1982 that Gini Coefficient rose from .573 to
.587, a substantial 3.3-percent rise in "progressivity."
So, the "fairness" assault on the Reagan tax cut is merely an
old-fashioned, left-wing lie (see Table below).
Distributed by Heritage Features Syndicate

43
The Income Tax Burden 1981-82
% of Tax Paid % Shift of $ Shift of1981 1982 Tax Burden Tax Burden
(Millions $1
Top 1 Percent 15.58% 17.77% + 14.1% $ + 6,825
Top 5 Percent 31.82% 33.07% + 4.0% + 3,439
Top 40 Percent 80.10% 81.07% + 1.2% + 1,981
Bottom 60 Percent 19.90% 18.93% - 4.9% - 2,667
Bottom 40 Percent 7.91% 7.23% - 8.6% - 1,870
Bottom 20 'Percent 1.97% 1.73% -12.2% - 660
Gini Coefficient (progressivity)For Tax Distribution .57303 .58698 + 3.27% -
Source: IRS Preliminary Income Tax StatsFor 1982 ReturnsAnalyzed by Gallaway andVedder---Ohio University.

44
Senator JEPSEN. Mr. Gwartney, welcome. Your statement as writtenwill be entered into the record. You may proceed as you so desire.
STATEMENT OF JAMES GWARTNEY, PROFESSOR, FLORIDA STATEUNIVERSITY
Mr. GWARTNEY. Thank you, Mr. Chairman. I appreciate the op-portunity to appear before this distinguished panel and I would liketo focus on one aspect of the implications of the proportional tax re-O1uction; that is, one that cuts rates across the board, that I think isoftentimes overlooked.
The 1981 Economic Recovery Tax Act was a modest effort to reducethe negative side effects of high marginal tax rates and, except for theimposition of the 50-percent rate ceiling, ERTA provided for propor-tional rate reductions. So it's very important to look and see what theincentive implications of that are.
Tax rates in all brackets were cut by approximately 23 percent over4 tax years. Some observers have a great deal of difficulty understand-ing that a proportional rate reduction, one that cuts each rate by thesame percentage, will shift the burden of the income tax to the upperincome brackets. Yet this is precisely what both economic theory andthe experience of our rate reductions indicate. Contrary to the assump-tion of many, taxable income is not in variant to changes in the taxrates. This is where so many people go wrong in analyzing the distri-butional consequences. When tax rates decline, the take-home payper dollar of additional earnings will increase and from an incentivestandpoint, what is really important is the impact that tax ratechanges have on take-home pay.
After all, people work, save, and invest mainly for after-tax income.The larger the share of additional earnings the taxpayer is permittedto keep, the greater his or her incentive to generate additional income.The incentive effect of a proportional tax reduction will differ con-siderably across tax brackets. This is important in understanding thedistribution of income.
Proportional rate reductions, such as the 1963-65 reductions andthe 1981-83 reductions, all increase take-home pay derived from addi-tional earnings far more in the upper brackets than in the lowerbrackets.
Perhaps some numbers will drive this point home. Suppose taxrates are cut across the board by, say, 20 percent. In the 10-percentmarginal tax brackets, the 10-percent rate is cut to 8 percent and thiswould increase take-home pay from 90 cents to 92 cents. Now eventhough I believe incentive matter, I expect this is going to have a lessthan dramatic impact on the tax base or the incentive of individualsin the very low tax bracket to earn additional reported taxable incomeor to reduce their incentive to engage in tax shelter activity.
On the other hand, consider what happens at the top rates. Thesame 20-percent rate at the top of the income spectrum will increasethe take-home pay at the 70-percent rate from 30 cents per dollar ofadditional earnings to 44 cents per dollar of additional earnings. Inother words, you cut the 70-percent rate by a proportion of 20 percentand it would reduce it to 56 percent. This would mean after-tax earn-ings would increase from 30 cents on the dollar to 44 cents on the dollar.

45
So what happens in the upper tax brackets, the same proportionalrate reduction leads to a larger increase in the tax base in the uppermarginal rate.
Now why this is important is the impact upon the revenue gain willbe directly proportional to that tax base. The largest increase in reve-nues or smallest reduction in revenues will come in those areas wherethe tax base increases the most. So theory says that you would expectthe tax base to be increased most in the upper brackets. Therefore, thisproportional tax reduction predictably will expand the income basemore in the upper brackets-taxable income base now-and will leadto an increase in the amount of revenues obtained from those upperincome brackets relative to lower income brackets.
In other words, it will shift the burden of the income tax to theupper income brackets.
Well, the test of a theory is, of course, in the evidence. When we lookat the evidence for the two most recent major proportional rate reduc-tions of 1963 and 1965, for example, in 1963-65, plus the 1981-82 data,my exhibit 5 in the prepared statement presents the data organized byincome groupings, by percentile groupings, and it looks at the amountof tax liability that each group bore in 1981 and then in 1982.
For example, the bottom 50 percent of taxpayers in 1981 paid $21.7billion income tax liability. In 1982, that liability fell to $19.5 billion,a reduction of 10 percent. Now at the other end of the spectrum, the top1.36 percent-this is the group that was most directly affected by theimposition of the 50-percent tax ceiling-in 1981, they paid $58 billionand in 1982 they paid $60.5 billion, an increase of 4.3 percent tax reve-nues collected from that group.
You will note the two intermediate groups, the 50 to 75 percentileand the 75 to 98.6 percentile, had smaller-as you moved up the incomespectrum, reductions in tax revenues and as you move down the incomespectrum, of course, the tax revenues reductions were larger.
So what that data indicates is perfectly consistent with the theory.In 1981, the bottom 50 percent paid 7.6 percent of the tax liability.In 1982, they paid only 7 percent of the tax liability. At the top end ofthe spectrum, the top 1.36 percent of taxpayers paid 20.4 percent ofthe tax liability. In 1982, that increased to 21.8 percent.
So just as our theory would predict, the largest increases in tax reve-nues or the smallest reductions were directly proportional to income.
Now that. exeCt same Dattern was present in 1963-65. 1981-82 wasnot an isolated case, as exhibit 6 shows that once again you found thatthe largest reduction in tax revenues were in the bottom 50 percent ofincome recipients while you had an increase in the percent of tax reve-nues gathered from the top 5 percent of taxpayers.
So the data are perfectly consistent with the theory. In addition, totest that hypothesis .in a little bit more detail, Prof. James Long ofAuburn University and I looked at the 1979 tax data in detail and weattemped to estimate how responsive the tax base was to changes inthe rates where what was giving us the change in rates or differencesin rates was differences in the State income tax. We superimposedState income tax structures so that you would have an individual in ahigh tax State-State income tax now, such as Minnesota or NewYork, where that individual would be facing higher marginal taxrates than an individual with the same income in Texas or Florida,
38-037 0 - 84 - 4

46
and that would permit us to estimate how that increase in the marginaltax rate affected the tax base.
What we found is, again, what theory would predict, that in theupper income brackets, the rate differentials exerted the greatest im-pact upon the responsiveness of the tax base, that higher tax ratesled to a shrinkage in the tax base and it was particularly importantin the upper tax brackets.
So in conclusion, what the analysis of both the major tax cuts-the1964 tax cut, the 1981 tax cut, as well as the static analysis for a singleyear where you look at rate differentials-is that the base is moreresponsive to changes in the rates in the upper income brackets, andthe implication is that the proportional rate reduction, far from whathas often been put forth in the media and other sources, will actuallyshift the tax burden to high income people rather than away fromhigh income people, as has often been alleged.
So that my analysis indicates that the 1.981 legislation resulted inan increased share of tax revenues paid by the upper income groupings.
Thank you, Mr. Chairman.[The prepared statement of Mr. Gwartney follows:]

47
PREPARED STATEMENT OF JAMES GwARTNEY
EXECUTIVE SUMMARY
Many observers are misled as to the distributional effects
of a change in tax rates because they erroneously assume that
taxable income is unaffected by tax rates. When tax rates decline,
particularly high tax rates, people will respond by spending more
time earning taxable income and less time (and money) with invest-
ment consultants and tax experts figuring out how to shelter their
income. As a result, lower rates will expand the tax base. This
factor is particularly important in the upper tax brackets.
Once allowance is made for the responsiveness of the tax
base to the lower rates, comparison of the 1981 and 1982 tax data
indicate that the rate reductions shifted the burden of the income
tax toward high income taxpayers. Even though the 50 percent
rate ceiling imposed in 1982 cut the rates of high income taxpayers
by as much as 28.6 percent (from 70 percent to 50 percent), the
tax revenues collected from the wealthy grew. The revenues col-
lected from the top 1.36 percent of taxpayers, the group most
directly affected by the sharply lower rates, jumped from $58.0
billion in 1981 to $60.5 billion in 1982. The top 1.36 percent
of taxpayers shouldered 21.8 percent of the tax burden in 1982,
up from 20.4 percent in 1981 (see Exhibits 4 and 5).

48
At the other end of the income spectrum, the tax liability
fell. The bottom 50 percent of income recipients paid income
taxes of $19.5 billion in 1982, down from $21.7 billion in 1981.
The share of total income tax revenues contributed by the lower
half of income recipients fell from 7.6 percent in 1981 to 7.0
percent in 1982-(see Exhibit 5), Far from creating a windfall.
gain for the rich, as some have charged, the 1981 tax cut actually
shifted the burden of the income tax toward those with higher
incomes, including taxpayers who received substantial rate reduc-
tions as the result of the 50 percent rate ceiling applicable
in 1982.
There is nothing mysterious about the shift in: tax liability
emanating from the 1981 tax cut. It was totally predictable.
The shift in the tax liability toward the rich reflects the greater
responsiveness of the tax base to rate changes in the upper
brackets. As a result, a roughly proportional rate reduction
will always shift the tax burden toward the upper tax brackets.
Both the Kennedy-Johnson tax cuts of 1963-1965 (see Exhibit 6)
and the rate reductions of the 1980s illustrate this point.

49
-Tax Rates, Taxable Income, and the DistributionalEffects of the Economic Recovery Act of 1981
by
James Gwartney*
Contrary to the conventional wisdom, it is not easy to deter-
mine the impact of tax rate reductions on the distribution of
the tax burden across income groupings. Economic theory indicates
that the taxable income base will be negatively related to tax
rates, particularly in the upper income brackets. Failure to
incorporate the impact of the rate changes on the taxable income
base will result in potentially misleading projections. This
is precisely the problem with static income projections. They
are based on the fallacious assumption that taxable income is
unaffected by changes in tax rates.
This study integrates the impact of the rate changes on the
taxable income base when estimating revenue changes across income
groupings. Comparative income and revenue data for 1981 and 1982
are utilized to analyze the distributional effects of the Economic
Recovery Tax Act of 1981 (ERTA). The findings are discussed in
light of both economic theory and other research in this area.
Tax Facts and Tax Policy
Historical evidence sheds light on the likely distributional
effects of ERTA. The following four tax policy facts will help
the reader better understand the forces at work.
*Dr. Gwartney is a Professor of Economics and Policy Sciencesat Florida State University and Research Associate for thePolitical Economy Research Center.

50
Fact 1: Literally millions of Americans now pay marginal
tax rates that were previously reserved for only the rich and
super rich. During the last two decades, inflation and the accom-
panying bracket creep brought high marginal tax rates to the moder-
ately successful American family. Exhibit 1 illustrates this
point. In 1965, only 2.9 percent of the families (1.13 million
returns) filing joint returns confronted a marginal federal income
tax rate of 28 percent or more. By 1979, the figure had jumped
to 35.3 percent (15.238 million returns), a twelvefold increase
over the 1965 figure. Stated another way, by the end of the 1970s
most persons in the upper third of the income distribution faced
marginal tax rates previously confronted by only the very rich--
the top 2 or 3 percent of earners. As Exhibit 1 shows, the picture
is the same for still higher marginal tax rates. While only 1.0
percent (376 thousand) of the taxpayers filing joint returns in
1965 paid a marginal rate of 37 percent or more, the comparable
figure in 1979 was 12.8 percent (5.533 million returns). A similar
increase was recorded in the 49 percent marginal tax bracket.
These figures, as dramatic as they are, actually understate
the increases in marginal tax rates during the last two decades.
In the mid-1960s, persons facing marginal rates of 30 percent
or more would have had earnings above the cutoff point of the
Social Security payroll tax. This would not be true today. For
most taxpayers in the 30 percent federal income tax range, the
Social Security tax boosts their effective marginal rates another
6.7 percent. If they live in states with an income tax, this
tax takes another 5 or 10 percent of their additional earnings.

51
Exhibit 1: The Rising Marginal Federal Income Tax Rates: 1965-1979
1965 1970 1973 1977 1979
No. of Joint Returns 39.506 42.660 39.805 42.576 43.217(in millions)
Joint Returns (in millions)Facing:
Marginal Tax Rates of 28 1.130 2.984 5.386 12.003 15.238percent or more(percent) 2.9Z 7.02 13.5% 28.22 35.3%
Marginal Tax Rates of 32 .722 1.701 3.044 7.308 9.782percent or more .(percent) 1.8% 4.0Z 7.6% 17.2% 22.6%
Marginal Tax Rates of 37 .376 .797 1.321 2.965 5.533percent or more
-(percent) 1.0% 1.9% 3.3% 7.0Z 12.8%
Marginal Tax Rates of 49 .136 .296 .481 1.032 1.541percent or more(percent) 0.3% 0.7% 1.2% 2.4Z 3.6%
Source: Internal Revenue Service,Tax Returns (Annual).
Statistics of Income: Individual Income
52
Clearly, the tax collectors take 40 percent or more of each addi-
tional dollar earned by many middle and upper middle income
families--particularly those with dual earners.
Fact 2: As marginal tax rates increased during the post-1965
period, tax avoidance activities soared. Sheep may stand still
while they are sheared, but taxpayers do not. Predictably, they
responded to the higher rates by increasing their tax avoidance
activities. Self employment, which offers greater opportunity
for tax avoidance, expanded rapidly as the marginal tax rates
rose. The underground economy grew at a rate twice that of the
"reported income" economy. The prices of depreciable assets,
including housing, increased more rapidly than the general price
level, as investors sought out projects yielding accounting losses
while appreciating in value. Of course, the losses reduced their
current tax liability while the appreciation transformed ordinary
income into a capital gain.
In several areas, this expansion in tax avoidance is clearly
observable. A comparison of income losses relative to gains in
major categories affected by tax shelter investments illustrates
this point. As Exhibit 2 shows, during the 1966-1981 period,
there was a sharp increase in net income losses from rents,
business and professional practice, farming, partnerships, and
small business corporations, the income categories most directly
affected by tax shelter investments. In 1966, net income gains
from these five categories were seven times greater ($52.23 billion
compared to $7.43 billion) than the net income losses. In each
category, net income gains were substantially greater than the

,53
Exhibit 2: Net Income Losses Compared with Net Income Gains forSelected Sources of Income, 1966 and 1981
1966 Returns 1981 Return
Net Net Net NetSource of Income Gain Income Loss Loss/Gain Income Gain Income Loss Loss/Gain
Income Gain (in (in Ratio (in (in Ratioor Loss billions) billions) (percent) billions) billions) (percent)
Rents $ 4.36 $1.75 40.1 $ 15.05 $17.82 118.4
Business andProfessionalPractice 28.14 1.95 6.9 68.53 15.46 22.6
Farming 5.99 1.92 32.0 8.53 16.34 191.6
Partnerships 12.08 1.35 11.2 25.91 26.05 100.5
Small BusinessCorporations 1.66 .46 27.7 4.26 5.07 119.0
Total $52.23 $7.43 14.2 $122.28 $80.74 66.0
Source: Internal Revenue Service,Returns (Annual).
Statistics of Income: Individual Income Tax

| 54
losses. By 1981, the-picture had changed dramatically. By 1981,
the net income gains were only one and a half times greater
($122.28 billion compared to $80.74 billion) than the losses.
In four of the five categories the losses actually exceeded the
gains.
F Fact 3: High marginal tax rates promote economic waste and
discourage productive activities. When individuals bear the full
cost of their actions and are able to reap fully the gains that
occur from their activities, they use resources wisely. When
I bear the full cost of food, clothing, telephone service, recre-
ation facilities and thousands of other items, you can be reason-
ably sure that I will conserve on my use of these items. I will
not consume them unless I value the services that they provide
more than the cost of the provision. Similarly, when I am able
to reap the full benefits of my productive activities, you can
be sure that I will undertake even unpleasant tasks when the bene-
fits (usually personal income) exceed the costs. When individuals
bear the full cost and reap the full benefits, they will use
resources in a wealth-creating manner. They will engage in
positive-sum economic activity.
In contrast, as economists have long been aware, problems
arise when a sizable share of the benefits or costs emanating
-from economic activity accrues to non-participating parties.
This is precisely the problem that arises when marginal tax rates
are high. High maginal tax rates make it possible for individuals
to enjoy tax deductible items at a fraction of their costs to
our economy. High marginal tax rates make tax deductible expendi-

55
tures cheap to the taxpayer-consumer, but not to society. The
personal cost of tax-reducing expenditures such as business-related
vacations, luxury restaurants, nice automobiles, plush offices,
mortgage financed homes and literally thousands of other items
are substantially reduced because such items are deductible.
However, deductibility does not reduce the cost to society of
the valuable resources used to produce these commodities. Since
they bear only a fraction of the costs, individuals often choose
the deductible goods and services even though the items cost more
to produce than they are valued by the taxpayer-consumer. Wealth
is destroyed by this process; it wastes our valuable resources.
Simultaneously, high marginal tax reduce the incentive of
individuals to engage in wealth-creating activities that generate
taxable income. When taxpayers are permitted to keep only 40
or 50 percent of the fruits of their labor, they spend less time
working in the taxable income garden. Lawyers, doctors and other
high income professionals spend more time on the golf course and
consulting with their accountants and less time serving their
clients. Similarly, secondary workers decide that their job is
not worth the hassle when they get to keep only a fraction of
every dollar they earn. Individuals forego wealth-creating activi-
ties because they are unable to capture fully the fruits of their
labor. The result--a smaller output and slower economic growth.
It is no coincidence that the 1970s were a period of both
rising marginal tax rates and stagnating economic growth. The
incentive structure created by the former leads to the latter.

56
Rising-marginal tax rates and stagnating economic growth--
predictably, the two will be associated.
Fact 4: Essentially what the Economy Recovery Tax Act of
1981 (ERTA) did was correct for bracket creep and higher Social
Security tax rates. Except for the imposition of the 50 pecent
rate ceiling which took effect in 1982, ERTA did little to rollback
high marginal tax rates. In a nutshell, it kept rates from increa-
sing. Exhibit 3 indicates the marginal tax rate a two-earner
family of four would confront if their money income just kept
pace with inflation. Thus, their inflation adjusted family income
is constant. Only the federal income and Social Security taxes
are considered. The data indicate that by 1984, marginal tax
rates are slightly lower then 1980, but almost identical to the
marginal rates of 1979 for families with real incomes (1979
dollars) of less than $75,000. Since returns with an adjusted
gross income of $75,000 or less constitute approximately 98.5
percent of the total, it is clear that ERTA only modestly reduced
the enormous rate increases that took place during the 1970s.
The Incentive Effects of a Proportional RateReduction Differ Across Tax Brackets
Many observers are misled as to the distributional effects
of a change in tax rates because they erroneously assume that
taxable income is unaffected by tax rates. Static revenue com-
parisons based on the assumption that taxable would be the same
before and after the rate changes is a meaningless exercise.
They are akin to General Motors comparing before and after revenues
associated with, for example, 10 percent price reduction, assuming
that the number of GM automobiles purchased by consumers remained

57
Exhibit 3: Marginal Tax Rates for a Two-Earner Family of Four, 1979-1984a
Marginal Tax Rate
Adjusted Gross Income (percent)(1979 Dollars) 1979 1980 1982 1984
20,000 24.13 27.13 28.7 24.7
40,000 38.13 43.13 45.7 39.7
60,000 49.13 55.13 50.7 48.7
75,Q00 49.00 54.00 49.0 48.7
100,000 54.00 54.00 50.0 45.0
aThe data are for federal personal income and social security tax liabilities.The calculations are based on the following assumptions: The couple files ajoint return and all income is earned income. The second wage earner earnsone-half the amount of the first. Taxpayers take the zero-bracket amount oritemize deductions equal to 23 percent of income, whichever is greater. Whencalculating the 1980 ard 1984 incomes in 1979 dollars, the actual inflationrates were used for the 1980-1983 period and a 5 percent inflation rate wasprojected for 1984.

58
constant. However, since consumers would buy more GM cars at
the lower price, such a calculation would be of little value to
a manager seeking to determine the impact of a price reduction
on GM revenues. Similarly, since taxpayers will generate more
taxable income at the lower rates, the static projects reveal
little about the impact of the lower rates on tax revenues.
As Richard Stroup and I discussed in an article on the 1964
tax cut, economic theory provides insight on the distributional
effects of a proportional tax rate reduction.l The 1964 tax cut
reduced rates across the board by approximately 20 percent. Except
for the 50 percent rate ceiling, ERTA also reduced rates propor-
tionally. By 1984, both upper and lower rates applicable to nom-
inal income were approximately 23 percent lower, as compared to
the 1980 rates.
When tax rates fall, particularly high tax rates, people
will respond to the lower rates by spending more time earning
taxable income and less time (and money) with investment consul-
tants and tax experts figuring out how to shelter their income.
The result--the tax base expands due to the lower rates. Higher
rates exert the opposite effect. For an economist, the negative
relationship between tax rates and the size of the tax base should
be obvious. After all, it is merely a reflection of tilea bosi
economic postulate that "incentives matter" in a predictable way.
From an incentive standpoint, what really matters is the
impact of a tax rate change on after-tax income. People work,
lJames Gwartney and Richard Stroup, "Tax Cuts: Who Shouldersthe Burden." Economic Review: Federal Reserve Bank of Atlanta,March 1982.

59
save, and invest mainly for "take home" income. The larger the
share of additional earnings that the taxpayer is permitted to
keep, the greater his or her incentive to generate additional
income.
The incentive effects of a proportional tax reduction will
differ considerably across tax brackets. Proportional rate reduc-
tions, such as the 1963-65 and 1981-83 tax cuts, will increase
the take-home pay derived from additional earnings far more in
the upper brackets than for the lower brackets. Perhaps some
numbers will drive this point home. Suppose tax rates are cut
across the board by 20 percent. In the 10 percent bracket, the
rate is cut to 8 percent. For the 50 percent bracket, the rate
falls to 40 percent and the 70 percent rate declines to 56 per-
cent. Now, consider how this proportional rate reduction impacts
take-home pay. For persons in the 10 percent bracket, after-tax
income increases from 90 cents per dollar of additional earnings
to 92 cents, a paltry 2.2 percent increase. Clearly this small
increase is unlikely to exert a major impact on the incentive
of those taxpayers to earn more taxable income. In contrast,
look what happens in the 70 percent bracket. Here the 20 percent
rate reduction increases take-home pay from 30 cents to 44 cents
per dollar of 3dditional earnings--an increase of 47 percent.
This exerts a substantial incentive effect. Taxpayers in this
and other high income brackets are now permitted to keep a signif-
icantly larger proportion of their before tax earnings. Predict-
ably, they will respond by earning more taxable income and engaging

60
less intensely in tax shelter activities which generate less tax
savings at the lower rates.
How does this incentive structure affect the distribution
of the tax burden across income groupings? The answer is now
straightforward. Since the rates were all reduced by the same
percentage, the size of the revenue reduction will be inversely
related to the changes in taxable income. If taxable income is
virtually unaffected by the rate reductions, as is likely to be
the case in the lowest marginal tax brackets, revenues will fall
by the same percent as the rates. In these brackets, a 20 percent
rate cut will lead to approximately a 20 percent reduction in
tax revenues. In contrast, in the upper income (and marginal
tax) brackets where the incentive effects on take-home pay are
greater, increases in the tax base will at least partially offset
the lower rates. In these brackets, tax revenues will fall by
less than the 20 percent rate reduction.
Since tax revenues fall by a smaller amount in the upper
income brackets, the share of taxes collected from high income
taxpayers expands. As the Laffer curve emphasizes, if the expan-
sion in the revenue base in the upper brackets is large enough,
lower rates may lead to an increase in revenues. However, even
if this Is not the case, the incentive structure indicates that
the tax burden is shifted toward the rich.
The Distributional Effects of ERTA
Thus, economic theory indicates a proportional rate reduction
will shift the tax burden to high income taxpayers because the
taxable income base will be more sensitive to rate changes in

61
the upper tax brackets. However, the 50 percent tax ceiling
reduced the highest tax rates (on non-personal service income)
more than proportionally. Unless the tax base is highly responsive
in the upper brackets, the 50 percent ceiling may reduce the share
of revenues collected from taxpayers previously facing marginal
rates of 50 percent.or more. The test of a theory is in its
ability to predict. We now turn to the empirical evidence.
Exhibit 4 presents income and revenue data for taxpayers
most directly affected by the imposition of the 50 pecent rate
ceiling. In recent years, itemized deductions have averaged
slightly more than 20 percent of adjusted gross income (AGI).
Assuming itemized deductions summed to 20 percent of AGI, taxpayers
filing joint returns with adjusted gross incomes in excess of
$75,000 would have confronted marginal tax rates of more than
50 percent in 1981. The50 percent rate ceiling would have reduced
the marginal rates of similarly situated taxpayers in 1982. The
rates (on non-personal service income) of those at the top of
the income pyramid were slashed from 70 percent to 50 percent,
a whopping 28.6 percent cut in one year. Thus, in this area the
rate reductions in 1982 were both real and significant.
In 1981, 1.36 percent of the returns had gross incomes of
$75,000 more. Exhibit 4 compares the income and tax liability
of the top 1.36 percent of tax returns in 1981 with the parallel
data for 1982. Just as our theory indicated, the reported adjusted
gross income, wages and salaries, and taxable income of this group
of taxpayers grew quite rapidly. Even though 1982 was a recession
year and nominal gross national product rose by only 4 percent,
38-037 0 - 84 - 5

62
Exhibit 4: The Estimated Growth Rate of Income Components and the Income TaxLiability for Taxpayers Affected by the 50 Percent Tax Ceilingof ERTA Compared to Other Taxpayers
Top 1.36 Percent Bottom 98.64 Percentof Tax Returnsa of Tax Returns
Percent Percent1981 1982 Change 1981 1982 Change
No. of Returns 1.3005 1.2992 - 0.1 94.096 93.998 -0.1(in millions)
Income Range >$75,000 >$80,300 -- <$75,000 <$80,300 --
Adjusted Gross $177.0 $196.9 +11.2 $1595.6 $1652.3 +3.6Income (billions)
Wages and Salaries $102.3 $113.0 +10.5 $1383.8 $1451.6 +4.9(in billions)
TaxablelIncome $138.2 $155.0 +12.2 $1245.5 $1313.9 +5.5(in billions)
Income Tax $ 58.0 $ 60.5 + 4.3 $ 226.1 $ 216.4 -4.3Liability
(in billions)
aIn 1981, persons filing joint returns faced a marginal tax rate of more than50 percent on non-service income if their taxable income was in excess of$60,000. Allowing for 20 percent itemized deductions, this suggests thatreturns with an AGI of $75,000 or more would have confronted marginal ratesin excess of 50 percent in 1981. In 1981, 1.36 percent of all returns had anadjusted gross income of $75,000 or more. Here, the income and tax liabilityof the top 1.36 percent of returns (those confronting a marginal tax rate of50 percent or more in 1981) are compared with the income and tax liabilitydata for the top 1.36 percent of returns in 1982.
Source: The 1981 data are from Internal Revenue Service, 1981 Statistics ofIncome: Individual Income Tax Returns, Tables 1.1 and 1.3. The 1982data are from Internal Revenue Service, Statistics of Income: SOIBulletin (Winter 1983-84), pp. 11-22.

63
AGI, wages and salaries, and taxable income for the top 1.36 per-
cent of taxpayers, each expanded at double digit rates. As a
result of the rapid growth of taxable income, the tax revenues
collected from the top 1.36 percent of taxpayers rose from $58.0
billion in 1981 to $60.5 in 1982, a 4.3 percent increase in a
recession year. These findings illustrate that the taxable income
base is quite sensitive to changes in the rates, at least in the
upper tax brackets.
Exhibit 4 also presents the income and revenue data for all
other taxpayers (the bottom 98.64 percent). As expected, the
reported income of other taxpayers grew less rapidly, more in
line with the growth rate of GNP. As a result, the tax liability
of the bottom 98.64 percent of taxpayers, reflecting the lower
rates in 1982, declined by 4.3 percent. Thus, even though the
50 percent ceiling cut the top rates by a larger amount, tax
revenues collected from the taxpayers most directly affected by
the rate ceiling expanded by 4.3 percent while the tax liability
of other taxpayers declined by an identical percentage.
Exhibit 5 presents data on the share of tax revenues collected
from a broader set of income groupings for both 1981 and 1982.
The tax liability of the bottom 50 percent of returns fell from
$21.7 billion in 1981 to $19.5 billion in 1982. In these lower
tax brackets, the 10 percent lower rates resulted in approximately
10 percent less tax revenues. Thus, the bottom 50 percent of
returns contributed only 7.0 percent of the tax revenues in 1982,
down from 7.6 percent in 1981. The tax liability of taxpayers
in (a) the 50 to 75 percentile and (b) the 75 to 98.64 percentile

64
Exhibit 5: The Share of Tax Revenue Collected from Various PercentileGroupings Ranked According to Adjusted Gross Income--1981versus 1982
Income Tax Liability Share of Total(billions) Income Tax Liability
Percent1981 1982 Change 1981 1982
Bottom 50 percents $ 21.7 $ 19.5 -10.1 7.6 7.0
50 to 75 percentilea $ 59.0 $ 55.6 - 5.8 20.8 20.1
75 to 98.64 percentilea $145.4 $141.3 - 2.8 51.2 51.0
Top 1.36 percenta $ 58.0 $ 60.5 + 4.3 20.4 21.8
Total $284.1 $276.9 - 2.5 100.0 100.0
aThe adjusted gross income intervals for the percentile groups were:
Bottom 50 percent50 to 75 percentile75 to 98.64 percentileTop 1.36 percent
1981
<$14,160$14,160-$26,140$26,140-$75,000
>$75.000
1982
<$14,344$14,344-$26,855$26,855-$80,300
>$80,300
When necessary, interpolation was used to estimate the tax revenues within income
intervals.
Source: The 1981 data are from Internal Revenue Service, 1981 Statistics ofIncome: Individual Income Tax Returns, Tables 1.1 and 1.3 ihe 19o2data are from Internal Revenue Service, Statistics of Income: SOIBulletin (Winter 1983-84), pp. 11-22.

65
groupings also declined by 5.8 percent and 2.8 percent respec-
tively. Thus, the share of income tax revenues paid by these
groups declined slightly. In contrast, the share of income taxes
paid by the top 1.36 percent rose from 20.4 percent in 1981 to
21.8 percent in 1982. Note the decline in tax liability was
inversely related to income--the largest reductions in tax lia-
bility were in the lowest income and marginal tax brackets. As
economic theory indicates, this is precisely the pattern that
one would expect from a roughly proportional rate reduction.
Far from creating a windfall gain for the rich, as some have
charged, ERTA actually shifted the burden of the income tax toward
taxpayers in upper brackets, including those who received the
largest-rate reductions as the result of the 50 percent rate
ceiling.
Exhibit 6 presents parallel data for the 1964 tax cut. Just
as theory predicts, the proportional rate reductions of 1964-65
also shifted the tax burden to the rich. The tax revenues collec-
ted from the bottom 50 percent of returns fell by 6.4 percent
between 1963 and 1965. Smaller reductions in tax liability accrued
to those in the 50 to 75 percentile and 75 to 95 percentile group-
ings. In contrast, the revenues collected from the top 5 percent
of returns rose by 16.9 percent between 1963 and 1965. As a
result, the share of tax revenues collected from the top 5 percent
of taxpayers rose from 35.6 percent in 1963 to 38.5 percent in
1965. The proportion-of revenues collected from all other groups
fell. Just as economic theory predicts, the proportional rate

66
Exhibit 6: The Share of Tax Revenue Collected from Various Percentile GroupingsRanked According to Adjusted Gross Income Prior to and Subsequent tothe 1964 Reduction in Tax Rates
Tax Revenues Collected Percent of Personalfrom Group Inc4me Taxes
(in billions) Collected from Group
Percent1963 1965 Change 1963 1965
Bottom 50 percent $ 5.01 $ 4.69 - 6.4 10.4 9.5
50 to 75 percentile 10.02 9.90 - 1.2 20.8 20.0
75 to 95 percentile 16.00 15.88 - 0.7 33.2 32.1
Top 5 percent 17.17 19.05 +10.9 35.6 38.5
Total $48.20 $49.53 + 2.8 100.0 100.0
aThese estimates were derived via interpolation.
Source: Internal Revenue Service, Statistics of Income: Individual Income TaxReturns (1963 and 1965).

67
reductions of 1963-1965 like the reductions in 1981-1982 shifted
the tax burden to the rich.
Two Fallacious Views As To Why High IncomeTaxpayers Paid More Taxes in 1982
Confronted with the evidence that the tax burden shifted
toward upper income taxpayers in 1982, critics of the "incentives
matter" view have raised two points. First, some have argued
that the pattern merely reflects cyclical conditions--the recession
of 1982. Of course, a recession does reduce incomes. However,
there is no reason to believe that it reduces incomes more in
lower tax brackets than in upper brackets. In fact, the evidence
indicates that the business income and profits fluctuate more
than other components of income over the business cycle. This
being the case, a recession is more likely to retard incomes in
the upper tax brackets more severely than in the lower brackets
because business income and profits are a larger component of
total income for those with higher incomes. However, the most
damaging evidence against the cyclical view is the pattern of
the 1963-1965 data. During this period of economic growth and
rising incomes, the distributional pattern emanating from a tax
reduction was similar to the pattern experienced in 1982. This
indicates that changes in the structure of incentives across tax
brackets is far more important than cyclical conditions as a deter-
minant of changes in tax liability across income groupings.
Second, other critics have argued that the shift in the tax
burden toward the rich merely reflects rising capital gains asso-
ciated with the bull market on Wall Street beginning in August
1982. Inspection reveals that this is a "tail wags dog" theory.

68
Capital-gains are a small component of total income. In 1981,
net capital gains less losses contributed only 1.7 percent to
the total adjusted gross income. Even for the top 1.36 percent
of taxpayers, the capital gains component was only 9.6 percent
of AGI. Given the size of capital gains as a share of AGI, it
would have taken a huge expansion in capital gains income to
explain the observed pattern of income growth across income group-
ings in 1982. But the actual increase in net capital gains income
was rather modest--from $29.3 bilion in 1981 to $32.0 billion
in 1982, an increase of only 9.2 percent. Of course, the major
component of income is wages and salaries. In 1981, the wage
and salary component summed to 84.percent of AGI. As Exhibit
4 shows, this component of income grew substantially more rapidly
in the upper tax brackets between 1981 and 1982. Clearly, it
provided the major impetus for the growth of taxable income in
the upper brackets.
Why Taxpayers Have Not Made a Major MoveOut of Tax Shelters
As we noted previously, the tax shelter industry boomed with
the rising marginal tax rates of the 1970s. In fact, taxpayers
are still adjusting their investment portfolios to the higher
marginal rates. We are in the midst of a tax shelter investment
boom. Why didn't the 1981-1984 tax cuts arrest the growth of
the tax shelter industry?
There are three major reasons why recent tax changes have
failed to reduce significantly the size of the tax shelter indus-
try. First, given bracket creep and higher Social Security tax
rates, marginal tax rates are not much lower today than they were

69
in 1979 and 1980 for taxpayers with an AGI of less than $75,000
(see Exhibit 3). Since the overall marginal rates were not
reduced, at least not reduced very much, it is not surprising
that there has been little movement away from tax shelters.
Second, ERTA provided far more rapid depreciation allowances
beginning in 1982. This aspect of the legislation would make
tax shelters more attractive. The more rapid depreciation write-
off would mean larger up front losses from real estate and other
depreciable investments. Far from discouraging the tax shelter
industry, the rapid depreciation allowances made the shelter
business more profitable.2
Finally, the incentive to engage in tax shelter investments
is influenced by expected future rates as well as current rates.
Many influential policymakers have argued, and continue to argue,
that tax rates will have to be increased in the near future.
2Some of us indicated at the time the legislation was passed,
that this would be the case. For example, Richard Stroup andI stated the following at a conference held in March 1982:
"Will the Reagan tax program reduce the flow of resourcesinto tax avoidance? Unfortunately, the answer is, 'Probablynot.' Congress added sections providing favorable tax treat-ment for special-interest groups such as racehorse ownersand commodity traders. The leasing provision of the newlaw will increase the attractiveness of this technique asa means of sheltering income. The more rapid depreciationwrite-offs, particularly for real estate, will clearlyincrease the attractiveness of tax-shelter investments indepreciable assets.
However, the major reason for doubting that the 1981legislation will reduce tax avoidance is that for mostpeople it does not reduce marginal tax rates on realincome. The rates during 1981-84 will be lower thanthey would have been in the absence of the Reagan plan.However, they-will be about the same or higher than the1980 tax rates."
See Federal Reserve Bank of Atlanta, Supply-side Economics inthe 1980s (Westport, Conn.: Quorum Books, 1982).

70
Given the current environment, many investors anticipate higher
tax rates in 1985 and 1986. Predictably, they will stay with
their tax shelter investments, so they will not be caught short
when the anticipated higher rates are instituted.
Additional Evidence from the 1979 Data
Analysis of both the 1963-1965 and 1981-1982 data indicate
that the taxable income base is more responsive to rate changes
in the upper income (and tax rate) brackets. In the terminology
of economists, the tax elasticity coefficient is larger in the
upper income brackets. In order to investigate this issue more
thoroughly, Professor James Long of Auburn University and I
utilized the Internal Revenue Service 1979 Individual Tax Model
File to estimate the impact of differences in marginal tax rates
on the taxable income base. Since the IRS data contain a state
of residence indicator, we were able to integrate the federal
and state rate structures so the income base of persons with the
same gross income but a different effective marginal tax rate
(reflecting differences in the state marginal tax rates) could
be compared:
Seeking to obtain an income measure that was not contaminated
by tax sheltering, we developed a gross income variable. "Gross
income" is defined as the positive components of income arnd dlhus
is a measure of taxpayer income prior to their engaging in tax
shelter activities. In contrast, "adjusted gross income," as
defined by the IRS, indicates the income of taxpayers after deduc-
tion of losses from many, if not most, tax shelter activities.
71
Thus, gross income is a better indicator of the taxpayer's income
level in the absence of tax shelter activity.
Utilizing the 1979 data, the following model was developed
and estimated:
Taxable Income = f(MTR, GI, Age, PE, and IA)
where: MTR is the combined marginal federal and state income
tax rate the taxpayer would confront in the absence
of deductible expenditures and deductions for losses,
GI is the gross income of the tax return,
Age is a dummy variable indicating the taxpayer is age
65 or over,
PE is the number of persoral exemptions, and
IA is a dummy variable indicating the taxpayer used
the income averaging method to calculate tax lia-
bility.
In order to reduce variability from factors outside the focus
of our study, only taxpayers filing joint returns were included
in our analysis.
Taxpayers residing in states where the state marginal tax
rate is higher will confront higher marginal tax rates than tax-
payers in states with lower rates. State marginal tax rates range
from zcro in ztates without an income tax to maximum rates in
the teens in several states.3
Therefore, even after making allow-
ance for the deductibility of state income tax payments on one's
3Florida, Nevada, South Dakota, Texas, Washington, and
Wyoming did not levy a state income tax. In contrast, Cali-fornia, Delaware, Hawaii, Iowa, Minnesota, Montana, New York,and Wisconsin all levied maximum rates of 11 percent or morein 1979.

. 72
federal return, differences in state income tax rates lead to
substantial differences in marginal rates among taxpayers with
similar gross income and number of exemptions.
Within the framework of our model we are most interested
in the impact of changes in marginal tax rates on taxable income.
Since higher marginal rates increase the taxpayer's incentive
to shelter income and thereby reduce taxable income,4
we expect
a negative relationship between taxable income and marginal tax
rates. The regression equations for our model were estimated
within income groupings. Exhibit 7 summarizes the results. As
expected, higher marginal tax rates exerted a negative impact
on taxable income for all income categories except the $20,000
to $40,000 grouping where the estimated coefficient was zero.
Predictably, the largest negative impact was in the high income
(and high marginal tax rate) categories. For the $40,000 to
$60,000 gross income cell, after adjusting from gross income,
age, personal exemptions, and income averaging, taxable income
declined by $103 for every one unit increase in marginal tax
rates. This indicates that in this income range, a one unit
increase in the marginal tax rate induces a decline of $103 in
taxable income. For the $60,000 to $80,000 gross income grouping,
taxable income is estimated to decline by $321 for each one unit
increase in marginal tax rates. As one moves to income groupings
4Since we are interested only in taxpayer decisionmaking that
influences their taxable income, our taxable income variable addsstate and local income tax deductions to the taxpayers' taxableincome. Thus, the lower taxable income for taxpayers confrontinghigh marginal tax rates reflects factors other than the deduc-tibility of state and local income tax liability from their grossincome.

73
Exhibit 7: The Estimated Elasticity of Taxable Income with Respect toMarginal Tax Rates for Various Income Categories - JointReturns 1979
HypotheticalImpact of One Estimated Marginal FederalUnit Increase Elasticity of Income Tax Rate,
in Marginal Taxable Income Midpoint ofTax on with Respect Income Interval,
Taxable Income to MTR 19 79 aGross Income (1) (2) (3)
$ 0- 20,000 -s 4 - .01 16
20,000- 40,000 0 .00 28
40,000- 60,000 - 103 - .13 43
60,000- 80,000 - 321 - .34 49
80,000-100,000 - 1,525 -1.29 54
100,000-120,000 - 2,584 -1.88 54
120,000-140,000 - 3,371 -2.10 59
140,000-170,000 - 3,629 -1.92 64
170,000-200,000 - 4,999 -2.38 64
over $200,000 - 5,709 -3.93 >64
aAssumes a family of four married and filing a joint return. Taxpayers areassumed to take either the standard deduction or itemized deductions equalto 22 percent of AGI, whichever is greatest.

74
above $80,000, the negative impact of marginal tax rates
increases. For the $80,000 to $100,000 gross income cell, the
negative impact of a unit tax rate change rose to $1,525. Still,
larger estimates were obtained for income brackets above $100,000.5
The estimates of Exhibit 7 (column 1) can be converted easily
to tax rates elasticities. The tax rate elasticity coefficient
is equal to:
nercent change in taxable incomepercent change in marginal tax rate
Since the tax base and tax rate generally change in opposite direc-
tions, a negative tax rate elasticity coefficient is anticipated.
If the percent change in the tax base (taxable income in our case)
is less than the percent change in the tax rate, the elasticity
coefficient will be less than one. Under these circumstances,
higher (lower) marginal tax rates would lead to an expansion (con-
traction) in tax revenues. In contrast, when a change in the
tax rate leads to an even larger change in the tax base, the tax
rate elasticity coefficient will be greater than one. When this
is the case, higher (lower) tax rates would lead to a reduction
(increase) in tax revenues. Tax rate elasticity coefficients
50ur estimate for the open-ended $200,000 and above groupingshould be interpreted with caution. Since the '.ta:-..:a AvanueService does not provide information on state of residence forreturns with an adjusted gross income of $200,000 and over, thesereturns had to be excluded from our analysis. Thus, we are leftwith persons who had an adjusted gross income of less than$200,000, but a gross income (positive components of income) ofmore than $200,000. The more tax sheltering undertaken by a tax-payer with an adjusted gross income near the S200,000 cutoff,the more likely their gross income will place them in our $200,000and over bracket. Therefore, taxpayers in our $200,000 and overgross income grouping may be a bias sample of all returns in thisbracket.

75
in excess of unity indicate that taxpayers in the grouping are
on the backward bending portion of their Laffer curve.
Exhibit 7 (column 2) presents estimates for the tax rate
elasticity coefficient for each of the ten gross income groupings.
For income cells below $60,000, the tax elasticity coefficient
is small. However, beginning with the $60,000 to $80,000 gross
income cell, the estimated elasticities rise sharply. For gross,
income cells in excess of $80,000, the estimated tax elasticity
coefficient is greater than one. This indicates that lower mar-
ginal rates in these cells would have raised more tax revenue.
Perhaps a little additional discussion is necessary to high-
light the importance of these estimates. Consider the $60,000
to $80,000 gross income category. Our analysis indicates that
taxpayers who have the same gross income (remember gross income
is a control variable in the model) report $321 less taxable income
for each one unit increase in their effective marginal tax rate.
Given the shrinkage in taxable income as tax rates rise in this
grouping, it takes a substantial increase in tax rates in order
to squeeze additional tax revenue from this tax bracket. In fact,
the estimated tax elasticity of minus .34 indicates that a 10
percent increase in tax rates in this bracket will reduce taxable
inccmc by 2.1 percent. Thus, the 10 percent higher marginal rates
will lead to, at most, only about a 6.6 percent increase in
revenues from taxpayers in this bracket.
For higher incomes (and tax rates), the tax elasticity is
still grter. For eample the 1-29 estimated tax elasticity
in the $80,000 to $100,000 grouping indicates that a 10 percent

76
rate hike in this category would cause a 12.9 percent shrinkage
in taxable income. Of course, since the decline in the tax base
is larger than the increase in rates, higher rates for this bracket
would lead to a reduction in revenue collected. As of 1979, our
estimates indicate that taxpayers in this grouping were on the
backward bending segment of the Laffer curve. As expected, the
estimated elasticities are even larger for the higher income cate-
gories.6
In interpreting the estimates of Exhibit 7, it is important
to recognize that they reflect long-run adjustments. One would
expect a smaller shrinkage in the tax base in the year or two
immediately following a rate increase than the shrinkage that
will eventually take place as the result of a tax rate increase.7
The major factor contributing to rate differences within income
categories in our model is differences in state income tax rates.
Since the gefieral pattern of state rates has been in place for
a considerable period of time, it is reasonable to assume that
taxpayers have adjusted their tax sheltering activities accord-
ingly. Thus, the responsiveness of taxable income to changes
in tax rates in the year or two immediately following a change
60ur model estimates the impact of a change in tax rates ontaxable income, holding gross income constant. To the extentthat higher marginal rates also induce taxpayers to consume moreleisure, engage in the underground economy, shift income to closelyheld corporations, and/or take other steps (e.g., purchase munici-pal bonds) to reduce their reported gross income, our model willunderestimate the negative impact of higher marginal tax rateson the taxable income base.
7See James M. Buchanan and Dwight R. Lee, "Politics, Time,
and the Laffer Curve," Journal of Political Economy, vol. 90,no. 4 (1982), pp. 816-819.

77
in tax rates may be somewhat less than the magnitude indicated
by the estimates of Exhibit 7.
Summary
Economic theory indicates that the taxable income base will
be more responsive to changes in tax rates in the upper tax brac-
kets than in the lower brackets. A detailed analysis of the 1979
individual tax data indicate-that this proposition is true. Given
the greater responsiveness in the upper brackets, proportional
rate reductions such as those instituted in 1964-1965 and 1981-1984
will shift the burden of the income tax to taxpayers in the upper
brackets. Predictably, there will be an increase in the share
of tax revenues collected in the upper income brackets. The empir-
ical evidence from both the 1963-1965 and the 1981-1982 period
is highly consistent with the underlying economic theory.

78
Senator JEPSEN. Thank you, Mr. Gwartney.Mr. Richard Rahn, U.S. Chamber of Commerce, welcome. You may
proceed.
STATEMENT OF RICHARD RAHN, VICE PRESIDENT AND CHIEFECONOMIST, U.S. CHAMBER OF COMMERCE
Mr. RAHN. Thank you. On behalf of our 200,000 members, I appre-ciate the opportunity to come before you today to talk about the impactof the tax changes made in 1981.
Now the proponents of the Roth-Kemp proposal argue that it wouldbroaden the tax base by reducing the tax disincentives on work, saving,and investment, resulting in higher rates of economic growth and moreemployment and that the wealthy would pay a higher portion of thetotal tax burden.
Those detractors argue that tax cuts would be unfair to the poor.The CBO and others have used static analysis to build their argu-ments. They assume that there was an economic man out there who didnot respond to changes in relative rewards of tradeoffs between workand leisure, between consumption and saving, between tax-shelteredand nonsheltered income. In other words, they ignored humanbehavior.
In fact, I found it rather inexcusable that the CBO in March 1984came up with a projection claiming that the poor would pay an in-creased proportion of the total taxes and the wealthy less, when theactual data had been out 3 months previous for the year 1982 and atminimum I find that kind of analysis and projections dishonest.
But in essence, what has happened-and I fully concur with the twoprevious witnesses on their description of the effects of these taxchanges-but what has been overlooked as a result of these changesis that now the United States has the fastest economic growth of anycountry in the world. Some of us can remember back to the mid-1970'sand I think particularly of President Carter's malaise speech, wherethe argument was that we were a developed economy and hence wecould not expect to grow much in the future, if at all, and inflation andhigh levels of unemployment would be with us forever.
But what has happened? The first quarter of this year we've grownat an 8.8-percent annualized rate. Over the last 12 months, we've grownat a 7.8-percent annualized rate, again, the highest growth rate of anycountry in the world. We have created 6.3 million new jobs in the last18 months. We have created 890,000 new jobs in the month of Mayalone. That is more jobs than the European Common Market has cre-ated in the last 13 years. Yet they are complaining about us. There hasbeen, I think, an undue focus on the Federal deficit, claiming that thetax cuts resulted in the high deficit.
We had a deficit problem that comes about primarily because ofincreased spending, but even so, the facts are that the deficit is comingdown very rapidly.
Last year, the deficit was about $195 billion. This year, the Federaldeficit is likely to come in between $160 and $168 billion and by theend of the year will probably be running at an annualized rate of about$130 billion.

79
At the same time, due to the economic recovery brought about bythese tax changes, State and local governments are running a surplusin the $60 to $70 million range on an annualized basis.
The result of this is that our total governmental sector deficit now isabout $100 billion, down substantially from last year. This comesout to be about 2.9 percent of our GNP, which is one of the lowestnumbers of the major industrialized countries.
So when other countries of the world complain about our high def-icits, I find they are being highly hypocritical. The Italians, for in-stance, are running a governmental sector deficit of 12.5 percent. Sowhen you see countries around the world saying that our deficits bringon high interest rates, I look at this as nonsense.
Clearly, they have hurt their own economies by running both highdeficits and high taxes, hence they have not created jobs in the way wehave and they have not gotten out of the economic stagnation thathas plagued so many countries during the 1970's.
My concern is that the forces who are trying to mislead the Ameri-can people on this phony fairness issue are working to increase taxesand increased taxes would have a number of detrimental effects.
First of all, we have to realize that in this recovery we have had themost rapid rate of increased capital formation of any recovery since1950. Plant and equipment spending has been up 16.5 percent duringthe last five quarters. The average of the postwar recoveries is only8.4 percent.
The changes made in the capital cost recovery part of the Roth-Kemptax bill have resulted in this rapid increase in investment spendingand that has created jobs. There is nothing fairer than you can dofor an unemployed person than to create a job for him.
If these things are changed, as has been proposed by some of theMembers of Congress, and we go back to the old system, you can wellexpect that we will have reduced levels of capital formation, reducedlevels of job creation, reduced economic growth, and a reduced increasein real per capita incomes for all our citizens.
We at the chamber are opposed to any tampering with the accel-erated tax recovery program. We are opposed to the repeal of index-ing. In fact, I find it a great irony that many of those politicians thatwant to repeal indexing claim they care about low income people. Therepeal of indexing would not really benefit millionaires by more thanan i1nfnitPsimal mmniint- ht. it would have. enormous detrimental ef-fects on low and middle income taxpayers. And I look at that as a greatstep backward.
Again, Mr. Chairman, I urge you and your colleagues to stick withthe course that has brought this recovery about, that has caused theUnited States to have the highest rate of economic growth in theworld, that has caused the United States to shift the tax burden fromlow income to higher income people, and has resulted in such a highrate of job formation.
Thank you very much.[The prepared statement of Mr. Rahn follows:]

80
PREPARED STATEMENT OF RICHARD RAHN
I am Richard Rahn, Vice President and Chief Economist for the Chamber
of Commerce of the United States. On behalf of our over 200,000 members, I
would like to thank you for the opportunity for expressing our views on the
fairness of the Economic Recovery Tax kt of 1981 (ERTA).
The Goal of ERTA
ERTA led to at least a 25 percent reduction of marginal tax rates for
everyone and about a 7.5 percent reduction in the average person's tax
liabilities. Single taxpayers making $41,500 or more and married taxpayers
making more than $60,000, however, saw their rates reduced from 70 percent to
50 percent, or about 29%.
Proponents of the Reagan tax cuts urged that the tax cut would
encourage more work, savings and investment and would lure the rich out of tax
shelters and into taxable investments. This would increase the tax base and
actually increase the share of taxes paid by the rich. Further, everyone
would benefit from the economic growth sure to follow.
In effect, with the rate cut from 70 percent to 50 percent, the rich
would both earn and "show" more income. In the long run, the tax cuts, by
increasing the return to capital and labor could also lead to robust economic
growth, an even greater expansion of the tax base and more economic benefits
for everyone.
81
What ERTA's Detractors Said
Many doubted the efficacy of these 'supply-side"incentive effects.They maintained that such a drastic cut of marginal rates would have no impact
upon the tax base. As a consequence, less taxes would be collected from therich and the poor would have to shoulder a larger percentage of the tax
burden. Some have argued for three years that the tax cut favors the rich andhave attempted to sell that notion.
This is a very sensitive issue and the resolution of the debate willinfluence the course of economic policy for decades to come. A recent volley
in the continuing battle over the actual effects of the Reagan tax cuts was aStaff Analysis prepared by the Congressional Budget Office (CBO). The CBO
study, entitled The Combined Effects of Federal Taxes and Spending Programs
since 1981, was a static estimate of net tax reduction by income class andgave the distinct impression that the tax cuts would actually reduce the share
of taxes paid by the rich and increase the poor's share. Some members of thepress, ever eager to pounce on the "fairness issue", utilized the CBO study to
attack Reaganomics. 'Rich gain, the poor lose", read the headlines.
Reagan Tax Cuts Soak the Rich
The results for 1982 are now officially in. They show emphatically
that incentives do matter. The percentage of taxes paid by the rich has
increased while the percent paid by the poor has actually fallen.
The actual results for 1982 are shown in Table 1. They clearly
document the powerful incentive effects triggered by the 1981 tax cut. Thepercentage of taxes paid by those in the income classes above $50,000 actually
increased. Individuals making $1 million or more paid 42 percent more taxesin 1982, after the tax cut. As shown by table 1, a reduced share of taxes was
paid by lower income groups.

82
The pattern is clear. If one wants to truly "soak the rich," the way
to do it is to reduce high marginal tax 'rates. Some of the most able
ministers of public finance, cognizant of the disincentive effects of
taxation, have employed this tactic to boost both economic growth and tax
revenues. In the nineteenth century, William Gladstone of England often
employed the metaphor that imposing high taxes on the rich was like killing
the goose that laid the golden egg. His tax cuts were an important ingredient
in the booming economic growth of the British Empire during the middle and
late nineteenth century. Andrew Mellon, Secretary of the U.S. Treasury during
the 1920s, used the same policies to boost taxes paid by the rich. He argued,
"Is it fair to tax the rich at a very high rate and collect a paltry amount or
tax them at a lower rate but get more money?"
The Failure of Static Economics
Apparently, history seem easily neglected when it comes to examining
the actual effects of the Reagan tax program. Although it was merely a static
estimate, the CBO analysis, for example, was used as a basis for prediction,
by others. The CBO simply "projected" tax shares by multiplying the previous
tax base with a lower tax rate. This static arithmetic exercise would
obviously lead to a smaller share paid by the upper income groups since the
tax cuts were initially greater for this group. The CBO exercise was
inexcusably misleading because they employed their static revenue estimates in
a March, 1984 report even though actual results were available in January 1984.
Table 2 illustrates the large reduction in tax revenues found by CBO in
its study. In 1982, for income categories above $40,000, CBO projected a $23
billion shortfall. The actual results show that tax revenues from this group
actually rose by approximately $4.5 billion. This increase is all the more
impressive since it occurred in during a deep recession. The marginal rate
reduction caused higher income taxpayers to work more, invest more and to
invest in higher risk-higher return assets; the lower rates also encouraged
the rich to shelter less income, placing their resources instead in more
productive areas. These effects were so powerful that they overshadowed the
effects of the cyclical downturn.

83
Actual results for future years will almost certainly show greater
taxes collected from higher income taxpayers, not less. Whereas manyinterpreted the CB0 study to mean that the rich will be paying less in taxes
in response to a cut in marginal tax rates, the available data indicates justthe opposite. Apparently, when it comes to actual results, supply-side
incentive economics is alive and well.
In the face of such overwhelming evidence, critics continue to
quibble. John Berry of the Washington Post argues that the tax cuts have,
nevertheless, been unfair since total income, in 1982, has fallen for income
classes below $25,000. However, as the Wall Street Journal notes, this haslittle to do with fairness. The fact is that more lower bracket taxpayers
simply moved up the income ladder. 20.6 million taxpayers claimed income
between $25,000 and $50,000 in 1981, 22 million did so in 1982.
A legitimate concern is whether the wealthy paid increased taxes simply
due to bracket creep. Are the rich simply paying more because this group is
becoming larger through bracket creep?
Probably not. 1982 was a year of low inflation; the Consumer Price
Index (CPI) increased by only 3.9 percent. Consequently, not much bracketcreep occurred. Furthermore, the percentage of taxes paid by the rich has
increased only in those years where they have received significant tax
decreases. From 1973 to 1983, the most important bracket creep years, the
sharpest rise in the percentage of taxes paid by the rich occurred only inthose years which coincided with tax reduction. For example, the effective
maximum rate on capital gains above $50,000 fell from 49 percent to 28 percent
in 1978, then to 20 percent in 1981. It was over this same period that we
experienced a significant increase in the percentage of taxes paid by the
rich, the sole group for whom capital gains are an important source of income.

84
Why Most Economists' Forecasts Are Erroneous
Why is it that many, perhaps most, economists continue to believe that
the path to higher tax revenues is to push tax rates even higher? The answer:
because they fail to incorporate the incentive effects of taxation into their
analyses. Within their macroeconomic models lurk a strange sort of 'economic
man," a person who does not respond to changes in the relative rewards or
trade-offs between work and leisure, consumption and savings, tax-sheltered
and nonsheltered investments. Human nature is blithely ignored.
The failure to consider the incentive effects of taxation is clearly
stated, for example, in the statement of methodology in the CBO report. The
report notes that their "estimates do not take account of an individual's
behavior resulting from tax changes as they affect the household or the
economy at large." In effect, this statement is equivalent to saying that "we
are going to estimate the effects of Reaganomics by assuming that Reaganomics
does not work." Recall, the point of Reaganomics was that the supply-side
incentive effects of the 1981 tax cuts.
Indexing Must Be Retained
Beginning in 1985, the personal exemption and tax rate brackets will
increase each year to compensate for increases in the cost of living as
measured by the CPI. This provision is most important to lower and middle
income taxpayers; wealthy taxpayers are already in the top bracket and
therefore will remain subject to the same top marginal rate whether the tax
code is indexed or not.
Tax indexing assures honesty and integrity in the tax policy process.
It will prevent continued unlegislated increases in real individual tax
liabilities that result entirely from the effects of inflation on the tax
system. If tax indexing were repealed, individual and business taxpayers at
the lower income levels would continue to be taxed at higher and higher
rates. Furthermore, inflation would lessen the value of the personal
exemption and zero bracket amount, which are relatively more important to
lower income persons.

85
As noted above, the relative tax burden on the wealthy has increased
over the past several years. This is because we have had de facto indexing.
The 25 percent cut in marginal rates has benefitted lower income taxpayers
disproportionately over the past several years; middle income taxpayers
received a reduction in rates each year -- helping them to compensate for
bracket creep -- while the highest income taxpayers remained subject to the
highest marginal rates. The rate cuts helped lower income taxpayers avoid
bracket creep, even though the code was not indexed. Inflation increased
their nominal incomes, but not their real incomes, and would have forced them
into ever higher tax brackets if the tax cuts were not taking effect at the
same time.
The Congressional Research Service in its January, 1983 study noted
that, because of narrower low income tax brackets and fixed personalexemptions, inflation disproportionately hurts lower and middle income
taxpayers. It concluded that this continual increase in their tax burden will
be stopped by indexing. Instead of increasing the burden on the middle income
taxpayers, it concludes that "once indexation begins this new distributionwill, for all practical purposes, be 'locked in'". That is certainly
preferable to increasing the burden on middle income taxpayers by continued
and unlegislated bracket creep.
Record Capital Formation
The Accelerated Cost Recovery System (ACRS) was a cornerstone of ERTA
and it is working. Replacement of the inadequate Asset Depreciation Range
(ADR) system with ACRS cut the cost of capital and allowed businesses to make
the investment in plant and equipment needed to drive the recovery.
Nonresidential fixed investment (equipment and machinery) has increased by
16.5 percent in the five quarters since the recovery began in the fourth
quarter of 1982. This is the highest rate of capital formation in any
recovery since 1949 (when it grew at 22.5 percent). The average increase
during post-1950 recoveries is 8.4 percent, half of the present rate.
38-037 0 - 84 - 6

86
CAPITAL FORMATION DURING THE RECOVERY
Recovery Began
1949195419581961197019751980Average of all 7Average last 4
1982 most recent
Five Quarter Percentage Increase inFixed Nonresidential Investment
19.115.310.510.76.38.87.8
8.4
16.5
Quarters After Peak
135
CAPITAL RECOVERY DURING THE RECESSION
Average of Seven Postwar Recessions
-2.0%-6.4%-14.2%
Capital formation did not fall nearly as much during the
because of ACRS.
Last Recession
+0.2%-4.1%-7.5%
last recession
Increased capital formation increases productivity, employment and
competitiveness. Because pre-ERTA allowances were insufficient, the U.S.
economy has fallen behind, stagnated and become uncompetitive. Our capital
stock is much older than our trading partners because our allowances have beeninsufficient for decades. Any further cutbacks in ACRS will sabotage the
progress made to date.
The tax law has undergone many changes over the last seven years --
often several major changes in one year. Businesses have watched tax cuts be
enacted only to be undone within the year. This sort of activity makes it
difficult to plan. Moreover, it makes every tax reduction suspect and
therefore reduces the efficacy of its incentive effects.

. 87
Mny businesses choose not to take "advantage" of new tax incentivesbecause they expect the new advantages to disappear. They will not makemarginal investments on the basis of tax provisions if they expect them to
disappear, thus rendering their investments unprofitable.
ACRS under ERTA was simple. The Tax Equity And Fiscal Responsibility
Act of 1982 (TEFRA) introduced new complexities. Any additional attempts todecrease depreciation allowances will just add complexity. This ever
increasing complexity is rapidly undoing the progress made in 1981.
One of the most important incentive effects of lower taxation is the
increased reward to both savings and investment. Lower marginal tax rates
reduce the tax wedge that exists between savings and investment. It
simultaneously increases the after tax reward to savings and the after tax
return on capital investment. As Dr. Norman Ture, former under secretary of
Treasury for tax and economic affairs, notes, this has been an importantcharacteristic of the current expansion. The recovery has been literally
driven by gross private investment.
Dr. Ture states that real gross private domestic investment surgedahead by 37.4 percent from the fourth quarter of 1982 through the fourth
quarter of 1983, a growth rate almost seven times that of consumption, and
substantially faster than the 26.4 percent average of the first-year growth
rates of investment spending for prior postwar recoveries. Producers' durableequipment outlays were up a remarkable 20.3 percent, almost double the average
first-year postwar recovery rate. Residential investment, presumably a
casualty of "gigantic federal budget deficits', increased during the first
year of the current recovery by 37.4 percent, more than twice the postwaraverage first-recovery-year rate. Consumption certainly has not been the
prime mover of this recovery to date. Capital formation has provided most ofthe momentum.
The Futu.e Course nf Fisral Policy
As we look beyond the impact of the 1981 tax cut on 1982 tax revenues,the positive incentive effects of the tax cuts continue to unfold. The robust
expansion presently underway has developed unexpected speed and power. The

88
incentive effects of taxation have played an important role, particularly in
business fixed investment. The effects of lower taxation not only contributed
to the rising tax share paid by the rich, but also to the strength of the
present economic recovery.
What this adds up to is a surprisingly large increase in the tax base.
The incentive based tax cuts have been responsible for a 12.5 percent increase
of taxes collected in the first seven months of 1984 compared to 1983. In
effect, economic growth is increasing federal revenues at the same time it is
cutting federal spending. Better business conditions have resulted in higher
tax revenues and reduced unemployment benefits. If this trend continues, the
FY'84 deficit would be $37 billion less than the $195 billion FY'83 deficit.
Having failed to make much of a dent in the federal budget, some now
cast their eyes upon so-called tax "reforms" to close the deficit. For the
most part, this translates into a euphemism for major tax increases. But
where are the tax revenues to come from?
Evidence provided by the Internal Revenue Service (IRS) indicates it
will not come from the rich. Increasing tax rates which the rich will simply
drive them into tax shelters and reduce federal revenues. The Grace
Commission has calculated that even if the IRS confiscated one hundred percent
of all remaining taxable income above $75,000, it would run the government for
no more than ten days.
This means that any tax increase will come out of the paychecks of
lower and middle income class taxpayers. This group accounts for ninety
percent of all personal income tax payments. Their 1981 tax cuts have already
been whittled away by bracket creep, Social Security tax increases, and higher
excise taxes. How much further can we dip into their pocketbooks?

89
The message should be clear by now. Any major assault on the federal
deficit must be based on cuts in the growth of federal expenditures. Anincrease in tax rates would create strong disincentive effects that would
eradicate any gains made by reducing the demand for credit by the federalgovernment. Furthermore, it would not lead to anything like the increased tax
revenues that proponents of tax increases claim. We must face up to theproblem that the federal government is an extravagant spender, and that one
does not cure the habits of an extravagant spender by providing him with morefunds.
Concl usion
The results of the 1981 tax cut are filtering in. They show that these
tax cuts have had strong incentive effects. They have increased tht share oftaxes paid by the rich by causing them to produce more and to shelter less
income. They have been a prime ingredient in the current economic expansion.ACRS has caused a dramatic increase in capital formation which is vital for
continued economic growth. This proven success should place the focus ofdeficit reduction on the expenditure side of the ledger. Major tax increases
threaten to reverse all the gains that have been made so far.

90
TABLE I
TAX SHARE UNDER ERTA 1981-1982 CUT(Millions of $)
Net IncomeGroup
S0-10,O000$10-1 5,000$15-20,000$2-50,000$50-1 00,000$100-500,000$500,000-i 000,000$1,000,000 and up
TOTAL
Summary
Under $20,000$20-50,000Over $50,000
Tax RevenuesCollected Cs)
1981
8,63417,68023,385145,41252,15634,6134,1184,901
1982
7,6271 5,87320,425140,13551,73236,7235,7196,945
290,900 285,179 -2%
49,699145,41295,788
43,925140,135101 ,119
Change Share of(2) Taxes Paid
1981 1982
-12% 3.0% 2.7%-10% 6.1% 5.6%-13% 8.0% 7.2%-4% 50.0% 49.1%-1% 17.9% 18.1%+6% 11.9% 12.9%+39% 1.4% 2.0%442% 1.7% 2.4%
100.0% 100.0%
-12%-4%+6%
17.1%50.0%32.9%
15.5%49.1%35.4%
Source: U.S. Treasury, Office of Tax Analysis.
TABLE II
CONGRESSIONAL BUDGET OFFICE ESTIMATES OFTAX CHANGES RESULTING FROM ERTA AND TEFRA BY INCOME CATEGORY
CALENDAR YEARS 1983-1985
(S billions)
Calendar All House-Year holds
Household Income
Less $10,000Than 20,000$10,000
$20,000- S40,000- $80,00040,000 80,000 and
over
-.1 -1.0 -13.6 -16.0 -7.1-0.1 -4.9 -25.1 -27.8 -10.0-0.4 -7.3 -35.0 -38.8 -12.1-0.9 -9.8 -44.1 -47.9 -13.3
Source: Congressional Budget Office. Based on CBO economic projections ofFebruary 1983.
1982 -37.81983 -68.01984 -93.61985 -1 15.9

91
Senator JEPSEN. I thank you.Mr. Lawrence Pratt of the American Institute for Economic
Research. Again, your prepared statement will be entered in the record.You may proceed.
STATEMENT OF LAWRENCE PRATT, ECONOMIC JOURNALIST,AMERICAN INSTITUTE FOR ECONOMIC RESEARCH
Mr. PRArT. Thank you, Senator Jepsen and Senator Roth, for in-cluding me in this hearing.
I'm a simple economic journalist from Great Barrington, MA. Weget a certain sense of detachment up there.
ERTA, the Economic Recovery Tax Act of 1981, was a very unusualevent in economics. It was a sudden change in rules, incentives, andrewards that were available to a very small group, those with highproperty incomes. The top rate went from 70 percent to 50 percent.
Economists, as behavioral scientists, don't get an opportunity likethis very often, and one of the things that has astonished us is howlittle attention was devoted to this. The advocates of the bill, as thepreceding witnesses have said and as subsequent evidence seems toshow, said that this would actually increase the returns from thisgroup. I tried very early to get some evidence of this which I foundby looking at the other component of income tax receipts which isreported monthly by the Treasury. This is obviously only an indica-tion, but it is where people pay taxes on high property income.
You recall that the rate on so-called earned income stayed at 50 per-cent. It was 50 percent in 1981 and 1982, although with the complexityof the law, someone might have actually wound up paying a little bitmore than 50 percent on earned income if he also had property income.
But in any event, this series-the other component of income taxreceipts-rose sharply during 1982 in the teeth of a severe recessionand, in fact, it came in something like $9 billion over the TreasuryDepartment's estimates for fiscal 1982 made in January of that year.
To me, this indicated that there was some sort of supply-sideresponse, but we had to wait until we had data on the actual returns.We got the data for 1982, thanks to the Government Printing Officeand the U.S. Postal Service, in mid-March, although they were datedJanuary 31. Nonetheless, out came the CBO report with the numberson the board there, which were made on static assumptions, assump-tions that, in fact, could have been made at the time the law waswritten, maybe with a little adjustment for what actual inflationturns out to be during those years. As Mr. Rahn said, I think this wasdishonest, even though this analysis and related analyses have receivedenormous play in the press and in the editorial pages, especially.
The fact is that the 1982 data indicate that the top group receivedmore taxable income, earned more taxable income, or elected to reportmore taxable income. It makes little difference. They paid more taxesbecause their taxable income went up.
I'd like to make a point about this whole issue of taxing the rich orof not taxing the rich. It is something of a sideshow as far as eco-nomics goes. We are talking about a very small group. It seems to bemore symbolic than anything else.

92
If you want to close the deficit by raising more revenue, you are notgoing to get it out of that group. There simply isn't enough income inthe aggregate. The bulk of taxes are paid in the middle. The poordon't have enough income, and the rich as a group don't have enoughincome. So if you're talking about fiscal policy and tax changes, themajor burden, or the major gains are going to be received in the middlein terms of large dollars.
But back to this small group, it is true that they received more tax-able income and they probably paid more taxes. This seems to annoypeople, that the rich seem to have gotten richer. This is pure envy, inmy view. But it illustrates an important point I'd like to mention andtouch on, something Senator Roth said about savings. I would agreethat savings are important. It's more important to refrain from dis-couraging savings than encouraging savings. Savings in and of them-selves aren't necessarily a good thing. Centrally planned economies,Eastern Europe, Communist China, have had extraordinary highrates of capital formation and it hasn't done them any good becausethey don't know what to do with it. They don't have the mechanismsto properly invest what they save at a decent rate of return.
The rate of return is equally important. So the real issue here ontaxing the rich, or taxing anybody else, is how much are you goingto let a producer keep? If people choose lightly taxed but inefficientuses of resources because they are better off after that, rather thangoing for efficient but highly taxed uses, then the economy suffers asa whole. And the reverse is true. I think that's something of whatwe're seeing now in this recovery. We are seeing people able to usetheir resources to reward themselves and in the process, everybodyelse benefits too.
The increased taxable incomes of the rich, which is what the datawe're discussing indicate, also mean more incomes throughout theeconomy-economic growth, in other words.
The important thing is reducing the rates at the margin. Therehave been tax cut bills any number of years since the last major ratecut in the Kennedy round, but the cuts have been targeted. There havebeen a little more exemptions here enlarging this deduction there, andso forth. That has quite a fiscal impact, but I don't think it does muchfor economic growth. The important thing to keep in mind is to keepthe rates down at the margin as low as possible.
I would say that to really get somewhere, you have to attack theconstraints on the people in the middle regarding what their incentivesand rewards are. Below, say-I don't know-it depends on whetheryou're married or not, but below $50,000 or $100,000. The marginalrates haven't changed that much since ERTA because you have had20-percent inflation since it was enacted, and that's almost equal to the23-percent cut.
I think it has been helpful and it is a move in the right direction,but I think the Nation needs a lot more.
Thank you very much.[The prepared statement of Mr. Pratt, together with attachments,
follows:]

93
PREPARED STATEMENT OF LAWRENCE PRATT
Since the modern income tax was first levied in 1913, the Economic Recovery Tax
Act of 1981 (ERTA) was only the third instance in which the basic rate schedules were
substantially reduced. (The other two were the so-called "Kennedy" tax cuts of 1964
and the "Mellon" cuts 40 years before that.) Over the years, there have been num-
erolus other tax cuts, hut they usually involved enlargement of exceptions to the
basic rates. One observer (Michael K. Evans) has estimated that the percentage of
any increase in personal income that was paid in taxes (including state, local and
Federal income taxes and Social Security taxes) was about 10 percentage points higher
in the late 1970's than it was in 1965 after the Kennedy tax cut. This increase in
lit h, R mga:too tax rate wias :ccompasl led by an incrrese of only 4 per:entige points in
the average tax rate, or total personal taxes as a proportion of total income. This
divergence between the changes in the average rate and the marginal rate reflected
"bracket Wreep," cased by the interactton of i1f1.i tred inci.ses and progressive rate
schedules, and the use of "targeted tax cuts" during the years 1965-1980. In 1980,
the Consumer Price Index (CPi) increased 13.5 percent. Those whose incomes kept up
but who had no real gain In pre-tax income paid higher real taxes. The extent of
this unlegislated tax increase for a family of four at various income leve's is shown
in Table 1.
The 13.5 percent increase in the CPI for 1980 followed increases of 11.3 percent
in 1979, 7.7 percent percent in 1978 and 6.5 percent in 1977. Individual income
taxes (sat I oi.ilI income ceoun ta has is) inor-.sid fri, a 10.5 percent r F each (non-
imputed) personal income in 1976 to 11.9 percent in 1980 despite some tax reductions,
including a drop in capital gains tax rates, during those years. By 1980 the time
was ripe for a major tax reduction as the effects of bracket creep were becoming too
pronounced to be ignored by the administration or Congress, no matter who was in
.[Eice.

94
"Bracket Creep" in
Table I
1980 for a family of four
Inflation-1980 Income induced tax increase*
$10,00020,00030,00050,000
100,000200,000500,000
$ 297252521
1, 1792,5244,2714,863
*Excess of 1980 Federal income taxes over 1979taxes, expressed in 1980 dollars for a marriedcouple with two dependents and no deductions, taxcredits (except the earned income credit), or ad-justments to gross income and whose income in-creased as much as the CPR between 1979 and 1980.

95
Before considering the changes that were actitallv eoa'-ted in ERTA, it is worth
'ste.x.inlag itra,-ket .reep fri r . A:; T:tbl.e I 1 7'.-s t-,ri fF -Ct, tf bracket creep
falt proportionally m'or, 'tn these with . ier ...- ; (The $10,000 family was sub-
ject to a doub Ic witamy in 1980, 1n11L only becauise mor' of their income wis taxed at a
higher rate, but also because thL workintgs .- the corned i-one credit added 12.5
percentage puants to their morginit I x rat- .) 1n f3,t io- ittred in eeoc go ins have
-I pr.roortionolly Larger Lmpact on1 tseas in thi lower iaeo11 raiges , heclist- the
bracket. are narrower at the bottom. At the top, toxpayers are less affected by
bracket creep. The marginal tax rate c-tn -reep no higher than the top. The tax
l itbi lit ies of thiose in ti-- ttp bracke -t :ir' only IfF lsate, to. the extent that incoe
taxed in the top bracket becomes a larger proportion of total inflated income.
Onee of ERTA's key provisions was to "index" taxes starting next year (1985),so
thi:t any gails in n',.,iloatl in'''"e whiih simply reEfem:t a ltoms oF pttrchiasimg power of
the dollar will not lead to lower real after-tax inctles nad purchasing power. If
tih indexization of tax br:tckets aitti other pr.mvisio.mts [oLix il1 do ltars Ls postponed
or repealed, the impact will be proportionally Ltagest on taxpayers with the smallest
ittmees. Any resoltant increase in tax recetpts wi' I mainly be paid by taxpayers in
the middle (say, $20,000 to $75,000) becanse such taxpayers receive most U.S. income
and pay the bulk of income taxes. Of course this latter aspect is inescapable: any
prospective increase in taxes designed to increase Federal revenues wilt mainly
affect thtse in the middle: neither thi "poor" nor the "rich" have sufficient aggre-
gate resources for tax changes to make a substantial impact ott tax receipts from
those gro'-ps.
The ma jor provision of ERTA was a phased-in reduction of tax rates across the
boa rd." Starting with a lt
percent tax credit against 1981 tax liabilities, rates
were redtced in all brackets during 1982, 1983 and 1984. The overall reductions
totaled about 23 percent (with some variation dute to rounding tax rates to whole
numbers). In addition the top marginal rate was reduced in the first year (1982)
from 70 to 50 percent, a 28.6 percent reduction.

96
At the time of enactment, official projections were for a 25 percent decrease in
the purchasing power of the dollar over the four-year span that tax rates were to be
reduced. Thus, it was expected that the ERTA tax rate cuts would be slightly less
than the effects of bracket creep for most taxpayers whose incomes kept up with the
cost of living between 1980 and 1984.
As it turned out, prices increased less than was expected: the purchasing power
of the dollar is now "only" about 20 percent less than four years ago, which means
that most taxpayers received small real income tax cuts instead of slight real in-
creases between 1980 and 1984. (For wage and salary earners this was offset by in-
creased Social Security taxes.) It was this underestimate of price inflation comobned
with the effects of the 1981-82 recession (also unanttctpated at the time ERrTA was
passcd), that produced the large shortfall of Federal income tax receipts from
earlier projections.
But ERTA was designed not so much to reduce tax payments in real terms (except
in relation to what they might have been if bracket creep had continued unchecked) ais
to reduce marginal tax rates. In Table 2, 1 have shown the average and marginal
Federal tax rates (including both income and Social Security taxes) for 1980 and 1q84
and the percentage point change between those years. I have also shown the total
taxes due and the 1980 to 1984 change, expressed in 1980 dollars. As in Table 1,
these were competed for families of four with uncomplicated tax returns.
It should be stressed that the data in Tables 1 anti 2 are artificial. Few
taxpayers today have uncomplicated retirns. Above relatively modest income levels,
virtualiy none do. At a ainmlm.n, this means that anyone who is paying the 1984 taxes
on the income levels shown in Table 2 is likely to have a higher income in any gen-
erally understood sense. Nevertheless some general observation:, seem warreated.
First, ERTA did not actzsal[.y produce significantly reduced Federal taxes [n reat.
terms for most taxpayers. In fact, real tax liabilities (including Social SeuurIty
taxes) increased slightly for real incomes is the range In which rite vast majority of
taxpayers are found.

W
co0Iw
0
l.I Table 2Change in Combined Federal Income and Social Security Taxes
--j Married Worker ;lah 2 dependents1980 to 1984* (dollar amounts in 1980 dollars)
Income 1984 Taxes Change from '980
S10,00020,00030,00050.000
100,000200,000500,000
$ 1, 1403,5626,870
13,90035,92785,571
235,571
$+153+71
+332-505
-5,299-20, 328-79, 940
Average Tax Rate (2)1980 1984 Change
9.917.521.828.841.253.063.1
11.417.822.927.835.642.847.1
Marginal Tax Rate (X)1980 1984 Change
+1.5+0.3+1.1-1.0-5.6
-10.2-16. 0
22.130.132.049.059.068.070.0
20.728.734 .242.049.050.050.0
-1.4-1.4+2.7-7.0
-10.0-18.0-20.0
*Calculations assume no deductions or tax credits and no exclusion for dividend income, alimony paid, contributionsto a retirement plan or other adjustments to gross income (nor do they reflect the maximum tax on earned incomefor 1980). Incorse up to the maximum subject to Social Security taxes ($25,900 in 1980 and $37,800 in 1984) ispresum ed to be earned by one source only.

98
Second, marginal tax rates did decrease "across the hoard" between 1980 and
1984. The ERTA decreases were offset by the increased Social Security taxes of 0.6
percentage point where applicable and, because the Social Security tax base rose
faster than the CPI, the marginal rate on wage and salary income may have actually
increased for a few souls who had managed to receive a small portion of their pay
free of this tax in 1980 but not in 1984. (This is the cause of the 2.7 percentage
point increase in the marginal rate of the $30,000 family shown in Table 2.)
Finally, it is clear that ERTA significantly reduced the marginal tax rate en
those with higher incomes. However, the individual income tax schedules remain sharply
progressive. The 1984 rate schedules call for a family of four with 10 times the
income of a $10,000 family to pay 30 times as much tax and for a family with 50 times
$10,000 of income to pay 200 times as much.
Since the time it was first proposed, critics and opponents of ERTA have focused
on the extent of the tax reduction for upper-income taxpayers that the new rate schled-
ules called for. This lies at the heart of the so-called fairness issue with respect
to ERTA. But as anyone who has even looked at a form 1040 recognizes, there can he
vast differences between "income" in a generalized sense of the word and what appears
on the line labeled "taxable income."* At some level of marginal taxation, an indi-
vidual will begin to consider the tax consequences of decisions to work, save or in-
vest. This level cannot be determined precisely (and it probably varies among indi-
viduals), hut there can he little doubt that anyone who was subject to the top 70
percent marginal rate in 1980, made few, if any, financial decisions in which the
tax implications were not considered.
*In strict economic terms, an individhtal's income in a given period can only be de-
fined as total consumption plus change Lai net worth adjusted for price level changes. Whi
is taxed on form 1040s is only vaguely related to this, especially if the tax-
payer holds assets or is a net debtor or creditor.

99
Even people facing much tower margional rates probably make tax-infIlienced
choices concerning work vs. lelsure, taxatbl- vs. ,oun-taxbihte investment., do-it-
you xcelf vs. 1eyfiq; for soervi,-, "n-tele." vs. "off-the-hooks*" sand so forth.
Choices that taxpayers make to avoid or evade taxes not only serve to shrink the tax
base but also retard economic growth. The ecoonmy as a whole reflects countless in-
divid,,al choices and if the tax laws drive people toward iaeffLci.cnt hut lightly-taxed
uses of resources and away from more efficient (uLty-taxed uses, then the economy as
a whole suffers.
Serious analysts have recognized that the "fairness" issue cannot be assessed
simply from the relationship between the old and new rate schedules without reference
to any changes in actual taxpayer behavior. Unfortunately, measuring the effects of
ERTA on the tax base and on resource allocation are incomparably more difficult to
measure than is analysis of the effectsof the new tax schedules on hypothetical taxpayers
(is T have doe in Tables 1 and 2). The latter type of analysis has dominated discussions
of ti,' effects of ERTA since it was first proposed.
The latest and most exhaustive attempt was a March 1984 staff memorandum of the
Congressional Budget Office (CBO), "The Combined Effects of Major Changes in Individual
Income and Excise Taxes Enacted in 1981 and 1982 for Households in Different Income
Categories." Astoundingly this study relied on "static estimates ...based on the some-
what [!] arbitrary assumption that ... changes in the tax code do not have significant
effects on general taxpayer behavior or otherwise on the economy at large." This
methodology effectively precluded any findings that ERTA had worked in ways that its
advocates had expected.
With this methodology, it should have been no surprise that the CBO found that
the "rich" benefited far more from ERTA than the "poor." ERTA's opponents reacted
to their findings like felines to catnip. The New York Times editors proclaimed
that the CBO was "a professional. not a partisan oreanitatlon." And they asserted

100
that "it seems clear that the rich have gotten richer and the poor poorer."
However, as behavioral scientists, professional economists must look when
possible to actual evidence of human behavior. Such evidence, IRS and Treasury
reports of changes in actual tax payments, was available to the CEO well before
their study was published. In terms of the ethics of the economics profession, I can
only call the CBO's methudology scandalous. If anything the actual data on tax
collections have indicated that high income taxpayers have paid a larger proportion
of the Treauury's total income taxes since ERTA even though ERTA gave them the largest
reduction in tax rates. I have appended an article on this subject, portions of
which appeared in The Wall Street Journal for May 1, 1984. (I have also appended
a letter from Mr. Rudolph Penner and an editorial from the Journal, that relate to
this article.)
ERTA presented a rare opportunity for economists: a significant sudden change
in the rewards and penalties applicable to a relatively small but heterogeiieo'is
group: those who have high property incomes. One might have expected that a ,major
effort would have been made to ascertain what these changes have been especially
on the part or thosC who hIIC :1 nh jIs Lntitre. t in tli sid ject tad witl hIavg th' 'pul, k's-0
access to the available data: the Treasury and the CBO for example.
I hope these hearings will prompt those with the best abilities and resources
to determine what actually happened. I believe that actual tax liabilities this year
may well he more "progressively" distributed in 1984 than in 1980, i.e., that as a
result of ERTA, upper-income tadpayers cow account for a larger proportion of atL
personal incme taxes due. If this proves to be the case, attacks on ERTA as "unfair"
can be based on envy alone.
l.twrt"O.ce S. Pr: Itt
American Institute for Economic ResearchGreat Barrington, Mass. 01230

101
PuhlisLd by
AMERICAN INSTITUTEfor ECONOMIC RESEARCH
Great Barrington, Nassachtua,,ts 01230
RESEARCHREPORTS
Vo l. No. 9 Oaby 7, 1984
The CB0 Report: eFac-isie for the Occasion*IAss- idea of s.ppiy-aide, e-o-st is that lowe tar,
ros' si'org ,sam prosloesweff-irsa.d si .o.ii's. The19.11 toe loll provided acros the hoad" ioois tax ras'' IsIs. Ilol for --s qI~ r there. has bees, litles -1-
1or.
rsdisf. Iseoos rote rats hat best offset hs "beacheece'p"- doe to sajtsted ia-oes The o -roeeepsioa werthe high-ieosi tseoyer. far whom the top s'te droppdfess73) lorssa is, I )31 tss 5t perc'ss it, 19112. 7h,, shors,.r i.s'ss.o.'...iea ,oIJ.ia hi the topj grisop ioi'-rs'I is Ia 1Q8sod their ostool lo-es Imisi d.r.'...'. md c less .that,th
ol' iss i is,, sss. This o o.. i 4ossis -s1spts- sub' ealsssBIh't'igrssio tdgetI Office, schich -poeported Pro
eisa. sIc p-osoed aSideIy reportd aaoliy sof the, effectssf ''booes'ssa P~sh'ol loies test a~a'tso 4 'sasimris ...i...o.
hrsss -osvps'isog ER111.I.. os...tr'.lsoosga $h,tii,5h,, ibs' ''ssse "Ibis rs'p-r 'sapb'tls'l dio. re ddsb
ocio Ai hps's. reyiog 00 eaia-ts basd a thebs'hat'ssissris....ffesis'i hi'hs
al'eos'.The t.1ibis'iats aerts so refer the, hehef tha-isiials o s s these ,-r isstioth, r-td ea b-oeji
silJrsapsisat1, orgete tax ad apr-diag progrm.
~Sse Ilie. LEo,7 s..... Iete....r.y 'rat hit ol 19hE (ICAllA)-fis.r-i prip-ssoe -it iic tar d-eriss IIl.',sslrsabesiiss IeLrsar ii 1s- ra-illa lf ss' "eels" (largr) atis is
'jisoa'' -11ai). TEl-- dlolla iipiobtsits ai', i'lissatli ,aspld sip. 'ths' ILs'sat' ae ti s s'stisiael Lsss sto
asssss sisissmsalele, ass
'lI,' Iqsli, isl' rii'iii - i ilt-s' s ist-s. i
iv is'ts di seat. -Y~Nst re 'eatsnisa -ihsr Iilarsssis.jstit, i-d'sr
ass Ih ii- . Sliete "thE 1i s' reIls's evry"s
wils '..threitsota isa lit. taa piratsiod Isaac
syrelsStez- heaaS tax ct 0. 'Ese isita eass'sc 'mat. aid,iisesisssvst'ts -stls thesop jity'Idc otiial
rter h- aecssl' - .I theeet toreL. "arr-a -.e, booed
that assh1981, bt Ntmoa).t s sr mRare doriA-op b
'Ehsee~-e the, t9tE2 adoewioa moissly ftibt"ia~~
LlaieEsIle i ea thraidslgh propraty iaasair rar aL(asis 71 ireiti13 to 50 paei itllS
L1er at tlseAXsii-a'c Esotitote me hasLed to tls6sisrastlslseId ("other") eopassrt t FedersE isidiridool ii
2 issistl isssl si thi "ot i." ....I.Istsse, 1-tyir~ aole
tlssiatasy isieslsatig hoyra 197234lE. See ChartIII 'sst's~ssitstsl thas'tsl sfse'- '11182 Sts 'ilir
vsssstsotmo WMjIslbs hihe tha it aal'it ssS'7i11
ii ssis'ta, ahI- '-i (srisa l' ls'tfss'%teeee'rostttartetospodest t ier fiss pp
aTh acresirsAljto E tibt.I i im .,lit' esasesJaI Sa- Iaa' Mltraeastctstssatooiaa
sItottd isra ta Ivists otatiessaysis at Use,
icaigsr ii Psl'rl rcm'iJits tieeesldi asy'82
hats acre gcietIy tIstiissssi asd sLsassetol sat a-
lore. tl-as dsraIuvsti'iI.h'Ltax- osaipo ai floess- by ssao tate. id.-illvas p. or,
assil lais-ii'aliss at sIieals's data tasi the 19112 U.x
.igastore if She l'isiiweio ft laistr-IsltEe-eoe
sI"e di,, lab, at pretasd a. 'T.Ide1 Et li-o that farIr'501a , mi m--ssea ma1 tho- Syll,000, the ahor at
atEat- 1pidi l'1112 ta "sta d.ao iiot soi 19111 aed that(sr hreliatv $5htltl die ebar m 2.5 peestibayr
'lAX SOthIAR llN DIJIIt EIAGAN 1981 -82 CUE"Jcle d.m dLt farl use ltabiih , ir-afri- hOt h6 'hrr m-e-s
rsels er paslo, og-r share ef ,aduidttl i--ertaem, 1931 that a. 191112
Aw~ Shar at Tacos PaidNet btetma ('maoj, thAI~198 1982
SOiI 1110031 1.0 2.7
$12 20,0110 B.11 7.2$20 540,000 54.11 49.1$20 Ellhhol 17.0 18.1
$103 500000o ItO 12"91500 E,0110010(j I7.9 tll.E
Itll00.000 & op 7 2'4
PatesprlbS Trlssiry
Chart IIa 1952 asd 1983, after the tap iadividuso toerat
wa rot It 50 parrat fro 70 p-rert,"sstlatsy" itatos Lot paymo it-rosd
Pesart so r L.tt sowthhatdstg reripta.
26
28
ia...t.ta.e'2ssaob7 teahasb sP. s stiess rasyt i
26sso~ ie hutmoibit sis'alaae h
19ieretErr t t3 75 ar 77~i' psee, tar i.1 13'solid Joassasa stilt-'

102
WIIahioi.lo Can't Ille Bothered with. the, Facts
"teauoiie tan ton 'a lae 1981 atal ett~t af ihlt
lffeete ofMao Changes, inFdea .io nI Omndliig
r1,a.1Si11. Iti, Oht'it' -t~ieily lIon.".'
,htl'' Ita'etititjit thalt betwee tOl suIt 19111,
a il"litt.,'ttI~ewil mt$410000 ino gained"
311.27O.,) asr'niit ofII tic -Ioaa r',dtito. A ealeiliery
,,p'ur nidiente dlb th $l- 8,20toewaznr thaw
$174 y ''itteevieoo Iethtliiti ya) 11) o hiv
lt tble 2c e-ac b lto-a (1) Ohg1-,arsg i.opeeset
t''t Ith' vetii... ..tt..'.yrtte~te fte"itlit C114 ,tt'ly ai
(2) hr ttig tenet t OttI. itt 1 teeett gil 'io dollies An ntesleth
1esl"'etp it' tiel tight of the lto) gr'Ig.'n larg tax
ti6t ,ilitt',v, die dollar dl,'rtac in the tor Ion (over
975.1000 dilo,ijtt' -tn.itror, a lt irge") lii slit' 2.7
Iro- tero decrease io t il og eoitoa ge~ulitual) 19) tLr at'd a,- iii'siti'Ahtio. Ity static, t.Ilysit t
elioldd hose teen itilrgst Iweam 1982 wan a yrne'iIs-t (o'rtrt it.......ttei. .......'t.yd'it't tItanvooi
eIrrl ItItIolar Ityith) a' ii veIto'tf te~ lage dea1t li
lie ltrketstt thattiette 50 pgreece) Hin ll. Iw vhoit,
It". ita,, 't-otel sg")that dunh ws- otpplyd-sil
Alhogh itt hilenton foe die 19t12 U.o saing of
lit lttte noitio ye' tu, )tttost iv' tIte ant enlono ol o
tItettoI fstt Il t-t I tSW t"$, 0 gt'teI
lit1 Iety sneeane by a farlorof-m(ore ha f-ne (Sum'it rilttit sitl hat Itt, I 1112 asteg'' ta ilitt i
otiti liitS 75.100 -djiotedtlpeo- ivetie ao ntiot121 t[ bait it t-mll) 'Thitotet tiit ls i~tii
l dta Lisl,tgett hat fito -cir ae". ..stode eati-tne0' l, i!:, -itti at aelitii.ary ns ttt in that. .
Ao i 6I---wled do vot hove! siitnleffeota no
gtei atIe-re t~o,eto'tu." Th'w makes ahtot m mahoto "e thtatI Iiriitle,) net tiofedIy road wgn,
a, ttieees.r tot tevt fts th 1903 attd91 ~I t. la tobotda ',' tli-lIt o . ,t Ui it oo
tilet Itteth n riI wee' otaletit den' YaIu-. lie' Cttll'n i'stituti $:I,1,50 attititia bAtt't'A L.. s-ilig foe It. tog
friy(ott$5,100 itt I)02 Itt $81,750 iii 19114) pgparsty
Itueee gett I)di sal ntel1982 ohnein mlatiwnittheattagit,,at ail (2 Ith vyhital rhn...tI of
lopg frnt ,ilt gay 'in as t vrg i 9 than thsy
0oi i th,ti' I-laid it is gpniblt that high her-ket
talale t ,ta ,'' to dela6y reesips of 19111 "eunie ii'
'it's Ittle a,'-tln the Ia.- 1982 mte, (tlts-b d'ote
tu Ite 192taaorIattlI 91"-eIetoe, e-iice
Ittilt lu')eee 1981 atit 1984. Agpartiidy it involom nam
estittiete of ota tanni iiene'eiife otIayn wu Idti tttttle 19111 law atid pagtei-iiig the 'iffeore
fr~o-oite et) 19114 en-iam nio inomeoo geowgn. ihot~teototnttrneoeeyof a figure dtierd from die differ'
ette ,tetucei too goenni di,,olds bg a dtied gami6 toowis
reaoti to doubt dte mefwtoe of die CBO'n aItgroah. hRot
ecrtinteeee ,ovdu iiuig i t dia it toaldly ignurv dieg. hil
e'in'ii opz.lttttt'ttaiit 1 90I, ;it leat ttnt ttf oltel
ItL o I1)lihti Closeif,-- LIAIlodt -i hol
Ib Lu1j prilall ta itltl -Co;ttt aoh I tud, t.itiA Ftaikiit
the CIII) regne 01111 d "Coige -ietalAtu o I llli ak
euiai "oliuntto of taelt- ' after nettia reetlt acr
-ealahl. 1101 it 'o, ale, Al too nevtaoluidahle dtst divl
CMII en toe) -ni otin the nay it did, hmI ie- quedo she
staff wo ortlit oto oer .Ie Itoj? oeme i glty
ittat fulLee the 1 tuiaen deetuties ofgrtoenaieulIstlliet -a re ine or igittird 'it W-hiIgogovt"nsdthe! ltel-y" it turmo Itaity l~tI eettntt't fitviy tttateee
tet itilt t .It 1auitoii,7 le evtIlkte IGIternIittest
eto)at' ,derly di ett...a.t' tin uottoigeatitot of genum- tooppo' iti., ~! go-a~r.tIi... l,etttet thu
tuutivieleigt fI itt _"Itottet"' Tuhai oattitode.
huiutuoet I c~tuetr t lie Chrysler Wolalo (ottielt
"Thtt' IIte jtittv ii a eU.as ltysttttt of w~oeb iohooe
nL'.tgeat' ar tgh' hlat tito 'tIM l oe iactat'e o t,
foedie htluol) itt th rth fiiideuerSittoild tfaint - in.ilihtiywrtu aittee.....eeriteeI90 'Iite h l tte hb grInsi'
duly let tuu'' elunh metle'' I6,tt etittyu -ttthtttne olth
'io a [lote uc-iag tetot"t Li 1 ay'eit) of Ite ob
indicotedial the , neI foile. , -t, Id to beeita mci imeItoql',. sitttly idatto that .. te Inealttrh,
jn ilogort ot the, seo.nty ounl..d har been entai i 1982.Osy hot I gereet of aIll tagy-s ore insalued. Not
nto1i 1983, wltsn the, arthe die nr cola" so-edd die,effeel of "tfni,"a tIter ma-h soggly tdd incentive,
f his di-vt majosity of tavgayem to esgp.ond to' The
attsn. ucied vigor of die, enrectevaviov ad geseiuditgocd attni netiem of die Unileil svtmt m at wod
Thot g-semmeta eans ae onew be~tter of linnt _oltbint enmnu else , ita"no~dentd. The, faimeu
i-oe en -ee he, esnlcd to noiveeva stisfaction, becam
atmot aliat 'o, - in not faje. Hloce, die ,ttody of cai. In' .. tot d.Itt h''tetit aiothlt' giero otiti'i
elm atd actinto ftinte o retad hstaii geofres.Aa far fl'ua golicy (Gnss-vt sodung, boton,
liutienitg nod Icuidlog), ftsl =n e a o maeh of diel
Naltti I'o Ieotlce mcskei an directd by Goitves ,ttev
lint only inl turd litaoet I- be h magen uf d1cislu to
work, s: 1o'i, tIt nave. ittt lac.., tielt. aniitucui, site'
vanes or eve brad tae isl nodred-olnged ..o.nti., ca
aettiaty 1trttuo~te er -etie edity. tlttten elt. atifhe it o
f_ ormtndvtde tndeer ... d.Soggly'atlem. draev nioe crdit foe drawing at
teetlo, to dIe stWielue.- Bt their nchiesnoots to da~te
haeIieei qoijte titoited, fne all do, rheoic. Macgiloa sacsatin remai high ,while dt otal tanra colleted are loads
qonte to jlay foe the ogendiog votd by die, glitici-s Thel
-eno, a c-m, 'e d-int she, golidinna love nt take crdit
11sf" t en agvlhi gao jit an they lose to pg-d fur dhiebvei f. fvrdecIaI ge.otig. That die -sonnny i
whdtfe inamo)eeato lie ltoy.oul thrir r~ompfeeZIistsittieetivni
Tattl 2tNtD11011 IUAL INCOMEd'TAXiS AFIERtTHI 901T'A.X CUT
The useage 1 982 tan enlg f deIn p memgsoag oem only ahnnt onefaaih
-2are a stmae by~ g theCO no I rtnion to tne Psid mr
Aeanlo 1982 Toe Pnyonta
h1djtIatd Cent Inche Lgggfoo 1981
t(Dttfr-) et-eta Too. ope dtet Peren Dioltam CBOO aio
= l~o I 0,000 $ 211 It.) $ 1 $ Ill
1,111M) to 211,4000 1,410 -10.5 lb62 _150
s.)D o 4.lll)llM 3,1190 7b -3214 -40
41i.1.iltl I 75.01110 9,070 -1(17 1,093 -1,170t
li-'s75.111111 kull~ 2.7 t,2h11) 5,110)9
"Ii -.......... ennu to staff of tir 'las Aunbiw I Iteosof i. onea"itOtr ai
1h,~ittuu~ aeunednea 808to 7501 a imtoen~

103
Thu J aIut inidadget Chliees unildOi- nf lI. ith ribitilonat Iane.ls i (Gait
Pre.sItiau:1 agialaitve actions In 1931 andIP.,2 eitls desilted in be muchi disetussitbi:t seldom tend.
If iia e v S lvrlt lediiorialu pgt,Ilay 1i i:... .t ".i .i cartully, he mould
have realteIIt that In no way did w.- pur'loil to provide a oercast oa changes in theillutilnilton tr laX htlls'eut between linSoinl lri2. th: the tax side, the analysis ex
.nitltn' tlt wenr ci le niny sets nt narla.bles thot chaltged tetuneetm those iwo years.namely, th,-se related tochanges In the tanlaI.. It Isolated Ihe initial impact winig
:'artr lly tie..utted atatic asutilyttlis-tint is. it evait:ated the Impact hoenre nnYiteiti ittitl lesatwnse rlwurred. The votumnI- igures that tI,. t'rait labets "CEO real-
::te' dars itt tItenote tai Inx liabilitychiaoige treat Itit" as he says rather
it coitpities the dilterence betmeeti applyIng the oid versas the ne ttax law io 19S2in'-me tenels. herrcitfulyp theugh ItadlytIar-iest'ith. ou tiutdaba. M Pratl did atleast note that tue Usedi static sissttip'
nnrs.tithe rle vintieatrotieb lha~s tummy ilk'
adaititicra es-areitty itttetiterati'l it, nut.tnniysis-i is dlictilmt In know where elseIn tegh.ttt Wittiest a qtIltntilntIve eslittite
::r o:tll ll v~c IS~: ts Imls for:s :wun:t astnmtll tie a ilgnrntis teliate rega:idien: h initll 't aSit .
rating behaui-ad resipoiias Ilnclves diticiil slallstiltl prolltents tiNt an tar ronmIbeing resolved, whilh Isisursof WotIrms In.voive pnlillcal unite jidiglmenits Ilint Q0tsIs requlrd to avoid.
Certainly. ramlari In" of Iwo years atactual data sled little light an such Isstes.Teo many things other than the tax nun
changed dining Ihose two ye:r. Therwas a ralher mijiir recesulon in 19St2 ilheffecis tar timer I tittiptex tiall toilneated lyMr. Pratt, anid Tbe Watl Street Joirnal'sedilotial wlilels In their analysis ot"Tricklennmilcs" lApril 11i seem to havetorgolten It eitirely. These oho, na lie rercension Io argue that them is no nertl tosupply side economics are nihe, buot soaoe Ihose who tinitlaln tIhat tie preiciplesoi saitpIYaldi' cutlonwicra are conirrmed bythe tact that high bracket taxpayers receNed a greatter share of nominal incomeIn 1932 than they did in tIlt.
Aside trntil the etftes of the recession,many tnxpiyers undoubtedly "gamed" thetax system between 19t1 and 19i2. Any sensible taxwyer wtold. as tar as passible,have moved dedictiaons tor such ihings ascharitable conitribuiulots bachiard to 0.81Ino take advantage of high marginal ratesuwhile muving tienmiie items. such as rapl-
tll gains, ttiardl In I9t52 In lake ailvan-lige on lower eties. The iltereatives n t such
manneotittg were highest In the topbrahketo. it Iaupayers did not taue ndvan'lAge oi such obvusts Incenuives, theywirely are not Itkely to have adjusted their Iwonrk e crt aid savings hehonvinr tochang.
Ing tan bitiolits. Bult It wIt tate matnYyearn of data in sort oul the Importence atmieli htanleri phernomen.
On a more minlr point, a nelu readin ci tor analysis winld bane shoan hIr.IPrat that we did not me adjmuted gersInetio in distribitle tanpayers aerrisa Ihlcome categor es. IVe used somethingcaited "expaided Income"- which is sometbalt Iclsr lo economie Incone than IFAGI. Cnssetteiouty, his table nut noly cui.lined very differeit methodologies but alrodifterent statistical deanitions. Thin hiscomiparnsan bt'ween our tables and actualdatsa I dulibly mwaninleass-li that Is nlgi.calty paisaible.
Rutmucil G. PONutroDi1rector
.Cnngreatuonal ,Bid9 I'tltceWashington
Juist wheti you iltougliht It wuas safeto go out in the water . . . up Irups. ..The Fairness Issue!
Like the metal shark In "Jaws,'.lie Fairness Issue is a kind ot prop,contrived by people who have a par'lictiar rison ot ftirness-namely re-disu ibutionisint-and who, tar fromv tiev.'tg is ta issunit. have made tiptheir t11itits. Their pitrpose, tisldg re-pttvls l5t' the Congressional Budget Ofttime mititi lie Treasury on the "Rea'g;li lsx slitd bhitdget cuts, IS tO spoilyuie ttull iU theAi econtic iecoverybeach. Read the studies canefully,thliugh, antd yopu won't be seared oat.
Ili separate articles Ou this page,Irtig Kii t'si Olnl Ia tI -tct' ': rfliu
'l'etltvy tatl)(itanvd it'L tCUtj lillilt.lt:'ttiy.. ste taititl (130 DiO ecor Rtthtl,,ihl 'eltiltt's r'spinisv ini dteletise afhuis tittilit l<'s t nut hilettest lit' yenSteludly ra'ter dlsingdmious. Ieehapsthe CBO is precelded froi "valtejtivigitt'lis'' aitt pierhiaps dytanticaiultysi' is iore dilticulit thim the('li's slUmic atilysas,.as Mr. Pettiter,t'5s. liNi a lot nif liberal pollticiansh:::! :n ::v !:!:! !: !:U Isthn C!'0 rc;Itll Ile vahic jitdgiteicit they werelnokitig tr, that Mi. Reagan's tax,pirograti has shiftie tlax burdens frmutile tiell Alil tIhat Is clearly utiitie.
bit. 'eninit'r pleads titat the CBO'stelnitl was onily n quantitative sart- .lIg liiht for the debate. The "difltrclt" dynatiuc aitlysis of hehaviornal
tieseinise to tax ctils was left to ithers.Tilt's t litule like ciatmitig you hanve
a: rhecolent cake bilt neglecting1.1. ile ' yll '' t11 didn't plt ill ahet 1w, nlinte. -Kronninlirs 1I- halve anynwoh: :Il hasIn se a behavinralscieice. The CB0, by skirlitig thelitiestitt ilit :s atipptiYsitle response inits cuts. tuitle iKussiblu' lhr rilid till tits-ni'litig nt spvcin" s argilnietils that
tilume is ito stupply-l~e veaponse.:::The report clan Igmores any "indi- sairness
rlerit ecoanomie effcta. LetIs say thegpvernmnent gumt 3133 bliluon from the G-J ' /tedemni budget by reducing Social Se- (' -liahuty, welfare and all other federal : .behetitf by an average of 9bO0 a fam-fly; And letas say that as a result oft
thinis idget halatecing move, Interest the recrs-ion nomena] GNP rose onlyrates and Iitlation piuitmet, an teficit '%. Relirlber, It's growth iii nonticuttere say they woald, raisitig the nal fice"tlo, not Inflation itself. thatpurchasing tower oa the average fam pitshes !^oit le ito higtter bruckets.ily by pelhapsu 31.00. Simple arithme Higler t' esu "re simply what ttliak
tic would suggest that, an averager ev tile pim "-a3 unfair. I seems very an-erv family' wudtild be S00 betier olf. likely *' 'in a recension year Iracket
Bitt CHO-style analysis Wmlul Still creep in 'manted tor a 10% rsie Inhave the nievage yamily snig worse 1htgh1r tit.je tax payments and very)tif tlikel.tl ! redited incentives io shel
tileetil ti. t 'ItO uirges l witi grass Iter imcdl-v were mainly trspollsilui.tIltdet lemtit, linhat Ins titalysis b''p Lljhc''i'te there is reason to believclSwii sitit Cetitivt.'' The pruSs gives thilat cn- tilctlt In top reitis pfx,-;:itmIIIs :t!i .it'ttit : ,Ili eal allite lireil a Il A lg'' J IN t peopie :':tlsunisi llt'-chaitr sritoker affrtds the Stirgiont C0itt i"' 19312 to Itnkye ldviuilaihe ofGeter-il's warlttg toile ritpping ilttn a, the ti S. ril ery eiattcinuer Illre, tatrgrly
Inck of Casnels. CEO findings are not becausr "I A cut ill the capitalngainstily lt qitlaitied. bitt alr frosted with' taxI. Bit these nisoervAtinns dn not Jo-poeiitiimcicielitiflcprereisioi: ''Wel, Joe,, bte th" siipplytstle CasCe: tey en-It yopl earned 314.733. yout were u12 tllunce it. providiugyet maue evilencedinttat s anti tO ceiti wacur nit- '', nYs ' ltjvi pC e r .n !thc litecr of tact vone, as if te were ' As
1.Krlstol observed, thee Is
talkaitg alwatt tIle boiling prliit no ma aurnt r:' n legitimate debate on tit.leter or the castseqttettctes ou Smtoking ' lens. i-:. In all fairness, the dealte
2.S3 packs. a day. Islild h Sel on what ile rcal cnn01 greater Intteriest ate the. Trcm' .ittti1 9nd nm iera aGr figuresdin g terthme tax slrca Isequen of a governmart ilneon
nut- figres ealig uvlli he lx utle, re-a' "umrty as they can be tiincnn-nutlined here recentli "lu iraness" tered-. ier than 'on a bunch ofcritirs pretited that cultting tol mar meanit. ".s numbers, And If sler
ginal anx ralcat to 35 i rons 70%r wutld naving "-covered that lower tax ratesshift tak biurdeias the aor, pcr In m iip '"achet careers idttce thetis
'982, wheit such a cut took effctd indu pay rcc taxes there are till peonvititisis issabing $l milinit or amon tie u nit 11 io punish them with hightail l dio tuner tuant i1931. ralres. I hritl Sai so. They will t:ticAs soilte sensible letter writers io Mdot' that tii the name of "fall
note tearby, part of the satrge was in- ness' : y are willing to settle for'tittedit lty ba ket retlr-taxpayetm PyrrhRi vietories, hut that's iheirshitum itislrilIt hi igiher irackets hisille!': 'Jaws' makes good dritia,largely by. utlicrit. Still, inflatin bitt hilk t "tpersuasive to argue thai itslnwrN to 'V/ in tin.M andt "tiaiks" to is gn' 'tlic policy.

104
Senator JEPSEN. Thank you, Mr. Pratt.Mr. Vedder, welcome back.
STATEMENT OF RICHARD K. VEDDER, PROFESSOR, OHIO UNI-VERSITY, ACCOMPANIED BY LOWELL GALLAWAY, PROFESSOR,OHIO UNIVERSITY
Mr. VFDDui. Thank you, Senator Jepsen. Glad to be back. It's aprivilege to be here.
Like Mr. Pratt, I'm a humble little economist from the provinceswho likes to get to come to the big city once in a while and put on myshoes to come to see you and I'd like to think that I have a sense ofdetachment about things, too.
I agree with everything that my colleagues on the panel say, andindeed they have stolen some of my thunder, which I had anticipated,by going last. However, let me make essentially three points.
My testimony, by the way, was coauthored by Prof. Lowell Galla-way, who is also here in the room.
First, I want to talk about fairness more specifically perhaps thanthe other witnesses, and there is a part of the public who believes,rightly or wrongly, that increased taxation of the rich, relative tothe poor, means a fair tax system.
Now, the empirical evidence is crystal clear for those people whohold that view that the Reagan-Roth-Kemp tax bill of 1981 was amajor milestone in a half a century of public policy moves in providingincome quality.
Now, that statement is based not only on the data for 1981 and 1982,but on six decades of history that show a systematic tendency for thetax burdens of the rich to rise relative to the poor, when marginal taxrates are reduced for upper-income groups. That's my first point.
The second point I'd like to make this morning is that the evidencesuggests that the American people are more concerned with horizontalequity-and that is to say that they believe that persons with similarincomes should pay similar amounts of income tax. The public appearsto be particularly galled at the thought that some rich persons escapetaxation altogether, and the 1981 tax bill in this regard was a step inthe direction of alleviating that concern, as is, I might add, such legis-lative proposals as the Kemp-Kasten tax simplification bill.
A third point that we would like to make is that fairness itself isan elusive concept. It's difficult to define. It's impossible to objectivelymeasure with any precision. Nonetheless, the best available evidenceis that fairness cannot be increased by increasing tax rate progres-sivity. A "soak the rich" philosophy of taxation is not considered tobe fair by the American people. The reduction in tax rates for allgroups in the 1981 tax bill was viewed by the American public as animportant first step in improving tax equity or fairness, contrary tothe utterances of Jesse Hartdale and other politicians.
Let me elaborate briefly on each of these points. First, other wit-nesses and other observers, such as the distinguished syndicated col-umist Warren Brooks, have demonstrated that the 1982 tax reductionlowered tax payments by the relatively low-income groups but in-creased payments by the rich, a move in the direction of increased

105
fairness if the view is correct that the Federal income tax previouslyimposed too low of a tax burden on the rich relative to the poor.
Some have criticized this evidence on the grounds that 1982 was anunusual year, with a stock market boom, a major recession, and so on.Examination of the historical evidence suggests, however, that the 1982experience was very typical. When marginal tax rates are reducedsignificantly for the rich, tax payments from the rich almost invariablyrise relative to tax payments from the poor.
Consider the interwar period from 1920 to 1941. In those years, themaximum marginal tax rate was lowered and raised drastically onseveral occasions, ranging from 24 percent in 1929 to 80 percent in1940 and 1941. The era included high war-related rates, a period ofsupplyside tax rate reductions promoted by Secretary of the TreasuryMellon, and the Hoover-Roosevelt "soak the rich" tax increases of the1930's.
Table 1 shows that in vears in which the tax burden on the rich wasthe lowest, the proportion of total income taxes paid was the largest-more than twice as great as in the highest tax years. The evidence intable 1 is confirmed by use of a highly accepted statistical techniqueknown as regression analysis. About 72 percent of the variation inrelative tax effort by super-rich Americans is explained by variationsin the marginal and average tax rates, with a strong and statisticallysignificant negative relationship observed between the marginal taxrate and the proportion of tax paid.
The evidence suggests that high marginal tax rates of high-incomeAmericans might satisfy the demagogic instincts of some politicians,but those rates end up placing an increasing tax burden on poorerAmericans.
The experience of the interwar years is duplicated in the last quarterof a century. Take the Kennedy tax cut of 1964 and 1965. In 1963,those with $1 million or more income paid $326 million in taxes, whilein 1965, they paid $603 million, and their share of the total tax burdenrose significantly. Yet those high-income Americans got a generoustax cut, almost equal in percentage terms to those in lower incomegroups. And incidentally, a good study on this whole issue was pre-pared by the JEC itself in 1982. I recommend that you look at it.
The Laffer curve lives. Why? The answer is almost trivially simple.Citizens face two options: they can pay taxes or not pay taxes. Thelatter option can be pursued along two lines, namely, tax avoidance-which is legal-or tax evasion-which is illegal. Lowering marginaltax rates lowers the cost of paying taxes, reducing incentives to engagein either tax avoidance or tax evasion strategies. Income comes out ofshelters and out of the underground economy and is taxed. Even moreimportant, previously idle resources become productive, creating newincomes for the rich and the poor alike. If you attempt to tax thegolden goose too much, it will run away.
To our second point. Survey data show that taxpayers are enragedby the fact that some rich persons do not pay taxes. In the jargon ofpublic finance, people are concerned with horizontal equity, or theissues of whether people in similar economic circumstances pay similaramounts of taxes. It is considered unfair for some millionaires to payhundreds of thousands of dollars in taxes while others pay nothing.

106
In the last few years, two significant changes in the tax code havegreatly improved horizontal equity by flushing out many heretoforehidden millionaires. The first is legislation effective in 1979 sharplyreducing tax rates on capital gains, and the second is legislation ap-proved at the request of President Reagan in 1981 and initiated bySenator Roth and many others, including all three of you, I might add,who supported that legislation, lowering taxes for virtually allAmericans.
Using regression analysis again, we developed a model to estimatethe number of returns that would be filed by those with $1 million ofincome or more for the period 1970 to 1978. This model was based onpersonal income and time trends. Our model predicted that in 1978,there would be 2,039 returns; there were 2,035, only 4 less. The modelwas a very good, accurate model. Yet in 1979, our model said thereought to have been 2,474 returns, but in fact there were 3,594, 45 per-cent more. Why the big error? A sharp reduction in marginal taxrates of capital gains flushed well over 1,000 millionaires into thetaxable economy.
Using a similar model for the period 1970 to 1981 based on levelsof personal incomes, time trends, and a "dummy"~ variable measuringthe impact of the aforementioned capital gains tax changes, we canpredict over 99 percent of the variation in the number of tax returnsfor millionaires over time. For example, in 1981, our model predictedthere would be 5,198 returns filed; in fact there were 5,280, only 82more. But in 1982, our model said there ought to be 5,495 returns, whilethe actual number of returns filed was 49 percent more, 8,185. Thereason is simple: The reduction in the top marginal rate from 70 to50 percent. Some 2,690 very rich persons joined the taxpaying army,paying hundreds of millions of dollars in taxes and reducing the prob -Iem of horizontal equity.
Fairness is something that cannot be precisely measured, and indeeddifferent people with different values have diverging views on what isfair or unfair. Professional economists or organizations-particu-larly, I might add, the Congressional Budget Office-have no businessmaking statements about what is fair or unfair because there is noobjective or scientific way of proving or disproving that a tax is fairor unfair. It's based on values.
Now the values of the so-called experts, including myself, shouldn'tcount any more in evaluating fairness than the values of millions ofordinary taxpayers with no claims of expert status. The public atlarge is probably the best judge as to the "fairness" of a tax.
In this regard, the nonpartisan Advisory Commission on Intergov-ernmental Relations has been conducting polls on tax fairess for manyyears. For many years, the polls were done by Opinion Research Corp.and the last one was done by the Gallup Organization.
One question that has been consistently asked is: "Which do youthink is the worst tax-that is, the least fair?" Chart 1 of the preparedstatement looks at changes in the proportion of the respondents think-ing; the Federal income tax was the most unfair over time. Duringthe 1970's, the proportion of the population think the Federal in-come tax was the most unfair tax grew nearly 2 percent each year,so that by 1981, the income tax was considered far more unfair thanlocal property taxes, which has perennially been the most disliked tax.

107
Yet feelings as to the unfairness of the tax have declined slightlysince the 1981 tax cut was approved, reversing a decade-long trend ofincreasing disenchantment. At least from the public's perspective, the1981 tax bill seemed to be a move toward more equity, not less.
Now it is interesting to note that the rise in public perceptions ofunfairness with respect to the Federal income tax in the 1970's didnot occur in a period when the tax system was becoming more regres-sive. Indeed, as table 2 in my prepared statement suggests, the propor-tion of the population viewing the income tax as the most unfair taxalmost doubled in a period when the share of the tax burden paid byhigh-income groups actually rose relative to the share of the taxburden borne by the poor. The problem with the tax system, they wouldsuggest, is not that the rich pay too small a share of taxes; rather, theproblems lie elsewhere, such as in the horizontal equity issues men-tioned earlier.
Let me conclude by suggesting that the claim that the 1981 tax cutwas unfair is without foundation. The 1981 legislation increased thetax burden on the rich relative to the poor, reducing vertical inequities.Horizontal inequities were reduced by increased participation in thetax system by wealthy Americans. The American public itself viewsthe 1981 tax cut as a move toward greater equity. The fairness issue,at least as it relates to the 1981 tax cut, is no issue at all.
Thank you.[The joint prepared statement of Mr. Vedder and Mr. Gallaway
follows:]

108
JOINT PREPARED STATEMENT OF RICHARD K. VEDDER AND LOWELL GALLAWAY
WAS THE 1981 TAX CUT FAIR?
Thank you, Senator Jepsen, for inviting us to testify on this issue of
vital national interest. This is something of a homecoming for both of us, as
we both have had an enjoyable past association with the JEC as professional
staff members.
There has been a growing public concern about whether the Reagan economic
program, and in particular the 1981 tax bill, was "fair". We wish to make three
major points with respect to this question.
First, the recent primary campaigns make it abundantly clear that some
political officials and some parts of the public believe that increased taxation
of the rich relative to the poor means a fairer tax system. The empirical
evidence is crystal clear that persons holding that view should consider the
Economic Recovery Tax Act of 1981 as a major milestone in a half century of
public policy moves in providing income equality. That statement is based not
only on data showing that the wealthy paid a larger proportion of the total
income tax burden in 1982 than in 1981, but also on six decades of history
that show a systematic tendency for the tax burden of the rich to rise relative
to that of the poor when marginal tax rates are reduced for upper income groups.
Second, the evidence suggests that the American people are more concerned
with horizontal equity, and strongly believe that persons with similar incomes
should pay similar amounts of income tax. The public appears to be particularly
galled at the thought that some rich persons escape taxation altogether. The
1981 tax bill was a step in the direction of alleviating that concern, as is
such a legislative proposal as the Kemp-Kasten tax simplification bill.

109
Third, "fairness" is an elusive concept to define and impossible to
objectively measure with any precision. Nonetheless, the best available
evidence is that fairness cannot be increased by increasing tax rate
progressivity. A "soak the rich" philosophy of taxation is not considered to
be fair by the American people. The reduction in tax rates for all groups
in the 1981 tax bill was viewed by the American public as an important
first step in improving tax equity or fairness, contrary to the utterances
of Jesse Hartdale and other politicians.
Marginal Tax Reductions and the Tax Burden: Historical Evidence
Let me elaborate briefly on each of these points. First, other witnesses
and other observers such as the distinguished syndicated columnist Warren
Brookes have demonstrated that the 1982 tax reduction lowered tax payments
by the relatively low income groups but increased payments by the rich, a
move in the direction of increased fairness if the view is correct that
the federal income tax previously imposed too low of a tax burden on the
rich relative to the poor.
Some have criticized this evidence on the grounds that 1982 was an
unusual year, with a stock market boom, a major recession, and so on.
Examination of the historical evidence suggests, however, that the 1982
experience was very typical. When marginal tax fates are reduced
significantly for the rich, tax payments from the rich almost invariably
rise relative to tax payments from the poor.
Consider the interwar period from 1920 to 1941. In those years, the
maximum marginal tax rate was lowered and raised drastically on several
occasions, ranging from 24 percent in 1929 to 80 percent in 1940 and 1941.
The era included high war-related rates, a period of supply side tax
rate r-duc.-On- prc-ted by Secretary -. the Tre-sury Me.!.n, nd the
Hoover-Roosevelt "soak the rich" tax increases of the Thirties.
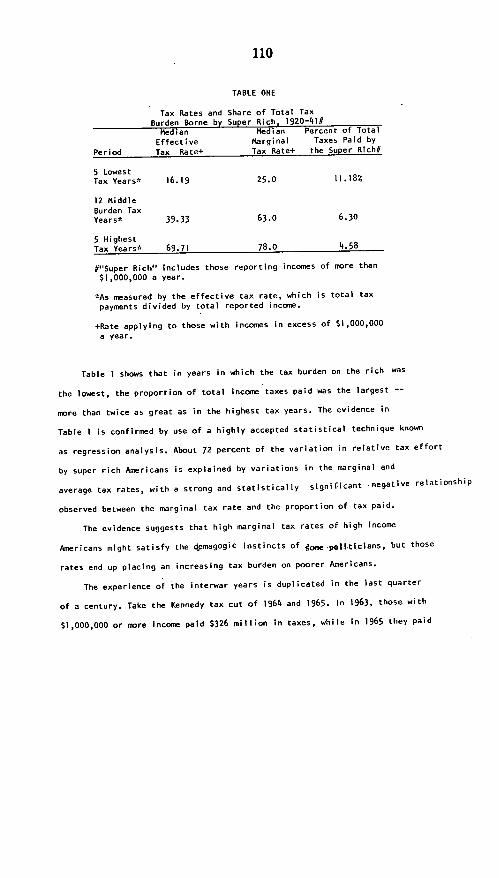
110
TABLE ONE
Tax Rates and Share of Total Tax
Burden borne by Super Rich, 1920-4l#Median Median Percent of Total
Effective Marginal Taxes Paid by
Period Tax Rate+ Tax Rate+ the Super Rich#
5 LowestTax Years* 16.19 25.0 11.18%
12 MiddleBurden TaxYears* 39.33 63.0 6.30
S HighestTax Years* 69.71 78.0 4.58
#"Super Rich" includes those reporting incomes of more than
$1,000,000 a year.
*As measured by the effective tax rate, which is total tax
payments divided by total reported income.
+Rate applying to those with incomes in excess of $1,000,000
a year.
Table I shows that in years in which the tax burden on the rich was
the lowest, the proportion of total income taxes paid was the largest --
more than twice as great as in the highest tax years. The evidence in
Table I is confirmed by use of a highly accepted statistical technique known
as regression analysis. About 72 percent of the variation in relative tax effort
by super rich Americans is explained by variations in the marginal and
average tax rates, with a strong and statistically significant negative relationship
observed between the marginal tax rate and the proportion of tax paid.
The evidence suggests that high marginal tax rates of high income
Americans might satisfy the demagogic instincts of jumm politicians, but those
rates end up placing an increasing tax burden on poorer Americans.
The experience of the interwar years is duplicated in the last quarter
of a century. Take the Kennedy tax cut of 1964 and 1965. In 1963, those with
$1,000,000 or more income paid $326 million in taxes, while in 1965 they paid

ill
$603 million, and their share of the total tax burden rose significantly.
Yet those high income Americans got a generous tax cut, almost equal in
percentage terms to those in lower income groups. More details on this
tax cut are provided in an excellent 1982 staff study prepared
for your committee, and I recommend you look at it.
The Laffer curve lives! Why? The answer is almost trivially simple.
Citizens face two options: they can pay taxes or not pay taxes. The latter
option can be pursued along two lines, namely tax avoidance (which is legal)
or tax evasion (which is illegal.) Lowering marginal tax rates lowers the
cost of paying taxes, reducing incentives to engage in either tax avoidance
or tax evasion strategies. Income comes out of shelters and out of the
underground economy and is taxed. If you attempt to tax the Golden Goose too
much, it will run away.
Flushing the Millionaires into the Tax Economy: The 1981 Tax Cut
To our second point. Survey data show that taxpayers are enraged by the
fact that some rich persons do not pay taxes. In the jargon of public finance,
people are concerned with horizontal equity, or the issues of whether people
in similar economic circumstances pay similar amounts of taxes. It is considered
unfair for some millionaires to pay hundreds of thousands of dollars in taxes
while others pay nothing.
In the last few years two significant changes in the tax code have greatly
improved horizontal equity by flushing out many heretofore hidden millionaires.
The first is legislation effective in 1979 sharply reducing tax rates on
capital gains, and the second is legislation-approved at the request of
President Reagan in 1981 lowering taxes for virtually all Americans.
Using regression analysis again, we developed a model based on changing
personal income levels and time trends that can explain almost 94 percent
of the variation In the number of income tax returns filed by persons with
more than $1;000,,000 in income for-the period 1970 to 1978. In 1978, for example,
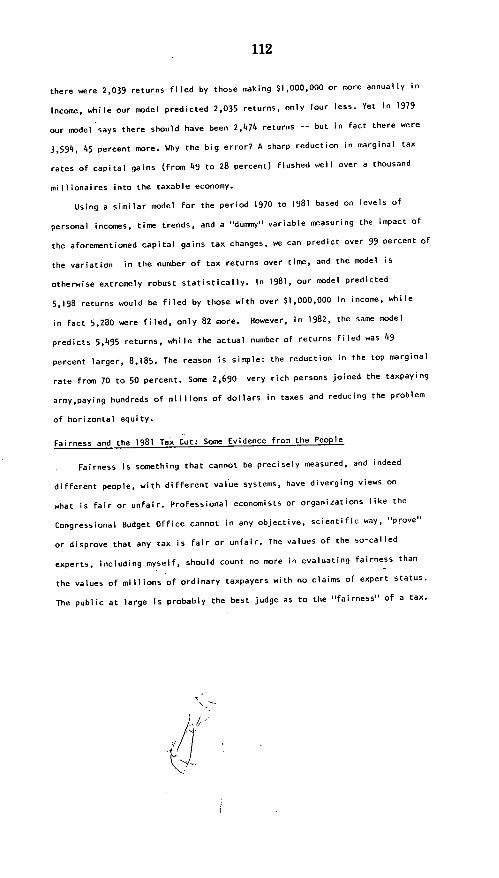
112
there were 2,039 returns filed by those making $1,000,000 or more annually in
income, while our model predicted 2,035 returns, only four less. Yet in 1979
our model says there should have been 2,474 returns -- but in fact there were
3,594, 45 percent more. Why the big error? A sharp reduction in marginal tax
rates of capital gains (from 49 to 28 percent) flushed well over a thousand
millionaires into the taxable economy.
Using a similar model for the period 1970 to 1981 based on levels of
personal incomes, time trends, and a "dummy" variable measuring the impact of
the aforementioned capital gains tax changes, we can predict over 99 percent of
the variation in the number of tax returns over time, and the model is
otherwise extremely robust statistically. In 1981, our model predicted
5,198 returns would be filed by those with over $1,000,000 in income, while
in fact 5,280 were filed, only 82 more. However, in 1982, the same model
predicts 5,495 returns, while the actual number of returns filed was 49
percent larger, 8,185. The reason is simple: the reduction in the top marginal
rate from 70 to 50 percent. Some 2,690 very rich persons joined the taxpaying
army,paying hundreds of millions of dollars in taxes and reducing the problem
of horizontal equity.
Fairness and the 1981 Tax Cut: Some Evidence from the People
Fairness is something that cannot be precisely measured, and indeed
different people, with different value systems, have diverging views on
what is fair or unfair. Professional economists or organizations like the
Congressional Budget Office cannot in any objective, scientific way, "prove"
or disprove that any tax is fair or unfair. The values of the so-called
experts, including myself, should count no more in evaluating fairness than
the values of millions of ordinary taxpayers with no claims of expert status.
The public at large is probably the best judge as to the "fairness" of a tax.

113:
In this regards, the nonpartisan Advisory Commission on Intergovernmental
Relations (ACIR) has been conducting polls on tax fairness for many years.
For many years, the polls were done by Opinion Research Corporation, although
the latest poll was conducted by the Gallup Organization.
One question consistently asked is: "Which do you think is the worst
tax - that is, the least fair?" Chart One looks at changes in the proportion
of the respondents thinking the federal income tax was the most unfair
over time. During the Seventies, the proportion of the population thinking
the federal income tax was the most unfair tax grew nearly two percent each
year, so that by 1981 the income tax was considered far more unfair than
local property taxes, perennially the most disliked tax. Yet feelings as to
the unfairness of the tax have declined slightly since the 1981 tax cut
was approved, reversing a decade long trend of increasing disenchantment.
At least from the public's perspective, the 1981 tax bill seemed to be a
move towards more equity, not less.CHART ONE
Change in Percent Viewing Federal Income Tax As Most Unfair Tax. 1972-83
MARCH1972- MAY'7
MORE UNFAIR MAY7 SEPT.
1981
+ 9%+ 8%
LjSSvUNFAIR
-1%
38-037 0 - 84 - 8

114
It is interesting to note that the rise in public perceptions of
unfairness with respect to the federal income tax did not occur in a period
when the tax system was becoming more regressive. Indeed, as Table 2
suggests, the proportion of the population viewing the income tax as the
most unfair tax almost doubled in a period when the share of the tax
burden paid by high income groups actually rose relative to the share of
the tax burden borne by the poor. The problem with the tax system,
that would suggest, is not that the rich pay too smal I a share of taxes.
Rather,the problems lie elsewhere, such as in the horizontal equity issues
mentioned earlier.
TABLE TWO
Fairness and Tax Burdens, 1972 and 1981
1972 1981
Percent Viewing Federal IncomeTax As Most Unfair Tax 19% 36%
Percent of Income Taxes Paid byTop 10 Percent of Income Recipients 43.68 44.o6
Percent of Income Taxes Paid byBottom 20 Percent of Income Recipients 2.67 1.99
Progressivity Index: Ratio, TaxPayments of Top 10 Percent To TaxPayments of Bottom 20 Percent 16.7 22.1
SOURCES: Internal Revenue Service, Advisory Commissionon Intergovernmental Relations
Conclusions
The claim that the 1981 tax cut was unfair is without foundation.
The 1981 legislation increased the tax burden on the rich relative to
the poor, reducing vertical inequities. Horizontal inequities were
reduced by increased participation in the tax system by wealthy Americans.
The American public itself views the 1981 tax cut as a move towards greater
equity. The fairness issue, at least as it relates to the 1981 tax cut,
is no issue at all.

115
Senator JEPSEN. I thank you.The critics of the current administration assert that its policies have
resulted in a massive redistribution of income from the poor to the rich.Is this view consistent with the results of the tax cuts and the dra-matically lower rate of inflation after 1981? Does anybody on the panelcare to comment on that?
Mr. ROBERTS. I think, Mr. Chairman, that the charge is obviouslyfalse. It's contradicted by not only all the evidence you have heardthis morning but the rest that hasn't been presented. There's no basisin fact for that charge.
Senator JEPSEN. Mr. Pratt, in your statement, you refer to a recentCongressional Budget Office staff study on recent tax changes. Youalso note its use of static estimates even though the data on actual pay-mnents in 1982 were available.
In addition, Mr. Rahn, in your prepared statement, you say for in-come categories above $40,000 the CBO projected a $23 billion short-fall. The actual results, however, show that tax revenues from thisgroup actually rose by approximately $4.5 billion.
Are you saying then that the CBO's projection of tax revenuesderived from this income group was off by $27.5 billion?
Mr. RAHN. That's quite right, and as I pointed out earlier, I thinkthe CBO study was a dishonest study, particularly since the data wasalready in and the fact that they just totally ignored the incentive ef-fects to work, save, and invest made by the tax rate reductions. Essen-tially, they argue that Reaganomics failed by ignoring the effects ofthe Reagan program, and I just find that basically unconscionable fora group of professional economists to do that and I would encourageyou to-
Mr. ROBERTS. Change the Director.Mr. RAHN. That was Mr. Roberts' statement, not mine, but I think
your displeasure should be made known to the CBO that that kind ofstudy should not be allowed.
Senator Smmrs. If the chairman would allow me to ask a question,do you think they did this because they are just incompetent or be-cause they are trying to mislead the public?
Mr. RAHN. Senator Symms, I really don't know what the motiva-tion was. I could guess the motivation, but I have never looked at themas being incompetent. I do not know what the direct motivation wasthere, but it's elearl7 something we shouldn't tolcratc.
Senator JEPSEN. Mr. Pratt, we might examine this going back toyour statement. From your statement, could we assume that you con-sider their study to be biased and unreliable?
Mr. PRATT. The title is "The Effects of the ERTA .Tax Cut," butthere were three studies in fact. There was one of the ERTA cut, oneof the TEFRA, and one of the effects of domestic spending programs.I only looked at the ERTA side of it because, for one thing, the actualdata we had on TEFRA didn't apply to the 1982 tax payments.
I don't know why they did it. If I had to guess, I'd say that some-body said that this is the result we want. That's very common in thesekind of situations. It was a static analysis. They acknowledge that itwas a static analysis. Mr. Penner wrote the Wall Street Journal aftermy article appeared saying it was a static analysis and it was only thebeginning of finding out what actually happened. There were no such

116
letters when the New York Times was citing this as proof that therich got richer and the poor got poorer. So from that, I have to con-clude there was a bias.
Senator JEPSEN. OK. Well, our purpose today is not necessarily todiscuss the veracity or credibility of the CBO, except to point out that,in fact, information that will be used and quoted from their studiesand reports in 1984 will be conveyed to the American people. There-fore, the fact that the one study Mr. Rahn pointed out that the projec-tion of tax revenues was off by $27.5 billion, and the fact in anotherstudy made by the Congressional Budget Office staff they used staticestimates even though there was actual data on actual payments avail-able, are relevant. There seems to be much public misunderstandingabout the relative share of taxes paid by various income groups. It istalked about and will be talked about much during the balance of 1984.
Do the wealthy now pay a smaller share of their incomes in taxesthan do middle- and low-income taxpayers and has this relationshipbeen stable over the years? Mr. Gwartney, do you want to answer that?
Mr. GWARTNEY. I'm not sure I quite understand the question.Senator JEPSEN. Do the wealthy now pay a smaller share of their
income in taxes than do middle- and lower-income taxpayers?Mr. GWARTNEY. My answer to that question is obviously no, that
they pay a larger share of their income than low- and middle-incometaxpayers and they have for some time. I think the more relevant con-sideration is what share of revenues you collect from high-incomepeople under different rate structures, and the sort of layman's seat-of-the-pants-type view is that obviously if you raise the rates of thewealthy, you will gather more revenue from them, and that's not true.The reason why it's not true is for the same reason it doesn't makeany sense for General Motors to try to sell their cars for $50,000. Notmany people buy them. And what happens when you continue raisingrates in the upper brackets, is that people have options, as severalmembers of this panel pointed out, to paying those high rates. Theyhave legal options. One of the options, of course, is to not earn income.They opt out of the labor force and do other things, spend more timeon vacation, less overtime, and all those kind of things, but they havea number of other options as well, such as organizing their financialaffairs a little bit differently.
Someone said that they thought the very best tax shelter or taxavoidance technique is you pick out what you like to do and then yougo into that business. Therefore, it means what you like to do, the ex-penditures for that sort of thing are tax deductible for you. If youlike to ski, you become a ski instructor, not full time. You stay a doc-tor or lawyer or whatever, but you become a part-time ski instructoron the side. If you like to drive cars, you go into some type of distribu-tional service where you can deduct off $15,000 or $20,000 automobilesf rom the cost of your services.
Now let me make one point with regard to this because I think thisis critically important and it has not come out to the extent that I thinkit's important to this panel. That is, some people have the view thatthese tax avoidance techniques or tax shelter techniques involve simplyclosing up a few loopholes or something of this sort. It's not true. Theyinvolve literally thousands of different kinds of techniques that areencouraged by how high or how low the marginal tax structure ratesare.

117
So what happens is when you reduce those rates in the upper incomebrackets, you collect more revenues from them. The incentive struc-tures I covered in my introductory remarks very clearly indicate thatthat would be the case for a proportional tax reduction. The data foreven that top 50 percent-which, by the way, in exhibit 5, the reasonI chose the top 1.36 percent of taxpayers is that is roughly the percentof people who would pay the above 50 percent marginal rate in 1981.So when we reduce those rates suddenly on nonpersonal service income,in some cases by as much as from 70 percent to 50 percent, we gatheredmore revenue from those people, both in dollar terms and as a percent-age of the total revenue.
So I think what the 1981-82 cut indicates, as well as analyses in moredetail that I referred to that Jim Long and I have done, is if you wantto gather more revenues from high income people, what you need todo is reduce those top rates even more. I think you could reduce thetop rates to the neighborhood of 30 percent and you would find thathigh income people would pay a higher percentage of the total taxesand that you would gather more revenue from them at those lowerrates than what you currently have.
Senator JEPSEN. Senator Roth.Senator ROTH. Thank you, Mr. Chairman.I'd like to go back to the question of what we should do with the
tax structure. I take it from what you just said, Mr. Gwartney, thatyou don't think that the so-called tax package that we have in con-ference right now is going to end tax shelters.
Mr. GwARTNEY. Absolutely not.Senator ROTH. I'm not an economist and ['m just a plain politician.
The thing that bothers me so much is that, as I understand your testi-mony today, all of it is very simple, but it's very difficult to getthrough because of these charges of unfairness. But if I understandyour testimony, what you're saying is that the consequence of the taxcut of 1981 is that the wealthy are in fact both percentagewise andactual dollars paying more taxes. Is that correct?
Mr. RoBmETs. Yes.Mr. RAHN. Correct.Mr. GwAirTNEY. Right.Mr. VEDOER. Right.Mr. PRATr. Yes.Senator RoTn. And the negative side or the nth er side. of that is that
the poor or less affluent are paying both less taxes percentagewise andthey are paying less taxes dollarwise.
Mr. GWARTNEY. That's correct.Mr. RAHN. Right.Senator ROTH. Why is that so hard to get through? It seems to me
even I can understand that. Why is that so hard to get across, becauseI think we have to face the fact that the American people have beensold a bill of goods that the very opposite has happened. Would youagree with that?
Mr. VEDDER. That's right.Mr. RAHN. Yes.Mr. GwARTNEY. Yes.Mr. VEnDER. Part of the answer, Senator Roth, is right over there
[indicating] in your own organization-not yours personally, but the

118
U.S. Congress is subsidizing an organization that is spreading mali-cious lies that are completely without factual foundation about this inthe form of this chart and other forms and in so-called studies thatare based on totally erroneous assumptions about human behavior.
Senator ROTH. I'd like to go to the economic model in a moment,but let me just, if I might-these figures that you're citing showingthe conclusions that we just went over, can those be challenged? Canother figures be carted out showing otherwise or is there any question,any basis of saying that the rich in fact did not pay more? Are thosefigures that you're basing your conclusions on beyond challenge?
Mr. ROBERTS. They are the figures of the Internal Revenue Service.Senator ROTH. And they are published figures ?Mr. ROBERTS. If the Internal Revenue Service decided they wanted
to somehow revise their figures, the way the Federal Reserve doesMr. PRATT. Senator Roth, the challenges to the numbers presented
here are that they are just 1 year-1982 was a year of recession. 1982was a year when the stock market went way down and went way up.The rate of change of prices decreased. The upshot is that it's toosoon to tell, maybe. Certainly, by the time 1984 returns are analyzed,which because the 1984 returns won't be filed until next April-1985-won't be analyzed for another 9 or 10 months after that-by then,we should have a much better picture. But as all of us today havepointed out, the data that we have, the 1982 returns, and the trend ofthe "other" component in Treasury receipts, indicate that there hasbeen a surge in tax payments by those with high incomes, high prop-erty income particularly. If the data had been the other way, I thinkwe'd hear more about them.
Senator ROTH. In other words, the only evidence that's availableat this time confirms the conclusions that were drawn?
Mr. ROBERTS. Yes; and so does all the evidence from all past occa-sions of similar tax cuts.
This is not a new pattern. This is a pattern that occurs every timethe top rates are cut.
Senator ROTH. The same thing happened in the so-called Kennedyround?
Mr. ROBERTS. That's right, and also in the Mellon period.Senator ROTH. Couldn't you have made the same false allegations
against Kennedy that that benefited the rich? I mean, if you acceptit for this round, wouldn't it be equally applicable for the Kennedyround?
Mr. ROBERTS. Fortunately for President Kennedy, at that time theCongressional Budget Office did not exist. That was a mistake of themid-1970's.
Senator ROTH. Let me ask you this question: Is there anywhere aneconomic model that's not static and takes into consideration some ofthese other factors that you gentlemen agree is a good economic model?
Mr. GWARTNEY. You're talking about a macroeconomic model?Senator ROTH. Macroeconomic, yes.Mr. RAHN. Well, all the models involve a good deal of judgment
in terms of certain assumptions, but you might take a look at the recordof the economic forecasters particularly over the last couple years, andI think that you will find those forecasters with the supply-side orien-tation, such as the U.S. Chamber, have been very close to the mark. I

119
realize that it is self-serving, but it's also true. As opposed to theKeynesians who are claiming the recovery could not take place andthen they said it would be an anemic recovery or one with a rapid in-flation. They have been consistently wrong. If we could start reject-ing those people who have been consistently wrong and start lookingat the ones that have had a little better track records-the science ofeconomic knowledge building is still probably more an art than ascience, but clearly in the last couple years to differentiate those whohave done a rather poor job from those who have done a much betterjob.
Senator ROTH. I'd like to switch ground just slightly now. I noticein most of your testimony a great deal of confidence in the economicrecovery and yet that seems again to be the opposite of what one readsin the press, opposite what one hears even on Wall Street, and so forth.
Let me ask you, do you see the economic recovery as sound, as con-tinuing, or do you think it's a very fragile thing that can collapse atany instant? If you feel it's strong, why is there this extremely nervousperception abroad that it's temporary in nature?
Mr. RAHN. Since I have been one of the more optimistic ones pre-dicting a strong recovery for the last 2 years, all the evidence is thatthis is a very strong recovery. It is very well balanced. The great in-crease in plant and equipment spending that I mentioned has led tohigher levels of productivity than most people had forecast. If youlook at the amount of job creation, there's no period when we've everhad this kind of increase in job creation.
Now, of course, the recovery could be aborted and that could onlybe done by the Federal Reserve and that is a constant worry amongall of us who watch and make policy recommendations concerning theeconomy about the erratic Federal Reserve behavior. But in the ab-sence of a major mistake by the Federal Reserve, this recovery clearlyought to go for the next couple years at a strong level.
Now you're absolutely right about the bad press. I'm astoundedwhen I often read the Washington Post of what their analysis is versuswhat the facts are. But if you look at what they have been saying forthe last several years-and there are a number of politicians and newsorganizations that seem to have a vested interest in bad news and thefailure of our type of free enterprise society. Those of us who believein the importance of higher real economic growth and personal free-dom, T think have to speak more loudly agninst these npople who do notseem to have the same kind of respect for the Constitution and the im-portance of increasing real per capita incomes of most of us in theroom.
Senator RoTH. Now one of the criticisms one hears or one of thecomments one constantly reads is that this recovery is not based onReaganomics, the changes that he's brought about, but in fact we stillhave Keynesian economics in effect, that this is just an outflow of theconstant deficit. How do you answer that?
Mr. RAHN. I think Mr. Roberts did a nice article about that theother day.
Mr. RoBERTs. Senator Roth, the evidence shows clearly that thegrowth in consumption has lagged the growth in the real gross na-tional product and that this is not a consumption-led recovery.

120
The evidence also shows a very unusual feature of this recovery,and that is that the contribution of fixed business investment to GNPgrowth is three times the average contribution which has characterizedall recovery in the postwar period.
The data on this recovery is not based on any model or theory. It'sbased on the evidence that has been thrown up by the economy itself,and the data show clearly that it is not a consumption-led Keynesianrecovery.
The reason I think, Senator Roth, that the strong recovery has sucha bad press is that the entire forecasting establishment predicted thatthere would be no recovery and therefore they're very embarrassed tohave been so wrong in their forecast and they are trying to pretendthat it's not really here and it's going to go away any moment. Theyare basically people who were completely wrong and who are tryingto cover up the fact that they cannot forecast.
Senator RoTH. Could I ask one more question ?Senator JEPSEN. Sure.Senator RoTH. As you know, we have a tax package before us.
There's already a lot of talk about what's going to happen next year,some talk about reform, but even more talk that once we get throughthe election, what we're really going to have to do is raise taxes sub-stantially to reduce the deficit.
What I would like to ask you is a twofold question. No. 1, is that thekind of medicine that the economic recovery needs, a tax increase, inwhatever form?* And second, could you briefly say if we are going tohave tax reform, what are the criteria you would use in bringing aboutthat reform or that change?
Mr. ROBERTS. Senator Roth, I think that the talk about higher taxesis probably hurting the recovery because it creates so much uncertaintyfor decisionmakers. They are not certain which taxes and when. Iftaxes are raised by any substantial amount, it will definitely hurt therecovery, and this is something that every economic model would pre-dict, not just a supplyside one. It is the consensus of all economicmodels that tax increases retard economic growth. There's no theorythat says tax increases help economic growth.
I think the talk about the tax increase, as well as the reason for one,is largely political. It is an effort to pretend that the Reagan tax cutswere not successful. It is, in my view, entirely a political operation.It has nothing to do with economics, with the need of the economy,but it is an effort to paint a highly successful program as unsuccessful,and therefore we must backpedal and back away from it. That is allthe tax increase talk is about.
Now to answer your other question, if there is an opportunity fora major tax reform along supply-side lines, then seize it and certainlyyou might make all efforts to change this rather silly tax increasebefore the Congress now into a major reform that would broaden thebase in exchange for sharply lower rates. If we could have a furthersupply-side tax reform, then we could expect the high growth rateswhich have characterized the economy recently, and which have beennoninflationary to continue for a long time.
Mr. RAHN. I'd like to add just a couple comments to Mr. Roberts'remarks which I fully concur with. Again, I am hopeful that after theelection period when much of the political demagoguery goes away,

121
that people will start looking at the deficits in a far more dispassion-ate way than they have been and see how rapidly they are comingdown as a result of economic growth.
Now it is true that the Congress needs to do more on the spendingside, but it is also true that right now tax revenues are increasing at afar faster rate than are Government expenditures. Hence, you do havethe real drop in deficit, particularly when you add in the State andlocal government surpluses. If you look at the governmental sectordeficit, it is getting down to numbers that are very close to what theywere in the mid-1970's, and we lived with that. Not that I'm advocat-ing we live with high deficits. We need to do more on the spendingside, but the evidence, as Craig Roberts and many people here havestated time and time again, is overwhelming that major tax increaseswill retard economic growth, if not bring on a major recession, whichcauses higher spending rather than lower, and that over time, furtherreductions in those taxes that particularly provide disincentives towork, saving and investment will bring greater degrees of economicprosperity and well being to our people.
Mr. ROBERTS. Senator Roth, I'd like to say that the deficit is totallya red herring and these predictions of deficits have proven to be evenmore inaccurate than the Congressional Budget Office's predictions oftax cut gains.
If you look at the budget of the U.S. Government for fiscal year1984, that is the budget that was issued officially by the Governmentfor the current fiscal year, the prediction was that the deficit for thiscurrent fiscal year would be $231 billion. Well, it's currently runningin the $160 to $170 billion range, so here we have the deficit actuallycoming in $60 to $70 billion below predictions for the year.
If the recovery is allowed to continue by the Federal ReserveBoard-and that is not a certain fact-but if it is allowed to continue,then you will see that the deficit, when offset by the surpluses of Stateand local government budgets, is no longer an economic problem.
The only way the deficit can become an economic problem is if therecovery is seriously slowed or aborted. If the recovery is slowed oraborted by the Federal Reserve or by tax increases or by a combina-tion of both, then the deficit will rise. But the current deficit is falling.It's falling rapidly, and is much below OMB's prediction for thisyear's budget of $231 billion. Obviously, this is a forecasting error ofenormous ma-4-..i
Senator Symms. What do you think it will end up at?Mr. ROBERTS. Well, if it's not aborted, I think that the deficit for
the year will probably come in around $165 billion, but that it will befalling such that by the time you hit the last part of the year it willbe running about $130 billion on an annual rate.
Now if you add to that the surpluses in State and local governmentbudgets which are around $60 billion, then you do not have the Gov-ernment presence in financial markets on any scale that would dis-turb anything.
Senator STymms. Senator Boschwitz recently wrote an article whichwas in the New York Times about 2 or 3 weeks ago that I thought wasvery good, where he pointed out that the same people that predicteda balanced budget in 1984 are now predicting a $200 billion deficit.He thinks it looks like they may be that far off again and there may

122
be a chance that it could, under just a recovery, just completely bediminished to nonsignificance.
Mr. ROBERTS. Yes. If you compare the current budget projections ofthe Office of Management and Budget to the ones they made a yearago, they've already had to reduce these projections by an average of25 percent, and for what they call the out-years, by a factor of one-third.
Senator SYMMS. Well, I'm interested in this chart that's up on thewall, Mr. Chairman, and the comments that were made. Mr. Vedder,you made some pretty strong statements there and I appreciate that,but when you made those statements about the so-called disinforma-tion by the CBO I am reminded of articles and speeches that ArnoldBourchagrave gives about disinformation on the part of the Sovietsin other matters. One that particularly comes to mind is how ourown CIA seems to try to cover up the fact that there's a definite con-nection between the attempted assassination of the Pope and the Bul-garians and the KGB, and yet our CIA wants to cover that up sothat we don't have the appearance that there's a difference betweenus and the Soviets.
Do you see any parallel there?Mr. VEDDER. Well, I must admit I wasn't prepared for that question.Senator SYMMS. But the taxpayers are paying for this nonsense
over here and that gives fuel to the fire of portions of the Westernmedia in the free press who don't believe in supply-side economicsand are anticapitalistic in their mentality anyway.
Mr. VEDDER. Right.Senator SyMms. So they take that and run with it.Mr. VEDDER. Well, I'm sorry I was a little strong on the CBO,
Senator.Senator SYMMS. Don't apologize.Mr. VEDDER. I know I don't have to apologize to you, however, I once
worked in the same building with the CBO and I sort of got afeeling that there was something less than total objectivity in thepreparation of some studies. But aside from that, it seems to me that.if a young assistant professor at my university had come in with astudy like this and came up for tenure and he says, "I need to be giventenure," I would say, "No, you don't know anything about economics."To prepare a study that ignored the basic assumptions of human be-havior that people respond to changes in relative price, which isessentially what we are talking about here, to ignore that among pro-fessional economists is totally unconscionable. That is like trying torepeal the law of demand, and that is essentially to go beyond the paleof what is acceptable.
Senator SYMMS. Congress has tried to do that, too. It didn't work.Mr. VEDDER. I noticed, yes.Senator SyMMs. Mr. Rahn.Mr. RAHN. Well, I would just totally agree with Mr. Vedder. What
it is, is equivalent to repealing the law of supply and demand. You aresaying that people do not respond to changes in price.
Senator SYMMS. The late Keith Sebelius was a very dear friend of,mine, a Congressman from Kansas. When we were in the House to-gether we went -through these drills of wage and price, controls andwe were always in opposition to it. At the time something that was

123
very controversial was the skyrocketing price of beef in the store andthere was a great uproar on the floor. They were extending it and wewere opposing the extension of wage and price control authority.Mr. Sebelius offered an amendment to the bill which changed thegestation period of a cow from 9 months to 7 so that they could havethe calves faster, and lower the price for the Congress. And he madehis point, but we still lost the vote because there was such a strong anti-capitalistic mentality in the country, but I think it's gotten better sincethose days with Ronald Reagan's Presidency.
Now, I want to ask three specific questions. One is, there's a lot oftalk about broadening the base and lowering tax rates and I happento be someone who believes that where you tax people, whether the taxhits consumption or production, has a big overall impact, as well aswhat the rate of taxation is. So the Kemp-Kasten bill is talked abouta lot and there's the Bradley-Gephardt plan.
There's another plan that was prepared by the Hoover Institute ofStanford, the Hall-Rabushka plan. Would each one of you tell mewhich one of these plans, if you had your druthers, that you would liketo see pass, or are you familiar enough with them?
Mr. RoBERTs. I would like to say that all three plans show the ascen-dency of supply-side thinking because that is the basic framework forall three plans. I think that's significant, Senator Symms, becauseBradley and Gephardt are liberal Members of the Congress and to seethem with a supply-side framework for their own tax program is, Ithink, significant.
Senator SyMms. Do you think the Hall-Rabushka plan of theHoover Institution is superior to the other plans?
Mr. ROBERTS. I think if you could get the Hall-Rabushka plan orthe Kemp-Kasten plan, you would have a fundamental improvementin the tax system of the United States that would have lasting effectsfor decades and I think these would be a wonderful contribution tothe welfare of everyone in the country.
Senator SYMMs. How does the Kemp-Kasten plan affect the farmers,though?
Mr. ROBERTS. What do you mean?Senator SyMMs. A small business farmer, a farmer who's not in-
corporated and has to have business deductions and so forth in orderto survive, where his gross income and his net income would be far andaway a different subject.
Mr. ROBERTS. Well, Senator Symms, I'd have to study that particu-lar question in detail. I would say that it's likely to affect the farmerin many ways, many that would not maybe be obvious to him, and itwould come from having created a better and far superior economicenvironment and, of course, the general economic environment is oneof the main features which determines the success of any kind of busi-ness venture.
Senator SYMMs. Well, what about-I've been told by some peoplethat there is a bias against the West and the Southwest where you haveoil depletion allowances, mineral depletion allowances, timber capitalgains taxes, and agricultural taxing of many business agricultural de-ductions and so forth that are taken.
Would there be, in your opinion, any bias against the productionareas of raw materials in the country with a flat rate income taxoi., he Kemp-Kasten bill, for example?

124
Mr. ROBERTS. I don't think about them in that way. What you'redoing is that you're creating a low and uniform tax rate which offersof course, enormous incentives for investment without the distortionsthat are inflicted on investment by having a different tax situation forevery kind of investment. If you have a different tax situation forevery kind of investment, then you get people making investment deci-sions for tax reasons rather than for economic or investment reasons.So the whole notion of these three approaches
Senator SYMMS. Well, I would be against the Western peoplestopping investment in the production of minerals, timber or oil andgas.
Mr. ROBERTS. Why would they if they find that the tax paid on theirprofits is lower? I mean why should they? You can't think about thisin terms of the distributional gains and losses in tax subsidies becausewhat you're going for is a far superior environment, and you hope thatin general the broadening of the base is offset by the lowering of therates. If there are some special cases in which this does not happen, youjust have to go with it.
Senator SYMMs. The problem is, I don't have to worry about it eitherexcept that if I want to get reelected in 1986, and if I have all the majorpr oduction companies in my State down on this idea that I'm promot-ing. it makes it a little difficult if the word is out that Symms is goingto raise your taxes in this big effort for flat rate income taxes. NowPeter Grace said before this committee that 90 percent of the incomeavailable to the Federal Government comes from people who earn$35,000 a year or less, and my great fear about tax reform is whenpoliticians talk about tax reform it's because they don't have the gutsto talk about spending reform. With a 25-percent spending rate ofthe GNP and a 19-percent revenue flow of the GNP to the Treasury,unless growth in the economy gets up enough so that the revenueequals the spending, just pure growth, something has to be done onthe spending side.
Now I think all of you are opposed to doing away with indexing. Isthat correct?
Mr. RoBERrrs. Tax indexing.Senator SYIm-s. Tax indexing.Mr. RAHN. Yes.Mr. GWARTNEY. Yes.Senator SYMMs. Now my personal CPA is not an economist but
he's an accountant, and he says that those of us that argue that weshould keep indexing at all costs are making a grievous mistake.He says, "What you should argue is to do away with all index-ing of the spending side and the Tax Code at the same time and yourconsumers and taxpayers will benefit from that because the moneythat we don't raise taxes for we're borrowing or we're printing it orcounterfeiting the currency, so the taxpayer has to pay for it eitherway." And he makes that argument.
What do you say back, Mr. Rahn?Mr. RAHN. Since I've watched the behavior of you and your col-
leagues for a number of years, that assertion assumes that you wouldnot go ahead and increase payments to Social Security recipients ormedicare recipients or the other people that have indexed programs,and I know that you and Senator Jepsen might well vote against hav-ing big increases in those programs in the name of fiscal responsibility,

125
but, unfortunately, from what I've noticed of the behavior of manyof your colleagues, I think that is unlikely to occur.
In addition, getting rid of tax indexing of course hurts the low andmiddle income people and you have that constant increase in revenueas a percentage of GNP going to the Federal Government and, again,if you look at history, we find that the Congress has always managedto increase spending faster than revenue and any time we have at-tempted to go ahead and bring revenue up to spending somehowspending has gotten ahead.
Senator SYMMS. Right. He's making the argument, though, that thebudget is balanced. He's looking at it as an accountant.
Mr. RAHN. Those fellows who did that [indicating the CBO chart]are accountants, too.
Senator SyMms. He said that the budget is balanced and you're bal-ancing it by either borrowing or printing money. If you could get all92 indexed programs frozen in place then it would be a fair tradeoff,then you would actually leave more money in the hands of the privatesector to build and go with.
Mr. RAHN. First of all, are you going to freeze those programs?Senator SYMMS. The answer is no, of course.Mr. ROBERTS. That would depend on the inflation rate and the Fed-
eral Reserve over whom-as far as I can tell-nobody has any control.Senator Symms. Mr. Pratt.Mr. PRATT. I would say I agree with your accountant in that if I
had to make a choice of which I would think is better, if I had to giveup indexing, I'd rather do it on both sides or I'd even trade the index-ing of the taxes for the deindexing of the spending. I don't thinkthere's a serious proposal for this anywhere.
Senator SYMMS. Well, it's interesting.Mr. PRATT. That's what I say. I would favor it because it would
create an enormous constituency who would be aghast at inflation.Senator SYMms. Well, it's interesting that I tried it on the Senate
Finance Committee and didn't get any takers.Mr. PRATr. I don't imagine so.Mr. ROBERTS. That surprises me. I would think that you would,
Senator, because I think that Mr. Rahn's point was that if you takeaway the automatic indexing of benefits, you will simply replace themwith legislated increases in benefits. I'm surprised Congress ever gaveup the right to legislate Social Security benefits and instead replacedthem with an automatic cost-of-living adjustment, because you can'tgo out and tell them, "I've raised your benefits," because it was doneautomatically.
Senator SyMms. But if we could get this idea of reducing the taxrates popular, we could do that every year also. We could have a5-percent reduction in rates every year and I have said to a lot ofpeople that probably if we would just repeal the taxes on dividendsand double taxation and the taxes on interest, if we had done that in1981 along with reducing all the rates down to where the highest ratewas 50 percent, and then just start reducing all tax rates at 5 and 10percent a year and just keep on going and not touch the rest of theTax Code, we'd have a lot less confusion-you know, we've just gotchaos out there in the business community because we change theTax Code every year. It's like being a roller ball player.

126
Mr. RAHN. You have made a key point there and I think one of thebest things Congress could do in terms of taxes is take a long vacation.
Senator SYMnIs. Absolutely. If the Senate Finance wouldn't meetfor 5 years and the House committee wouldn't meet-
Mr. RAHN. Because right now we know businessmen are reluctantto invest because you put the ACRS in in 1981 and you took a bighunk of it back in 1982 and so the investors all assume the worst isgoing to happen to them. Hence, we have lower levels of investmentthan we would have had.
Senator SYMMS. But on the other side of this, if we could get spend-ing under control, then there wouldn't be so much pressure to raisetaxes. I have felt that the supply-side economic theory that supposedlyPresident Reagan came into town with, we only got about a third of itput into effect and two-thirds of it is still yet to be put into effect,and the first thing that would have been helpful is if we would haveknocked out the increases in spending really dramatically in 1981.
Mr. RAHN. Well, you see how well it works then. Already we havethe highest growth rate of any economy in the world with only one-third of it in effect. Just think if we had the other two-thirds.
Senator SYMMS. Did you want to make a comment, Mr. Vedder?Mr. VEDDER. Well, I would agree with you in saying that only a
small part of it is in effect. Going back to your original point, SenatorSymms, you were asking which of these three proposals is superior.
I would agree with Craig Roberts in saying that any one of themis a monumental step forward, even Bradley-Gephardt with a 30-percent top marginal rate. Thirty percent is better than 50 percent.However, 20 percent is better than 30 or 19 percent or whatever Hall-Rabushka is, and Hall-Rabushka has the added advantage of notrequiring any worry about indexation at all. I mean, it disappearsfrom consideration if you have a flat rate, whereas with Bradley-Gephardt you still have the potential bracket creep arising becauseof the fact that there is an implicit progressivity in it which lendsitself to mischief later on when people want to go and add anotherbracket one or two or three or four.
So I would say that you should be commended for supporting theHall-Rabushka plan because it is sort of the extreme, if you like.
Senator SYMMs. It's the touchstone.Mr. VEDDER. It's the touchstone, the one that can't be beat in terms
of going to the lowest possible flat rate with the largest base. Nowthere are some problems with Hall-Rabushka, but I'm just sayingthat if you really want to go all the way, that's the way to go.
Senator SyMms. Well, last weekend two economists from the Brook-ings Institution unveiled a proposal which would tax consumptionrather than income and I couldn't help notice that the tax rates theyrecommended are much lower than our current income tax rates. Ialso noticed that the Washington Post yesterday gave PresidentReagan the credit he deserves for playing a big role in altering theattitude of the public and policymakers toward taxation of theeconomic effects of taxation.
Are any of you aware of the Brookings consumption tax proposal?Is it a good one?

127
Mr. ROBERTS. It's certainly a better tax system than we have now.It's basically a consumption-based income tax that excludes all in-come saved from the tax base and it has I think a top rate of 32percent, the same for corporations. What it does require-and theseare details of the proposal-is that individuals and businesses reportall borrowing as income. They can deduct all investment. For exam-ple, business would have a 1-year writeoff of all investment expenses.
I think the most serious problem with it is detail that is not an in-tegral part of the proposal, such as to have all inheritances treatedas income so if someone comes into an inheritance it is taxed as in-come. This treats wealth as income and wealth is a different thing thanincome.
I think it is not as good a system as Hall-Rabushka, for certain,but what it shows you is that even that liberal economists in the Demo-cratic think tanks are moving in the same direction.
Senator SYMMS. That's good. That's a plus. Well, I'll just make oneother comment. I've said this before. One of the disturbing things isthat it seems like we don't have to go very far to find that we're ourown worst enemies. When the President gave a speech in Boston acouple years ago and said that he would like to abolish the corporateincome tax or his goal would be to get rid of it so that we could havehonesty in the Tax Code because people pay all the taxes anyway andbusiness just ends up being a tax collector for government, and it in-terferes with the process of capitalization, before he got off the podium,the apologists at the White House were telling the press that that'sreally not what the President meant. I think that's just tragic. If yougo out to the farm cooperatives in the country in the West and placeswhere they can actually accumulate capital and they don't have topay taxes on it until they distribute the income, it's a much bettersystem and we should adopt that for all corporations. What alwaysbothers me is the business community will raise heck about the taxbreak given to farm co-ops because they say it's unfair competition,when what they should be doing is arguing to give all corporationsthose same privileges so that if they would pile money in and buildplants and equipment and so forth, that they would pay no taxes on ituntil they distribute the income and then you'd have an honest system.
But we're our own worst enemies in this thing because everybodywants to get everybody else paying taxes and I hope that somethingdoes come of it,, but my fear is that there will be a massive tax increaseif we're not careful on any major reform of our Tax Code.
I appreciate all of you for your help and efforts to keep some lighton this subject so that those people like Paul Volcker and others whocontinually threaten Congress that if we don't raise taxes, he's goingto push the discount rate up, and so forth-I hope that we can in factget this information out to the public because it's so badly needed torestore confidence in the capitalistic system and that's really what'sneeded, confidence in capitalism, and if we have that, our system surelywill survive. We can't lose.
Unless there are any other comments that any of you want to make,the meeting is adjourned.
[Whereupon, at 11:55 a.m., the committee adjourned, subject to thecall of the Chair.]
0