Embed Size (px)
Citation preview

in partnership with
Title: S-DWH Modular Workflow
WP: 3 Deliverable: 3.2
Version: 1.0 Date: 25-2-2013
Autor: Allan Randlepp NSI: Statistics Estonia
ESS - NET
1
ON MICRO DATA LINKING AND DATA WAREHOUSING IN PRODUCTION OF BUSINESS STATISTICS
@S-DWH Modular WorkflowVersion:1.0 February 25, 2013: Allan Randlepp
Summary1 Introduction...................................................................................................................................3
2 Statistical production models........................................................................................................3
2.1 Stovepipe model....................................................................................................................3
2.2 Augmented stovepipe model.................................................................................................4
2.3 Integrated model....................................................................................................................5
2.4 Warehouse approach..............................................................................................................6
3 Integrated Warehouse model........................................................................................................7
3.1 Technical platform integration..............................................................................................8
3.2 Process integration.................................................................................................................9
3.3 Warehouse – reuse of data...................................................................................................10
4 S-DWH as layered modular system............................................................................................12
4.1 Layered architecture............................................................................................................12
4.2 CORE services and reuse of components............................................................................13
5 Conclusion..................................................................................................................................15
2

1 Introduction
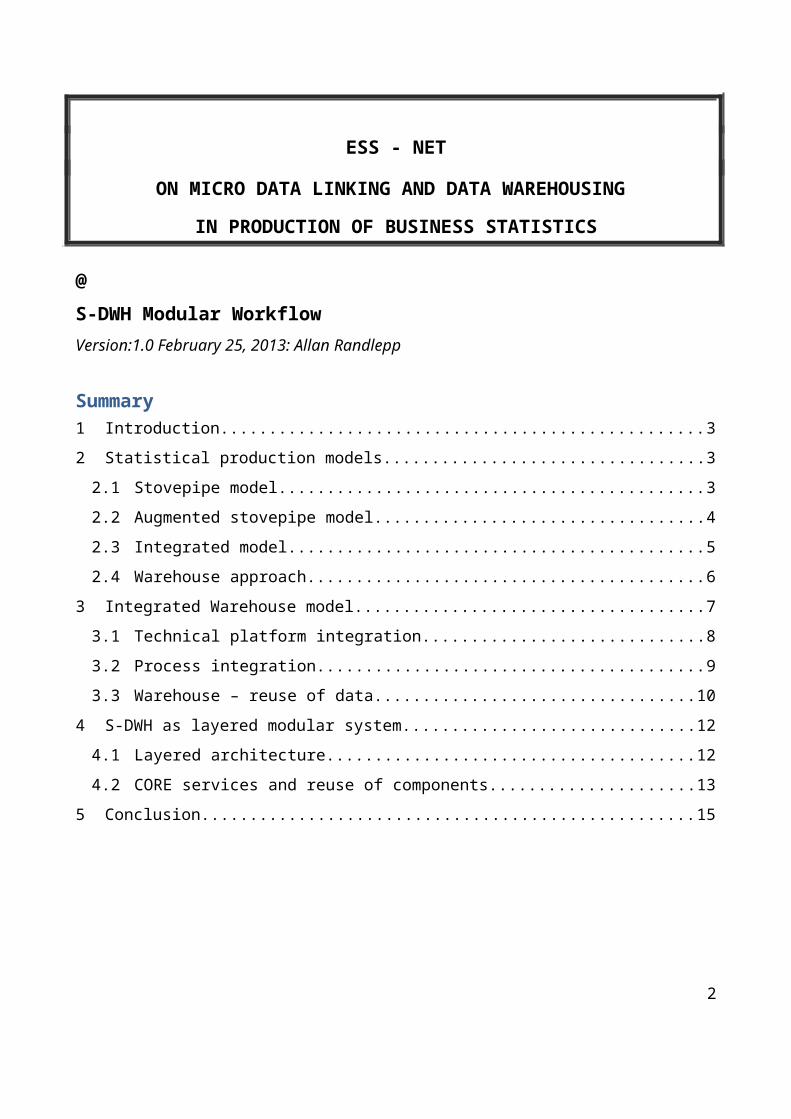
Next figure (from Sundgren (2004a)) shows a statistical system as precisely defined, man-designed system, that measures external reality. Planning and control system on the figure corresponds to phases 1-3 and 9 in GSBPM notation and statistical production system on the figure corresponds to phases 4-8 in GSBPM.
„ There is an ongoing complex exchange of data and actions between the statistical system and its environment. The situation and changes in the environment (a society) are reflected by data and data updates in the statistical system. Decision-makers interpret data from the statistical system, assisted by analysts and researchers, and they make decisions that change reality (the society), and in the following iterations they may see and evaluate the effects of their decisions as reflected by the statistikal system (and other information systems in the environment of the statistical system).“ (The Systems Approach to Official Statistics)
…
3
2 Statistical production models
2.1 Stovepipe model
“The stovepipe model is the outcome of a historic process in which statistics in individual domains have developed independently. It has a number of advantages: the production processes are best adapted to the corresponding products; it is flexible in that it can adapt quickly to relatively minor changes in the underlying phenomena that the data describe; it is under the control of the domain manager and it results in a low-risk business architecture, as a problem in one of the production processes should normally not affect the rest of the production.” (Terminology Relating To The Implementation Of The Vision On The Production Method Of Eu Statistics)
“However, the stovepipe model also has a number of disadvantages. First, it may impose an unnecessary burden on respondents when the collection of data is conducted in an uncoordinated manner and respondents are asked for the same information more than once. Second, the stovepipe model is not well adapted to collect data on phenomena that cover multiple dimensions, such as globalisation, sustainability or climate change. Last but not least, this way of production is inefficient and costly, as it does not make use of standardisation between areas and collaboration between Member States. Redundancies and duplication of work, be it in development, in production or in dissemination processes are unavoidable in the stovepipe model. These inefficiencies and costs for the production of national data are further amplified when it comes to collecting and integrating regional data, which are indispensible for the design, monitoring and evaluation of some EU policies.” (Terminology Relating To The Implementation Of The Vision On The Production Method Of Eu Statistics)
2.2 Augmented stovepipe model
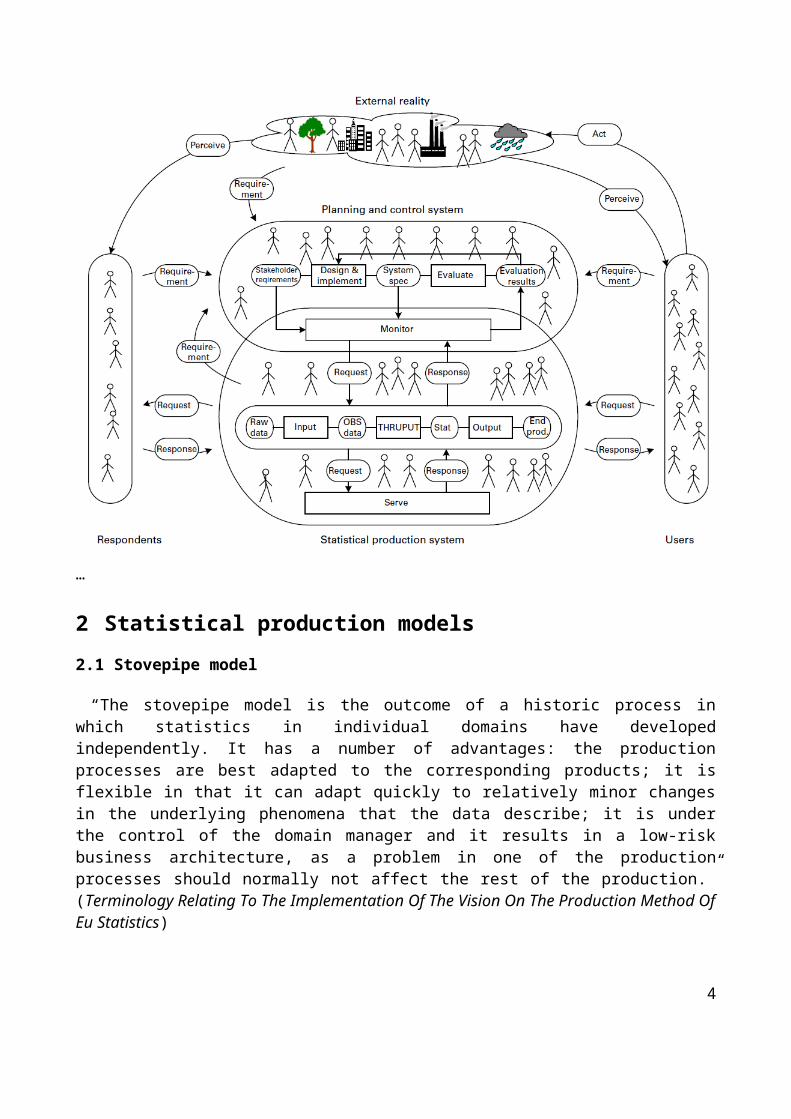
As indicated in the previous paragraph, the stovepipe model describes the pre-dominant situation within the ESS where statistics are produced in numerous parallel processes. The adjective "augmented" indicates that the same model is reproduced and added at Eurostat level.
Data processing
Table
Data collection
Data processing
Table
Data collection
Data processing
Table
Data collection
Data processing
Table
Data collection
Statistics 1 Statistics 2 Statistics 3 Statistics n
4
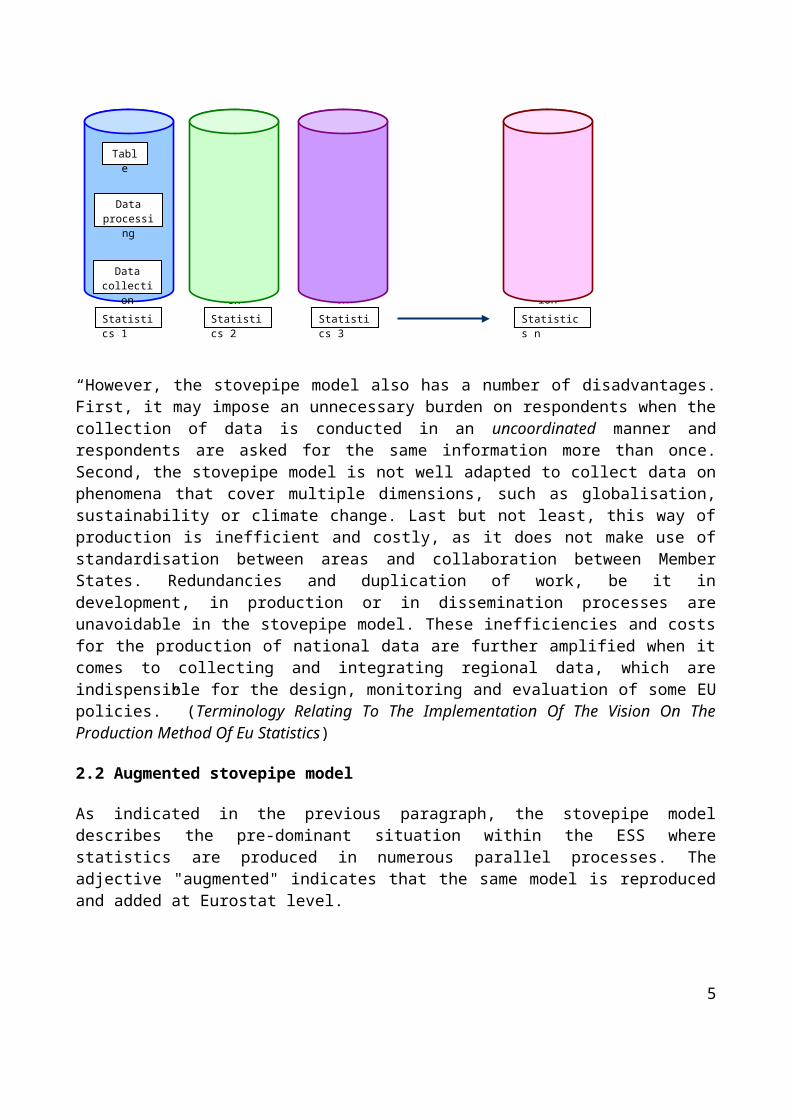
In order to produce European statistics, Eurostat compiles the data coming from individual NSIs also area by area. The same stovepipe model thus exists in Eurostat, where the harmonised data in a particular statistical domain are aggregated to produce European statistics in that domain. The traditional approach for the production of European statistics based on the stovepipe model can thus be labelled as an "augmented" stovepipe model, in that the European level is added to the national level. (Terminology Relating To The Implementation Of The Vision On The Production Method Of Eu Statistics)
2.3 Integrated model
“Innovative way of producing statistics based on the combination of various data sources in order to streamline the production process. This integration is twofold:
a) horizontal integration across statistical domains at the level of National Statistical Institutes and Eurostat. Horizontal integration means that European statistics are no longer produced domain by domain and source by source but in an integrated fashion, combining the individual characteristics of different domains/sources in the process of compiling statistics at an early stage, for example households or business surveys.
b) vertical integration covering both the national and EU levels. Vertical integration should be understood as the smooth and synchronized operation of information flows at national and ESS levels, free of obstacles from the sources (respondents or administration) to the final product (data or metadata). Vertical integration consists of two elements: joint structures, tools and processes and the so-called European approach to statistics (see this entry).”
(Terminology Relating To The Implementation Of The Vision On The Production Method Of Eu Statistics)
5
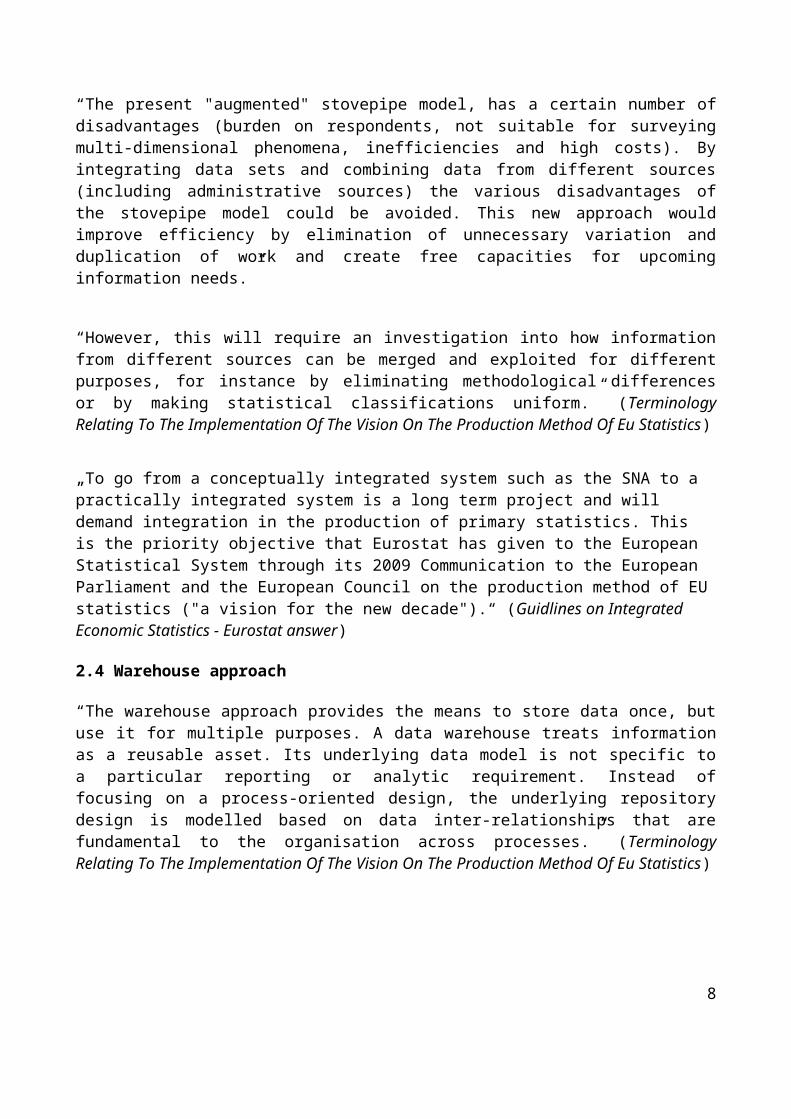
“The present "augmented" stovepipe model, has a certain number of disadvantages (burden on respondents, not suitable for surveying multi-dimensional phenomena, inefficiencies and high costs). By integrating data sets and combining data from different sources (including administrative sources) the various disadvantages of the stovepipe model could be avoided. This new approach would improve efficiency by elimination of unnecessary variation and duplication of work and create free capacities for upcoming information needs.”
“However, this will require an investigation into how information from different sources can be merged and exploited for different purposes, for instance by eliminating methodological differences or by making statistical classifications uniform.” (Terminology Relating To The Implementation Of The Vision On The Production Method Of Eu Statistics)
„To go from a conceptually integrated system such as the SNA to a practically integrated system is a long term project and will demand integration in the production of primary statistics. This is the priority objective that Eurostat has given to the European Statistical System through its 2009 Communication to the European Parliament and the European Council on the production method of EU statistics ("a vision for the new decade").“ (Guidlines on Integrated Economic Statistics - Eurostat answer)
2.4 Warehouse approach
“The warehouse approach provides the means to store data once, but use it for multiple purposes. A data warehouse treats information as a reusable asset. Its underlying data model is not specific to a particular reporting or analytic requirement. Instead of focusing on a process-oriented design, the underlying repository design is modelled based on data inter-relationships that are fundamental to the organisation across processes.” (Terminology Relating To The Implementation Of The Vision On The Production Method Of Eu Statistics)
6

Conceptual model of data warehousing in the ESS (European Statistical System)
“Based on this approach statistics for specific domains should not be produced independently from each other, but as integrated parts of comprehensive production systems, called data warehouses. A data warehouse can be defined as a central repository (or "storehouse") for data collected via various channels.” (Terminology Relating To The Implementation Of The Vision On The Production Method Of Eu Statistics)
“Data validation, integration, and provisioning into an dissemination database typically accounts for a large part of the statistical production costs, especially in the statistical fields where a lot of metadata would need to be harmonised or fine-tuned (for instance, statistical units, concepts and classifications). But by sourcing data into a reusable information asset in the form of a well-designed warehouse, these costs are incurred just once for the organisation, rather than multiple times in the case of multi-stovepipe deployments.” (Terminology Relating To The Implementation Of The Vision On The Production Method Of Eu Statistics)
3 Integrated Warehouse model
Integrated Warehouse model combines the integrated model and the warehouse approach into one model. To have integrated warehouse centric statistical production system, different statistical domains should have more consistency on methodology and share common tools and distributed architecture. First we look at integration followed by warehouse and then combine both into one model.
7
3.1 Technical platform integration
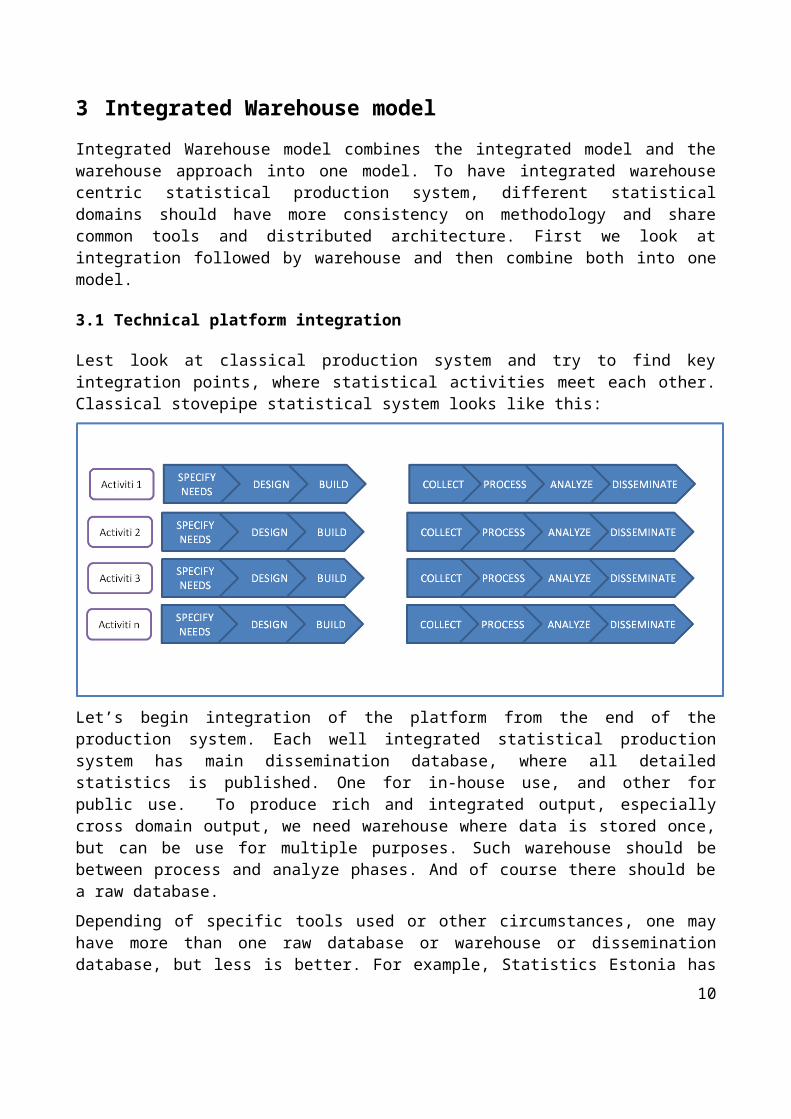
Lest look at classical production system and try to find key integration points, where statistical activities meet each other. Classical stovepipe statistical system looks like this:
Let’s begin integration of the platform from the end of the production system. Each well integrated statistical production system has main dissemination database, where all detailed statistics is published. One for in-house use, and other for public use. To produce rich and integrated output, especially cross domain output, we need warehouse where data is stored once, but can be use for multiple purposes. Such warehouse should be between process and analyze phases. And of course there should be a raw database.
Depending of specific tools used or other circumstances, one may have more than one raw database or warehouse or dissemination database, but less is better. For example, Statistics Estonia has three integrated raw databases. First came with web based tool for collecting data from enterprises. Second came with data collection system for social surveys. And third one is for administrative and other data sources.
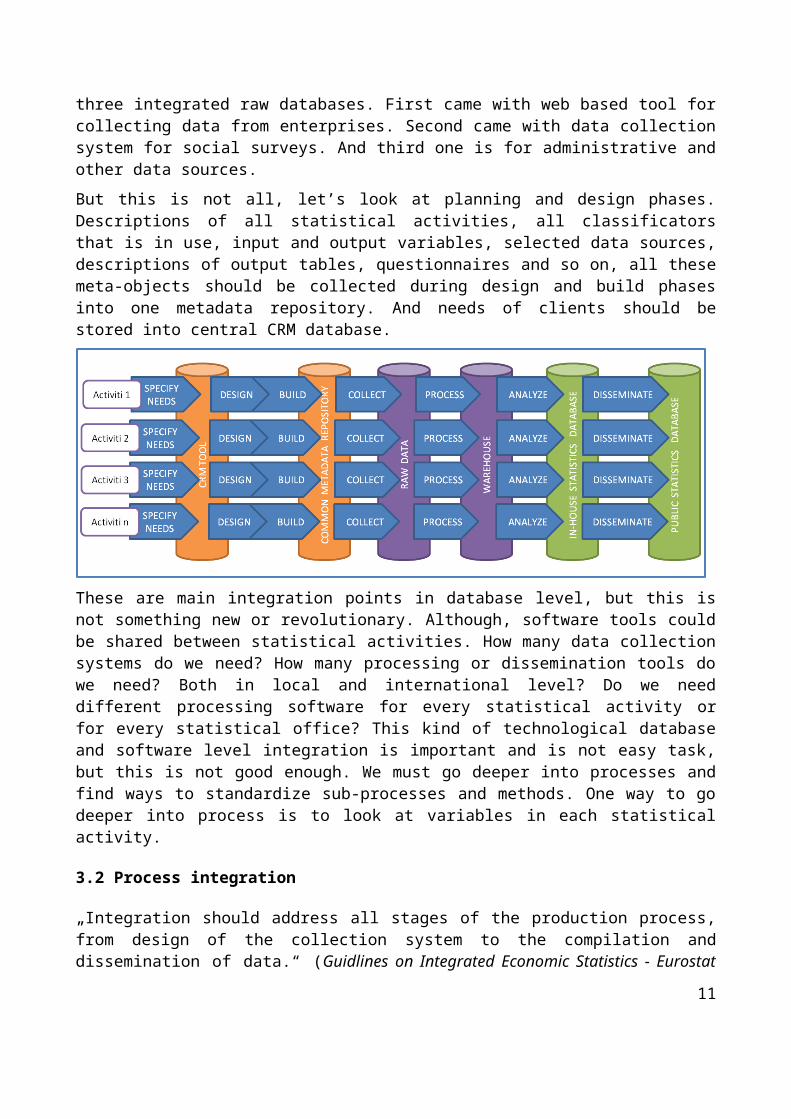
But this is not all, let’s look at planning and design phases. Descriptions of all statistical activities, all classificators that is in use, input and output variables, selected data sources, descriptions of output tables, questionnaires and so on, all these meta-objects should be collected during design and build phases into one metadata repository. And needs of clients should be stored into central CRM database.
8

These are main integration points in database level, but this is not something new or revolutionary. Although, software tools could be shared between statistical activities. How many data collection systems do we need? How many processing or dissemination tools do we need? Both in local and international level? Do we need different processing software for every statistical activity or for every statistical office? This kind of technological database and software level integration is important and is not easy task, but this is not good enough. We must go deeper into processes and find ways to standardize sub-processes and methods. One way to go deeper into process is to look at variables in each statistical activity.
3.2 Process integration
„Integration should address all stages of the production process, from design of the collection system to the compilation and dissemination of data.“ (Guidlines on Integrated Economic Statistics - Eurostat answer) Each statistical activity designs sample and questionnaires according to own needs and uses variations of classificators as needed, selection of data sources is done according the needs of activity and so on.
In statistical system there are number of statistical activities and each activity collects some input variables and produces some output variables. One way to find some common ground between different statistical activities and sources is to focus on variables. Especially input variables because data collection and processing are most costly phases of statistical production. Standardizing on these phases gives us fastest and biggest saving. Output variables will be standardized in SDMX initiative.
Statistical activities should collect unique input variables not just rows and columns of tables in questionnaire. Each input variable should be collected and processed once in each period of time. This should be done so that outcome, input variable in warehouse, could be used for producing various different outputs. This variable centric focus triggers changes in almost all phases of statistical production process. Samples, questionnaires, processing rules, imputation methods, data sources and so on, must be designed and built in compliance with standardized input variables, not according to the needs of one specific statistical activity.
9
Variable based statistical production system lessens the administrative burden, lovers the cost of data collection and processing and enables to produce richer statistical output faster. Of course, this is true in boundaries of standardized design. If there is need for special survey, one can design own sample, questionnaire and so on, but then this is separate project with its own price tag. But to produce regular statistics in this way is not reasonable.
3.3 Warehouse – reuse of data
To organize reuse of allready collected and processed data in statistical production system, the boundaries of statistical activities must be removed. What will remain if statistical activitis are removed? Statistical activities are collection of input and output variables, processig methods and so on. When we talk about data and reuse then we are intrested in variables.
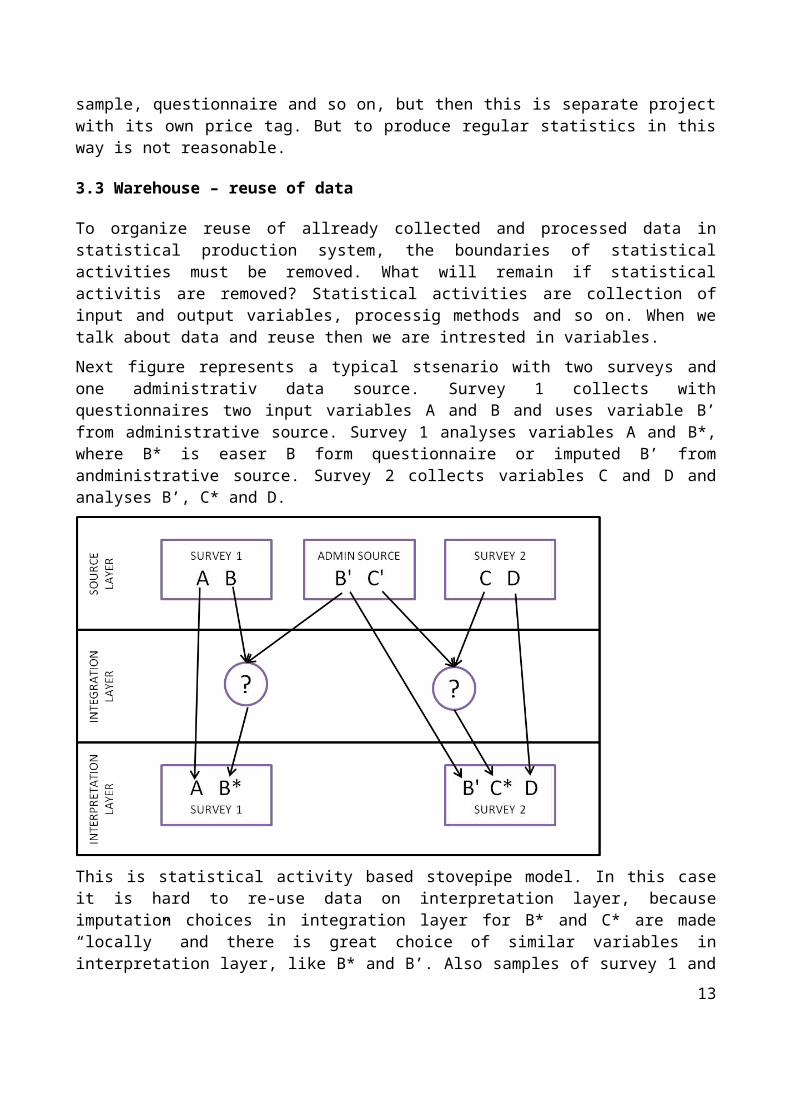
Next figure represents a typical stsenario with two surveys and one administrativ data source. Survey 1 collects with questionnaires two input variables A and B and uses variable B’ from administrative source. Survey 1 analyses variables A and B*, where B* is easer B form questionnaire or imputed B’ from andministrative source. Survey 2 collects variables C and D and analyses B’, C* and D.
10
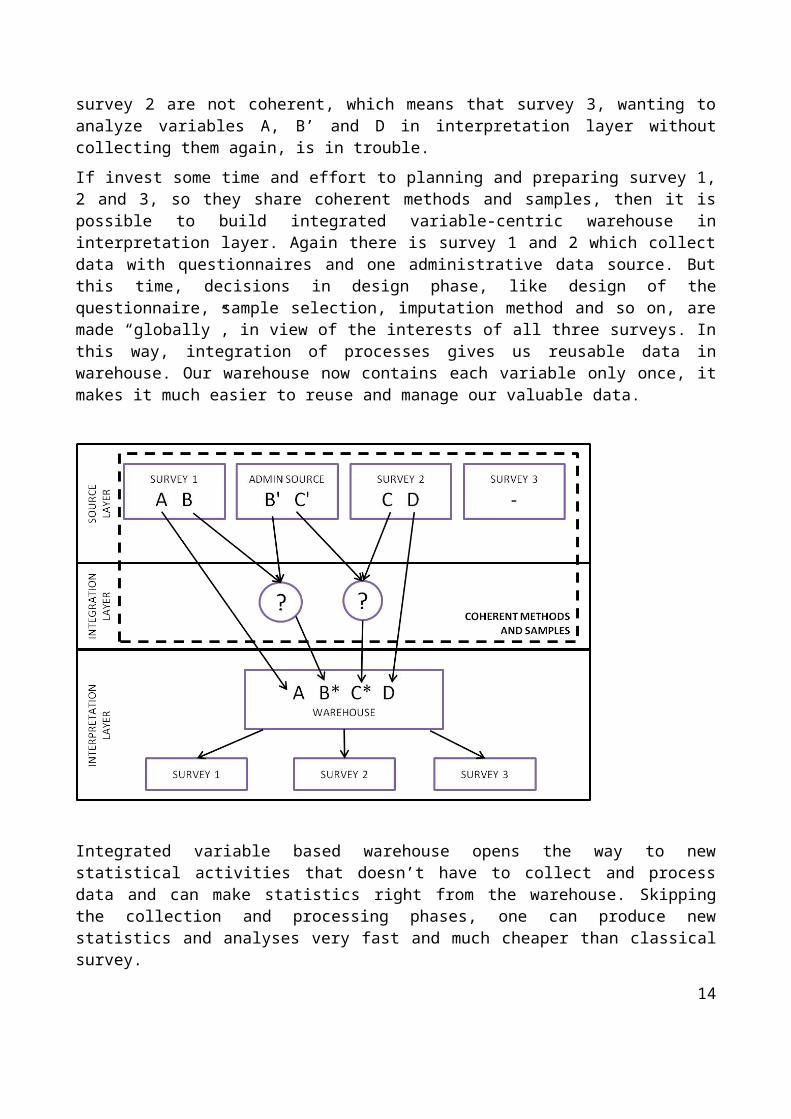
This is statistical activity based stovepipe model. In this case it is hard to re-use data on interpretation layer, because imputation choices in integration layer for B* and C* are made “locally” and there is great choice of similar variables in interpretation layer, like B* and B’. Also samples of survey 1 and survey 2 are not coherent, which means that survey 3, wanting to analyze variables A, B’ and D in interpretation layer without collecting them again, is in trouble.
If invest some time and effort to planning and preparing survey 1, 2 and 3, so they share coherent methods and samples, then it is possible to build integrated variable-centric warehouse in interpretation layer. Again there is survey 1 and 2 which collect data with questionnaires and one administrative data source. But this time, decisions in design phase, like design of the questionnaire, sample selection, imputation method and so on, are made “globally”, in view of the interests of all three surveys. In this way, integration of processes gives us reusable data in warehouse. Our warehouse now contains each variable only once, it makes it much easier to reuse and manage our valuable data.
11

Integrated variable based warehouse opens the way to new statistical activities that doesn’t have to collect and process data and can make statistics right from the warehouse. Skipping the collection and processing phases, one can produce new statistics and analyses very fast and much cheaper than classical survey.
To design and build a statistical production system according to the integrated warehouse model takes initially more time and effort than building stovepipe model. But maintenance cost of integrated warehouse system should be lover and new products that can be made faster and cheaper, to meet the changing needs, should make up the initial investment soon.
4 S-DWH as layered modular system
4.1 Layered architecture
In a generic S-DWH system we identified four functional layers in which we group functionalities. The ground level corresponds to the area where the external sources are incoming and interfaced, while the top of the pile is where produced data published to external user or system. In the intermediate layers we manage the ETL functions for the DWH in which are carried out coherence analysis, data mining, design for possible new strategies or data re-use.
Specifically, from the top to the bottom of the architectural pile, we define:
IV° - access layer, for the final presentation, dissemination and delivery of the information sought;
III° - interpretation and data analysis layer, is specifically for statisticians and enables any data analysis, data mining and support to design production processes or data re-use;
II° - integration layer, is where all operational activities needed for any statistical production process are carried out;
12
I° - source layer, is the level in which we locate all the activities related to storing and managing internal or external data sources.
S-DWH layers are in specific order and data goes through layers without skipping any layers. It is impossible to use data directly from the other layer. If data is needed, it must be moved to that layer where it is needed. And it cannot be moved so that some layers are skipped. Data can be moved between neighboring layers.
For example, to publish data in access layer, raw data needs to be collected into raw database in source layer, then extracted into integration layer for processing, then loaded into warehouse in interpretation layer and after that someone can calculate statistics or make an analyze and publish it in access layer.
Another example: sometime is needed to monitor collection process and analyze raw data during the collection. Then raw data is extracted from collection raw database, processed in integration layer so that data can be easily analyzed with specific tools in use, and loaded to interpretation layer, where it can be analyzed. This process is repeated as often as needed. For example once a day or once a week or hourly.
4.2 CORE services and reuse of components
There is three main groups of workflows in S-DWH. One workflow updates data in warehouse, second one updates in-house dissemination database and third one updates public dissemination database.
13
These three automated data flows are quite independent from each other. Flow 1 is the biggest and most complex. It extracts raw data from source layer, processes it in integration layer and loads to interpretation layer. And from the other hand, it brings cleansed data to source layer for pre-filling questionnaires, prepares sample data for collection systems and so on. Let’s name this flow processing flow.
Flow 2 and Flow 3 is very similar, both generate standard output to dissemination database. One updates data in in-house dissemination database and second one in public database. Both are unidirectional flows. Let’s call Flow 2 as generate cube and Flow 3 as publish cube. In this context cube is multidimensional table, for example .Stat or PC-Axise table.
Processing flows should be built up around input variables or groups of input variables to feed variable based warehouse. Generate and publish cube flows are built around cubes, i.e. each flow generates or publishes a cube.
There are many software tools available to build these modular flows. S-DWH’s layered architecture itself provides possibility use different platforms and software in separate layers, i.e. to re-use components already available in-house or internationally. In addition, different software can be used inside the same layer to build up one particular flow. When CORE services are used to move data between S-DWH layers and also inside the layers between different sub-tasks (e.g. edit, impute, etc), then it is easier to use software provided by statistical community or re-use self developed components to build flows for different purposes.
From the architectural point of view and to add more modularity, it is reasonable to separate integration tools used to move data between the layers from those that are used inside the layer. In small systems it is very likely that the same tool is used for both purposes but in large systems there may be different software to build flows inside the layer and between the layers.
14

5 Conclusion
Today, prevalent model for producing statistics is the stovepipe model. But there is also integrated model and warehouse approach. In this paper integration model and warehouse approach was put together. Integration can be looked at form three main viewpoints:
1. Technical integration – integrating IT platforms and software tools.
2. Process integration – integrating statistical processes like survey design, sample selection, data processing and so on.
3. Data integration – data is stored once, but used for multiple purposes.
When we put all these three integration aspects together, we get S-DWH, which is built on integrated technology, uses integrated processes to produce statistics and reuses data efficiently.
6 References
B. Sundgren (2010a) “The Systems Approach to Official Statistics”, Official Statistics in Honour of Daniel Thorburn, pp. 225–260. Available at: https://sites.google.com/site/bosundgren/my-life/Thorburnbokkap18Sundgren.pdf?attredirects=0
W. Radermacher (2011) “Global consultation on the draft Guidelines on Integrated Economic Statistics”.
UNSC (2012) “Guidlines on Integrated Economic Statistics”. Available at: http://unstats.un.org/unsd/statcom/doc12/RD-IntegratedEcoStats.pdf
W. Radermacher, A. Baigorri, D. Delcambre, W. Kloek, H. Linden (2009) “Terminology Relating To The Implementation Of The Vision On The Production Method Of EU Statistics”. Available at: http://ec.europa.eu/eurostat/ramon/coded_files/TERMS-IN-STATISTICS_version_4-0.pdf
European Union, Communication from the Commission to the European Parliament and the Council on the production method of EU statistics: a vision for the next decade, COM(2009) 404 final. Available at: http://eur-lex.europa.eu/LexUriServ/LexUriServ.do?uri=COM:2009:0404:FIN:EN:PDF
15