Embed Size (px)
Citation preview

STATE CONSUMER PROTECTION ACTS AND COSTS TO CONSUMERS The Impact of State Consumer Acts
on Automobile Insurance premiums
Preliminary Policy Report
INTRODUCTION
Over the last few decades, state consumer protection legislation has increased dramatically.1 In addition to federal regulation, every state now has its own Consumer Protection Act (CPA), each of which provides for a private cause of action.2 The impetus for these statutes derived from three forces emerging in the 1960s: dissatisfaction with Federal Trade Commission (FTC) consumer protection enforcement efforts, an apparent increase in popular demand for consumer protection, and the perception that common law causes of action were inadequate.
While subsequent amendments to CPAs have resulted in much variation among states, the direction of these changes suggests that state consumer protection law has expanded access to the courthouse. Generally, such changes have increased the class of eligible potential plaintiffs, reduced the burden facing plaintiffs alleging a CPA violation, and increased the scope and magnitude of available remedies.
Legislative and judicial trends towards expanded access for plaintiffs under the CPAs have contributed to a significant increase in litigation.3 Expanded access has also contributed to meaningful differences in the types of consumer protection claims pursued at the federal and state levels.4 Whether these changes have led to additional costs for consumers as a group is unclear.
As a matter of economics theory, CPA liability could force sellers to internalize social costs associated with deceptive selling or marketing practices and thereby enhance efficiency. For example, CPA liability could increase economic efficiency and consumer welfare by granting recourse to consumers who would otherwise bear the cost of a
1 See SEARLE CIVIL JUSTICE INSTITUTE, STATE CONSUMER PROTECTION ACTS, AN EMPIRICAL INVESTIGATION OF PRIVATE
LITIGATION (2009), available at http://papers.ssrn.com/sol3/papers.cfm?abstract_id=1708175 [hereinafter SEARLE STUDY]. 2 Iowa, the last state to adopt a private cause of action, added the provision to its CPA in July 2009. See Press Release, Iowa Attorney General, Consumer ‘Private Right of Action’: What Consumers Need to Know, (July 1, 2009) available at http://www.iowa.gov/government/ag/consumer_advisories/general_advice/private_right_of_action.html. 3 SEARLE STUDY, supra note 1. The Searle Study generated an index (the “Expected Value Index” or EVI) to capture the overall “plaintiff friendliness” of the state CPA. For each 2008 statute, 27 CPA provisions were coded as either “benefits” or “restrictions.” Id. The Study demonstrated that an increase in the EVI is associated with an increase in the number of reported decisions involving a CPA claim. Id. 4 Id.

Consumer Protection Acts and Costs to Consumers 2
producer’s deceptive statements. Consistent with this argument, proponents of more expansive consumer protection legislation contend that “gaps” in FTCenforcement, irrational consumer behavior, and insufficient incentive for plaintiffs to bring small, but meritorious claims justify expanded CPA liability. Proponents also claim that CPAs can correct problems that arise in markets in which sellers uniquely possess information on the quality of the products sold to consumers.5
However, economic theory identifies potential social harms associated with expansion of consumer protection liability. Specifically, if CPAs sufficiently increase expected liability for business activities associated with the production, marketing, and sale of consumer goods and services, consumers can be harmed in the form of higher prices. CPA liability can operate as a tax on goods and services sold to consumers.6 CPA liability, like excise taxes, can raise the marginal costs of production for the firm and result in reduced competition and output as well as higher product prices. Further, because marketing communications can provide valuable information to consumers, CPA liability that deters informative advertising, such as partial disclosures of valuable information,7 can reduce consumer welfare.8 Broad interpretations of vague CPA statutes can also result in further welfare losses by introducing additional uncertainty into the business decisions of firms. 9
Potential social benefits of expanded CPA liability must be balanced against potential costs when designing policy. Problematically, neither economic theory nor empirical evidence identifies a uniquely optimal amount of state CPA liability. However, the potentially negative effects on consumers of continually expanding liability suggest that
5 For example, one common type of CPA litigation involves so-called “vanishing premiums.” In these cases, life insurance sales agents promise the customer that after a few years of payments the premiums will vanish altogether because the policy will pay for itself out of dividend or investment income. The assumptions about investment performance, however, are often quite unrealistic and under more plausible assumptions the premiums would never vanish. The consumer is unlikely to detect the misleading nature of the claims at issue. Theoretically, a CPA could improve the life insurance market in this case because consumers would have a cause of action that would, in turn, deter future misleading claims. See Broberg v. Guardian Life Ins. Co., 90 Cal. Rptr. 3d 225 (Ct. App. 2009). 6 See Henry N. Butler & Jason S. Johnston, Reforming State Consumer Protection Liability: An Economic Approach, 2010 COLUM. BUS. L. REV. 1, 44 (2010) (arguing that CPA liability amounts to “what is effectively a tax on every good or service sold to consumers.”). 7 Id. notes 130-31. 8 Id. at 47-48. On the economic value of information, and advertising in particular, see Kyle Bagwell, The Economic Analysis of Advertising (Columbia Univ. Dep’t of Econ. Discussion Paper Series, Paper No. 0506-01, 2005), available at http://oz.stern.nyu.edu/cite05/readings/cabral2.pdf; Avinash Dixit & Victor D. Norman, Advertising and Welfare, 9 BELL. J. ECON. 1 (1978); Philip Nelson, Advertising as Information, 82 J. POL. ECON. 729 (1974); Benjamin Klein & Keith B. Leffler, The Role of Market Forces in Assuring Contractual Performance, 89 J. POL. ECON. 615 (1981). 9 In fact, the SEARLE STUDY suggests that CPA statutory language strongly affects overall CPA litigation within a state. SEARLE STUDY at 26. Business must expend resources attempting to predict how vague CPA standards will be enforced; judges must expend further resources defining illegal conduct and sorting between meritorious and frivolous claims. These added costs may be passed on to consumers in the form of higher prices or reduced innovation.

Introduction 3
this expansion may have diminishing marginal returns.10 In the context of consumer protection liability, expanding liability may generate positive consumer welfare effects up to some threshold level, but expansion beyond that critical level raises the possibility of over deterrence of business activity that benefits consumers.
Although these basic tradeoffs are well-known and recognized even by proponents of stronger consumer protection regulation,11 no data currently exists that would allow for an analysis of potentially relevant effects of expanded liability on consumers. In order to provide some insight into the effects of changes to CPAs on consumers, the Searle Civil Justice Institute (SCJI) at the George Mason University Law & Economics Center commissioned the Task Force on State Consumer Protection Acts and Costs to Consumers (the Task Force). The Task Force analyzed the effects of CPAs on premiums in the automobile insurance market.
The automobile insurance market has several unique features that render it useful for addressing some of these important policy concerns. First, insurance prices are established on a state-by-state basis. This feature enables isolation of the impact of state CPA law changes on prices. Second, automobile insurance is the largest of the property casualty lines of insurance, and, unlike health insurance, which is the largest insurance market overall, individuals purchase it with a minimum of government subsidy. Accordingly, laws that alter automobile insurance premiums have a substantial impact on consumers. Third, because automobile insurance product lines are frequently the focus of CPA litigation, sufficient data are available to construct a test of the impact of CPAs on the insurance prices ultimately paid by consumers.12 Fourth, automobile insurance prices are not as highly regulated as prices for many other lines of insurance.13 As such, automobile 10 For an example of diminishing marginal returns, consider the following: the value a hungry consumer derives from consuming a candy bar may be high. However, consuming a second candy bar is likely to result in less satisfaction for the consumer, and even less for the third. The consumption value decreases with each additional candy bar. At some point (beyond the threshold of diminishing marginal returns), eating candy bars would yield negative marginal returns. 11 See, e.g., Jeff Sovern, Toward a New Model of Consumer Protection Statutes: The Problem of Increased Transaction Costs, 47 WM. & MARY L. REV. 1635, 1705-09 (2006) (recognizing that state CPAs can increase transaction costs and arguing for regulation that would prevent firms from passing these costs on to consumers). 12 Insurance companies are parties in at least 1,500 decisions in a database including over 17,000 decisions involving CPA claims from 2000-2007 in state appellate and federal district courts. SEARLE STUDY, supra note 1. This same database reinforces the idea that automobile insurance companies are not immune from CPA claims. In one of the largest cases, Avery v. State Farm Mutual Automobile Insurance Company, a nationwide class of consumers was certified and ultimately awarded $1.2 billion at trial, $730 million attributable to the CPA claim. Avery v. State Farm Mut. Auto. Ins. Co., 216 Ill.2d 100 (Ill. 2005) (involving a nationwide class of consumers alleging that State Farm’s practice of using non-Original Equipment Manufacturer parts to repair vehicles damaged in crashes was a breach of the standard contract and violated the Illinois Consumer Fraud and Deceptive Business Practices Act). The Illinois Supreme Court eventually reversed the entire award, but not until the dispute had gone on for 8 years. 13 Twenty-eight states either have no filing laws or have file and use laws, both of which allow considerable discretion in price setting. According to the NAIC, file and use (or use and file) laws require the rates to be submitted to the state insurance department but specific approval is not required. See Auto Insurance Database Report, NAT’L ASS’N OF INS. COMM’R 227 (2006/2007), available at http://www.naic.org/documents/newsroom_2007_auto_report_summary.pdf [hereinafter NAIC Automobile
Consumer Protection Acts and Costs to Consumers 4
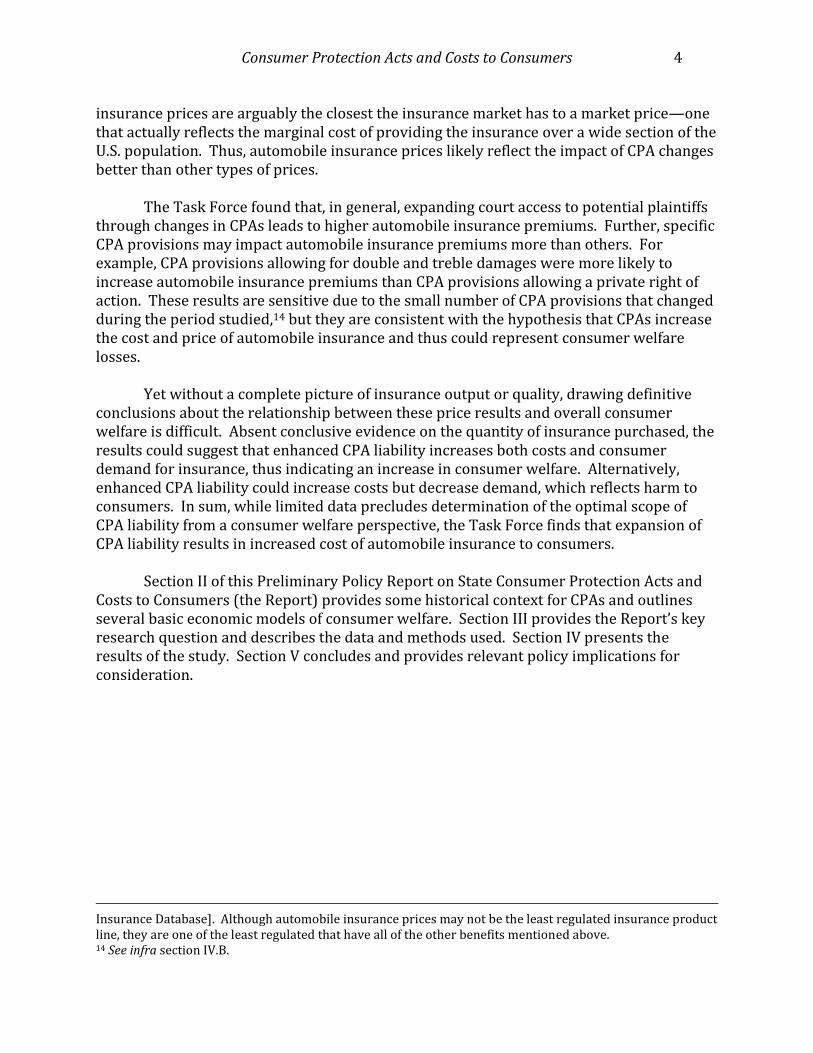
insurance prices are arguably the closest the insurance market has to a market price—one that actually reflects the marginal cost of providing the insurance over a wide section of the U.S. population. Thus, automobile insurance prices likely reflect the impact of CPA changes better than other types of prices.
The Task Force found that, in general, expanding court access to potential plaintiffs through changes in CPAs leads to higher automobile insurance premiums. Further, specific CPA provisions may impact automobile insurance premiums more than others. For example, CPA provisions allowing for double and treble damages were more likely to increase automobile insurance premiums than CPA provisions allowing a private right of action. These results are sensitive due to the small number of CPA provisions that changed during the period studied,14 but they are consistent with the hypothesis that CPAs increase the cost and price of automobile insurance and thus could represent consumer welfare losses.
Yet without a complete picture of insurance output or quality, drawing definitive conclusions about the relationship between these price results and overall consumer welfare is difficult. Absent conclusive evidence on the quantity of insurance purchased, the results could suggest that enhanced CPA liability increases both costs and consumer demand for insurance, thus indicating an increase in consumer welfare. Alternatively, enhanced CPA liability could increase costs but decrease demand, which reflects harm to consumers. In sum, while limited data precludes determination of the optimal scope of CPA liability from a consumer welfare perspective, the Task Force finds that expansion of CPA liability results in increased cost of automobile insurance to consumers.
Section II of this Preliminary Policy Report on State Consumer Protection Acts and
Costs to Consumers (the Report) provides some historical context for CPAs and outlines several basic economic models of consumer welfare. Section III provides the Report’s key research question and describes the data and methods used. Section IV presents the results of the study. Section V concludes and provides relevant policy implications for consideration.
Insurance Database]. Although automobile insurance prices may not be the least regulated insurance product line, they are one of the least regulated that have all of the other benefits mentioned above. 14 See infra section IV.B.

Background 5
I. BACKGROUND
This section explains how legislatures and courts have expanded consumers’ rights under CPAs by increasing consumer access to the courts. In addition to providing historical context of CPA expansion, this section illustrates various economic models of consumer welfare. These models illustrate the tradeoffs associated with expanded consumer protection liability and the key variables necessary to analyze and determine consumer welfare effects.
A. PRIOR LITERATURE
In the 1960s, the FTC faced serious criticism of its consumer protection efforts, including that it misallocated its already insufficient resources,15 suffered from political favoritism and regulatory capture,16 and protected producers in the name of consumer protection.17 Proponents of stronger regulation argued that market forces could no longer offer consumers adequate protection, as the marketplace had become too impersonal and too favorable to producers. 18 Similarly, these proponents claimed that common law causes of action were impractical as consumer protection devices because they required high burdens of proof.19
State legislatures responded to these widespread criticisms by enacting a diverse collection of CPAs, each designed to supplement public enforcement and to improve consumer outcomes. Most early CPAs authorized state Attorneys General to seek injunctions against specific business practices. Some allowed the Attorney General to seek restitution for injured consumers.20
More expansive modern CPA characteristics can be traced back to uniform and model statutes that appeared in the late 1960s.21 The Uniform Deceptive Trade Practices Act (UDTPA), for example, granted consumers a private right of action and allowed 15 AM. BAR ASS’N COMM’N TO STUDY THE FED. TRADE COMM’N, REPORT OF THE COMMISSION TO STUDY THE FEDERAL TRADE
COMMISSION (1969) at 26-28. 16 EDWARD R. COX , ROBERT C. FELLMETH & JOHN E. SCHULTZ, “THE NADER REPORT” ON THE FEDERAL TRADE COMMISSION (1969) at 130-40. 17 Richard A. Posner, The Federal Trade Commission, 37 U. CHI. L. REV. 47, 71 (1969) (“A perusal of FTC rules and decisions reveals hundreds of cases in which prohibitory orders have been entered against practices, not involving serious deception, by which sellers have attempted to market a new, often cheaper, substitute for an existing product.”) 18 William A. Lovett, Louisiana Civil Code of 1808: State Deceptive Trade Practice Legislation, 46 TUL. L. REV. 724, 725 (1972); James R. Withrow, Jr., The Inadequacies of Consumer Protection by Administrative Action, 1967 N.Y. STATE BAR ASS’N ANTITRUST LAW SYMPOSIUMS 58, 64 (“The difficulties being faced by the consumer today are best understood in terms of the new ‘impersonality’ of the market place.”); see also NAT’L ASS’N OF
ATTORNEYS GEN. COMM. ON THE OFFICE OF ATTORNEY GEN., REPORT ON THE OFFICE OF ATTORNEY GENERAL 395 (1971). 19 Robert Quinn, Consumer Protection Comes of Age in Massachusetts, 4 NEW ENG. L. REV. 72 (1969)(“It was, after all, primarily the failure of the legal system to provide adequate remedies which led to the great consumer movement of the past decade with the resultant deluge of new laws.”). 20 N.J. STAT. ANN. § 56:8-3.1 (West 2011) 21 See NAT’L ASS’N OF ATTORNEYS GEN. COMM. ON THE OFFICE OF ATT’Y GEN., REPORT ON THE OFFICE OF ATTORNEY
GENERAL 395, 400 (1971).

Consumer Protection Acts and Costs to Consumers 6
injunctive relief absent proof of actual damages and demonstrated intent to deceive.22 Another important model statute that appeared at this time was the Model Unfair Trade Practices and Consumer Protection Law (UTPCPL). The FTC developed the UTPCPL as a comprehensive composite of prior consumer protection legislation. The UTPCPL deliberately attempted to maintain its similarities to the relevant FTC standards, noting that ‘due consideration and great weight’ should be given to the FTC’s own interpretations.23 Currently, twenty-eight states refer to the FTC in their CPAs.24
Legislative amendments and judicial interpretations have broadened consumer rights under most CPAs.25 Legislative amendments have generally increased consumer access to courts by, for example, allowing class actions and private claims. Other amendments repeal the “public interest” requirement to sue under the CPA. Some CPAs have truncated rigorous common-law burdens of proof to make it easier for consumers to bring claims.26 Proponents of these amendments contend that consumers must be willing to file suit for CPAs to have any deterrent effect. However, critics have noted that such permissive causes of action raise the potential for harassment of legitimate business conduct27 and that vague consumer fraud statutes create an environment ripe for abuse.28
The potential benefits of additional consumer protection must be evaluated while accounting for existing and alternative frameworks, as well as any costs in changing the relevant legal regime. One aspect of this inquiry relates to whether consumer protection legislation optimally supplements other enforcement mechanisms (e.g., market forces, federal regulation, and state common law).29 In determining the efficient level of state CPA liability, the risk of overprotection is an important consideration because it has the potential to increase the marginal cost of the firm, which, in turn, leads to higher prices and may also deter pro-competitive business activity.
Several Task Force members conducted a prior empirical study that documented changes in CPA provisions among states and over time, as well as the impact of those changes on CPA litigation activity. The resulting Searle Study found that CPAs became considerably more favorable to potential plaintiffs over time and that those states with more plaintiff-friendly CPAs also tended to have more litigation.30 This dramatic shift in the scope of CPA liability, and the resulting litigation, raised the issue of whether state consumer protection enforcement was qualitatively different than presumably related FTC
22 COMM’RS ON UNIF. STATE LAWS, HANDBOOK OF THE NATIONAL CONFERENCE OF COMMISSIONERS ON UNIFORM STATE
LAWS AND PROCEEDINGS OF THE ANNUAL CONFERENCE MEETING IN ITS SEVENTY-THIRD YEAR 253, 262 (1964). 23 29 COUNCIL OF STATE GOV’TS, 1970 Suggested Legislation 142 (1969). 24 Dee Pridgen & Richard M. Alderman, Consumer Protection and the Law, vol. 1, § 2:10 (2009-2010 ed.). 25 Victor E. Schwartz & Cary Silverman, Common-Sense Construction of Consumer Protection Acts, 54 KAN. L. REV. 1 (2005). 26 David A. Rice, Exemplary Damages in Private Consumer Actions, 55 IOWA L. REV. 307, 307 (1969). 27 William A. Lovett, Louisiana Civil Code of 1808: State Deceptive Trade Practice Legislation, 46 TUL. L. REV. 724, 744 (1972). 28 Rice, supra note 26, at 340. 29 Butler, supra note 6, at 9. 30 SEARLE STUDY, supra note 1.
Background 7
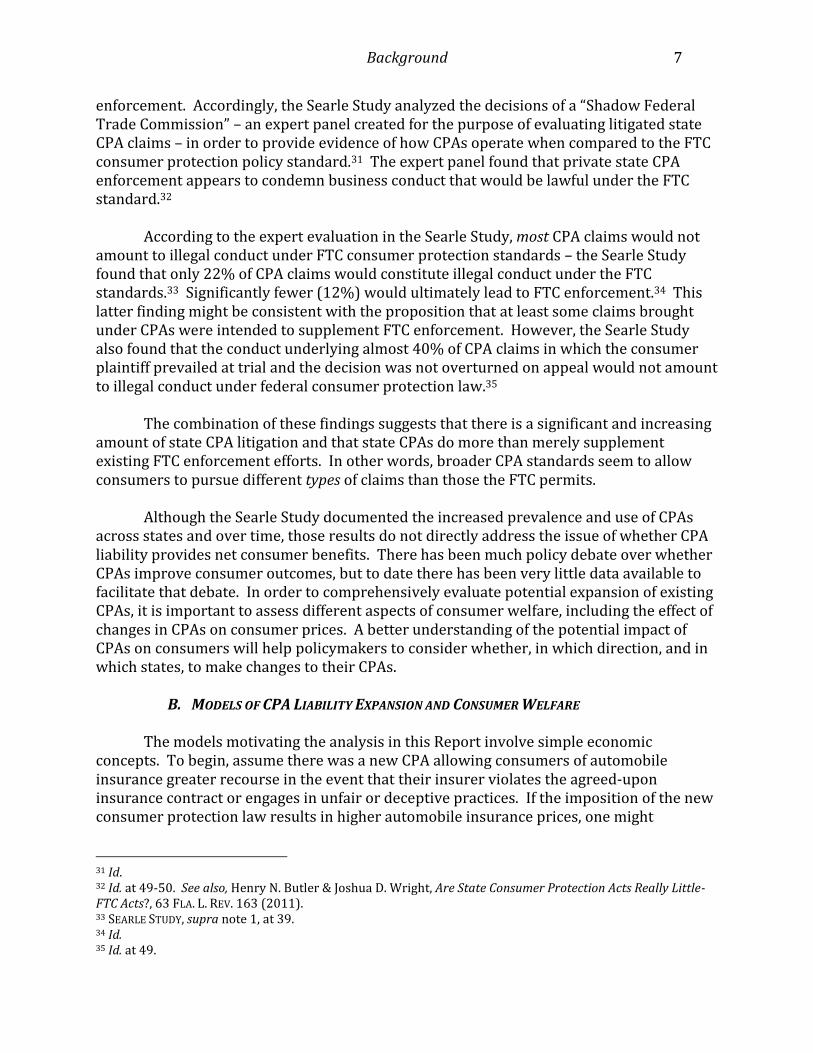
enforcement. Accordingly, the Searle Study analyzed the decisions of a “Shadow Federal Trade Commission” – an expert panel created for the purpose of evaluating litigated state CPA claims – in order to provide evidence of how CPAs operate when compared to the FTC consumer protection policy standard.31 The expert panel found that private state CPA enforcement appears to condemn business conduct that would be lawful under the FTC standard.32
According to the expert evaluation in the Searle Study, most CPA claims would not amount to illegal conduct under FTC consumer protection standards – the Searle Study found that only 22% of CPA claims would constitute illegal conduct under the FTC standards.33 Significantly fewer (12%) would ultimately lead to FTC enforcement.34 This latter finding might be consistent with the proposition that at least some claims brought under CPAs were intended to supplement FTC enforcement. However, the Searle Study also found that the conduct underlying almost 40% of CPA claims in which the consumer plaintiff prevailed at trial and the decision was not overturned on appeal would not amount to illegal conduct under federal consumer protection law.35
The combination of these findings suggests that there is a significant and increasing amount of state CPA litigation and that state CPAs do more than merely supplement existing FTC enforcement efforts. In other words, broader CPA standards seem to allow consumers to pursue different types of claims than those the FTC permits.
Although the Searle Study documented the increased prevalence and use of CPAs across states and over time, those results do not directly address the issue of whether CPA liability provides net consumer benefits. There has been much policy debate over whether CPAs improve consumer outcomes, but to date there has been very little data available to facilitate that debate. In order to comprehensively evaluate potential expansion of existing CPAs, it is important to assess different aspects of consumer welfare, including the effect of changes in CPAs on consumer prices. A better understanding of the potential impact of CPAs on consumers will help policymakers to consider whether, in which direction, and in which states, to make changes to their CPAs.
B. MODELS OF CPA LIABILITY EXPANSION AND CONSUMER WELFARE
The models motivating the analysis in this Report involve simple economic
concepts. To begin, assume there was a new CPA allowing consumers of automobile insurance greater recourse in the event that their insurer violates the agreed-upon insurance contract or engages in unfair or deceptive practices. If the imposition of the new consumer protection law results in higher automobile insurance prices, one might
31 Id. 32 Id. at 49-50. See also, Henry N. Butler & Joshua D. Wright, Are State Consumer Protection Acts Really Little-FTC Acts?, 63 FLA. L. REV. 163 (2011). 33 SEARLE STUDY, supra note 1, at 39. 34 Id. 35 Id. at 49.

Consumer Protection Acts and Costs to Consumers 8
intuitively believe an increase in prices unambiguously reduces consumer welfare. The reality, however, is far more nuanced.
As an illustration, a price increase in coffee might be due to the government placing a per-cup tax on coffee, thereby increasing costs to consumers. Alternatively, the price increase might be attributable to the release of a new FDA study revealing the health benefits of coffee consumption and, in turn, increasing consumer demand. In the second case, the increase in price reflects an increase in consumer welfare because it reflects an increase in demand (i.e., consumers are willing to pay for more coffee) and not an increase in costs resulting from a tax increase.
The same factors could conceivably be at work with a new CPA. However, the
economics of CPAs are more complicated than the economics in this simple coffee example. CPAs are likely to increase the cost of providing insurance. CPA compliance and litigation costs imposed upon insurance providers decrease their willingness to supply the same level of insurance for a given premium. The concept is intuitive, but the economics of how this cost increase is passed through to the observed premium and the impact on consumers is more complex.
The simplest case is one in which consumers do not at all value the new protection
provided by the CPA. Because CPAs are not widely discussed in the popular press, it seems likely that few automobile insurance customers know that a new state law gives them greater recourse to sue their insurance company for contract violations. Also likely is that consumers' willingness to purchase certain levels of insurance is somewhat sensitive to changes in premiums. The logic is that if premiums rise, consumers may prefer to offset that price increase by taking a higher deductible rather than wider coverage.
Figure 1 illustrates the case in which consumers do not at all value the new
protections. The increase in costs causes an increase in price from P0 to P1 and a decrease in quantity from Q0 to Q1. This cost increase has two effects. The first is a wealth transfer from customers and shareholders of insurance companies to CPA plaintiffs and attorneys. This effect is represented by the light grey rectangle in Figure 1. This welfare box (or wealth transfer) reflects the fact that the increase in price at Q1 from the supply curve without a CPA to the supply curve with a CPA is driven by increased cost. This price increase multiplied by the quantity designated by Q1 equals the value at this Price/Quantity combination that goes to plaintiffs and attorneys rather than to customers and shareholders of insurance companies.
By itself the price increase is what economists call welfare neutral. Although
consumers are unhappy with the transfer, there is no economic reason to prefer insurance shareholders and automobile insurance customers to CPA plaintiffs and their attorneys, so the wealth transfer is neutral in effect. In fact, CPA plaintiffs are a subset of insurance consumers, so a price increase acts to transfer wealth from one group of consumers to another, and to no detriment to the whole.

Background 9
The second, problematic, effect is that the CPA statute, which is assumed to provide zero additional value to consumers in this case, actually reduces the level of insurance demanded by consumers. This effect unambiguously decreases consumer welfare because the consumers who no longer purchase insurance cannot receive the benefits from the cheaper plan they had before the price increase. Thus, a price increase in this example concretely predicts consumer harm. That harm is measured by the dark grey triangle in Figure 1 called deadweight loss. This deadweight loss triangle reflects the negative impact to consumers as measured by the decline in quantity purchased from Q0 to Q1. Either consumers whose marginal benefit exceeds the marginal cost of purchasing insurance are refraining from purchasing insurance at the resulting higher price, or consumers whose marginal cost exceeds the marginal benefit are purchasing the insurance at the lower quantity and higher price. Both situations yield a loss to consumer welfare.
Therefore, to establish that a price increase has negatively impacted consumers, some evidence of reduced demand is needed. For auto insurance, this might manifest as an actual reduction in number of policies purchased or a decrease in coverage per policy at a given price (i.e., a higher deductible).
FIGURE 1 Consumer Harm from Expanded CPA Liability
Although Figure 1 suggests that increases in price accompanied by decreases in
quantity demanded result in consumer harm, absent strong evidence on quantity movements, increases in price could represent consumer benefits. In other words, an
Supply of Insurance withCPA
Supply of Insurance
InsuranceDemand
$
Quantity of InsuranceQ0Q1
P1
P0
Price: re turnreceived byinsurancecompanies
Transfer toCPA plaintiffand attorneys
Deadweightloss toinsurancecustomers

Consumer Protection Acts and Costs to Consumers 10
increase in price might reflect the increase in demand due to the perceived benefits from more CPA protection.
In an example of product liability,36 consumers purchase a product, here a toaster, which has some risk of injury. The cost of that injury is paid either by the consumers, through purchasing life and health insurance, or by the toasters’ producers, via the liability system. As a simplification, this example assumes that liability is strict and the tort system is costless (an admittedly strong assumption). In this case, consumers are indifferent between purchasing the toaster with strict liability or no liability because they have the ability to completely replicate the liability system with private insurance.37 Further, there is no welfare difference because the hypothetical consumer is insured against loss through either the tort system or private insurance.38
The costs are the same in both of these cases because we have assumed zero
deterrence value from the imposition of liability upon the producer, and we have further assumed that both individuals and producers can provide insurance at the same price. Thus, the product is equally safe regardless of who pays for the insurance, but the observed price in the product market is higher when the producer provides insurance via the liability system. Based on the observed price in the markets for toasters, one could erroneously conclude that the liability system increases toaster prices and costs when, in reality, two different markets are being compared: the market for toasters alone with the lower price and the market for toasters plus insurance, which commands a higher price.39
Despite the instructive power of this model, it is too simple to describe even the
toaster market. In reality, the tort system carries administrative costs far greater than the health insurance system, meaning that the tort system would require an additional benefit, such as deterrence, to justify using it rather than a private insurance market.40 CPAs’ effects are further complicated by the fact that CPAs could conceivably increase the demand for insurance by increasing the likelihood that consumers receive an insurance payment when they experience a loss.
36 A. Mitchell Polinsky & Steven Shavell, The Uneasy Case for Product Liability, 123 HARV. L. REV. 1437 (2010). 37 CPAs are not the only way to solve information problems associated with contracting. Because insurance customers have repeat dealings with their insurance companies, consumers are more likely in this context to learn firsthand about the effectiveness of their insurance contracts. Moreover, insurance companies spend a great deal to maintain their reputation both through advertising and via follow up surveys on claims experiences. All of these factors are in some ways duplicating the efforts of CPAs, in that they are designed to assure consumers that the company will pay off a claim. See Benjamin Klein & Keith B. Leffler, The Role of Market Forces in Assuring Contractual Performance, 89 J. POL. ECON. 615 (1981). 38
There is, however, an important observational difference between private insurance and the tort system. When
consumers pay for their own insurance, their demand for toasters falls by the price of the insurance, causing the
producer to sell fewer toasters. By contrast, when producers pay for the insurance through the tort system, they are
unwilling to supply the product at the lower price. Rather than supply the product with the liability system,
producers now supply the product plus insurance against injury and simply build the insurance cost into the final
product. Again, consumer demand for toasters falls due to the higher observed price for toasters. 39 William Landes & Richard Posner, A Positive Economic Theory of Products Liability, 14 J. LEGAL STUD. 535 (1985). 40 George L. Priest, The Modern Expansion of Tort Liability: Its Sources, Its Effects, and Its Reform, 5 J. ECON. PERSPECT. 31 (1991).
Background 11
Regardless of these various complications, the basic economic forces at work in the
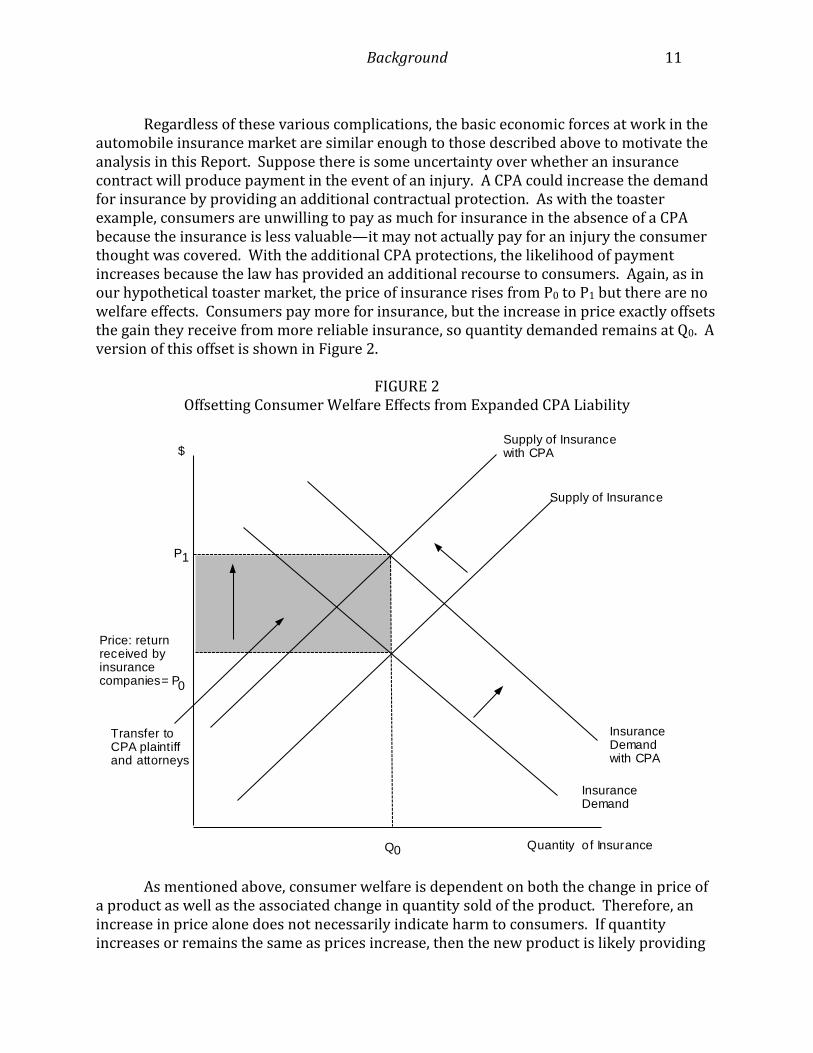
automobile insurance market are similar enough to those described above to motivate the analysis in this Report. Suppose there is some uncertainty over whether an insurance contract will produce payment in the event of an injury. A CPA could increase the demand for insurance by providing an additional contractual protection. As with the toaster example, consumers are unwilling to pay as much for insurance in the absence of a CPA because the insurance is less valuable—it may not actually pay for an injury the consumer thought was covered. With the additional CPA protections, the likelihood of payment increases because the law has provided an additional recourse to consumers. Again, as in our hypothetical toaster market, the price of insurance rises from P0 to P1 but there are no welfare effects. Consumers pay more for insurance, but the increase in price exactly offsets the gain they receive from more reliable insurance, so quantity demanded remains at Q0. A version of this offset is shown in Figure 2.
FIGURE 2
Offsetting Consumer Welfare Effects from Expanded CPA Liability
As mentioned above, consumer welfare is dependent on both the change in price of
a product as well as the associated change in quantity sold of the product. Therefore, an increase in price alone does not necessarily indicate harm to consumers. If quantity increases or remains the same as prices increase, then the new product is likely providing
Supply of Insurancewith CPA
Supply of Insurance
InsuranceDemand
$
Quantity o f InsuranceQ0
P1
Price: returnreceived byinsurancecompanies= P0
InsuranceDemandwith CPA
Transfer toCPA plaintiffand attorneys

Consumer Protection Acts and Costs to Consumers 12
additional benefits to consumers that are worth the cost of a price increase. On the other hand, if quantity decreases as prices increase, consumers are likely being harmed since they are not getting benefits from the new product commensurate to the price increase.
One way to measure the quantity of automobile insurance is to determine the proportion of people in the state that do not carry automobile insurance. In accordance with the models explained above, if increasing prices of automobile insurance due to CPAs were associated with a decrease in the number of insured motorists, CPAs could be associated with consumer harm. However, almost all states have requirements to purchase minimum levels of insurance. These requirements make it very difficult to observe changes in how many people would buy automobile insurance if given the option of not buying it.
An alternative, and possibly more appropriate, way to measure the quantity of
automobile insurance purchased is to look at changes in the type of insurance purchased as prices increase. Although states have minimum requirements for the level of insurance that must be purchased, customers do have the option to purchase better quality insurance packages from the same provider. If higher prices cause consumers to shift toward the minimum required level, then those consumers may still be harmed by the price increases. Alternatively, if consumers keep their insurance plans or shift to higher levels of insurance, then CPAs could be providing benefits to consumers.
Insurance types are also difficult to measure, but one possible measurement is to
observe changes in deductibles. The higher the deductible, the higher the risk the consumer personally takes on and the lower the level of insurance the company provides. Deductibles by state are not available consistently and so could not be used for this study.
The focus of this Report, then, is to provide some information to policymakers on at
least one aspect of consumer welfare – the relationship of increased CPA liability to the consumer prices as measured by auto insurance premiums. The Task Force was not able to develop a reliable measurement of quantity in this context. Thus, the Report can only measure the costs borne by consumers due to CPAs. Any benefits, to the extent they exist, have not been captured in this analysis.

Methodology and Data 13
II. METHODOLOGY AND DATA
The Task Force used automobile insurance premiums to address the following research question:
What is the impact of different CPA provisions
on automobile insurance premiums by state and over time? The Task Force addressed the above research question by estimating a set of
econometric models41 to evaluate the effects of changes in CPAs on automobile insurance premiums. The models generally tested whether and to what extent changes in each state’s automobile insurance premiums over time can be explained by the state’s CPA provisions, the state’s automobile insurance regulatory environment, the rates at which individuals in the state used automobile insurance, and other state-level demographics such as the state unemployment rate and median age. The models also accounted for any other effects on automobile insurance premiums due to the particular year in which a premium occurs (known as “year fixed effects”). Finally, the models considered the fact that certain states exempt unfair and deceptive acts pertaining to insurance from the CPA.42 A complete description of the econometric models appears in Appendix A.
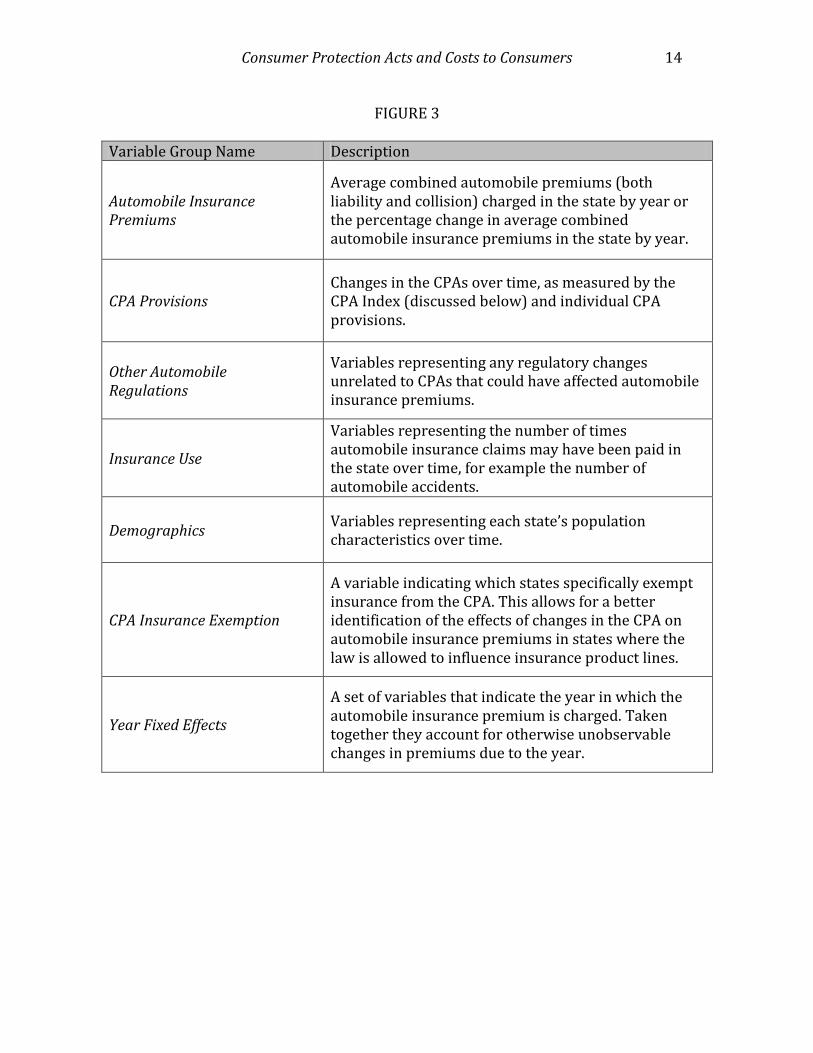
Figure 3 provides general descriptions for each of these variables:43
41 Econometric models are generally equations that specify the statistical relationship between various attributes of an economic phenomenon. For example, these types of models can explain which attributes play the largest role in changes of automobile insurance premiums. 42 Further explanation of this distinction can be found in section III.C.iv. 43 The term variable, for purposes of this Report, is defined as an attribute that can have different values for different observations. For example, the variable Combined Average Automobile Insurance Premiums has a different value for each state for every year observed in the data.
Consumer Protection Acts and Costs to Consumers 14
FIGURE 3
Variable Group Name Description
Automobile Insurance Premiums
Average combined automobile premiums (both liability and collision) charged in the state by year or the percentage change in average combined automobile insurance premiums in the state by year.
CPA Provisions Changes in the CPAs over time, as measured by the CPA Index (discussed below) and individual CPA provisions.
Other Automobile Regulations
Variables representing any regulatory changes unrelated to CPAs that could have affected automobile insurance premiums.
Insurance Use
Variables representing the number of times automobile insurance claims may have been paid in the state over time, for example the number of automobile accidents.
Demographics Variables representing each state’s population characteristics over time.
CPA Insurance Exemption
A variable indicating which states specifically exempt insurance from the CPA. This allows for a better identification of the effects of changes in the CPA on automobile insurance premiums in states where the law is allowed to influence insurance product lines.
Year Fixed Effects
A set of variables that indicate the year in which the automobile insurance premium is charged. Taken together they account for otherwise unobservable changes in premiums due to the year.

Methodology and Data 15
Ideally, the impact on insurance prices of enacting a CPA law would be estimated using the standard “difference-in-difference” approach.44 This approach could estimate the impact of the CPAs by comparing the difference in the pre- and post- law periods for states that adopted CPA laws to those that did not. The difficulty is that all states have now adopted some version of a CPA and, more importantly, did so decades ago, meaning that the standard difference-in-difference model is not feasible.
The data that does exist for the time period studied are changes to CPA provisions.
The Task Force captured these changes with two different measures (discussed further in the next section): (1) the CPA Index, and (2) individual changes to CPA provisions among states. The first measure captured changes in the state’s CPA that could encourage or facilitate a plaintiff’s claim under the CPA. It is thus a measure of the ease of potential recovery in CPA litigation within each state. The second measure focuses on differences among states. All analyses focus on the time period 1994 - 2006.
A. DESCRIPTIVE ANALYSIS OF STATE CONSUMER PROTECTION ACT CHANGES
In order to determine whether changes in CPAs have any effect on automobile
insurance premiums, the Task Force first undertook a comprehensive analysis of the statutory language in all 68 CPAs and subsequent amendments from the time of their adoption through 2009.45
The Task Force began by collecting and analyzing the statutory language for each
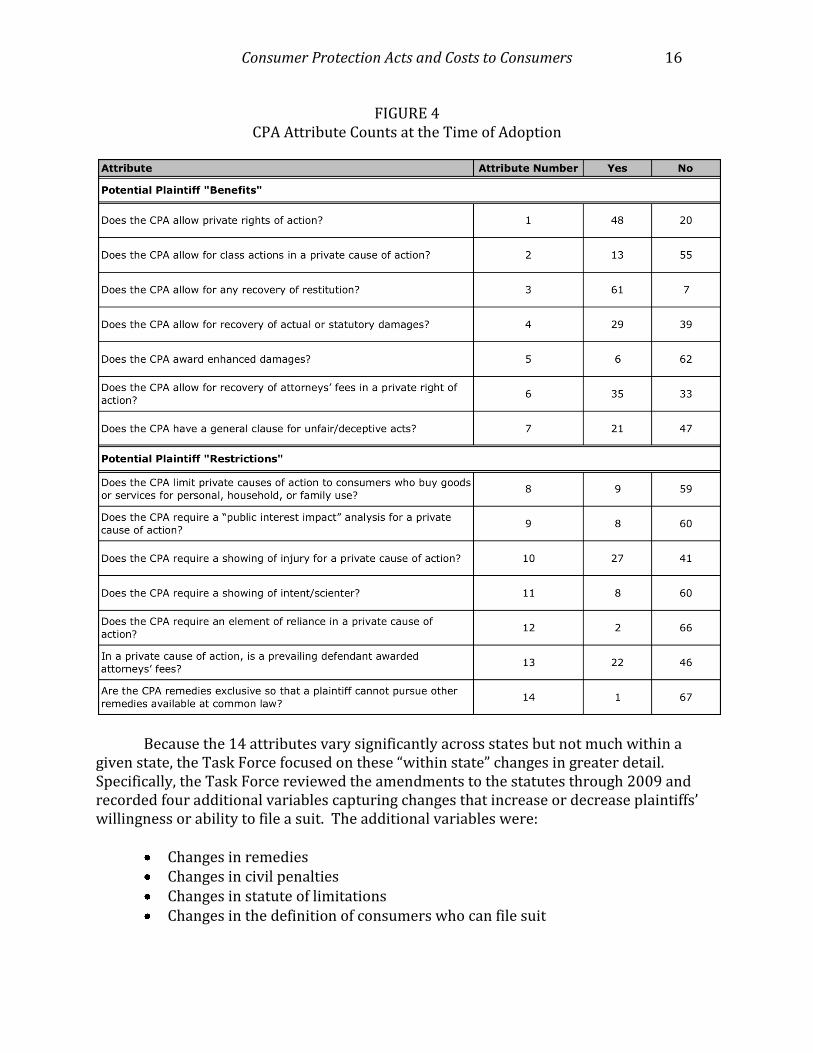
CPA at the time of adoption. Based upon this analysis, 14 attributes emerged as key CPA provisions that could encourage (or discourage) potential plaintiffs from filing suit. The Task Force then identified and documented each CPA amendment from adoption through 2009 to identify any changes in these 14 attributes. To construct a measure that would track a potential plaintiff’s access to the courts through a CPA suit, the Task Force classified the 14 attributes into two groups: “benefits” that may make it easier or more attractive for a potential plaintiff to file a suit (attributes 1-7) and “restrictions” that may make it more difficult or less attractive for a potential plaintiff to file a suit (attributes 8-14). Figure 4 provides counts of the number of statutes containing each attribute at the time of adoption.
44 The standard “difference-in-difference” approach is an econometric technique that measures the effect of a particular event by comparing the results from two groups. The first group is not exposed to the event (the control group) and the second group is exposed (the treatment group). In the most basic models, the control group and the treatment group are observed at a point in time before the event and then observed again after the treatment group has been exposed to the event. The differences between the two groups and the differences before and after the event will identify the true effect of the event on the treatment group. 45 Appendix B contains a complete list of CPAs. CPA statutory language was recorded using Westlaw, LexisNexis, Hein Online, state session laws on microfiche, and hard copies of session laws. Because some states have multiple consumer protection statutes, there are 68 CPAs over the 50 states and the District of Columbia.
Consumer Protection Acts and Costs to Consumers 16
FIGURE 4 CPA Attribute Counts at the Time of Adoption
Because the 14 attributes vary significantly across states but not much within a
given state, the Task Force focused on these “within state” changes in greater detail. Specifically, the Task Force reviewed the amendments to the statutes through 2009 and recorded four additional variables capturing changes that increase or decrease plaintiffs’ willingness or ability to file a suit. The additional variables were:
Changes in remedies Changes in civil penalties Changes in statute of limitations Changes in the definition of consumers who can file suit
Methodology and Data 17
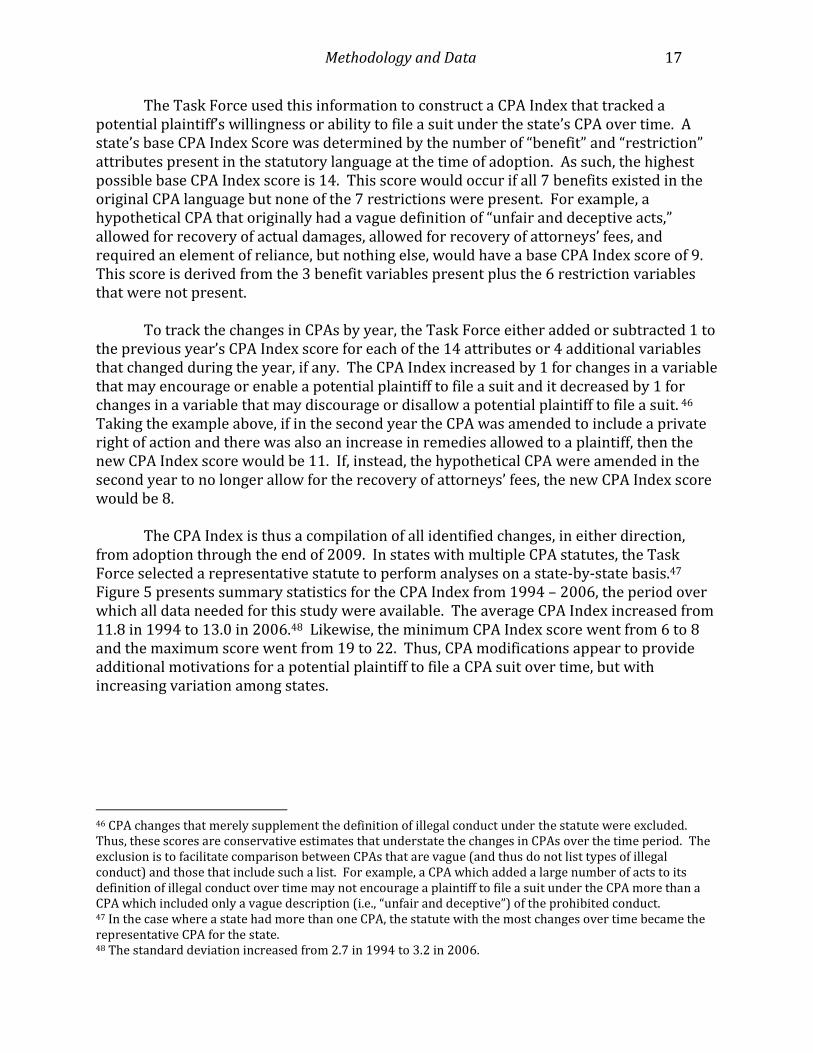
The Task Force used this information to construct a CPA Index that tracked a potential plaintiff’s willingness or ability to file a suit under the state’s CPA over time. A state’s base CPA Index Score was determined by the number of “benefit” and “restriction” attributes present in the statutory language at the time of adoption. As such, the highest possible base CPA Index score is 14. This score would occur if all 7 benefits existed in the original CPA language but none of the 7 restrictions were present. For example, a hypothetical CPA that originally had a vague definition of “unfair and deceptive acts,” allowed for recovery of actual damages, allowed for recovery of attorneys’ fees, and required an element of reliance, but nothing else, would have a base CPA Index score of 9. This score is derived from the 3 benefit variables present plus the 6 restriction variables that were not present.
To track the changes in CPAs by year, the Task Force either added or subtracted 1 to the previous year’s CPA Index score for each of the 14 attributes or 4 additional variables that changed during the year, if any. The CPA Index increased by 1 for changes in a variable that may encourage or enable a potential plaintiff to file a suit and it decreased by 1 for changes in a variable that may discourage or disallow a potential plaintiff to file a suit. 46 Taking the example above, if in the second year the CPA was amended to include a private right of action and there was also an increase in remedies allowed to a plaintiff, then the new CPA Index score would be 11. If, instead, the hypothetical CPA were amended in the second year to no longer allow for the recovery of attorneys’ fees, the new CPA Index score would be 8.
The CPA Index is thus a compilation of all identified changes, in either direction,
from adoption through the end of 2009. In states with multiple CPA statutes, the Task Force selected a representative statute to perform analyses on a state-by-state basis.47 Figure 5 presents summary statistics for the CPA Index from 1994 – 2006, the period over which all data needed for this study were available. The average CPA Index increased from 11.8 in 1994 to 13.0 in 2006.48 Likewise, the minimum CPA Index score went from 6 to 8 and the maximum score went from 19 to 22. Thus, CPA modifications appear to provide additional motivations for a potential plaintiff to file a CPA suit over time, but with increasing variation among states.
46 CPA changes that merely supplement the definition of illegal conduct under the statute were excluded. Thus, these scores are conservative estimates that understate the changes in CPAs over the time period. The exclusion is to facilitate comparison between CPAs that are vague (and thus do not list types of illegal conduct) and those that include such a list. For example, a CPA which added a large number of acts to its definition of illegal conduct over time may not encourage a plaintiff to file a suit under the CPA more than a CPA which included only a vague description (i.e., “unfair and deceptive”) of the prohibited conduct. 47 In the case where a state had more than one CPA, the statute with the most changes over time became the representative CPA for the state. 48 The standard deviation increased from 2.7 in 1994 to 3.2 in 2006.

Consumer Protection Acts and Costs to Consumers 18
FIGURE 5 CPA Index Summary Statistics
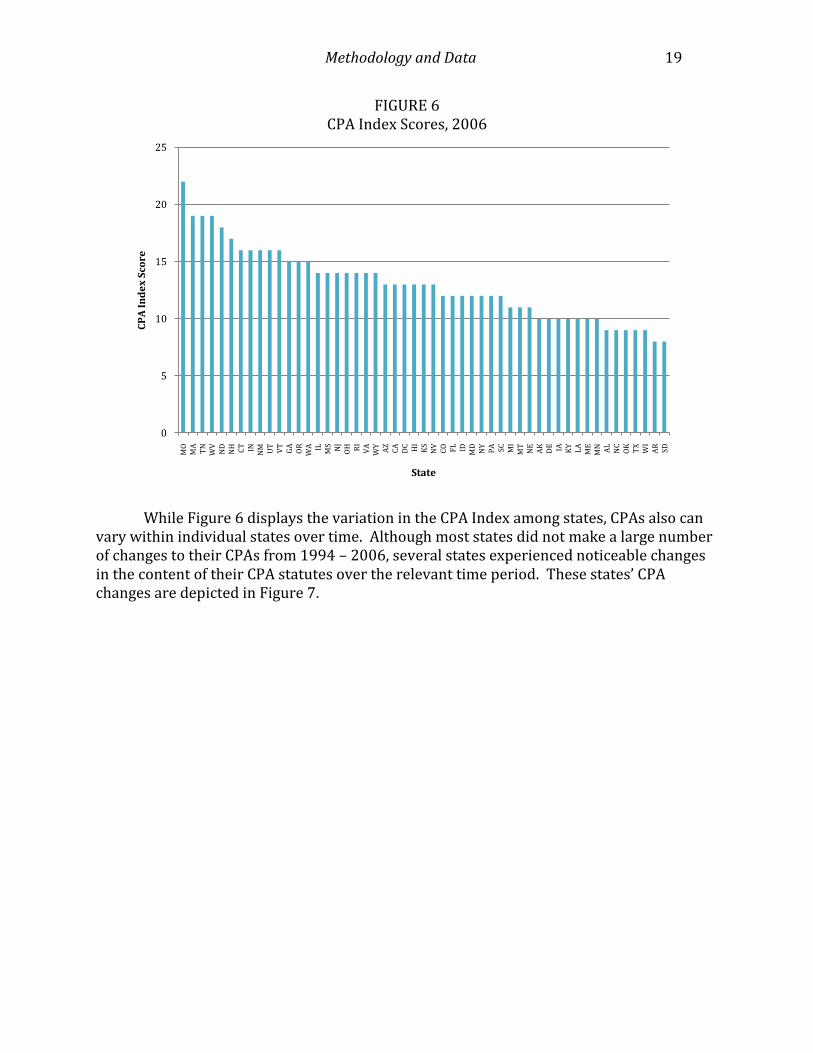
Figure 6 provides a snapshot of the CPA Index values for all fifty states and the District of Columbia in 2006. Generally, this shows the actual variation among states with regard to the CPAs.
Methodology and Data 19
FIGURE 6 CPA Index Scores, 2006
While Figure 6 displays the variation in the CPA Index among states, CPAs also can
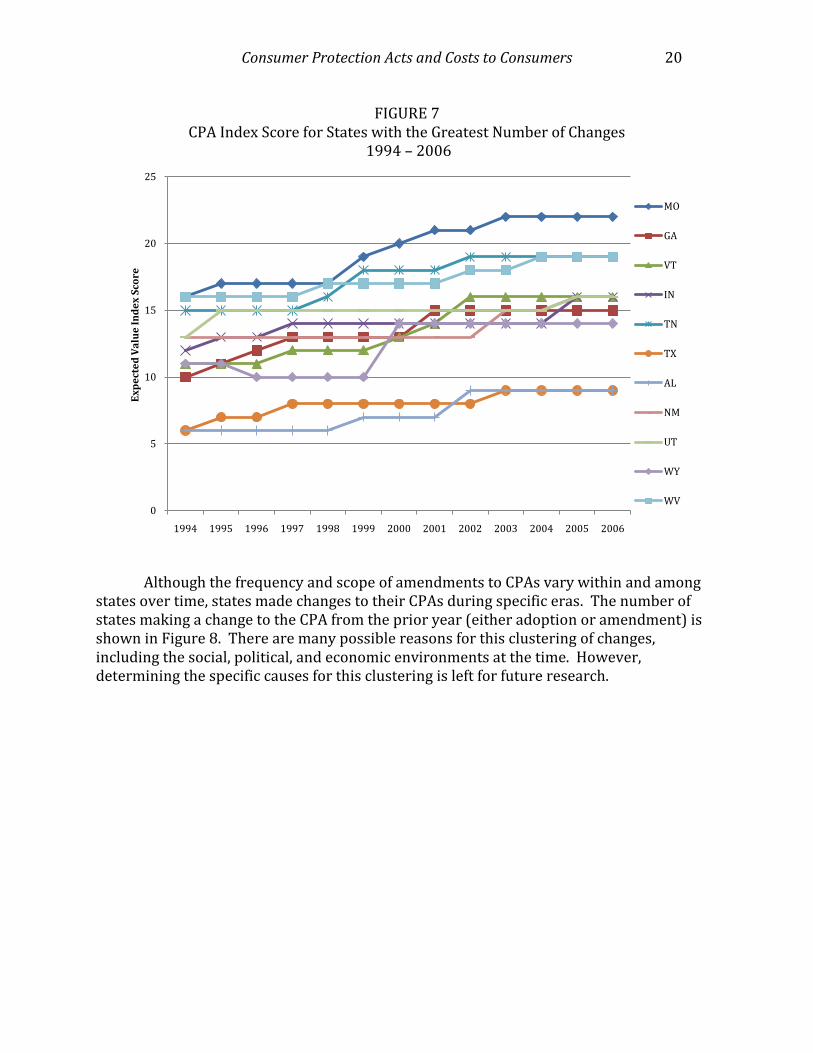
vary within individual states over time. Although most states did not make a large number of changes to their CPAs from 1994 – 2006, several states experienced noticeable changes in the content of their CPA statutes over the relevant time period. These states’ CPA changes are depicted in Figure 7.
0
5
10
15
20
25
MO
MA
TN
WV
ND
NH CT IN
NM UT
VT
GA
OR
WA IL MS NJ
OH RI
VA
WY
AZ
CA
DC HI
KS
NV
CO FL ID MD
NY
PA SC MI
MT
NE
AK
DE IA KY
LA
ME
MN AL
NC
OK
TX
WI
AR
SD
CP
A I
nd
ex
Sco
re
State
Consumer Protection Acts and Costs to Consumers 20
FIGURE 7 CPA Index Score for States with the Greatest Number of Changes
1994 – 2006
Although the frequency and scope of amendments to CPAs vary within and among states over time, states made changes to their CPAs during specific eras. The number of states making a change to the CPA from the prior year (either adoption or amendment) is shown in Figure 8. There are many possible reasons for this clustering of changes, including the social, political, and economic environments at the time. However, determining the specific causes for this clustering is left for future research.
0
5
10
15
20
25
1994 1995 1996 1997 1998 1999 2000 2001 2002 2003 2004 2005 2006
Ex
pe
cte
d V
alu
e I
nd
ex
Sco
re
MO
GA
VT
IN
TN
TX
AL
NM
UT
WY
WV

Methodology and Data 21
FIGURE 8 Number of States Changing the CPA from the Prior Year
1960 – 2009
As shown above, CPAs evolved differently across states over time. These differences provide sufficient variation in the CPA Index to test the relationship between these changes in CPA characteristics and consumer welfare and, specifically, whether CPA statutes that provide increased access to courts are associated with higher automobile insurance premiums in that state.
B. DESCRIPTIVE ANALYSIS OF AUTOMOBILE INSURANCE PREMIUMS
The National Association of Insurance Commissioners (NAIC) provides data on automobile insurance premiums going back to the late 1980s. The NAIC Automobile Insurance Database49 includes information on premiums and a number of potential determinants of insurance prices from 1994 - 2006. The primary measure of automobile insurance premiums in this Report is the combined average premiums, available by state and by year.50 The Task Force chose this measure over other options because it represents the price faced by the typical automobile insurance consumer in a particular state-year.
49 NAIC Automobile Insurance Database, supra note 13. 50 Id. at 1-2. The NAIC defines Premiums as the “dollar amount paid for a policy” and are calculated from data provided by "statistical agents including the American Association of Insurance Services (AAIS); ISO Data, Inc. (ISO); National Independent Statistical Service (NISS); Independent Statistical Service, Inc. (ISS), a subsidiary of Property Casualty Insurers Association of America (PCI); Massachusetts Commonwealth Automobile
0
2
4
6
8
10
12
14
16
181
96
0
19
67
19
74
19
81
19
88
19
95
20
02
20
09
Nu
mb
er
of
CP
As
Ch
an
ge
d
Consumer Protection Acts and Costs to Consumers 22
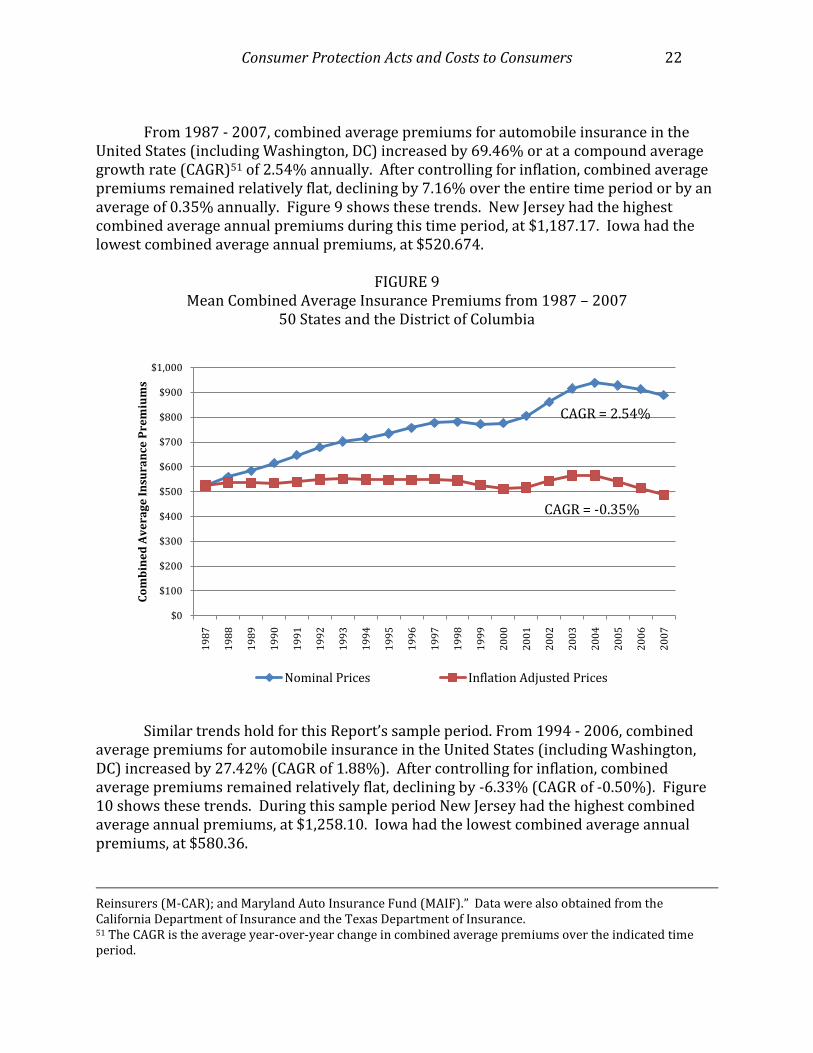
From 1987 - 2007, combined average premiums for automobile insurance in the
United States (including Washington, DC) increased by 69.46% or at a compound average growth rate (CAGR)51 of 2.54% annually. After controlling for inflation, combined average premiums remained relatively flat, declining by 7.16% over the entire time period or by an average of 0.35% annually. Figure 9 shows these trends. New Jersey had the highest combined average annual premiums during this time period, at $1,187.17. Iowa had the lowest combined average annual premiums, at $520.674.
FIGURE 9
Mean Combined Average Insurance Premiums from 1987 – 2007 50 States and the District of Columbia
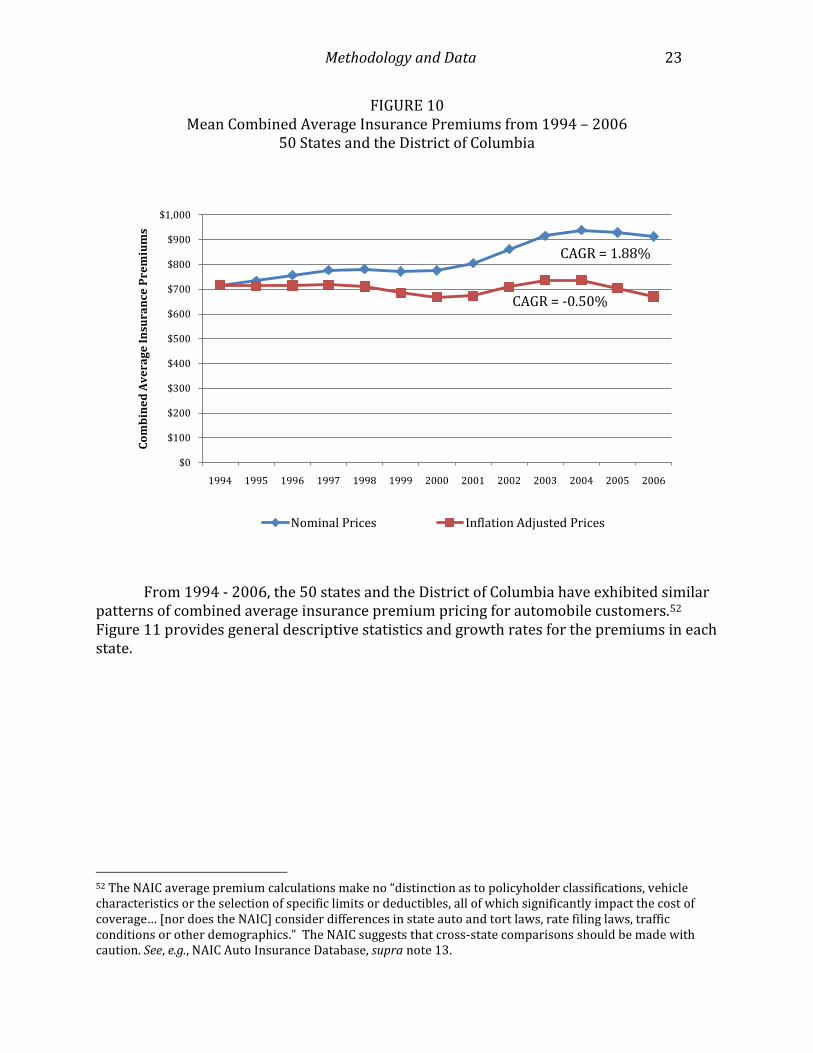
Similar trends hold for this Report’s sample period. From 1994 - 2006, combined average premiums for automobile insurance in the United States (including Washington, DC) increased by 27.42% (CAGR of 1.88%). After controlling for inflation, combined average premiums remained relatively flat, declining by -6.33% (CAGR of -0.50%). Figure 10 shows these trends. During this sample period New Jersey had the highest combined average annual premiums, at $1,258.10. Iowa had the lowest combined average annual premiums, at $580.36.
Reinsurers (M-CAR); and Maryland Auto Insurance Fund (MAIF).” Data were also obtained from the California Department of Insurance and the Texas Department of Insurance. 51 The CAGR is the average year-over-year change in combined average premiums over the indicated time period.
$0
$100
$200
$300
$400
$500
$600
$700
$800
$900
$1,000
19
87
19
88
19
89
19
90
19
91
19
92
19
93
19
94
19
95
19
96
19
97
19
98
19
99
20
00
20
01
20
02
20
03
20
04
20
05
20
06
20
07
Co
mb
ine
d A
ve
rag
e I
nsu
ran
ce P
rem
ium
s
Nominal Prices Inflation Adjusted Prices
CAGR = 2.54%
CAGR = -0.35%
Methodology and Data 23
FIGURE 10 Mean Combined Average Insurance Premiums from 1994 – 2006
50 States and the District of Columbia
From 1994 - 2006, the 50 states and the District of Columbia have exhibited similar patterns of combined average insurance premium pricing for automobile customers.52 Figure 11 provides general descriptive statistics and growth rates for the premiums in each state.
52 The NAIC average premium calculations make no “distinction as to policyholder classifications, vehicle characteristics or the selection of specific limits or deductibles, all of which significantly impact the cost of coverage… [nor does the NAIC] consider differences in state auto and tort laws, rate filing laws, traffic conditions or other demographics.” The NAIC suggests that cross-state comparisons should be made with caution. See, e.g., NAIC Auto Insurance Database, supra note 13.
$0
$100
$200
$300
$400
$500
$600
$700
$800
$900
$1,000
1994 1995 1996 1997 1998 1999 2000 2001 2002 2003 2004 2005 2006
Co
mb
ine
d A
ve
rag
e I
nsu
ran
ce P
rem
ium
s
Nominal Prices Inflation Adjusted Prices
CAGR = 1.88%
CAGR = -0.50%

Consumer Protection Acts and Costs to Consumers 24
FIGURE 11 Combined Average Automobile Insurance Premiums (1994 – 2006)
Note: CAGR is not adjusted for inflation.

Methodology and Data 25
C. DESCRIPTIVE ANALYSIS OF OTHER VARIABLES AFFECTING AUTOMOBILE INSURANCE
PREMIUMS
In addition to changes to CPAs, many other variables could potentially influence automobile insurance premiums. In order to isolate the specific impact of CPA changes on automobile insurance premiums, the Task Force had to account for these other influences. By adding information on other automobile regulations, insurance use, and state demographics to the analysis, the Task Force effectively “controlled” for the effects of these outside variables and isolated the effects of changes in the CPAs on automobile insurance premiums.53
i. OTHER AUTOMOBILE REGULATIONS
There are several variables that can capture a state’s regulatory and legal
environment as it relates to automobile insurance premiums. A full list of the Other Automobile Regulations variables considered for the analysis can be found in Appendix C. The three most important variables were whether the state had compulsory liability automobile insurance, if the state allowed the insurance providers to set their own rates with little or no approval from the state insurance commissioner, and if the state had raised the legal blood alcohol content level to 0.08.54 All of these variables could alter the structure of insurance markets in the particular state, in turn affecting automobile insurance premiums consumers face. These variables were included as controls for Other Automobile Regulations in all econometric models presented in the Results section below. Descriptive statistics for these control variables appear in Appendix D.
ii. INSURANCE USE
In addition to the various regulatory data described above, the NAIC also collects information on variables that could contribute to the number and cost of automobile insurance claims filed. A full list of the Insurance Use variables considered for the analysis in this Report can be found in Appendix C. The most important variables were the number of thefts per 1,000 registered vehicles55 and the average repair cost in the state.56 Both of
53 In this case, controls are variables that would likely influence changes in automobile insurance premiums, but are reasonably independent from the variable of interest. Here, the variables of interest are the CPA Index and the individual CPA provisions. 54 The NAIC retrieved this data from the state’s respective insurance departments. It can be supplemented by data available from the Insurance Information Institute and the Insurance Institute for Highway Safety. The data are available from 1994-2006 for the 50 states and Washington, DC. See e.g., NAIC Auto Insurance Database Report, supra note 13, at 232-240. The data are available from 1994-2006 for the 50 states and Washington, DC. 55 The NAIC compiled this data from the Federal Bureau of Investigation (total number of auto thefts per year, per state) and the Federal Highway Administration (registered vehicles per state). The data are available from 1994-2006 for the 50 states and Washington, DC. See, e.g., NAIC Auto Insurance Database Report, supra note 13, at 213. 56 NAIC collected this data from Automatic Data Processing, Inc. and Audatex, a Solera Company. The data are available from 1994-2006 for the 50 states and Washington, DC. See, e.g., NAIC Auto Insurance Database Report, supra note 13, at 217.

Consumer Protection Acts and Costs to Consumers 26
these variables were included as controls for Insurance Use in all models presented herein. Descriptive statistics for these control variables also appear in Appendix D.
iii. DEMOGRAPHIC VARIABLES
The final type of data considered in the Report was Demographic Variables. A full list of Demographic Variables considered can be found in Appendix C. The most important variables were the number of lawyers per 1,000 people in the state,57 per capita disposable income,58 rate of unemployment,59 percent of state population that is male,60 and the median age of the state’s population.61 All of these variables were included as controls in all models presented herein. Descriptive statistics for these control variables also appear in Appendix D.
iv. CPA INSURANCE EXEMPTION
For the purposes of the Task Force’s analysis, it is important to know which CPAs
potentially reach firms offering automobile insurance. It would not be surprising, for example, to find that the CPA has no effect on automobile insurance premiums in states where insurance is exempted from the CPA.
To determine whether a particular state CPA exempted insurance, the Task Force
categorized as “exempt” any CPA that contained language completely exempting insurance. All other CPAs were classified as “not exempt.” Using this categorization, the Task Force found that: 31 states have never had an explicit exemption for insurance in their CPAs; 18 states always had an explicit exemption for insurance in their CPAs, opting to delegate such issues to the state’s insurance laws; and 2 states enacted amendments in the early 2000s specifically exempting insurance. The Task Force excluded these 20 states from the analysis.
Ideally, states that specifically exempted insurance from their CPA statutes would be
used as a control group, for in almost all of the 20 states with explicit insurance exemptions, insurance companies were sued under CPA provisions at least once, and usually more, between 2000 and 2007. However, given that the laws appear to allow some CPA suits against insurance companies, there is concern that using these states as a control group would confound the impact of CPA laws and other factors. The Task Force’s solution is to omit the 20 states which “exempt” insurance since it is unclear exactly what the exemption means for CPA actions against insurance companies.
57 Attorney data from 1994-2006 for all 50 states and Washington, DC was collected from both the American Bar Association and the Census Bureau. 58 The Bureau of Economic Analysis provided disposable income data for all 50 states and DC, 1994 - 2006. See, e.g., NAIC Auto Insurance Database Report, supra note 14, at 221. 59 Id. Unemployment rates from 1994-2006 for all 50 states and DC were collected from the Bureau of Labor Statistics. 60 The percentage of males in the 50 states and Washington, DC from 1994-2006 was collected from the Census Bureau. 61 Demographic data on age from 1994-2006 for all 50 states and DC were retrieved from the Census Bureau.
Results 27
III. RESULTS
In order to evaluate the effects of changes in state CPAs on automobile insurance
premiums, the Task Force conducted three different analyses based on the CPA Index and its components. As discussed above, 62 the CPA Index is a measure of “pro-plaintiff” tendency in the state, in the sense that it measures the net number of changes likely to increase a plaintiff’s ability or willingness to file a CPA suit. The first looked at the relationship between overall CPA changes, as measured by the CPA Index, and changes in average combined automobile insurance premiums. The second broke the CPA Index into its component parts to study the effects of individual CPA provisions on average combined automobile insurance premiums. The third evaluated the impact of individual CPA provisions on the growth rate of average combined automobile insurance premiums.
Generally, the analyses found that states with a relatively higher number of CPA
Index changes that increased potential plaintiffs’ access to the courthouse were associated with higher automobile insurance premiums. Exemplifying increasing marginal costs, the increases in premiums occurred after CPAs were expanded beyond a threshold level. Further, certain CPA provisions had a greater effect on automobile insurance prices than others.63
A. CPA INDEX EFFECTS ON AUTOMOBILE INSURANCE PREMIUMS
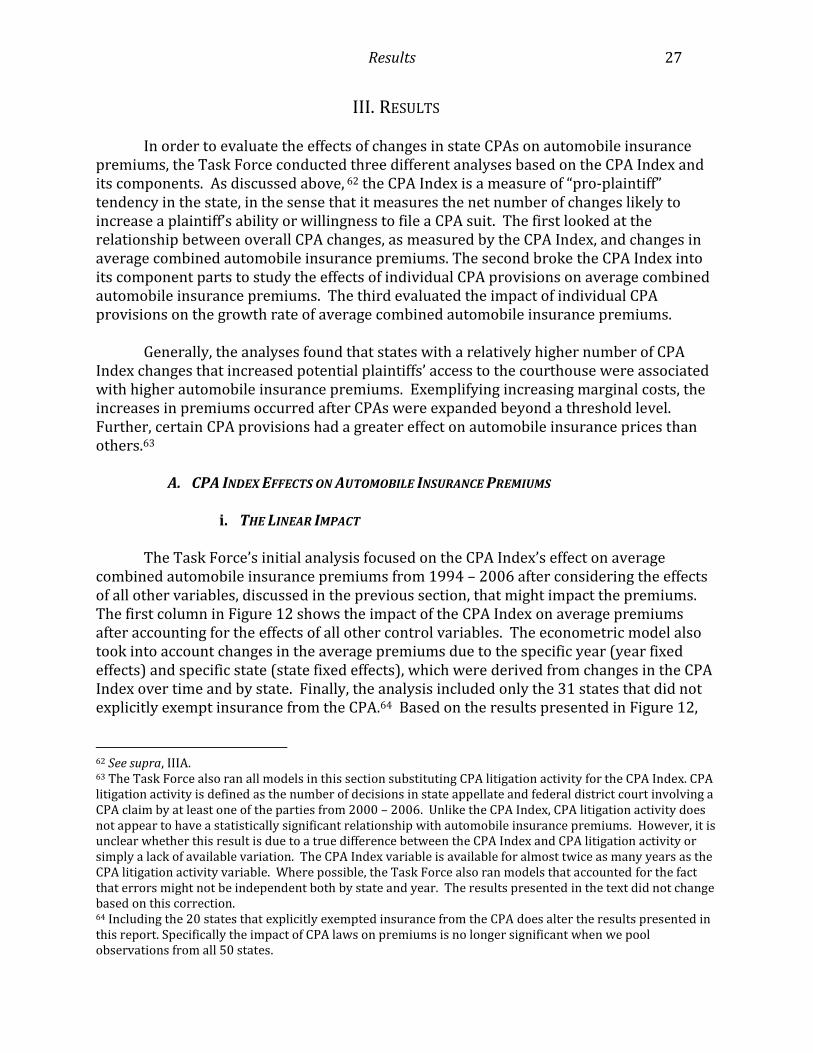
i. THE LINEAR IMPACT The Task Force’s initial analysis focused on the CPA Index’s effect on average
combined automobile insurance premiums from 1994 – 2006 after considering the effects of all other variables, discussed in the previous section, that might impact the premiums. The first column in Figure 12 shows the impact of the CPA Index on average premiums after accounting for the effects of all other control variables. The econometric model also took into account changes in the average premiums due to the specific year (year fixed effects) and specific state (state fixed effects), which were derived from changes in the CPA Index over time and by state. Finally, the analysis included only the 31 states that did not explicitly exempt insurance from the CPA.64 Based on the results presented in Figure 12,
62 See supra, IIIA. 63 The Task Force also ran all models in this section substituting CPA litigation activity for the CPA Index. CPA litigation activity is defined as the number of decisions in state appellate and federal district court involving a CPA claim by at least one of the parties from 2000 – 2006. Unlike the CPA Index, CPA litigation activity does not appear to have a statistically significant relationship with automobile insurance premiums. However, it is unclear whether this result is due to a true difference between the CPA Index and CPA litigation activity or simply a lack of available variation. The CPA Index variable is available for almost twice as many years as the CPA litigation activity variable. Where possible, the Task Force also ran models that accounted for the fact that errors might not be independent both by state and year. The results presented in the text did not change based on this correction. 64 Including the 20 states that explicitly exempted insurance from the CPA does alter the results presented in this report. Specifically the impact of CPA laws on premiums is no longer significant when we pool observations from all 50 states.

Consumer Protection Acts and Costs to Consumers 28
one could conclude that average automobile insurance premiums were higher in states with relatively larger CPA Index scores.
To conceptualize, consider Georgia’s CPA Index, which is representative of the pro-
plaintiff movements over the time period.65 Figure 12, Column 1, presents estimates of Georgia’s move from a CPA Index of 12 in 1996 to 15 in 2001, which produced an approximately 2% increase in the combined average annual premium in the state (2.74*0.00740) holding all else constant. Although the Report cannot estimate the total benefits of this move to consumers, it can provide an estimate of the cost due to “pro-plaintiff” changes to the CPA. For example, the average combined annual premium in Georgia over the sample period was $841.76. If this average were to increase by 2%, the average consumer in Georgia would pay an additional $17.87 per year. Likewise, the sample average of the combined premium over the 31 states is $838.72, suggesting that a 2% increase in premiums would raise the annual payments of the typical automobile insurance customer by $17.81.
FIGURE 12
CPA Index Results (1) (2)
VARIABLES Linear Non-Linear
CPA Index 0.00740* -0.0267
(0.00379) (0.0221)
CPA Index, Squared 0.00126
(0.000808)
Observations 403 403
R-squared (within) 0.824 0.826
R-squared (between) 0.187 0.178
R-squared (overall) 0.298 0.291
Number of states 31 31 Robust standard errors clustered by state in parentheses. All estimates include state and year fixed effects and controls found in Appendix D. Estimates include only states that allow CPA litigation against automobile insurance companies.
*** p<0.01, ** p<0.05, * p<0.1
While the model estimated the impact of a CPA change on consumers, the increased
costs could potentially be borne by other groups, such as shareholders of automobile insurance providers. There is reason to suspect, however, that the impact on consumers would capture most of the total increased social cost associated with CPA expansion. In the case of automobile insurance, state mandates requiring coverage for all drivers likely produce relatively inelastic demand. In effect, due to the illegality of not purchasing automobile insurance, consumers will not likely demand less insurance simply because the
65 Georgia is a typical state because from 1994 – 2006, the CPA Index for the 31 states in the model had a standard deviation of 2.74 and a mean of 12. Georgia had similar movements over the same time period.
Results 29
price increases.66 If increases in the CPA Index are the analytical equivalent of a tax on automobile insurance associated with the pro-plaintiff movement in the statute, then basic economic theory suggests that customers, not shareholders, would largely pay that tax.67
ii. THE NON-LINEAR IMPACT
An interesting and potentially important analysis explores the possibility that the
relationship between the CPA Index and automobile insurance prices is non-linear (as the first model assumes). Column 2 of Figure 12 is the same as the model in Column 1, except that it includes both the CPA Index and CPA Index squared. This is a standard statistical model to test whether the relationship between the CPA Index and average automobile insurance premiums is non-linear, i.e., curved. The coefficients are not statistically significant individually, but they are jointly significant,68 indicating that the relationship between the CPA Index and average automobile insurance premiums is non-linear. The linear and non-linear relationships are graphed in Figure 13.
66 The price elasticity of demand for a particular product is calculated as the percent change in quantity demanded for the product over the percent change in the price of the product. Blackmon and Zeckhauser estimate a demand elasticity of -.57 for Massachusetts while Jaffee and Russell estimate a price elasticity of -.63 for California. See B. Glenn Blackmon & Richard Zeckhauser, Mispriced Equity: Regulated Rates for Auto Insurance in Massachusetts, 81 AM. ECON. REV. 65 (1991); DWIGHT JAFFEE & THOMAS RUSSELL, The Causes and Consequences of Rate Regulation in the Auto Insurance Industry, in, THE ECONOMICS OF PROPERTY-CASUALTY
INSURANCE (David F. Bradford ed. 1997). 67 Blackmon, supra note 66. As discussed in II.B., expansion of CPA liability may not act as a pure tax to consumers. 68 In an econometric model, a coefficient estimate is considered statistically significant if it is unlikely to have occurred by chance. Statistical significance for a single variable is measured by p-values and in the social sciences a result is generally significant if p < 0.1 (i.e., the likelihood that the result occurred by chance is less than 10%). Coefficient estimates can also be jointly significant if both are unlikely to have occurred by chance. In Figure 10, Column 2, the coefficients jointly have a p-value of 0.082 (F-stat = 2.72) indicating that together, the likelihood that the result occurred by chance is less than 10%.

Consumer Protection Acts and Costs to Consumers 30
FIGURE 13 Linear versus Non-Linear Impact of the CPA Index
The non-linear trend in Figure 13 suggests that automobile insurance prices declined until states had enacted about 12 pro-plaintiff changes in their CPAs, at which point costs began to increase.69 The initial decline in the non-linear CPA Index trend could be consistent with the view that state CPAs can improve consumer welfare by forcing firms to internalize the social costs of deception and the provision of misleading information. Although, without a complete understanding of how this price change affects the quantity (or quality) of insurance purchased, it is difficult to make definitive statements about consumer welfare. It is clear, though, that consumers face lower costs as CPAs initially expand access to the courts.
However, assuming that the quantity (or quality) of insurance purchased does not increase, the subsequent increase in the trend may suggest that further pro-plaintiff expansion in state CPAs can ultimately result in diminishing marginal returns for consumers. In other words, initial pro-plaintiff changes to CPAs can be welfare enhancing, but after a certain point further pro-plaintiff changes can begin to reduce consumer welfare. For example, some levels of state CPA liability can reduce the ability of insurance companies to engage in deceptive advertising that allows them to charge higher prices, thus lowering premiums and improving consumer welfare. However, beyond a threshold
69 This suggests that the 2% increase shown for Georgia, as calculated from the linear model, would not generalize to those states or years in which the CPA Index was below the average over all 31 states from the sample period 1994 – 2006.
-0.2
-0.1
0
0.1
0.2
0.3
0.4
0.5
0.6
1 2 3 4 5 6 7 8 9 10 11 12 13 14 15 16 17 18 19 20 21 22 23 24 25 26 27 28 29 30 31 32 33
Lo
g o
f C
om
bin
ed
Av
era
ge
Pre
miu
ms
CPA Index
Non-linear Linear

Results 31
level of expanded CPA liability, the CPA may deter the supply of valuable information, resulting in higher premiums and reduced competition. At a minimum, consumers are likely facing increasing marginal costs from CPA amendments that expand consumers’ access to the courts.
These analyses assume that the demand for automobile insurance does not
simultaneously increase when a state increases the ability of residents to bring a claim against their insurance company. This might not be the case. For example, if the ability to bring a claim decreased the likelihood of fraud by insurers making insurance more valuable, one might expect the demand for insurance to rise. However, there are reasons for skepticism that the estimated impacts were due to such demand, rather than supply, changes. One reason is that all states have CPAs during the sample period, so that the ability to bring a claim has existed for some time. Another is that most states already require drivers to purchase automobile insurance.
B. INDIVIDUAL CPA PROVISION EFFECTS ON AUTOMOBILE INSURANCE PREMIUMS
Another way to explore the effects of changes in CPAs on average automobile insurance premiums is to study the impact of individual, specific CPA provisions on insurance prices. Figure 14 presents the results from two such econometric models. Both models are similar to those in Figure 12 in that they include the same control variables, account for changes due to the specific year (year fixed effects), and include only the 31 states that did not exempt insurance from litigation under CPAs. However, because the 14 provisions changed infrequently within a state from 1994 – 2006, the models can no longer remove state-specific averages (it was not possible to include state fixed effects).
The first model (Figure 14, Column 1) studied the impact of all 14 of the specific CPA attributes together on automobile insurance premiums. Because the attributes were highly correlated, i.e., a state with specific CPA provisions was more likely to also have other provisions, the second model (Figure 14, Column 2) estimated the impact of each of the attributes individually. In effect, the first column shows the impact of the specific CPA provision while holding all other provisions constant, whereas the second column presents the impact of the specific CPA provision assuming the entire effect on the insurance premium was due only to the provision, thus ignoring the correlation among provisions. Differences between the two columns represent the uncertainty over whether an individual CPA provision was impacting premiums directly or in conjunction with other provisions.
Several results emerged from Figure 14. The largest effect came from provisions that allow for enhanced damages. These were associated with a 16% increase in premiums when other provisions were included in the model and a 10% increase when there were no other provisions considered. On their own, provisions for enhanced damages could cost consumers approximately $80 per year in increased premiums.70 Next, CPAs that allowed
70 This assumes the average premium for the 31 states in the model from 1994 – 2006 is $838.72 and the increase due to enhanced damages provisions is 10% ($838.72 * 0.10 = $83.87). Note that it is possible for
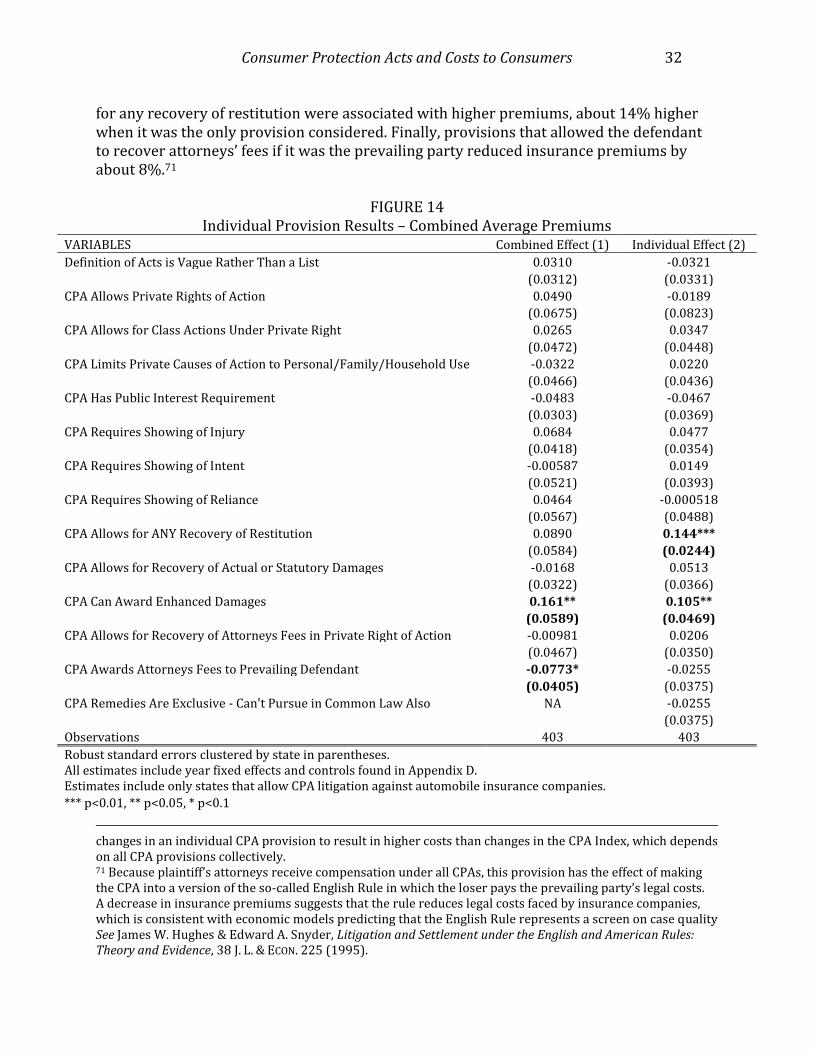
Consumer Protection Acts and Costs to Consumers 32
for any recovery of restitution were associated with higher premiums, about 14% higher when it was the only provision considered. Finally, provisions that allowed the defendant to recover attorneys’ fees if it was the prevailing party reduced insurance premiums by about 8%.71
FIGURE 14
Individual Provision Results – Combined Average Premiums VARIABLES Combined Effect (1) Individual Effect (2)
Definition of Acts is Vague Rather Than a List 0.0310 -0.0321
(0.0312) (0.0331)
CPA Allows Private Rights of Action 0.0490 -0.0189
(0.0675) (0.0823)
CPA Allows for Class Actions Under Private Right 0.0265 0.0347
(0.0472) (0.0448)
CPA Limits Private Causes of Action to Personal/Family/Household Use -0.0322 0.0220
(0.0466) (0.0436)
CPA Has Public Interest Requirement -0.0483 -0.0467
(0.0303) (0.0369)
CPA Requires Showing of Injury 0.0684 0.0477
(0.0418) (0.0354)
CPA Requires Showing of Intent -0.00587 0.0149
(0.0521) (0.0393)
CPA Requires Showing of Reliance 0.0464 -0.000518
(0.0567) (0.0488)
CPA Allows for ANY Recovery of Restitution 0.0890 0.144***
(0.0584) (0.0244)
CPA Allows for Recovery of Actual or Statutory Damages -0.0168 0.0513
(0.0322) (0.0366)
CPA Can Award Enhanced Damages 0.161** 0.105**
(0.0589) (0.0469)
CPA Allows for Recovery of Attorneys Fees in Private Right of Action -0.00981 0.0206
(0.0467) (0.0350)
CPA Awards Attorneys Fees to Prevailing Defendant -0.0773* -0.0255
(0.0405) (0.0375)
CPA Remedies Are Exclusive - Can't Pursue in Common Law Also NA -0.0255
(0.0375)
Observations 403 403
Robust standard errors clustered by state in parentheses. All estimates include year fixed effects and controls found in Appendix D. Estimates include only states that allow CPA litigation against automobile insurance companies.
*** p<0.01, ** p<0.05, * p<0.1
changes in an individual CPA provision to result in higher costs than changes in the CPA Index, which depends on all CPA provisions collectively. 71 Because plaintiff’s attorneys receive compensation under all CPAs, this provision has the effect of making the CPA into a version of the so-called English Rule in which the loser pays the prevailing party’s legal costs. A decrease in insurance premiums suggests that the rule reduces legal costs faced by insurance companies, which is consistent with economic models predicting that the English Rule represents a screen on case quality See James W. Hughes & Edward A. Snyder, Litigation and Settlement under the English and American Rules: Theory and Evidence, 38 J. L. & ECON. 225 (1995).

Results 33
C. INDIVIDUAL CPA PROVISION EFFECTS ON AUTOMOBILE INSURANCE PREMIUM GROWTH
RATES Another way to assess the impact of individual CPA provisions on automobile
insurance premiums is to consider the effect of such CPA changes on the growth rate of automobile insurance premiums rather than on the level of combined average premiums. Instead of trying to explain why certain states have higher premiums than others, this analysis asks what the impact of CPA provisions will be on the rate of increase of premiums. One concern with the results in Figure 14 is if changes in CPAs did not cause higher premiums, but rather states that adopted specific provisions did so because they had higher premiums. Focusing on growth rates should mitigate that concern.72
The models in Figure 15 are identical to those in Figure 14, except that the measure
used for automobile insurance premiums was the growth rate of combined average automobile insurance premiums. The model using all 14 CPA provisions is in Column 1, while the model using only the specific provision is in Column 2.
Changing the measure for automobile insurance premiums provides different results from those found in Figure 14. The two most significant findings involve private rights of action and public interest requirements. First, Figure 15 indicates that states with CPA provisions allowing a private right of action had a more rapid increase in automobile insurance premiums. The presence of a private right of action provision was associated with a 1.65% increase in growth rate of premiums after accounting for all other CPA provisions.73 Given that from 1994 – 2006, the overall average growth rate of premiums was 1.78% per year,74 the presence of a private right of action may have contributed 0.03% on average to the annual growth rate of premiums.75
Second, CPAs with a public interest requirement were associated with higher
premium growth rates of 0.9% when considered separately and 1.0% when combined with other provisions. This effect is statistically significant, whether the provision was estimated separately or combined with other provisions. These results may be consistent with the notion that public interest provisions expand the number of lawsuits without necessarily increasing the cost of individual cases.
Several findings involving restitution and defendants’ recovery of attorneys’ fees
were inconsistent with the results derived from the models using combined average premium levels as the measure for automobile insurance premiums. Although there are a number of possible explanations for the divergence, analyzing the underlying causes is left for a future study. As such, the Task Force cannot predict with confidence the impact of adopting any of these provisions on insurance premiums
72 Growth rates are not entirely without concerns. If the impact of a CPA change is immediately capitalized into premiums, then the growth rate estimates would miss that impact. 73 See Figure 15, column 1. 74 The 1.78% growth rate represents the CAGR on the average combined premium averaged for the 31 non-exempt states from 1994 – 2006. 75 0.03% = 1.65%*1.78%.
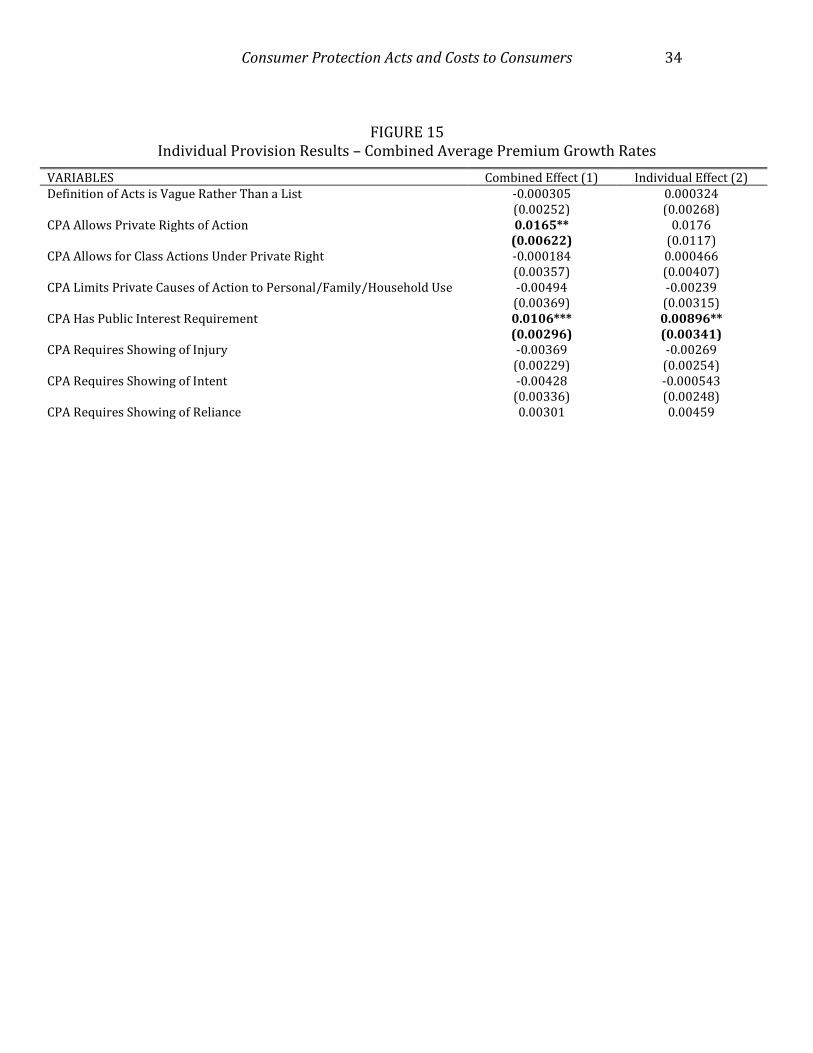
Consumer Protection Acts and Costs to Consumers 34
FIGURE 15
Individual Provision Results – Combined Average Premium Growth Rates
VARIABLES Combined Effect (1) Individual Effect (2) Definition of Acts is Vague Rather Than a List -0.000305 0.000324 (0.00252) (0.00268) CPA Allows Private Rights of Action 0.0165** 0.0176 (0.00622) (0.0117) CPA Allows for Class Actions Under Private Right -0.000184 0.000466 (0.00357) (0.00407) CPA Limits Private Causes of Action to Personal/Family/Household Use -0.00494 -0.00239 (0.00369) (0.00315) CPA Has Public Interest Requirement 0.0106*** 0.00896** (0.00296) (0.00341) CPA Requires Showing of Injury -0.00369 -0.00269 (0.00229) (0.00254) CPA Requires Showing of Intent -0.00428 -0.000543 (0.00336) (0.00248) CPA Requires Showing of Reliance 0.00301 0.00459

Conclusions 35
IV. CONCLUSIONS
The Searle Civil Justice Institute Preliminary Policy Report on Consumer Protection
Acts and Costs to Consumers (the Report) provides evidence on the impact of changes to Consumer Protection Acts (CPAs) on automobile insurance costs to consumers. During the sample period from 1994 – 2006, the CPA Index, a measure of a potential plaintiff’s ability or willingness to file a suit under the CPA, increased for almost every state. This suggests that CPA changes over time have almost universally increased access to the courthouse for potential CPA plaintiffs. The critical policy question is whether even further expansion of consumer protection liability will result in negative consequences for consumers.
Data on the consumer effects associated with more expansive consumer protection
liability has been largely absent from policy discourse. In order to capture the effects on consumers of expanding CPA liability, the Task Force on State Consumer Protection Acts and Costs to Consumers focused on the automobile insurance market. While caution should be exercised in generalizing the findings in this Report to other insurance products, the results could be used to inform CPA policy debates and to highlight the importance of
(0.00683) (0.00897) CPA Allows for ANY Recovery of Restitution 0.00533 -0.00594** (0.00460) (0.00225) CPA Allows for Recovery of Actual or Statutory Damages -0.00152 -0.00243 (0.00349) (0.00246) CPA Can Award Enhanced Damages -0.00369 -0.00480 (0.00309) (0.00359) CPA Allows for Recovery of Attorneys Fees in Private Right of Action -0.00215 0.00349 (0.00417) (0.00338) CPA Awards Attorneys Fees to Prevailing Defendant 0.00909** 0.00603 (0.00333) (0.00391) CPA Remedies Are Exclusive - Can't Pursue in Common Law Also NA 0.00603 (0.00391) Observations 403 403 Robust standard errors clustered by state in parentheses. All estimates include year fixed effects and controls found in Appendix D. Estimates include only states that allow CPA litigation against automobile insurance companies.
*** p<0.01, ** p<0.05, * p<0.1

Consumer Protection Acts and Costs to Consumers 36
considering both the potential benefits and the potential costs of expanding liability when attempting to identify consumer protection policies that maximize consumer welfare.
The key research findings of this Report include:
1. On average, states have increased access to the courthouse by making it easier to
sue under CPA statutes. The CPA Index is a measure of “pro-plaintiff” activity in the state because it measures the net number of changes likely to increase a plaintiff’s ability or willingness to file a CPA suit. The average CPA Index increased from 11.8 in 1994 to 13.0 in 2006, suggesting that state CPAs during this time period became more “pro-plaintiff.”
2. States with relatively more “pro-plaintiff” CPAs are associated with higher automobile insurance premiums. For states that do not exempt insurance from their CPAs, increases in the CPA Index scores are associated with higher combined average automobile insurance premiums. For example, a one standard deviation increase from the average CPA Index results in a 2.0% increase in combined average premiums. Given an overall combined average annual premium of $838.72, a 2.0% increase translates to an additional $17.81 paid by the average consumer of automobile insurance annually.
3. Price increases occur after “pro-plaintiff” CPA statutes expand beyond a threshold level. Initial changes that increase the CPA Index may lead to decreased combined average premiums but additional changes ultimately result in higher premiums. Policymakers should take into account both the costs and benefits of a potential expansion in CPA liability.
4. Many states have reached the threshold where additional CPA liability is likely to increase automobile insurance premiums. For many states, CPA statutes have already been expanded to the point of increasing marginal costs and possibly diminishing marginal returns for consumers. At average CPA levels, a marginal expansion of CPA liability is likely associated with higher prices.
5. Changes in CPA provisions that allow for enhanced damages are associated with automobile insurance premium increases ranging from 10 - 16%. Not all CPA provisions contribute equally to changes in automobile insurance premiums. The largest effect of CPA changes on insurance premiums involves provisions that allow for enhanced damages. These provisions, on their own, may increase the cost of premiums by $80 per year.
Combined, these findings and empirical observations in the SCJI Preliminary Policy Report on Consumer Protection Acts and Costs to Consumers have critical implications for state and federal policymakers:

Conclusions 37
1. Continued expansion of CPAs may ultimately make consumers worse off. Consumer protection is no exception to the rule that there is no such thing as a free lunch. State consumer protection legislation and litigation can impose considerable financial costs on consumers. Although consumers may initially benefit from expansion of their legal rights, the continued expansion of liability is costly and may ultimately cause consumer harm.
2. Policymakers considering incremental state consumer protection legislation or
regulation should be required to articulate tangible benefits to justify the costs imposed on consumers. Policymakers must remain mindful that no policy measure advances only benefits to the exclusion of any costs. Consumer protection provisions are no exception, and any perceived benefits must be balanced against any potential costs.
3. Consumer protection reforms that allow enhanced or treble damages appear to
create the greatest cost burden to consumers. Not all consumer protection provisions have the same impact. While the benefits of CPA reform may outweigh the costs in some circumstances, the costs may clearly outweigh the benefits in others. Supplementing CPAs with enhanced or treble damage provisions must be accompanied with persuasive evidence that consumer benefits will exceed the likely increase in premiums.
4. The analysis contained in this Preliminary Report could apply to other consumer
protection enforcement efforts, including those at the federal level. It is not unreasonable to extend this analysis to other consumer protection issues, such as those emerging from the Consumer Financial Protection Bureau and the Consumer Product Safety Commission.
This Preliminary Policy Report contributes new and useful information to the policy
debates on CPAs. This new information must be read and interpreted with appropriate caution. Focusing on prices allows for the suggestion that expanded CPAs might have important negative consumer welfare effects holding non-price dimensions constant. However, the Report is not able to capture changes in non-price consumer welfare. Further, it is unclear how much of the total increase in costs associated with expanded liability under CPAs are borne by shareholders of automobile insurance providers rather than by consumers. Nevertheless, there is reason to suspect that consumers bear the bulk of the costs associated with CPA expansion. While these limitations suggest important areas for future research, the Report contributes valuable data to CPA policy debates by demonstrating that, at least in one major consumer product market, continued expansion of CPA liability is likely to result in increased costs to consumers in the form of higher product prices.

Consumer Protection Acts and Costs to Consumers 38
APPENDIX A: ECONOMETRIC MODEL DESCRIPTIONS
A generalized model for predicting the effects of changes in CPAs on insurance
premiums is characterized by the following generalized equation:
Insurance Premiumsit = f(CPA Provisionsit, Other Regulationsit, Insurance Useit, Demographic Variablesit, θt)
where i = state t = year
θt = year fixed effects.
The model assumes insurance pricing by state over time is a function of the state’s regulatory environment, the insurance use rates, and the state-level demographics. The dependent Insurance Premiums variable set consists of average combined automobile premiums (both liability and collusion) charged in the state by year or by the percentage change in average combined automobile insurance premiums in the state by year.
Independent variables include CPA Provisions, which controls for changes in the
CPAs over time. The regressions also include: Other Regulations, which include controls for any regulatory changes unrelated to CPAs that could have affected automobile insurance prices; Insurance Use, which includes controls for the number of times automobile insurance claims may have been paid in the state over time, for example the number of automobile accidents; and Demographic Variables, which control for each state’s population characteristics over time. All models include year fixed effects and, where possible, state fixed effects as well.
Estimating the impact of CPAs on insurance prices presents an econometric
challenge because there are very few CPA provisions enacted during the time period in which automobile insurance premium information is available. The solution is to examine changes to the CPA’s provisions. The first measure, called the CPA Index, is designed to measure changes in the state’s CPA that would likely motivate a potential plaintiff to bring a claim under the CPA. It is thus a within state measure of the ease of recovery in CPA litigation. The second measure examines the cross-sectional impact of CPA provisions between states.
Another important variable takes into account the relationship between states’ CPAs
and insurance laws. Some states specifically exempt insurance from claims under the CPA, preferring to place any deceptive or unfair acts involving insurance under the purview of that state’s insurance laws. Other states’ CPAs remain silent on whether insurance falls under the CPA. Understanding which states specifically exempt insurance from the CPA allows for better identification of the effects of changes in the CPA on automobile insurance premiums where the law is allowed to influence insurance product lines.

Appendices 39
APPENDIX B: LIST OF CONSUMER PROTECTION ACTS
State Common Title Statute (as of June 2008)
Alabama The Alabama Deceptive Trade Practices Act
Ala. Code §§ 8-19-1 to 8-19-15
Alaska The Alaska Unfair Trade Practices and Consumer Protection Act
AS §§ 45.50.471 to 45.50.561
Arizona Arizona's Consumer Fraud Act Ariz. Rev. Stat. Ann. §§ 44-1521 to 44-1534
Arkansas The Deceptive Trade Practices Act
Ark. Code Ann. §§ 4-88-101 to 4-88-115 (general provisions); Ark. Code Ann. §§ 4-88-101 to 4-88-706 (entire act)
California California's Unfair Competition Law (UCL)
Ca. Bus. & Prof. Code §§ 17200 to 17210 (previously, Ca. Civil Code § 3369)
California Consumers Legal Remedies Act (CLRA) Cal. Civ. Code § 1750 to 1784 California Unfair Practices Act (UPA) Ca. Bus. & Prof. Code §§ 17000 to 17101
Colorado The Colorado Consumer Protection Act (CCPA)
C.R.S. §§ 6-1-101 to 6-1-115 (general provisions); C.R.S. §§ 6-1-101 to 6-1-1120 (entire act)
Connecticut Connecticut Unfair Trade Practices Act (CUTPA)
Conn. Gen. Stat. §§ 42-110a to 42-110q
Delaware Consumer Fraud Act Del. Code Ann. tit. 6, §§ 2511 to 2527 Delaware Deceptive Trade Practices Act Del. Code Ann. tit. 6, §§ 2531 to 2536 District of Columbia
District of Columbia Consumer Protection Procedures Act (DCCPPA)
DC Code §§ 28-3901 to 28-3913
Florida Florida Deceptive and Unfair Trade Practices Act (FDUTPA)
Fla. Stat. §§ 501.201 to 501.213
Georgia Uniform Deceptive Trade Practices Act OCGA §§ 10-1-370 to 10-1-375
Georgia Georgia Fair Business Practices Act (FBPA)
OCGA §§ 10-1-390 to 10-1-407
Hawaii Uniform Deceptive Trade Practices Act Haw. Rev. Stat. §§ 481A-1 to 481A-5 Idaho Idaho Consumer Protection Act (ICPA) Idaho Code §§ 48-601 to 48-619
Illinois Illinois Consumer Fraud and Deceptive Business Practices Act (ICFA)
815 ILCS 505/1 to 505/12
Illinois Uniform Deceptive Trade Practices Act 815 ILCS 510/1 to 510/7
Indiana The Indiana Deceptive Consumer Sales Act
Indiana Code §§ 24-5-0.5-1 to 24-5-0.5-12
Iowa The Iowa Consumer Fraud Act Iowa Code § 714.16
Kansas The Kansas Consumer Protection Act (KCPA)
K.S.A. §§ 50-623 to 50-643 (general provisions); K.S.A. §§ 50-623 to 50-6113 (entire act)
Kentucky The Kentucky Consumer Protection Act KRS §§ 367.110 to 367.300
Louisiana The Louisiana Unfair Trade Practices and Consumer Protection Act (LUTPA)
La. R.S. §§ 51:1401 to 51:1425
Maine The Maine Unfair Trade Practices Act (UTPA)
5 M.R.S.A. §§ 205-A to 214

Consumer Protection Acts and Costs to Consumers 40
APPENDIX B (Cont.)
State Common Title Statute (as of June 2008) Maine Uniform Deceptive Trade Practices Act 10 M.R.S.A. §§ 1211 to 1216
Maryland Maryland Consumer Protection Act Md. Com. Law Code Ann. §§ 13-101 to 13-501
Massachusetts The Massachusetts Regulation of Business Practice and Consumer Protection Act (Chapter 93A)
Mass. Gen. L. ch. 93A §§ 1 to 11
Michigan The Michigan Consumer Protection Act (MCPA)
Mich Comp. Laws §§ 445.901 to 445.922
Minnesota Deceptive Trade Practices Act Minn. Stat. §§ 325D.43 to 325D.48 Minnesota Minnesota Consumer Fraud Act Minn. Stat. §§ 325F.68 to 325F.70
Mississippi
The Mississippi Consumer Protection Act (MCPA); also cited as the Mississippi Unfair and Deceptive Practices Act or the Mississippi Unfair Trade Practices Act
MISS. CODE ANN. §§ 75-24-1 to 75-24-27 (general provisions); MISS. CODE ANN. §§ 75-24-1 to 75-24-217 (entire act)
Missouri Merchandising Practices Act
MO. REV. STAT. §§ 407.010 to 407.309 (general provisions); MO. REV. STAT. §§ 407.010 to 407.1370 (entire act)
Montana Montana Unfair Trade Practices and Consumer Protection Act (MCPA)
Montana Code §§ 30-14-101 to 30-14-143
Nebraska Uniform Deceptive Trade Practices Act R.R.S. Neb. §§ 87-301 to 87-306 Nebraska Consumer Protection Act R.R.S. Neb. §§ 59-1601 to 59-1623
Nevada Nevada Consumer Fraud Statute
NRS § 41.600 (previously 1973 Nev. Stat. 1483) NRS § 119.330 NRS § 205.2747 NRS § 482.36655 to 482.36667 NRS § 482.351 NRS §§ 598.0903 to 598.0999
Nevada Nevada Unfair Trade Practices Act NRS § 598A.010 to 598A.280
New Hampshire New Hampshire’s Consumer Protection Act (or Regulation of Business Practices for Consumer Protection Act)
N.H. RSA §§ 358-A:1 to 358-A:13
New Jersey Consumer Fraud Act
N.J.S.A. §§ 56:8-1 to 56:8-20 (general provisions); N.J.S.A. §§ 56:8-1 to 56:8-181 (entire act)
New Mexico New Mexico’s Unfair Practices Act (UPA) N.M. Stat. Ann. §§ 57-12-1 to 57-12-26
New York New York’s Deceptive Business Acts and Practices statute (or Consumer Protection Act)
N.Y. GEN. BUS. §§ 349 to 350-f-1
North Carolina North Carolina unfair trade practices law (or Unfair and Deceptive Trade Practices Act)
N.C.G.S. §§ 75-1 to 75-42

Appendices 41
APPENDIX B (Cont.)
State Common Title Statute (as of June 2008)
North Dakota Consumer Fraud and Unlawful Credit Practices
N.D. Cent. Code §§ 51-15-01 to 51-15-11
Ohio Ohio's Consumer Sales Practices Act (CSPA)
O.R.C. §§ 1345.01 to 1345.13 (general provisions); O.R.C. §§ 1345.01 to 1345.99 (entire act)
Ohio Deceptive Trade Practices Act O.R.C. §§ 4165.01 to 4165.04
Oklahoma Oklahoma Consumer Protection Act 15 Okla. Stat. §§ 751 to 763 (general provisions); 15 Okla. Stat. §§ 751 to 1024 (entire act)
Oklahoma Deceptive Trade Practices Act 78 Okla. Stat. §§ 51 to 55 Oregon Unlawful Trade Practices Act (UTPA) ORS §§ 646.605 to 646.656
Pennsylvania Unfair Trade Practices and Consumer Protection Law (UTPCPL)
73 Pa. C.S.A. §§ 201-1 to 201-9.3
Rhode Island Rhode Island’s Unfair Trade Practice and Consumer Protection Act (UPTA)
R.I. Gen. Laws §§ 6.13.1-1 to 6.13.1-28
South Carolina South Carolina Consumer Protection Code (SCCPC)
S.C. Code Ann. §§ 37-1-101 to 37-1-303 (general provisions); S.C. Code Ann. §§ 37-1-101 to 37-25-80 (entire act)
South Carolina Unfair Trade Practices Act
S.C. Code Ann. §§ 39-5-10 to 39-5-170 (general provisions); S.C. Code Ann. §§ 39-5-10 to 39-5-560 (entire act)
South Dakota Deceptive Trade Practices and Consumer Protection Act
S.D. Codified Laws §§ 37-24-1 to 37-24-35 (general provisions); S.D. Codified Laws §§ 37-24-1 to 37-24-48 (entire act)
Tennessee The Tennessee Consumer Protection Act of 1977 (TCPA)
Tenn. Code Ann. §§ 47-18-101 to 47-18-128
Texas Texas Deceptive Trade Practices - Consumer Protection Act
Tex. Bus. & Com. Code §§ 17.41 to 17.63
Utah Utah's Consumer Sales Practices Act (UCSPA)
Utah Code Ann. §§ 13-11-1 to 13-11-23
Vermont Vermont Consumer Fraud Act (VCFA) 9 V.S.A. §§ 2451 to 2466a (general provisions); 9 V.S.A. §§ 2451 to 2480n (entire act)
Virginia Consumer Protection Law Va. Code Ann. §§ 59.1-196 to 59.1-207
Virginia No title Va. Code Ann. §§ 18.2-214 and 18.2-216 and 18.2-240 and 18.2-245
Virginia No title Va. Code Ann. § 59.1-68.3
Washington The Washington Consumer Protection Act
RCW §§ 19.86.010 to 19.86.920

Consumer Protection Acts and Costs to Consumers 42
APPENDIX B (Cont.)
State Common Title Statute (as of June 2008)
West Virginia The West Virginia Consumer Credit and Protection Act
West Virginia Code §§ 46A-1-101 to 46A-1-108 and 46A-6-101 to 46A-6-110 (general provisions); West Virginia Code §§ 46A-1-101 to 46A-8-102 (entire act)
Wisconsin "Fraudulent Representations" Statute (Deceptive Trade Practices Act)
Wis. Stat. §§ 100.18(1) to 100.18(12)(b)
Wisconsin "Methods of Competition and Trade Practices" (Unfair Trade Practices Statues)
Wis. Stat. §§ 100.20(1) to 100.20(6)
Wisconsin Wisconsin Consumer Act Wis. Stat. §§ 421 to 427
Wyoming Wyoming Consumer Protection Act Wyo. Stat. Ann. §§ 40-12-101 to 40-12-114
Sources:
Product Liability Advisory Council
Alan S. Brown and Larry E. Hepler, Comparison of Consumer Fraud Statutes Across the 50 States, 55 FDCC QUARTERLY 263 (2005).
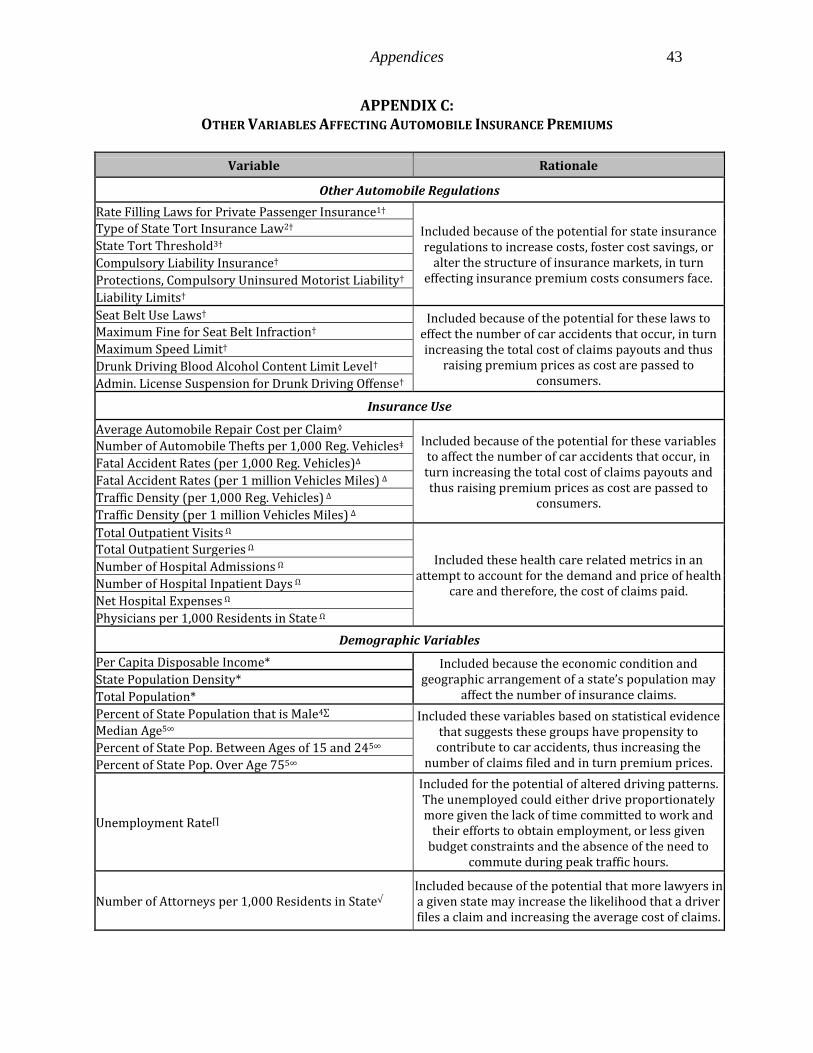
Appendices 43
APPENDIX C: OTHER VARIABLES AFFECTING AUTOMOBILE INSURANCE PREMIUMS
Variable Rationale
Other Automobile Regulations
Rate Filling Laws for Private Passenger Insurance1†
Included because of the potential for state insurance regulations to increase costs, foster cost savings, or
alter the structure of insurance markets, in turn effecting insurance premium costs consumers face.
Type of State Tort Insurance Law2†
State Tort Threshold3†
Compulsory Liability Insurance†
Protections, Compulsory Uninsured Motorist Liability†
Liability Limits†
Seat Belt Use Laws† Included because of the potential for these laws to effect the number of car accidents that occur, in turn increasing the total cost of claims payouts and thus
raising premium prices as cost are passed to consumers.
Maximum Fine for Seat Belt Infraction†
Maximum Speed Limit†
Drunk Driving Blood Alcohol Content Limit Level†
Admin. License Suspension for Drunk Driving Offense†
Insurance Use
Average Automobile Repair Cost per Claim◊
Included because of the potential for these variables to affect the number of car accidents that occur, in turn increasing the total cost of claims payouts and thus raising premium prices as cost are passed to
consumers.
Number of Automobile Thefts per 1,000 Reg. Vehicles‡
Fatal Accident Rates (per 1,000 Reg. Vehicles)∆
Fatal Accident Rates (per 1 million Vehicles Miles) ∆
Traffic Density (per 1,000 Reg. Vehicles) ∆
Traffic Density (per 1 million Vehicles Miles) ∆
Total Outpatient Visits Ω
Included these health care related metrics in an attempt to account for the demand and price of health
care and therefore, the cost of claims paid.
Total Outpatient Surgeries Ω
Number of Hospital Admissions Ω
Number of Hospital Inpatient Days Ω
Net Hospital Expenses Ω
Physicians per 1,000 Residents in State Ω
Demographic Variables
Per Capita Disposable Income* Included because the economic condition and geographic arrangement of a state’s population may
affect the number of insurance claims. State Population Density*
Total Population*
Percent of State Population that is Male4∑ Included these variables based on statistical evidence that suggests these groups have propensity to contribute to car accidents, thus increasing the
number of claims filed and in turn premium prices.
Median Age5∞
Percent of State Pop. Between Ages of 15 and 245∞
Percent of State Pop. Over Age 755∞
Unemployment Rate∏
Included for the potential of altered driving patterns. The unemployed could either drive proportionately more given the lack of time committed to work and
their efforts to obtain employment, or less given budget constraints and the absence of the need to
commute during peak traffic hours.
Number of Attorneys per 1,000 Residents in State√ Included because of the potential that more lawyers in a given state may increase the likelihood that a driver files a claim and increasing the average cost of claims.
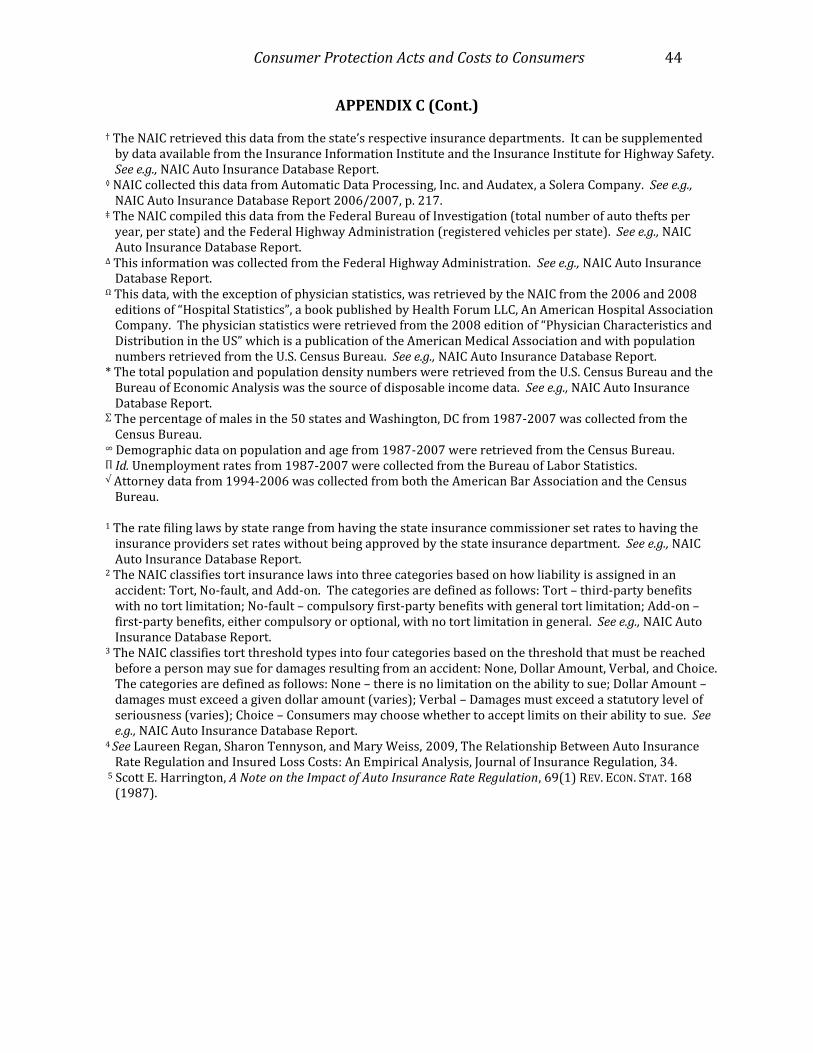
Consumer Protection Acts and Costs to Consumers 44
APPENDIX C (Cont.) † The NAIC retrieved this data from the state’s respective insurance departments. It can be supplemented
by data available from the Insurance Information Institute and the Insurance Institute for Highway Safety. See e.g., NAIC Auto Insurance Database Report.
◊ NAIC collected this data from Automatic Data Processing, Inc. and Audatex, a Solera Company. See e.g., NAIC Auto Insurance Database Report 2006/2007, p. 217.
‡ The NAIC compiled this data from the Federal Bureau of Investigation (total number of auto thefts per year, per state) and the Federal Highway Administration (registered vehicles per state). See e.g., NAIC Auto Insurance Database Report.
∆ This information was collected from the Federal Highway Administration. See e.g., NAIC Auto Insurance Database Report.
Ω This data, with the exception of physician statistics, was retrieved by the NAIC from the 2006 and 2008 editions of “Hospital Statistics”, a book published by Health Forum LLC, An American Hospital Association Company. The physician statistics were retrieved from the 2008 edition of “Physician Characteristics and Distribution in the US” which is a publication of the American Medical Association and with population numbers retrieved from the U.S. Census Bureau. See e.g., NAIC Auto Insurance Database Report.
* The total population and population density numbers were retrieved from the U.S. Census Bureau and the Bureau of Economic Analysis was the source of disposable income data. See e.g., NAIC Auto Insurance Database Report.
∑ The percentage of males in the 50 states and Washington, DC from 1987-2007 was collected from the Census Bureau.
∞ Demographic data on population and age from 1987-2007 were retrieved from the Census Bureau. ∏ Id. Unemployment rates from 1987-2007 were collected from the Bureau of Labor Statistics. √ Attorney data from 1994-2006 was collected from both the American Bar Association and the Census
Bureau. 1 The rate filing laws by state range from having the state insurance commissioner set rates to having the
insurance providers set rates without being approved by the state insurance department. See e.g., NAIC Auto Insurance Database Report.
2 The NAIC classifies tort insurance laws into three categories based on how liability is assigned in an accident: Tort, No-fault, and Add-on. The categories are defined as follows: Tort – third-party benefits with no tort limitation; No-fault – compulsory first-party benefits with general tort limitation; Add-on – first-party benefits, either compulsory or optional, with no tort limitation in general. See e.g., NAIC Auto Insurance Database Report.
3 The NAIC classifies tort threshold types into four categories based on the threshold that must be reached before a person may sue for damages resulting from an accident: None, Dollar Amount, Verbal, and Choice. The categories are defined as follows: None – there is no limitation on the ability to sue; Dollar Amount – damages must exceed a given dollar amount (varies); Verbal – Damages must exceed a statutory level of seriousness (varies); Choice – Consumers may choose whether to accept limits on their ability to sue. See e.g., NAIC Auto Insurance Database Report.
4 See Laureen Regan, Sharon Tennyson, and Mary Weiss, 2009, The Relationship Between Auto Insurance Rate Regulation and Insured Loss Costs: An Empirical Analysis, Journal of Insurance Regulation, 34.
5 Scott E. Harrington, A Note on the Impact of Auto Insurance Rate Regulation, 69(1) REV. ECON. STAT. 168 (1987).

Appendices 45
APPENDIX D: DESCRIPTIVE STATISTICS FOR KEY CONTROL VARIABLES