Embed Size (px)
Citation preview

Washington State Superintendent of Public Instruction
S-275 Personnel Reporting
& Its Role in School (K–12) Funding
prepared for
WASBO - October 28, 2015
Ross Bunda – Supervisor, Personnel Reporting (360) 725-6308 – [email protected]

Topics
Overview of K-12 Funding & S-275 Reporting Staff Mix Staff Ratios Salary Compliance Other Topics?
DISCLAIMER – This is a simplified presentation on K–12 funding and S-275 reporting in Washington State, for overview purposes only. Specific authoritative references and details are contained in statute and rules and may not be fully represented here.
2

K–12 Funding Relationship
WA
State (OSPI)
School District (300+) Apportions $$
General Apportionment (Basic Education Allocation)
Categorical Funding
Reports Data Pupils (P-223) Staff (S-275) Financial (F-195, F-196, etc.)
3

Terms Used in State Reporting of School Data:
Staff ~ Personnel ~ Employees (example: S-275) o Certificated instructional staff (CIS) - teachers, counselors, etc. o Certificated administrative staff (CAS) - principals, etc. o Classified staff (CLS) - custodians, bus drivers, etc. - Districts report persons (actual staffing), not positions. - State funds positions (allocated staffing levels), not persons.
Pupils ~ Students ~ Enrollment (example: P-223)
Revenue ~ Funding ~ Allocation ~ Apportionment ~ $$
school districts receive, from state and other sources (examples: F-203, Report 1191)
Expenditures ~ Costs ~ $$ school districts give, to
employees and other entities (example: F-196)
4
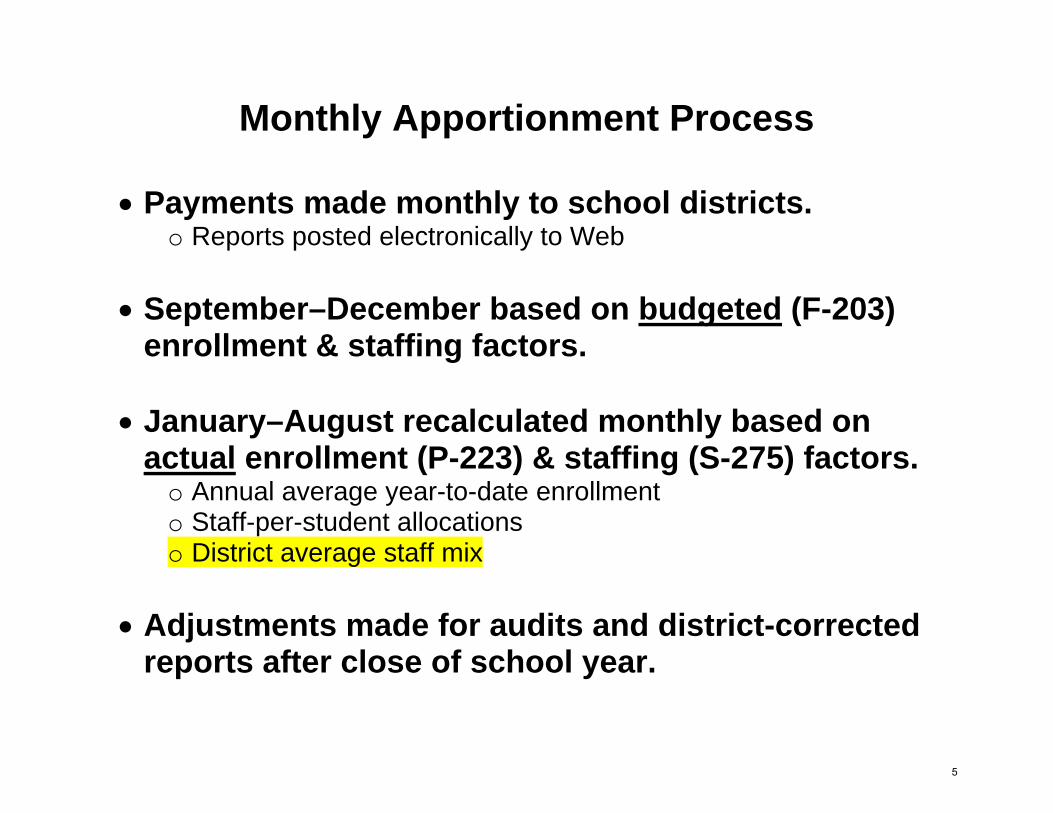
Monthly Apportionment Process
Payments made monthly to school districts. o Reports posted electronically to Web
September–December based on budgeted (F-203)
enrollment & staffing factors. January–August recalculated monthly based on
actual enrollment (P-223) & staffing (S-275) factors. o Annual average year-to-date enrollment o Staff-per-student allocations o District average staff mix
Adjustments made for audits and district-corrected
reports after close of school year.
5
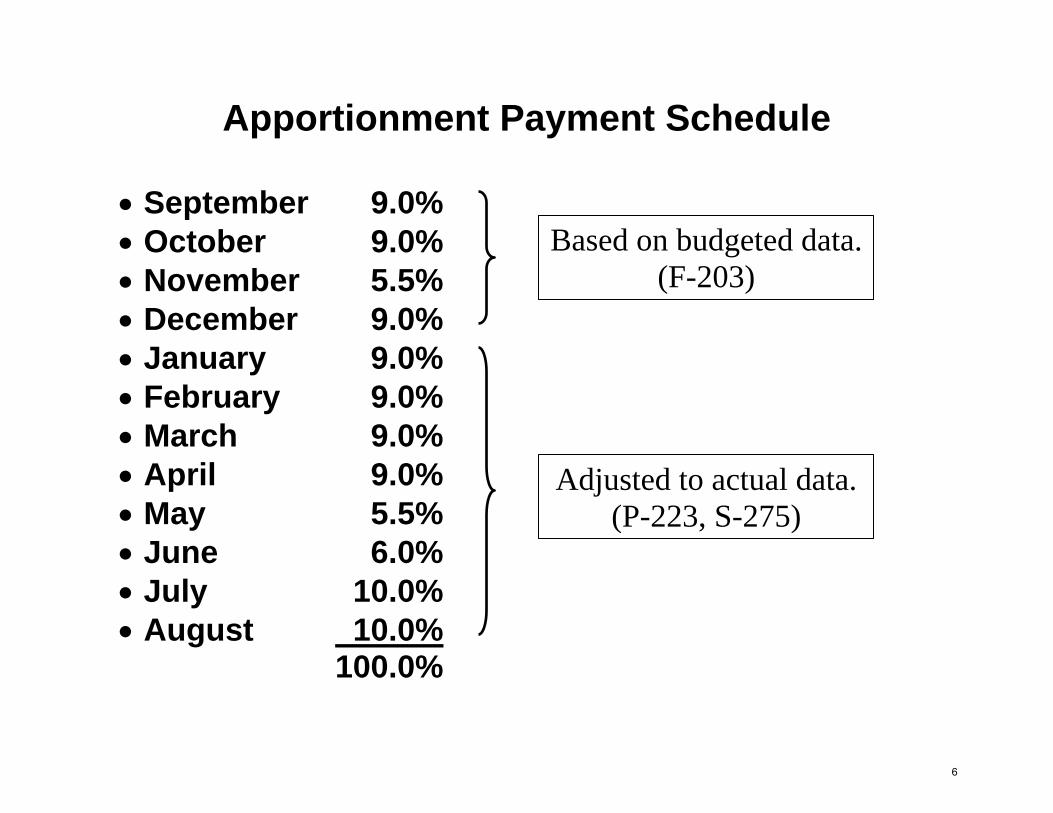
Apportionment Payment Schedule • September 9.0% • October 9.0% • November 5.5% • December 9.0% • January 9.0% • February 9.0% • March 9.0% • April 9.0% • May 5.5% • June 6.0% • July 10.0% • August 10.0%
100.0%
Based on budgeted data. (F-203)
Adjusted to actual data. (P-223, S-275)
6

S-275 Personnel Report
Electronic personnel reporting process developed during late 1970’s.
Provides yearly record [census] of WA school personnel:
o Certificated & classified staff (130,000 employees) o School districts (300+) & educational service districts (9)
Data is used:
o To calculate apportionment/allocations to school districts: Staff mix Staff ratio Salary compliance
o For research, analysis, & policy development
7

I.H. When to Report The reporting schedule below is intended as a guide to help districts in planning submission of data to OSPI. Except for the initial submission date, the target dates are not mandatory reporting dates. Rather they represent significant dates when accurate and complete information must be available to OSPI for statistical reports, legislative requests, and school apportionment. October 1 remains the only snapshot date. Complete this three-step process prior to each target date after November 1:
Step 1. Submit any updates or corrections to the October 1 data. Step 2. Review all edit exceptions for errors (see Appendix B). Step 3. As necessary, resubmit corrections identified in step 2.
Schedule of Reporting Target DatesOctober 1, 2014 The snapshot date for all staff.November 1–26, 2014 Initial data submission period for the S-275 reporting process. November 26, 2014 All initial S-275 data due to OSPI on or before this date.December 31, 2014 Corrections to edit exceptions so that snapshot data are complete and accurate.January 16, 2015 OSPI calculates monthly apportionment using data received as of this date. February 13, 2015 OSPI calculates monthly apportionment using data received as of this date. March 17, 2015 OSPI calculates monthly apportionment using data received as of this date. April 16, 2015 OSPI calculates monthly apportionment using data received as of this date. May 15, 2015 OSPI calculates monthly apportionment using data received as of this date. June 16, 2015 OSPI calculates monthly apportionment using data received as of this date. July 17, 2015 OSPI calculates monthly apportionment using data received as of this date. August 17, 2015 OSPI calculates monthly apportionment using data received as of this date. August 31, 2015 Final district updates to current items. Note that this is the date on which Item C.4,
Total Final Salary, is based. September 30, 2015 Final corrections to edit exceptions so that all snapshot and current data are complete
and accurate. Submit final data prior to 5 p.m., September 30, 2015, for entry into the 2014–15 S-275 personnel files located at OSPI.
Failure to submit data by November 26, 2014, and correct edit exceptions by December 31, 2014, may result in reduction or delay of state apportionment pursuant to chapter 392-117 WAC. Missing or incorrect data will impact staffing calculations (for example, staff mix) used for state funding.
8

MAR BEAMix1
cou dis district name Budget Jan-15 Feb-15 Mar-15 Apr-15 May-15 Jun-15 Jul-15 Aug-15 2014-15 FTE21 014 Napavine 1.58963 1.59457 1.59457 1.59457 1.59457 1.59457 1.59457 1.59457 1.59457 1.59457 45.10021 036 Evaline 1.39085 1.24800 1.24800 1.24800 1.24800 1.24800 1.24800 1.24800 1.24800 1.24800 2.00021 206 Mossyrock 1.57205 1.56036 1.56036 1.56036 1.56036 1.56036 1.56036 1.56036 1.56036 1.56036 33.50021 214 Morton 1.49562 1.47664 1.47664 1.47664 1.47664 1.47664 1.47664 1.47664 1.47664 1.47642 18.48421 226 Adna 1.67955 1.65198 1.65198 1.65198 1.65198 1.65198 1.65198 1.65198 1.65198 1.65198 31.50321 232 Winlock 1.65590 1.60465 1.60465 1.60465 1.60465 1.60465 1.60465 1.60465 1.60465 1.60465 37.22821 234 Boistfort 1.38075 1.44832 1.44832 1.44832 1.44832 1.44832 1.44832 1.44832 1.44832 1.44832 6.67021 237 Toledo 1.68332 1.62489 1.62489 1.62489 1.62489 1.62489 1.62489 1.62489 1.62489 1.62756 41.00021 300 Onalaska 1.50000 1.52767 1.52767 1.52767 1.52767 1.52767 1.52767 1.52767 1.52767 1.52767 44.38321 301 Pe Ell 1.66970 1.66970 1.66970 1.66970 1.66970 1.66970 1.66970 1.66970 1.66970 1.66970 21.00021 302 Chehalis 1.60000 1.58117 1.58117 1.58117 1.58117 1.58117 1.58117 1.58117 1.58117 1.58117 163.08921 303 White Pass 1.52972 1.56403 1.56403 1.56403 1.56403 1.56403 1.56403 1.56403 1.56403 1.56403 26.56721 401 Centralia 1.58104 1.56017 1.56017 1.56017 1.56017 1.56017 1.56017 1.56017 1.56017 1.55896 203.41922 008 Sprague 1.35878 1.40339 1.40339 1.40339 1.40339 1.40339 1.40339 1.40339 1.40339 1.40339 9.31322 009 Reardan-Edwall 1.63642 1.65220 1.65220 1.65220 1.65220 1.65220 1.65220 1.65220 1.65220 1.65220 35.71422 017 Almira 1.64531 1.64529 1.64529 1.64529 1.64529 1.64529 1.64529 1.64529 1.64529 1.64529 10.50122 073 Creston 1.68153 1.67739 1.67739 1.67739 1.67739 1.67739 1.67739 1.67739 1.67739 1.67739 14.00022 105 Odessa 1.78219 1.74605 1.74605 1.74605 1.74605 1.74605 1.74605 1.74605 1.74605 1.74635 17.42522 200 Wilbur 1.67437 1.67142 1.67142 1.67142 1.67142 1.67142 1.67142 1.67142 1.67142 1.67142 21.19522 204 Harrington 1.56428 1.55618 1.55618 1.55618 1.55618 1.55618 1.55618 1.55618 1.55618 1.55618 12.27222 207 Davenport 1.62763 1.62501 1.62501 1.62501 1.62501 1.62501 1.62501 1.62501 1.62501 1.62771 35.95723 042 Southside 1.50886 1.50928 1.50928 1.50928 1.50928 1.50928 1.50928 1.50928 1.50928 1.50928 10.00027 001 Steilacoom Hist. 1.53947 1.52253 1.52253 1.52253 1.52253 1.52253 1.52253 1.52253 1.52253 1.52351 175.66027 003 Puyallup 1.60007 1.58403 1.58403 1.57977 1.57977 1.57977 1.57977 1.57977 1.57977 1.58037 1,244.74427 010 Tacoma 1.56033 1.54832 1.54832 1.54832 1.54815 1.55108 1.55086 1.55086 1.55086 1.55153 1,934.08427 019 Carbonado 1.66220 1.57274 1.57274 1.57274 1.57274 1.57274 1.57274 1.57274 1.57274 1.57274 11.50027 083 University Place 1.60524 1.59539 1.59539 1.59539 1.59568 1.59568 1.59568 1.59568 1.59568 1.59568 338.29527 320 Sumner 1.57624 1.57025 1.57045 1.57045 1.57045 1.57045 1.57045 1.57045 1.57045 1.57150 516.62527 343 Dieringer 1.54675 1.64184 1.64184 1.64184 1.64184 1.64184 1.64184 1.64184 1.64184 1.64400 87.50027 344 Orting 1.52543 1.53621 1.53621 1.53621 1.53621 1.53621 1.53621 1.53621 1.53621 1.53621 130.37827 400 Clover Park 1.49612 1.49855 1.49836 1.50088 1.49847 1.49847 1.49846 1.49697 1.49697 1.49621 838.35727 401 Peninsula 1.61500 1.62199 1.62199 1.62199 1.62199 1.62199 1.62199 1.62199 1.62199 1.62189 511.15027 402 Franklin Pierce 1.49068 1.47541 1.47408 1.47408 1.47408 1.47379 1.47379 1.47379 1.47379 1.47408 503.85727 403 Bethel 1.54000 1.52831 1.52831 1.52831 1.52831 1.52831 1.52831 1.52831 1.52831 1.52801 1,088.09427 404 Eatonville 1.60780 1.55834 1.55834 1.55834 1.55834 1.56242 1.56254 1.56254 1.56254 1.55892 98.45727 416 White River 1.63772 1.61743 1.61743 1.61743 1.61589 1.61589 1.61589 1.61589 1.61589 1.61918 199.573
OSPI/SAFS9

MAR BEAMix1
cou dis district name Jan-15 Feb-15 Mar-15 Apr-15 May-15 Jun-15 Jul-15 Aug-15 2014-15 FTE21 014 Napavine 0.00494 45.10021 036 Evaline (0.14285) 2.00021 206 Mossyrock (0.01169) 33.50021 214 Morton (0.01898) (0.00022) 18.48421 226 Adna (0.02757) 31.50321 232 Winlock (0.05125) 37.22821 234 Boistfort 0.06757 6.67021 237 Toledo (0.05843) 0.00267 41.00021 300 Onalaska 0.02767 44.38321 301 Pe Ell 21.00021 302 Chehalis (0.01883) 163.08921 303 White Pass 0.03431 26.56721 401 Centralia (0.02087) (0.00121) 203.41922 008 Sprague 0.04461 9.31322 009 Reardan-Edwall 0.01578 35.71422 017 Almira (0.00002) 10.50122 073 Creston (0.00414) 14.00022 105 Odessa (0.03614) 0.00030 17.42522 200 Wilbur (0.00295) 21.19522 204 Harrington (0.00810) 12.27222 207 Davenport (0.00262) 0.00270 35.95723 042 Southside 0.00042 10.00027 001 Steilacoom Hist. (0.01694) 0.00098 175.66027 003 Puyallup (0.01604) (0.00426) 0.00060 1,244.74427 010 Tacoma (0.01201) (0.00017) 0.00293 (0.00022) 0.00067 1,934.08427 019 Carbonado (0.08946) 11.50027 083 University Place (0.00985) 0.00029 338.29527 320 Sumner (0.00599) 0.00020 0.00105 516.62527 343 Dieringer 0.09509 0.00216 87.50027 344 Orting 0.01078 130.37827 400 Clover Park 0.00243 (0.00019) 0.00252 (0.00241) (0.00001) (0.00149) (0.00076) 838.35727 401 Peninsula 0.00699 (0.00010) 511.15027 402 Franklin Pierce (0.01527) (0.00133) (0.00029) 0.00029 503.85727 403 Bethel (0.01169) (0.00030) 1,088.09427 404 Eatonville (0.04946) 0.00408 0.00012 (0.00362) 98.45727 416 White River (0.02029) (0.00154) 0.00329 199.573
OSPI/SAFS10

Staff Mix
Staff mix = numerical value of education & experience. o Between 1.00000 (BA+0 & 0 yrs) – 1.88482 (MA+90 & 16+ yrs)
Which staff are included in the district-wide avg staff mix?
o CIS (duty roots 31–49, & 63–64)* o Excludes staff in duty roots:
11–25 all certificated admin staff (CAS) 51 extracuricular 52 substitute teacher 61 certificated on leave 9x all classified staff (CLS)
*In all programs except institutional education, programs 26, 56, & 59 (220-day school year).
11

Report S275 State of Washington Page 1 of 1
Superintendent of Public Instruction 8:32:28 AM
7/15/2015Certificated Personnel for School Year 2014-2015
Mill A School District (30031)
NOBLE CHERIE ANNE
M 2011 72.0 0.0 0.0 0.0 0.0 B 7.00 180.0
1.000 0.000
43885 43885
18353 8314
1.28891
3 3406 01-27-310 6 200 252.00 8777 11/21/2014
4 3406 01-27-320 M 400 504.00 17554 11/21/2014
1 3406 01-27-310 4 200 252.00 8777 11/21/2014
2 3406 01-27-310 5 200 252.00 8777 11/21/2014
WHITLOCK KATHY BOURNE
M 2008 0.0 0.0 0.0 0.0 0.0 B 8.00 260.0
0.200 0.000
19437 19437
0 3958 1.19891 1 3406 97-12-110 E 1000 416.00 19437 11/21/2014
MACNAB LENA M
M 2005 0.0 0.6 0.0 0.0 6.5 C 7.00 180.0
1.000 0.000
44440 44440
18187 8415
1.30517
3 3406 01-27-310 3 250 315.00 11110 11/21/2014
4 3406 01-27-310 K 250 315.00 11110 11/21/2014
1 3406 01-27-310 1 250 315.00 11110 11/21/2014
2 3406 01-27-310 2 250 315.00 11110 11/21/2014
SSN & NameDeg Type
& YearAcad Cred
InServ
CredExc Cred
NonDg
CredYrs Exp
CBRT Code
Full Hrs & Days
FTE Cert & Clas
Salary Final & Base
Benefit Ins & Mand LEAP 1 Rec Bldg PP-AA-DDD Grade Pct Hrs/Yr Salary Updated
Mandatory Benefits 20,687 9,403
Total Final Salary 107,762 48,983
Insurance Benefits 36,540 16,609
Assignment Salary 107,762 48,983
FTE 2.20000
Staff LEAP1 Mix 2.83386 1.28812
Certificated Total
Certificated Average
12
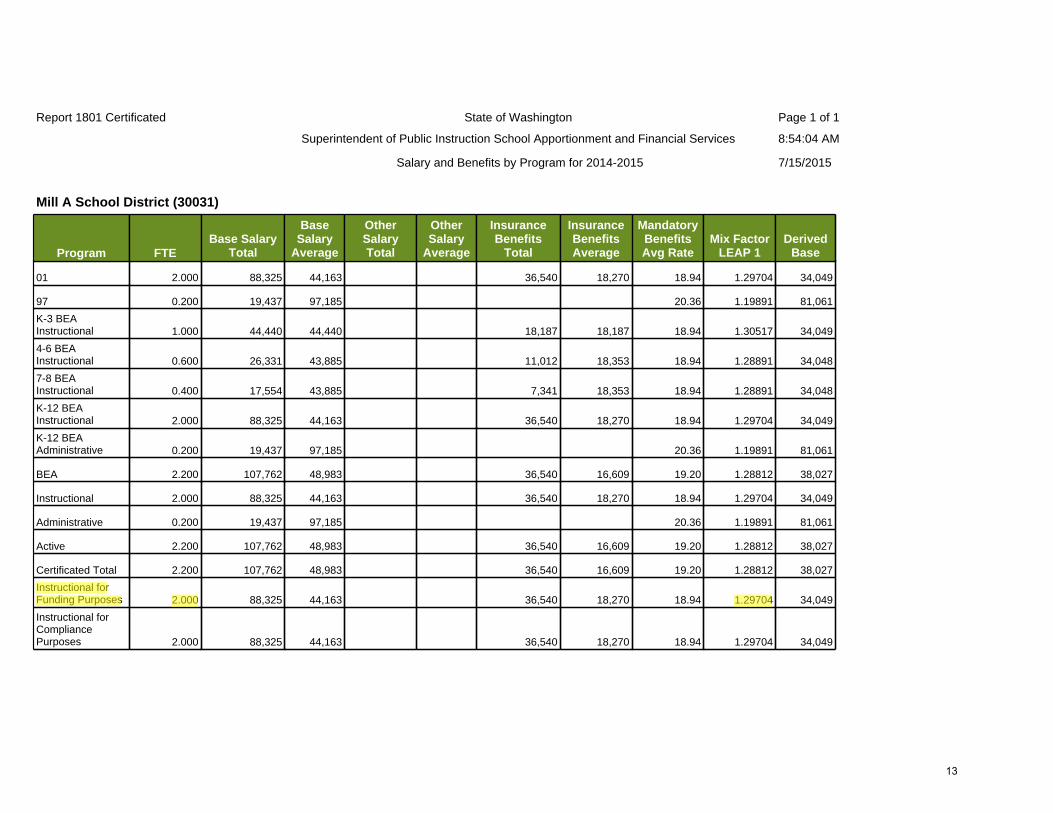
Report 1801 Certificated State of Washington Page 1 of 1
Superintendent of Public Instruction School Apportionment and Financial Services 8:54:04 AM
7/15/2015 Salary and Benefits by Program for 2014-2015
Instructional 2.000 88,325 44,163 36,540 18,270 18.94 1.29704 34,049
BEA 2.200 107,762 48,983 36,540 16,609 19.20 1.28812 38,027
Instructional for Compliance Purposes 2.000 88,325 44,163 36,540 18,270 18.94 1.29704 34,049
Administrative 0.200 19,437 97,185 20.36 1.19891 81,061
Instructional for Funding Purposes 2.000 88,325 44,163 36,540 18,270 18.94 1.29704 34,049
Certificated Total 2.200 107,762 48,983 36,540 16,609 19.20 1.28812 38,027
Active 2.200 107,762 48,983 36,540 16,609 19.20 1.28812 38,027
97 0.200 19,437 97,185 20.36 1.19891 81,061
01 2.000 88,325 44,163 36,540 18,270 18.94 1.29704 34,049
K-12 BEA Administrative 0.200 19,437 97,185 20.36 1.19891 81,061
K-3 BEA Instructional 1.000 44,440 44,440 18,187 18,187 18.94 1.30517 34,049
K-12 BEA Instructional 2.000 88,325 44,163 36,540 18,270 18.94 1.29704 34,049
7-8 BEA Instructional 0.400 17,554 43,885 7,341 18,353 18.94 1.28891 34,048
4-6 BEA Instructional 0.600 26,331 43,885 11,012 18,353 18.94 1.28891 34,048
Program FTEBase Salary
Total
Base Salary
Average
Other Salary Total
Other Salary
Average
Insurance Benefits
Total
Insurance Benefits Average
Mandatory Benefits Avg Rate
Mix Factor LEAP 1
Derived Base
Mill A School District (30031)
13
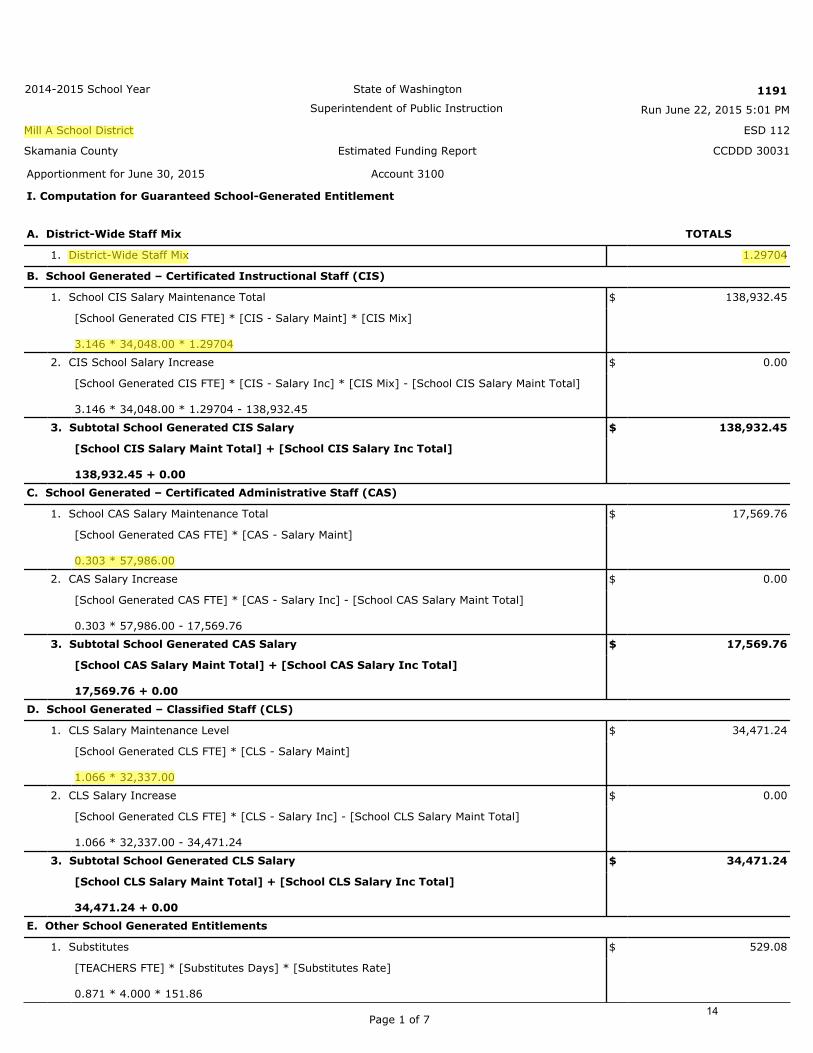
State of Washington
Superintendent of Public Instruction Run June 22, 2015 5:01 PM
Estimated Funding Report CCDDD 30031
ESD 112Mill A School District
Skamania County
2014-2015 School Year
Apportionment for June 30, 2015
1191
Account 3100
I. Computation for Guaranteed School-Generated Entitlement
A. District-Wide Staff Mix TOTALS
1. District-Wide Staff Mix 1.29704
B. School Generated – Certificated Instructional Staff (CIS)
1. School CIS Salary Maintenance Total $ 138,932.45
[School Generated CIS FTE] * [CIS - Salary Maint] * [CIS Mix]
3.146 * 34,048.00 * 1.29704
2. CIS School Salary Increase $ 0.00
[School Generated CIS FTE] * [CIS - Salary Inc] * [CIS Mix] - [School CIS Salary Maint Total]
3.146 * 34,048.00 * 1.29704 - 138,932.45
3. Subtotal School Generated CIS Salary $ 138,932.45
[School CIS Salary Maint Total] + [School CIS Salary Inc Total]
138,932.45 + 0.00C. School Generated – Certificated Administrative Staff (CAS)
1. School CAS Salary Maintenance Total $ 17,569.76
[School Generated CAS FTE] * [CAS - Salary Maint]
0.303 * 57,986.00
2. CAS Salary Increase $ 0.00
[School Generated CAS FTE] * [CAS - Salary Inc] - [School CAS Salary Maint Total]
0.303 * 57,986.00 - 17,569.76
3. Subtotal School Generated CAS Salary $ 17,569.76
[School CAS Salary Maint Total] + [School CAS Salary Inc Total]
17,569.76 + 0.00
D. School Generated – Classified Staff (CLS)
1. CLS Salary Maintenance Level $ 34,471.24
[School Generated CLS FTE] * [CLS - Salary Maint]
1.066 * 32,337.00
2. CLS Salary Increase $ 0.00
[School Generated CLS FTE] * [CLS - Salary Inc] - [School CLS Salary Maint Total]
1.066 * 32,337.00 - 34,471.24
3. Subtotal School Generated CLS Salary $ 34,471.24
[School CLS Salary Maint Total] + [School CLS Salary Inc Total]
34,471.24 + 0.00E. Other School Generated Entitlements
1. Substitutes $ 529.08
[TEACHERS FTE] * [Substitutes Days] * [Substitutes Rate]
0.871 * 4.000 * 151.86
Page 1 of 714

Legislative Final 2015-17 Omnibus Operating BudgetLEAP Document 2 Date: June 28, 2015
Time: 08:06 hours
Derived Base Salary Salary Allocations Salary AllocationsAllocations For For Certificated For
Certificated Instructional Staff Administrative Staff Classified StaffSchool District 2014-15 2015-16 2016-17 2014-15 2015-16 2016-17 2014-15 2015-16 2016-17 28 137 Orcas Island 34,048 35,069 35,700 57,986 59,726 60,801 31,949 32,907 33,499 28 144 Lopez Island 34,417 35,450 36,088 62,762 64,645 65,809 31,865 32,821 33,412 28 149 San Juan Island 34,048 35,069 35,700 61,424 63,267 64,406 31,865 32,821 33,412 29 011 Concrete 34,048 35,069 35,700 63,854 65,770 66,954 31,865 32,821 33,412 29 100 Burlington-Edison 34,048 35,069 35,700 58,695 60,456 61,544 31,865 32,821 33,412 29 101 Sedro-Woolley 34,048 35,069 35,700 57,986 59,726 60,801 31,962 32,921 33,514 29 103 Anacortes 34,048 35,069 35,700 59,811 61,605 62,714 31,865 32,821 33,412 29 311 La Conner 34,048 35,069 35,700 65,753 67,726 68,945 31,865 32,821 33,412 29 317 Conway 34,048 35,069 35,700 62,653 64,533 65,695 31,865 32,821 33,412 29 320 Mount Vernon 34,048 35,069 35,700 57,986 59,726 60,801 31,865 32,821 33,412 30 002 Skamania 34,048 35,069 35,700 73,130 75,324 76,680 33,930 34,948 35,577 30 029 Mount Pleasant 34,048 35,069 35,700 57,986 59,726 60,801 35,213 36,269 36,922 30 031 Mill A 34,048 35,069 35,700 57,986 59,726 60,801 32,337 33,307 33,907 30 303 Stevenson-Carson 34,048 35,069 35,700 58,725 60,487 61,576 31,865 32,821 33,412 31 002 Everett 35,737 36,809 37,472 62,536 64,412 65,571 33,539 34,545 35,167 31 004 Lake Stevens 34,048 35,069 35,700 64,822 66,767 67,969 31,865 32,821 33,412 31 006 Mukilteo 34,454 35,488 36,127 61,326 63,166 64,303 31,865 32,821 33,412 31 015 Edmonds 34,048 35,069 35,700 60,403 62,215 63,335 31,865 32,821 33,412 31 016 Arlington 34,048 35,069 35,700 58,653 60,413 61,500 31,865 32,821 33,412 31 025 Marysville 35,359 36,420 37,076 58,169 59,914 60,992 31,865 32,821 33,412 31 063 Index 34,048 35,069 35,700 57,986 59,726 60,801 31,865 32,821 33,412 31 103 Monroe 34,048 35,069 35,700 60,406 62,218 63,338 31,865 32,821 33,412 31 201 Snohomish 34,048 35,069 35,700 61,664 63,514 64,657 31,865 32,821 33,412 31 306 Lakewood 34,048 35,069 35,700 57,986 59,726 60,801 31,865 32,821 33,412 31 311 Sultan 34,048 35,069 35,700 57,986 59,726 60,801 31,865 32,821 33,412 31 330 Darrington 34,048 35,069 35,700 67,586 69,614 70,867 31,865 32,821 33,412 31 332 Granite Falls 34,048 35,069 35,700 58,099 59,842 60,919 31,865 32,821 33,412 31 401 Stanwood 34,048 35,069 35,700 57,986 59,726 60,801 31,865 32,821 33,412 32 081 Spokane 34,048 35,069 35,700 57,986 59,726 60,801 31,865 32,821 33,412 32 123 Orchard Prairie 34,048 35,069 35,700 57,986 59,726 60,801 31,865 32,821 33,412 32 312 Great Northern 34,048 35,069 35,700 57,986 59,726 60,801 31,865 32,821 33,412 32 325 Nine Mile Falls 34,048 35,069 35,700 63,998 65,918 67,105 31,865 32,821 33,412 32 326 Medical Lake 34,048 35,069 35,700 57,986 59,726 60,801 31,865 32,821 33,412 32 354 Mead 34,048 35,069 35,700 57,986 59,726 60,801 31,865 32,821 33,412 32 356 Central Valley 34,048 35,069 35,700 57,986 59,726 60,801 32,206 33,172 33,769 32 358 Freeman 34,048 35,069 35,700 57,986 59,726 60,801 31,919 32,877 33,469 32 360 Cheney 34,048 35,069 35,700 59,525 61,311 62,415 31,865 32,821 33,412 32 361 East Valley (Spokane) 34,048 35,069 35,700 57,986 59,726 60,801 31,865 32,821 33,412
LEAP Document 2 is referenced in the Legislative Final 2015-17 Omnibus Operating Budget. Page 6 of 815
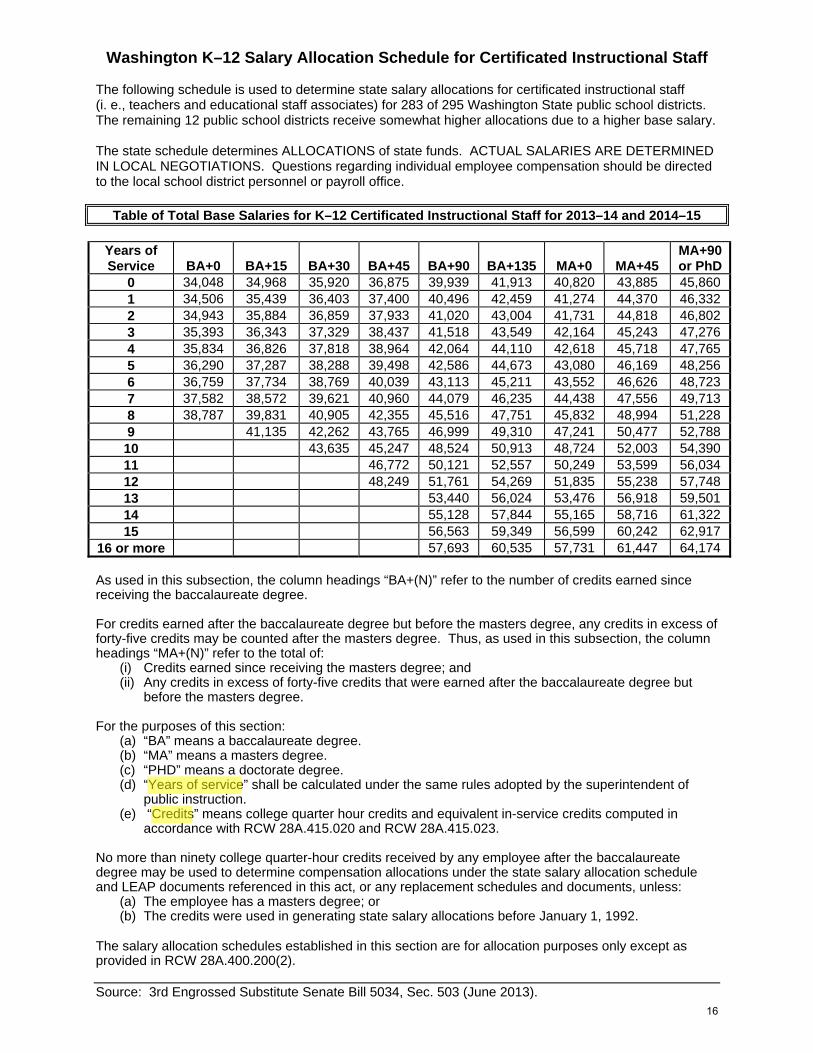
Washington K–12 Salary Allocation Schedule for Certificated Instructional Staff The following schedule is used to determine state salary allocations for certificated instructional staff (i. e., teachers and educational staff associates) for 283 of 295 Washington State public school districts. The remaining 12 public school districts receive somewhat higher allocations due to a higher base salary. The state schedule determines ALLOCATIONS of state funds. ACTUAL SALARIES ARE DETERMINED IN LOCAL NEGOTIATIONS. Questions regarding individual employee compensation should be directed to the local school district personnel or payroll office.
Table of Total Base Salaries for K–12 Certificated Instructional Staff for 2013–14 and 2014–15
Years of Service
BA+0
BA+15
BA+30
BA+45
BA+90
BA+135
MA+0
MA+45
MA+90 or PhD
0 34,048 34,968 35,920 36,875 39,939 41,913 40,820 43,885 45,860 1 34,506 35,439 36,403 37,400 40,496 42,459 41,274 44,370 46,332 2 34,943 35,884 36,859 37,933 41,020 43,004 41,731 44,818 46,802 3 35,393 36,343 37,329 38,437 41,518 43,549 42,164 45,243 47,276 4 35,834 36,826 37,818 38,964 42,064 44,110 42,618 45,718 47,765 5 36,290 37,287 38,288 39,498 42,586 44,673 43,080 46,169 48,256 6 36,759 37,734 38,769 40,039 43,113 45,211 43,552 46,626 48,723 7 37,582 38,572 39,621 40,960 44,079 46,235 44,438 47,556 49,713 8 38,787 39,831 40,905 42,355 45,516 47,751 45,832 48,994 51,228 9 41,135 42,262 43,765 46,999 49,310 47,241 50,477 52,788 10 43,635 45,247 48,524 50,913 48,724 52,003 54,390 11 46,772 50,121 52,557 50,249 53,599 56,034 12 48,249 51,761 54,269 51,835 55,238 57,748 13 53,440 56,024 53,476 56,918 59,501 14 55,128 57,844 55,165 58,716 61,322 15 56,563 59,349 56,599 60,242 62,917
16 or more 57,693 60,535 57,731 61,447 64,174 As used in this subsection, the column headings “BA+(N)” refer to the number of credits earned since receiving the baccalaureate degree. For credits earned after the baccalaureate degree but before the masters degree, any credits in excess of forty-five credits may be counted after the masters degree. Thus, as used in this subsection, the column headings “MA+(N)” refer to the total of:
(i) Credits earned since receiving the masters degree; and (ii) Any credits in excess of forty-five credits that were earned after the baccalaureate degree but
before the masters degree. For the purposes of this section:
(a) “BA” means a baccalaureate degree. (b) “MA” means a masters degree. (c) “PHD” means a doctorate degree. (d) “Years of service” shall be calculated under the same rules adopted by the superintendent of
public instruction. (e) “Credits” means college quarter hour credits and equivalent in-service credits computed in
accordance with RCW 28A.415.020 and RCW 28A.415.023. No more than ninety college quarter-hour credits received by any employee after the baccalaureate degree may be used to determine compensation allocations under the state salary allocation schedule and LEAP documents referenced in this act, or any replacement schedules and documents, unless:
(a) The employee has a masters degree; or (b) The credits were used in generating state salary allocations before January 1, 1992.
The salary allocation schedules established in this section are for allocation purposes only except as provided in RCW 28A.400.200(2). Source: 3rd Engrossed Substitute Senate Bill 5034, Sec. 503 (June 2013).
16

Written Guidance
Revised Code of Washington (RCW) - statutory laws enacted by the state legislature.
o Title 28A RCW, Common School (K–12 public school) Provisions Washington Administrative Code (WAC) - policies,
rules, and regulations adopted by state agencies in carrying out state law.
o Title 392 WAC, Rules and Regulations of OSPI WAC 392-121-200 through -299, General apportionment of state
moneys for certificated instructional staff o Title 181 WAC, Rules and Regulations of the PESB
Certification for school personnel, CTE certification, continuing education requirement (getting & maintaining cert.)
S-275 Personnel Reporting Instructions
o Section II B, State LEAP Placement Information
17

Staff Ratio
K–12 staff ratio = FTE staff / FTE students * 1000. o Must be at least 46/1000 (Chapter 392-127 WAC).
Which staff are included in the K–12 ratio calculation?
o CIS FTE (duty roots 31–49 & 63–64) in Grades K–12 in basic education (programs 01, 31, 34, 45, & 97).
o Plus a %* of CIS FTE in special education (program 21) in K–12. o Students & staff in ALE (program 02) are excluded (since 2011).
Staff FTE from S-275. Student FTE from P-223 (& Form 1160 to select different
enrollment month—see ABFRH & S-275 instructions).
* % is shown on Report 1159, line B.7 (for 2014–15). Also, see OSPI/SAFS website for 2015–16 Budget Preparations, Special Education Percentage for Revenue 3121 Calculation for 2015–16.
18

REPORT 1251 STATE OF WASHINGTONSUPERINTENDENT OF PUBLIC INSTRUCTION
RUN JUL 15, 2015 @ 09:38
SUMMARY OF FULL-TIME EQUIVALENT ENROLLMENT AS REPORTED ON FORM P223 FOR SCHOOL YEAR ENDING 2015
GRADES 9-12 406.76 405.51 404.33 409.87 407.37 401.39 399.38 398.87 397.87 395.87 402.72
GRADES 7-8 195.77 196.50 200.50 201.50 201.00 205.00 207.00 205.00 205.00 204.00 202.13
GRADES 5-6 227.00 228.00 228.00 227.00 226.00 228.00 230.00 234.00 234.00 232.00 229.40
GRADE 4 91.00 91.00 92.00 92.00 92.00 92.00 93.00 94.00 92.00 92.00 92.10
GRADES 1-3 279.00 280.00 278.00 282.00 281.00 280.00 279.00 279.00 279.00 274.00 279.10
KINDERGARTEN 97.00 97.00 93.00 93.00 92.00 91.00 93.00 94.00 93.00 93.00 93.60
*** TOTALS 1,296.53 1,298.01 1,295.83 1,305.37 1,299.37 1,297.39 1,301.38 1,304.87 1,300.87 1,290.87 1,299.05
THIRD 102.00 103.00 103.00 105.00 104.00 104.00 103.00 105.00 107.00 102.00 103.80
SECOND 82.00 82.00 83.00 84.00 84.00 84.00 84.00 85.00 83.00 83.00 83.40
FIRST 95.00 95.00 92.00 93.00 93.00 92.00 92.00 89.00 89.00 89.00 91.90
FULL-DY. 97.00 97.00 93.00 93.00 92.00 91.00 93.00 94.00 93.00 93.00 93.60
*** TOTALS 376.00 377.00 371.00 375.00 373.00 371.00 372.00 373.00 372.00 367.00 372.70
Eligible High Poverty School Enrollment
GRADES SEPTEMBER OCTOBER NOVEMBER DECEMBER JANUARY FEBRUARY MARCH APRIL MAY JUNE AVERAGE
Zillah S.D. No. 205 Yakima County No. 39 E.S.D. 105
TWELFTH 91.66 90.47 88.77 89.71 89.71 87.97 87.21 87.46 87.46 87.46 88.79
ELEVENTH 87.63 88.57 87.09 90.65 90.15 89.15 88.90 88.90 88.90 88.90 88.88
TENTH 112.00 111.00 112.00 112.51 111.51 108.51 108.27 108.51 108.51 107.51 110.03
NINTH 115.47 115.47 116.47 117.00 116.00 115.76 115.00 114.00 113.00 112.00 115.02
EIGHTH 99.77 100.50 101.50 101.50 101.00 104.00 104.00 103.00 103.00 103.00 102.13
SEVENTH 96.00 96.00 99.00 100.00 100.00 101.00 103.00 102.00 102.00 101.00 100.00
SIXTH 120.00 119.00 119.00 119.00 118.00 117.00 118.00 120.00 120.00 119.00 118.90
FIFTH 107.00 109.00 109.00 108.00 108.00 111.00 112.00 114.00 114.00 113.00 110.50
FOURTH 91.00 91.00 92.00 92.00 92.00 92.00 93.00 94.00 92.00 92.00 92.10
THIRD 102.00 103.00 103.00 105.00 104.00 104.00 103.00 105.00 107.00 102.00 103.80
SECOND 82.00 82.00 83.00 84.00 84.00 84.00 84.00 85.00 83.00 83.00 83.40
FIRST 95.00 95.00 92.00 93.00 93.00 92.00 92.00 89.00 89.00 89.00 91.90
FULL-DY. 97.00 97.00 93.00 93.00 92.00 91.00 93.00 94.00 93.00 93.00 93.60
Total K-12 Basic Education Enrollment
GRADES SEPTEMBER OCTOBER NOVEMBER DECEMBER JANUARY FEBRUARY MARCH APRIL MAY JUNE AVERAGE
*** TOTALS
GRADES SEPTEMBER OCTOBER NOVEMBER DECEMBER JANUARY FEBRUARY MARCH APRIL MAY JUNE AVERAGE
Total ALE Enrollment
19

Report 1801 Certificated State of Washington Page 1 of 2
Superintendent of Public Instruction School Apportionment and Financial Services 9:39:09 AM
7/15/2015 Salary and Benefits by Program for 2014-2015
K-12 Program 21 Instructional 4.950 286,502 57,879 9,983 2,017 39,005 7,880 17.59 1.69992 34,048
31 2.450 134,828 55,032 9,622 3,927 23,186 9,464 18.63 1.52279 36,139
24 1.000 48,249 48,249 1,340 1,340 10,238 10,238 18.78 1.41708 34,048
52 0.750 44,037 58,716 5,990 7,986 18.66 1.72451 34,048
51 23,410
01 66.400 3,826,561 57,629 94,676 1,426 637,663 9,603 18.65 1.61216 35,746
Program 21 Administrative 0.400 35,681 89,203 5,659 14,147 18.46 1.34610 66,267
22 0.250 17,580 70,320 2,030 8,120 18.77 1.55578 45,199
21 5.350 322,183 60,221 9,983 1,866 44,664 8,348 17.68 1.67347 35,986
55 1.500 64,278 42,852 55,145 36,763 12,287 8,191 18.87 1.25857 34,048
97 0.750 97,500 130,000 14,840 19,787 14,531 19,374 16.91 1.69557 76,670
79 1.000 59,500 59,500 136,658 136,658 10,238 10,238 18.58 1.74756 34,047
Program 21 Instructional 4.950 286,502 57,879 9,983 2,017 39,005 7,880 17.59 1.69992 34,048
99 0.250 32,500 130,000 6,000 24,000 4,844 19,374 16.91 1.69557 76,670
65 1.000 64,176 64,176 8,916 8,916 18.61 1.88482 34,049
64 21,572
71 12,000
69 1.000 46,569 46,569 9,848 9,848 18.79 1.36773 34,048
Program FTEBase Salary
Total
Base Salary
Average
Other Salary Total
Other Salary
Average
Insurance Benefits
Total
Insurance Benefits Average
Mandatory Benefits Avg Rate
Mix Factor LEAP 1
Derived Base
Zillah School District (39205)
20

Report 1801 Certificated State of Washington Page 2 of 2
Superintendent of Public Instruction School Apportionment and Financial Services 9:39:09 AM
7/15/2015 Salary and Benefits by Program for 2014-2015
7-8 BEA Instructional 11.900 612,065 51,434 8,636 726 111,502 9,370 18.71 1.51064 34,048
4-6 BEA Instructional 15.742 816,969 51,897 6,097 387 147,418 9,365 18.72 1.52400 34,053
K-12 BEA Instructional 64.350 3,510,491 54,553 79,983 1,243 598,732 9,304 18.68 1.60224 34,048
9-12 BEA Instructional 19.000 1,083,619 57,033 54,836 2,886 179,183 9,431 18.62 1.67507 34,048
Program 31 Instructional 2.300 118,367 51,464 9,622 4,183 21,295 9,259 18.65 1.51152 34,048
K-3 BEA Instructional 17.708 997,838 56,350 10,414 588 160,629 9,071 18.69 1.65522 34,044
Program 31 Administrative 0.150 16,461 109,740 1,890 12,602 18.38 1.69557 64,722
K-12 BEA Administrative 4.500 450,898 100,200 11,585 2,574 62,117 13,804 18.41 1.70525 58,759
On Leave 14,840
Active 81.700 4,757,961 58,237 370,406 4,534 784,432 9,601 18.54 1.60850 36,206
Instructional for Funding Purposes 75.700 4,132,462 54,590 340,091 4,493 695,868 9,192 18.61 1.60333 34,048
Certificated Total 81.700 4,757,961 58,237 385,246 4,715 784,432 9,601 18.54 1.60850 36,206
Instructional 75.700 4,132,462 54,590 340,091 4,493 695,868 9,192 18.61 1.60333 34,048
BEA 69.600 4,058,889 58,317 119,138 1,712 675,379 9,704 18.60 1.60991 36,224
Other 12,730
Administrative 6.000 625,499 104,250 17,585 2,931 88,564 14,761 18.07 1.67371 62,287
Instructional for Compliance Purposes 75.700 4,132,462 54,590 340,091 4,493 695,868 9,192 18.61 1.60333 34,048
Program FTEBase Salary
Total
Base Salary
Average
Other Salary Total
Other Salary
Average
Insurance Benefits
Total
Insurance Benefits Average
Mandatory Benefits Avg Rate
Mix Factor LEAP 1
Derived Base
21

Report 1159(R) 09-Jun-1508:47 AM
State of Washington Superintendent of Public Instruction
Calculation of 2014-15 Certificated Instructional Staff Ratio 39205 Zillah School District
>>>> Base Data as Reported by the District <<<< Grades K-12A. Full-Time Equivalent (FTE) Student Enrollment for Selected Month: 1. October 2014 or month selected on Form SPI 1160 October 2014 2. K-12 FTE students (less Running Start) from Report P-223 1,298.01 3. K-12 FTE students in Alternative Learning Experience (ALE) 4. K-12 FTE students less ALE [A.2 - A.3] 1,298.01
B. FTE Certificated Instructional Staff (CIS) in Basic Education: 1. K-12 FTE CIS in basic education from Report S-275 64.350 2. K-12 FTE CIS in ALE (program 02) from Report S-275 3. K-12 FTE CIS in basic education less ALE [B.1 - B.2] 64.350 4. K-12 FTE CIS in basic education from Form SPI 1158 5. K-12 FTE CIS in special education from Report S-275 4.950 6. K-12 FTE CIS in special education from Form SPI 1158 7. K-12 FTE CIS in special education % to basic education 28.69% 8. Total K-12 FTE CIS [B.3 + B.4 + ((B.5 + B.6) * B.7)] 65.770
>>>> Calculation of K-12 Ratio Compliance <<<<
C. Calculated Basic Education CIS Ratio [B.8 / A.4 * 1000] 50.67
D. Did the district maintain the statutory ratio of 46 Basic Education CIS per 1000 Students in K-12? Yes 1. If "No," K-12 ratio shortfall [46.00 - C] 2. Penalty Basic Education CIS FTE [D.1 * A.2 / 1000] ---
==========Rules governing K-12 ratio compliance are codified in Chapter 392-127 WAC.
22

Report 1159(R) 23-Jan-1512:36 PM
State of Washington Superintendent of Public Instruction
Calculation of 2014-15 Certificated Instructional Staff Ratio 36402 Prescott School District
>>>> Base Data as Reported by the District <<<< Grades K-12A. Full-Time Equivalent (FTE) Student Enrollment for Selected Month: 1. October 2014 or month selected on Form SPI 1160 October 2014 2. K-12 FTE students (less Running Start) from Report P-223 336.75 3. K-12 FTE students in Alternative Learning Experience (ALE) 4. K-12 FTE students less ALE [A.2 - A.3] 336.75
B. FTE Certificated Instructional Staff (CIS) in Basic Education: 1. K-12 FTE CIS in basic education from Report S-275 15.000 2. K-12 FTE CIS in ALE (program 02) from Report S-275 3. K-12 FTE CIS in basic education less ALE [B.1 - B.2] 15.000 4. K-12 FTE CIS in basic education from Form SPI 1158 5. K-12 FTE CIS in special education from Report S-275 1.000 6. K-12 FTE CIS in special education from Form SPI 1158 7. K-12 FTE CIS in special education % to basic education 17.32% 8. Total K-12 FTE CIS [B.3 + B.4 + ((B.5 + B.6) * B.7)] 15.173
>>>> Calculation of K-12 Ratio Compliance <<<<
C. Calculated Basic Education CIS Ratio [B.8 / A.4 * 1000] 45.06
D. Did the district maintain the statutory ratio of 46 Basic Education CIS per 1000 Students in K-12? No 1. If "No," K-12 ratio shortfall [46.00 - C] 0.94 2. Penalty Basic Education CIS FTE [D.1 * A.2 / 1000] 0.317
==========Rules governing K-12 ratio compliance are codified in Chapter 392-127 WAC.
23

II. District Staffing Data
A. Funding Reduction Staff Units 0.317
B. Learning Improvement Days (LID) pursuant to WAC 392-140-961 0.00
C. LEAP 2 Base Salary (Previous Year) $ 34,048.00
D. Allocated CIS Base Salary (Previous Year) $ 34,048.00
E. LEAP 2 Base Salary (Current Year) $ 34,048.00
F. Allocated CIS Base Salary (Current Year) $ 34,048.00
G. Greater of Actual or Minimum Allocated K-3 CIS Ratio 49.000
H. Greater of Actual or Minimum Allocated 4 CIS Ratio 46.000
III. Formulated Staffing Units
A. School Generated
1. Principals 1.061
[Principal Elem FTE] + [Principal Middle FTE] + [Principal High FTE]
0.608 + 0.152 + 0.301
2. Classroom Teachers 15.324
[Teachers Elem FTE] + [Teachers Middle FTE] + [Teachers High FTE] + [Lab Science FTE]
9.116 + 2.044 + 4.017 + 0.147
3. Teacher Librarians 0.464
[Librarian Elem FTE] + [Librarian Middle FTE] + [Librarian High FTE]
0.322 + 0.058 + 0.084
4. Guidance Counselors 0.783
[Counselor Elem FTE] + [Counselor Middle FTE] + [Counselor High FTE]
0.239 + 0.137 + 0.407
5. Health And Social Services
a. School Nurses 0.059
[Nurses Elem FTE] + [Nurses Middle FTE] + [Nurses High FTE]
0.037 + 0.007 + 0.015
b. Social Workers 0.023
[Social Workers Elem FTE] + [Social Workers Middle FTE] + [Social Workers High FTE]
0.020 + 0.001 + 0.002
c. Psychologists 0.009
[Psychologists Elem FTE] + [Psychologists Middle FTE] + [Psychologists High FTE]
0.008 + 0.000 + 0.001
6. Teaching Assistance 0.638
[Teach Assist Elem FTE] + [Teach Assist Middle FTE] + [Teach Assist High FTE]
0.454 + 0.079 + 0.105
7. Office Support 1.763
[School Office Elem FTE] + [School Office Middle FTE] + [School Office High FTE]
0.977 + 0.262 + 0.524
8. Custodians 1.497
[Custodians Elem FTE] + [Custodians Middle FTE] + [Custodians High FTE]
0.804 + 0.218 + 0.475
9. Student & Staff Safety 0.071Page 2 of 7
1191ED
Run January 26, 2015 5:42 PM
TOTALS
24

[Security Elem FTE] + [Security Middle FTE] + [Security High FTE]
0.038 + 0.010 + 0.023
10. Family Involvement Coordinators 0.040
[Family Involve Elem FTE] + [Family Involve Middle FTE] + [Family Involve High FTE]
0.040 + 0.000 + 0.000
11. Total School Generated Staffing Units 21.415
[Principal FTE] + [Teachers FTE] + [Librarian FTE] + [Counselor FTE] + [Nurses FTE] + [Social Workers FTE] + [Psychologist FTE] + [Teaching Assist FTE] + [School Office FTE] + [Custodians FTE] + [Security FTE] + [Family Involve FTE] - [Staff Unit Reduction]
1.061 + 15.324 + 0.464 + 0.783 + 0.059 + 0.023 + 0.009 + 0.638 + 1.763 + 1.497 + 0.071 + 0.040 - 0.317
B. District Wide Support
1. Technology 0.213
([Enroll Total] - [Enroll 7-8 CTE] - [Enroll CTE/Skills 9-12]) * [Technology] / [Proto Enroll District]
(339.01 - 0.00 - 0.00) * 0.628 / 1,000.00
2. Facilities, Maintenance, Grounds 0.615
([Enroll Total] - [Enroll 7-8 CTE] - [Enroll CTE/Skills 9-12]) * [Facilities] / [Proto Enroll District]
(339.01 - 0.00 - 0.00) * 1.813 / 1,000.00
3. Warehouse, Laborers, Mechanics 0.113
([Enroll Total] - [Enroll 7-8 CTE] - [Enroll CTE/Skills 9-12]) * [Warehouse] / [Proto Enroll District]
(339.01 - 0.00 - 0.00) * 0.332 / 1,000.00
4. Central Administration Total 1.185
( [School Generated FTE] + [Technology FTE] + [Facilities FTE] + [Warehouse FTE] ) * [Central Admin Percent]
( 21.415 + 0.213 + 0.615 + 0.113 ) * 0.05300
a. Certificated Administrators 0.302
[Central Admin Total FTE] * [Central Admin CAS%]
1.185 * 0.25470
b. Classified Staff 0.883
[Central Admin Total FTE] * [Central Admin CLS%]
1.185 * 0.74530
Page 3 of 7
1191ED
Run January 26, 2015 5:42 PM
TOTALS
25

Report 1159(R) 18-Feb-1509:50 AM
State of Washington Superintendent of Public Instruction
Calculation of 2014-15 Certificated Instructional Staff Ratio 36402 Prescott School District
>>>> Base Data as Reported by the District <<<< Grades K-12A. Full-Time Equivalent (FTE) Student Enrollment for Selected Month: 1. October 2014 or month selected on Form SPI 1160 October 2014 2. K-12 FTE students (less Running Start) from Report P-223 336.75 3. K-12 FTE students in Alternative Learning Experience (ALE) 4. K-12 FTE students less ALE [A.2 - A.3] 336.75
B. FTE Certificated Instructional Staff (CIS) in Basic Education: 1. K-12 FTE CIS in basic education from Report S-275 15.600 2. K-12 FTE CIS in ALE (program 02) from Report S-275 3. K-12 FTE CIS in basic education less ALE [B.1 - B.2] 15.600 4. K-12 FTE CIS in basic education from Form SPI 1158 5. K-12 FTE CIS in special education from Report S-275 1.000 6. K-12 FTE CIS in special education from Form SPI 1158 7. K-12 FTE CIS in special education % to basic education 17.32% 8. Total K-12 FTE CIS [B.3 + B.4 + ((B.5 + B.6) * B.7)] 15.773
>>>> Calculation of K-12 Ratio Compliance <<<<
C. Calculated Basic Education CIS Ratio [B.8 / A.4 * 1000] 46.84
D. Did the district maintain the statutory ratio of 46 Basic Education CIS per 1000 Students in K-12? Yes 1. If "No," K-12 ratio shortfall [46.00 - C] 2. Penalty Basic Education CIS FTE [D.1 * A.2 / 1000] ---
==========Rules governing K-12 ratio compliance are codified in Chapter 392-127 WAC.
26

Salary Compliance
The current salary compliance law (RCW 28A.400.200) took effect in 1987.
A district’s actual average base salary may not exceed
the state salary allocation schedule o “A district may not pay more than the state allocates.” o CIS salaries may exceed the salary limits only by separate
contracts for additional time, responsibility, or incentives (TRI). Salary compliance applies to:
o CIS base salary (duty roots 31–49; duty suffix 0). o All programs (except institutional ed. programs 26, 56, & 59).
27

LEAP Document 1 - Table of Staff Mix Factors for Certificated Instructional Staff *** Education Experience ***
Years of MA+90 Service BA+0 BA+15 BA+30 BA+45 BA+90 BA+135 MA+0 MA+45 or PhD
0 1.00000 1.02701 1.05499 1.08304 1.17303 1.23099 1.19891 1.28891 1.34693 1 1.01346 1.04084 1.06918 1.09846 1.18939 1.24704 1.21224 1.30317 1.36079 2 1.02628 1.05393 1.08257 1.11411 1.20478 1.26303 1.22566 1.31632 1.37458 3 1.03950 1.06741 1.09636 1.12890 1.21940 1.27905 1.23838 1.32881 1.38850 4 1.05246 1.08160 1.11072 1.14439 1.23542 1.29551 1.25171 1.34274 1.40286 5 1.06585 1.09513 1.12454 1.16008 1.25077 1.31206 1.26526 1.35599 1.41728 6 1.07961 1.10825 1.13866 1.17597 1.26623 1.32785 1.27915 1.36942 1.43100 7 1.10379 1.13286 1.16367 1.20301 1.29461 1.35793 1.30517 1.39673 1.46008 8 1.13919 1.16984 1.20138 1.24398 1.33681 1.40246 1.34610 1.43896 1.50458 9 1.20814 1.24125 1.28538 1.38038 1.44826 1.38747 1.48253 1.55041
10 1.28158 1.32891 1.42517 1.49532 1.43104 1.52733 1.59744 11 1.37371 1.47207 1.54362 1.47584 1.57423 1.64574 12 1.41708 1.52023 1.59391 1.52240 1.62236 1.69607 13 1.56956 1.64544 1.57060 1.67169 1.74756 14 1.61913 1.69890 1.62022 1.72451 1.80105 15 1.66126 1.74310 1.66233 1.76934 1.84788
16 or more 1.69447 1.77794 1.69557 1.80472 1.88482
Base Salaries for Certificated Instructional Staff for 2013–14 and 2014–15 *** Education Experience ***
Years of MA+90 Service BA+0 BA+15 BA+30 BA+45 BA+90 BA+135 MA+0 MA+45 or PHD
0 34,048 34,968 35,920 36,875 39,939 41,913 40,820 43,885 45,860 1 34,506 35,439 36,403 37,400 40,496 42,459 41,274 44,370 46,332 2 34,943 35,884 36,859 37,933 41,020 43,004 41,731 44,818 46,802 3 35,393 36,343 37,329 38,437 41,518 43,549 42,164 45,243 47,276 4 35,834 36,826 37,818 38,964 42,064 44,110 42,618 45,718 47,765 5 36,290 37,287 38,288 39,498 42,586 44,673 43,080 46,169 48,256 6 36,759 37,734 38,769 40,039 43,113 45,211 43,552 46,626 48,723 7 37,582 38,572 39,621 40,960 44,079 46,235 44,438 47,556 49,713 8 38,787 39,831 40,905 42,355 45,516 47,751 45,832 48,994 51,228 9 41,135 42,262 43,765 46,999 49,310 47,241 50,477 52,788 10 43,635 45,247 48,524 50,913 48,724 52,003 54,390 11 46,772 50,121 52,557 50,249 53,599 56,034 12 48,249 51,761 54,269 51,835 55,238 57,748 13 53,440 56,024 53,476 56,918 59,501 14 55,128 57,844 55,165 58,716 61,322 15 56,563 59,349 56,599 60,242 62,917
16 or more 57,693 60,535 57,731 61,447 64,174 Source: 3rd Engrossed Substitute Senate Bill 5034, Sec. 503.
This document is used to generate revenues.
This document is used to generate expenditures.
28

Background on Salary Limits (cont.)
Many districts have adopted the state salary allocation schedule as a local salary schedule. Exceptions:
District Students Adopted State Salary
Allocation Schedule? 17-001 Seattle 50,000 No 17-405 Bellevue 19,000 No 17-411 Issaquah 18,000 No 17-414 Lake Washington 26,000 No 18-401 Central Kitsap 11,000 Migrating towards 27-010 Tacoma 28,000 No 31-002 Everett 19,000 No 31-004 Lake Stevens 8,000 No 31-006 Mukilteo 15,000 No 31-025 Marysville 11,000 No 31-201 Snohomish 10,000 No Charter & tribal schools <1,000 ?
29

Report 1803 State of Washington Page 103 of 103
Federal Way School District (17210) Superintendent of Public Instruction School Apportionment and Financial Services 12:04:50 PM
7/15/2015Certificated Instructional Staff Salary Lid Compliance for 2014-2015
Total CIS Salary 72,683,707
Total CIS FTE 1,428.11300
Average CIS Salary
Total CIS Mix
Total CIS FTE
Average CIS Mix
2,134.75111
1,428.11300
50,895
1.49481
Derived Base Salary 34,048
LEAP 2 Base Salary 34,048
Difference 0
30

Report 1803 State of Washington Page 83 of 83
Kennewick School District (03017) Superintendent of Public Instruction School Apportionment and Financial Services 12:11:21 PM
7/15/2015Certificated Instructional Staff Salary Lid Compliance for 2014-2015
Total CIS Salary 51,854,087
Total CIS FTE 979.95000
Average CIS Salary
Total CIS Mix
Total CIS FTE
Average CIS Mix
1,524.22804
979.95000
52,915
1.55541
Derived Base Salary 34,020
LEAP 2 Base Salary 34,048
Difference -28
31

Report 1803 State of Washington Page 7 of 7
Montesano School District (14066) Superintendent of Public Instruction School Apportionment and Financial Services 12:21:01 PM
7/15/2015Certificated Instructional Staff Salary Lid Compliance for 2014-2015
Total CIS Salary 4,179,755
Total CIS FTE 75.73300
Average CIS Salary
Total CIS Mix
Total CIS FTE
Average CIS Mix
122.66411
75.73300
55,191
1.61969
Derived Base Salary 34,075
LEAP 2 Base Salary 34,048
Difference 27
32

Report 1803 State of Washington Page 5 of 7
Montesano School District (14066) Superintendent of Public Instruction School Apportionment and Financial Services 12:21:01 PM
7/15/2015Certificated Instructional Staff Salary Lid Compliance for 2014-2015
CYNTHIA SHEARARD 1.88482 1.000 1.000 64,174 1.88482 34,048 64,174 180.0 0
DOUGLAS SCHUPBACH 1.88482 1.000 1.000 64,174 1.88482 34,048 64,174 180.0 0
JILL SCHRADER 1.32891 1.000 1.000 48,524 1.32891 36,514 48,524 180.0 2,466
MEGAN SCHMITZ 1.21224 0.500 0.500 20,637 0.60612 34,048 41,274 180.0 0
DAVID SADLER 1.88482 1.000 1.000 64,174 1.88482 34,048 64,174 180.0 0
DALE ROWEKAMP 1.13919 1.000 1.000 38,787 1.13919 34,048 38,787 180.0 0
DORRIE ROSSMAIER 1.88482 1.000 1.000 64,174 1.88482 34,048 64,174 180.0 0
CAROLYNE RODRIGUEZ 1.38747 1.000 1.000 47,242 1.38747 34,049 47,242 180.0 1
TIMOTHY RENO 1.80472 1.000 1.000 61,447 1.80472 34,048 61,447 180.0 0
ROGER RECORDS 1.88482 1.000 1.000 64,175 1.88482 34,048 64,175 180.0 0
KRISTA RAMSTAD 1.28158 1.000 1.000 43,636 1.28158 34,049 43,636 180.0 1
JUSTIN RAINES 1.38038 1.000 1.000 46,999 1.38038 34,048 46,999 180.0 0
BRADLEY POCKLINGTON 1.41708 1.000 1.000 48,249 1.41708 34,048 48,249 180.0 0
CORINNE PLATO 1.56956 1.000 1.000 53,440 1.56956 34,048 53,440 180.0 0
ERICA PEARSON 1.06585 1.000 1.000 36,290 1.06585 34,048 36,290 180.0 0
SSN Name MixProg-Duty Cert FTE
Assign FTE
Assign Salary
Assign Mix
Der Base Salary
Salary at 1.0 FTE
Days at 1.0 FTE
Comp In/Out
33

Why Districts May Have Compliance Issues
Compensation Plan Issues* (1) Additional base pay to attract/retain certain employees, such as
ESAs or vocational instructors. -- Put in supplemental salary? (2) Grandfathering/recognizing credits or years of experience not
recognized in state funding rules. -- Put in supplemental salary? (3) Extended days reported as part of base contract, rather than
supplemental. -- CIS should have about 180 base contract days.
Data Reporting “Challenges” (4) Miscalculating employee’s salary, FTE, or % certificated
contracted time. -- Check your math. (5) Base salary out-of-sync with degree, credits, and/or experience
reported. -- Check LEAP 1 staff mix vs. salary on Report 1803 (Comp In/Out column).
(6) CIS with CAS assignments also. -- Math challenge. *Compensation policy decisions by the employing school district.
34

Report 1803 State of Washington Page 6 of 6
Valley School District (33070) Superintendent of Public Instruction School Apportionment and Financial Services 4:12:40 PM
6/27/2014Certificated Instructional Staff Salary Lid Compliance for 2013-2014
Total CIS Salary 1,695,863
Total CIS FTE 34.39600
Average CIS Salary
Total CIS Mix
Total CIS FTE
Average CIS Mix
49.67474
34.39600
49,304
1.44420
Derived Base Salary 34,139
LEAP 2 Base Salary 34,048
Difference 91
35
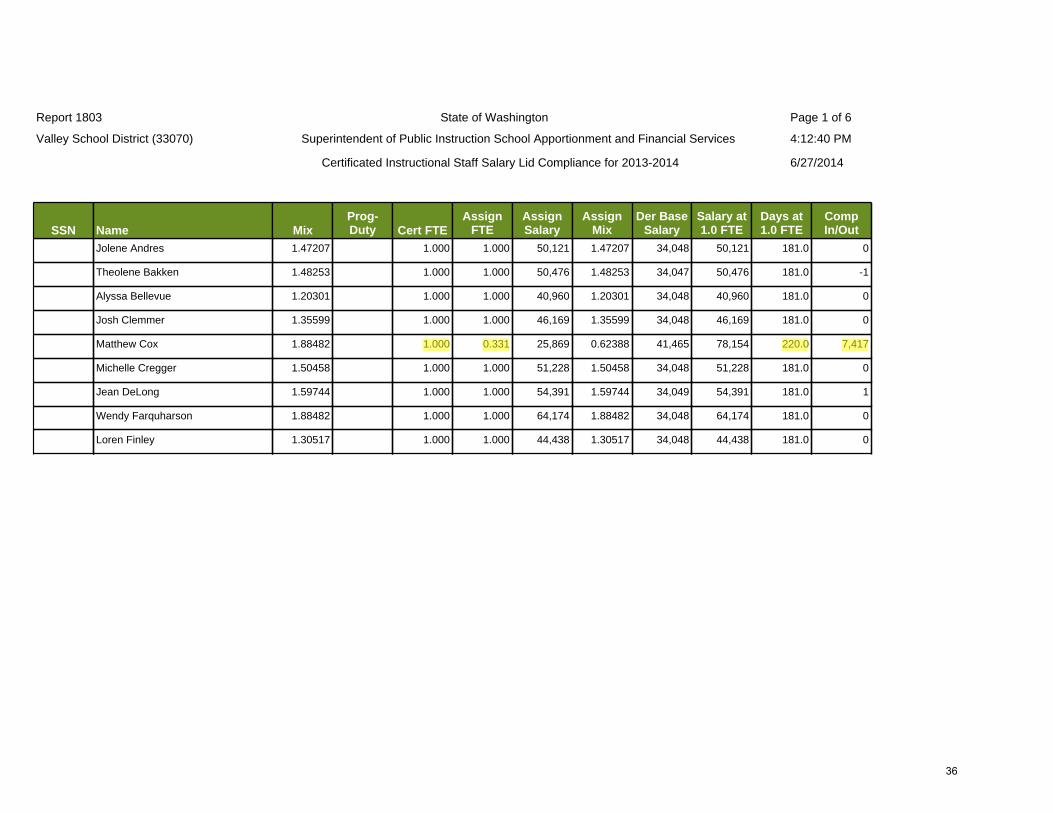
Report 1803 State of Washington Page 1 of 6
Valley School District (33070) Superintendent of Public Instruction School Apportionment and Financial Services 4:12:40 PM
6/27/2014Certificated Instructional Staff Salary Lid Compliance for 2013-2014
Loren Finley 1.30517 1.000 1.000 44,438 1.30517 34,048 44,438 181.0 0
Wendy Farquharson 1.88482 1.000 1.000 64,174 1.88482 34,048 64,174 181.0 0
Jean DeLong 1.59744 1.000 1.000 54,391 1.59744 34,049 54,391 181.0 1
Michelle Cregger 1.50458 1.000 1.000 51,228 1.50458 34,048 51,228 181.0 0
Matthew Cox 1.88482 1.000 0.331 25,869 0.62388 41,465 78,154 220.0 7,417
Josh Clemmer 1.35599 1.000 1.000 46,169 1.35599 34,048 46,169 181.0 0
Alyssa Bellevue 1.20301 1.000 1.000 40,960 1.20301 34,048 40,960 181.0 0
Theolene Bakken 1.48253 1.000 1.000 50,476 1.48253 34,047 50,476 181.0 -1
Jolene Andres 1.47207 1.000 1.000 50,121 1.47207 34,048 50,121 181.0 0
SSN Name MixProg-Duty Cert FTE
Assign FTE
Assign Salary
Assign Mix
Der Base Salary
Salary at 1.0 FTE
Days at 1.0 FTE
Comp In/Out
36

Report S275 State of Washington Page 1 of 8
Superintendent of Public Instruction 4:10:45 PM
6/27/2014Certificated Personnel for School Year 2013-2014
Valley School District (33070)
Bellevue Alyssa Carbonetti
B 1999 52.0 29.6 0.0 0.0 7.2 C 8.00 181.0
1.000 0.000
40960 40960
9976 9323
1.20301
2 2405 55-27-310 1 200 289.60 8192 12/06/2013
1 2405 01-27-310 1 800 1158.40 32768 12/06/2013
Clemmer Josh R
M 2007 0.0 32.1 17.3 0.0 5.3 C 8.00 181.0
1.000 0.000
49419 46169
9656 10849
1.35599
4 2405 01-28-321 0 0.00 50 12/06/2013
5 2405 01-28-321 0 0.00 1600 12/06/2013
3 2405 01-28-321 0 0.00 1600 12/06/2013
1 2405 01-27-310 F 400 579.20 18468 12/06/2013
2 2405 01-27-320 M 600 868.80 27701 12/06/2013
Cox Matthew Hans
M 1999 43.5 19.2 30.1 0.0 20.0 C 8.00 220.0
1.000 0.000
78155 78155
9976 16035
1.88482
2 5223 01-27-320 H 331 582.56 25869 12/06/2013
1 5223 01-23-230 H 669 1177.44 52286 12/06/2013
Andres Jolene J.
B 1981 90.0 20.9 0.0 0.0 10.6 C 8.00 181.0
1.000 0.000
50171 50121
1903 10985
1.47207
3 2405 01-28-511 0 0.00 50 12/06/2013
4 2405 51-27-320 410 593.68 20550 12/06/2013
1 2405 01-27-310 F 118 170.86 5914 12/06/2013
2 2405 01-27-320 M 472 683.45 23657 12/06/2013
Bakken Theolene O
M 1990 4.5 18.1 28.0 0.0 9.3 C 8.00 181.0
1.000 0.000
50476 50476
9976 11040
1.48253
4 1932 02-27-320 M 451 653.04 22765 12/06/2013
5 2405 02-27-310 F 239 346.07 12064 12/06/2013
3 1932 02-27-310 K 70 101.36 3533 12/06/2013
1 1932 02-27-310 1 70 101.36 3533 12/06/2013
2 1932 02-27-310 E 170 246.16 8581 12/06/2013
SSN & NameDeg Type
& YearAcad Cred
InServ
CredExc Cred
NonDg
CredYrs Exp
CBRT Code
Full Hrs & Days
FTE Cert & Clas
Salary Final & Base
Benefit Ins & Mand LEAP 1 Rec Bldg PP-AA-DDD Grade Pct Hrs/Yr Salary Updated
37

- CIS base salary (duty codes 310–490) is regulated by salary compliance law, while CAS base salary (duty codes 110–250) is not.
- Therefore, (1) first make the CIS base salary comply: Multiply the employee's staff mix * district LEAP 2 CIS allocation * assignment FTE (cert FTE * assignment %).
- Then, (2) distribute remaining base salary to CAS assignment(s).
EmployeeEducation & Experience
LEAP 1 Staff Mix
(LEAP 2 Allocation)
Hrs per Day
Days per Year
Cert FTE
Cert Base Salary
PP-AA-DDD Grd
Assign Pct Hrs/Yr
Assgn Salary
Matthew Cox MA+90 & 16+ yrs 1.88482 - 8.00 220.0 1.000 78,155 01-23-230 66.9 1,177.44 52,286(as shown) 01-27-320 H 33.1 582.56 25,869
100.0 1,760.00 78,155
Matthew Cox MA+90 & 16+ yrs 1.88482 34,048 8.00 220.0 1.000 78,155 01-23-230 66.9 1,177.44 56,913(should be) 01-27-320 H 33.1 582.56 21,242
100.0 1,760.00 78,155
(1) Matthew Cox's CIS base salary should be: staff mix * LEAP 2 allocation * assgn FTE = 1.88482 * $34,048 * 0.331 FTE = $21,242
(2) Matthew Cox's CAS base salary should be: cert base salary - CIS base salary = $78,155 - $21,242 = $56,913
How to Distribute Salary to Avoid Compliance ProblemsWhen an Employee Has both CIS & CAS Assignments
38

Report S275 State of Washington Page 1 of 8
Superintendent of Public Instruction 4:52:49 PM
6/27/2014Certificated Personnel for School Year 2013-2014
Valley School District (33070)
Bellevue Alyssa Carbonetti
B 1999 52.0 29.6 0.0 0.0 7.2 C 8.00 181.0
1.000 0.000
40960 40960
9976 9323
1.20301
2 2405 55-27-310 1 200 289.60 8192 12/06/2013
1 2405 01-27-310 1 800 1158.40 32768 12/06/2013
Clemmer Josh R
M 2007 0.0 32.1 17.3 0.0 5.3 C 8.00 181.0
1.000 0.000
49419 46169
9656 10849
1.35599
4 2405 01-28-321 0 0.00 50 12/06/2013
5 2405 01-28-321 0 0.00 1600 12/06/2013
3 2405 01-28-321 0 0.00 1600 12/06/2013
1 2405 01-27-310 F 400 579.20 18468 12/06/2013
2 2405 01-27-320 M 600 868.80 27701 12/06/2013
COX MATTHEW HANS
M 1999 43.5 19.2 30.1 0.0 20.0 C 8.00 220.0
1.000 0.000
78155 78155
9976 16035
1.88482
2 5223 01-27-320 H 331 582.56 21242 06/27/2014
1 5223 01-23-230 H 669 1177.44 56913 06/27/2014
Andres Jolene J.
B 1981 90.0 20.9 0.0 0.0 10.6 C 8.00 181.0
1.000 0.000
50171 50121
1903 10985
1.47207
3 2405 01-28-511 0 0.00 50 12/06/2013
4 2405 51-27-320 410 593.68 20550 12/06/2013
1 2405 01-27-310 F 118 170.86 5914 12/06/2013
2 2405 01-27-320 M 472 683.45 23657 12/06/2013
Bakken Theolene O
M 1990 4.5 18.1 28.0 0.0 9.3 C 8.00 181.0
1.000 0.000
50476 50476
9976 11040
1.48253
4 1932 02-27-320 M 451 653.04 22765 12/06/2013
5 2405 02-27-310 F 239 346.07 12064 12/06/2013
3 1932 02-27-310 K 70 101.36 3533 12/06/2013
1 1932 02-27-310 1 70 101.36 3533 12/06/2013
2 1932 02-27-310 E 170 246.16 8581 12/06/2013
SSN & NameDeg Type
& YearAcad Cred
InServ
CredExc Cred
NonDg
CredYrs Exp
CBRT Code
Full Hrs & Days
FTE Cert & Clas
Salary Final & Base
Benefit Ins & Mand LEAP 1 Rec Bldg PP-AA-DDD Grade Pct Hrs/Yr Salary Updated
39

Report 1803 State of Washington Page 1 of 6
Valley School District (33070) Superintendent of Public Instruction School Apportionment and Financial Services 4:57:31 PM
6/27/2014Certificated Instructional Staff Salary Lid Compliance for 2013-2014
Loren Finley 1.30517 1.000 1.000 44,438 1.30517 34,048 44,438 181.0 0
Wendy Farquharson 1.88482 1.000 1.000 64,174 1.88482 34,048 64,174 181.0 0
Jean DeLong 1.59744 1.000 1.000 54,391 1.59744 34,049 54,391 181.0 1
Michelle Cregger 1.50458 1.000 1.000 51,228 1.50458 34,048 51,228 181.0 0
MATTHEW COX 1.88482 1.000 0.331 21,242 0.62388 34,048 64,175 220.0 0
Josh Clemmer 1.35599 1.000 1.000 46,169 1.35599 34,048 46,169 181.0 0
Alyssa Bellevue 1.20301 1.000 1.000 40,960 1.20301 34,048 40,960 181.0 0
Theolene Bakken 1.48253 1.000 1.000 50,476 1.48253 34,047 50,476 181.0 -1
Jolene Andres 1.47207 1.000 1.000 50,121 1.47207 34,048 50,121 181.0 0
SSN Name MixProg-Duty Cert FTE
Assign FTE
Assign Salary
Assign Mix
Der Base Salary
Salary at 1.0 FTE
Days at 1.0 FTE
Comp In/Out
40

Report 1803 State of Washington Page 6 of 6
Valley School District (33070) Superintendent of Public Instruction School Apportionment and Financial Services 4:57:31 PM
6/27/2014Certificated Instructional Staff Salary Lid Compliance for 2013-2014
Total CIS Salary 1,691,236
Total CIS FTE 34.39600
Average CIS Salary
Total CIS Mix
Total CIS FTE
Average CIS Mix
49.67474
34.39600
49,170
1.44420
Derived Base Salary 34,047
LEAP 2 Base Salary 34,048
Difference -1
41

K–1 Funded Class Size for 2014–15
K–1 funded class size for high poverty schools. o Schools eligible per 10/1/2013 CEDARS student poverty data. o Schools are funded based on demonstrated class size in K–1.
Minimum of 20.3 students per teacher. Maximum of 24.1 students per teacher. (“Non” high poverty schools = 25.23 students per teacher.)
o Teacher FTE in grade group codes “K” & “1” from S-275. In programs 01 & 79, and % of program 21. Duty roots 31, 33, 52, & 63.
o Student FTE from 10/1/2014 CEDARS. Grade 1 and full-day kindergarten students = 1.0 FTE. Half-day kindergarten students = 0.5 FTE.
o Calculations done January, March, & June.
42

North Thurston Public Schools
Calculation of 2014-15 K-1 Funded Class Size as of 6/17/2015 4:00:00 AM
S-275 Teacher Data Current as of 6/17/2015 3:15:35 AM
Additional Teacher Data Current as of 6/17/2015 4:00:00 AM
CedarsK1 Hdct
CedarsK2 Hdct
CedarsGrade 1 K-1 Calc FTE
S-275K-1
Teachers
Addtl.K-1
Teachers
S-275Spec Ed
K-1Teach
Addtl.Spec Ed
K-1Teach
Spec Ed FTEto Basic by
%
TotalK-1
TeachersClassSize
FundedClassSize
3130 Mountain View Elementary 110 2 102 213.0 10.910 0.000 0.644 0.000 0.183 11.093 19.20 20.30
3262 Lydia Hawk Elementary 72 2 62 135.0 7.885 0.000 0.957 0.000 0.272 8.157 16.55 20.30
3653 Lacey Elementary 88 4 77 167.0 7.925 0.000 1.536 0.000 0.437 8.362 19.97 20.30
4255 Meadows Elementary 68 2 65 134.0 6.939 0.000 1.168 0.000 0.332 7.271 18.43 20.30
4271 Pleasant Glade Elementary 86 1 69 155.5 8.848 0.000 0.231 0.000 0.066 8.914 17.44 20.30
5167 Chambers Prairie Elementary School 73 3 96 170.5 7.880 0.000 0.300 0.000 0.085 7.965 21.41 21.41
District Weighted Average Grades K-1 Funded Class Size 20.49
43

K–3 Funded Class Size for 2015–16+
K–3 funded class size; for high poverty schools and for non high poverty schools
o High poverty schools eligible per 10/1/2014 CEDARS data. o Districts are funded based on demonstrated class size in K–3.
One calculation for high poverty schools. One calculation for non high poverty schools.
o Teacher FTE in grade group codes “K”–“3” from S-275. In programs 01 & 79, and % of program 21. Duty roots 31, 33, 34, 52, & 63. Supplemental teachers allowed, hired after Oct 1, not on S-
275 o Student FTE from P-223 annual average year-to-date. o Calculations done January, March, & June. o Other details still being worked.
44