Embed Size (px)
Citation preview

Annual Report 2013March 1, 2012 – February 28, 2013
RYOHIN KEIKAKU CO., LTD.

2009/2 2010/2 2011/2 2012/2 2013/2
1 Revenue from operations (million yen) 163,757 164,341 169,748 178,186 188,350
2 Operating revenue (million yen) 17,223 14,134 13,900 15,438 18,351
2 Operating revenue ratio (%) 10.5 8.6 8.2 8.7 9.8
3 Ordinary profit (million yen) 17,358 14,608 14,229 16,135 19,760
3 Ordinary profit ratio (%) 10.7 8.9 8.4 9.1 10.5
4 Net income (million yen) 6,936 7,506 7,859 8,850 10,970
4 Net income ratio (%) 4.3 4.6 4.6 5.0 5.8
Net assets per share (yen) 2,522.54 2,718.43 2,871.02 3,055.61 3,488.03
Net income per share (yen) 249.80 270.31 285.86 330.35 409.45
5 Total assets (million yen) 92,000 99,381 97,481 102,293 119,360
5 Net assets (million yen) 71,528 77,066 78,502 83,528 96,050
5 Capital adequacy ratio (%) 76.1 76.0 78.9 80.0 78.3
6 Return on equity (ROE) (%) 10.1 10.3 10.3 11.1 12.5
Return on assets (ROA) (%) 7.7 7.8 8.0 8.9 9.9
Number of employees 2,471 2,331 2,595 2,734 3,069
(million yen) (%)
0
6,000
9,000
3,000
12,000
0
4
6
2
8
’09/2 ’10/2 ’11/2 ’12/2 ’13/2
Net income (left scale)
Net income ratio (right scale)
0
60,000
90,000
30,000
120,000
0
50
75
25
100
’09/2 ’10/2 ’11/2 ’12/2 ’13/2
(million yen) (%)
Total assets (left scale) Net assets (left scale)
Capital adequacy ratio (right scale)
Ordinary profit (left scale)
Ordinary profit ratio (right scale)
0
10,000
15,000
5,000
20,000
0
6
9
3
12
’09/2 ’10/2 ’11/2 ’12/2 ’13/2
(million yen) (%)
Operating revenue (left scale)
Operating revenue ratio (right scale)
0
10,000
15,000
5,000
20,000
0
6
9
3
12
’09/2 ’10/2 ’11/2 ’12/2 ’13/2
(million yen) (%)
0
100,000
150,000
50,000
200,000(million yen)
’09/2 ’10/2 ’11/2 ’12/2 ’13/2
0
10
15
5
20
’09/2 ’10/2 ’11/2 ’12/2 ’13/2
(%)
1 Revenue from operations
4 Net income and net income ratio
2 Operating revenue and operating revenue ratio
5 Total assets, net assets and capital adequacy ratio
3 Ordinary profit and ordinary profit ratio
6 Return on equity (ROE)
Financial Highlights
1
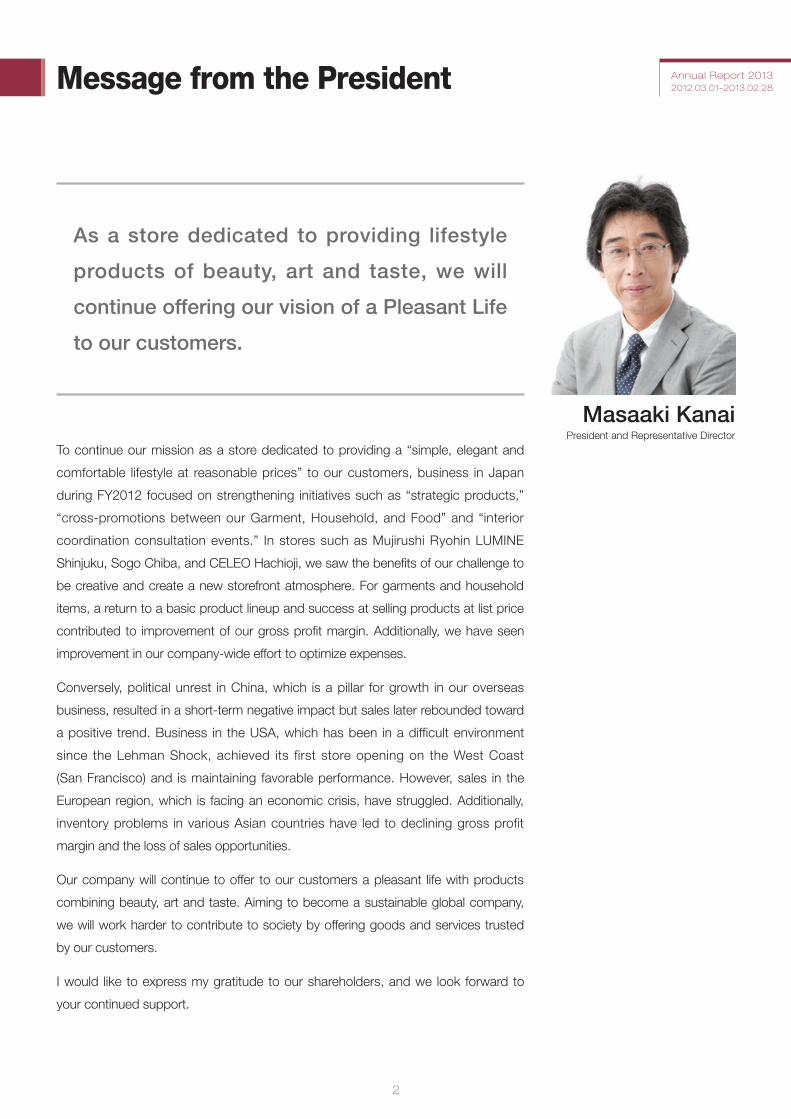
Annual Report 20132012.03.01–2013.02.28Message from the President
As a store dedicated to providing lifestyle
products of beauty, art and taste, we will
continue offering our vision of a Pleasant Life
to our customers.
To continue our mission as a store dedicated to providing a “simple, elegant and
comfortable lifestyle at reasonable prices” to our customers, business in Japan
during FY2012 focused on strengthening initiatives such as “strategic products,”
“cross-promotions between our Garment, Household, and Food” and “interior
coordination consultation events.” In stores such as Mujirushi Ryohin LUMINE
Shinjuku, Sogo Chiba, and CELEO Hachioji, we saw the benefits of our challenge to
be creative and create a new storefront atmosphere. For garments and household
items, a return to a basic product lineup and success at selling products at list price
contributed to improvement of our gross profit margin. Additionally, we have seen
improvement in our company-wide effort to optimize expenses.
Conversely, political unrest in China, which is a pillar for growth in our overseas
business, resulted in a short-term negative impact but sales later rebounded toward
a positive trend. Business in the USA, which has been in a difficult environment
since the Lehman Shock, achieved its first store opening on the West Coast
(San Francisco) and is maintaining favorable performance. However, sales in the
European region, which is facing an economic crisis, have struggled. Additionally,
inventory problems in various Asian countries have led to declining gross profit
margin and the loss of sales opportunities.
Our company will continue to offer to our customers a pleasant life with products
combining beauty, art and taste. Aiming to become a sustainable global company,
we will work harder to contribute to society by offering goods and services trusted
by our customers.
I would like to express my gratitude to our shareholders, and we look forward to
your continued support.
Masaaki KanaiPresident and Representative Director
2

Building platform to support strengthening of product marketability
1 Strengthening of Product Marketability
2 Promoting procurement structure reform
Results of existing store net sales comparison against previous year
Gross profit ratio
[Strengthen cost reduction control during season transitional periods]•Strengthenmonitoringofinventorystatusduring2Qand4Q,theseasontransitionalperiodsfromsummer(winter)toautumn
(spring)
[Continued strengthening of production location shift for clothing and household products]•ProgressinventoryratiofromASEANbasedonoriginalplan(attheendofFY12:15%)
[Expansion of direct sales ratio and concentrating production to factories in long-term operations]•Clothingandsundries:Firsthalf2011131factories>centralizedinto100factoriesbysecondhalf2012•MGSdirecttradinglevelFY12actual–expandedto10billionyenrange
Results of cross-promotions
Results for strategic products
Segment Firsthalf Secondhalf AnnualThirdquarter Fourthquarter
Clothing and sundries 109.5 % 108.4 % 101.2 % 105.0 % 107.2 %
Housewares 98.2 % 97.4 % 94.5 % 96.0 % 97.2 %
Food 96.4 % 93.3 % 90.9 % 91.9 % 94.1 %
Directly managed existing store comparison against previous year 101.9 % 101.1 % 96.4 % 98.8 % 100.4 %
Number of customers compared to previous year 95.7 % 95.4 % 92.8 % 94.1 % 95.8 %
Sales per customer 106.5 % 106.0 % 103.9 % 105.0 % 104.8 %
Promotion Sales %toplan Periodshare
Hemp, hemp, hemp 1,690 million yen 103.9 % 14.0 %
MUJI to Go (travel) 860 million yen 115.1 % 5.5 %
As always (disasterprevention) 300 million yen 80.1 % 3.4 %
Wool – This Great Earth 2,960 million yen 106.0 % 20.8 %
Main factors Total Fewerpricereductions Currencyfactors Recorded sales of
overseas supply Costreductions,etc.
Difference from previous period +0.2 % +0.1 % ▲0.5 % +0.6 % +0.4 %
Clothingandsundries Housewares Food Total
2010% to sales plan 94.7 % 102.7 % 100.4 % 97.6 %
Sales share 40 % 27 % 27 % 31 %
2011% to sales plan 99.1 % 91.8 % 97.5 % 95.4 %
Sales share 55 % 34 % 40 % 42 %
2012% to sales plan 101.3 % 97.0 % 86.8 % 97.9 %
Sales share 52 % 41 % 40 % 45 %
+0.4%[Individual]
(2012.3 to 2013.2)
•Salesofclothingandsundrieshaverecoveredfavorablyandthefocusisonhouseholditemsandfood
•“Hemp,hemp,hemp,”and“Wool–ThisGreatEarth”promotions,growthofhititemswithhighunitprices,limitingofpricereductionsales,etc.,tocontinueincreasingtheper-customersalespricethroughtheincreaseofunitprices
Policy Measures Progress
3

Annual Report 20132012.03.01–2013.02.28
Building infrastructure to support the growth of overseas operations
1 Aim to achieve 100 stores in China in 2013
2 Transferring the Chinese model
FY2012 net increase of 27 stores in China
•Completedinfrastructure(IT/logistics)creationinfirsthalf,focusedonimprovingoperationalprecision
•Improvedproductmanagementaccuracy[reducecasesofinventorydiscrepancies]
•Inventoryturnovergreatlyimprovedbutproblemsremainrelatedtorateofout-of-stockitemsanddeliverysystem
•Futureproblemsincludesecuringanddevelopingpersonnel
•Expandproductlineup(foodandhousingproducts)andlooktoopenflagshipstore
•OpenstoresinMalaysiaandKuwait(Malaysia–April2012,Kuwait–January2013)
•IntroduceoverseasMDsystemtoSingapore(FromNovember2012)
•ContinuemarketingresearchfornewcountriesincludingSouthAsia(Australia,India)
MUJI Hangzhou Mingde Lixing Department Store, China – 1,650m2 (2013.1.25 RE:open)
Kuwait THE AVENUES store 792m2 (2013.1.19 open)
4

Licensed stores: Stores to which we sell products wholesale
Hong Kong10
Philippines5
Turkey2
Indonesia6
Portugal1
Ireland1
12
China65
South Korea12
Taiwan28
Thailand9
U.S.A.5
Spain5
Singapore5
Malaysia2
United Kingdom11
France
8Italy
7
7Sweden
4Norway
Poland1
Germany
Stores managed by affiliates (Taiwan)
Directly managed stores 137Stores managed by affiliates 28Licensed stores 41
Total 206(as of February 28, 2013)
Total
206
Breakdown of storesoutside Japan,
by regionEurope 59
Asia 142
U.S.A. 5
Hokkaido1 56
Tohoku8 26
Kyushu / Okinawa13 322
Chugoku7 110
Shikoku8
Kansai
Directly managed stores 262Licensed stores 61Stores in Seiyu outlets 56
Total 379(as of February 28, 2013)
Licensed stores: Stores to which we sell products wholesale, except for Seiyu, FamilyMart and com KIOSK
Chubu1336 9
744 12Kanto
4138 24
Stores in Japan
Stores outside Japan
Business Segment Overview 1
Status of stores, by region
5

Annual Report 20132012.03.01–2013.02.28
(stores)
0
300
200
100
2008 2009 2010 2011 2012
Domestic supply businessDirectly managed business in Japan
Directly managed business in Japan saw strong growth with directly managed net sales recording an increase of 3.4% compared to the previous period and Web Business net sales recording an increase of 12.7%.
On a products segment basis, clothing and sundries performed favorably due to sales of items including the always-popular hit product, “Washable Turtle Neck that Controls Itchiness around Neck,” and stoles and capes, which are convenient for temperature adjustments, as well as items that focused on stringently selected natural materials such as organic cotton, hemp, and wool.
The housewares segment saw stable growth primarily from health and beauty products such as aromatic materials and our “Aging Care Series.” Also, our “Natural Wood Dining Table” and other furniture products made from high-quality materials
Among general supply destinations and our supply business to Seiyu, clothing and sundries performed well but the housewares and food segments trended towards decline and resulted in a decrease in revenue.
Food sales represented a large share of net sales from supplies to the FamilyMart Group and com KIOSK. As a result, overall
performed well to contribute to an increase in per-customer sales.
In the food segment, while we saw growth from the boil-in-a-bag curry, which offers numerous variations, we felt the negative impact of not running television commercials we ran during the previous period and saw a decline in performance for the current period.
Revenue from operations
Revenue from operations
124,506 million yen ( up 4.1% YOY)
26,528 million yen ( down 1.4% YOY)
12,429 million yen ( up 23.6% YOY)
2,439 million yen ( up 7.6% YOY)
Segment profit
Segment profit
▶Store openings and closuresStore openings and closures included 16 store openings and 10 store closures, resulting in the number of stores being 262.
▶Store openings and closuresTwo store openings and one store closure for a total of 117 stores.
▶Trend in number of stores (FY2012)
Directly managed business in Japan
Domestic supply
business
Retail sales business at directly managed domestic stores and online stores
Wholesale business to domestic licensed companies
Number of stores at end of previous term
Openings Closings Total
Directly managed business in Japan 256 16 10 262
Domestic supply business 116 2 1 117
66.1%
Percentage ofrevenue from operations
14.1%
Percentage ofrevenue from operations
performance was stagnant as sales experienced the same negative impact as was seen with food sales of directly managed businesses in Japan.
6

While we aggressively opened stores, we felt the impact of the economic crisis facing the European region, which led to stagnant net sales by supply operations for licensed stores in the European region managed by the European management company as well as stagnant net sales by stores managed by the Italian sales company. Also, as the majority of inventory is purchased in yen, we felt the impact of a weakening euro and pound, which resulted in foreign exchange losses and was a stress factor for profit.
Improved production management standards for seasonal products in the clothing and sundries segment made it possible to achieve timely and optimal storefront arrangements. This created a cleaner, refreshed storefront look and contributed to growth in the number of customers and increased sales. In China, the impact of demonstration activities that occurred in September led to a short-term decline but the market recovered gradually to achieve performance nearly on par with original plans.
▶Store openings and closuresSeven store openings and two store closures (of which, one was a supply destination) for a total of 59 stores.
▶Store openings and closures33 store openings and two store closures for a total of 94 stores. In China, which is the key of growth in our overseas business, there were 28 store openings and one store closure, bringing the number of stores to 65 stores as of the end of the term.
▶Trend in number of stores (FY2012)
Business in European
region
Business in Asian region
Sales business in Asia
Number of stores at end of previous term Openings Closings Total
54 7 2 59
0
90
60
30
2008 2009 2010 2011 2012
(stores)
(stores)
0
100
75
25
50
2008 2009 2010 2011 2012
ChinaAsian region overall
▶Trend in number of stores (FY2012)Number of
stores at end of previous term
Openings Closings Total
63 33 2 94Of which, in China 38 28 1 65
4.2%
Percentage ofrevenue from operations
10.2%
Percentage ofrevenue from operations
Business Segment Overview 2
Revenue from operations
Revenue from operations
7,931 million yen ( up 2.4% YOY)
19,272 million yen ( up 27.3% YOY)
228 million yen ( down 59.3% YOY)
1,542 million yen ( up 38.1% YOY)
Segment profit
Segment profit
Sales business in Europe
7

Annual Report 20132012.03.01–2013.02.28
In the USA, web-based PR campaigns, etc., helped increase brand recognition and led to solid growth.
Other business
Sales business in regions other than Europe and Asia
Overseas Supply Business, Beverage Business, MUJI Campsite Operation, Housing Sales Business
Business in other
regions
▶Store openings and closuresOne opening for a total of 5 stores.
▶Trend in number of stores (FY2012)
Number of stores at end of previous term Openings Closings Total
4 1 – 5
0
6
4
2
2008 2009 2010 2011 2012
(stores)
Store openings and closures for licensed stores in countries in the Asia region included eight new openings and two closures for a total of 48 stores.
Driven by growth of focus products, net sales for our beverage business showed strong performance, increasing by 16.4% compared to the previous period.
0.7%
Percentage ofrevenue from operations
4.7%
Percentage ofrevenue from operations
Revenue from operations
Revenue from operations
1,287 million yen ( up 22.6% YOY)
8,824 million yen ( up 13.6% YOY)
77 million yen ( up 18.9% YOY)
1,730 million yen ( up 14.9% YOY)
Segment profit
Segment profit
8

1. Basic Policy on Corporate Governance
We aim to establish good relationships with all stakeholders (shareholders, customers, employees, society and client
companies), to differentiate ourselves from other companies and win an overwhelming presence and the trust of customers to
enhance our corporate value. We have therefore been making improvements in manufacturing, sales, and customer service in
order to enhance our reputation and strengthen the “MUJI (Mujirushi Ryohin)” brand image.
We will demonstrate our reliability by improving our business performance, engaging in proactive IR activities, making fair
and transparent disclosures, and increasing returns to shareholders. In our relationships with employees, we will provide a
vector for our staff members to make efforts to achieve our company’s goals and establish an open and stimulating corporate
culture so that employees can realize their full potential. Our organizational management processes ensure constant self-
reflection and self-discipline, based on the lessons learned from a spate of corporate scandals seen in recent years.
2. Current status of Corporate Governance System for final decision-making, and of Managerial Organization for execution of decisions and supervision
1) Currently, taking into account the size of our company, its organizational status and staff mobility, the Board consists of
six directors within the company (six directors doubling as operating officers) and three directors outside the company,
who were appointed as independent directors in accordance with rules stipulated by the Tokyo Stock Exchange and who
report to the TSE. The supervisory functions and managerial responsibility of the Board of Directors are clearly stipulated,
and we also promote delegation of authority, including reviews of the board system and decision-making systems as
appropriate, in order to accelerate the implementation of processes.
2) Our company has adopted an audit system. Currently, the Board of Auditors consists of four members (including one
full-time auditing officer), all of whom are outside corporate auditors. Three of the four members were appointed as
independent directors in accordance with rules stipulated by the Tokyo Stock Exchange and these members report to
the TSE. The Board of Auditors audits the directors’ execution of their duties by attending Board meetings and checking
important documents. In addition, the Board of Auditors regularly liaises with the Audit Department, which conducts
internal audits, and with the accounting auditor, who conducts accountancy services.
3) The Payment Advisory Board (consisting of three directors outside the company (including one chairperson) and two
directors within the company) advises the Board of Directors on the payment of directors. The Nomination Advisory Board
(consisting of three directors outside the company (including one chairperson) and two directors within the company)
advises the Board of Directors on the nomination of directors.
4) The Audit Department (currently consisting of seven members) conducts internal audits. The Department performs audits
to determine whether business operations are being appropriately performed in accordance with our store management
manual and Work Standard Sheets (MUJIGRAM) by our headquarters, as well as to determine whether problems have
been solved. The audit results are reported to our representative directors on a weekly basis, as well as to our Board of
Directors every half-term.
5) Accounting audits of our company are conducted by a team consisting of three certified public accountants with KPMG
AZSA LLC, nine assistant certified public accountants, and nine other members. Thus an environment for fair auditing is
established. The team of certified public accountants with KPMG AZSA LLC consists of Mr. Masayuki Kawanishi (with
seven years of continuous auditing service), Mr. Akihiro Ohtani (with one year of continuous auditing service) and Mr.
Takushi Miyashita (with three years of continuous auditing service).
Corporate Governance
9

Annual Report 20132012.03.01–2013.02.28
(As of June 1, 2013)
Directors
SixdirectorswithinthecompanyThreedirectorsoutsidethecompany
Payment Advisory Board
TwodirectorswithinthecompanyThreedirectorsoutsidethecompany
Nomination Advisory Board
TwodirectorswithinthecompanyThreedirectorsoutsidethecompany
Board of Auditors
Fourcorporateauditorswithinthecompany(includingonefull-timeauditingofficer)
Accounting Auditor
[Committees]
•Management Strategy Committee•Personnel Committee•Personnel Training Committee•Advertisement Strategy Committee•Quality Improvement Committee•Safety and Health Committee•Overseas 400 Committee•Store Opening Planning Committee
Representative Directors
Management Committee
Operating Officers
Audit Department
Sales Meeting
WorkStandardizationCommittee
HelplineAdvisory Board
Merchandise Strategy Committee
Shareholders’ Meeting
Employees
Head of Each Department (person responsible for internal control)
Each Group Company
[Diagram]
Appointment/Dismissal Appointment/Dismissal
Audit
Report
Report
Report
Consultation
Accounting audit
Internal audit
Appointment/DismissalSupervision
Advice
Audit
Appointment/Dismissal
Audit
Compliance&RiskManagementCommittee
( )person responsible for overall internal control
general manager of general affairs and personnel
=
10

Environmental Activities
Creating a Pleasant Life Ryohin Keikaku contributes to society through our business activities
In 1980, Ryohin Keikaku launched the MUJI brand under the catchphrase “Lower priced for a reason.” MUJI was created to
promote low price and high value products, based on the in-house development experience of Seiyu GK, the umbrella group of
Ryohin Keikaku. The basic principle of MUJI merchandise development is to create products that are fundamental, practical and
really necessary in daily life, and to ensure efficient and minimal manufacturing processes. Based on this concept, we constantly
review our materials and designs, streamline time and labor in the manufacturing process, and simplify our packaging. For many
years our simple, elegant and functional products have earned the respect and appreciation of our customers.
Over 30 years has passed since the birth of MUJI, and we are still applying and developing our basic principles, responding to
our customers, and ensuring the MUJI brand means pleasant (well-designed, well-made and environmentally-friendly) products
and services; in this way we will offer the opportunity of a Pleasant Life (harmony with our neighbors and our planet) to people
throughout the world. Ryohin Keikaku believes that through our business activities we are able to satisfy our customers, offer
simplicity, harmony and beauty, and contribute to the greater community.
As a company that promotes a Pleasant Life we proclaim and implement three promises for corporate operation, three
viewpoints for product development—the fundamentals of business operation—and three criteria for manufacturing.
Three Promises for Corporate Operation(excerptfromVisionof“ryohin(goodproduct),”CorporatePhilosophy)
Three Criteria for Product Development
Three Viewpoints for Manufacturing
1. Take the challenges of global growth and development through fair and transparent business activities, and rise to these challenges.
2. Inquire into and offer new value and attractiveness of good products from the viewpoints of people. From the customers’ viewpoints, seek and offer new value and appeal.
3. To all age groups and various communities (customers, growers, manufacturers, etc.) connected with Ryohin Keikaku, offer the vision of a sustainable Pleasant Life.
1. Problem solving through design
2. Examination of materials and processes
3. Simplification of packaging
1. Ryohin Standards (Quality Standards)
2. Ryohin Keikaku Environment, Labor and Safety Management (The Code of Conduct for Business Partners)
3. Major materials not used or controlled
11

Annual Report 20132012.03.01–2013.02.28
Company initiatives to create a Pleasant Life
Waste Elimination (Waste Reduction)
1. Problem solving through design
2. Examination of materials and processes
3. Simplification of packaging
4. Recycling of textile goods
5. Recycling Sofas that Fit the Body
6. Recycling of polyvinyl chloride
7. After-sale service and parts
8. Reuse of corrugated cardboard boxes used for deliveries to stores
9. In-store reuse of packing materials, etc.
10. Reducing trash at Café&Meal MUJI
11. Well-built houses for long occupancy
12. Reduction of paper use in offices and promoting paperless offices
Conservation of Natural Resources 13. Checking the origin of wood used for furniture products
14. Checking the origin of wood for paper goods
15. Making full use of organic cotton
16. Use of organic linen
17. Initiatives at MUJI campsites
18. Supporting Akagi Nature Park
Safety & Security 19. Ryohin Standards
20. Materials prohibited or subject to restricted use
21. Activities for the development of more comfortable socks
22. Use of natural materials
23. Efforts at MUJI Labo
24. Development of products that can be washed at home
25. Use of materials with temperature adjustment function
26. Skin care series that uses spring water
27. Including collapse-prevention fixtures as standard accessory for all furniture over 180cm
28. Development of products that can be used in emergency situations
29. Selecting alternatives to fluorine resin
30. Food safety
31. Development of caffeine-free drinks
Respect & Harmony 32. Making use of customer opinions with your Voice System
33. Opinions and the Customer Viewpoint Sheet
34. Communication with business partners
35. Promoting the Fairtrade Label
36. Initiatives supporting producers
37. Developing “My Bag” with village in Laos
38. Developing products that parents and children can make together
39. Workshops & community
40. Participation in Pink Ribbon activities
41. Cleaning outside the company
42. Employee volunteers in Kids Summer Camps
43. Supporting NGOs and NPOs though our products and services
44. Sales of fund-raising tickets
45. Deploying products that allow buyers to make donations
46. Laboratory for Discerning Living
47. Inviting recipe submissions
48. Disaster recovery efforts
49. Women’s activities
50. Employment of people with disabilities
51. Ranked 21st in Great Places to Work®
52. Conversations with NPOs, NGOs, and company employees
53. Global communication promotions
Global Warming 54. Future House Project
55. Delivery of polypropylene storage products
56. Leaving work at the scheduled time
57. Energy saving activity participated in by all our staff
58. Installation of heat shield sheets on the south windows of company headquarters
59. Introduction of energy-saving lighting in the Head Office
60. Introduction of energy-saving lighting in stores
61. Product development utilizing rechargeable batteries
62. We will work towards the 100% use of LED in lighting products
Company Creating a Pleasant Life
Global Warming
Waste Elimination
Conservation of Natural Resources
Safety & Security
Respect & Harmony
12

Company name RYOHIN KEIKAKU CO., LTD.
Location 4-26-3 Higashi-Ikebukuro, Toshima-ku, Tokyo, 170-8424
Establishment June 1989 (registration: May 1979)
Capital ¥6,766,250,000
Accounts settlement date Last day of February every year
Major business Operation of exclusive MUJI stores / product planning / development / production / wholesale / retail
Management Chairman and Representative Director Tadamitsu Matsui
President and Representative Director Masaaki Kanai
Senior Managing Director Satoru Matsuzaki
Managing Director Takashi Kato
Managing Director Takashi Komori
Director Kei Suzuki
Director Hisashi Sakamaki
Director Isao Endo
Director Toshiaki Ito
Corporate Auditor Hitoshi Matsui
Corporate Auditor Masaaki Kojima
Corporate Auditor Masaru Hattori
Corporate Auditor Michio Shibuya
Senior Executive Officer Junichi Tokue
Executive Officer Hiroto Oki
Executive Officer Tetsuo Kameya
Executive Officer Mitsuru Tanaka
Executive Officer Yumiko Hagiwara
Executive Officer Satoshi Okazaki (As of June 1, 2013)
Advisory Board Advisor Kazuko Koike
Advisor Takashi Sugimoto
Advisor Kenya Hara
Advisor Naoto Fukasawa (As of February 28, 2013)
Corporate Information
13

Annual Report 20132012.03.01–2013.02.28
MUJI was established in December 1980 as a private brand of The Seiyu, Ltd. with 40 products, and has grown into a brand
with more than 7,000 products today. Ryohin Keikaku Co., Ltd. was established as an independent company from The Seiyu,
Ltd. in 1989. As a manufacturer/retailer, it plans, develops, manufactures, distributes and sells the MUJI brand for all aspects of
life, including clothing, household articles and food products.
1980 MUJI established as a private brand of The Seiyu, Ltd. (household articles: 9, food products: 31).
1981 Started selling clothes.
1982 Started wholesaling to partner stores.
1983 Opened the first directly managed store, “MUJI Aoyama” (103 sq m).
1984 Opened outlets inside large Seiyu stores.
1985 Established MUJI Business Department.
1986 Started overseas production and procurement (comprehensive production in overseas countries).
1987 Accumulated know-how of overseas production and procurement including factory direct orders and original distribution channels.
1988 Developed materials globally.
1989 Established Ryohin Keikaku Co., Ltd. (capital: 100 million yen).
1990 MUJI business transferred from The Seiyu, Ltd.
1991 Opened the first overseas store in London (a partnership with Liberty & Co.).
1992 Started Blue MUJI for products with further enhanced quality.
1993 Established RK Trucks Co., Ltd.; opened large one-floor store, “MUJI Lalaport.”
1994 Established Ryohin Keikaku Europe Ltd.; opened Niigata Logistics Center.
1995 Opened first store in Singapore (closed down in 1998); opened “MUJI Tsunan Campsite;” Company shares registered on the over-the-counter market.
1996 Increased capital to ¥6,766.25 million; opened Fukuoka Logistics Center.
1997 Obtained ISO9001 certification.
1998 Listed on the second section of the Tokyo Stock Exchange; opened Kobe Logistics Center and Urayasu Logistics Center.
1999 Started com KIOSK business (operated by JR East Retail Net Co., Ltd.).
2000 Promoted to listing on the first section of the Tokyo Stock Exchange; established MUJI.net Co., Ltd.
2001 Opened MUJI (Hong Kong) Co., Ltd.; opened MUJI Yurakucho and MUJI Namba stores.
2002 Opened first store in Ireland.
2003 Opened first store in Korea; started living space project Mujirushi Ryohin no Ie.
2004 Opened first store in Taiwan; opened MUJI Tsumagoi Campground; opened Mujirushi Ryohin no Ie Yurakucho; opened first store in Italy.
2005 Opened first store on Chinese mainland (Shanghai) and first store in Germany.
2006 Established MUJI Global Sourcing Private Limited in Singapore; opened first store in Spain; took over the business of IDÉE Co., Ltd.
2007 Established subsidiary MUJI Europe Holdings Ltd. to oversee European operations; opened MUJI Tokyo Midtown and first U.S.A. directly managed store.
2008 Opened MUJI to GO Hong Kong International Airport; opened U.S.A. flagship store MUJI Times Square; opened MUJI Shinjuku and MUJI Ginza Matsuzakaya.
2009 Relocated and updated MUJI Ikebukuro Seibu; opened first store in Indonesia.
2010 Opened first store in Poland; 30th anniversary of MUJI; opened first store in Portugal.
2011 Opened Café&Meal MUJI Minami Aoyama; updated Mujirushi Ryohin Yurakucho and MUJI Canal City Hakata; established MUJI (Malaysia) SDN. BHD.; opened Found MUJI Aoyama.
2012 Opend first store in Malaysia; established MUJI Retail (Thailand) Co., Ltd.
History
Found MUJI Aoyama
MUJI Yurakucho
MUJI Times Square
Mujirushi Ryohin Shimokitazawa
Forty debut items
14

Group Companies
Address : Toshima-ku, TokyoEstablishment : March 1993Primary business : Distribution
Address : SingaporeEstablishment : January 2003Primary business : Retailing of MUJI products
Address : Toshima-ku, TokyoEstablishment : May 2000Primary business : Retailing of living space project
Mujirushi Ryohin no Ie products
Address : Kuala Lumpur, MalaysiaEstablishment : October 2011Primary business : Retailing of MUJI products
Address : Toshima-ku, TokyoEstablishment : August 2006Primary business : Planning, manufacturing and retailing
of furniture, interior goods, etc.
Address : Seoul, South KoreaEstablishment : December 2004Primary business : Retailing of MUJI products
Address : London, U.K.Establishment : January 2007Primary business : Oversight of European region
business
Address : Shanghai, ChinaEstablishment : May 2005Primary business : Retailing of MUJI products
Address : London, U.K.Establishment : March 1994Primary business : Retailing of MUJI products
Address : Shenzhen, ChinaEstablishment : July 2010Primary business : Retailing of MUJI products
Address : Paris, FranceEstablishment : April 1998Primary business : Retailing of MUJI products
Address : SingaporeEstablishment : April 2006Primary business : Product development,
procurement, import and export
Address : Milan, ItalyEstablishment : September 2004Primary business : Retailing of MUJI products
Address : Shanghai, ChinaEstablishment : October 2009Primary business : Product development, procurement
and wholesale in China
Address : Düsseldorf, GermanyEstablishment : July 2005Primary business : Retailing of MUJI products
Address : Taipei, TaiwanEstablishment : August 2003Primary business : Retailing of MUJI products
Address : New York, U.S.A.Establishment : October 2006Primary business : Retailing of MUJI products
Address : Bangkok, ThailandEstablishment : November 2012Primary business : Retailing of MUJI products
Address : Hong Kong, ChinaEstablishment : March 2001Primary business : Retailing of MUJI products
RKTRUCKSCO.,LTD.
MUJIDeutschlandGmbH
MUJI(SHENZHEN)CO.,LTD.
MUJI.netCO.,LTD.
MUJIU.S.A.LIMITED MUJIRetail(Thailand)Co.,Ltd.
MUJI(MALAYSIA)SDN.BHD.
IDÉECO.,LTD.
MUJI(HONGKONG)CO.,LTD.
MUJIGlobalSourcingPrivateLimited
MUJIEUROPEHOLDINGSLIMITED
MUJI(SINGAPORE)PRIVATELTD.
MGS(SHANGHAI)TRADINGCO.,LTD.
RYOHINKEIKAKUEUROPELTD.
MUJIKOREACO.,LTD.
MUJITAIWANCO.,LTD.
RYOHINKEIKAKUFRANCES.A.S.
MUJI(SHANGHAI)CO.,LTD.
MUJIITALIAS.p.A.
15

Consolidated financial statements
16

Consolidated balance sheets
(Unit: Million yen)
Previous consolidated fiscal year(February 29, 2012)
Current consolidated fiscal year(February 28, 2013)
Assets
Current assets
Cash on hand and in banks 16,033 21,563
Notes and accounts receivable 4,988 6,092
Marketable securities 9,012 10,023
Products 21,869 27,106
Work in process 24 74
Supplies 15 14
Deferred tax assets 577 758
Accounts receivable – other 4,732 5,168
Other items 2,583 1,758
Allowance for doubtful accounts (3) (4)
Total current assets 59,833 72,556
Fixed assets
Tangible fixed assets
Buildings and structures 19,882 21,272
Accumulated depreciation (11,688) (12,601)
Buildings and structures (net value) 8,194 8,671
Machinery, equipment and vehicles 1,828 1,917
Accumulated depreciation (1,390) (1,209)
Machinery, equipment and vehicles (net value) 438 708
Equipment 9,515 10,222
Accumulated depreciation (7,546) (7,570)
Equipment (net value) 1,968 2,652
Land 1,038 1,324
Lease assets 33 39
Accumulated depreciation (26) (34)
Lease assets (net value) 7 5
Construction in progress 97 874
Total tangible fixed assets 11,743 14,236
Intangible fixed assets
Goodwill 0 36
Other 3,695 4,077
Total intangible fixed assets 3,696 4,113
Investment and other assets
Investment securities 10,140 12,047
Deferred tax assets 1,726 975
Lease and guarantee deposits 15,001 15,230
Other 330 366
Allowance for doubtful accounts (179) (164)
Total investments and other assets 27,020 28,454
Total fixed assets 42,460 46,804
Total assets 102,293 119,360
17

Annual Report 20132012.03.01–2013.02.28
(Unit: Million yen)
Previous consolidated fiscal year(February 29, 2012)
Current consolidated fiscal year(February 28, 2013)
Liabilities
Current liabilities
Accounts payable 8,933 10,155
Short-term loans payable 67 407
Accrued expenses 3,981 4,124
Income taxes payable 3,235 4,446
Reserve for bonuses 186 243
Reserve for directors’ bonuses 71 73
Provision for sales returns — 46
Reserve for loss on closing of stores 152 19
Other 1,558 3,168
Total current liabilities 18,186 22,685
Long-term liabilities
Reserve for directors’ retirement benefits 115 109
Reserve for loss on non-cancelable lease contracts 80 50
Other 382 465
Total long-term liabilities 578 625
Total liabilities 18,765 23,310
Net assets
Shareholders’ equity
Capital stock 6,766 6,766
Capital surplus 10,119 10,116
Earned surplus 72,183 80,207
Treasury stock (3,961) (3,927)
Total shareholders’ equity 85,107 93,163
Valuation and translation adjustments
Valuation difference on available-for-sale securities (829) 1,192
Translation adjustment (2,416) (870)
Total valuation and translation adjustments (3,245) 322
Stock acquisition rights 286 310
Minority interests 1,380 2,254
Total net assets 83,528 96,050
Total liabilities and net assets 102,293 119,360
18

Consolidated income statements
(Unit: Million yen)
Previous consolidated fiscal year(March 1, 2011 – February 29, 2012)
Current consolidated fiscal year(March 1, 2012 – February 28, 2013)
Net sales 177,532 187,693
Cost of sales 96,589 100,974
Gross profit 80,943 86,719
Operating revenue 653 657
Operating profit before S.G.A. 81,596 87,376
Selling, general and administrative expenses
Advertising expenses 3,975 3,670
Distribution and transportation expenses 6,902 7,438
Employees’ salaries and bonuses 18,011 18,963
Provision of reserve for directors’ bonuses 71 73
Leasehold and office rents 18,532 19,630
Depreciation 3,201 3,186
Other 15,463 16,061
Total selling, general and administrative expenses 66,158 69,024
Operating profit 15,438 18,351
Non-operating income
Interest income 28 29
Dividends income 277 289
Foreign exchange gains 25 739
Co-sponsor fee 12 43
Equity in earnings of affiliates 221 145
Other 147 179
Total non-operating income 713 1,427
Non-operating expenses
Interest expenses 1 8
Other 15 10
Total non-operating expenses 17 18
Ordinary profit 16,135 19,760
Extraordinary income
Reversal of reserve for loss on closing of stores 40 —
Reversal of allowance for doubtful accounts 31 —
Reversal of reserve for loss on non-cancelable lease contracts 71 —
Other 2 —
Total extraordinary income 146 —
19

Annual Report 20132012.03.01–2013.02.28
(Unit: Million yen)
Previous consolidated fiscal year(March 1, 2011 – February 29, 2012)
Current consolidated fiscal year(March 1, 2012 – February 28, 2013)
Extraordinary losses
Impairment loss 295 34
Loss on disaster 386 —
Loss on retirement of fixed assets 242 296
Loss on valuation of investment securities — 1,379
Provision of reserve for loss on closing of stores — 16
Others 67 14
Total extraordinary losses 992 1,740
Income before income taxes 15,289 18,019
Income taxes – current 6,039 7,455
Income taxes for prior periods 188 —
Income taxes – deferred 54 (535)
Total income taxes 6,282 6,920
Income before minority interests 9,007 11,099
Minority interests in income 157 128
Net income 8,850 10,970
20

Consolidated statements of changes in net assets
(Unit: Million yen)
Previous consolidated fiscal year(March 1, 2011 – February 29, 2012)
Current consolidated fiscal year(March 1, 2012 – February 28, 2013)
Shareholders’ equity
Capital stock
Balance at beginning of current term 6,766 6,766
Changes of items during term
Total changes of items during term — —
Balance at end of term 6,766 6,766
Capital surplus
Balance at beginning of current term 10,122 10,119
Changes of items during term
Disposal of treasury stock (3) (2)
Total changes of items during term (3) (2)
Balance at end of term 10,119 10,116
Retained earnings
Balance at beginning of current term 66,280 72,183
Changes of items during term
Dividends from surplus (2,946) (2,947)
Net income 8,850 10,970
Total changes of items during term 5,903 8,023
Balance at end of term 72,183 80,207
Treasury stock
Balance at beginning of current term (3,964) (3,961)
Changes of items during term
Disposal of treasury stock 3 34
Total changes of items during term 3 34
Balance at end of term (3,961) (3,927)
Total shareholders’ equity
Balance at beginning of current term 79,204 85,107
Changes of items during term
Dividends from surplus (2,946) (2,947)
Net income 8,850 10,970
Disposal of treasury stock 0 31
Total changes of items during term 5,903 8,055
Balance at end of term 85,107 93,163
21

Annual Report 20132012.03.01–2013.02.28
(Unit: Million yen)
Previous consolidated fiscal year(March 1, 2011 – February 29, 2012)
Current consolidated fiscal year(March 1, 2012 – February 28, 2013)
Valuation and translation adjustments
Valuation difference on available-for-sale securities
Balance at beginning of current term (302) (829)
Changes of items during term
Net changes of items other than shareholders’ equity (net value) (526) 2,022
Total changes of items during term (526) 2,022
Balance at end of term (829) 1,192
Translation adjustment
Balance at beginning of current term (1,987) (2,416)
Changes of items during term
Net changes of items other than shareholders’ equity (net value) (428) 1,545
Total changes of items during term (428) 1,545
Balance at end of term (2,416) (870)
Total valuation and translation adjustments
Balance at beginning of current term (2,290) (3,245)
Changes of items during term
Net changes of items other than shareholders’ equity (net value) (954) 3,567
Total changes of items during term (954) 3,567
Balance at end of term (3,245) 322
Stock acquisition rights
Balance at beginning of current term 244 286
Changes of items during term
Net changes of items other than shareholders’ equity (net value) 41 24
Total changes of items during term 41 24
Balance at end of term 286 310
Minority interests
Balance at beginning of current term 1,344 1,380
Changes of items during term
Net changes of items other than shareholders’ equity (net value) 35 874
Total changes of items during term 35 874
Balance at end of term 1,380 2,254
Total net assets
Balance at beginning of current term 78,502 83,528
Changes of items during term
Dividends from surplus (2,946) (2,947)
Net income 8,850 10,970
Disposal of treasury stock 0 31
Net changes of items other than shareholders’ equity (net value) (877) 4,466
Total changes of items during term 5,025 12,521
Balance at end of term 83,528 96,050
22

Consolidated cash flow statements
(Unit: Million yen)
Previous consolidated fiscal year(March 1, 2011 – February 29, 2012)
Current consolidated fiscal year(March 1, 2012 – February 28, 2013)
Net cash provided by operating activities
Income before income taxes 15,289 18,019
Depreciation 2,705 2,675
Depreciation of software 725 665
Amortization of goodwill 0 1
Increase (decrease) in allowance for doubtful accounts (15) (14)
Increase (decrease) in reserve for directors’ bonuses 29 1
Increase (decrease) in reserve for retirement benefits and directors’ retirement benefits (23) (6)
Increase (decrease) in reserve for loss on closing of stores (63) (133)
Increase (decrease) in reserve for loss on non-cancelable lease contracts (71) (41)
Increase (decrease) in reserve for sales returns — 46
Interest and dividends income (306) (319)
Interest expenses 1 8
Foreign exchange losses (gains) (20) (201)
Equity in (earnings) losses of affiliates (221) (145)
Loss on retirement of fixed assets 279 296
Impairment loss 295 34
Loss (gain) on valuation of investment securities — 1,379
Decrease (increase) in notes and accounts receivable-trade (169) (627)
Decrease (increase) in inventories (3,730) (4,182)
Increase (decrease) in notes and accounts payable-trade (645) 431
Decrease (increase) in other assets 286 805
Increase (decrease) in other liabilities 717 316
Stock acquisition rights 56 55
Other (6) 13
Subtotal 15,113 19,082
Interest and dividend income received 405 393
Interest expenses paid (1) (8)
Income tax paid (5,787) (6,290)
Net cash provided by operating activities 9,729 13,176
Net cash used in investment activities
Payments into time deposits (170) (21)
Proceeds from withdrawal of time deposits 24 43
Purchase of property, plant and equipment (2,901) (3,856)
Proceeds from sales of property, plant and equipment 15 0
Leasehold right on stores and lease deposits (987) (962)
Proceeds from collection of lease deposits for stores 325 868
Purchase of intangible fixed assets (1,000) (986)
Other (53) (32)
Net cash used in investment activities (4,747) (4,945)
23

Annual Report 20132012.03.01–2013.02.28
(Unit: Million yen)
Previous consolidated fiscal year(March 1, 2011 – February 29, 2012)
Current consolidated fiscal year(March 1, 2012 – February 28, 2013)
Net cash used in financing activities
Increase (decrease) in short-term loans payable (167) 287
Repayments of lease obligations (5) (3)
Proceeds from stock issuance to minority shareholders — 122
Proceeds from sales of treasury stock 0 0
Cash dividends paid (2,947) (2,947)
Net cash used in financing activities (3,120) (2,540)
Effect of exchange rate change on cash and cash equivalents (246) 849
Increase (decrease) in cash and cash equivalents 1,614 6,539
Cash and cash equivalents, beginning of period 23,244 24,858
Cash and cash equivalents, end of period 24,858 31,397
24

MEMO