Embed Size (px)
Citation preview

Page 1
FY 25 Service Utilization Data
aid
sn
et.
org
Ryan White Program
Service Utilization Data
Fiscal Year 25
(3/1/2015 thru 2/29/2016)
(June 10, 2016)
Review of Utilization Data from the
Service Delivery Information System (SDIS)
Prepared by Behavioral Science Research Corporation
FY 25 Service Utilization Data
aid
sn
et.
org
2011 2012 2013 2014 2015
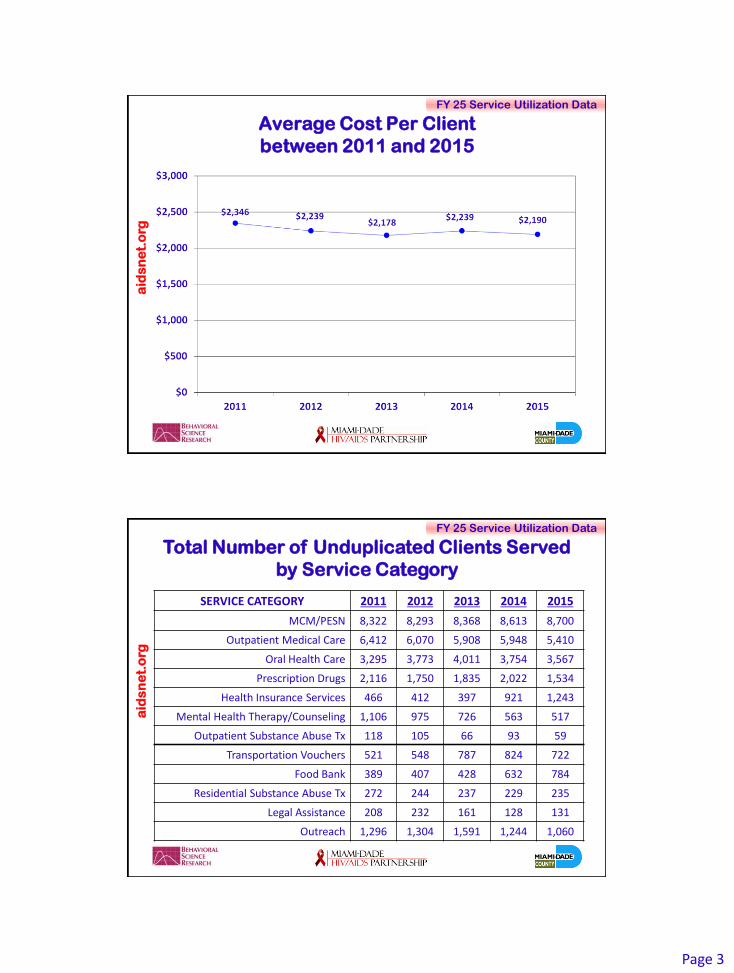
Total Expenditures $22,546,151 $21,331,284 $20,956,338 $21,614,852 $21,181,296
Total Unduplicated Clients
9,612 9,527 9,624 9,655 9,671
Average Cost/Client $2,346 $2,239 $2,178 $2,239 $2,190
Ryan White Program
Service Expenditures & Clients Served

Page 2
FY 25 Service Utilization Data
aid
sn
et.
org
Total Expenditures
between 2011 and 2015
FY 25 Service Utilization Data
aid
sn
et.
org
Total Number of Unduplicated Clients
between 2011 and 2015
Page 3
FY 25 Service Utilization Data
aid
sn
et.
org
Average Cost Per Client
between 2011 and 2015
FY 25 Service Utilization Data
aid
sn
et.
org
SERVICE CATEGORY 2011 2012 2013 2014 2015
MCM/PESN 8,322 8,293 8,368 8,613 8,700
Outpatient Medical Care 6,412 6,070 5,908 5,948 5,410
Oral Health Care 3,295 3,773 4,011 3,754 3,567
Prescription Drugs 2,116 1,750 1,835 2,022 1,534
Health Insurance Services 466 412 397 921 1,243
Mental Health Therapy/Counseling 1,106 975 726 563 517
Outpatient Substance Abuse Tx 118 105 66 93 59
Transportation Vouchers 521 548 787 824 722
Food Bank 389 407 428 632 784
Residential Substance Abuse Tx 272 244 237 229 235
Legal Assistance 208 232 161 128 131
Outreach 1,296 1,304 1,591 1,244 1,060
Total Number of Unduplicated Clients Served
by Service Category

Page 4
FY 25 Service Utilization Data
aid
sn
et.
org
CORE SERVICE CATEGORY
2011 2012 2013 2014 2015
Outpatient Medical Care
$10,765,487 $9,445,791 $9,618,335 $8,060,123 $6,635,024
MCM/PESN $4,332,987 $4,656,201 $4,249,321 $4,715,670 $4,467,261
Oral Health Care $2,043,119 $2,544,990 $2,602,136 $2,527,953 $2,507,114
Health Insurance Services
$783,776 $530,720 $679,885 $1,553,913 $2,958,812
Prescription Drugs $796,770 $488,240 $464,876 $814,486 $781,336
Mental Health Therapy/ Counseling
$204,720 $202,239 $139,153 $138,318 $105,440
Outpatient Substance Abuse Treatment
$106,999 $117,739 $86,930 $110,648 $90,372
Total Expenditures
by Core Service Category
FY 25 Service Utilization Data
aid
sn
et.
org
SUPPORT SERVICE CATEGORY
2011 2012 2013 2014 2015
Residential Substance Abuse Treatment
$2,288,125 $2,166,875 $2,049,125 $2,292,150 $2,096,575
Food Bank $382,476 $349,369 $373,744 $712,842 $899,766
Transportation Vouchers $79,603 $82,135 $149,303 $188,094 $144,580
Legal Assistance $189,000 $222,570 $190,148 $151,943 $137,988
Outreach $471,671 $445,096 $353,383 $348,715 $357,028
Total Expenditures
by Support Service Category

Page 5
FY 25 Service Utilization Data
aid
sn
et.
org
Outpatient Medical Care
FY 25 Service Utilization Data
aid
sn
et.
org
Outpatient Medical Care
2011 2012 2013 2014 2015
Total Clients 6,412 6,070 5,908 5,948 5,410
% of All RW Clients 66.7% 63.7% 61.4% 61.6% 55.9%
Total Cost $10,765,487 $9,445,791 $9,618,335 $8,060,123 $6,635,024
% of Total Costs 47.8% 44.3% 45.9% 37.3% 31.3%
Average Cost/Client $1,679 $1,556 $1,628 $1,355 $1,226
Median Cost/Client $1,344 $1,306 $1,329 $1,014 $915
Max. Cost/Client $23,567 $17,522 $21,663 $18,671 $10,344

Page 6
FY 25 Service Utilization Data
aid
sn
et.
org
Percent of Clients Served and Percent Spent on
Outpatient Medical Care
FY 25 Service Utilization Data
aid
sn
et.
org
Gender and Ethnicity Percent Receiving
OMC
Percent of All Ryan White Program Clients
Hispanic Male 48% 46%
Hispanic Female 7% 7%
Black Male 17% 18%
Black Female 10% 12%
Haitian Male 6% 5%
Haitian Female 6% 6%
White Male 6% 6%
White Female 1% 1%
Outpatient Medical Care
by Gender and Ethnicity

Page 7
FY 25 Service Utilization Data
aid
sn
et.
org
Clients Total EXHD
99214: Level 4 Established Patient Office Visit. Must include 2 of 3 key components or 25 minutes spent face-to-face with Pt.
2,843 $1,012,117
87536: HIV-1 Test 3601 $731,046
99213: Level 3 Established Patient Office Visit. Must include 2 of 3 key components or 15 minutes spent face-to-face with Pt.
3069 $675,747
87901: Genotype Resistance Test 735 $274,324
99204: Level 4 New Patient Office Visit. Must include all 3 key components or 45 minutes spent face-to-face with Pt.
626 $182,244
87491: STI Test for Chlamydia 2476 $180,285
87591: STI Test for Gonorrhea and Chlamydia 2483 $179,150
86359: T Cells Count 1708 $178,920
86480: TB Test 1483 $132,598
87900: Genotype Test using a co-receptor tropism assay 691 $131,439
Top 10 Outpatient Medical Care Services
By Expenditures
FY 25 Service Utilization Data
aid
sn
et.
org
Clients Total EXHD
87536: HIV-1 Test 3,601 $731,046
80053: Comprehensive Metabolic Panel (Blood Test) 3,541 $106,223
86360: T-cell Test that evaluates helper and suppressor cell immune status
3,362 $65,850
36415: Blood Collection 3,286 $23,517
99213: Level 3 Established Patient Office Visit. Must include 2 of 3 key components or 15 minutes spent face-to-face with Pt.
3,069 $675,747
99214: Level 4 Established Patient Office Visit. Must include 2 of 3 key components or 25 minutes spent face-to-face with Pt
2,843 $1,012,117
80061: Lipid Panel (Cholesterol Test) 2,841 $86,727
86592: STI Test for Syphilis 2,669 $25,326
85025: Complete Blood Count Test 2,559 $53,292
87591: STI Test for Gonorrhea and Chlamydia 2,483 $179,150
Top 10 Outpatient Medical Care Services
By Clients Served

Page 8
FY 25 Service Utilization Data
aid
sn
et.
org
Medical Case Management &
Peer Education Support Network
FY 25 Service Utilization Data
aid
sn
et.
org
Medical Case Management
2011 2012 2013 2014 2015
Total Clients 7,364 7,417 7,365 7,817 7,493
% of All RW Clients 76.6% 77.8% 76.5% 81.0% 77.5%
Total Cost $3,848,530 $4,040,848 $3,829,690 $4,181,434 $3,890,241
% of Total Costs 17.1% 18.9% 18.3% 19.3% 18.4%
Average Cost/Client $523 $545 $520 $535 $519
Median Cost/Client $476 $504 $469 $471 $450
Max. Cost/Client $2,744 $3,528 $2,808 $3,042 $4,133

Page 9
FY 25 Service Utilization Data
aid
sn
et.
org
Percent of Clients Served and Percent Spent on
Medical Case Management
FY 25 Service Utilization Data
aid
sn
et.
org
Gender and Ethnicity Percent Receiving
MCM
Percent of All Ryan White Program Clients
Hispanic Male 48% 46%
Hispanic Female 6% 7%
Black Male 17% 18%
Black Female 11% 12%
Haitian Male 5% 5%
Haitian Female 6% 6%
White Male 7% 6%
White Female 1% 1%
Medical Case Management
by Gender and Ethnicity

Page 10
FY 25 Service Utilization Data
aid
sn
et.
org
Peer Education Support Network
2011 2012 2013 2014 2015
Total Clients 5,972 6,480 6,792 7,416 7,464
% of All RW Clients 62.1% 68.0% 70.6% 76.8% 77.2%
Total Cost $467,108 $615,353 $419,632 $523,544 $577,385
% of Total Costs 2.1% 2.9% 2.0% 2.4% 2.7%
Average Cost/Client $78 $95 $62 $71 $77
Median Cost/Client $53 $60 $40 $49 $51
Max. Cost/Client $1,860 $1,508 $1,133 $1,397 $1,448
FY 25 Service Utilization Data
aid
sn
et.
org
Percent of Clients Served and Percent Spent on
Peer Education Support Network
Page 11
FY 25 Service Utilization Data
aid
sn
et.
org
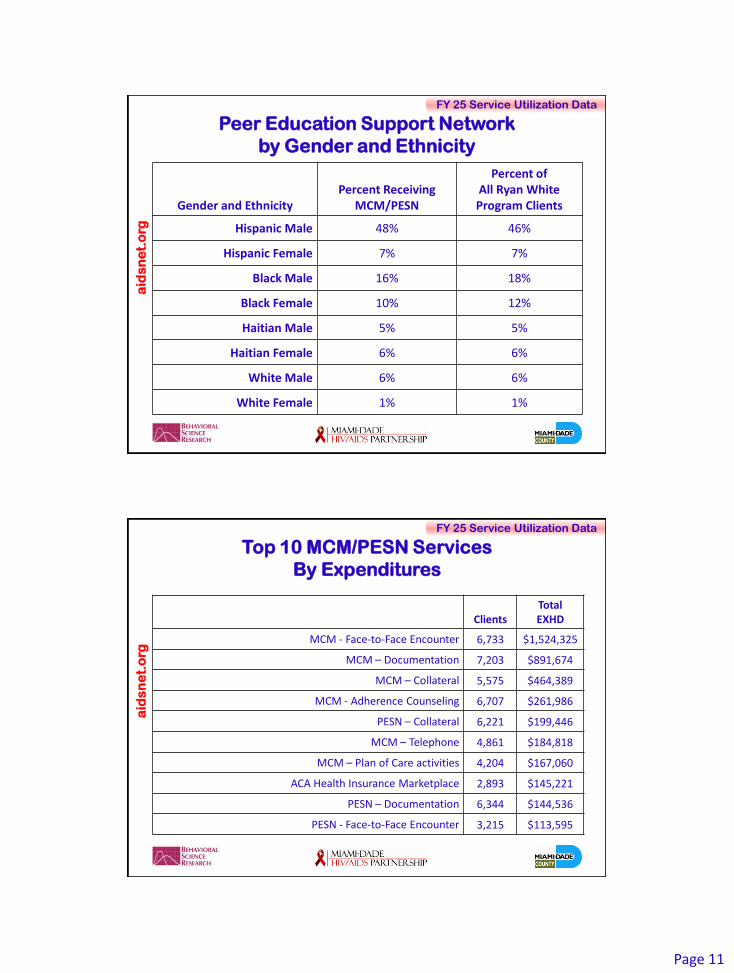
Gender and Ethnicity Percent Receiving
MCM/PESN
Percent of All Ryan White Program Clients
Hispanic Male 48% 46%
Hispanic Female 7% 7%
Black Male 16% 18%
Black Female 10% 12%
Haitian Male 5% 5%
Haitian Female 6% 6%
White Male 6% 6%
White Female 1% 1%
Peer Education Support Network
by Gender and Ethnicity
FY 25 Service Utilization Data
aid
sn
et.
org
Clients Total EXHD
MCM - Face-to-Face Encounter 6,733 $1,524,325
MCM – Documentation 7,203 $891,674
MCM – Collateral 5,575 $464,389
MCM - Adherence Counseling 6,707 $261,986
PESN – Collateral 6,221 $199,446
MCM – Telephone 4,861 $184,818
MCM – Plan of Care activities 4,204 $167,060
ACA Health Insurance Marketplace 2,893 $145,221
PESN – Documentation 6,344 $144,536
PESN - Face-to-Face Encounter 3,215 $113,595
Top 10 MCM/PESN Services
By Expenditures

Page 12
FY 25 Service Utilization Data
aid
sn
et.
org
Clients Total EXHD
MCM – Documentation 7,203 $891,674
MCM - Face-to-Face Encounter 6,733 $1,524,325
MCM - Adherence Counseling 6,707 $261,986
PESN – Documentation 6,344 $144,536
PESN – Collateral 6,221 $199,446
MCM – Collateral 5,575 $464,389
MCM - Telephone 4,861 $184,818
PESN - Telephone Encounter with Client/Rep. 4,560 $58,747
MCM – Plan of Care activities 4,204 $167,060
PESN - Face-to-Face Encounter 3,215 $113,595
Top 10 MCM/PESN Services
By Clients Served
FY 25 Service Utilization Data
aid
sn
et.
org
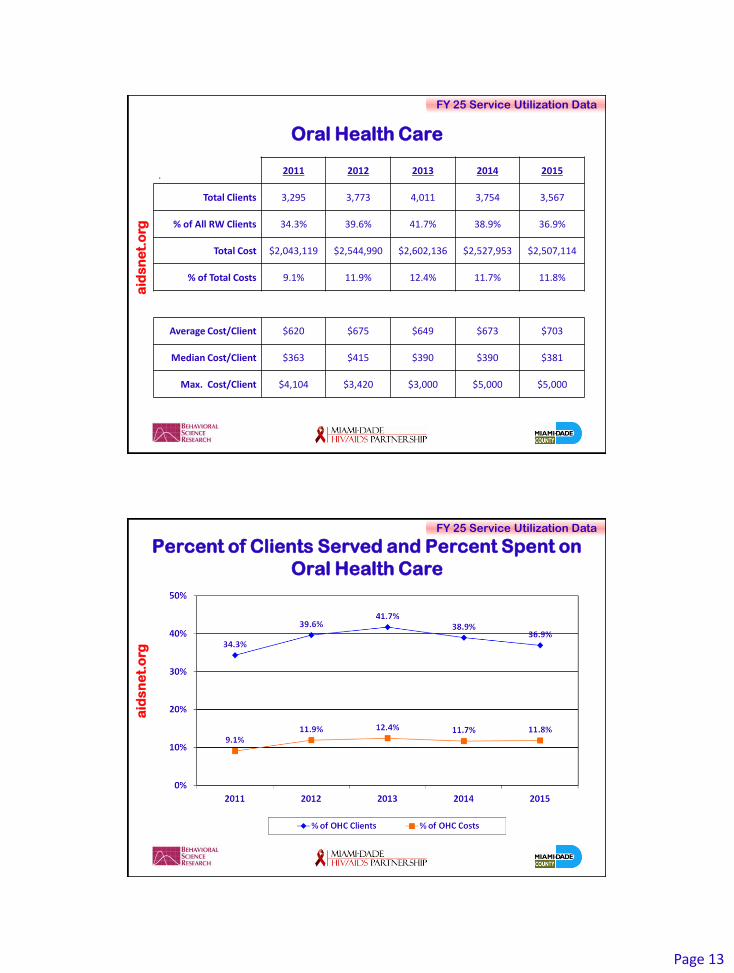
Oral Health Care
Page 13
FY 25 Service Utilization Data
aid
sn
et.
org
Oral Health Care
. 2011 2012 2013 2014 2015
Total Clients 3,295 3,773 4,011 3,754 3,567
% of All RW Clients 34.3% 39.6% 41.7% 38.9% 36.9%
Total Cost $2,043,119 $2,544,990 $2,602,136 $2,527,953 $2,507,114
% of Total Costs 9.1% 11.9% 12.4% 11.7% 11.8%
Average Cost/Client $620 $675 $649 $673 $703
Median Cost/Client $363 $415 $390 $390 $381
Max. Cost/Client $4,104 $3,420 $3,000 $5,000 $5,000
FY 25 Service Utilization Data
aid
sn
et.
org
Percent of Clients Served and Percent Spent on
Oral Health Care

Page 14
FY 25 Service Utilization Data
aid
sn
et.
org
Gender and Ethnicity Percent Receiving Oral Health Care
Percent of All Ryan White Program Clients
Hispanic Male 51% 46%
Hispanic Female 7% 7%
Black Male 14% 18%
Black Female 10% 12%
Haitian Male 5% 5%
Haitian Female 5% 6%
White Male 6% 6%
White Female 1% 1%
Oral Health Care
by Gender and Ethnicity
FY 25 Service Utilization Data
aid
sn
et.
org
Top 10 Oral Health Care Services
By Expenditures
Clients Total EXHD
D2751: Crown-a porcelain cap placed on damaged teeth 367 $420,231
D2391: Resin-Based Composite Restorations – filling or reconstruction to one area on premolars or molars
879 $157,337
D2392: Resin-Based Composite Restorations – filling or reconstruction to two areas on premolars or molars
757 $147,477
D5214: Partial denture of the lower jaw 143 $136,080
D4355: Removal of plaque/tartar from the entire mouth to allow for a comprehensive exam
780 $130,648
D0330: Panoramic scan of both the upper & lower jaw 1,091 $99,720
D3330: Root canal of a molar tooth 125 $92,355
D5213: Partial denture of the upper jaw 89 $85,995
D4341: Cleaning of the crown & root surfaces to remove plaque & calculus on 4+ teeth per quadrant
473 $75,780
D0210: X-ray of the whole mouth 689 $65,280

Page 15
FY 25 Service Utilization Data
aid
sn
et.
org
Clients Total EXHD
D1330: Oral Hygiene Instruction 1456 $33,030
D0120: Periodic Oral Examination - Established Patient 1137 $52,335
D0330: Panoramic scan of both the upper & lower jaw 1091 $99,720
D1050: Comprehensive Oral Evaluation – New/Established Pt 942 $45,360
D2391: Resin-Based Composite Restorations – filling or reconstruction to one area on premolars or molars
879 $157,337
D1110: Prophylaxis – removal of plaque, tartar & stains 826 $58,266
D4355: Removal of plaque/tartar from the entire mouth to allow for a comprehensive exam
780 $130,648
D2392: Resin-Based Composite Restorations – filling or reconstruction to two areas on premolars or molars
757 $147,477
D0274: X-rays of back teeth 756 $25,278
D0210: X-ray of the whole mouth 689 $65,280
Top 10 Oral Health Care Services
By Clients Served
FY 25 Service Utilization Data
aid
sn
et.
org
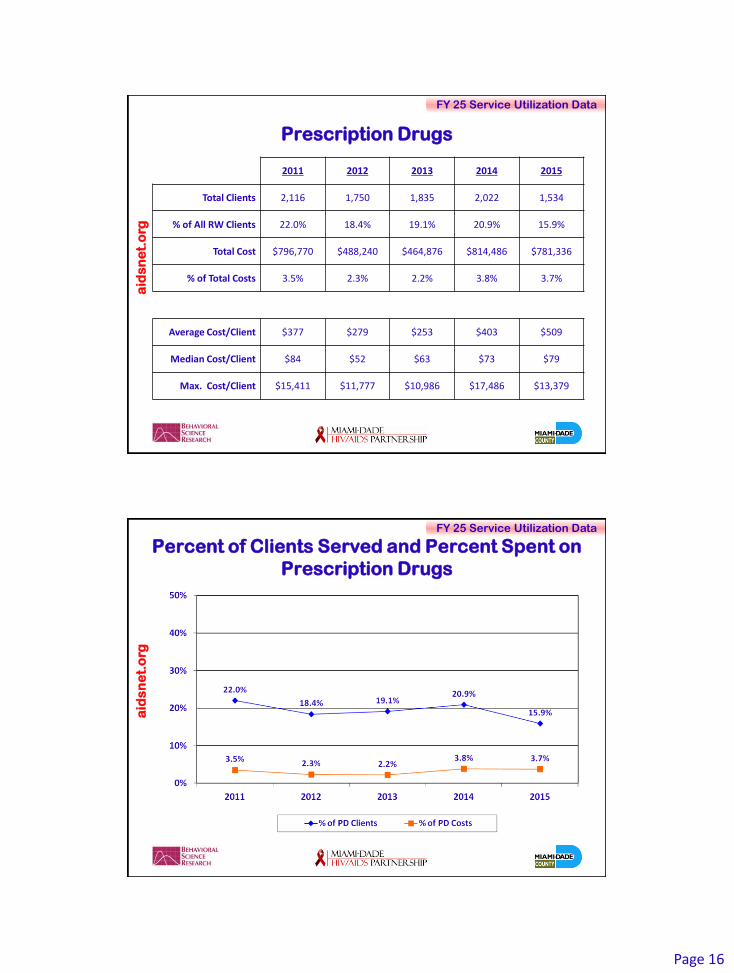
Prescription Drugs
Page 16
FY 25 Service Utilization Data
aid
sn
et.
org
Prescription Drugs
2011 2012 2013 2014 2015
Total Clients 2,116 1,750 1,835 2,022 1,534
% of All RW Clients 22.0% 18.4% 19.1% 20.9% 15.9%
Total Cost $796,770 $488,240 $464,876 $814,486 $781,336
% of Total Costs 3.5% 2.3% 2.2% 3.8% 3.7%
Average Cost/Client $377 $279 $253 $403 $509
Median Cost/Client $84 $52 $63 $73 $79
Max. Cost/Client $15,411 $11,777 $10,986 $17,486 $13,379
FY 25 Service Utilization Data
aid
sn
et.
org
Percent of Clients Served and Percent Spent on
Prescription Drugs

Page 17
FY 25 Service Utilization Data
aid
sn
et.
org
Percent of Clients Served and Percent Spent
by Prescription Drug Class
All PD OI Meds Anti-HIV
Agent
Psychi- atric Meds
Cardio- Hyperlip
Meds Diabetes
Meds Other RW
Form.
Total Clients 1,534 105 118 375 382 85 1,133
% of All PD Clients
100.0% 6.8% 7.7% 24.5% 24.9% 5.5% 73.9%
Total Cost $781,336 $9,086 $164,786 $237,767 $137,447 $41,552 $189,213
% of Total PD Costs
100.0% 1.2% 21.1% 30.4% 17.6% 5.3% 24.2%
Average Cost/Client
$5093 $87 $1,397 $634 $360 $489 $167
Median Cost/Client
$79 $28 $1,200 $84 $98 $101 $42
Max. Cost/Client
$13,379 $1,035 $8,168 $11,356 $3,407 $7,089 $5,121
FY 25 Service Utilization Data
aid
sn
et.
org
Gender and Ethnicity Percent Receiving Prescription Drugs
Percent of All Ryan White Program Clients
Hispanic Male 50% 46%
Hispanic Female 7% 7%
Black Male 15% 18%
Black Female 10% 12%
Haitian Male 4% 5%
Haitian Female 6% 6%
White Male 7% 6%
White Female 1% 1%
Prescription Drugs
by Gender and Ethnicity

Page 18
FY 25 Service Utilization Data
aid
sn
et.
org
Gender and Ethnicity
All PD (n=1,534)
OI Meds (n=105)
Anti-HIV Agent
(n=118)
Psychi-atric
Meds (n=375)
Cardio- Hyperlip
Meds (n=382)
Diabetes Meds (n=85)
Other RW Formulary (n=1,133)
Hispanic Male 50% 36% 38% 38% 50% 43% 50%
Hispanic Female
7% 6% 9% 7% 8% 11% 7%
Black Male 15% 27% 22% 17% 13% 19% 15%
Black Female 10% 15% 12% 20% 15% 18% 10%
Haitian Male 4% 3% 3% 4% 4% 5% 5%
Haitian Female 6% 2% 6% 9% 6% 5% 6%
White Male 7% 11% 10% 6% 5% 0% 6%
White Female 1% 1% 0% <1% 1% 0% 1%
Prescription Drug Class
by Gender and Ethnicity
FY 25 Service Utilization Data
aid
sn
et.
org
Clients Total EXHD
RX0922 – Quetiapine (Psychiatric Med.) 67 $114,648
RX0411 – Stribild (Anti-HIV Agent) 36 $66,856
RX0816 – Rosuvastatin Calcium (Cardio-Hyperlip Med.) 100 $55,237
RX1101 – Omeprazole (Gastric Med.) 95 $36,901
RX0817 – Atorvastatin (Cardio-Hyperlip Med.) 82 $35,638
RX0416 – Triumeq (Anti-HIV Agent) 14 $28,753
RX0417 – Atripla (Anti-HIV Agent) 21 $21,244
RX090 – Bupropion (Psychiatric Med.) 63 $20,777
RX0410 – Truvada (Anti-HIV Agent) 27 $13,404
RX0919 – Risperidone (Psychiatric Med.) 24 $13,279
Top 10 Prescription Drugs
By Expenditures

Page 19
FY 25 Service Utilization Data
aid
sn
et.
org
Clients Total EXHD
RX0106 – Ibuprofen (Anti-Inflammatory Med.) 154 $11,260
RX2001 – Multivitamin 154 $3,083
RX0514 – Doxycycline (oral) (Bacterial treatment) 109 $5,503
RX0816 – Rosuvastatin Calcium (Cardio-Hyperlip Med.) 100 $55,237
RX1101 – Omeprazole (Gastric Med.) 95 $36,901
RX1803 – Albuterol (Asthma Med.) 93 $9,127
RX0107 – Naproxen (Anti-Inflammatory Drug) 92 $5,284
RX0925 – Clonazepam (Psychiatric Med.) 89 $9,732
RX0812 – Hydrochlorothiazide/HCTZ (Cardio-Hyperlip Med.) 86 $4,689
RX0817 – Atorvastatin (Cardio-Hyperlip Med.) 82 $35,638
Top 10 Prescription Drugs
By Clients Served
FY 25 Service Utilization Data
aid
sn
et.
org
Health Insurance Services

Page 20
FY 25 Service Utilization Data
aid
sn
et.
org
Health Insurance Services
2011 2012 2013 2014 2015
Total Clients 466 412 397 921 1,243
% of All RW Clients 4.9% 4.3% 4.1% 9.5% 12.9%
Total Cost $783,776 $530,720 $679,885 $1,553,913 $2,958,812
% of Total Costs 3.5% 2.5% 3.2% 7.2% 14.0%
Average Cost/Client $1,682 $1,288 $1,713 $1,687 $2,380
Median Cost/Client $1,076 $743 $1,050 $984 $1,574
Max. Cost/Client $25,139 $16,613 $23,482 $22,918 $11,876
FY 25 Service Utilization Data
aid
sn
et.
org
Percent of Clients Served and Percent Spent on
Health Insurance Services

Page 21
FY 25 Service Utilization Data
aid
sn
et.
org
Gender and Ethnicity Percent Receiving Insurance Services
Percent of All Ryan White Program Clients
Hispanic Male 63% 46%
Hispanic Female 5% 7%
Black Male 8% 18%
Black Female 6% 12%
Haitian Male 5% 5%
Haitian Female 6% 6%
White Male 7% 6%
White Female 1% 1%
Health Insurance Services
by Gender and Ethnicity
FY 25 Service Utilization Data
aid
sn
et.
org
Clients Total EXHD
ACA Premiums (Monthly) 828 $2,259,795
Drug Co-Payments 315 $434,495
ACA Drug Co-Payments 258 $181,977
Insurance Deductibles 38 $24,546
ACA Doctor Office Visit Co-Payment 79 $17,297
ACA Wrap Around Insurance Deductibles 19 $13,401
AICP Premiums (Monthly) 3 $11,609
ACA Insurance Deductibles 24 $11,513
ACA Rx Drug Co-Pay Part A Transition List 23 $4,603
ACA Lab Diagnostic Test Co-Payment 25 $4,599
ACA Premium (Quarterly) 1 $1,981
Part A ACA Labs and Diagnostics 3 $429
Part A ACA Office Visit 2 $140
Types of
Health Insurance Services

Page 22
FY 25 Service Utilization Data
aid
sn
et.
org
Mental Health Therapy/Counseling
FY 25 Service Utilization Data
aid
sn
et.
org
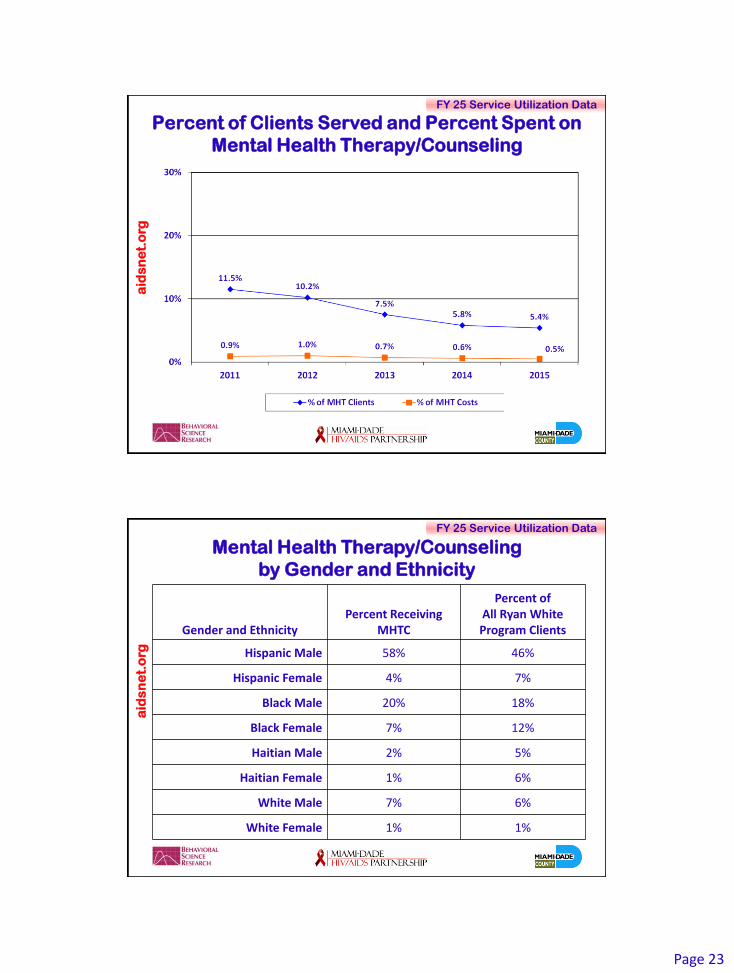
Mental Health Therapy/Counseling
2011 2012 2013 2014 2015
Total Clients 1,106 975 726 563 517
% of All RW Clients 11.5% 10.2% 7.5% 5.8% 5.4%
Total Cost $204,720 $202,239 $139,153 $138,318 $105,440
% of Total Costs 0.9% 1.0% 0.7% 0.6% 0.5%
Average Cost/Client $185 $207 $192 $246 $204
Median Cost/Client $98 $98 $98 $98 $98
Max. Cost/Client $2,985 $2,633 $3,640 $3,543 $4,323
Page 23
FY 25 Service Utilization Data
aid
sn
et.
org
Percent of Clients Served and Percent Spent on
Mental Health Therapy/Counseling
FY 25 Service Utilization Data
aid
sn
et.
org
Gender and Ethnicity Percent Receiving
MHTC
Percent of All Ryan White Program Clients
Hispanic Male 58% 46%
Hispanic Female 4% 7%
Black Male 20% 18%
Black Female 7% 12%
Haitian Male 2% 5%
Haitian Female 1% 6%
White Male 7% 6%
White Female 1% 1%
Mental Health Therapy/Counseling
by Gender and Ethnicity

Page 24
FY 25 Service Utilization Data
aid
sn
et.
org
Clients Total EXHD
MH2 - Individual Mental Health Counseling Level II 511 $104,325
MH1 - Individual Mental Health Counseling Level I 8 $975
MH2 - Group Mental Health Counseling Level II 7 $140
Types of
Mental Health Therapy/Counseling Services
FY 25 Service Utilization Data
aid
sn
et.
org
Outpatient Substance Abuse Treatment

Page 25
FY 25 Service Utilization Data
aid
sn
et.
org
Outpatient Substance Abuse Treatment
2011 2012 2013 2014 2015
Total Clients 118 105 66 93 59
% of All RW Clients 1.2% 1.1% 0.7% 1.0% 0.6%
Total Cost $106,999 $117,739 $86,930 $110,648 $90,372
% of Total Costs 0.5% 0.6% 0.4% 0.5% 0.4%
Average Cost/Client $907 $1,121 $1,317 $1,190 $1,532
Median Cost/Client $345 $615 $891 $630 $630
Max. Cost/Client $6,339 $8,733 $5,821 $5,676 $5,721
FY 25 Service Utilization Data
aid
sn
et.
org
Percent of Clients Served and Percent Spent on
Outpatient Substance Abuse Treatment

Page 26
FY 25 Service Utilization Data
aid
sn
et.
org
Gender and Ethnicity Percent Receiving
Outpatient SA
Percent of All Ryan White Program Clients
Hispanic Male 17% 46%
Hispanic Female 2% 7%
Black Male 43% 18%
Black Female 24% 12%
Haitian Male 0% 5%
Haitian Female 0% 6%
White Male 10% 6%
White Female 3% 1%
Outpatient Substance Abuse Treatment
by Gender and Ethnicity
FY 25 Service Utilization Data
aid
sn
et.
org
Clients Total EXHD
SA - IS1-Ind. Counseling Level I 56 $54,109
SA - IS2-Ind. Counseling Level II 21 $22,653
SA - GS1-Group Counseling Level I 43 $13,430
SA - GS2-Group Counseling Level II 11 $180
Types of
Outpatient Substance Abuse Treatments

Page 27
FY 25 Service Utilization Data
aid
sn
et.
org
Residential Substance Abuse Treatment
FY 25 Service Utilization Data
aid
sn
et.
org
Residential Substance Abuse Treatment
2011 2012 2013 2014 2015
Total Clients 272 244 237 229 235
% of All RW Clients 2.8% 2.6% 2.5% 2.4% 2.4%
Total Cost $2,288,125 $2,166,875 $2,049,125 $2,292,150 $2,096,575
% of Total Costs 10.2% 10.2% 9.8% 10.6% 9.9%
Average Cost/Client $8,412 $8,881 $8,646 $10,009 $8,922
Median Cost/Client $8,438 $8,938 $8,250 $9,750 $8,400
Max. Cost/Client $22,125 $23,625 $21,500 $25,050 $18,000

Page 28
FY 25 Service Utilization Data
aid
sn
et.
org
Percent of Clients Served and Percent Spent on
Residential Substance Abuse Treatment
FY 25 Service Utilization Data
aid
sn
et.
org
Gender and Ethnicity Percent Receiving
Residential SA
Percent of All Ryan White Program Clients
Hispanic Male 17% 46%
Hispanic Female 4% 7%
Black Male 45% 18%
Black Female 18% 12%
Haitian Male 3% 5%
Haitian Female <1% 6%
White Male 9% 6%
White Female 4% 1%
Residential Substance Abuse Treatment
by Gender and Ethnicity

Page 29
FY 25 Service Utilization Data
aid
sn
et.
org
Food Bank
FY 25 Service Utilization Data
aid
sn
et.
org
Food Bank
2011 2012 2013 2014 2015
Total Clients 389 407 428 632 784
% of All RW Clients 4.1% 4.3% 4.5% 6.5% 8.1%
Total Cost $382,476 $349,369 $373,744 $712,842 $899,766
% of Total Costs 1.7% 1.6% 1.8% 3.3% 4.2%
Average Cost/Client $983 $858 $873 $1,128 $1,148
Median Cost/Client $932 $740 $888 $1,036 $999
Max. Cost/Client $2,930 $2,782 $1,924 $2,516 $2,368

Page 30
FY 25 Service Utilization Data
aid
sn
et.
org
Percent of Clients Served and Percent Spent on
Food Bank
FY 25 Service Utilization Data
aid
sn
et.
org
Gender and Ethnicity Percent Receiving
Food Bank Services
Percent of All Ryan White Program Clients
Hispanic Male 42% 46%
Hispanic Female 8% 7%
Black Male 19% 18%
Black Female 16% 12%
Haitian Male 3% 5%
Haitian Female 4% 6%
White Male 6% 6%
White Female 1% 1%
Food Bank
by Gender and Ethnicity
Page 31
FY 25 Service Utilization Data
aid
sn
et.
org
Legal Assistance
FY 25 Service Utilization Data
aid
sn
et.
org
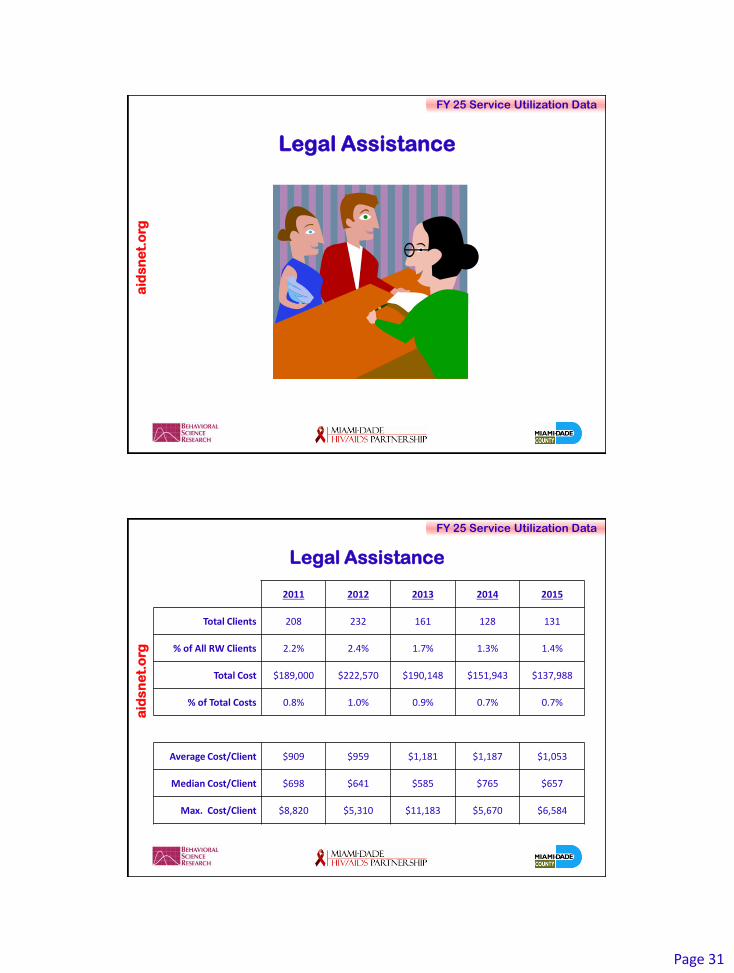
Legal Assistance
2011 2012 2013 2014 2015
Total Clients 208 232 161 128 131
% of All RW Clients 2.2% 2.4% 1.7% 1.3% 1.4%
Total Cost $189,000 $222,570 $190,148 $151,943 $137,988
% of Total Costs 0.8% 1.0% 0.9% 0.7% 0.7%
Average Cost/Client $909 $959 $1,181 $1,187 $1,053
Median Cost/Client $698 $641 $585 $765 $657
Max. Cost/Client $8,820 $5,310 $11,183 $5,670 $6,584

Page 32
FY 25 Service Utilization Data
aid
sn
et.
org
Percent of Clients Served and Percent Spent on
Legal Assistance
FY 25 Service Utilization Data
aid
sn
et.
org
Gender and Ethnicity Percent Receiving Legal Assistance
Percent of All Ryan White Program Clients
Hispanic Male 44% 46%
Hispanic Female 5% 7%
Black Male 16% 18%
Black Female 15% 12%
Haitian Male 4% 5%
Haitian Female 6% 6%
White Male 8% 6%
White Female 2% 1%
Legal Assistance
by Gender and Ethnicity

Page 33
FY 25 Service Utilization Data
aid
sn
et.
org
Transportation Vouchers
FY 25 Service Utilization Data
aid
sn
et.
org
Transportation Vouchers
2011 2012 2013 2014 2015
Total Clients 521 548 787 824 722
% of All RW Clients 5.4% 5.8% 8.2% 8.5% 7.5%
Total Cost $79,603 $82,135 $149,303 $188,094 $144,580
% of Total Costs 0.4% 0.4% 0.7% 0.9% 0.7%
Average Cost/Client $153 $150 $190 $228 $200
Median Cost/Client $107 $107 $125 $126 $126
Max. Cost/Client $767 $708 $752 $756 $797

Page 34
FY 25 Service Utilization Data
aid
sn
et.
org
Percent of Clients Served and Percent Spent on
Transportation Vouchers
FY 25 Service Utilization Data
aid
sn
et.
org
Gender and Ethnicity Percent Receiving Trans. Vouchers
Percent of All Ryan White Program Clients
Hispanic Male 35% 46%
Hispanic Female 10% 7%
Black Male 22% 18%
Black Female 12% 12%
Haitian Male 6% 5%
Haitian Female 10% 6%
White Male 4% 6%
White Female 2% 1%
Transportation Vouchers
by Gender and Ethnicity

Page 35
FY 25 Service Utilization Data
aid
sn
et.
org
Thank you for your attention!
Any questions?