Embed Size (px)
Citation preview
© 2017 Adobe Systems Incorporated. All Rights Reserved. Adobe Confidential.
Email Use 2017 – France reportRyan Dietzen | Marketing Insights & Operations (MIO)
Research conducted by:
© 2017 Adobe Systems Incorporated. All Rights Reserved. Adobe Confidential.
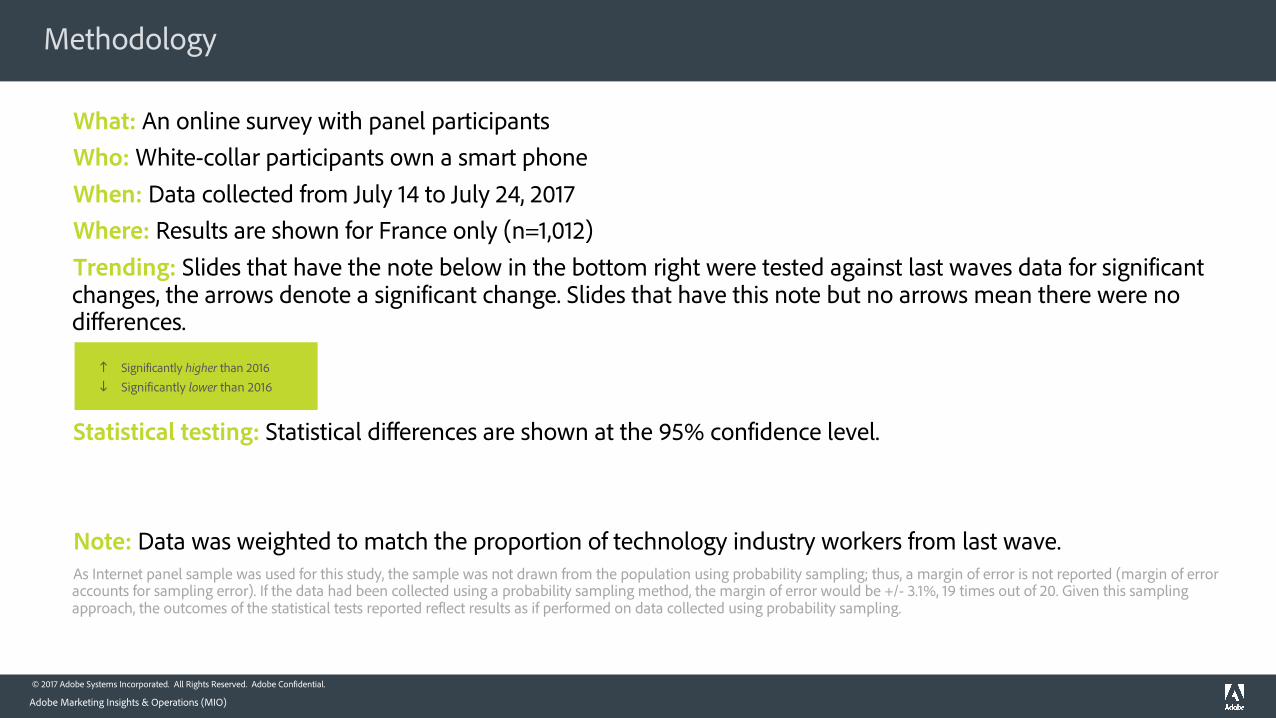
What: An online survey with panel participantsWho: White-collar participants own a smart phoneWhen: Data collected from July 14 to July 24, 2017Where: Results are shown for France only (n=1,012)Trending: Slides that have the note below in the bottom right were tested against last waves data for significant changes, the arrows denote a significant change. Slides that have this note but no arrows mean there were no differences.
Statistical testing: Statistical differences are shown at the 95% confidence level.
Note: Data was weighted to match the proportion of technology industry workers from last wave.As Internet panel sample was used for this study, the sample was not drawn from the population using probability sampling; thus, a margin of error is not reported (margin of error accounts for sampling error). If the data had been collected using a probability sampling method, the margin of error would be +/- 3.1%, 19 times out of 20. Given this sampling approach, the outcomes of the statistical tests reported reflect results as if performed on data collected using probability sampling.
Methodology
Adobe Marketing Insights & Operations (MIO)
h Significantly higher than 2016i Significantly lower than 2016
© 2017 Adobe Systems Incorporated. All Rights Reserved. Adobe Confidential.
• Most respondents check their work and personal email at least every few hours, which they feel is as often as they should. That said, fewer respondents are checking their work and personal email than last year.▬ 18 to 34 year olds are most likely to check their work emails while still in bed, while those 35 or older are most likely to
wait until they get to the office to check their work email.▬ Nearly half of respondents do not check any email while on vacation, and two fifths never check their work email while
on vacation.
• Computers are the most common device for checking email, although smartphones are more common for those aged 18 to 34.
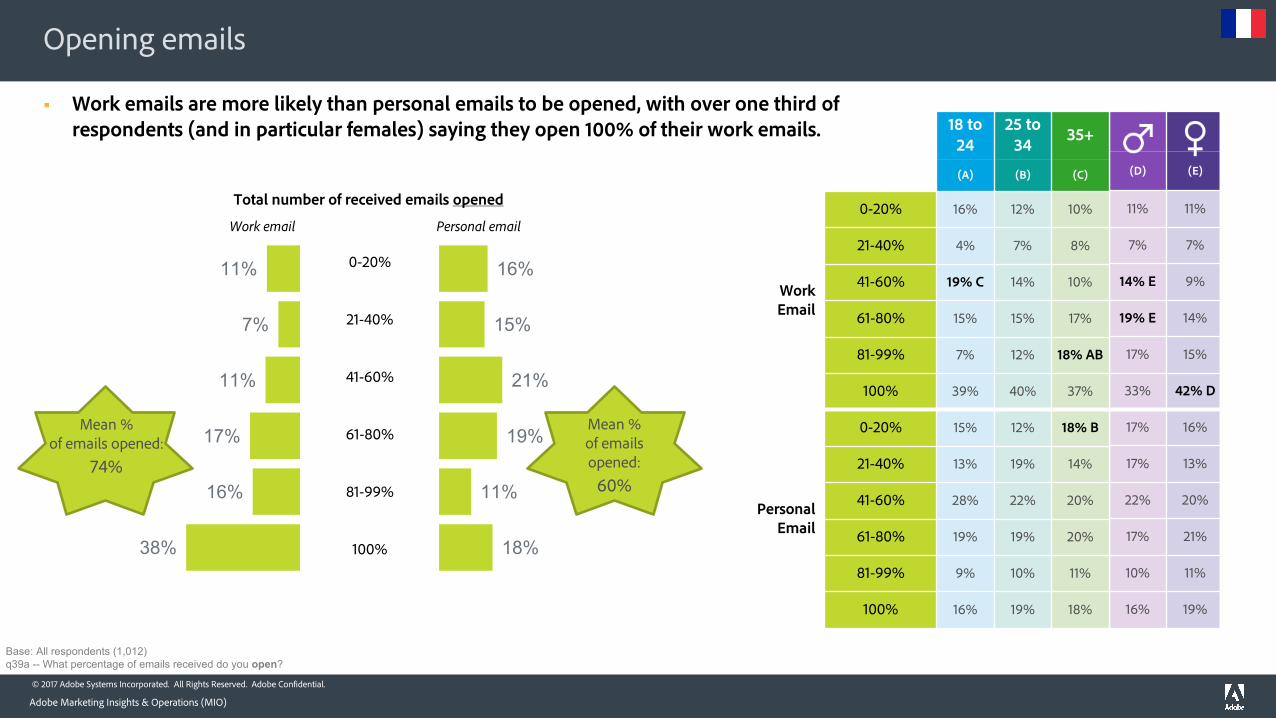
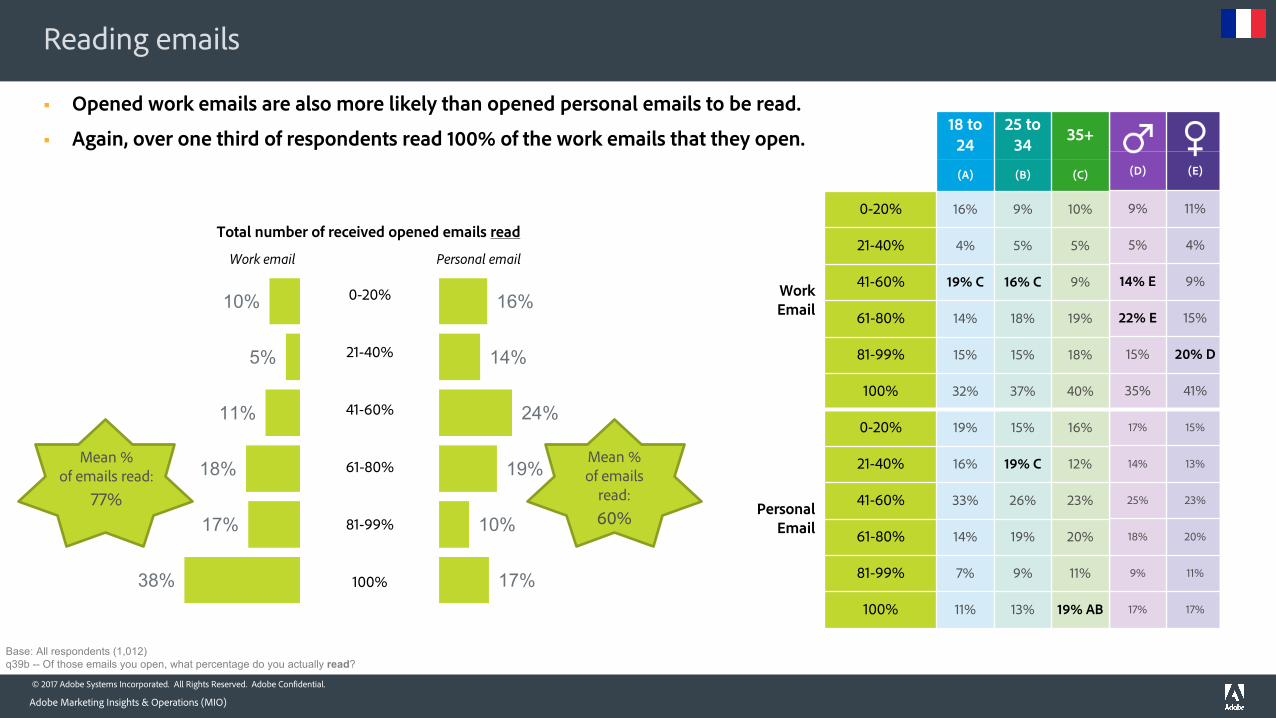
• 74% of work emails and 60% of personal emails are opened. Of those, 77% of work emails and 60% of personal emails are read.
• Most respondents expect their email use (both personal and work) to remain the same over the next two years.
• Respondents most likely feel indifference when checking their work email and excitement when checking their personal email. Additionally, over half get to “inbox-zero” which nearly half feel is amazing.
Summary of Results
Adobe Marketing Insights & Operations (MIO)
Email Usage
© 2017 Adobe Systems Incorporated. All Rights Reserved. Adobe Confidential.
• Email, phone calls, and face-to-face conversations are the most used communication methods (to communicate with colleagues).▬ Face-to-face conversations are the most preferred method to communicate with colleagues, even more preferred than in
2016.
• Face-to-face conversations are also the most common primary communication tool used by companies.
• For quick questions for a colleague, respondents are split as to their preferred communication method: nearly equal amounts are likely to use the phone, email, or a face-to-face conversation.
• For many different types of work discussions, email and face-to-face conversations are considered the most appropriate communication methods.▬ In general, face-to-face communication becomes more appropriate as the nature of the topic becomes more serious.
Summary of Results
Adobe Marketing Insights & Operations (MIO)
Work Communication in General
© 2017 Adobe Systems Incorporated. All Rights Reserved. Adobe Confidential.
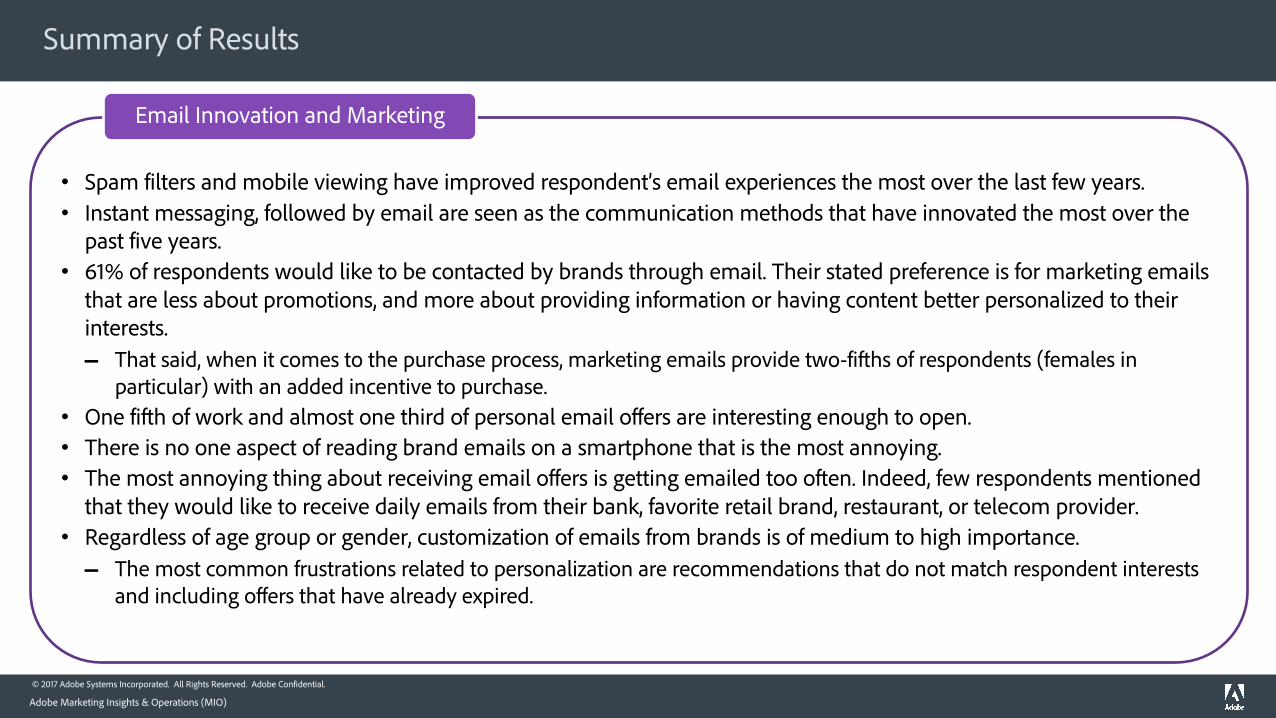
• Spam filters and mobile viewing have improved respondent’s email experiences the most over the last few years.• Instant messaging, followed by email are seen as the communication methods that have innovated the most over the
past five years.• 61% of respondents would like to be contacted by brands through email. Their stated preference is for marketing emails
that are less about promotions, and more about providing information or having content better personalized to their interests.▬ That said, when it comes to the purchase process, marketing emails provide two-fifths of respondents (females in
particular) with an added incentive to purchase.• One fifth of work and almost one third of personal email offers are interesting enough to open.• There is no one aspect of reading brand emails on a smartphone that is the most annoying.• The most annoying thing about receiving email offers is getting emailed too often. Indeed, few respondents mentioned
that they would like to receive daily emails from their bank, favorite retail brand, restaurant, or telecom provider.• Regardless of age group or gender, customization of emails from brands is of medium to high importance.▬ The most common frustrations related to personalization are recommendations that do not match respondent interests
and including offers that have already expired.
Summary of Results
Adobe Marketing Insights & Operations (MIO)
Email Innovation and Marketing
© 2017 Adobe Systems Incorporated. All Rights Reserved. Adobe Confidential. 6
Profile of Participants
Adobe Marketing Insights & Operations (MIO)
© 2017 Adobe Systems Incorporated. All Rights Reserved. Adobe Confidential.
Who Participated in the Survey
Adobe Marketing Insights & Operations (MIO)
8%
25%
38%
27%
2%
18 to 24
25 to 34
35 to 49
50 to 64
65 or above
Age
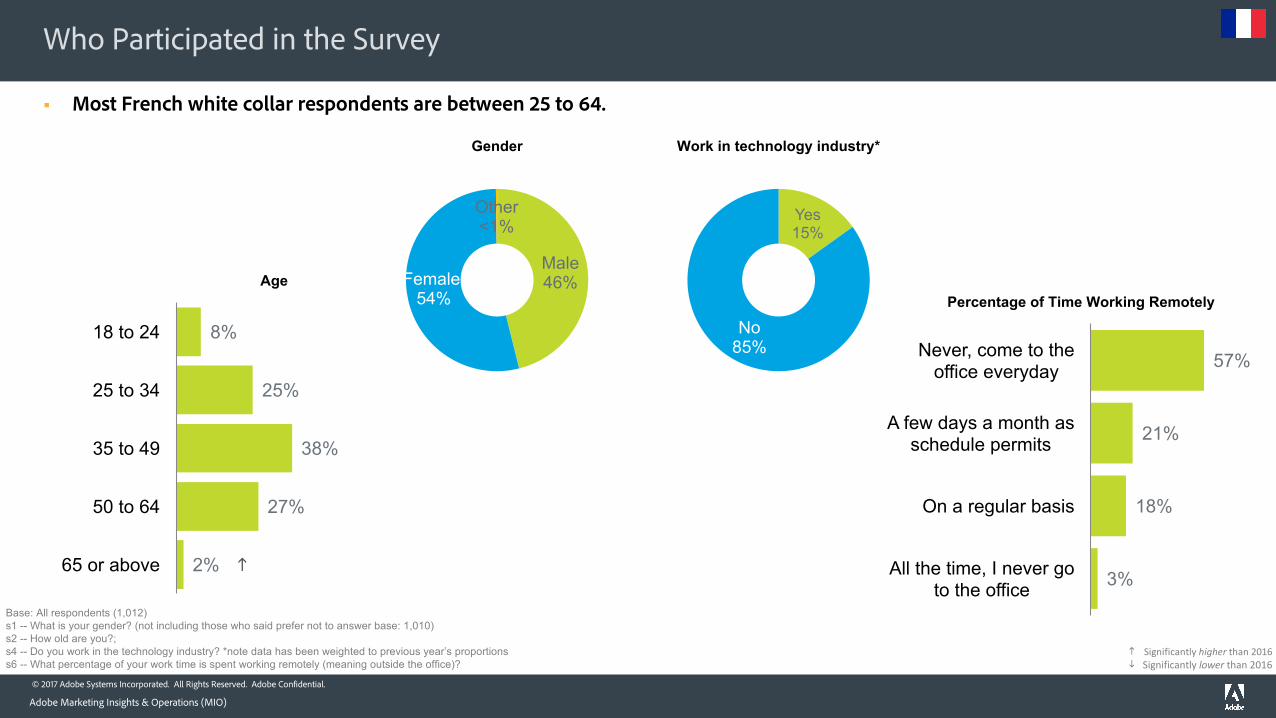
§ Most French white collar respondents are between 25 to 64.
Yes15%
No85%
Work in technology industry*
57%
21%
18%
3%
Never, come to the office everyday
A few days a month as schedule permits
On a regular basis
All the time, I never go to the office
Percentage of Time Working Remotely
Male 46%Female,
54%
Other <1%
Gender
Base: All respondents (1,012)s1 -- What is your gender? (not including those who said prefer not to answer base: 1,010)s2 -- How old are you?;s4 -- Do you work in the technology industry? *note data has been weighted to previous year’s proportionss6 -- What percentage of your work time is spent working remotely (meaning outside the office)?
Significantlyhigherthan2016Significantlylower than2016i
h
h
© 2017 Adobe Systems Incorporated. All Rights Reserved. Adobe Confidential. 8
Email Usage
Adobe Marketing Insights & Operations (MIO)
© 2017 Adobe Systems Incorporated. All Rights Reserved. Adobe Confidential.
Frequency of checking email
Adobe Marketing Insights & Operations (MIO)
Base: All respondents (1,012)q1 -- While at work, how often do you typically check your personal email in a given day?q2 -- Outside of normal work hours, how often do you check your work email in a given day?
(D) (E)
21% 29% D
43% E 35%
16% 13%
10% 13%
10% 11%
10% 17% D
45% 40%
17% 17%
16% 13%
11% 13%
14%
43%
17%
14%
12%
Frequency of checking personal email while at work
Never
Every fewhours
Every hour
Multiple times per hour
Constantly
18 to 24
25 to 34 35+
(A) (B) (C)
Checkingwork email
outside of work hours
Never 13% 25% A 27% A
Every few hours 46% 38% 37%
Every hour 20% C 20% C 11%
Multiple times per hour 10% 8% 13% B
Constantly 11% 8% 11%
Checking personal
email while at work
Never 7% 10% 16% AB
Every few hours 40% 47% 41%
Every hour 23% 21% C 15%
Multiple times per hour 17% 13% 14%
Constantly 13% 8% 14% B
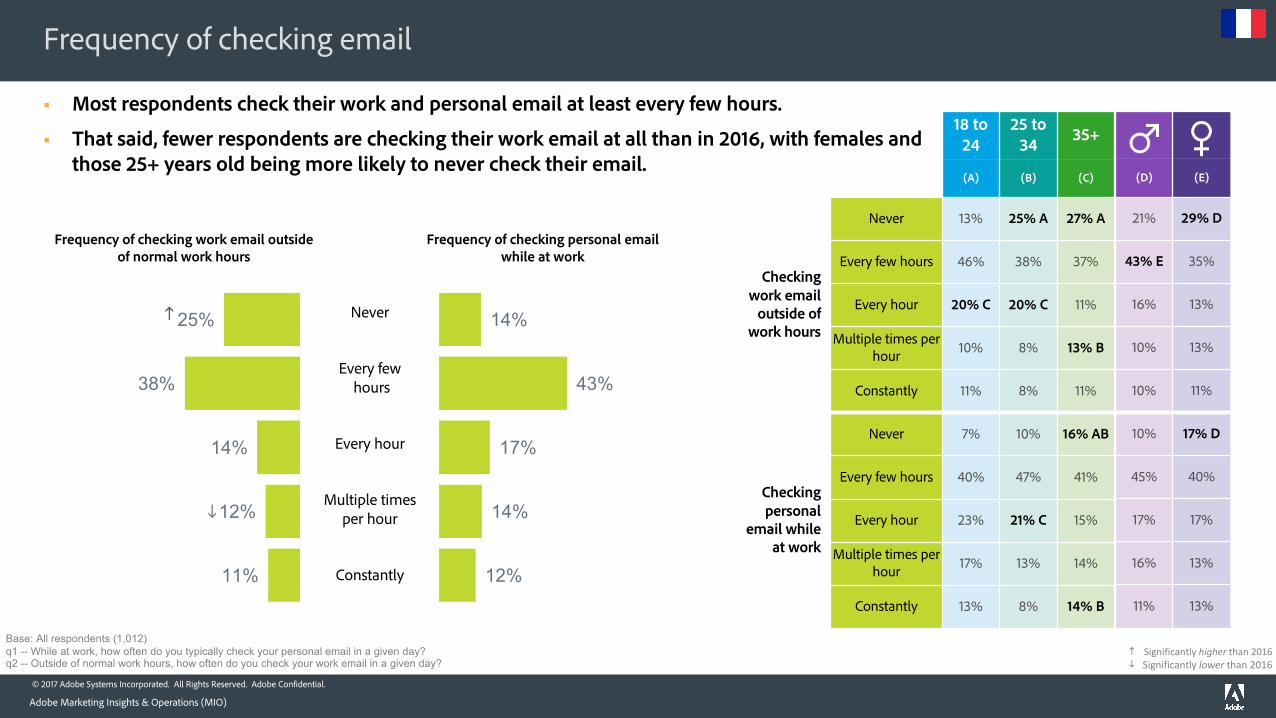
§ Most respondents check their work and personal email at least every few hours.
§ That said, fewer respondents are checking their work email at all than in 2016, with females and those 25+ years old being more likely to never check their email.
Significantlyhigherthan2016Significantlylower than2016i
h
25%
38%
14%
12%
11%
Frequency of checking work email outside of normal work hours
h
i
© 2017 Adobe Systems Incorporated. All Rights Reserved. Adobe Confidential.
Frequency of checking email
Adobe Marketing Insights & Operations (MIO)
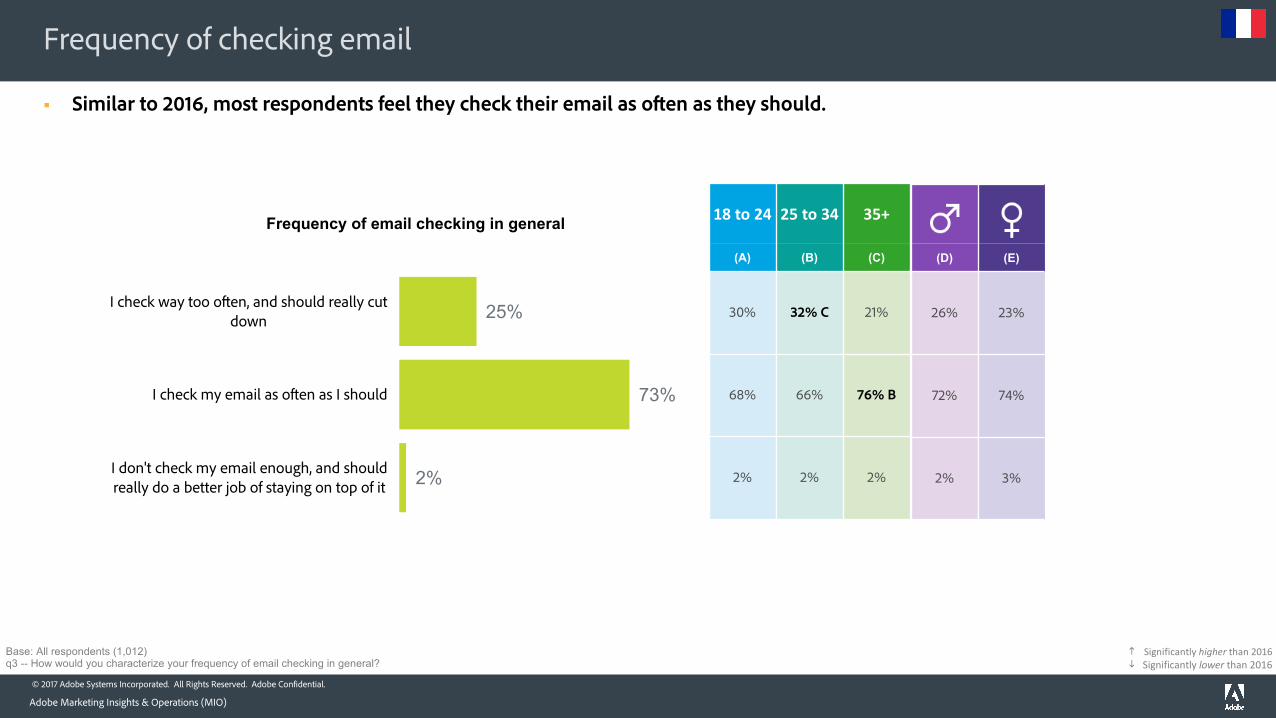
§ Similar to 2016, most respondents feel they check their email as often as they should.
25%
73%
2%
I check way too often, and should really cut down
I check my email as often as I should
I don't check my email enough, and should really do a better job of staying on top of it
Frequency of email checking in general
Base: All respondents (1,012)q3 -- How would you characterize your frequency of email checking in general?
(D) (E)
26% 23%
72% 74%
2% 3%
18to24 25to34 35+
(A) (B) (C)
30% 32% C 21%
68% 66% 76% B
2% 2% 2%
Significantlyhigherthan2016Significantlylower than2016i
h
© 2017 Adobe Systems Incorporated. All Rights Reserved. Adobe Confidential.
Time spent checking email
Adobe Marketing Insights & Operations (MIO)
42%
21%
17%
10%
11%
(D) (E)
47% E 37%
21% 21%
13% 20% D
9% 10%
10% 12%
58% E 50%
16% 19%
14% 11%
7% 7%
5% 12% D
54%
18%
13%
7%
9%
1 hour or less
>1 hour to 2 hours
>2 hours to 4 hours
>4 hours to 6 hours
More than 6 hours
18 to 24
25 to 34 35+
(A) (B) (C)
Work Email
1 hour or less 45% 40% 42%
>1 hour to 2 hours 26% 22% 19%
>2 hours to 4 hours 13% 18% 17%
>4 hours to 6 hours 9% 11% 9%
More than 6 hours 8% 8% 12%
Personal Email
1 hour or less 59% 54% 54%
>1 hour to 2 hours 20% 18% 17%
>2 hours to 4 hours 7% 16% A 12%
>4 hours to 6 hours 8% 5% 7%
More than 6 hours 6% 7% 10%
h
Mean number of hours:
2.8i
Mean number of
hours: 2.3 i
i i
(45%)
(18%)
(14%)
(8%)
(14%)
(3.0)
(37%)
(21%)
(15%)
(10%)
(17%)
(3.5)
Red numbers = 2016
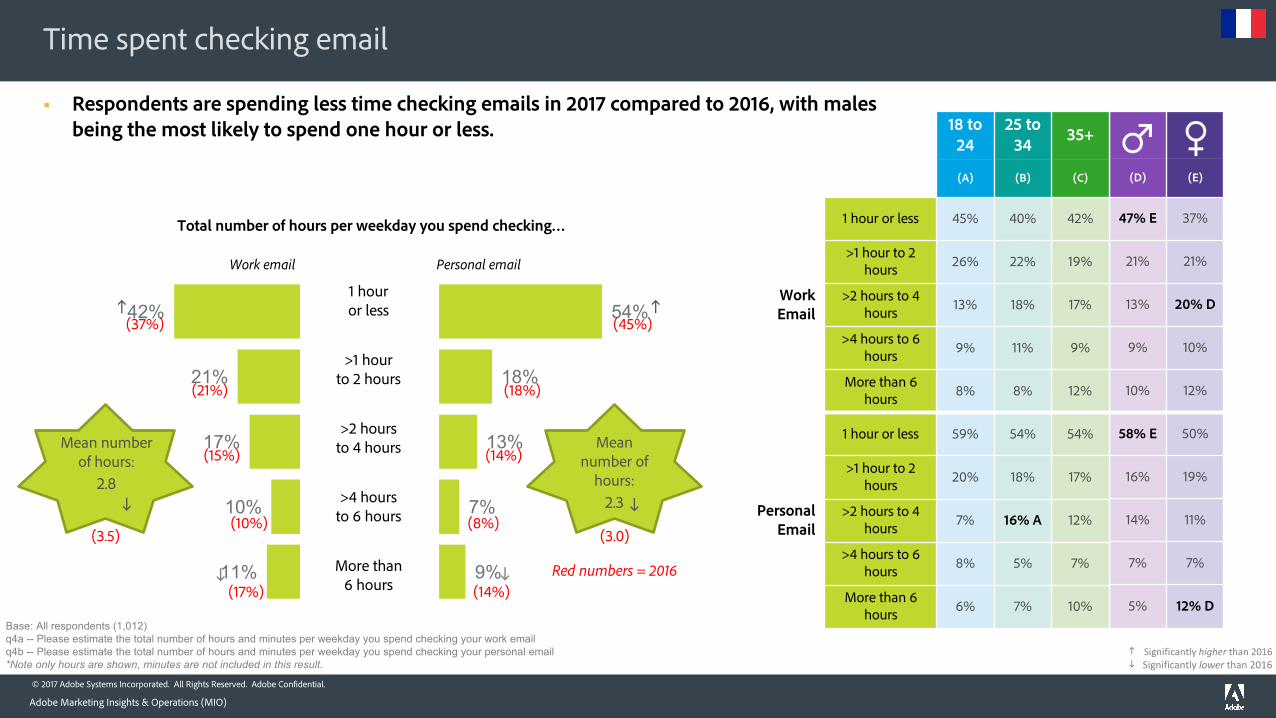
§ Respondents are spending less time checking emails in 2017 compared to 2016, with males being the most likely to spend one hour or less.
Significantlyhigherthan2016Significantlylower than2016i
h
Base: All respondents (1,012)q4a -- Please estimate the total number of hours and minutes per weekday you spend checking your work emailq4b -- Please estimate the total number of hours and minutes per weekday you spend checking your personal email*Note only hours are shown, minutes are not included in this result.
Total number of hours per weekday you spend checking…
Personal emailWork email
h
© 2017 Adobe Systems Incorporated. All Rights Reserved. Adobe Confidential.
Frequency of checking work email before work
Adobe Marketing Insights & Operations (MIO)
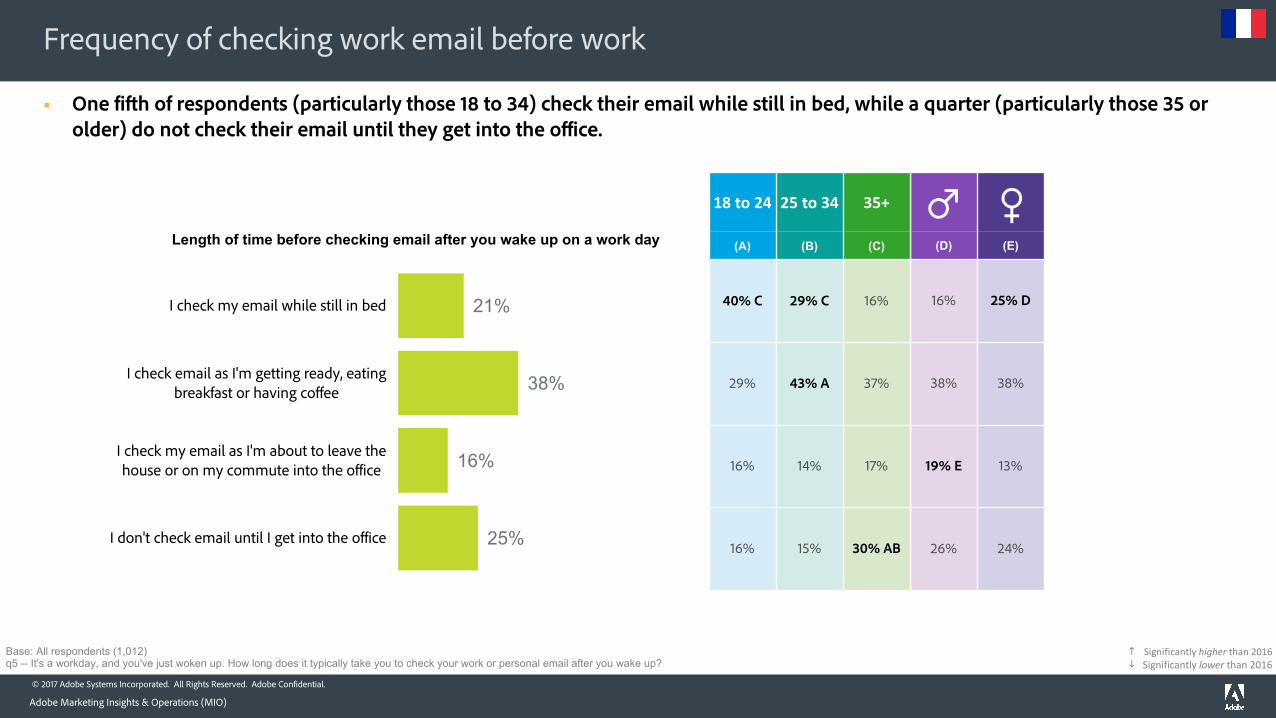
§ One fifth of respondents (particularly those 18 to 34) check their email while still in bed, while a quarter (particularly those 35 or older) do not check their email until they get into the office.
21%
38%
16%
25%
I check my email while still in bed
I check email as I'm getting ready, eating breakfast or having coffee
I check my email as I'm about to leave the house or on my commute into the office
I don't check email until I get into the office
Length of time before checking email after you wake up on a work day
Base: All respondents (1,012)q5 -- It's a workday, and you've just woken up. How long does it typically take you to check your work or personal email after you wake up?
(D) (E)
16% 25% D
38% 38%
19% E 13%
26% 24%
18to24 25to34 35+
(A) (B) (C)
40% C 29% C 16%
29% 43% A 37%
16% 14% 17%
16% 15% 30% AB
Significantlyhigherthan2016Significantlylower than2016i
h
© 2017 Adobe Systems Incorporated. All Rights Reserved. Adobe Confidential.
Checking emails in various situations
Adobe Marketing Insights & Operations (MIO)
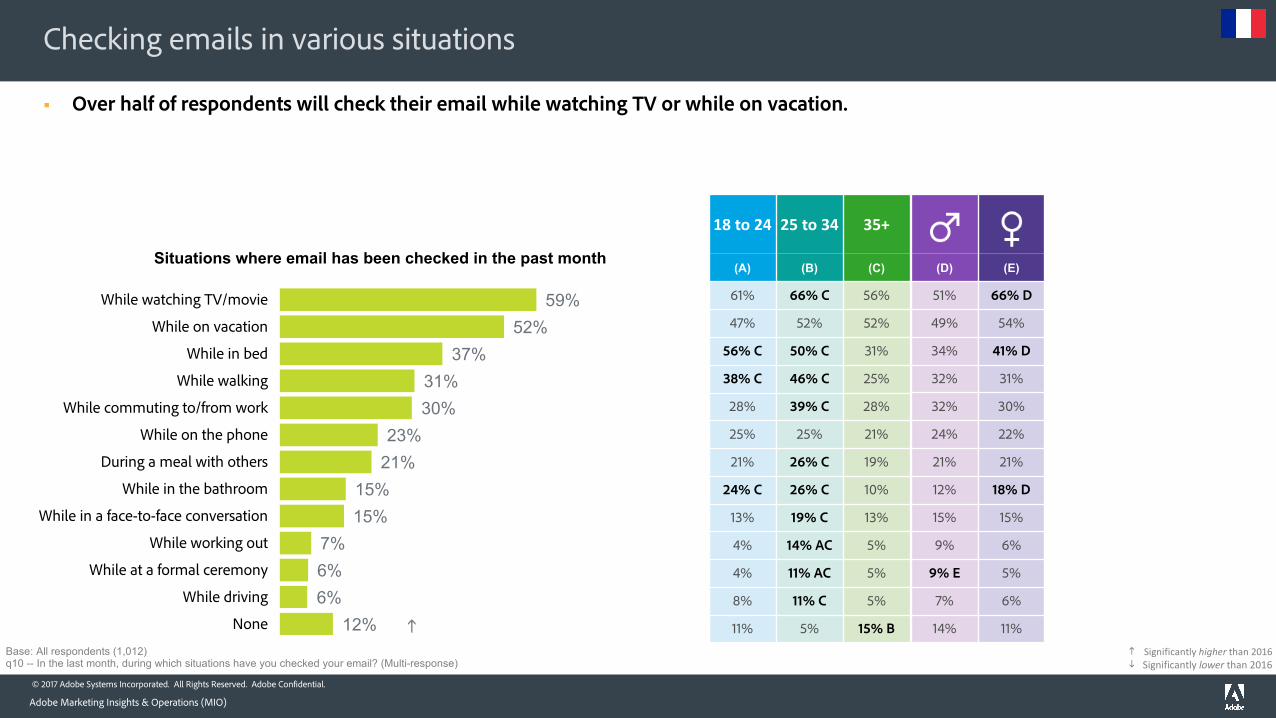
§ Over half of respondents will check their email while watching TV or while on vacation.
59%52%
37%31%30%
23%21%
15%15%
7%6%6%
12%
While watching TV/movie
While on vacation
While in bed
While walking
While commuting to/from work
While on the phone
During a meal with others
While in the bathroom
While in a face-to-face conversation
While working out
While at a formal ceremony
While driving
None
Situations where email has been checked in the past month
Base: All respondents (1,012)q10 -- In the last month, during which situations have you checked your email? (Multi-response)
(D) (E)
51% 66% D
49% 54%
34% 41% D
32% 31%
32% 30%
24% 22%
21% 21%
12% 18% D
15% 15%
9% 6%
9% E 5%
7% 6%
14% 11%
18to24 25to34 35+
(A) (B) (C)
61% 66% C 56%
47% 52% 52%
56% C 50% C 31%
38% C 46% C 25%
28% 39% C 28%
25% 25% 21%
21% 26% C 19%
24% C 26% C 10%
13% 19% C 13%
4% 14% AC 5%
4% 11% AC 5%
8% 11% C 5%
11% 5% 15% BhSignificantlyhigherthan2016Significantlylower than2016i
h
© 2017 Adobe Systems Incorporated. All Rights Reserved. Adobe Confidential.
Checking work email while on vacation
Adobe Marketing Insights & Operations (MIO)
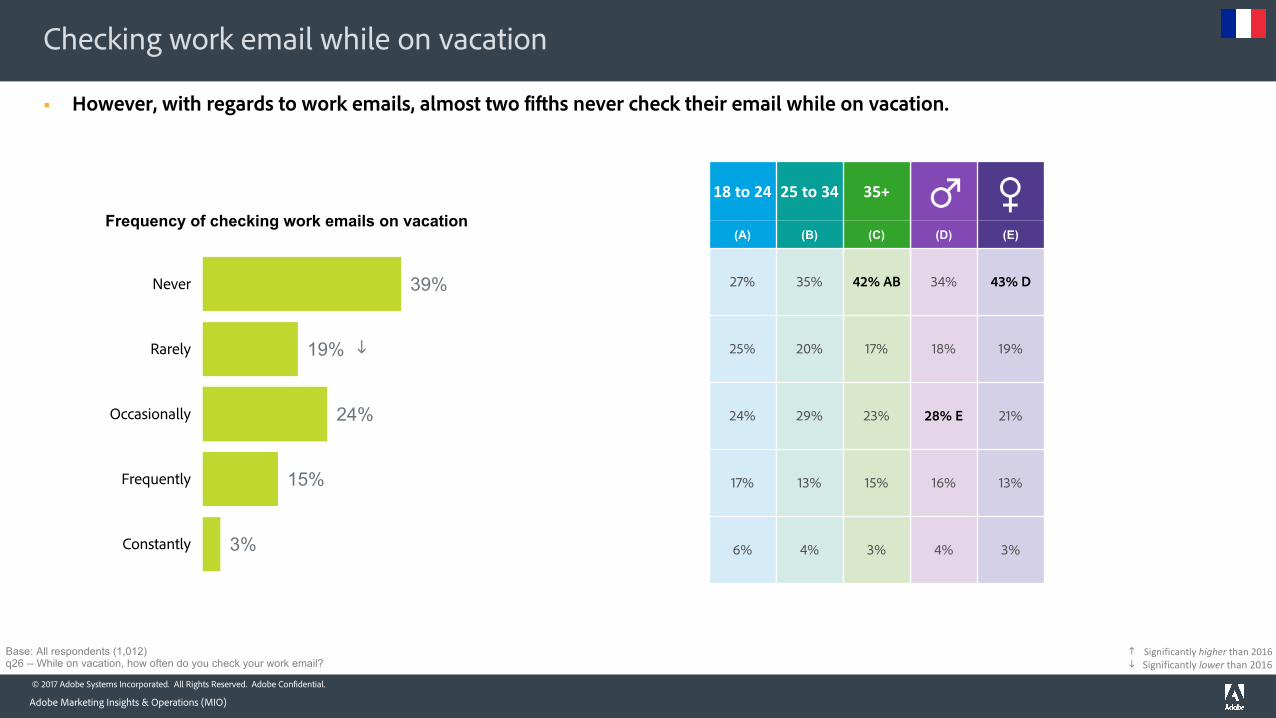
§ However, with regards to work emails, almost two fifths never check their email while on vacation.
39%
19%
24%
15%
3%
Never
Rarely
Occasionally
Frequently
Constantly
Frequency of checking work emails on vacation
Base: All respondents (1,012)q26 -- While on vacation, how often do you check your work email?
(D) (E)
34% 43% D
18% 19%
28% E 21%
16% 13%
4% 3%
18to24 25to34 35+
(A) (B) (C)
27% 35% 42% AB
25% 20% 17%
24% 29% 23%
17% 13% 15%
6% 4% 3%
Significantlyhigherthan2016Significantlylower than2016i
h
i
© 2017 Adobe Systems Incorporated. All Rights Reserved. Adobe Confidential.
Devices for checking emails
Adobe Marketing Insights & Operations (MIO)
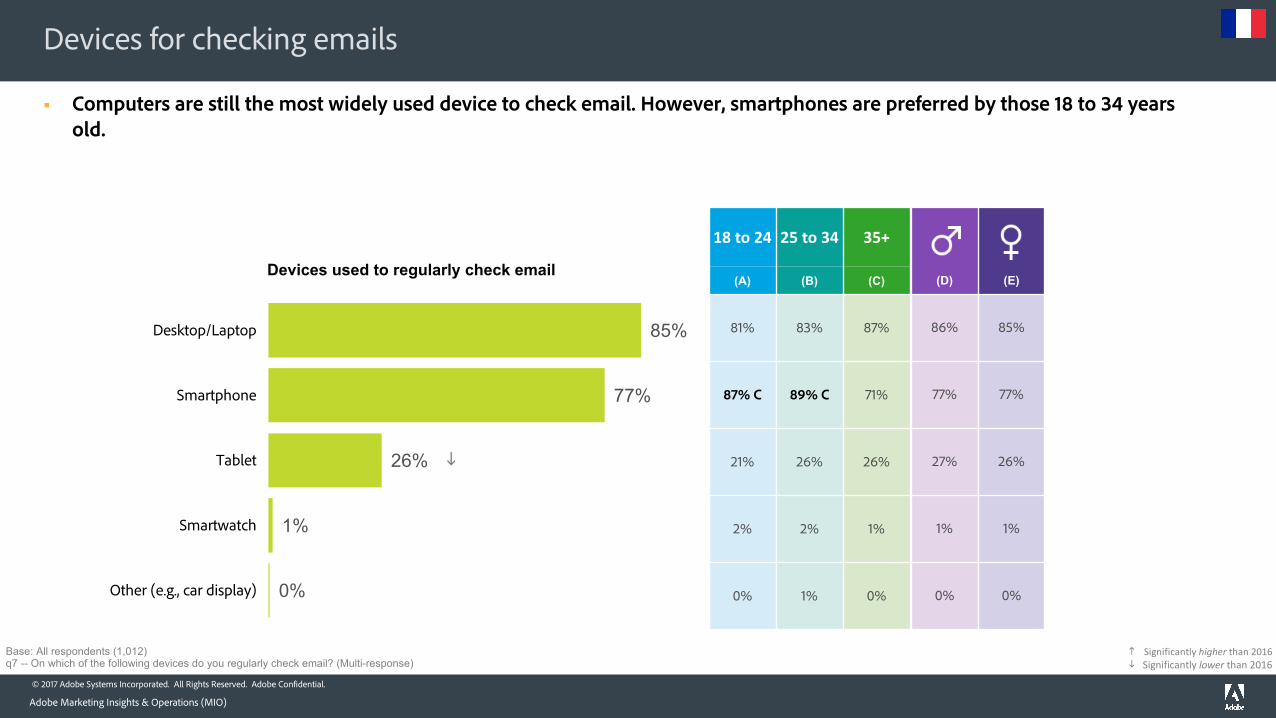
§ Computers are still the most widely used device to check email. However, smartphones are preferred by those 18 to 34 years old.
85%
77%
26%
1%
0%
Desktop/Laptop
Smartphone
Tablet
Smartwatch
Other (e.g., car display)
Devices used to regularly check email
Base: All respondents (1,012)q7 -- On which of the following devices do you regularly check email? (Multi-response)
(D) (E)
86% 85%
77% 77%
27% 26%
1% 1%
0% 0%
18to24 25to34 35+
(A) (B) (C)
81% 83% 87%
87% C 89% C 71%
21% 26% 26%
2% 2% 1%
0% 1% 0%
i
Significantlyhigherthan2016Significantlylower than2016i
h
© 2017 Adobe Systems Incorporated. All Rights Reserved. Adobe Confidential.
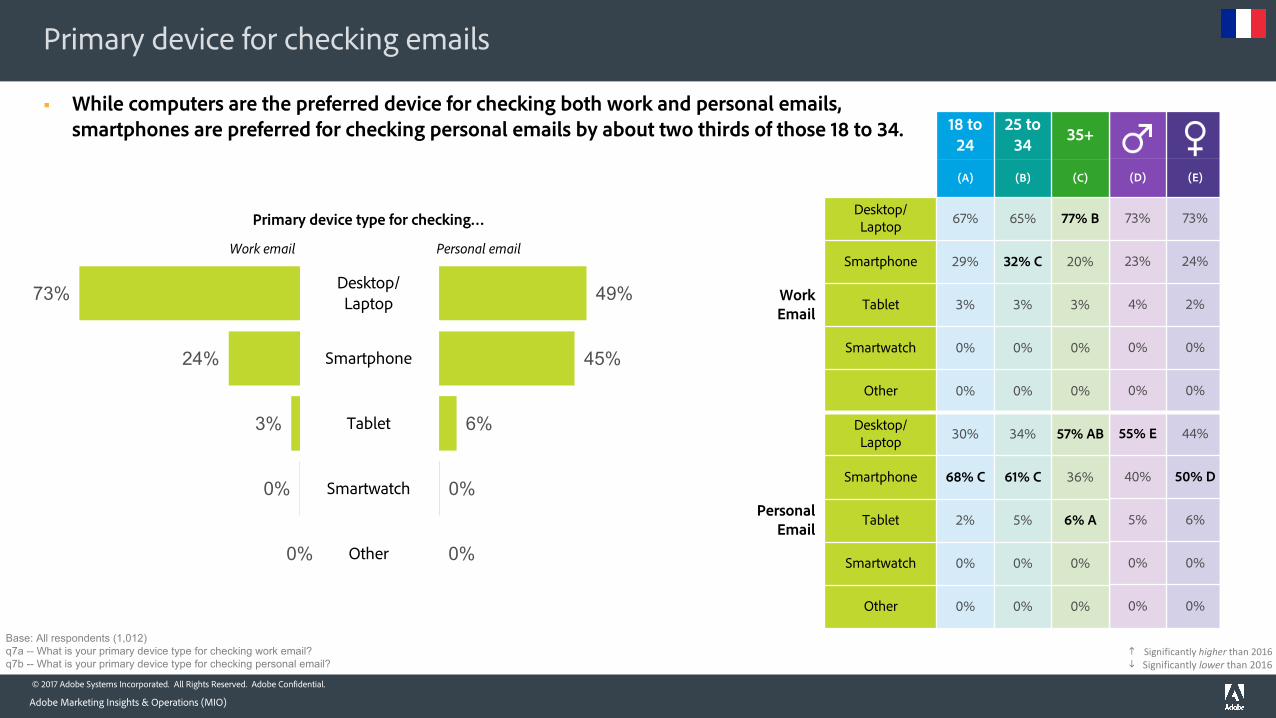
73%
24%
3%
0%
0%
Primary device for checking emails
Adobe Marketing Insights & Operations (MIO)
Base: All respondents (1,012)q7a -- What is your primary device type for checking work email?q7b -- What is your primary device type for checking personal email?
(D) (E)
73% 73%
23% 24%
4% 2%
0% 0%
0% 0%
55% E 44%
40% 50% D
5% 6%
0% 0%
0% 0%
49%
45%
6%
0%
0%
Desktop/Laptop
Smartphone
Tablet
Smartwatch
Other
18 to 24
25 to 34 35+
(A) (B) (C)
Work Email
Desktop/Laptop 67% 65% 77% B
Smartphone 29% 32% C 20%
Tablet 3% 3% 3%
Smartwatch 0% 0% 0%
Other 0% 0% 0%
Personal Email
Desktop/Laptop 30% 34% 57% AB
Smartphone 68% C 61% C 36%
Tablet 2% 5% 6% A
Smartwatch 0% 0% 0%
Other 0% 0% 0%
§ While computers are the preferred device for checking both work and personal emails, smartphones are preferred for checking personal emails by about two thirds of those 18 to 34.
Primary device type for checking…
Significantlyhigherthan2016Significantlylower than2016i
h
Personal emailWork email
© 2017 Adobe Systems Incorporated. All Rights Reserved. Adobe Confidential.
Opening emails
Adobe Marketing Insights & Operations (MIO)
11%
7%
11%
17%
16%
38%
(D) (E)
11% 11%
7% 7%
14% E 9%
19% E 14%
17% 15%
33% 42% D
17% 16%
17% 13%
22% 20%
17% 21%
10% 11%
16% 19%
16%
15%
21%
19%
11%
18%
0-20%
21-40%
41-60%
61-80%
81-99%
100%
18 to 24
25 to 34 35+
(A) (B) (C)
Work Email
0-20% 16% 12% 10%
21-40% 4% 7% 8%
41-60% 19% C 14% 10%
61-80% 15% 15% 17%
81-99% 7% 12% 18% AB
100% 39% 40% 37%
Personal Email
0-20% 15% 12% 18% B
21-40% 13% 19% 14%
41-60% 28% 22% 20%
61-80% 19% 19% 20%
81-99% 9% 10% 11%
100% 16% 19% 18%
§ Work emails are more likely than personal emails to be opened, with over one third of respondents (and in particular females) saying they open 100% of their work emails.
Mean % of emails opened:
74%
Mean % of emails opened:
60%
Total number of received emails opened
Base: All respondents (1,012)q39a -- What percentage of emails received do you open?
Personal emailWork email
© 2017 Adobe Systems Incorporated. All Rights Reserved. Adobe Confidential.
Reading emails
Adobe Marketing Insights & Operations (MIO)
10%
5%
11%
18%
17%
38%
(D) (E)
9% 11%
5% 4%
14% E 9%
22% E 15%
15% 20% D
35% 41%
17% 15%
14% 13%
25% 23%
18% 20%
9% 11%
17% 17%
16%
14%
24%
19%
10%
17%
0-20%
21-40%
41-60%
61-80%
81-99%
100%
18 to 24
25 to 34 35+
(A) (B) (C)
Work Email
0-20% 16% 9% 10%
21-40% 4% 5% 5%
41-60% 19% C 16% C 9%
61-80% 14% 18% 19%
81-99% 15% 15% 18%
100% 32% 37% 40%
Personal Email
0-20% 19% 15% 16%
21-40% 16% 19% C 12%
41-60% 33% 26% 23%
61-80% 14% 19% 20%
81-99% 7% 9% 11%
100% 11% 13% 19% AB
Mean % of emails read:
77%
Mean % of emails
read: 60%
Total number of received opened emails read
Base: All respondents (1,012)q39b -- Of those emails you open, what percentage do you actually read?
Personal emailWork email
§ Opened work emails are also more likely than opened personal emails to be read.
§ Again, over one third of respondents read 100% of the work emails that they open.
© 2017 Adobe Systems Incorporated. All Rights Reserved. Adobe Confidential.
Emotion when checking email
Adobe Marketing Insights & Operations (MIO)
42%
26%
15%
13%
3%
(D) (E)
46% E 39%
23% 29% D
12% 18% D
16% 12%
4% 3%
39% 37%
12% 14%
4% E 2%
42% 45%
3% 3%
38%
13%
3%
44%
3%
Indifference
Accomplished
Anxiety
Excitement
Dread or guilt
18 to 24
25 to 34 35+
(A) (B) (C)
Work email
Indifference 42% 40% 43%
Accomplished 25% 19% 29% B
Anxiety 13% 17% 14%
Excitement 15% 19% C 11%
Dread or guilt 4% 4% 3%
Personal email
Indifference 37% 39% 38%
Accomplished 7% 8% 15% AB
Anxiety 3% 2% 3%
Excitement 48% 47% 42%
Dread or guilt 5% 4% 2%
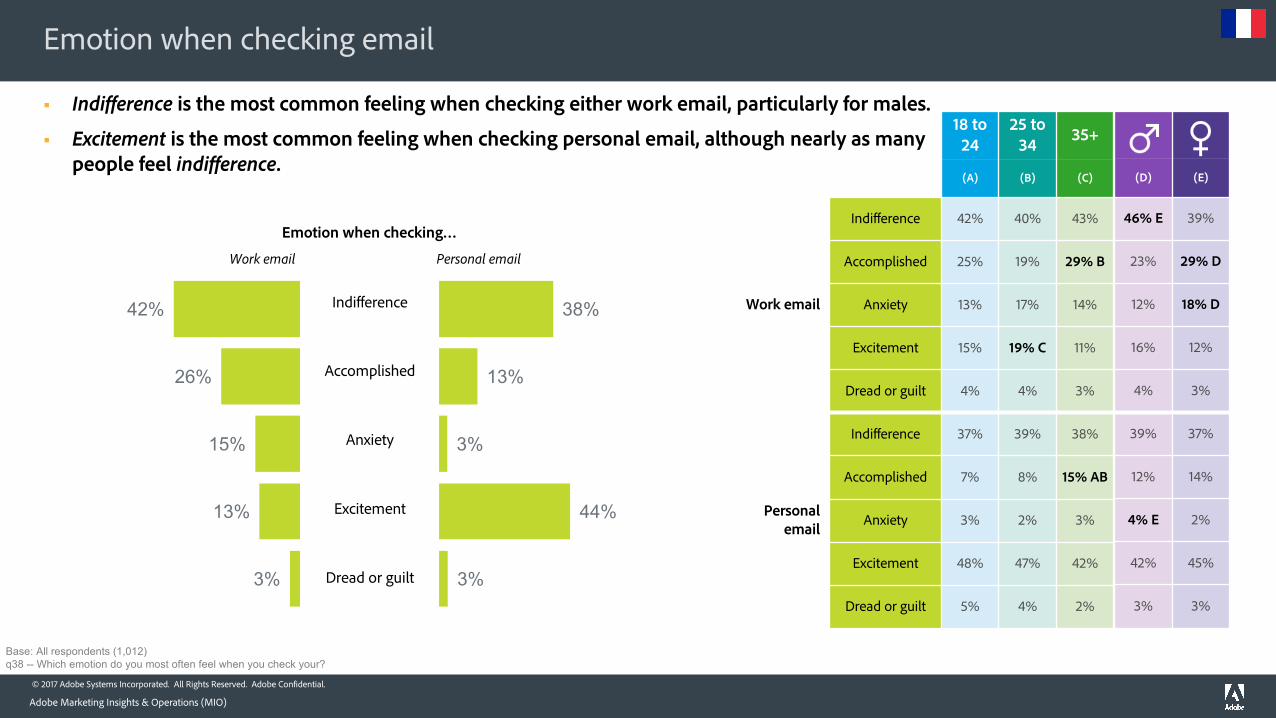
§ Indifference is the most common feeling when checking either work email, particularly for males.
§ Excitement is the most common feeling when checking personal email, although nearly as many people feel indifference.
Emotion when checking…
Base: All respondents (1,012)q38 -- Which emotion do you most often feel when you check your?
Personal emailWork email
© 2017 Adobe Systems Incorporated. All Rights Reserved. Adobe Confidential.
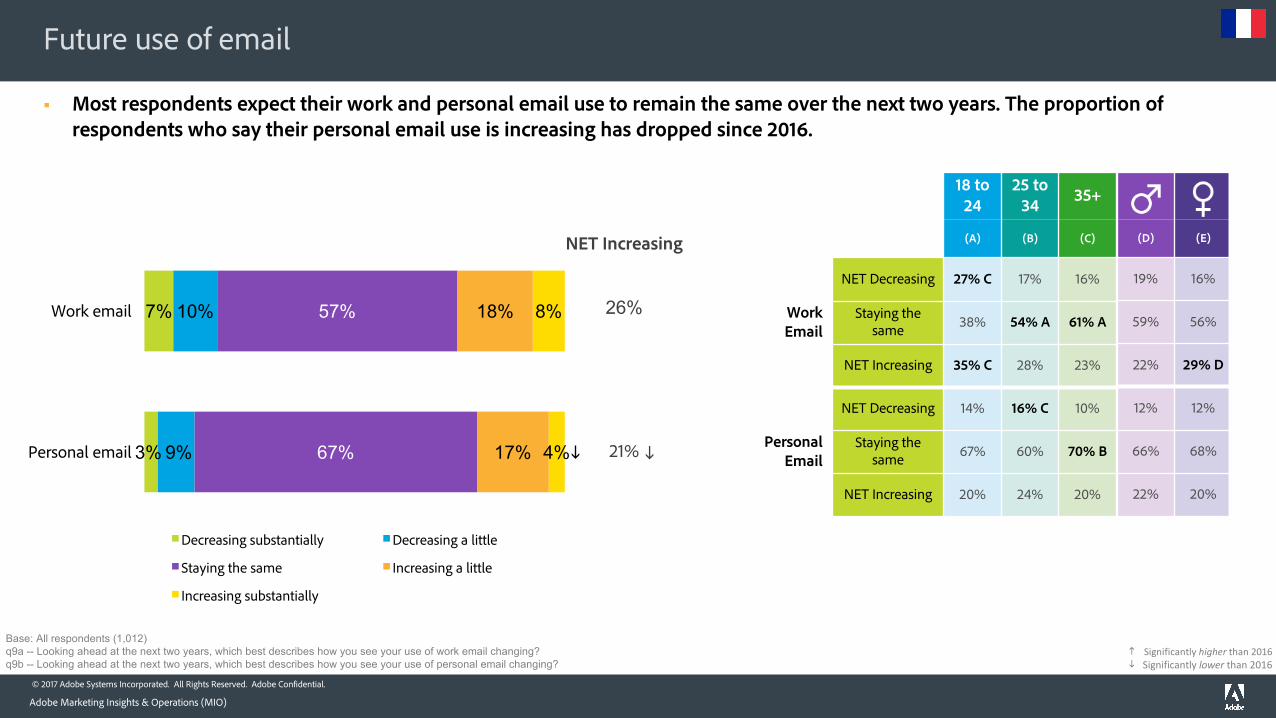
NET Increasing
26%
21%
Future use of email
Adobe Marketing Insights & Operations (MIO)
Base: All respondents (1,012)q9a -- Looking ahead at the next two years, which best describes how you see your use of work email changing?q9b -- Looking ahead at the next two years, which best describes how you see your use of personal email changing?
(D) (E)
19% 16%
59% 56%
22% 29% D
12% 12%
66% 68%
22% 20%
18 to 24
25 to 34 35+
(A) (B) (C)
Work Email
NET Decreasing 27% C 17% 16%
Staying the same 38% 54% A 61% A
NET Increasing 35% C 28% 23%
Personal Email
NET Decreasing 14% 16% C 10%
Staying the same 67% 60% 70% B
NET Increasing 20% 24% 20%
§ Most respondents expect their work and personal email use to remain the same over the next two years. The proportion of respondents who say their personal email use is increasing has dropped since 2016.
7%
3%
10%
9%
57%
67%
18%
17%
8%
4%
Work email
Personal email
Decreasing substantially Decreasing a little
Staying the same Increasing a little
Increasing substantially
ii
Significantlyhigherthan2016Significantlylower than2016i
h
© 2017 Adobe Systems Incorporated. All Rights Reserved. Adobe Confidential.
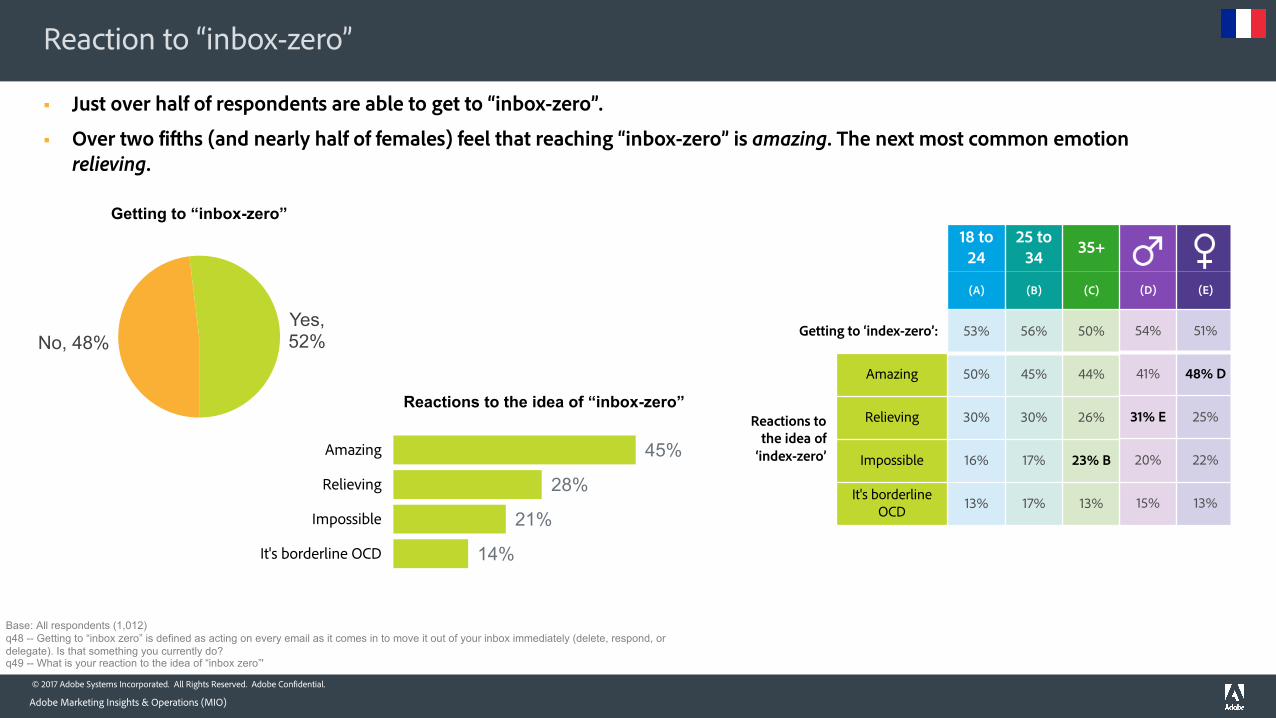
45%
28%
21%
14%
Amazing
Relieving
Impossible
It's borderline OCD
Reactions to the idea of “inbox-zero”
18 to 24
25 to 34 35+
(A) (B) (C)
Getting to ‘index-zero’: 53% 56% 50%
Reactions to the idea of
‘index-zero’
Amazing 50% 45% 44%
Relieving 30% 30% 26%
Impossible 16% 17% 23% B
It's borderline OCD 13% 17% 13%
No, 48%Yes, 52%
Getting to “inbox-zero”
Reaction to “inbox-zero”
Adobe Marketing Insights & Operations (MIO)
§ Just over half of respondents are able to get to “inbox-zero”.
§ Over two fifths (and nearly half of females) feel that reaching “inbox-zero” is amazing. The next most common emotion relieving.
(D) (E)
54% 51%
41% 48% D
31% E 25%
20% 22%
15% 13%
Base: All respondents (1,012)q48 -- Getting to “inbox zero” is defined as acting on every email as it comes in to move it out of your inbox immediately (delete, respond, or delegate). Is that something you currently do?q49 -- What is your reaction to the idea of “inbox zero”'
© 2017 Adobe Systems Incorporated. All Rights Reserved. Adobe Confidential. 22
Work Communication in General
Adobe Marketing Insights & Operations (MIO)
© 2017 Adobe Systems Incorporated. All Rights Reserved. Adobe Confidential.
Current communication preference
Adobe Marketing Insights & Operations (MIO)
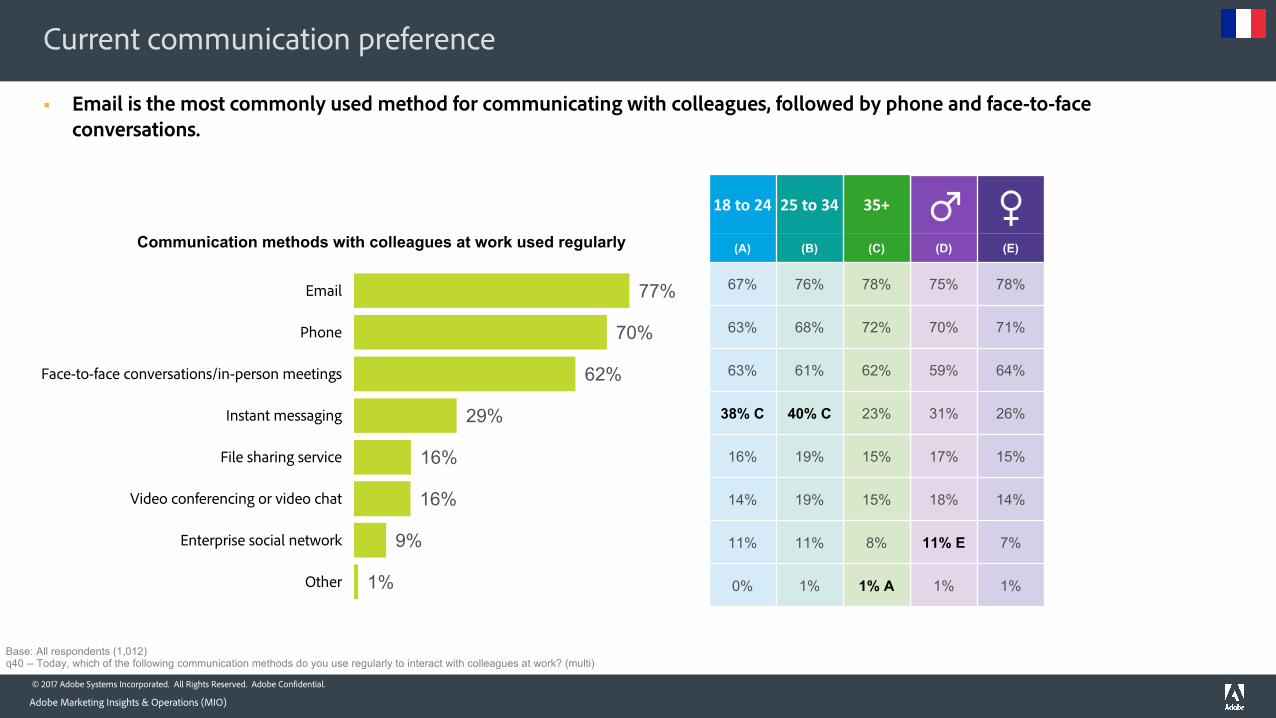
§ Email is the most commonly used method for communicating with colleagues, followed by phone and face-to-face conversations.
77%
70%
62%
29%
16%
16%
9%
1%
Phone
Face-to-face conversations/in-person meetings
Instant messaging
File sharing service
Video conferencing or video chat
Enterprise social network
Other
Communication methods with colleagues at work used regularly
Base: All respondents (1,012)q40 -- Today, which of the following communication methods do you use regularly to interact with colleagues at work? (multi)
(D) (E)
75% 78%
70% 71%
59% 64%
31% 26%
17% 15%
18% 14%
11% E 7%
1% 1%
18to24 25to34 35+
(A) (B) (C)
67% 76% 78%
63% 68% 72%
63% 61% 62%
38% C 40% C 23%
16% 19% 15%
14% 19% 15%
11% 11% 8%
0% 1% 1% A
© 2017 Adobe Systems Incorporated. All Rights Reserved. Adobe Confidential.
Current communication preference
Adobe Marketing Insights & Operations (MIO)
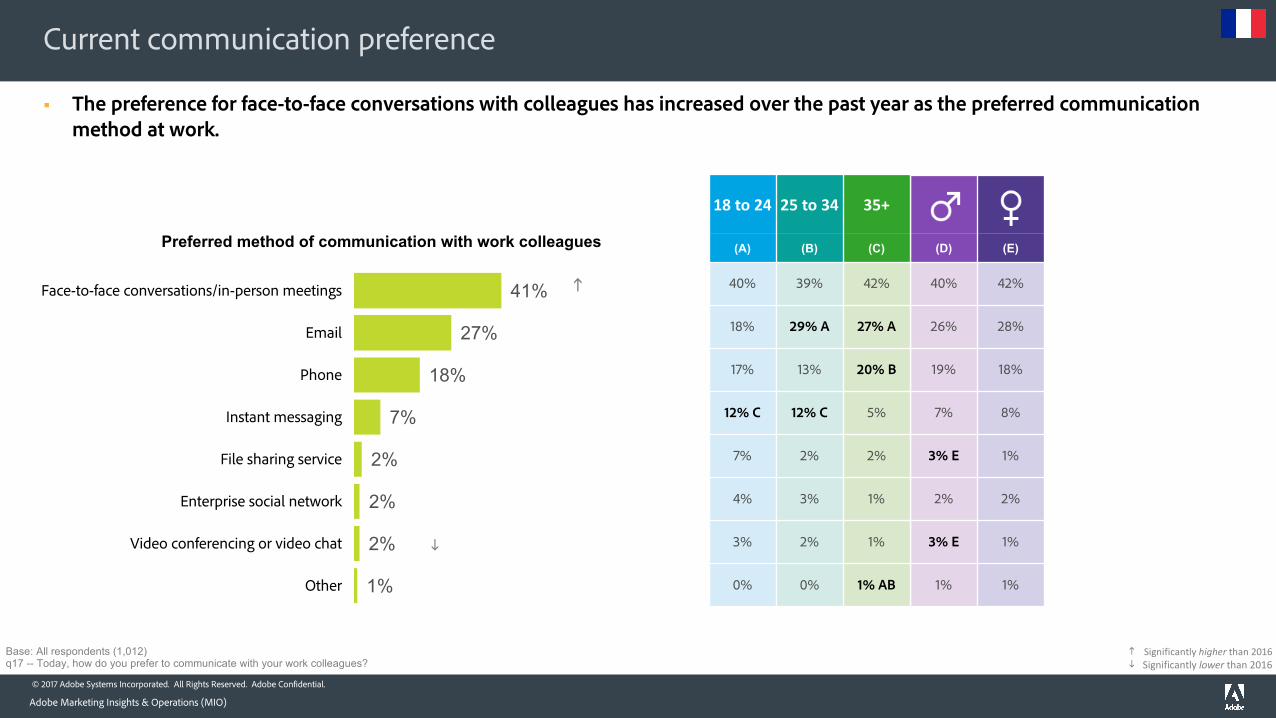
§ The preference for face-to-face conversations with colleagues has increased over the past year as the preferred communication method at work.
41%
27%
18%
7%
2%
2%
2%
1%
Face-to-face conversations/in-person meetings
Phone
Instant messaging
File sharing service
Enterprise social network
Video conferencing or video chat
Other
Preferred method of communication with work colleagues
Base: All respondents (1,012)q17 -- Today, how do you prefer to communicate with your work colleagues?
(D) (E)
40% 42%
26% 28%
19% 18%
7% 8%
3% E 1%
2% 2%
3% E 1%
1% 1%
18to24 25to34 35+
(A) (B) (C)
40% 39% 42%
18% 29% A 27% A
17% 13% 20% B
12% C 12% C 5%
7% 2% 2%
4% 3% 1%
3% 2% 1%
0% 0% 1% AB
h
i
Significantlyhigherthan2016Significantlylower than2016i
h
© 2017 Adobe Systems Incorporated. All Rights Reserved. Adobe Confidential.
Company’s primary communication tools
Adobe Marketing Insights & Operations (MIO)
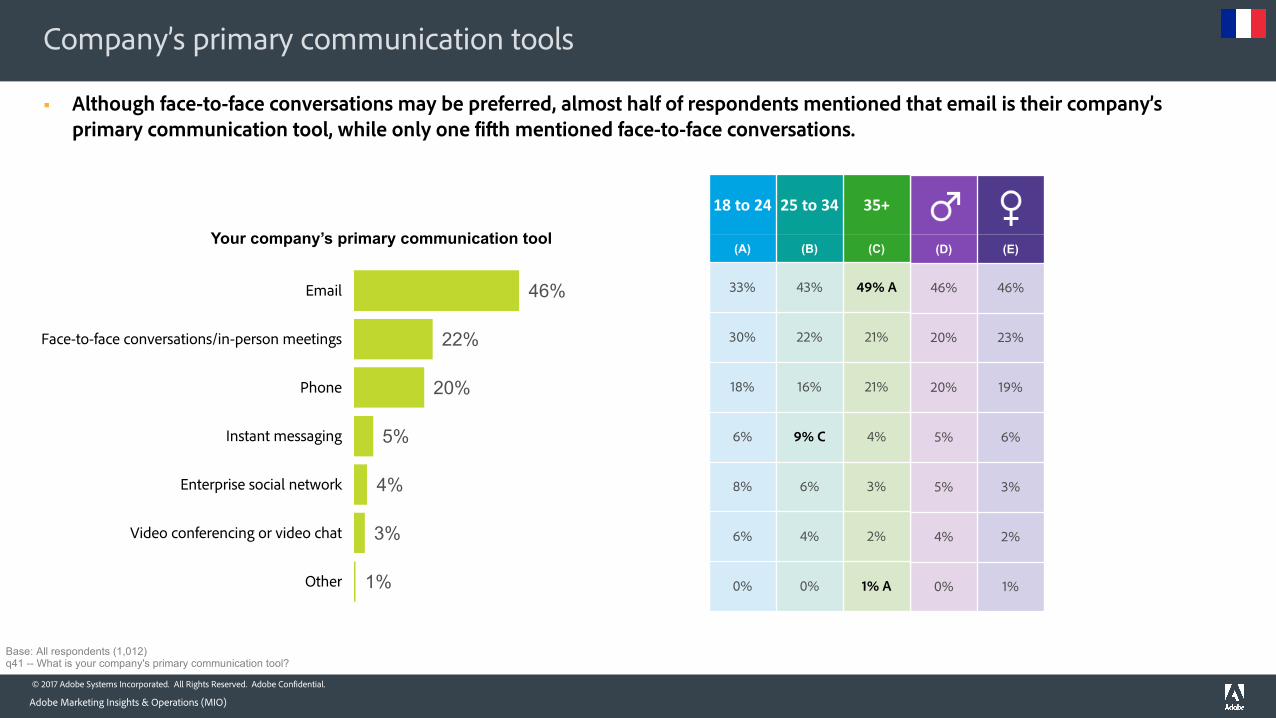
§ Although face-to-face conversations may be preferred, almost half of respondents mentioned that email is their company’s primary communication tool, while only one fifth mentioned face-to-face conversations.
46%
22%
20%
5%
4%
3%
1%
Face-to-face conversations/in-person meetings
Phone
Instant messaging
Enterprise social network
Video conferencing or video chat
Other
Your company’s primary communication tool
Base: All respondents (1,012)q41 -- What is your company's primary communication tool?
(D) (E)
46% 46%
20% 23%
20% 19%
5% 6%
5% 3%
4% 2%
0% 1%
18to24 25to34 35+
(A) (B) (C)
33% 43% 49% A
30% 22% 21%
18% 16% 21%
6% 9% C 4%
8% 6% 3%
6% 4% 2%
0% 0% 1% A
© 2017 Adobe Systems Incorporated. All Rights Reserved. Adobe Confidential.
Communication tool for a quick question
Adobe Marketing Insights & Operations (MIO)
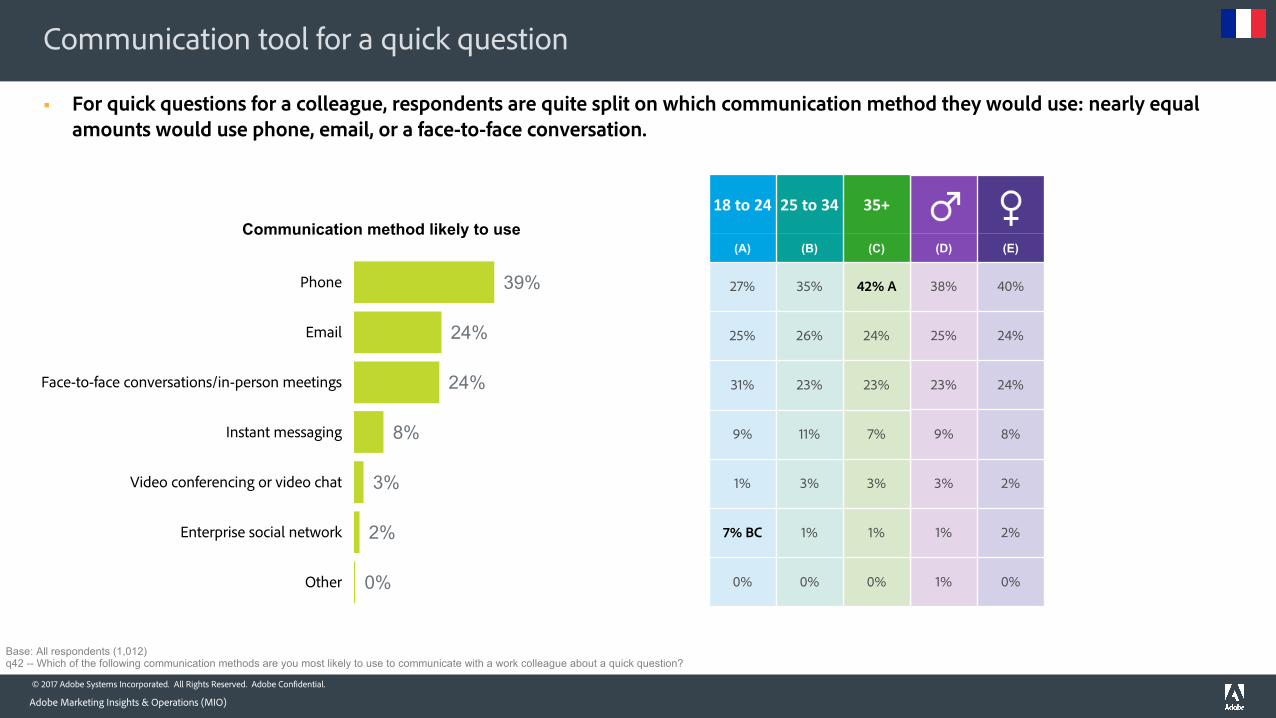
§ For quick questions for a colleague, respondents are quite split on which communication method they would use: nearly equal amounts would use phone, email, or a face-to-face conversation.
39%
24%
24%
8%
3%
2%
0%
Phone
Face-to-face conversations/in-person meetings
Instant messaging
Video conferencing or video chat
Enterprise social network
Other
Communication method likely to use
Base: All respondents (1,012)q42 -- Which of the following communication methods are you most likely to use to communicate with a work colleague about a quick question?
(D) (E)
38% 40%
25% 24%
23% 24%
9% 8%
3% 2%
1% 2%
1% 0%
18to24 25to34 35+
(A) (B) (C)
27% 35% 42% A
25% 26% 24%
31% 23% 23%
9% 11% 7%
1% 3% 3%
7% BC 1% 1%
0% 0% 0%
© 2017 Adobe Systems Incorporated. All Rights Reserved. Adobe Confidential.
Most appropriate communication method for different interactions
Adobe Marketing Insights & Operations (MIO)
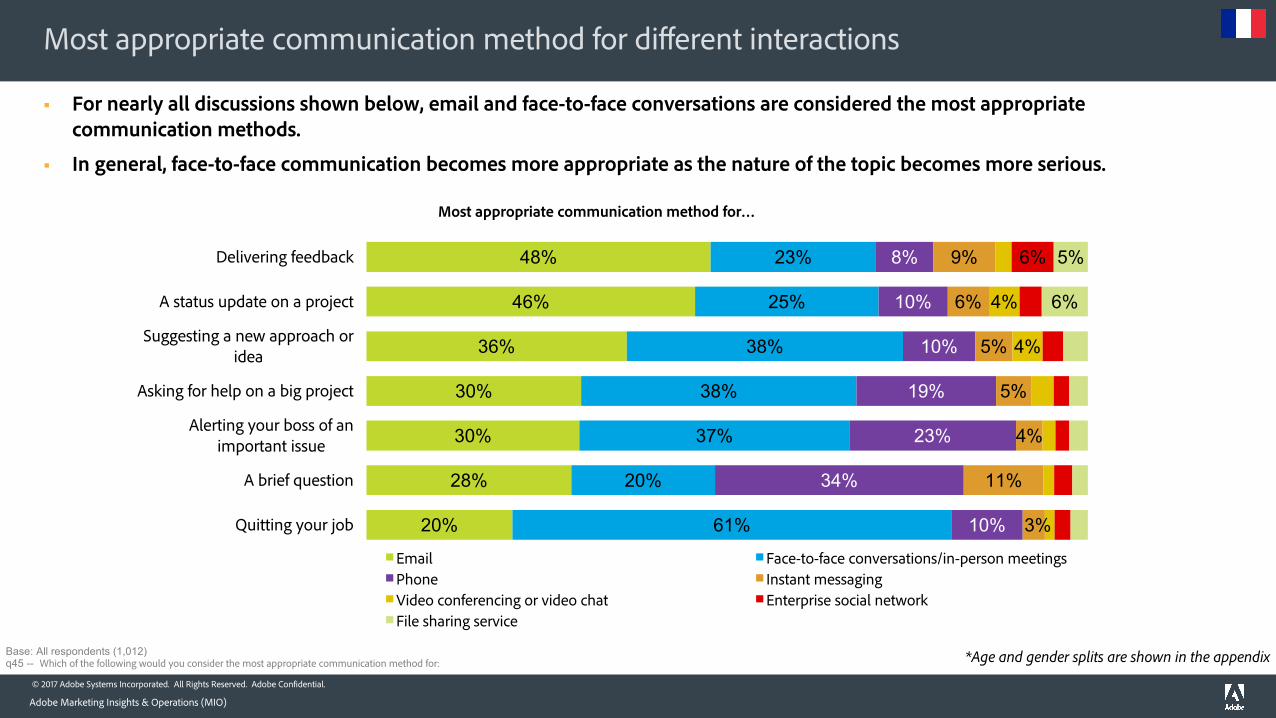
§ For nearly all discussions shown below, email and face-to-face conversations are considered the most appropriate communication methods.
§ In general, face-to-face communication becomes more appropriate as the nature of the topic becomes more serious.
Base: All respondents (1,012)q45 -- Which of the following would you consider the most appropriate communication method for:
48%
46%
36%
30%
30%
28%
20%
23%
25%
38%
38%
37%
20%
61%
8%
10%
10%
19%
23%
34%
10%
9%
6%
5%
5%
4%
11%
3%
4%
4%
6% 5%
6%
Delivering feedback
A status update on a project
Suggesting a new approach or idea
Asking for help on a big project
Alerting your boss of an important issue
A brief question
Quitting your job
Most appropriate communication method for…
Email Face-to-face conversations/in-person meetingsPhone Instant messagingVideo conferencing or video chat Enterprise social networkFile sharing service
*Age and gender splits are shown in the appendix
© 2017 Adobe Systems Incorporated. All Rights Reserved. Adobe Confidential. 28
Email Innovation and Marketing
Adobe Marketing Insights & Operations (MIO)
© 2017 Adobe Systems Incorporated. All Rights Reserved. Adobe Confidential.
Email improvements
Adobe Marketing Insights & Operations (MIO)
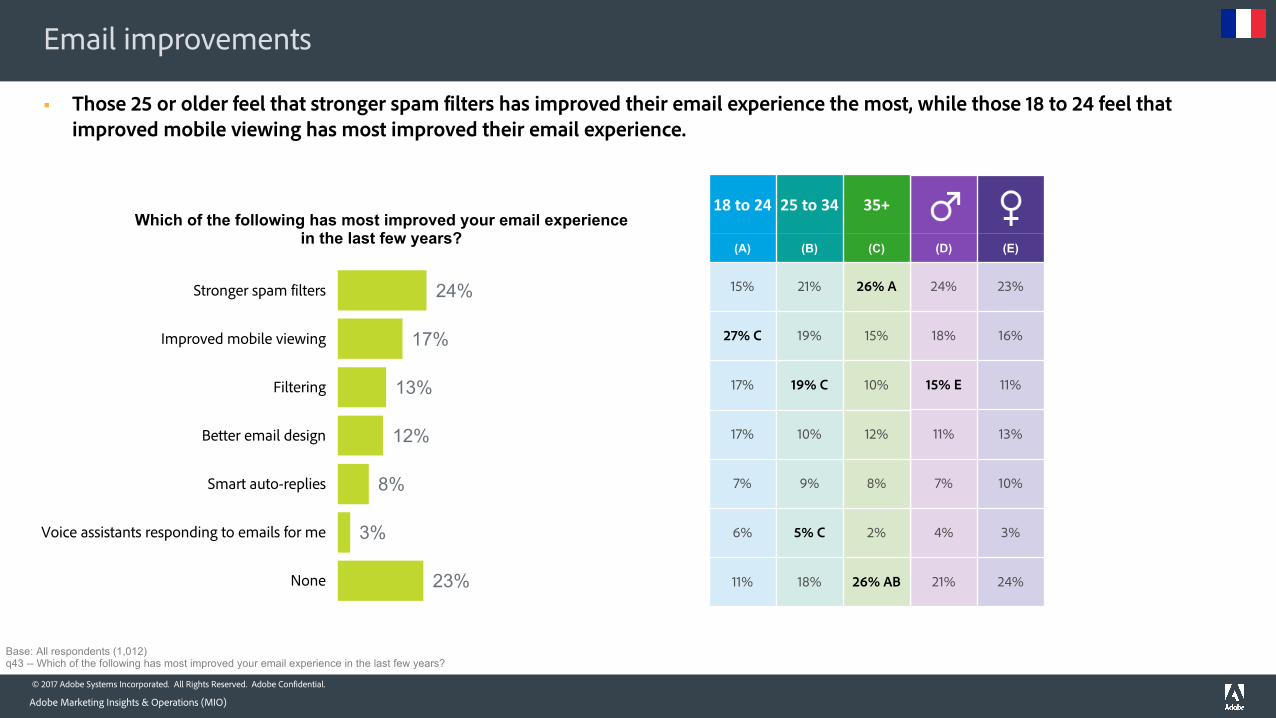
§ Those 25 or older feel that stronger spam filters has improved their email experience the most, while those 18 to 24 feel that improved mobile viewing has most improved their email experience.
24%
17%
13%
12%
8%
3%
23%
Stronger spam filters
Improved mobile viewing
Filtering
Better email design
Smart auto-replies
Voice assistants responding to emails for me
None
Which of the following has most improved your email experience in the last few years?
Base: All respondents (1,012)q43 -- Which of the following has most improved your email experience in the last few years?
(D) (E)
24% 23%
18% 16%
15% E 11%
11% 13%
7% 10%
4% 3%
21% 24%
18to24 25to34 35+
(A) (B) (C)
15% 21% 26% A
27% C 19% 15%
17% 19% C 10%
17% 10% 12%
7% 9% 8%
6% 5% C 2%
11% 18% 26% AB
© 2017 Adobe Systems Incorporated. All Rights Reserved. Adobe Confidential.
Most innovative communication method
Adobe Marketing Insights & Operations (MIO)
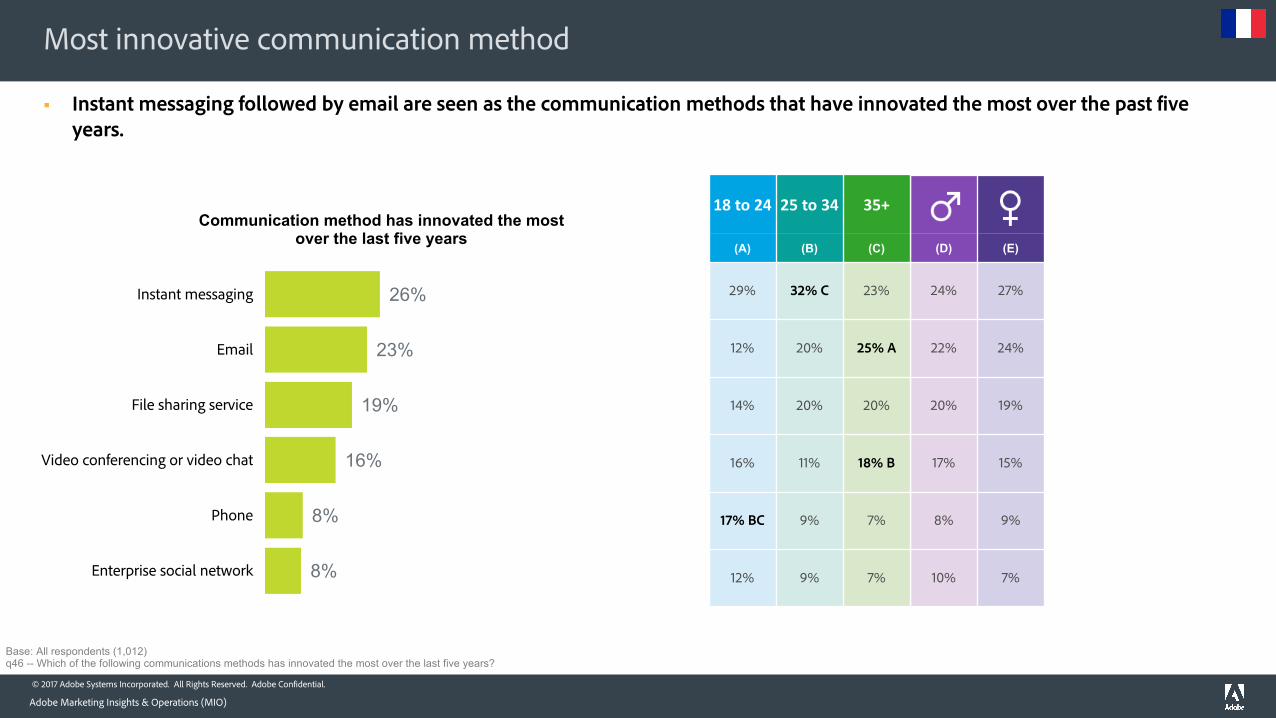
§ Instant messaging followed by email are seen as the communication methods that have innovated the most over the past five years.
26%
23%
19%
16%
8%
8%
Instant messaging
File sharing service
Video conferencing or video chat
Phone
Enterprise social network
Communication method has innovated the most over the last five years
Base: All respondents (1,012)q46 -- Which of the following communications methods has innovated the most over the last five years?
(D) (E)
24% 27%
22% 24%
20% 19%
17% 15%
8% 9%
10% 7%
18to24 25to34 35+
(A) (B) (C)
29% 32% C 23%
12% 20% 25% A
14% 20% 20%
16% 11% 18% B
17% BC 9% 7%
12% 9% 7%
© 2017 Adobe Systems Incorporated. All Rights Reserved. Adobe Confidential.
Brand contact
Adobe Marketing Insights & Operations (MIO)
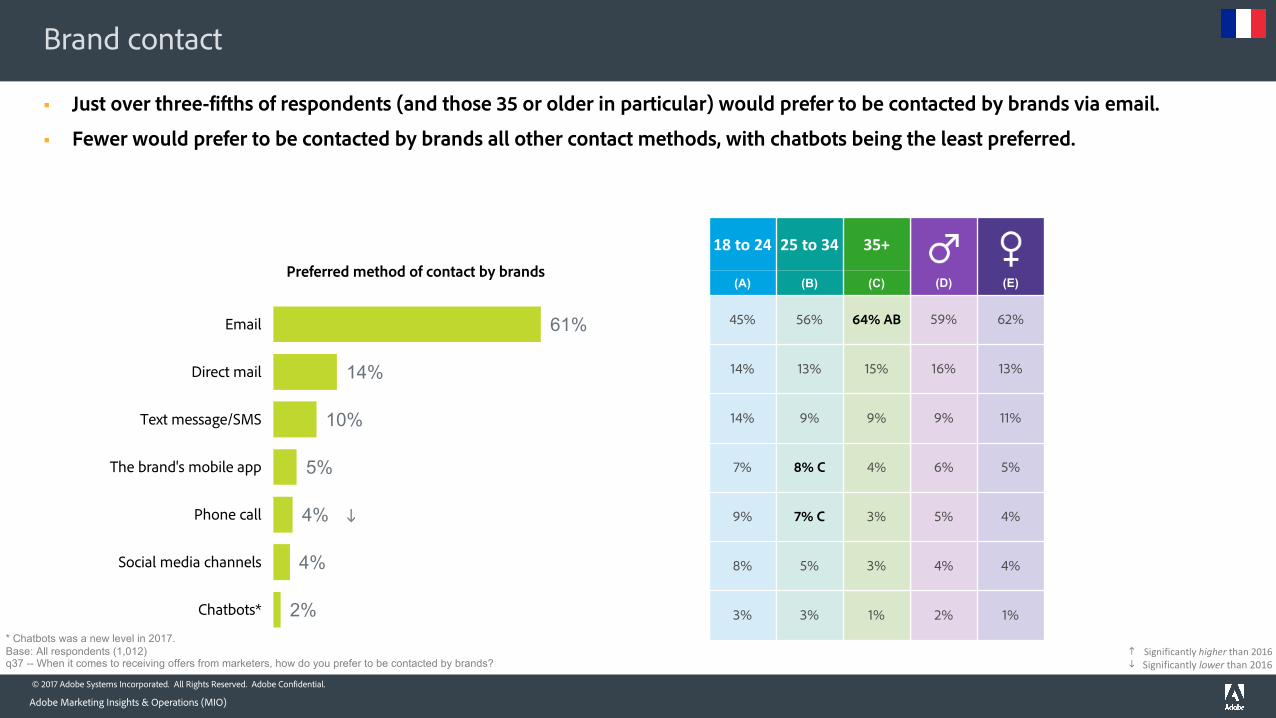
§ Just over three-fifths of respondents (and those 35 or older in particular) would prefer to be contacted by brands via email.
§ Fewer would prefer to be contacted by brands all other contact methods, with chatbots being the least preferred.
61%
14%
10%
5%
4%
4%
2%
Direct mail
Text message/SMS
The brand's mobile app
Phone call
Social media channels
Chatbots*
Preferred method of contact by brands
* Chatbots was a new level in 2017.Base: All respondents (1,012)q37 -- When it comes to receiving offers from marketers, how do you prefer to be contacted by brands?
(D) (E)
59% 62%
16% 13%
9% 11%
6% 5%
5% 4%
4% 4%
2% 1%
18to24 25to34 35+
(A) (B) (C)
45% 56% 64% AB
14% 13% 15%
14% 9% 9%
7% 8% C 4%
9% 7% C 3%
8% 5% 3%
3% 3% 1%
i
Significantlyhigherthan2016Significantlylower than2016i
h
© 2017 Adobe Systems Incorporated. All Rights Reserved. Adobe Confidential.
Changing marketing emails
Adobe Marketing Insights & Operations (MIO)
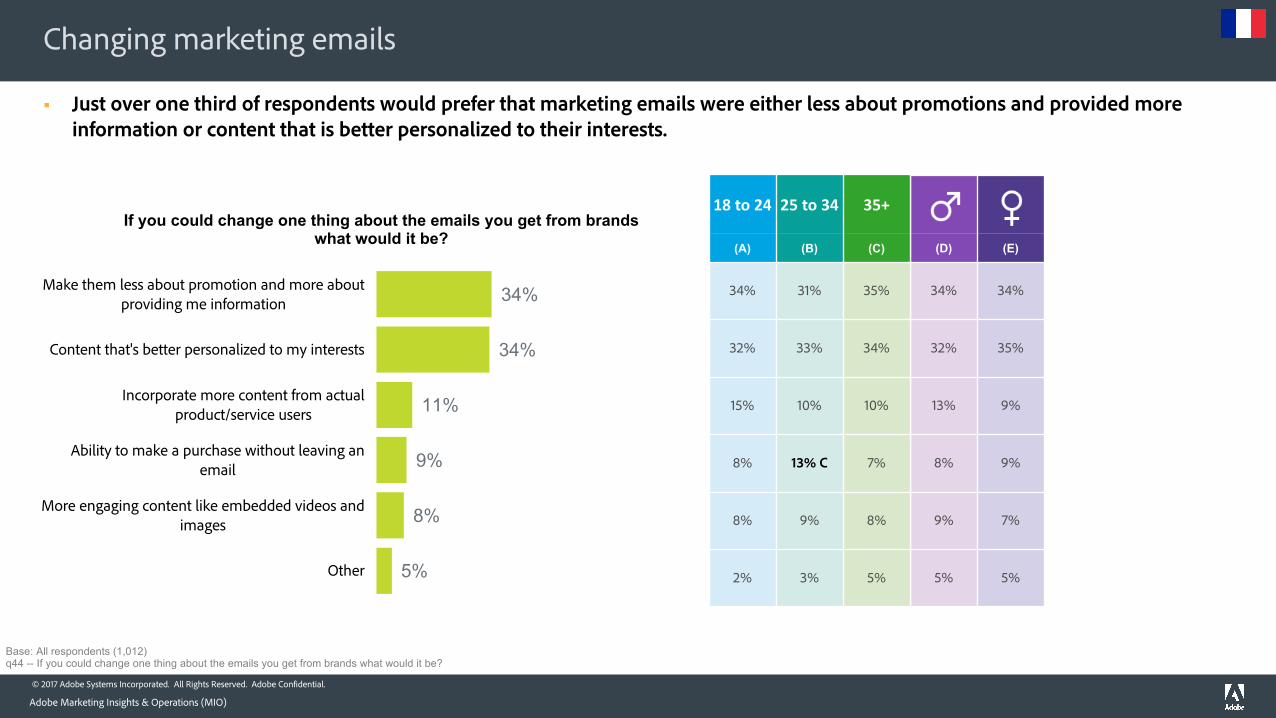
§ Just over one third of respondents would prefer that marketing emails were either less about promotions and provided more information or content that is better personalized to their interests.
34%
34%
11%
9%
8%
5%
Make them less about promotion and more about providing me information
Content that's better personalized to my interests
Incorporate more content from actual product/service users
Ability to make a purchase without leaving an email
More engaging content like embedded videos and images
Other
If you could change one thing about the emails you get from brands what would it be?
Base: All respondents (1,012)q44 -- If you could change one thing about the emails you get from brands what would it be?
(D) (E)
34% 34%
32% 35%
13% 9%
8% 9%
9% 7%
5% 5%
18to24 25to34 35+
(A) (B) (C)
34% 31% 35%
32% 33% 34%
15% 10% 10%
8% 13% C 7%
8% 9% 8%
2% 3% 5%
© 2017 Adobe Systems Incorporated. All Rights Reserved. Adobe Confidential.
Marketing emails and the purchase process
Adobe Marketing Insights & Operations (MIO)
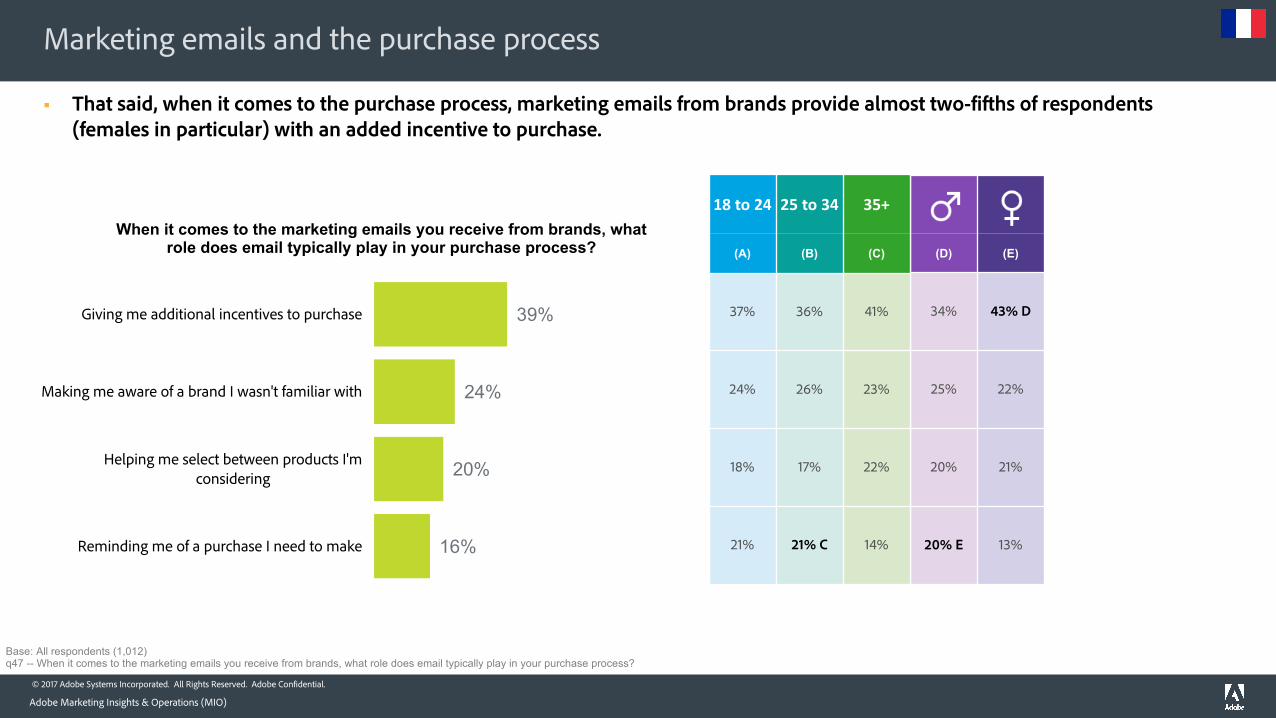
§ That said, when it comes to the purchase process, marketing emails from brands provide almost two-fifths of respondents (females in particular) with an added incentive to purchase.
39%
24%
20%
16%
Giving me additional incentives to purchase
Making me aware of a brand I wasn't familiar with
Helping me select between products I'm considering
Reminding me of a purchase I need to make
When it comes to the marketing emails you receive from brands, what role does email typically play in your purchase process? (D) (E)
34% 43% D
25% 22%
20% 21%
20% E 13%
18to24 25to34 35+
(A) (B) (C)
37% 36% 41%
24% 26% 23%
18% 17% 22%
21% 21% C 14%
Base: All respondents (1,012)q47 -- When it comes to the marketing emails you receive from brands, what role does email typically play in your purchase process?
© 2017 Adobe Systems Incorporated. All Rights Reserved. Adobe Confidential.
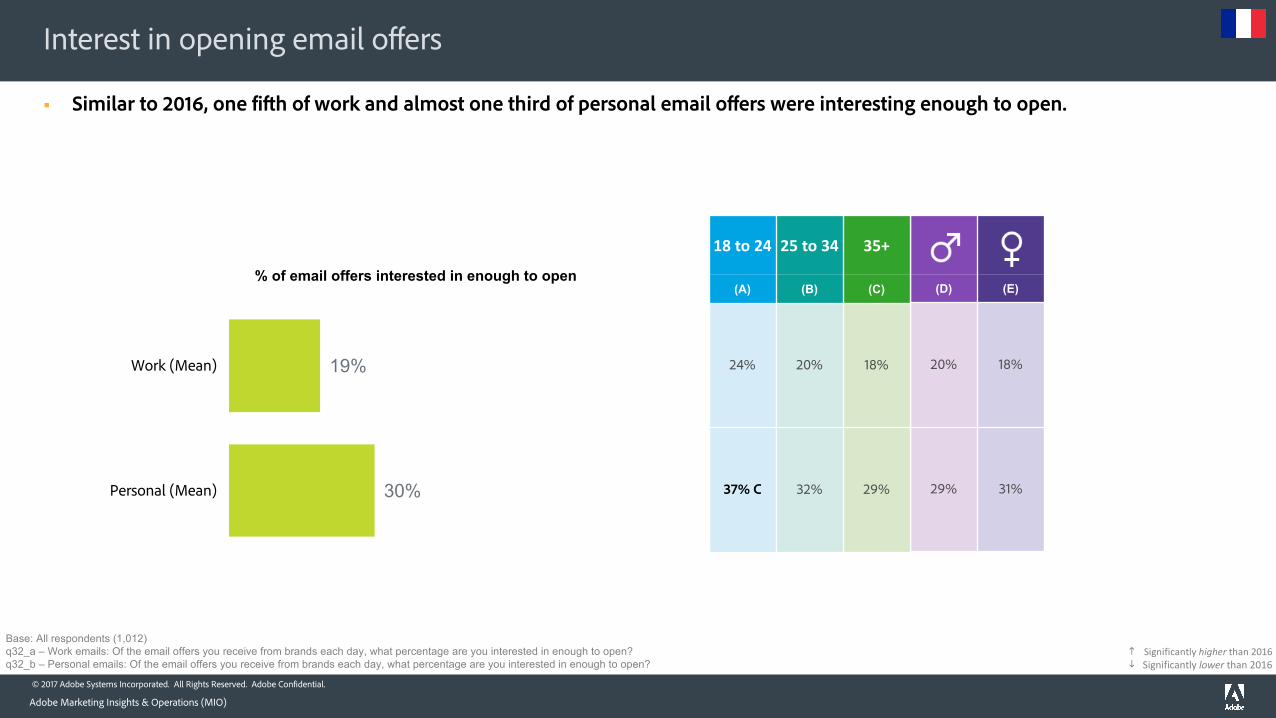
19%
30%
Work (Mean)
Personal (Mean)
% of email offers interested in enough to open
Interest in opening email offers
Adobe Marketing Insights & Operations (MIO)
§ Similar to 2016, one fifth of work and almost one third of personal email offers were interesting enough to open.
Base: All respondents (1,012)q32_a – Work emails: Of the email offers you receive from brands each day, what percentage are you interested in enough to open?q32_b – Personal emails: Of the email offers you receive from brands each day, what percentage are you interested in enough to open?
(D) (E)
20% 18%
29% 31%
18to24 25to34 35+
(A) (B) (C)
24% 20% 18%
37% C 32% 29%
Significantlyhigherthan2016Significantlylower than2016i
h
© 2017 Adobe Systems Incorporated. All Rights Reserved. Adobe Confidential.
Annoying things when reading email from a brand on a smartphone
Adobe Marketing Insights & Operations (MIO)
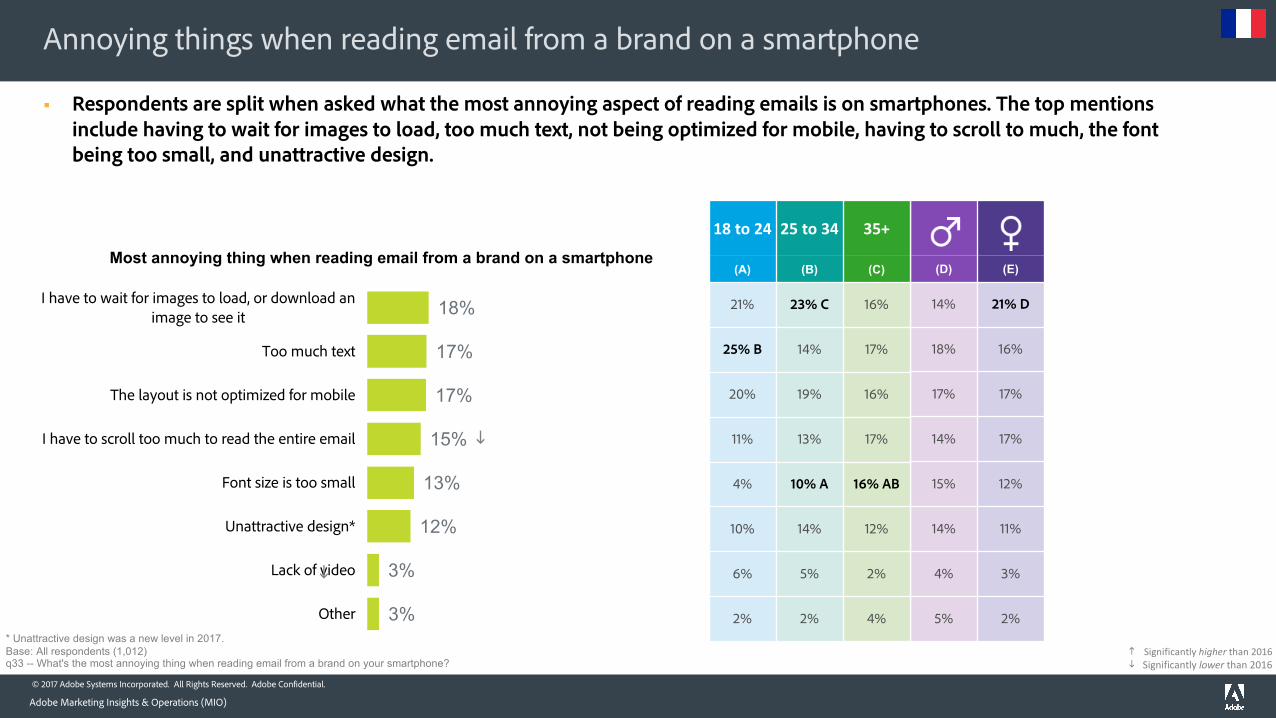
§ Respondents are split when asked what the most annoying aspect of reading emails is on smartphones. The top mentions include having to wait for images to load, too much text, not being optimized for mobile, having to scroll to much, the font being too small, and unattractive design.
18%
17%
17%
15%
13%
12%
3%
3%
I have to wait for images to load, or download an image to see it
Too much text
The layout is not optimized for mobile
I have to scroll too much to read the entire email
Font size is too small
Unattractive design*
Lack of video
Other
Most annoying thing when reading email from a brand on a smartphone
* Unattractive design was a new level in 2017.Base: All respondents (1,012)q33 -- What's the most annoying thing when reading email from a brand on your smartphone?
(D) (E)
14% 21% D
18% 16%
17% 17%
14% 17%
15% 12%
14% 11%
4% 3%
5% 2%
18to24 25to34 35+
(A) (B) (C)
21% 23% C 16%
25% B 14% 17%
20% 19% 16%
11% 13% 17%
4% 10% A 16% AB
10% 14% 12%
6% 5% 2%
2% 2% 4%
i
Significantlyhigherthan2016Significantlylower than2016i
h
i
© 2017 Adobe Systems Incorporated. All Rights Reserved. Adobe Confidential.
Most annoying thing when receiving an email offer from a marketer
Adobe Marketing Insights & Operations (MIO)
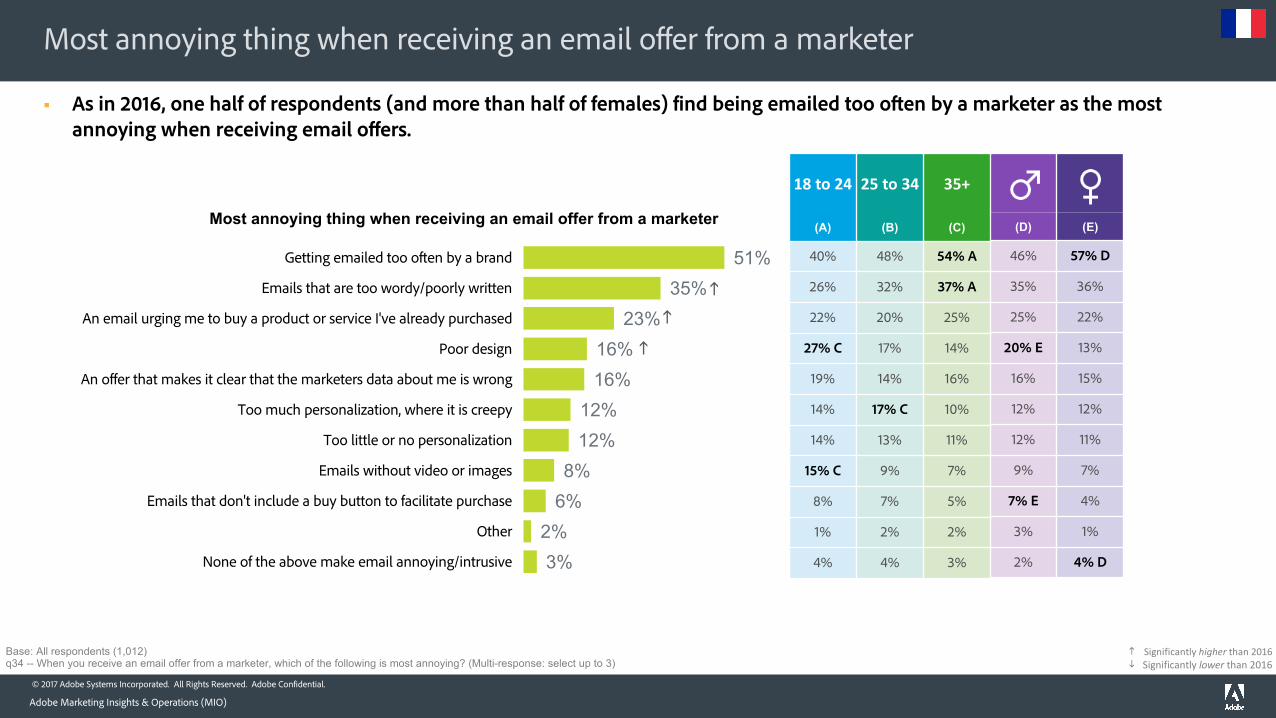
§ As in 2016, one half of respondents (and more than half of females) find being emailed too often by a marketer as the most annoying when receiving email offers.
51%35%
23%16%16%
12%12%
8%6%
2%3%
Getting emailed too often by a brand
Emails that are too wordy/poorly written
An email urging me to buy a product or service I've already purchased
Poor design
An offer that makes it clear that the marketers data about me is wrong
Too much personalization, where it is creepy
Too little or no personalization
Emails without video or images
Emails that don't include a buy button to facilitate purchase
Other
None of the above make email annoying/intrusive
Most annoying thing when receiving an email offer from a marketer
h
Base: All respondents (1,012)q34 -- When you receive an email offer from a marketer, which of the following is most annoying? (Multi-response: select up to 3)
(D) (E)
46% 57% D
35% 36%
25% 22%
20% E 13%
16% 15%
12% 12%
12% 11%
9% 7%
7% E 4%
3% 1%
2% 4% D
18to24 25to34 35+
(A) (B) (C)
40% 48% 54% A
26% 32% 37% A
22% 20% 25%
27% C 17% 14%
19% 14% 16%
14% 17% C 10%
14% 13% 11%
15% C 9% 7%
8% 7% 5%
1% 2% 2%
4% 4% 3%
Significantlyhigherthan2016Significantlylower than2016i
h
h
h
© 2017 Adobe Systems Incorporated. All Rights Reserved. Adobe Confidential.
Frequency of brand emails
Adobe Marketing Insights & Operations (MIO)
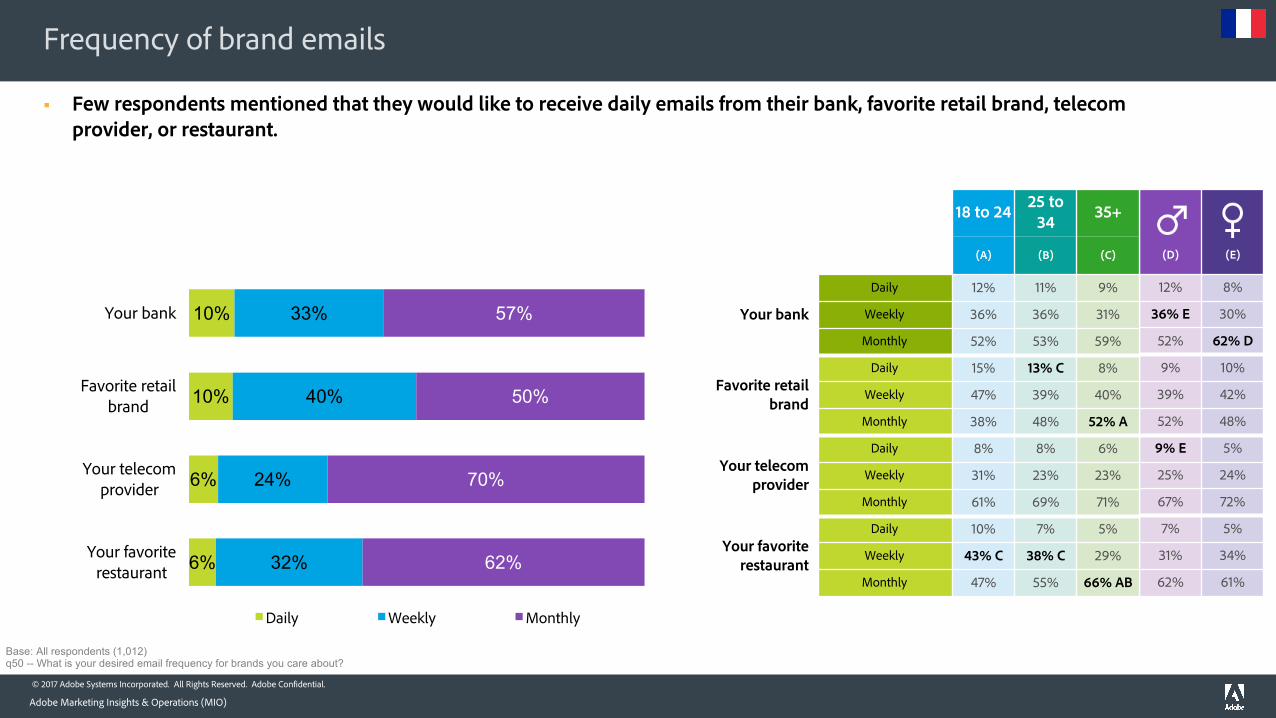
§ Few respondents mentioned that they would like to receive daily emails from their bank, favorite retail brand, telecom provider, or restaurant.
Base: All respondents (1,012)q50 -- What is your desired email frequency for brands you care about?
10%
10%
6%
6%
33%
40%
24%
32%
57%
50%
70%
62%
Your bank
Favorite retail brand
Your telecom provider
Your favorite restaurant
Daily Weekly Monthly
(D) (E)
12% 8%
36% E 30%
52% 62% D
9% 10%
39% 42%
52% 48%
9% E 5%
25% 24%
67% 72%
7% 5%
31% 34%
62% 61%
18 to 24 25 to 34 35+
(A) (B) (C)
Your bank
Daily 12% 11% 9%
Weekly 36% 36% 31%
Monthly 52% 53% 59%
Favorite retail brand
Daily 15% 13% C 8%
Weekly 47% 39% 40%
Monthly 38% 48% 52% A
Your telecom provider
Daily 8% 8% 6%
Weekly 31% 23% 23%
Monthly 61% 69% 71%
Your favorite restaurant
Daily 10% 7% 5%
Weekly 43% C 38% C 29%
Monthly 47% 55% 66% AB
© 2017 Adobe Systems Incorporated. All Rights Reserved. Adobe Confidential.
Interest in brand communication
Adobe Marketing Insights & Operations (MIO)
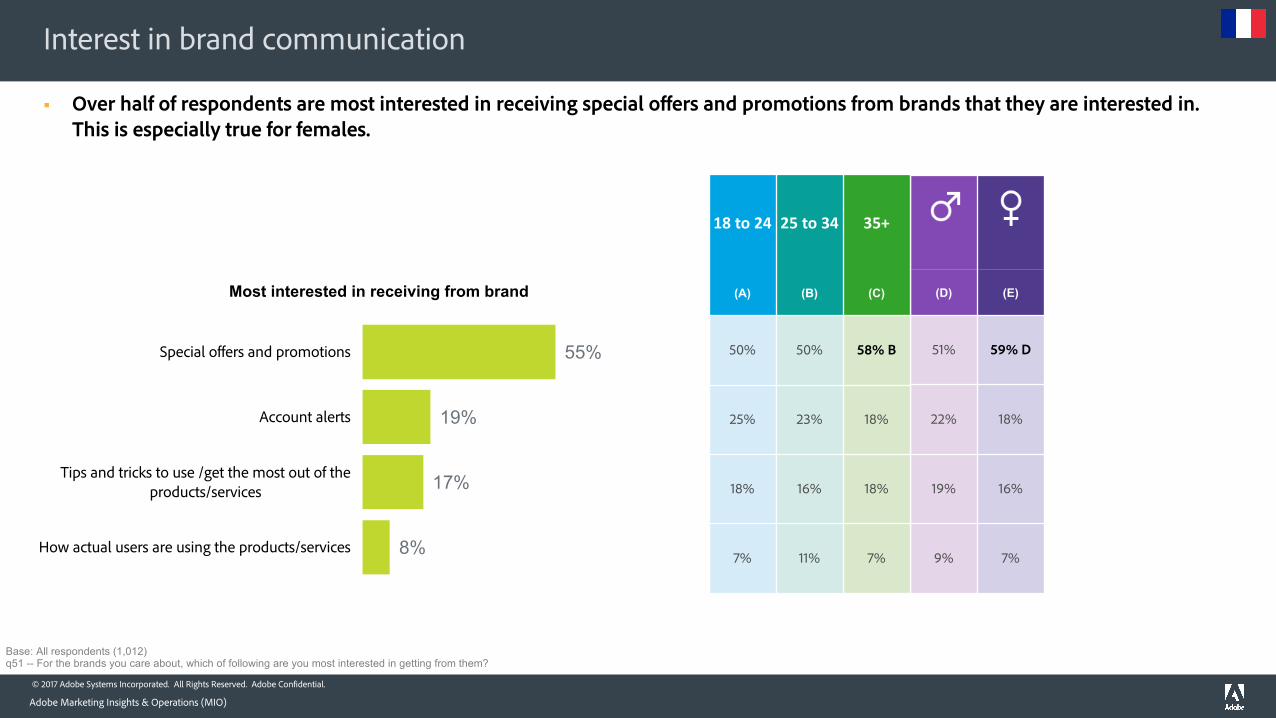
§ Over half of respondents are most interested in receiving special offers and promotions from brands that they are interested in.This is especially true for females.
55%
19%
17%
8%
Special offers and promotions
Account alerts
Tips and tricks to use /get the most out of the products/services
How actual users are using the products/services
Most interested in receiving from brand
Base: All respondents (1,012)q51 -- For the brands you care about, which of following are you most interested in getting from them?
(D) (E)
51% 59% D
22% 18%
19% 16%
9% 7%
18to24 25to34 35+
(A) (B) (C)
50% 50% 58% B
25% 23% 18%
18% 16% 18%
7% 11% 7%
© 2017 Adobe Systems Incorporated. All Rights Reserved. Adobe Confidential.
Importance of customized communication from brands
Adobe Marketing Insights & Operations (MIO)
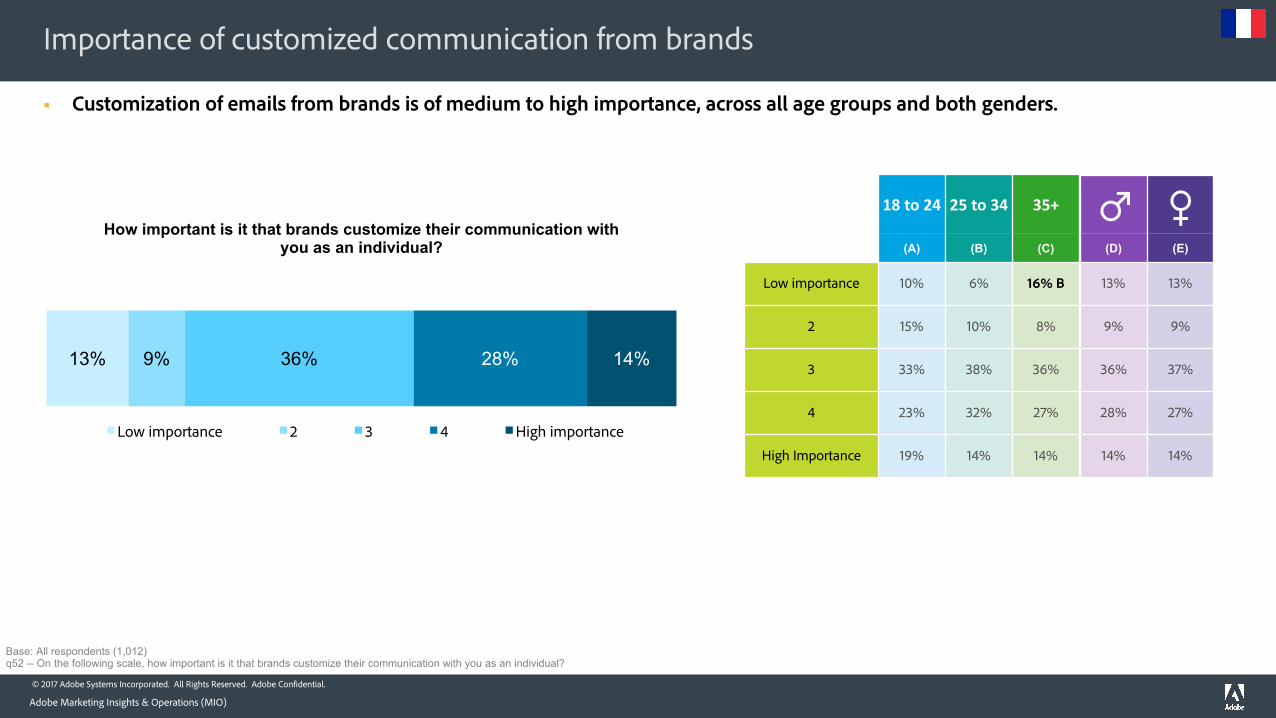
§ Customization of emails from brands is of medium to high importance, across all age groups and both genders.
13% 9% 36% 28% 14%
How important is it that brands customize their communication with you as an individual?
Low importance 2 3 4 High importance
Base: All respondents (1,012)q52 -- On the following scale, how important is it that brands customize their communication with you as an individual?
(D) (E)
13% 13%
9% 9%
36% 37%
28% 27%
14% 14%
18to24 25to34 35+
(A) (B) (C)
Low importance 10% 6% 16% B
2 15% 10% 8%
3 33% 38% 36%
4 23% 32% 27%
High Importance 19% 14% 14%
© 2017 Adobe Systems Incorporated. All Rights Reserved. Adobe Confidential.
Frustrating lack of personalization in emails
Adobe Marketing Insights & Operations (MIO)
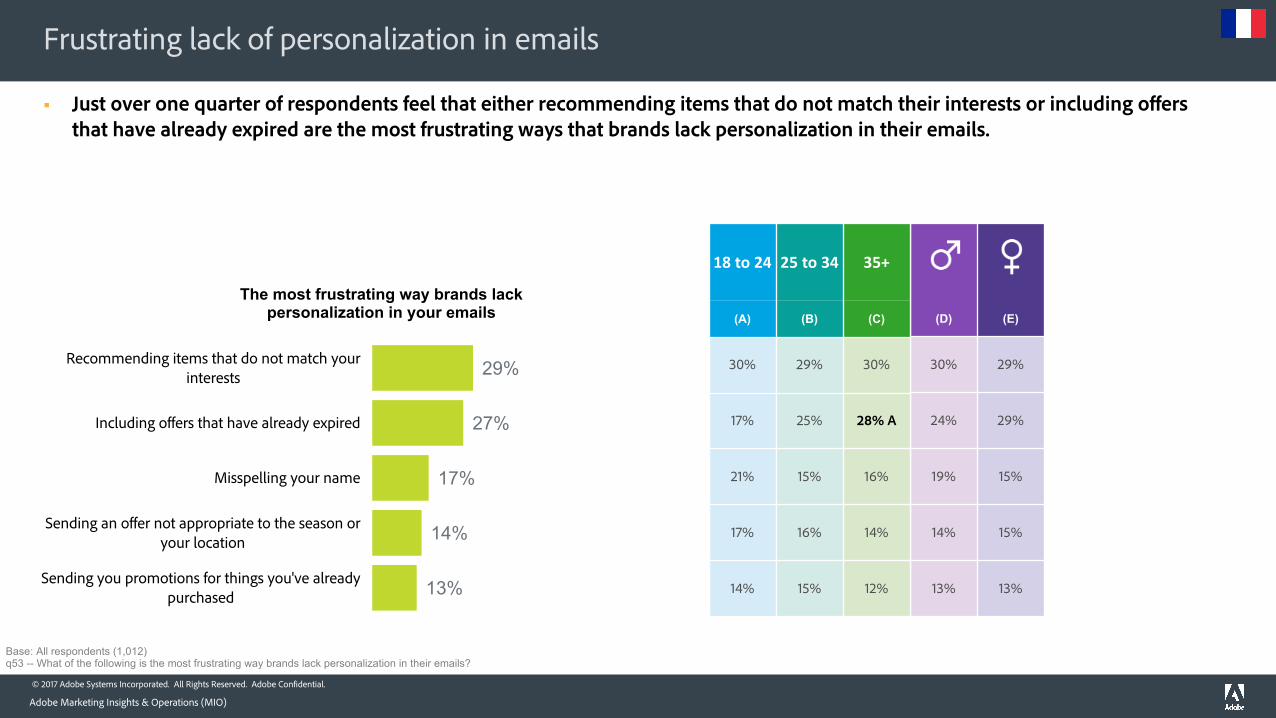
§ Just over one quarter of respondents feel that either recommending items that do not match their interests or including offers that have already expired are the most frustrating ways that brands lack personalization in their emails.
29%
27%
17%
14%
13%
Recommending items that do not match your interests
Including offers that have already expired
Misspelling your name
Sending an offer not appropriate to the season or your location
Sending you promotions for things you've already purchased
The most frustrating way brands lack personalization in your emails (D) (E)
30% 29%
24% 29%
19% 15%
14% 15%
13% 13%
18to24 25to34 35+
(A) (B) (C)
30% 29% 30%
17% 25% 28% A
21% 15% 16%
17% 16% 14%
14% 15% 12%
Base: All respondents (1,012)q53 -- What of the following is the most frustrating way brands lack personalization in their emails?
© 2017 Adobe Systems Incorporated. All Rights Reserved. Adobe Confidential. 41
Appendix
Adobe Marketing Insights & Operations (MIO)
© 2017 Adobe Systems Incorporated. All Rights Reserved. Adobe Confidential.
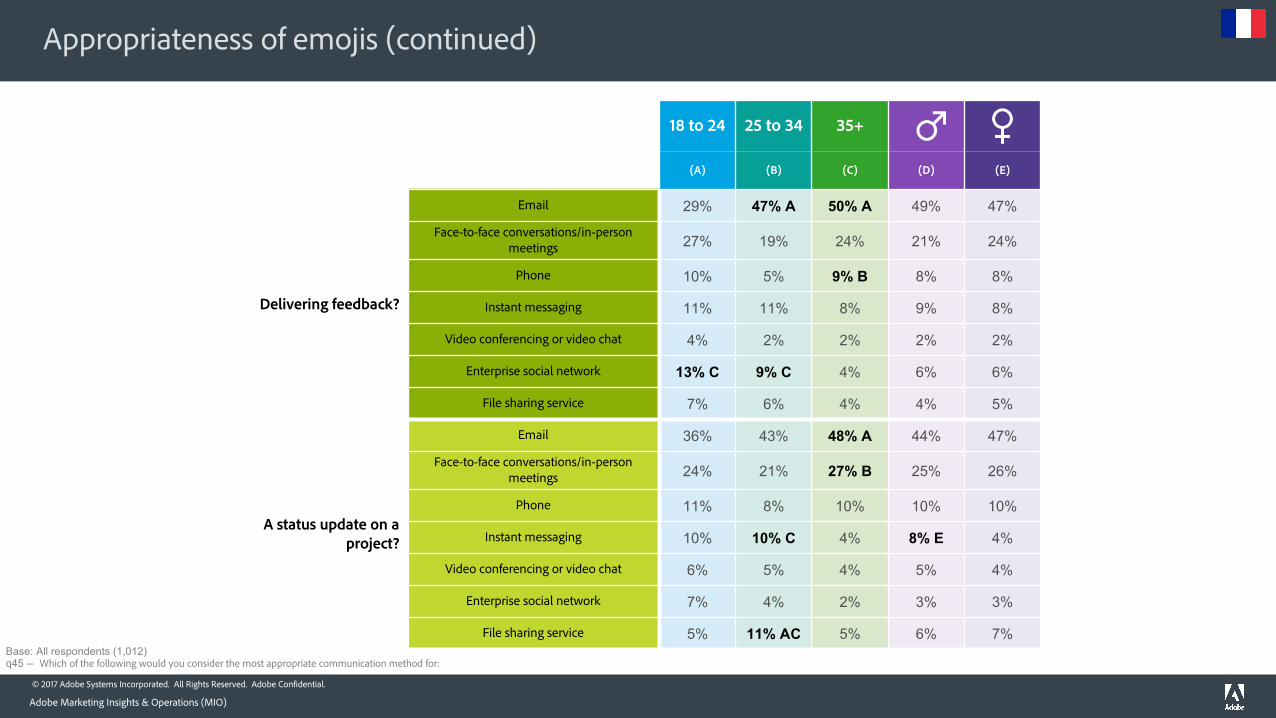
18 to 24 25 to 34 35+
(A) (B) (C) (D) (E)
Delivering feedback?
Email 29% 47% A 50% A 49% 47%
Face-to-face conversations/in-person meetings 27% 19% 24% 21% 24%
Phone 10% 5% 9% B 8% 8%
Instant messaging 11% 11% 8% 9% 8%
Video conferencing or video chat 4% 2% 2% 2% 2%
Enterprise social network 13% C 9% C 4% 6% 6%
File sharing service 7% 6% 4% 4% 5%
A status update on a project?
Email 36% 43% 48% A 44% 47%
Face-to-face conversations/in-person meetings 24% 21% 27% B 25% 26%
Phone 11% 8% 10% 10% 10%
Instant messaging 10% 10% C 4% 8% E 4%
Video conferencing or video chat 6% 5% 4% 5% 4%
Enterprise social network 7% 4% 2% 3% 3%
File sharing service 5% 11% AC 5% 6% 7%
Appropriateness of emojis (continued)
Adobe Marketing Insights & Operations (MIO)
Base: All respondents (1,012)q45 -- Which of the following would you consider the most appropriate communication method for:
© 2017 Adobe Systems Incorporated. All Rights Reserved. Adobe Confidential.
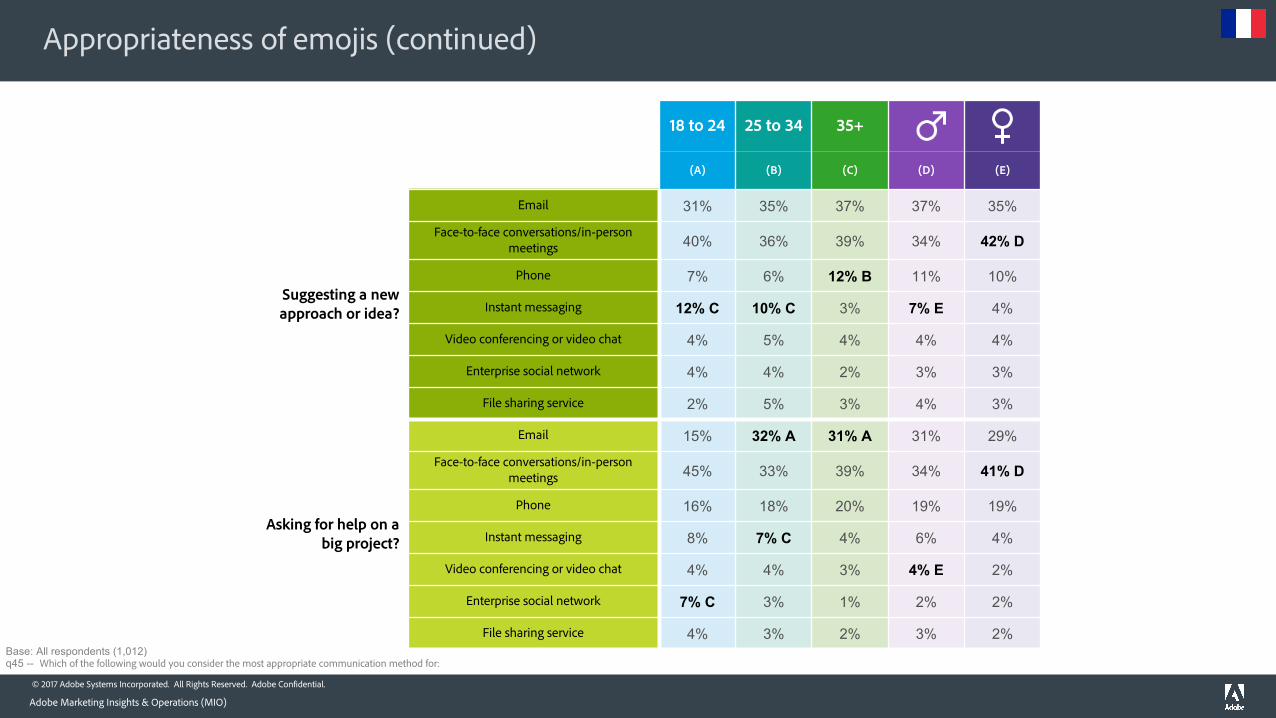
18 to 24 25 to 34 35+
(A) (B) (C) (D) (E)
Suggesting a new approach or idea?
Email 31% 35% 37% 37% 35%
Face-to-face conversations/in-person meetings 40% 36% 39% 34% 42% D
Phone 7% 6% 12% B 11% 10%
Instant messaging 12% C 10% C 3% 7% E 4%
Video conferencing or video chat 4% 5% 4% 4% 4%
Enterprise social network 4% 4% 2% 3% 3%
File sharing service 2% 5% 3% 4% 3%
Asking for help on a big project?
Email 15% 32% A 31% A 31% 29%
Face-to-face conversations/in-person meetings 45% 33% 39% 34% 41% D
Phone 16% 18% 20% 19% 19%
Instant messaging 8% 7% C 4% 6% 4%
Video conferencing or video chat 4% 4% 3% 4% E 2%
Enterprise social network 7% C 3% 1% 2% 2%
File sharing service 4% 3% 2% 3% 2%
Appropriateness of emojis (continued)
Adobe Marketing Insights & Operations (MIO)
Base: All respondents (1,012)q45 -- Which of the following would you consider the most appropriate communication method for:

© 2017 Adobe Systems Incorporated. All Rights Reserved. Adobe Confidential.
18 to 24 25 to 34 35+
(A) (B) (C) (D) (E)
Alerting your boss of an important issue?
Email 28% 31% 29% 29% 31%
Face-to-face conversations/in-person meetings 32% 35% 39% 31% 43% D
Phone 21% 21% 24% 27% E 20%
Instant messaging 5% 4% 3% 5% E 2%
Video conferencing or video chat 5% 2% 1% 2% 1%
Enterprise social network 4% 3% C 1% 2% 1%
File sharing service 4% 4% 2% 3% 2%
A brief question?
Email 27% 26% 29% 28% 29%
Face-to-face conversations/in-person meetings 24% 18% 20% 18% 22%
Phone 25% 31% 37% A 35% 35%
Instant messaging 10% 15% 10% 13% 9%
Video conferencing or video chat 3% 2% 1% 2% 1%
Enterprise social network 7% 4% C 1% 3% 3%
File sharing service 3% 5% C 1% 3% 1%
Appropriateness of emojis (continued)
Adobe Marketing Insights & Operations (MIO)
Base: All respondents (1,012)q45 -- Which of the following would you consider the most appropriate communication method for:
© 2017 Adobe Systems Incorporated. All Rights Reserved. Adobe Confidential.
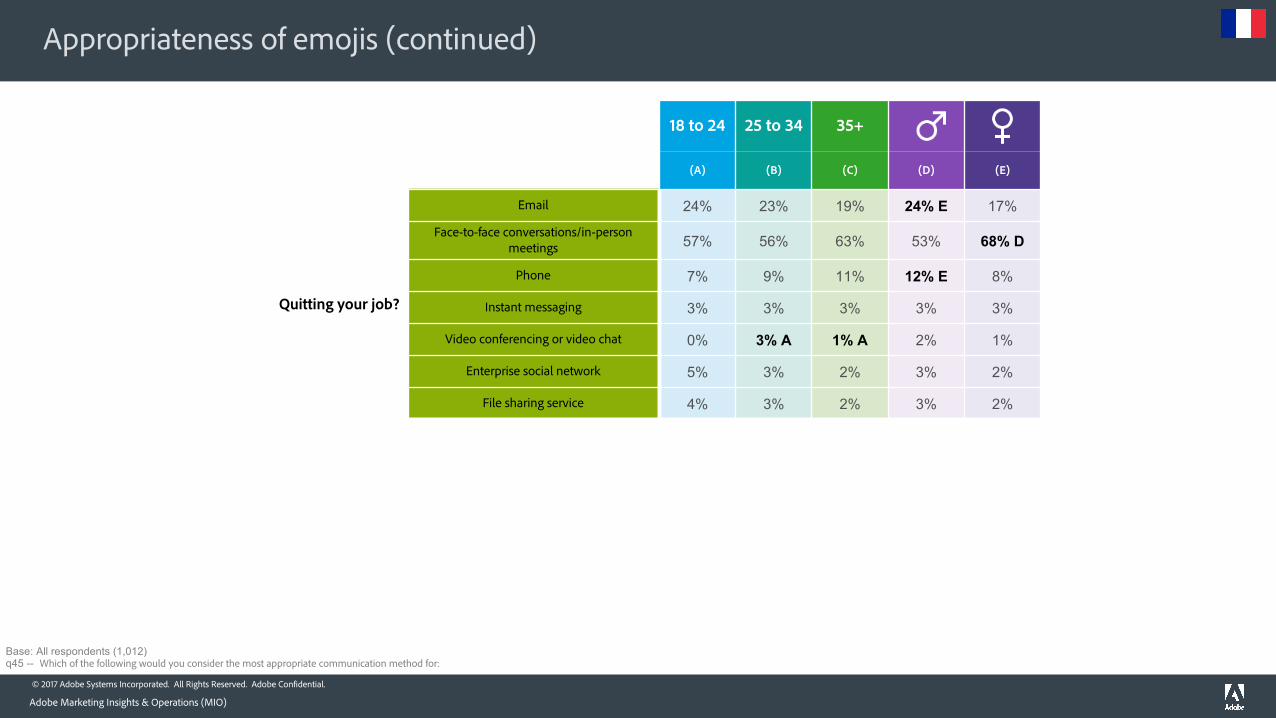
18 to 24 25 to 34 35+
(A) (B) (C) (D) (E)
Quitting your job?
Email 24% 23% 19% 24% E 17%
Face-to-face conversations/in-person meetings 57% 56% 63% 53% 68% D
Phone 7% 9% 11% 12% E 8%
Instant messaging 3% 3% 3% 3% 3%
Video conferencing or video chat 0% 3% A 1% A 2% 1%
Enterprise social network 5% 3% 2% 3% 2%
File sharing service 4% 3% 2% 3% 2%
Appropriateness of emojis (continued)
Adobe Marketing Insights & Operations (MIO)
Base: All respondents (1,012)q45 -- Which of the following would you consider the most appropriate communication method for:

© 2017 Adobe Systems Incorporated. All Rights Reserved. Adobe Confidential.