Embed Size (px)
Citation preview

Ryan BuenemannThomas McgeehonBirute Simkeviciute
Thomas StarrTam Tran
Decision Support Systems for Business Intelligence
2011 HOMICIDE DETECTION

Introduction St. Louis city
Population of 356,587 (2009) Grow rate 2.45% until 2014 Ranked 20th among all U.S. Metropolitan
Statistic Area’s (U.S. Census Bureau 2010) Average each year St. Louis lost 182 life by
Homicide Male>Female; Black = White; Young>Old(50 and up)
Allocating Data Crime reports per district
Types of crimes per district Association with
neighborhoods Geography

District Map
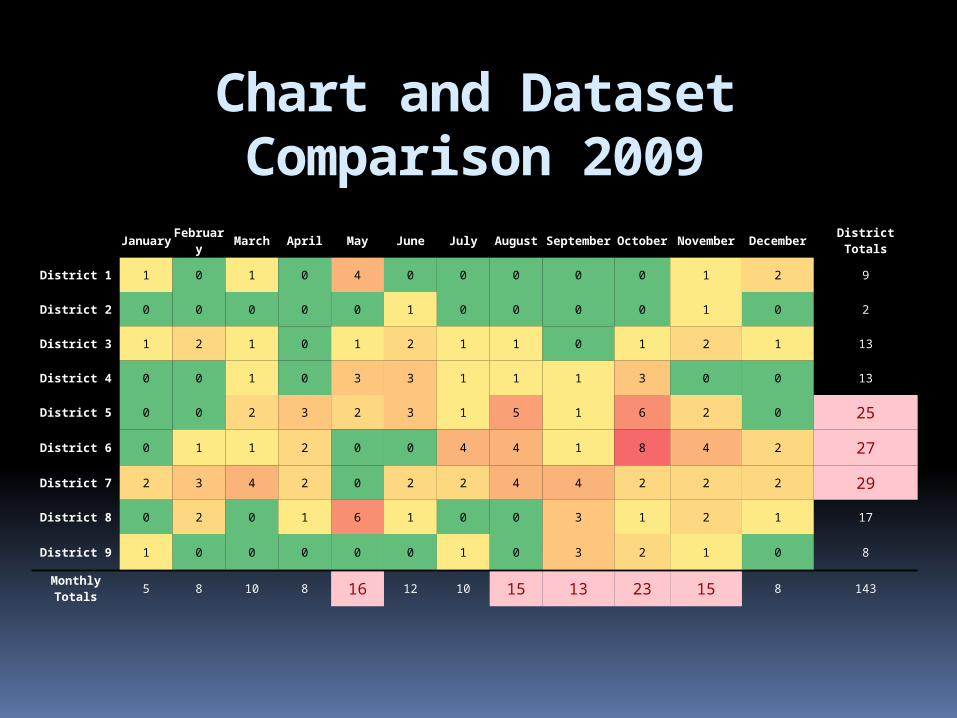
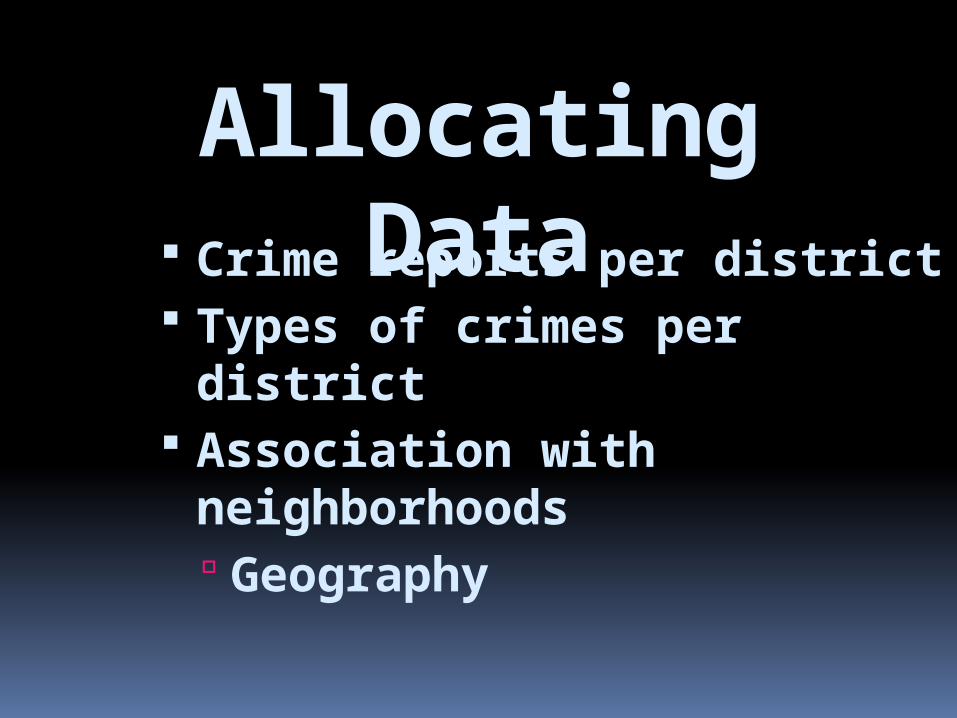
Chart and Dataset Comparison 2009
January February March April May June July August September October November December District Totals
District 1 1 0 1 0 4 0 0 0 0 0 1 2 9
District 2 0 0 0 0 0 1 0 0 0 0 1 0 2
District 3 1 2 1 0 1 2 1 1 0 1 2 1 13
District 4 0 0 1 0 3 3 1 1 1 3 0 0 13
District 5 0 0 2 3 2 3 1 5 1 6 2 0 25
District 6 0 1 1 2 0 0 4 4 1 8 4 2 27
District 7 2 3 4 2 0 2 2 4 4 2 2 2 29
District 8 0 2 0 1 6 1 0 0 3 1 2 1 17
District 9 1 0 0 0 0 0 1 0 3 2 1 0 8
Monthly Totals 5 8 10 8 16 12 10 15 13 23 15 8 143

January February March April May June July August September October November December District Totals
District 1 0 0 1 3 1 1 0 1 2 0 2 0 11
District 2 1 0 1 0 0 0 0 0 0 0 0 2 4
District 3 1 0 0 2 1 0 2 0 1 2 1 0 10
District 4 1 0 1 0 2 1 1 0 0 1 2 0 9
District 5 3 1 1 4 1 0 1 2 3 4 7 3 30
District 6 3 4 0 4 3 4 2 0 3 2 8 6 39
District 7 1 0 3 1 1 4 1 1 2 2 2 3 21
District 8 2 3 0 0 0 0 1 2 2 2 2 0 14
District 9 1 0 0 0 1 0 1 1 0 0 2 1 7
Monthly Totals 13 8 7 14 10 10 9 7 13 13 26 15 145
Chart and Dataset Comparison 2010

District Average Murders for 2009 and 2010
Dis
tric
t 1
Dis
tric
t 2
Dis
tric
t 3
Dis
tric
t 4
Dis
tric
t 5
Dis
tric
t 6
Dis
tric
t 7
Dis
tric
t 8
Dis
tric
t 9
0
5
10
15
20
25
30
35
10
3
11.5 11
27.5
33
25
15.5
7.5

Average Murders for 5, 6, & 7 of 2009 2010
Janu
ary
Febr
uary
Mar
chAp
ril
May
June
July
Augu
st
Sept
embe
r
Octob
er
Novem
ber
Decem
ber
0
2
4
6
8
10
12
14
4.5 4.55.5
8
3.5
6.55.5
87
12 12.5
8

Homicide Chart 2005-2010
KILLER
2005
2006
2007
2008
2009
2010
05
1015202530354045
District 1
District 2
District 3
District 4
District 5
District 6
District 7
District 8
District 9


Homicides have correlation with
the price of crude oil
2006 2007 2008 2009 2010
Yearly Change
-0.0305343511450382
0.0551181102362205
0.208955223880597
-0.117283950617284
0.006993006993007
-13%-8%-2%2%7%
13%18%23%
Percentage Change of Total Homicides Over
Last 5 Years
Perc
enta
ge
Change

Noticeable Changes
District 3 – Soulard 2005-2010 has highest
total of murders 2010 has 4th highest total
of murders
District 6 – Jennings 2005-2010
Distric
t 1
Distric
t 2
Distric
t 3
Distric
t 4
Distric
t 5
Distric
t 6
Distric
t 7
Distric
t 8
Distric
t 9
0
1
2
3
4
5
6
7
8
9
'05-'102010

Hypothesis The most probable area for
homicide to occur in 2011 in District 6
Based on past crime reports it is a far a assumption that Districts 5, 6, & 7 will remain to have higher homicides rates
Hypothesis
District 6 recently has become the district with the most homicides.
Reasons Higher income families are moving south and
west of city
Current prevention efforts are inadequate in these areas and need to be stepped up to improve the safety of their citizens


Homicide occurrence according to stltoday between Jan. 4 and Feb. 17
Homicides have been accruing in areas predicted by the research
Homicides in the St. Louis area this year

Works Cited
Official Website of the Metropolitan Police Department, City of St. Louis
SLMPD Crime Statistics Welcome to CrimeReports.com SLMPD Your Neighborhood AWH St. Louis City Police Frequencies,
Radio Codes and Talk groups
STLtoday.com/Post Dispatch 2011 Homicide Map
Us census crime rate