Embed Size (px)
Citation preview

Let us prepare a personalized plan for you
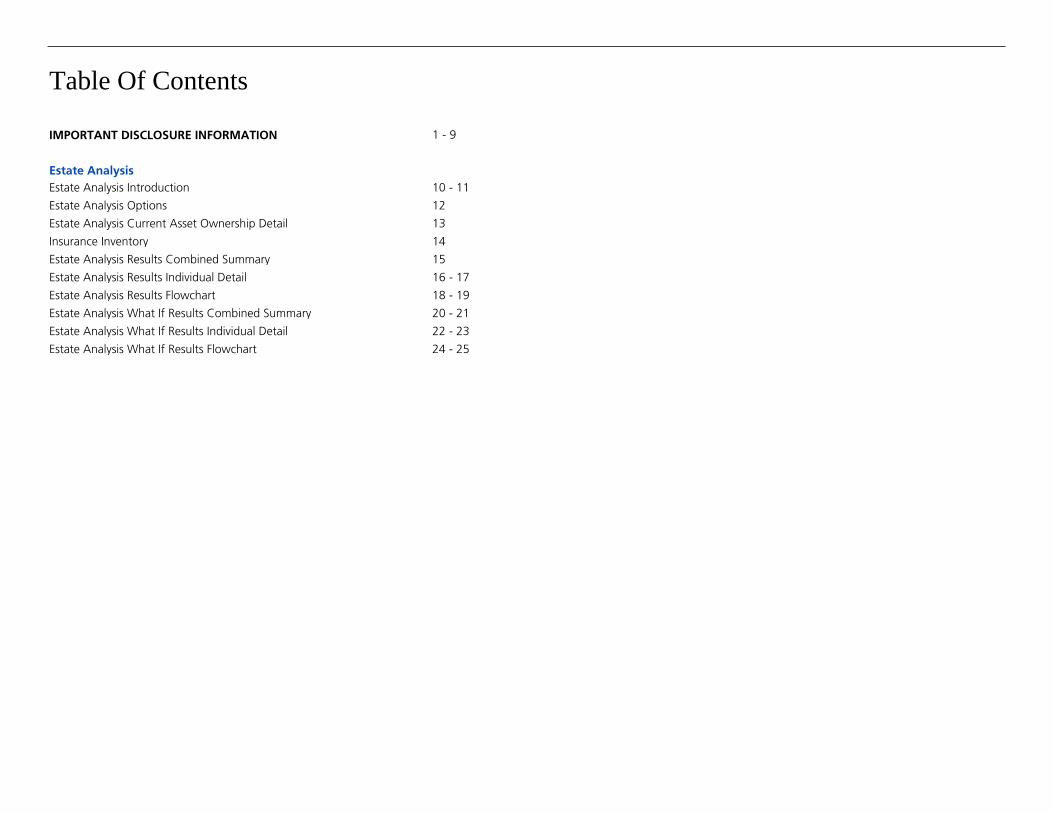
Table Of Contents
IMPORTANT DISCLOSURE INFORMATION 1 - 9
Estate Analysis
Estate Analysis Introduction 10 - 11
Estate Analysis Options 12
Estate Analysis Current Asset Ownership Detail 13
Insurance Inventory 14
Estate Analysis Results Combined Summary 15
Estate Analysis Results Individual Detail 16 - 17
Estate Analysis Results Flowchart 18 - 19
Estate Analysis What If Results Combined Summary 20 - 21
Estate Analysis What If Results Individual Detail 22 - 23
Estate Analysis What If Results Flowchart 24 - 25

IMPORTANT DISCLOSURE INFORMATION
05/21/2013
Prepared for : John and Margaret Boomer Prepared by: Sample Advisor
Page 1 of 25
The return assumptions in MoneyGuidePro are not reflective of any specific product, and donot include any fees or expenses that may be incurred by investing in specific products. Theactual returns of a specific product may be more or less than the returns used inMoneyGuidePro. It is not possible to directly invest in an index. Financial forecasts, rates ofreturn, risk, inflation, and other assumptions may be used as the basis for illustrations. Theyshould not be considered a guarantee of future performance or a guarantee of achievingoverall financial objectives. Past performance is not a guarantee or a predictor of futureresults of either the indices or any particular investment.
IMPORTANT: The projections or other information generated by MoneyGuidePro regardingthe likelihood of various investment outcomes are hypothetical in nature, do not reflectactual investment results, and are not guarantees of future results.
MoneyGuidePro results may vary with each use and over time.
Information that you provided about your assets, financial goals, and personal situation arekey assumptions for the calculations and projections in this Report. Please review theReport sections titled "Personal Information and Summary of Financial Goals", "CurrentPortfolio Allocation", and "Tax and Inflation Options" to verify the accuracy of theseassumptions. If any of the assumptions are incorrect, you should notify your financialadvisor. Even small changes in assumptions can have a substantial impact on the resultsshown in this Report. The information provided by you should be reviewed periodically andupdated when either the information or your circumstances change.
Information Provided by You
MoneyGuidePro Assumptions and Limitations
All asset and net worth information included in this Report was provided by you or yourdesignated agents, and is not a substitute for the information contained in the officialaccount statements provided to you by custodians. The current asset data and valuescontained in those account statements should be used to update the asset informationincluded in this Report, as necessary.
Assumptions and Limitations
MoneyGuidePro offers several methods of calculating results, each of which provides oneoutcome from a wide range of possible outcomes. All results in this Report are hypotheticalin nature, do not reflect actual investment results, and are not guarantees of future results.All results use simplifying assumptions that do not completely or accurately reflect yourspecific circumstances. No Plan or Report has the ability to accurately predict the future. Asinvestment returns, inflation, taxes, and other economic conditions vary from theMoneyGuidePro assumptions, your actual results will vary (perhaps significantly) from thosepresented in this Report.
All MoneyGuidePro calculations use asset class returns, not returns of actual investments.The projected return assumptions used in this Report are estimates based on average annualreturns for each asset class. The portfolio returns are calculated by weighting individualreturn assumptions for each asset class according to your portfolio allocation. The portfolioreturns may have been modified by including adjustments to the total return and theinflation rate. The portfolio returns assume reinvestment of interest and dividends at netasset value without taxes, and also assume that the portfolio has been rebalanced to reflectthe initial recommendation. No portfolio rebalancing costs, including taxes, if applicable,are deducted from the portfolio value. No portfolio allocation eliminates risk or guaranteesinvestment results.
MoneyGuidePro does not provide recommendations for any products or securities.

IMPORTANT DISCLOSURE INFORMATION
05/21/2013
Prepared for : John and Margaret Boomer Prepared by: Sample Advisor
Page 2 of 25
Projected Return AssumptionAsset Class
Cash & Cash Alternatives 3.50%
Cash & Cash Alternatives (Tax-Free) 3.00%
Short Term Bonds 4.30%
Short Term Bonds (Tax-Free) 3.40%
Intermediate Term Bonds 4.75%
Intermediate Term Bonds (Tax-Free) 4.10%
Long Term Bonds 4.50%
Long Term Bonds (Tax-Free) 4.00%
Large Cap Value Stocks 9.00%
Large Cap Growth Stocks 8.00%
Mid Cap Stocks 8.50%
Small Cap Stocks 9.00%
International Developed Stocks 8.00%
International Emerging Stocks 10.00%
IMPORTANT DISCLOSURE INFORMATION
05/21/2013
Prepared for : John and Margaret Boomer Prepared by: Sample Advisor
Page 3 of 25
Risks Inherent in Investing
Investing in fixed income securities involves interest rate risk, credit risk, and inflation risk.Interest rate risk is the possibility that bond prices will decrease because of an interest rateincrease. When interest rates rise, bond prices and the values of fixed income securities fall.When interest rates fall, bond prices and the values of fixed income securities rise. Creditrisk is the risk that a company will not be able to pay its debts, including the interest on itsbonds. Inflation risk is the possibility that the interest paid on an investment in bonds willbe lower than the inflation rate, decreasing purchasing power.
Cash alternatives typically include money market securities and U.S. treasury bills. Investingin such cash alternatives involves inflation risk. In addition, investments in money marketsecurities may involve credit risk and a risk of principal loss. Because money marketsecurities are neither insured nor guaranteed by the Federal Deposit Insurance Corporationor any other government agency, there is no guarantee the value of your investment will bemaintained at $1.00 per share. U.S. Treasury bills are subject to market risk if sold prior tomaturity. Market risk is the possibility that the value, when sold, might be less than thepurchase price.
Investing in stock securities involves volatility risk, market risk, business risk, and industryrisk. The prices of most stocks fluctuate. Volatility risk is the chance that the value of a stockwill fall. Market risk is chance that the prices of all stocks will fall due to conditions in theeconomic environment. Business risk is the chance that a specific company’s stock will fallbecause of issues affecting it. Industry risk is the chance that a set of factors particular to anindustry group will adversely affect stock prices within the industry. (See “Asset Class –Stocks” in the Glossary section of this Important Disclosure Information for a summary ofthe relative potential volatility of different types of stocks.)
International investing involves additional risks including, but not limited to, changes incurrency exchange rates, differences in accounting and taxation policies, and political oreconomic instabilities that can increase or decrease returns.
Report Is a Snapshot and Does Not Provide Legal, Tax, or Accounting Advice
This Report provides a snapshot of your current financial position and can help you to focuson your financial resources and goals, and to create a plan of action. Because the resultsare calculated over many years, small changes can create large differences in future results.You should use this Report to help you focus on the factors that are most important to you.This Report does not provide legal, tax, or accounting advice. Before making decisions withlegal, tax, or accounting ramifications, you should consult appropriate professionals foradvice that is specific to your situation.
MoneyGuidePro Methodology
MoneyGuidePro offers several methods of calculating results, each of which provides oneoutcome from a wide range of possible outcomes. The methods used are: “AverageReturns,” “Historical Test,” “Historical Rolling Periods,” “Bad Timing,” “Class Sensitivity,”and “Monte Carlo Simulations.” When using historical returns, the methodologies availableare Average Returns, Historical Test, Historical Rolling Periods, Bad Timing, and Monte CarloSimulations. When using projected returns, the methodologies available are AverageReturns, Bad Timing, Class Sensitivity, and Monte Carlo Simulations.
Results Using Average Returns
The Results Using Average Returns are calculated using one average return for yourpre-retirement period and one average return for your post-retirement period. AverageReturns are a simplifying assumption. In the real world, investment returns can (and oftendo) vary widely from year to year and vary widely from a long-term average return.
Results Using Historical Test
Results Using Historical Rolling Periods
The Results Using Historical Rolling Periods is a series of Historical Tests, each of which usesthe actual historical returns and inflations rates, in sequence, from a starting year to anending year, and assumes that you would receive those returns and inflation rates, insequence, from this year through the end of your Plan. If the historical sequence is shorterthan your Plan, the average return for the historical period is used for the balance of thePlan.
Indices in Results Using Historical Rolling Periods may be different from indices used in otherMoneyGuidePro calculations. Rolling Period Results are calculated using only three assetclasses -- Cash, Bonds, and Stocks. The indices used as proxies for these asset classes whencalculating Results Using Historical Rolling Periods are:
• Cash - Ibbotson U.S. 30-day Treasury Bills (1926-2012)
• Bonds - Ibbotson Intermediate-Term Government Bonds - Total Return (1926-2012)
• Stocks - Ibbotson Large Company Stocks - Total Return (1926-2012)
The Results Using Historical Test are calculated by using the actual historical returns andinflation rates, in sequence, from a starting year to the present, and assumes that youwould receive those returns and inflation rates, in sequence, from this year through the endof your Plan. If the historical sequence is shorter than your Plan, the average return for thehistorical period is used for the balance of the Plan. The historical returns used are those ofthe broad-based asset class indices listed in this Important Disclosure Information.
IMPORTANT DISCLOSURE INFORMATION
05/21/2013
Prepared for : John and Margaret Boomer Prepared by: Sample Advisor
Page 4 of 25
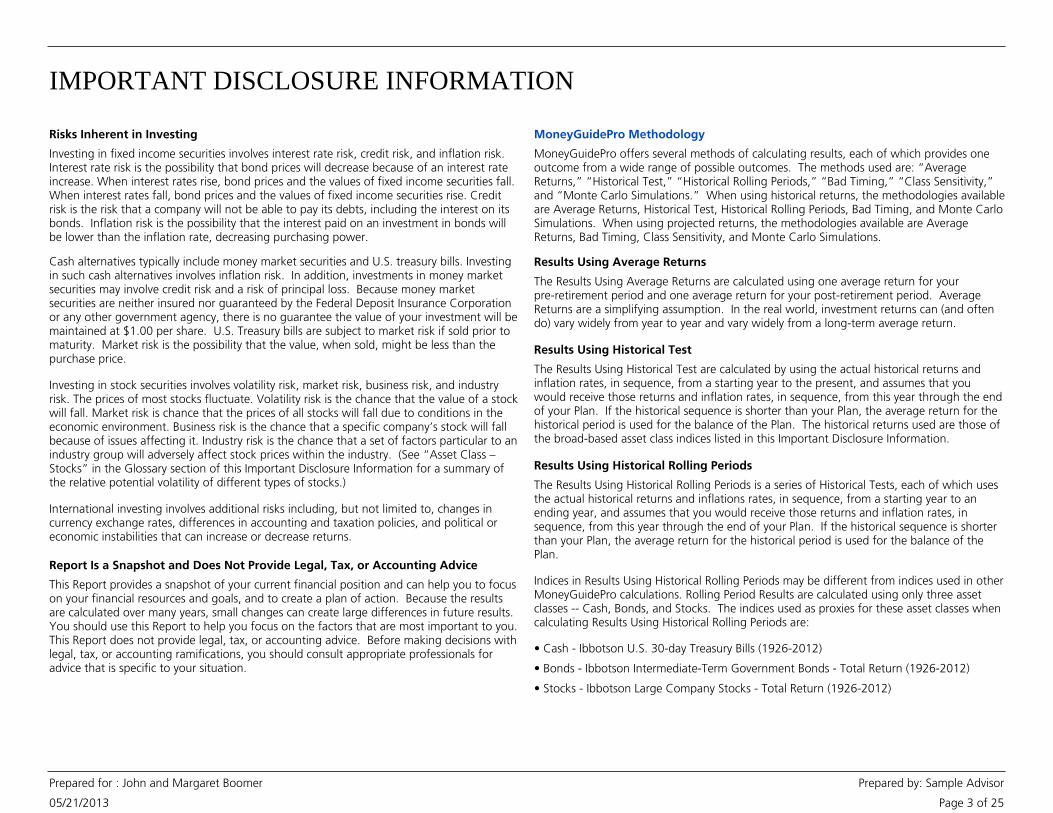
Results with Bad Timing
Results with Bad Timing are calculated by using low returns in one or two years, andaverage returns for all remaining years of the Plan. For most Plans, the worst time for lowreturns is when you begin taking substantial withdrawals from your portfolio. The Resultswith Bad Timing assume that you earn a low return in the year(s) you select and then anAdjusted Average Return in all other years. This Adjusted Average Return is calculated sothat the average return of the Results with Bad Timing is equal to the return(s) used incalculating the Results Using Average Returns. This allows you to compare two results withthe same overall average return, where one (the Results with Bad Timing) has low returns inone or two years.
When using historical returns, the default for one year of low returns is the lowest annualreturn in the historical period you are using, and the default for two years of low returns isthe lowest two-year sequence of returns in the historical period. When using projectedreturns, the default for the first year of low returns is two standard deviations less than theaverage return, and the default for the second year is one standard deviation less than theaverage return.
Results Using Class Sensitivity
The Results Using Class Sensitivity are calculated by using different return assumptions forone or more asset classes during the years you select. These results show how your Planwould be affected if the annual returns for one or more asset classes were different thanthe average returns for a specified period in your Plan.
Results Using Monte Carlo Simulations
Monte Carlo simulations are used to show how variations in rates of return each year canaffect your results. A Monte Carlo simulation calculates the results of your Plan by runningit many times, each time using a different sequence of returns. Some sequences of returnswill give you better results, and some will give you worse results. These multiple trialsprovide a range of possible results, some successful (you would have met all your goals) andsome unsuccessful (you would not have met all your goals). The percentage of trials thatwere successful is the probability that your Plan, with all its underlying assumptions, couldbe successful. In MoneyGuidePro, this is the Probability of Success. Analogously, thepercentage of trials that were unsuccessful is the Probability of Failure. The Results UsingMonte Carlo Simulations indicate the likelihood that an event may occur as well as thelikelihood that it may not occur. In analyzing this information, please note that the analysisdoes not take into account actual market conditions, which may severely affect theoutcome of your goals over the long-term.
MoneyGuidePro uses a specialized methodology called Beyond Monte Carlo™, a statisticalanalysis technique that provides results that are as accurate as traditional Monte Carlosimulations with 10,000 trials, but with fewer iterations and greater consistency. BeyondMonte Carlo™ is based on Sensitivity Simulations, which re-runs the Plan only 50 to 100times using small changes in the return. This allows a sensitivity of the results to becalculated, which, when analyzed with the mean return and standard deviation of theportfolio, allows the Probability of Success for your Plan to be directly calculated.
MoneyGuidePro Presentation of Results
The Results Using Average Returns, Historical Test, Historical Rolling Periods, Bad Timing,and Class Sensitivity display the results using an “Estimated % of Goal Funded” and a“Safety Margin.”
Estimated % of Goal Funded
For each Goal, the “Estimated % of Goal Funded” is the sum of the assets used to fund theGoal divided by the sum of the Goal’s expenses. All values are in current dollars. A result of100% or more does not guarantee that you will reach a Goal, nor does a result under100% guarantee that you will not. Rather, this information is meant to identify possibleshortfalls in this Plan, and is not a guarantee that a certain percentage of your Goals will befunded. The percentage reflects a projection of the total cost of the Goal that was actuallyfunded based upon all the assumptions that are included in this Plan, and assumes that youexecute all aspects of the Plan as you have indicated.
Safety Margin
The Safety Margin is the estimated value of your assets at the end of this Plan, based on allthe assumptions included in this Report. Only you can determine if that Safety Margin issufficient for your needs.
Bear Market Loss and Bear Market Test
The Bear Market Loss shows how a portfolio would have been impacted during the worstbear market since the Great Depression. Depending on the composition of the portfolio,the worst bear market is either the "Great Recession" or the "Bond Bear Market."
The Great Recession, from November 2007 through February 2009, was the worst bearmarket for stocks since the Great Depression. In MoneyGuidePro, the Great RecessionReturn is the rate of return, during the Great Recession, for a portfolio comprised of cash,bonds, and stocks, with an asset mix equivalent to the portfolio referenced.

IMPORTANT DISCLOSURE INFORMATION
05/21/2013
Prepared for : John and Margaret Boomer Prepared by: Sample Advisor
Page 5 of 25
The Bond Bear Market, from July 1979 through February 1980, was the worst bear marketfor bonds since the Great Depression. In MoneyGuidePro, the Bond Bear Market Return isthe rate of return, for the Bond Bear Market period, for a portfolio comprised of cash,bonds, and stocks, with an asset mix equivalent to the portfolio referenced.
The Bear Market Loss shows: 1) either the Great Recession Return or the Bond Bear MarketReturn, whichever is lower, and 2) the potential loss, if you had been invested in thiscash-bond-stock portfolio during the period with the lower return. In general, mostportfolios with a stock allocation of 20% or more have a lower Great Recession Return, andmost portfolios with a combined cash and bond allocation of 80% or more have a lowerBond Bear Market Return.
The Bear Market Test, included in the Stress Tests, examines the impact on your Plan resultsif an identical Great Recession or Bond Bear Market, whichever would be worse, occurredthis year. The Bear Market Test shows the likelihood that you could fund your Needs,Wants and Wishes after experiencing such an event.
Regardless of whether you are using historical or projected returns for all otherMoneyGuidePro results, the Bear Market Loss and Bear Market Test use returns calculatedfrom historical indices. If you are using historical returns, the indices in the Bear Market Lossand the Bear Market Test may be different from indices used in other calculations. Theseresults are calculated using only three asset classes – Cash, Bonds, and Stocks. Alternativeasset classes (e.g., real estate, commodities), if applicable, are included in the Stocks assetclass. The indices and the resulting returns for the Great Recession and the Bond BearMarket are:
Because the Bear Market Loss and Bear Market Test use the returns from asset class indicesrather than the returns of actual investments, they do not represent the performance forany specific portfolio, and are not a guarantee of minimum or maximum levels of losses orgains for any portfolio. The actual performance of your portfolio may differ substantiallyfrom those shown in the Great Recession Return, the Bond Bear Market Return, the BearMarket Loss, and the Bear Market Test.
AssetClass
Index Great RecessionReturn
11/2007 – 02/2009
Bond Bear MarketReturn
07/1979 – 02/1980
Cash Ibbotson U.S. 30-dayTreasury Bills
2.31% 7.08%
Bonds Ibbotson Intermediate-TermGovernment Bonds – TotalReturn
15.61% -8.89%
Stocks Ibbotson Large CompanyStocks – Total Return
-50.95% 14.61%
MoneyGuidePro Risk Assessment
The MoneyGuidePro Risk Assessment highlights some – but not all – of the trade-offs youmight consider when deciding how to invest your money. This approach does not provide acomprehensive, psychometrically-based, or scientifically-validated profile of your risktolerance, loss tolerance, or risk capacity, and is provided for informational purposes only.
Based on your specific circumstances, you must decide the appropriate balance betweenpotential risks and potential returns. MoneyGuidePro does not and cannot adequatelyunderstand or assess the appropriate risk/return balance for you. MoneyGuidePro requiresyou to select a risk score. Once selected, three important pieces of information are availableto help you determine the appropriateness of your score: a cash-bond-stock portfolio, theimpact of a Bear Market Loss (either the Great Recession or the Bond Bear Market,whichever is lower) on this portfolio, and a graph showing how your score compares to therisk score of others in your age group.
MoneyGuidePro uses your risk score to select a risk-based portfolio on the Target Bandpage. This risk-based portfolio selection is provided for informational purposes only, andyou should consider it to be a starting point for conversations with your advisor. It is yourresponsibility to select the Target Portfolio you want MoneyGuidePro to use. The selectionof your Target Portfolio, and other investment decisions, should be made by you, afterdiscussions with your advisor and, if needed, other financial and/or legal professionals.
Glossary
Asset Allocation is the process of determining what portions of your portfolio holdings areto be invested in the various asset classes.
Asset Allocation
Asset Class
Asset Class is a standard term that broadly defines a category of investments. The threebasic asset classes are Cash, Bonds, and Stocks. Bonds and Stocks are often furthersubdivided into more narrowly defined classes. Some of the most common asset classes aredefined below.
Cash and Cash Alternatives
Cash typically includes bank accounts or certificates of deposit, which are insured by theFederal Deposit Insurance Corporation up to a limit per account. Cash Alternatives typicallyinclude money market securities, U.S. treasury bills, and other investments that are readilyconvertible to cash, have a stable market value, and a very short-term maturity. U.S.Treasury bills are backed by the full faith and credit of the U.S. Government and, whenheld to maturity, provide safety of principal. (See the “Risks Inherent in Investing” sectionin this Important Disclosure Information for a summary of the risks associated withinvesting in cash alternatives.)

IMPORTANT DISCLOSURE INFORMATION
05/21/2013
Prepared for : John and Margaret Boomer Prepared by: Sample Advisor
Page 6 of 25
Bonds
Bonds are either domestic (U.S.) or global debt securities issued by either privatecorporations or governments. (See the “Risks Inherent in Investing” section in thisImportant Disclosure Information for a summary of the risks associated with investing inbonds. Bonds are also called “fixed income securities.”)
Domestic government bonds are backed by the full faith and credit of the U.S.Government and have superior liquidity and, when held to maturity, safety of principal.Domestic corporate bonds carry the credit risk of their issuers and thus usually offeradditional yield. Domestic government and corporate bonds can be sub-divided basedupon their term to maturity. Short-term bonds have an approximate term to maturity of 1to 5 years; intermediate-term bonds have an approximate term to maturity of 5 to 10years; and, long-term bonds have an approximate term to maturity greater than 10 years.
Stocks
Stocks are equity securities of domestic and foreign corporations. (See the “Risks Inherentin Investing” section in this Important Disclosure Information for a summary of the risksassociated with investing in stocks.)
Domestic stocks are equity securities of U.S. corporations. Domestic stocks are oftensub-divided based upon the market capitalization of the company (the market value of thecompany's stock). "Large cap" stocks are from larger companies, "mid cap" from themiddle range of companies, and "small cap" from smaller, perhaps newer, companies.Generally, small cap stocks experience greater market volatility than stocks of companieswith larger capitalization. Small cap stocks are generally those from companies whosecapitalization is less than $500 million, mid cap stocks those between $500 million and $5billion, and large cap over $5 billion.
Large cap, mid cap and small cap may be further sub-divided into "growth" and "value"categories. Growth companies are those with an orientation towards growth, oftencharacterized by commonly used metrics such as higher price-to-book andprice-to-earnings ratios. Analogously, value companies are those with an orientationtowards value, often characterized by commonly used metrics such as lower price-to-bookand price-to-earnings ratios.
International stocks are equity securities from foreign corporations. International stocks areoften sub-divided into those from "developed" countries and those from "emergingmarkets." The emerging markets are in less developed countries with emerging economiesthat may be characterized by lower income per capita, less developed infrastructure andnascent capital markets. These "emerging markets" usually are less economically andpolitically stable than the "developed markets." Investing in international stocks involvesspecial risks, among which include foreign exchange volatility and risks of investing underdifferent tax, regulatory and accounting standards.
Asset Mix
Asset Mix is the combination of asset classes within a portfolio, and is usually expressed as apercentage for each asset class.
Bear Market Loss
The Bear Market Loss shows how a portfolio would have been impacted during the GreatRecession (November 2007 through February 2009) or the Bond Bear Market (July 1979through February 1980). The Bear Market Loss shows: 1) either the Great Recession Returnor the Bond Bear Market Return, whichever is lower, and 2) the potential loss, if you hadbeen invested in this cash-bond-stock portfolio during the period with the lower return. SeeBear Market Test, Great Recession Return, and Bond Bear Market Return.
Bear Market Test
The Bear Market Test, included in the Stress Tests, examines the impact on your Plan resultsif a Bear Market Loss occurred this year. The Bear Market Test shows the likelihood that youcould fund your Needs, Wants and Wishes after experiencing such an event. See BearMarket Loss.
Bond Bear Market Return
The Bond Bear Market Return is the rate of return for a cash-bond-stock portfolio duringthe Bond Bear Market (July 1979 through February 1980), the worst bear market for bondssince the Great Depression. MoneyGuidePro shows a Bond Bear Market Return for yourCurrent, Risk-based, and Target Portfolios, calculated using historical returns of threebroad-based asset class indices. See Great Recession Return.
Cash Receipt Schedule
A Cash Receipt Schedule consists of one or more years of future after-tax amounts receivedfrom the anticipated sale of an Other Asset, exercising of Stock Options grants, or proceedsfrom Restricted Stock grants.
Confidence Zone
See Monte Carlo Confidence Zone.
Concentrated Position
A Concentrated Position is when your portfolio contains a significant amount (as apercentage of the total portfolio value) in individual stock or bonds. Concentrated Positionshave the potential to increase the risk of your portfolio.

IMPORTANT DISCLOSURE INFORMATION
05/21/2013
Prepared for : John and Margaret Boomer Prepared by: Sample Advisor
Page 7 of 25
Current Portfolio
Your Current Portfolio is comprised of all the investment assets you currently own (or asubset of your assets, based on the information you provided for this Plan), categorized byAsset Class and Asset Mix.
Current Dollars
The Results of MoneyGuidePro calculations are in Future Dollars. To help you comparedollar amounts in different years, we also express the Results in Current Dollars, calculatedby discounting the Future Dollars by the sequence of inflation rates used in the Plan.
Fund All Goals
Fund All Goals is one of two ways for your assets and retirement income to be used to fundyour goals. The other is Earmark, which means that an asset or retirement income isassigned to one or more goals, and will be used only for those goals. Fund All Goals meansthat the asset or income is not earmarked to fund specific goals, and can be used to fundany goal, as needed in the calculations.
Expense Adjustments
When using historical returns, some users of MoneyGuidePro include Expense Adjustments.These adjustments (which are specified by the user) reduce the return of the affected AssetClasses and are commonly used to account for transaction costs or other types of feesassociated with investing. If Expense Adjustments have been used in this Report, they willbe listed beside the historical indices at the beginning of this Report.
Future Dollars
Future Dollars are inflated dollars. The Results of MoneyGuidePro calculations are in FutureDollars. To help you compare dollar amounts in different years, we discount the FutureDollar amounts by the inflation rates used in the calculations and display the Results in theequivalent Current Dollars.
Great Recession Return
The Great Recession Return is the rate of return for a cash-bond-stock portfolio during theGreat Recession (November 2007 through February 2009), the worst bear market for stockssince the Great Depression. MoneyGuidePro shows a Great Recession Return for yourCurrent, Risk-based, and Target Portfolios, calculated using historical returns of threebroad-based asset class indices. See Bond Bear Market Return.
Inflation Rate
Inflation is the percentage increase in the cost of goods and services for a specified timeperiod. A historical measure of inflation is the Consumer Price Index (CPI). InMoneyGuidePro, the Inflation Rate is selected by your advisor, and can be adjusted indifferent scenarios.
Liquidity
Liquidity is the ease with which an investment can be converted into cash.
Monte Carlo Confidence Zone
The Monte Carlo Confidence Zone is the range of probabilities that you (and/or youradvisor) have selected as your target range for the Monte Carlo Probability of Success inyour Plan. The Confidence Zone reflects the Monte Carlo Probabilities of Success withwhich you would be comfortable, based upon your Plan, your specific time horizon, riskprofile, and other factors unique to you.
Monte Carlo Probability of Success / Probability of Failure
The Monte Carlo Probability of Success is the percentage of trials of your Plan that weresuccessful. If a Monte Carlo simulation runs your Plan 10,000 times, and if 6,000 of thoseruns are successful (i.e., all your goals are funded and you have at least $1 of SafetyMargin), then the Probability of Success for that Plan, with all its underlying assumptions,would be 60%, and the Probability of Failure would be 40%.
Monte Carlo Simulations
Monte Carlo simulations are used to show how variations in rates of return each year canaffect your results. A Monte Carlo simulation calculates the results of your Plan by runningit many times, each time using a different sequence of returns. Some sequences of returnswill give you better results, and some will give you worse results. These multiple trialsprovide a range of possible results, some successful (you would have met all your goals) andsome unsuccessful (you would not have met all your goals).
Needs / Wants / Wishes
In MoneyGuidePro, you choose an importance level from 10 to 1 (where 10 is the highest)for each of your financial goals. Then, the importance levels are divided into three groups:Needs, Wants, and Wishes. Needs are the goals that you consider necessary for yourlifestyle, and are the goals that you must fulfill. Wants are the goals that you would reallylike to fulfill, but could live without. Wishes are the “dream goals” that you would like tofund, although you won’t be too dissatisfied if you can’t fund them. In MoneyGuidePro,Needs are your most important goals, then Wants, then Wishes.
IMPORTANT DISCLOSURE INFORMATION
05/21/2013
Prepared for : John and Margaret Boomer Prepared by: Sample Advisor
Page 8 of 25
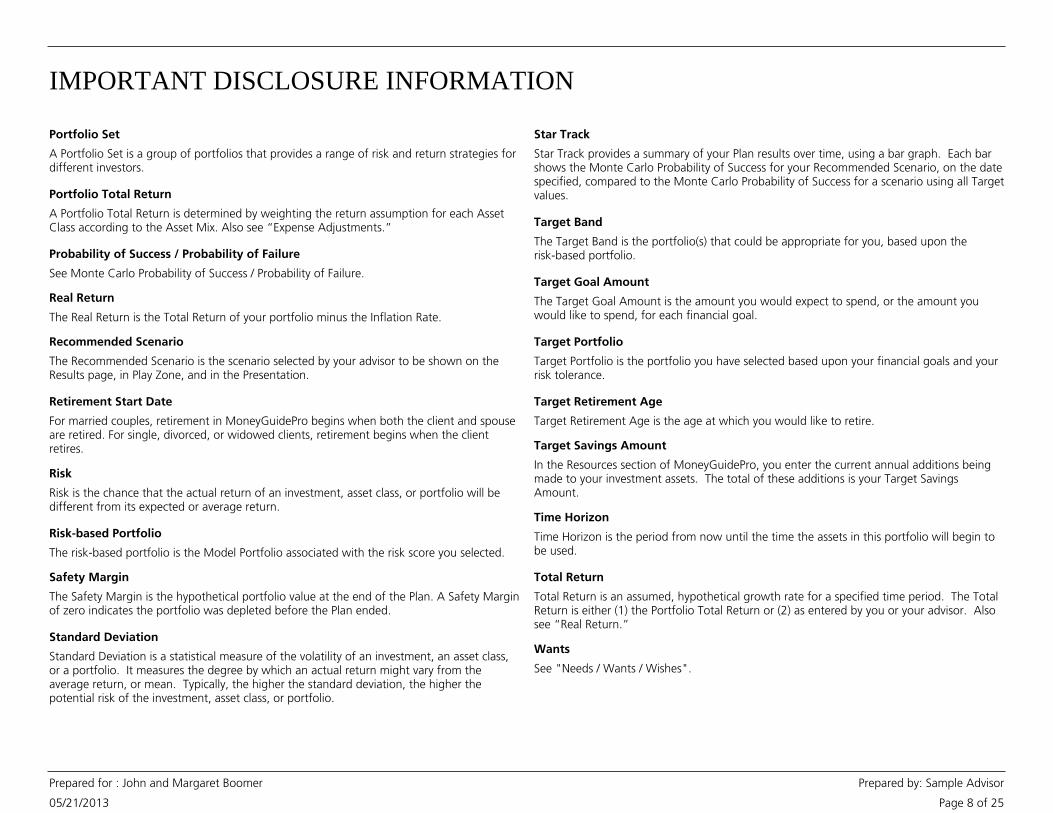
Portfolio Set
A Portfolio Set is a group of portfolios that provides a range of risk and return strategies fordifferent investors.
Portfolio Total Return
A Portfolio Total Return is determined by weighting the return assumption for each AssetClass according to the Asset Mix. Also see “Expense Adjustments.”
Standard Deviation
Safety Margin
The Safety Margin is the hypothetical portfolio value at the end of the Plan. A Safety Marginof zero indicates the portfolio was depleted before the Plan ended.
Probability of Success / Probability of Failure
See Monte Carlo Probability of Success / Probability of Failure.
Real Return
The Real Return is the Total Return of your portfolio minus the Inflation Rate.
Recommended Scenario
The Recommended Scenario is the scenario selected by your advisor to be shown on theResults page, in Play Zone, and in the Presentation.
Retirement Start Date
For married couples, retirement in MoneyGuidePro begins when both the client and spouseare retired. For single, divorced, or widowed clients, retirement begins when the clientretires.
Risk
Risk is the chance that the actual return of an investment, asset class, or portfolio will bedifferent from its expected or average return.
Risk-based Portfolio
The risk-based portfolio is the Model Portfolio associated with the risk score you selected.
Standard Deviation is a statistical measure of the volatility of an investment, an asset class,or a portfolio. It measures the degree by which an actual return might vary from theaverage return, or mean. Typically, the higher the standard deviation, the higher thepotential risk of the investment, asset class, or portfolio.
Star Track
Star Track provides a summary of your Plan results over time, using a bar graph. Each barshows the Monte Carlo Probability of Success for your Recommended Scenario, on the datespecified, compared to the Monte Carlo Probability of Success for a scenario using all Targetvalues.
Target Band
The Target Band is the portfolio(s) that could be appropriate for you, based upon therisk-based portfolio.
Target Portfolio
Target Portfolio is the portfolio you have selected based upon your financial goals and yourrisk tolerance.
Target Retirement Age
Target Retirement Age is the age at which you would like to retire.
Target Savings Amount
In the Resources section of MoneyGuidePro, you enter the current annual additions beingmade to your investment assets. The total of these additions is your Target SavingsAmount.
Time Horizon
Time Horizon is the period from now until the time the assets in this portfolio will begin tobe used.
Target Goal Amount
The Target Goal Amount is the amount you would expect to spend, or the amount youwould like to spend, for each financial goal.
Total Return
Total Return is an assumed, hypothetical growth rate for a specified time period. The TotalReturn is either (1) the Portfolio Total Return or (2) as entered by you or your advisor. Alsosee “Real Return.”
Wants
See "Needs / Wants / Wishes".

IMPORTANT DISCLOSURE INFORMATION
05/21/2013
Prepared for : John and Margaret Boomer Prepared by: Sample Advisor
Page 9 of 25
Willingness
In MoneyGuidePro, in addition to specifying Target Goal Amounts, a Target SavingsAmount, and Target Retirement Ages, you also specify a Willingness to adjust these Targetvalues. The Willingness choices are Very Willing, Somewhat Willing, Slightly Willing, andNot at All.
Wishes
See "Needs / Wants / Wishes".
Worst One-Year Loss
The Worst One-Year Loss is the lowest annual return that a portfolio with the specified assetmix and asset class indices would have received during the historical period specified.

Estate Analysis
Estate Analysis Introduction
05/21/2013
Prepared for : John and Margaret Boomer Prepared by: Sample Advisor
Page 10 of 25
See Important Disclosure Information section in this Report for explanations of assumptions, limitations, methodologies, and a glossary.
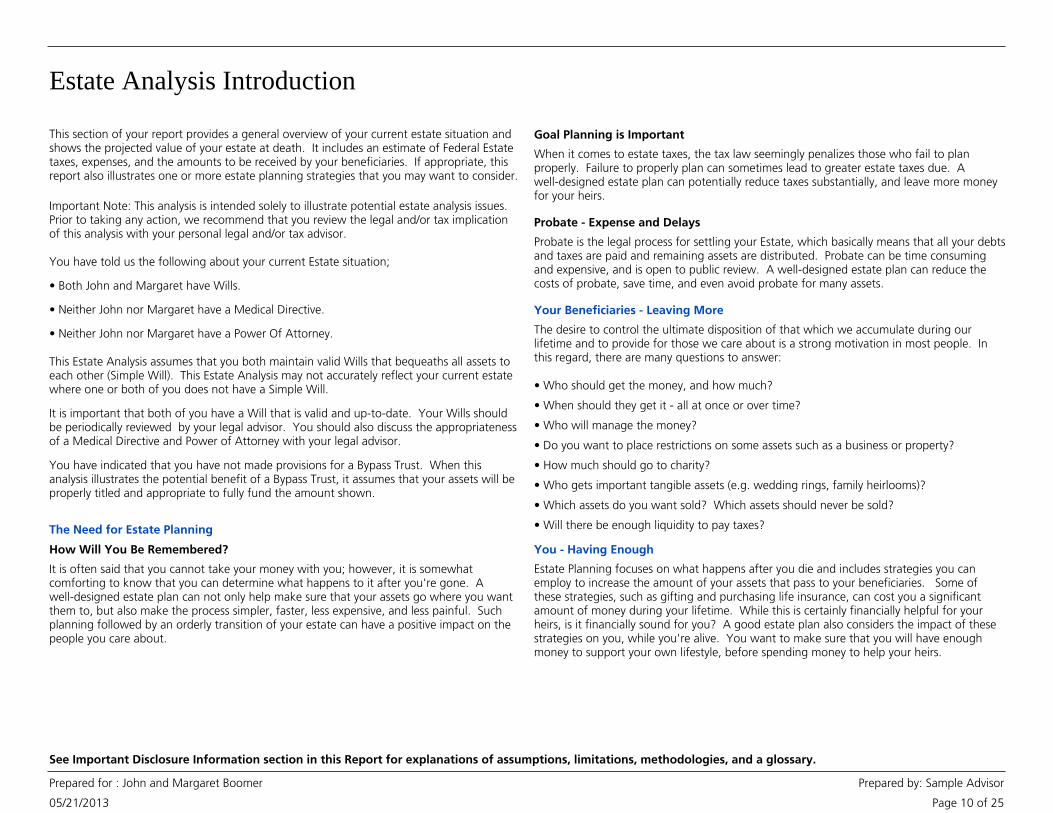
This section of your report provides a general overview of your current estate situation andshows the projected value of your estate at death. It includes an estimate of Federal Estatetaxes, expenses, and the amounts to be received by your beneficiaries. If appropriate, thisreport also illustrates one or more estate planning strategies that you may want to consider.
Important Note: This analysis is intended solely to illustrate potential estate analysis issues.Prior to taking any action, we recommend that you review the legal and/or tax implicationof this analysis with your personal legal and/or tax advisor.
You have told us the following about your current Estate situation;
• Both John and Margaret have Wills.
• Neither John nor Margaret have a Medical Directive.
• Neither John nor Margaret have a Power Of Attorney.
This Estate Analysis assumes that you both maintain valid Wills that bequeaths all assets toeach other (Simple Will). This Estate Analysis may not accurately reflect your current estatewhere one or both of you does not have a Simple Will.
It is important that both of you have a Will that is valid and up-to-date. Your Wills shouldbe periodically reviewed by your legal advisor. You should also discuss the appropriatenessof a Medical Directive and Power of Attorney with your legal advisor.
You have indicated that you have not made provisions for a Bypass Trust. When thisanalysis illustrates the potential benefit of a Bypass Trust, it assumes that your assets will beproperly titled and appropriate to fully fund the amount shown.
The Need for Estate Planning
It is often said that you cannot take your money with you; however, it is somewhatcomforting to know that you can determine what happens to it after you're gone. Awell-designed estate plan can not only help make sure that your assets go where you wantthem to, but also make the process simpler, faster, less expensive, and less painful. Suchplanning followed by an orderly transition of your estate can have a positive impact on thepeople you care about.
How Will You Be Remembered?
When it comes to estate taxes, the tax law seemingly penalizes those who fail to planproperly. Failure to properly plan can sometimes lead to greater estate taxes due. Awell-designed estate plan can potentially reduce taxes substantially, and leave more moneyfor your heirs.
Goal Planning is Important
• When should they get it - all at once or over time?
• Do you want to place restrictions on some assets such as a business or property?
• How much should go to charity?
• Who gets important tangible assets (e.g. wedding rings, family heirlooms)?
• Which assets do you want sold? Which assets should never be sold?
• Will there be enough liquidity to pay taxes?
Probate - Expense and Delays
Probate is the legal process for settling your Estate, which basically means that all your debtsand taxes are paid and remaining assets are distributed. Probate can be time consumingand expensive, and is open to public review. A well-designed estate plan can reduce thecosts of probate, save time, and even avoid probate for many assets.
Your Beneficiaries - Leaving More
The desire to control the ultimate disposition of that which we accumulate during ourlifetime and to provide for those we care about is a strong motivation in most people. Inthis regard, there are many questions to answer:
• Who should get the money, and how much?
• Who will manage the money?
You - Having Enough
Estate Planning focuses on what happens after you die and includes strategies you canemploy to increase the amount of your assets that pass to your beneficiaries. Some ofthese strategies, such as gifting and purchasing life insurance, can cost you a significantamount of money during your lifetime. While this is certainly financially helpful for yourheirs, is it financially sound for you? A good estate plan also considers the impact of thesestrategies on you, while you're alive. You want to make sure that you will have enoughmoney to support your own lifestyle, before spending money to help your heirs.

Estate Analysis Introduction
05/21/2013
Prepared for : John and Margaret Boomer Prepared by: Sample Advisor
Page 11 of 25
See Important Disclosure Information section in this Report for explanations of assumptions, limitations, methodologies, and a glossary.
This analysis makes a number of assumptions that could significantly affect your resultsincluding, but not limited to, the following:
Important Information on Assumptions
• State inheritance, estate or gift taxes have not been incorporated.
• Gift taxes are not calculated every year, but are totaled and settled at the death of thedonor.
• Generation-skipping taxes, if applicable, have not been calculated.
• All custodial accounts (UGMA and/or UTMA) are not included in the estate calculations.
• Both of you are U.S. Citizens.
• All amounts contributed to 529 Savings Plans are treated as completed gifts and there isno recapture provision for any 5-year pre-funding contribution elections.
• Prior gifts above the annual exclusion and for which no taxes have been paid are includedin your Taxable Estate. Prior gifts above the annual exclusion and for which taxes have beenpaid are not included in your Taxable Estate.
• All Qualified Retirement Plans, IRAs and Tax-deferred Annuities are assumed to have thespouse as the Beneficiary and its value is available to fund goals after the first death. Thecontingent Beneficiary is the estate.
• Financial Goals such as "Gift or Donation" or "Leave a Bequest" are not reflected in theEstate Analysis.
• Bequests stipulated in your will, including charitable bequests, are not reflected in theEstate Analysis.
• If applicable, reverted gifts and/or life insurance proceeds transferred to a Trust orthird-party within three years of death are included in your Gross Estate and Taxable Estate.
• In certain calculations, the Bypass Trust may not be fully funded to the available estateexemption equivalent amount due to prior gifts, titling of assets, insufficient resources,and/or other bequests.
• The current values of vested stock options are included in the gross estate. The currentvalues of unvested stock options are included if you indicated, on the Stock Options page,that the options vest at death.
• In the event Qualified Retirement Plans, IRAs, and Tax-deferred Annuities are used to fundthe Bypass Trust, the program assumes the spouse has disclaimed the assets and thecontigent beneficiary is a 'qualified' trust.
• In the event Other Assets, such as a Primary Residence or Personal Property, are used tofund the Bypass Trust, the program assumes these assets have a specific value and can infact be used to fund the Bypass Trust.
• If applicable, the value of any payment that continues past death created by theImmediate Annuity Goal Strategy is not included in the estate calculations.
Estate Analysis Options
05/21/2013
Prepared for : John and Margaret Boomer Prepared by: Sample Advisor
Page 12 of 25
See Important Disclosure Information section in this Report for explanations of assumptions, limitations, methodologies, and a glossary.
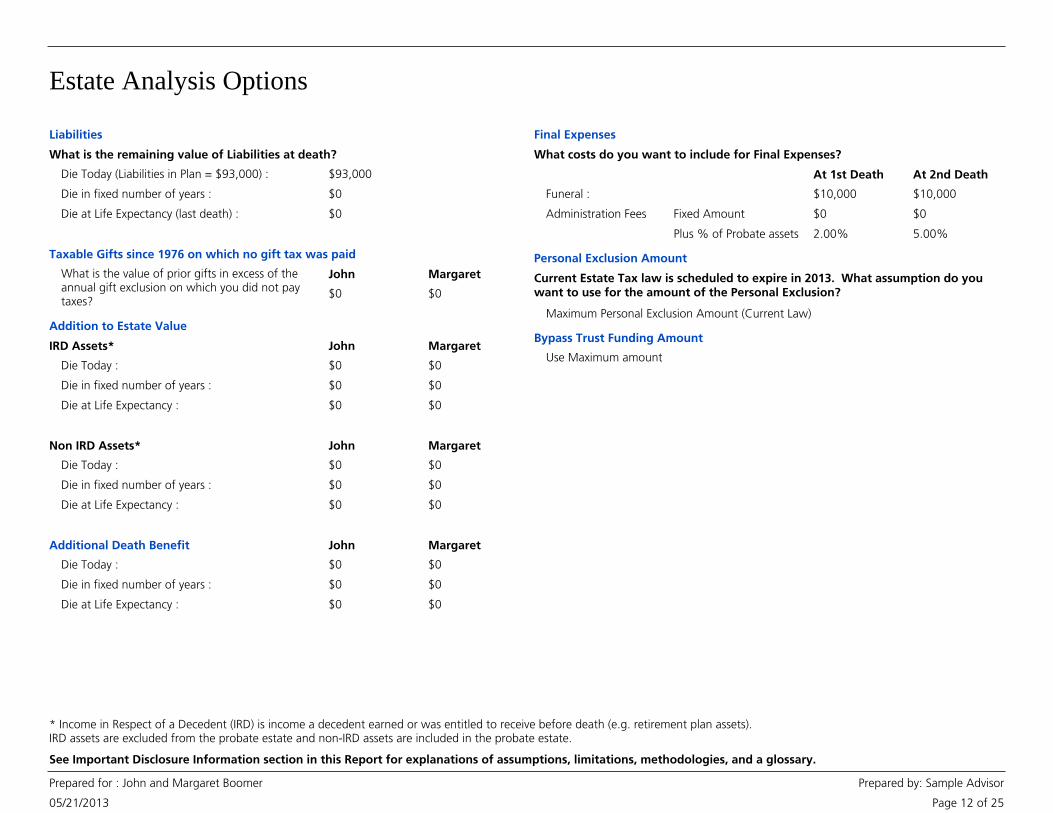
What is the remaining value of Liabilities at death?
Liabilities
Die Today (Liabilities in Plan = $93,000) :
Die in fixed number of years :
Die at Life Expectancy (last death) :
$93,000
$0
$0
Taxable Gifts since 1976 on which no gift tax was paid
What is the value of prior gifts in excess of theannual gift exclusion on which you did not paytaxes?
John Margaret
$0 $0
IRD Assets*
Addition to Estate Value
Die Today :
Die in fixed number of years :
Die at Life Expectancy :
Non IRD Assets*
Die Today :
Die in fixed number of years :
Die at Life Expectancy :
Additional Death Benefit
Die Today :
Die in fixed number of years :
Die at Life Expectancy :
John Margaret
John Margaret
John Margaret
$0 $0
$0 $0
$0 $0
$0 $0
$0 $0
$0 $0
$0 $0
$0 $0
$0 $0
What costs do you want to include for Final Expenses?
Final Expenses
Administration Fees
At 1st Death At 2nd Death
Funeral :
Fixed Amount
Plus % of Probate assets
$10,000 $10,000
$0 $0
2.00% 5.00%
Current Estate Tax law is scheduled to expire in 2013. What assumption do youwant to use for the amount of the Personal Exclusion?
Personal Exclusion Amount
Maximum Personal Exclusion Amount (Current Law)
Bypass Trust Funding Amount
Use Maximum amount
* Income in Respect of a Decedent (IRD) is income a decedent earned or was entitled to receive before death (e.g. retirement plan assets).IRD assets are excluded from the probate estate and non-IRD assets are included in the probate estate.

Estate Analysis Current Asset Ownership Detail
05/21/2013
Prepared for : John and Margaret Boomer Prepared by: Sample Advisor
Page 13 of 25
See Important Disclosure Information section in this Report for explanations of assumptions, limitations, methodologies, and a glossary.
Note: All Qualified Retirement Plans, IRA and Tax-deferred Assets are assumed to have the spouse as the beneficiary if married with theestate as contingent beneficiary, or the estate as the beneficiary if single. All other Assets owned individually or jointly are assumed tooperate as prescribed by applicable law. We do not provide legal or tax advice. Please consult with your tax and/or legal advisor to reviewthe ownership and beneficiary designations and their legal and tax implications since they can have a significant impact on the distributionof assets at your death and whether or not certain basic estate strategies can be implemented.
This chart summarizes the current ownership and designated beneficiary(ies) of all of your Assets used in this Plan.
Description John Margaret
Joint (Margaret)
TotalSurvivorship Common Entirety CommunityProperty
Joint (Other) Beneficiaries
Investment Assets
Employer Retirement Plans
401(k) $315,034 $315,034
Taxable and/or Tax-Free Accounts
Margaret's Brokerage Account $213,000 $213,000
Margaret's Brokerage Account $109,000 $109,000
Total Investment Assets $315,034 $322,000 $0 $637,034$0 $0 $0 $0
Other Assets
Personal Asset
Personal Residence $450,000 $450,000
Future Assets - Cash
Inheritance from Mom
Stock Options
Home Depot, Inc. $2,180 $2,180
Total Other Assets $2,180 $0 $450,000 $452,180$0 $0 $0 $0
$317,214Total Assets : $322,000 $450,000 $1,089,214$0 $0 $0 $0
Insurance Inventory
05/21/2013
Prepared for : John and Margaret Boomer Prepared by: Sample Advisor
Page 14 of 25
See Important Disclosure Information section in this Report for explanations of assumptions, limitations, methodologies, and a glossary.
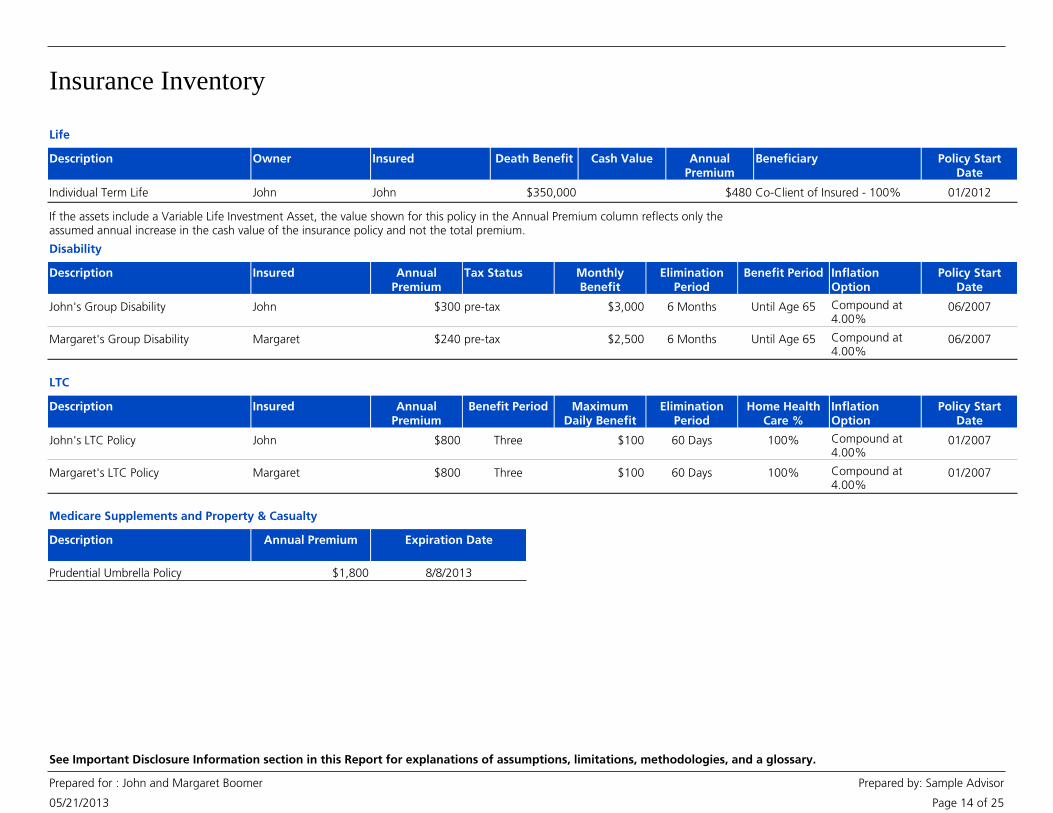
AnnualPremium
Cash ValueDescription Owner BeneficiaryInsured Death Benefit Policy StartDate
Life
$480Individual Term Life John Co-Client of Insured - 100%John $350,000 01/2012
If the assets include a Variable Life Investment Asset, the value shown for this policy in the Annual Premium column reflects only theassumed annual increase in the cash value of the insurance policy and not the total premium.
AnnualPremium
MonthlyBenefit
Description Benefit Period InflationOption
Insured Tax Status EliminationPeriod
Policy StartDate
Disability
$300 $3,000John's Group Disability Until Age 65 Compound at4.00%
John pre-tax 6 Months 06/2007
$240 $2,500Margaret's Group Disability Until Age 65 Compound at4.00%
Margaret pre-tax 6 Months 06/2007
AnnualPremium
MaximumDaily Benefit
Description Benefit Period InflationOption
Insured Home HealthCare %
EliminationPeriod
Policy StartDate
LTC
John's LTC Policy John $800 Three $100 60 Days 100% Compound at4.00%
01/2007
Margaret's LTC Policy Margaret $800 Three $100 60 Days 100% Compound at4.00%
01/2007
Annual PremiumDescription Expiration Date
Medicare Supplements and Property & Casualty
$1,800Prudential Umbrella Policy 8/8/2013

Estate Analysis Results Combined Summary
05/21/2013
Prepared for : John and Margaret Boomer Prepared by: Sample Advisor
Page 15 of 25
See Important Disclosure Information section in this Report for explanations of assumptions, limitations, methodologies, and a glossary.
Amount to Heirs : $2,180,001 $2,224,424
Federal Estate Tax** : $0 $0
Estate Expenses : $109,717 $65,294
Additional Value to Heirs : $44,423
Amount to Heirs
Net Estate Value : $2,180,001 $1,335,965
Bypass Trust : $0 $888,459
Life Insurance in Trust : $0 $0
Total : $2,180,001 $2,224,424
Cash Needed to Pay Tax and Expenses
Shortfall at First Death : $0 $0
Existing Estate Existing Estate
Other Life Insurance : $0 $0
Total Estate : $2,289,719 $2,289,719
Will without Bypass Trust Will with Bypass Trust
Shortfall at Second Death : $0 $0
Bypass Trust Funding
Funding Shortfall : $0 $12,646,681
** State Estate Taxes are not included. In some states, the tax may be substantial.
• Prior gifts are not included in the amount to heirs.
Notes
Using What If Scenario 1 - Both Die at life expectancy - John Predeceases Margaret
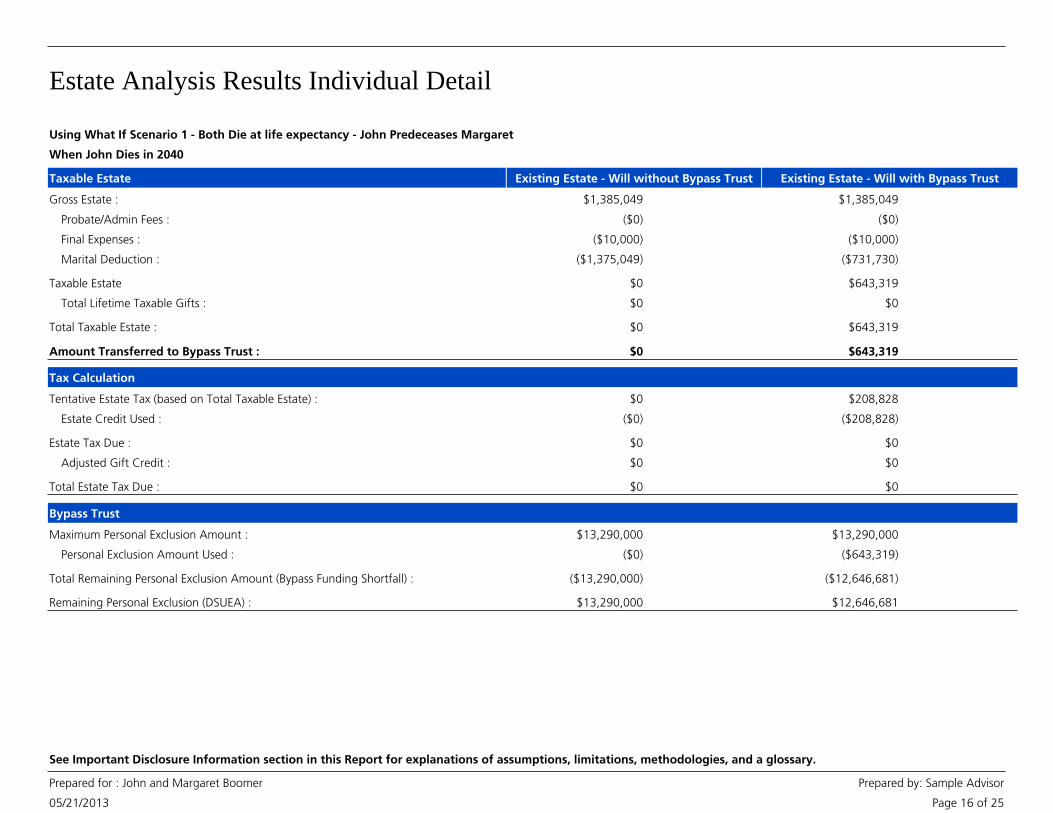
Estate Analysis Results Individual Detail
05/21/2013
Prepared for : John and Margaret Boomer Prepared by: Sample Advisor
Page 16 of 25
See Important Disclosure Information section in this Report for explanations of assumptions, limitations, methodologies, and a glossary.
Taxable Estate
Gross Estate : $1,385,049 $1,385,049
Probate/Admin Fees : ($0) ($0)
Final Expenses : ($10,000) ($10,000)
Marital Deduction : ($1,375,049) ($731,730)
Taxable Estate $0 $643,319
Total Lifetime Taxable Gifts : $0 $0
Total Taxable Estate : $0 $643,319
Tax Calculation
Tentative Estate Tax (based on Total Taxable Estate) : $0 $208,828
Estate Credit Used : ($0) ($208,828)
Total Estate Tax Due : $0 $0
Remaining Personal Exclusion (DSUEA) : $13,290,000 $12,646,681
Amount Transferred to Bypass Trust : $0 $643,319
When John Dies in 2040
Existing Estate - Will without Bypass Trust Existing Estate - Will with Bypass Trust
Estate Tax Due : $0 $0
Adjusted Gift Credit : $0 $0
Bypass Trust
Maximum Personal Exclusion Amount : $13,290,000 $13,290,000
Personal Exclusion Amount Used : ($0) ($643,319)
Total Remaining Personal Exclusion Amount (Bypass Funding Shortfall) : ($13,290,000) ($12,646,681)
Using What If Scenario 1 - Both Die at life expectancy - John Predeceases Margaret
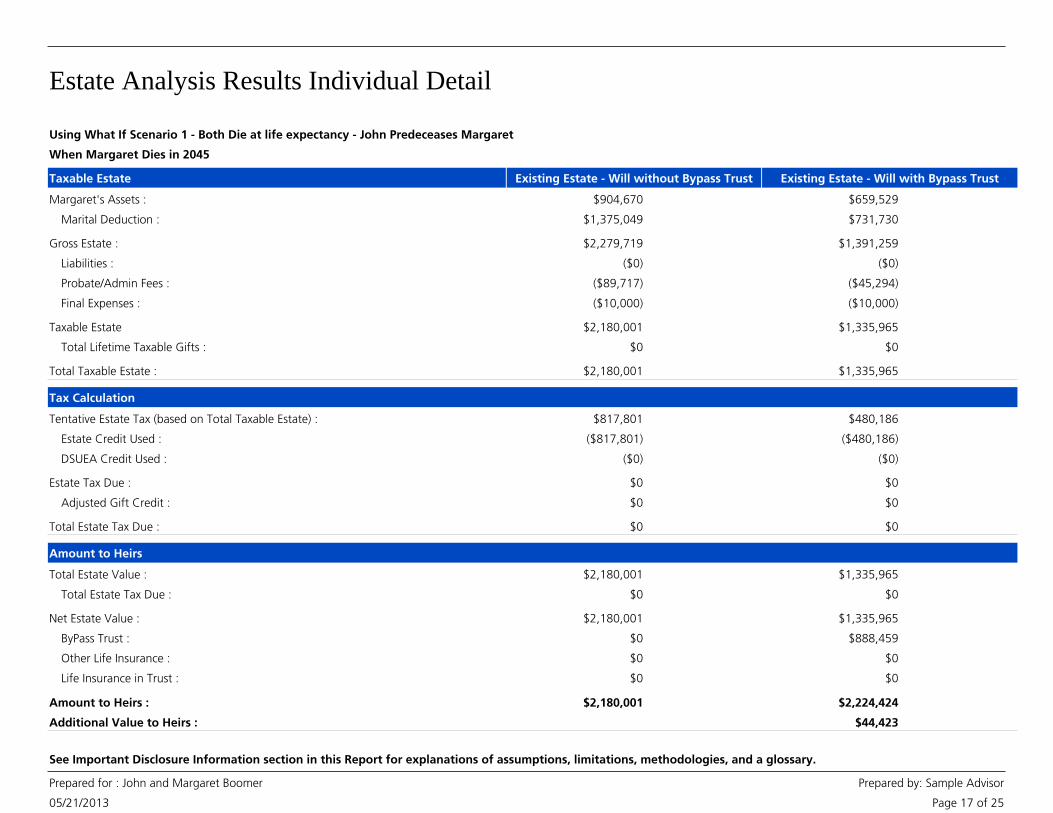
Estate Analysis Results Individual Detail
05/21/2013
Prepared for : John and Margaret Boomer Prepared by: Sample Advisor
Page 17 of 25
See Important Disclosure Information section in this Report for explanations of assumptions, limitations, methodologies, and a glossary.
Taxable Estate
Gross Estate : $2,279,719 $1,391,259
Liabilities : ($0) ($0)
Probate/Admin Fees : ($89,717) ($45,294)
Final Expenses : ($10,000) ($10,000)
Taxable Estate $2,180,001 $1,335,965
Total Lifetime Taxable Gifts : $0 $0
Total Taxable Estate : $2,180,001 $1,335,965
Tax Calculation
Tentative Estate Tax (based on Total Taxable Estate) : $817,801 $480,186
Estate Credit Used : ($817,801) ($480,186)
Total Estate Tax Due : $0 $0
When Margaret Dies in 2045
Existing Estate - Will without Bypass Trust Existing Estate - Will with Bypass Trust
Estate Tax Due : $0 $0
Adjusted Gift Credit : $0 $0
Margaret's Assets : $904,670 $659,529
Marital Deduction : $1,375,049 $731,730
DSUEA Credit Used : ($0) ($0)
Total Estate Value : $2,180,001 $1,335,965
ByPass Trust : $0 $888,459
Life Insurance in Trust : $0 $0
Amount to Heirs : $2,180,001 $2,224,424
Additional Value to Heirs : $44,423
Other Life Insurance : $0 $0
Amount to Heirs
Total Estate Tax Due : $0 $0
Net Estate Value : $2,180,001 $1,335,965
Using What If Scenario 1 - Both Die at life expectancy - John Predeceases Margaret

Estate Analysis Results Flowchart
05/21/2013
Prepared for : John and Margaret Boomer Prepared by: Sample Advisor
Page 18 of 25
See Important Disclosure Information section in this Report for explanations of assumptions, limitations, methodologies, and a glossary.
John'sGross Estate
1st DeathTaxes and Expenses
Marital Deduction Bypass Trust
Margaret'sGross Estate
2nd DeathTaxes and Expenses
Other Life Insurance
Total Amount to Heirs
ILITPolicies Owned by Other
$1,385,049
$10,000
$1,375,049
$2,279,719
$0
$99,717
$0
$2,180,001 $0+ $0+
$2,180,001=
$0+
Transfer : $0
To Heirs : $0
Existing Estate without Bypass Trust using What If Scenario 1 - Both Die at life expectancy - John Predeceases Margaret
Notes
• Gross Estate amounts may include the value of reverted gifts. • Gross Estate amounts do not include the value of prior gifts.
• Other Life Insurance includes policies where the first person to die is the owner andinsured and the beneficiary of the policy is not the co-client or estate.
• The Bypass Trust may not be fully funded to the available estate exemption equivalentamount due to prior gifts, titling of assets, insufficient resources, and/or other bequests.
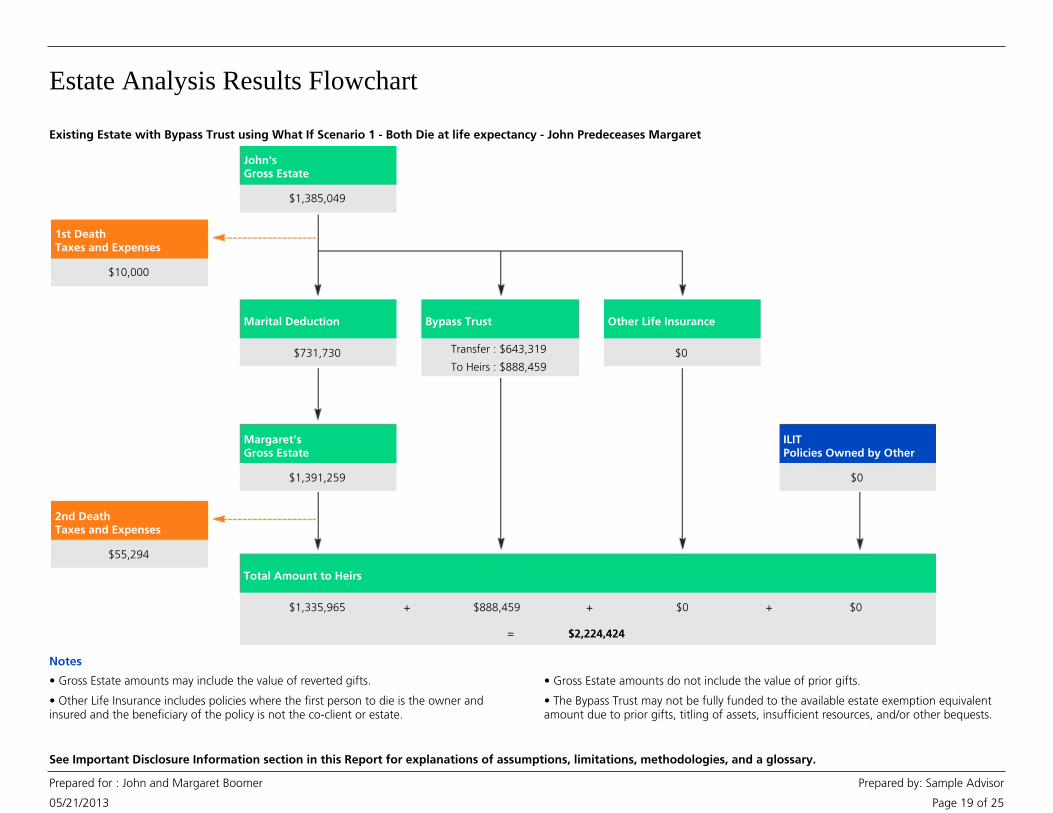
Estate Analysis Results Flowchart
05/21/2013
Prepared for : John and Margaret Boomer Prepared by: Sample Advisor
Page 19 of 25
See Important Disclosure Information section in this Report for explanations of assumptions, limitations, methodologies, and a glossary.
John'sGross Estate
1st DeathTaxes and Expenses
Marital Deduction Bypass Trust
Margaret'sGross Estate
2nd DeathTaxes and Expenses
Other Life Insurance
Total Amount to Heirs
ILITPolicies Owned by Other
$1,385,049
$10,000
$731,730
$1,391,259
$0
$55,294
$0
$1,335,965 $888,459+ $0+
$2,224,424=
$0+
Transfer : $643,319
To Heirs : $888,459
Existing Estate with Bypass Trust using What If Scenario 1 - Both Die at life expectancy - John Predeceases Margaret
Notes
• Gross Estate amounts may include the value of reverted gifts. • Gross Estate amounts do not include the value of prior gifts.
• Other Life Insurance includes policies where the first person to die is the owner andinsured and the beneficiary of the policy is not the co-client or estate.
• The Bypass Trust may not be fully funded to the available estate exemption equivalentamount due to prior gifts, titling of assets, insufficient resources, and/or other bequests.

Estate Analysis What If Results Combined Summary
05/21/2013
Prepared for : John and Margaret Boomer Prepared by: Sample Advisor
Page 20 of 25
See Important Disclosure Information section in this Report for explanations of assumptions, limitations, methodologies, and a glossary.
Federal Estate Tax** : $0 $0
Estate Expenses : $65,294 $56,075
Additional Value to Heirs : $392,529
Amount to Heirs and Charities
Net Estate Value : $1,335,965 $1,160,798
Bypass Trust : $888,459 $671,098
Life Insurance in Trust : $0 $0
Total : $2,224,424 $1,831,896
Cash Needed to Pay Tax and Expenses
Shortfall at First Death : $0 $0
Existing Estate Estate Scenario 1
Other Life Insurance : $0 $0
Total Estate : $2,289,719 $1,887,970
Amount to Heirs : $2,224,424 $1,831,896
Shortfall at Second Death : $0 $0
Bypass Trust Funding
Funding Shortfall : $12,646,681 $12,804,069
If you include in your Estate What-If scenario a change in ownership strategy where the insurance death benefit will not revert at death, theGross and Taxable Estate will not include the death benefits from life insurance policies that were transferred within three years of death -this option is for illustrative and comparison purposes only.
Using What If Scenario 1 - Both Die at life expectancy - John Predeceases Margaret

Estate Analysis What If Results Combined Summary
05/21/2013
Prepared for : John and Margaret Boomer Prepared by: Sample Advisor
Page 21 of 25
See Important Disclosure Information section in this Report for explanations of assumptions, limitations, methodologies, and a glossary.
Results for your Goal Plan include the Estate Strategies selected as shown below.
Estimated % of Goal Funded
Existing Estate Estate Scenario 1Goal
Estate Gifting N/A 100%
Retirement - Living Expense 100% 100%
Health Care 100% 100%
Travel 100% 100%
Wedding Gift 100% 100%
Anything Else 100% 100%
Leave Bequest 100% 100%
$459,046
$1,428,525
Current dollars :
Future dollars :
$329,947
$1,026,777
Safety Margin (Value at End of Plan)
Include IncludeStrategy Description
Bypass Trust
Estate GiftingFrom Both to Emily$10,000 in 2015Recurring every year for a total of 10times
Gift
• Prior gifts are not included in the amount to heirs.
Notes
** State Estate Taxes are not included. In some states, the tax may be substantial.
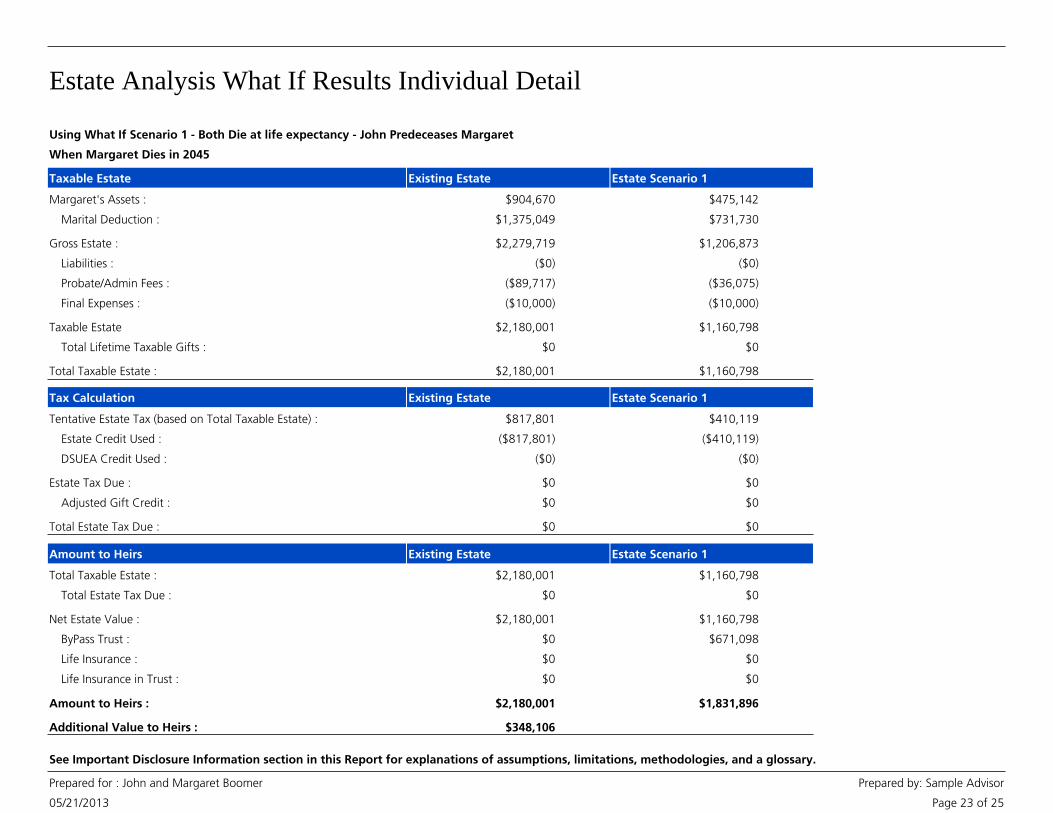
Using What If Scenario 1 - Both Die at life expectancy - John Predeceases Margaret

Estate Analysis What If Results Individual Detail
05/21/2013
Prepared for : John and Margaret Boomer Prepared by: Sample Advisor
Page 22 of 25
See Important Disclosure Information section in this Report for explanations of assumptions, limitations, methodologies, and a glossary.
Taxable Estate
Gross Estate : $1,385,049 $1,227,661
Probate/Admin Fees : ($0) ($0)
Final Expenses : ($10,000) ($10,000)
Marital Deduction : ($1,375,049) ($731,730)
Existing Estate Estate Scenario 1
Taxable Estate $0 $485,931
Total Lifetime Taxable Gifts : $0 $0
Total Taxable Estate : $0 $485,931
Tax Calculation
Tentative Estate Tax (based on Total Taxable Estate) : $0 $151,016
Estate Credit Used : ($0) ($151,016)
Total Estate Tax Due : $0 $0
Remaining Personal Exclusion (DSUEA) : $13,290,000 $12,804,069
Bypass Trust
Amount Transferred to Bypass Trust : $0 $485,931
Adjusted Gift Credit : $0 $0
Estate Tax Due : $0 $0
Maximum Personal Exclusion Amount : $13,290,000 $13,290,000
Personal Exclusion Amount Used : ($0) ($485,931)
When John Dies in 2040
Estate Scenario 1
Estate Scenario 1
Existing Estate
Existing Estate
Using What If Scenario 1 - Both Die at life expectancy - John Predeceases Margaret
Estate Analysis What If Results Individual Detail
05/21/2013
Prepared for : John and Margaret Boomer Prepared by: Sample Advisor
Page 23 of 25
See Important Disclosure Information section in this Report for explanations of assumptions, limitations, methodologies, and a glossary.
Taxable Estate
Gross Estate : $2,279,719 $1,206,873
Liabilities : ($0) ($0)
Probate/Admin Fees : ($89,717) ($36,075)
Final Expenses : ($10,000) ($10,000)
Existing Estate Estate Scenario 1
Taxable Estate $2,180,001 $1,160,798
Total Lifetime Taxable Gifts : $0 $0
Total Taxable Estate : $2,180,001 $1,160,798
Tax Calculation
Tentative Estate Tax (based on Total Taxable Estate) : $817,801 $410,119
Estate Credit Used : ($817,801) ($410,119)
Total Estate Tax Due : $0 $0
Adjusted Gift Credit : $0 $0
Estate Tax Due : $0 $0
Margaret's Assets : $904,670 $475,142
Marital Deduction : $1,375,049 $731,730
When Margaret Dies in 2045
Existing Estate Estate Scenario 1
DSUEA Credit Used : ($0) ($0)
Total Taxable Estate : $2,180,001 $1,160,798
ByPass Trust : $0 $671,098
Life Insurance in Trust : $0 $0
Amount to Heirs : $2,180,001 $1,831,896
Additional Value to Heirs :
Life Insurance : $0 $0
Amount to Heirs
Total Estate Tax Due : $0 $0
Net Estate Value : $2,180,001 $1,160,798
$348,106
Existing Estate Estate Scenario 1
Using What If Scenario 1 - Both Die at life expectancy - John Predeceases Margaret
Estate Analysis What If Results Flowchart
05/21/2013
Prepared for : John and Margaret Boomer Prepared by: Sample Advisor
Page 24 of 25
See Important Disclosure Information section in this Report for explanations of assumptions, limitations, methodologies, and a glossary.
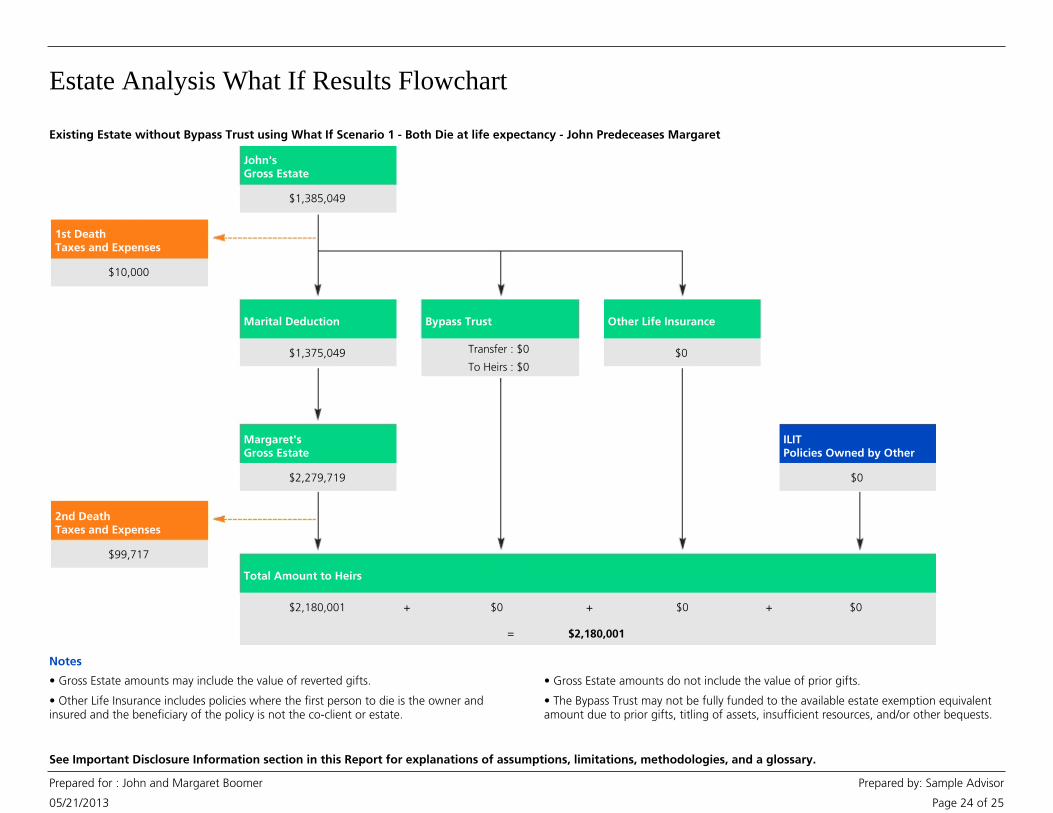
John'sGross Estate
1st DeathTaxes and Expenses
Marital Deduction Bypass Trust
Margaret'sGross Estate
2nd DeathTaxes and Expenses
Other Life Insurance
Total Amount to Heirs
ILITPolicies Owned by Other
$1,385,049
$10,000
$1,375,049
$2,279,719
$0
$99,717
$0
$2,180,001 $0+ $0+
$2,180,001=
$0+
Transfer : $0
To Heirs : $0
Existing Estate without Bypass Trust using What If Scenario 1 - Both Die at life expectancy - John Predeceases Margaret
Notes
• Gross Estate amounts may include the value of reverted gifts. • Gross Estate amounts do not include the value of prior gifts.
• Other Life Insurance includes policies where the first person to die is the owner andinsured and the beneficiary of the policy is not the co-client or estate.
• The Bypass Trust may not be fully funded to the available estate exemption equivalentamount due to prior gifts, titling of assets, insufficient resources, and/or other bequests.

Estate Analysis What If Results Flowchart
05/21/2013
Prepared for : John and Margaret Boomer Prepared by: Sample Advisor
Page 25 of 25
See Important Disclosure Information section in this Report for explanations of assumptions, limitations, methodologies, and a glossary.
John'sGross Estate
1st DeathTaxes and Expenses
Marital Deduction Bypass Trust
Margaret'sGross Estate
2nd DeathTaxes and Expenses
Other Life Insurance
Total Amount to Heirs
ILITPolicies Owned by Other
$1,227,661
$10,000
$731,730
$1,206,873
$0
$46,075
$0
$1,160,798 $671,098+ $0+
$1,831,896=
$0+
Transfer : $485,931
To Heirs : $671,098
Estate Scenario 1 using What If Scenario 1 - Both Die at life expectancy - John Predeceases Margaret
Notes
• Gross Estate amounts may include the value of reverted gifts. • Gross Estate amounts do not include the value of prior gifts.
• Other Life Insurance includes policies where the first person to die is the owner andinsured and the beneficiary of the policy is not the co-client or estate.
• The Bypass Trust may not be fully funded to the available estate exemption equivalentamount due to prior gifts, titling of assets, insufficient resources, and/or other bequests.