Embed Size (px)
Citation preview

Q2 2015 Investor Letter | April 2015
RWC Equity Income
For Professional Investors and Advisers Only
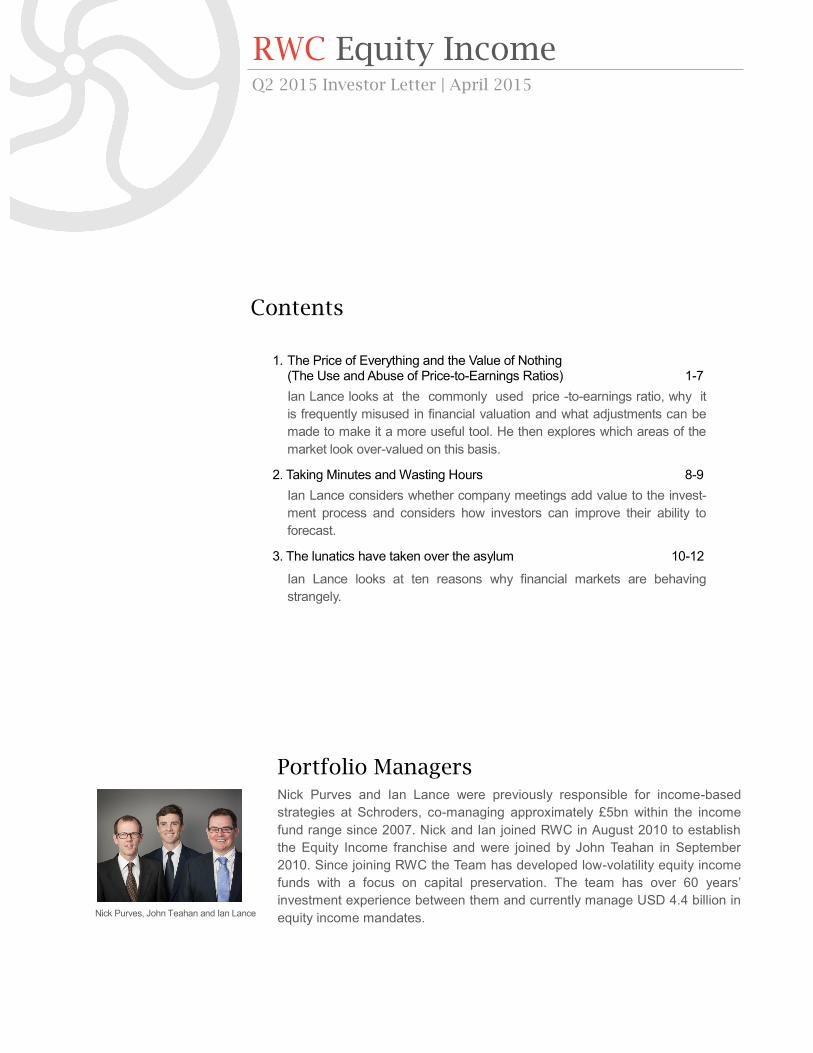
Portfolio Managers Nick Purves and Ian Lance were previously responsible for income-based
strategies at Schroders, co-managing approximately £5bn within the income
fund range since 2007. Nick and Ian joined RWC in August 2010 to establish
the Equity Income franchise and were joined by John Teahan in September
2010. Since joining RWC the Team has developed low-volatility equity income
funds with a focus on capital preservation. The team has over 60 years’
investment experience between them and currently manage USD 4.4 billion in
equity income mandates.
Contents
1. The Price of Everything and the Value of Nothing
(The Use and Abuse of Price-to-Earnings Ratios) 1-7
Ian Lance looks at the commonly used price -to-earnings ratio, why it
is frequently misused in financial valuation and what adjustments can be
made to make it a more useful tool. He then explores which areas of the
market look over-valued on this basis.
2. Taking Minutes and Wasting Hours 8-9
Ian Lance considers whether company meetings add value to the invest-
ment process and considers how investors can improve their ability to
forecast.
3. The lunatics have taken over the asylum 10-12
Ian Lance looks at ten reasons why financial markets are behaving
strangely.
Q2 2015 Investor Letter | April 2015
RWC Equity Income
Nick Purves, John Teahan and Ian Lance
RWC Q2 2015 Investor Letter | 1
RWC Equity Income
1. Asquith, Mikhail and Au ‘Information Content of Equity Analyst Reports’ Journal of Financial Economics February 2005
2. Modigliani and Miller ‘Dividend policy, growth and the valuation of shares’ 1961
The price-to-earnings (P/E) ratio remains the primary method
used to value stocks with a survey of sell side research
reports suggesting 99% of analysts used some sort of multiple
compared with less than 13% using any variation of a
discounted cash flow model.1 The appeal of P/E multiples is
that they are quick and easy to calculate and, at face value,
make it easy to compare the valuation of a stock to its history
as well as comparing one stock to another. Their ease of
calculation, however, means that they are frequently misused.
Sloppy use of P/E multiples is commonplace. Analysts will
most frequently relate a high P/E with high earnings growth
but not only does their poor ability to forecast invalidate this
but it also takes no account of whether that growth is value
creative or destructive. Most investors would agree with the
point of view that ‘the value of any asset is the present value
of its future cash flows’ and yet most investors will reject any
valuation model that projects and discounts future cash flows
as being ‘too complicated’ or ‘too sensitive’. Whilst it is true
that a discounted cash flow is sensitive to the inputs, at least
those inputs are explicit and can be sense checked and
debated whereas with a P/E multiple they are hidden away.
None of this is to say that P/E’s should not be used but just
that the user should be aware of the explicit assumptions that
he or she is making.
One way of separating out the implied assumptions in a
valuation multiple was originally put forward by Modigliani and
Miller who stated that the value of a company could be split
into two parts as follows.2
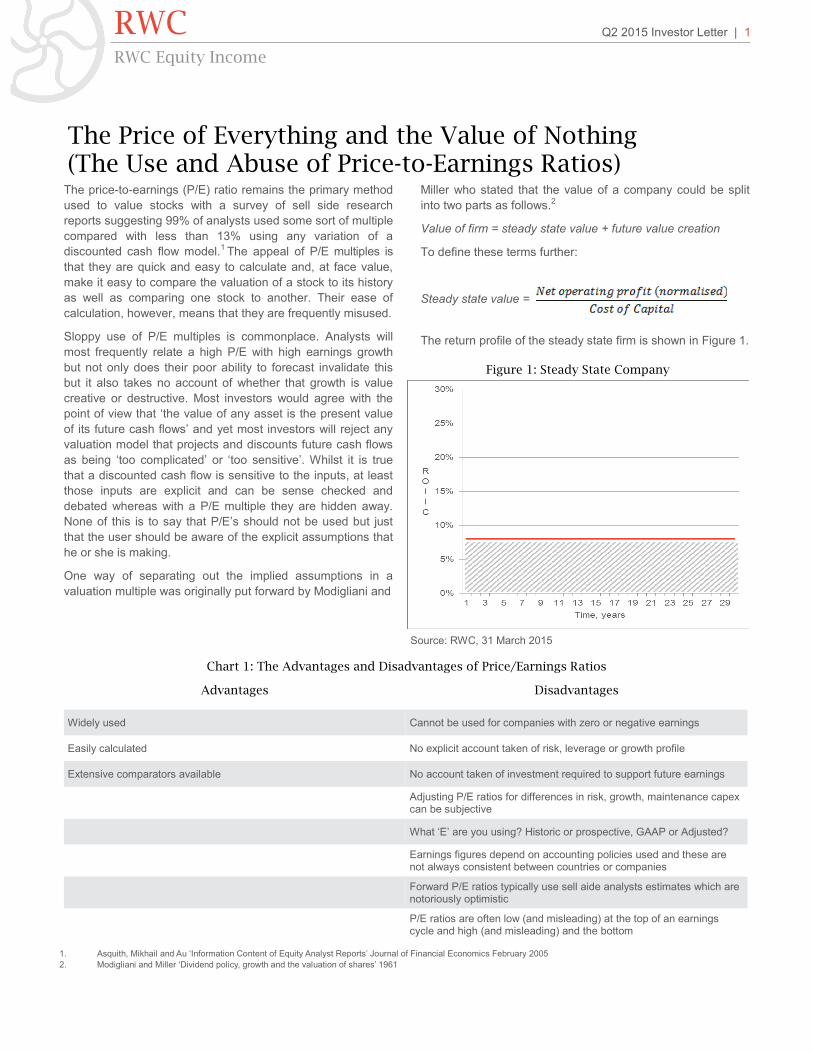
Value of firm = steady state value + future value creation
To define these terms further:
Steady state value =
The return profile of the steady state firm is shown in Figure 1.
The Price of Everything and the Value of Nothing (The Use and Abuse of Price-to-Earnings Ratios)
Advantages Disadvantages
Widely used Cannot be used for companies with zero or negative earnings
Easily calculated No explicit account taken of risk, leverage or growth profile
Extensive comparators available No account taken of investment required to support future earnings
Adjusting P/E ratios for differences in risk, growth, maintenance capex can be subjective
What ‘E’ are you using? Historic or prospective, GAAP or Adjusted?
Earnings figures depend on accounting policies used and these are not always consistent between countries or companies
Forward P/E ratios typically use sell aide analysts estimates which are notoriously optimistic
P/E ratios are often low (and misleading) at the top of an earnings cycle and high (and misleading) and the bottom
Figure 1: Steady State Company
Source: RWC, 31 March 2015
Chart 1: The Advantages and Disadvantages of Price/Earnings Ratios
The steady state value of the firm assumes that current net
operating profit (NOPAT) is sustainable indefinitely and that
incremental investments neither add nor subtract value.
Redefining these terms means that for a company that makes
a long run return on equity in line with its cost of equity, the
price to earnings multiple is calculated as follows:
Steady-state P/E =
So assuming a cost of equity of 8% a P/E for a company
making an 8% return on equity is 12.5x which is (1/0.08). By
just being aware of this value, an analyst can subtract it from
the current market value of a stock and see how much of the
value is associated with future value creation.3
Future value creation essentially comes down to how much
money a company invests, what spread over cost of capital it
makes and how long it can find these value creating
investments.
Future value creation =
For a firm where the return is above the cost of equity, the P/E
ratio is derived as follows:
P/E =
Where:
ROE= the long run return on incremental capital invested
COE= After tax cost of equity (assumed for the purpose of
this exercise to be 8%)
Ge= long run earnings growth rate
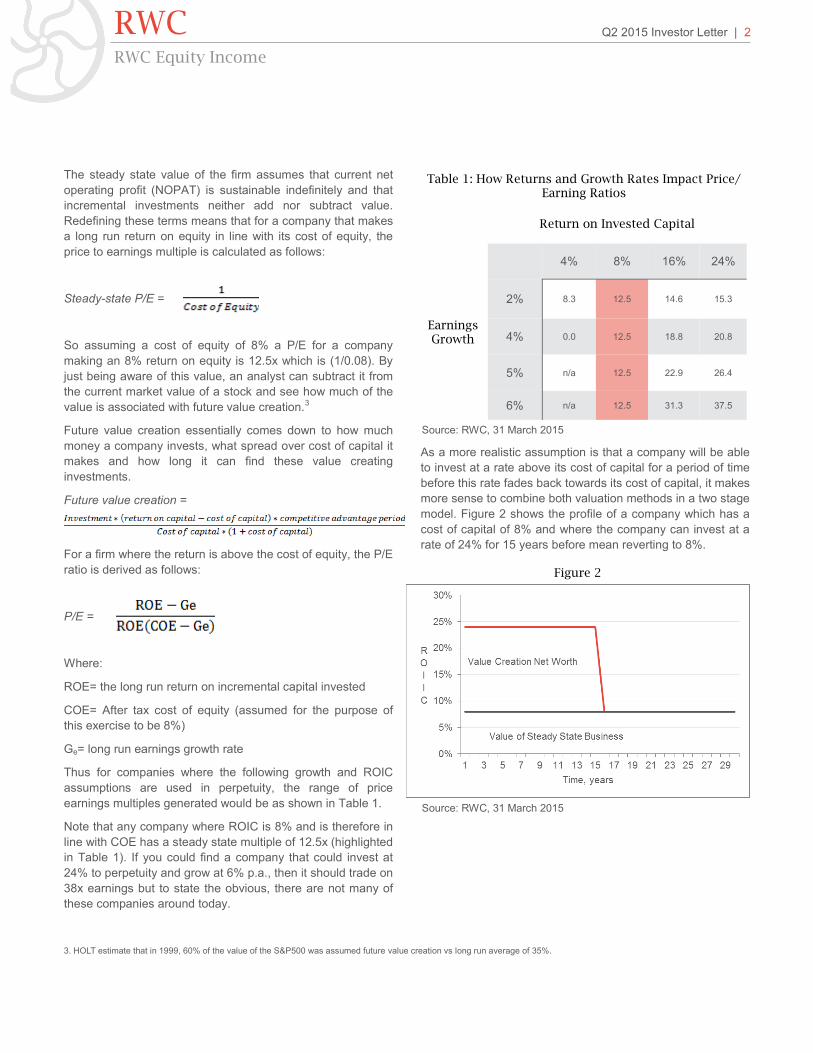
Thus for companies where the following growth and ROIC
assumptions are used in perpetuity, the range of price
earnings multiples generated would be as shown in Table 1.
Note that any company where ROIC is 8% and is therefore in
line with COE has a steady state multiple of 12.5x (highlighted
in Table 1). If you could find a company that could invest at
24% to perpetuity and grow at 6% p.a., then it should trade on
38x earnings but to state the obvious, there are not many of
these companies around today.
As a more realistic assumption is that a company will be able
to invest at a rate above its cost of capital for a period of time
before this rate fades back towards its cost of capital, it makes
more sense to combine both valuation methods in a two stage
model. Figure 2 shows the profile of a company which has a
cost of capital of 8% and where the company can invest at a
rate of 24% for 15 years before mean reverting to 8%.
RWC Q2 2015 Investor Letter | 2
RWC Equity Income
3. HOLT estimate that in 1999, 60% of the value of the S&P500 was assumed future value creation vs long run average of 35%.
Return on Invested Capital
Earnings Growth
4% 8% 16% 24%
2% 8.3 12.5 14.6 15.3
4% 0.0 12.5 18.8 20.8
5% n/a 12.5 22.9 26.4
6% n/a 12.5 31.3 37.5
Figure 2
Source: RWC, 31 March 2015
Source: RWC, 31 March 2015
Table 1: How Returns and Growth Rates Impact Price/Earning Ratios
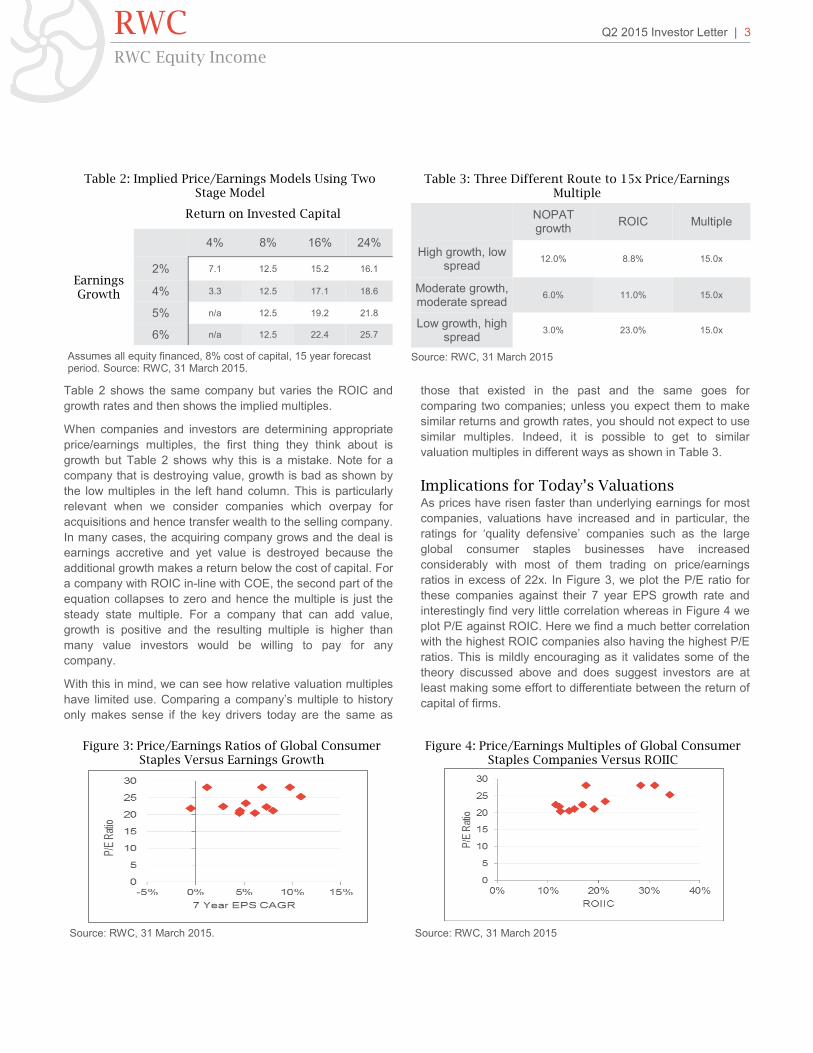
Table 2 shows the same company but varies the ROIC and
growth rates and then shows the implied multiples.
When companies and investors are determining appropriate
price/earnings multiples, the first thing they think about is
growth but Table 2 shows why this is a mistake. Note for a
company that is destroying value, growth is bad as shown by
the low multiples in the left hand column. This is particularly
relevant when we consider companies which overpay for
acquisitions and hence transfer wealth to the selling company.
In many cases, the acquiring company grows and the deal is
earnings accretive and yet value is destroyed because the
additional growth makes a return below the cost of capital. For
a company with ROIC in-line with COE, the second part of the
equation collapses to zero and hence the multiple is just the
steady state multiple. For a company that can add value,
growth is positive and the resulting multiple is higher than
many value investors would be willing to pay for any
company.
With this in mind, we can see how relative valuation multiples
have limited use. Comparing a company’s multiple to history
only makes sense if the key drivers today are the same as
those that existed in the past and the same goes for
comparing two companies; unless you expect them to make
similar returns and growth rates, you should not expect to use
similar multiples. Indeed, it is possible to get to similar
valuation multiples in different ways as shown in Table 3.
Implications for Today’s Valuations As prices have risen faster than underlying earnings for most
companies, valuations have increased and in particular, the
ratings for ‘quality defensive’ companies such as the large
global consumer staples businesses have increased
considerably with most of them trading on price/earnings
ratios in excess of 22x. In Figure 3, we plot the P/E ratio for
these companies against their 7 year EPS growth rate and
interestingly find very little correlation whereas in Figure 4 we
plot P/E against ROIC. Here we find a much better correlation
with the highest ROIC companies also having the highest P/E
ratios. This is mildly encouraging as it validates some of the
theory discussed above and does suggest investors are at
least making some effort to differentiate between the return of
capital of firms.
RWC Q2 2015 Investor Letter | 3
RWC Equity Income
Return on Invested Capital
Earnings Growth
4% 8% 16% 24%
2% 7.1 12.5 15.2 16.1
4% 3.3 12.5 17.1 18.6
5% n/a 12.5 19.2 21.8
6% n/a 12.5 22.4 25.7
Assumes all equity financed, 8% cost of capital, 15 year forecast period. Source: RWC, 31 March 2015.
NOPAT growth
ROIC Multiple
High growth, low spread
12.0% 8.8% 15.0x
Moderate growth, moderate spread
6.0% 11.0% 15.0x
Low growth, high spread
3.0% 23.0% 15.0x
Table 3: Three Different Route to 15x Price/Earnings Multiple
Figure 4: Price/Earnings Multiples of Global Consumer Staples Companies Versus ROIIC
Source: RWC, 31 March 2015. Source: RWC, 31 March 2015
Source: RWC, 31 March 2015
Table 2: Implied Price/Earnings Models Using Two Stage Model
Figure 3: Price/Earnings Ratios of Global Consumer Staples Versus Earnings Growth
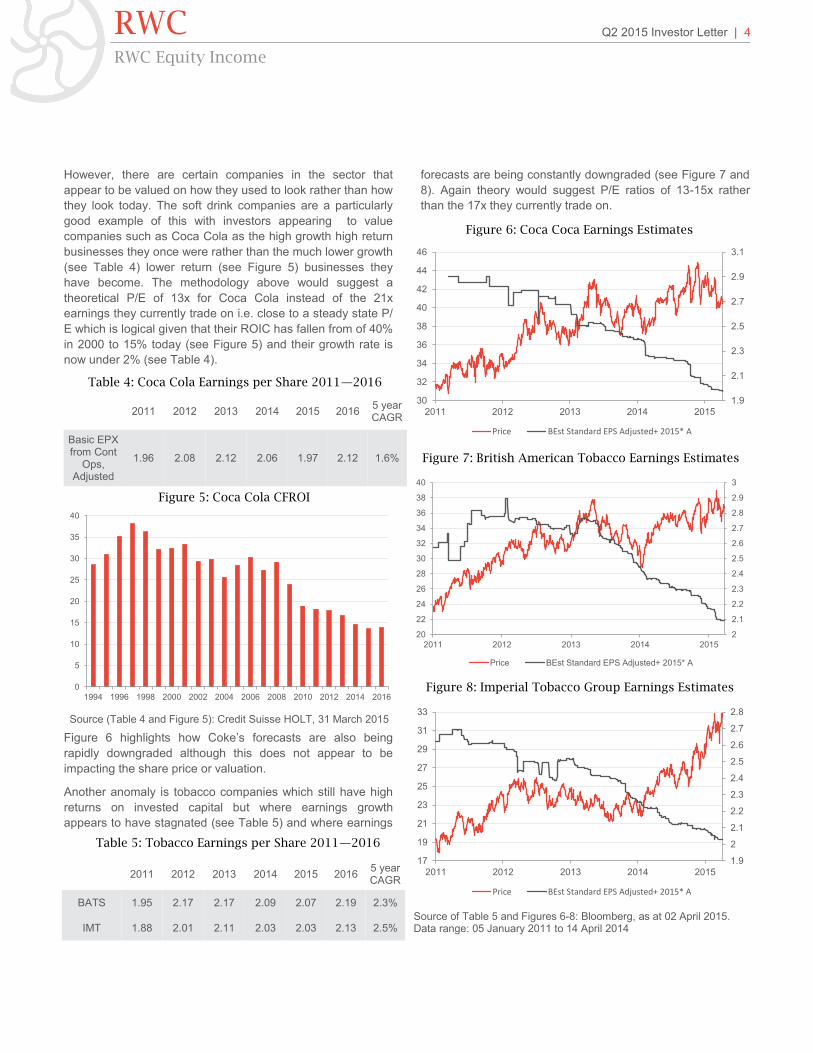
However, there are certain companies in the sector that
appear to be valued on how they used to look rather than how
they look today. The soft drink companies are a particularly
good example of this with investors appearing to value
companies such as Coca Cola as the high growth high return
businesses they once were rather than the much lower growth
(see Table 4) lower return (see Figure 5) businesses they
have become. The methodology above would suggest a
theoretical P/E of 13x for Coca Cola instead of the 21x
earnings they currently trade on i.e. close to a steady state P/
E which is logical given that their ROIC has fallen from of 40%
in 2000 to 15% today (see Figure 5) and their growth rate is
now under 2% (see Table 4).
Figure 6 highlights how Coke’s forecasts are also being
rapidly downgraded although this does not appear to be
impacting the share price or valuation.
Another anomaly is tobacco companies which still have high
returns on invested capital but where earnings growth
appears to have stagnated (see Table 5) and where earnings
forecasts are being constantly downgraded (see Figure 7 and
8). Again theory would suggest P/E ratios of 13-15x rather
than the 17x they currently trade on.
RWC Q2 2015 Investor Letter | 4
RWC Equity Income
2011 2012 2013 2014 2015 5 year CAGR
2016
Basic EPX from Cont
Ops, Adjusted
1.96 2.08 2.12 2.06 1.97 1.6% 2.12
Table 4: Coca Cola Earnings per Share 2011—2016
Figure 5: Coca Cola CFROI
Figure 6: Coca Coca Earnings Estimates
Figure 7: British American Tobacco Earnings Estimates
Figure 8: Imperial Tobacco Group Earnings Estimates
2011 2012 2013 2014 2015 5 year CAGR
2016
BATS 1.95 2.17 2.17 2.09 2.07 2.3% 2.19
IMT 1.88 2.01 2.11 2.03 2.03 2.13 2.5%
Table 5: Tobacco Earnings per Share 2011—2016
Source (Table 4 and Figure 5): Credit Suisse HOLT, 31 March 2015
Source of Table 5 and Figures 6-8: Bloomberg, as at 02 April 2015. Data range: 05 January 2011 to 14 April 2014
2
2.1
2.2
2.3
2.4
2.5
2.6
2.7
2.8
2.9
3
20
22
24
26
28
30
32
34
36
38
40
2011 2012 2013 2014 2015
Price BEst Standard EPS Adjusted+ 2015* A
1.9
2.1
2.3
2.5
2.7
2.9
3.1
30
32
34
36
38
40
42
44
46
2011 2012 2013 2014 2015
Price BEst Standard EPS Adjusted+ 2015* A
1.9
2
2.1
2.2
2.3
2.4
2.5
2.6
2.7
2.8
17
19
21
23
25
27
29
31
33
2011 2012 2013 2014 2015
Price BEst Standard EPS Adjusted+ 2015* A
0
5
10
15
20
25
30
35
40
1994 1996 1998 2000 2002 2004 2006 2008 2010 2012 2014 2016

RWC Q2 2015 Investor Letter | 5
RWC Equity Income
4. Robert.J. Shiller “Price-Earnings Ratios as Forecasters of Returns: 21 July 1996
5. Berkshire Hathaway 2014 Letter to Shareholders
6. http://uk.businessinsider.com/warren-buffett-gordon-gekko-comparison-2015-3?r=US#ixzz3W9v7oWiF, 27 March 2015
Conclusion The price/earnings ratio is a convention that emerged mostly
as a result of ‘tradition and convenience rather than logic’
according to Robert Shiller.4 We have highlighted, however,
that as long as the user is explicit in the assumptions he is
making, they do have some practical use. In addition we can
make the following comments:
1. Multiples are not valuation; they are a shorthand for
the process of valuation and this applies to all
multiples, not just price-earnings;
2. If you want to consider the effect of leverage, use an
enterprise multiple, if you want to adjust for cyclicality,
use normalised forecasts;
3. In assessing capital allocation, consider incremental
return on capital first and growth second. Growth at
below cost of capital has zero or negative value;
4. Don’t use the recent past to understand the future
unless it is likely to be very similar;
5. In common with many companies, the ROIIC and
earnings growth of global consumers staples has been
declining and yet their Price/earnings ratios have been
expanding leaving them trading on valuations that are
not justified by their underlying fundamentals. This is,
of course, symptomatic of a market being driven by
central banking largesse rather than fundamentals.
Addendum—the ‘alternative’ view from
private equity
No sooner had I finished writing this note, then Heinz
launched a takeover bid for Kraft, which was a share that, in
common with other consumer staples names, already looked
very over-valued at nearly 20x 2015 EPS for a company with
virtually no growth. Heinz clearly disagree as they and their
private equity backers 3G have come in with an offer roughly
30% above the market price. We thought it might be
interesting to look at the numbers involved in these two deals
(the 2013 takeover of Heinz and the subsequent takeover of
Kraft) to see how private equity gets them to work employing
the standard buyout techniques.
Deal 1:
Berkshire Hathaway and 3G bought Heinz for $23bn in March
2013 which looked like a pretty full price at 14x EV/EBITDA
multiple which was a 40% premium above the decade
average sector multiple. However, in our new normal ZIRP
world, any multiple can be made to work by employing the
following three steps; leverage, restructure, rerate and flip.
1. Leverage
Buffett and 3G loaded Heinz with $12bn of new debt taking
net debt to EBITDA up to 6.3x. In addition to this, Buffett
issued $8bn preferred stock with a 9% dividend which meant
the debt load was significant enough for Fitch to immediately
downgrade Heinz from investment grade to junk bond status.
Including the preference shares as debt the net debt to
EBITDA ratio was 10x.
2. Restructure
3G have raised margins by a whopping 800bps in two years
by firing a fifth of the workers, cutting advertising spend from
the standard 8% of sales to 4%. This has taken EBITDA
margins to 28% which is way higher than the global sector
average of 20% despite the fact that Heinz is smaller than
many of the global players such as Nestle and Unilever. In
addition, it assumes that hollowing out the company in this
way can be achieved without damaging the fabric of the
business or its growth potential. In the short term, however, it
is great news for shareholders (Buffett and 3G) although not
so great for other stakeholders such as employees, suppliers
and the wider economy. One does have to wonder when
Buffett claims ‘Americas best days are ahead’,5 how he
thinks loading companies with debt, firing their employees and
avoiding tax helps the wider economy. As Deutsche Bank
recently pointed out in a note to clients ‘how would this
"merger" have been reported if you swapped the popular,
cuddly Warren Buffet with Gordon Gekko?’6
3. Rerate
Rerate and then flip back on to the stock market at a higher
price (often back to the same investors you bought it from in
the first place) or use that expensive currency to buy
something else (see page 6).
Deal 2: Heinz (3G + Buffett) bid for Kraft
Before we jump into the detail first a little bit of context. Kraft,
is a low-growth business that sells Jell-O, Lunchables,
Maxwell House and Kool-aid (which is ironic as this has been
the drink of choice for many investors in the past decade)
amongst other brands; 2014 sales of $18.2bn were only just
above $17.8bn recorded in 2010 and operating income of
$3bn was the same as recorded in 2010. However, for Wall
Street, Kraft is the gift that keeps on giving – some investment
bankers must have been able to put their kids through college
on the generous fees that Kraft keeps dolling out. The
business was formerly owned by the tobacco company Philip
Morris but was IPO’d in 2001. In 2010 the next investment
banking payday came for advising on the $18.5bn takeover of
Cadbury and then yet more fees for spinning it out of parent
company Mondelez in 2012. But the financial engineering did
not stop there. At that point it gifted a $7.2bn goodbye
dividend to its parent followed by three years of dividends and
share re-purchases which combined amounted to $10bn. Now
given that Kraft’s free cash flow from operations only
amounted to $3bn over the period, the rest had to be
borrowed albeit at an ultra-low interest rate of 3%.
Enter Heinz who according to the terms of the deal, are
offering Kraft shareholders a 49% stake in the new combined
entity plus a special cash dividend of $16.50 per share (which
3G and Buffett are generously funding via a $10 billion
injection in to the new company). The remaining 51% share
would go to the existing Heinz shareholders – (Berkshire
Hathaway and 3G Capital) that jointly own Heinz. So despite
the fact that Kraft has nearly twice the revenues of Heinz and
a greater profit, the private equity guys are using their fancy
rating to get half the business. The company estimate cost
savings of $1.5bn although the ever optimistic street analysts
have plugged $2.2bn in to their models already. As Heinz gets
half of Kraft we know that Heinz is now implicitly being valued
at $45bn or 16 times 2014 EBITDA.
This is, of course, the new normal at work. $4 trillion of
quantitative easing has not brought about a sustainable
recovery and hence companies increasingly have to rely on
financial engineering to generate growth. Fed policies have,
however, made this financing cheaper than ever and the
guarantees that rates will stay low forever encourage
investors to lever up. Earnings growth is also boosted by firing
employees so the net effect of the Feds policies is that Wall
Street ends up better off whilst Main Street is worse off. I still
don’t fully understand why Main Street has been so tolerant
about this treatment.
RWC Q2 2015 Investor Letter | 6
RWC Equity Income
“Meetings are indispensable when you don't want to do
anything.”
― John Kenneth Galbraith
“If you had to identify, in one word, the reason why the human
race has not achieved, and never will achieve, its full
potential, that word would be 'meetings’.”
― Dave Barry8
One of the questions that we have been asked the most since
we joined RWC is ‘Don’t you miss all those company
meetings – how do you cope without them?’
And the honest answer is ‘no we don’t miss them’. In fact, we
now look back and realise how much time fund managers
waste in company meetings which begs the obvious question,
‘Why do fund managers spend so much time in meetings?’
One reason is that it helps to pass the time because as the
late economist and Nobel Prize Winner Paul Samuelson
implied, investing should be unutterably boring.
“Investing should be more like watching paint dry or watching
grass grow. If you want excitement, take $800 and go to Las
Vegas.”
Whilst some fund managers try to liven up their day by
constantly trading in and out of shares on their clients’ behalf,
another way to while away the hours is to attend lots of
company meetings. Company meetings are also a good
marketing ploy; large asset managers with 100+ global
analysts can boast of x thousand company meetings they
have every year thus suggesting they have some sort of
informational advantage over their smaller competitors
although they seem to confuse more information with better
information. At this point, it’s worth recalling the 1973 study by
Paul Slovic in which bookmakers were asked to forecast the
results of horse races and were given relevant pieces of
information in increments of 5, 10, 20, 40 i.e. each time they
ranked the horses, they were given more information and
asked to re-rank them. The study showed that the addition of
information beyond five pieces did not increase the accuracy
of their forecasts although it did increase their confidence.
This logic can be applied to company meetings – the addition
of lots of pieces of spurious information does not increase a
fund managers ability to pick stocks but it probably increases
his confidence as he feels that he ‘knows his company well’.
For others, company meetings go hand in hand with
namedropping company CEOs and creates the impression
that this gives them an advantage. Anecdotally, one well
known fund manager used to stand at the front of packed
meeting rooms of clients/prospects, waving his mobile phone
around whilst claiming that he had the mobile number of the
CEO of every company that he invested in. Apparently this
was meant to impress his audience.
Now there are times when a meeting is important, usually
during some sort of crisis that the company is facing or when
an impending acquisition is being discussed, but in general
their usefulness is massively over stated by the industry. Here
are six reasons why we believe they are given way too much
importance by the fund managers in general.
1. Assuming fund managers attend company meetings
looking for an informational advantage over their rivals, there
is one quite obvious hurdle to that strategy; companies cannot
tell you anything that is not already publicly disclosed
otherwise it is known as inside information and if you act on it
and get caught you can end up in jail.
2. Corporate management suffer from cognitive dissonance
as much as the rest of us and are likely to be either
consciously or sub consciously over optimistic about their
company’s fortunes and over-confident about their ability to
predict the future. The IR of a telecoms company once
assured us the dividend was totally safe a few months before
the company passed it completely and had a rescue rights
issue. I don’t think he was being deliberately misleading (at
least I hope not) but I just think he had seriously
underestimated how difficult their markets had become.
3. Sometimes managers will go out of their way to put a
positive spin on their company. One of the latest innovations
in the world of financial spin is the ‘Capital Markets Day’ which
is now known on our desk as a ‘Bull Up your Share Price
Day’. At these events, sell side analysts who are desperate
for bullish news in order to pump share prices higher are fed a
stream of positive news from company management and then
obligingly go away and write bullish investment reports. These
are usually published the following day and will invariably
drive the company’s share price higher (although this process
is now so tried and tested that the share price now starts to
move in advance of the Capital Markets Day).
4. Fund managers suffer from confirmatory bias; they will go
in to a meeting with a company they own and are positive
about and ask questions that confirm their positive outlook
rather than ask questions to test their belief. I once tried to
chair a meeting with the CEO of a large telecoms company on
one side of the table and twelve fund managers on the other,
each of whom owned the stock, was positive about it and had
one burning question to get across. To say that the meeting
was rambling, disjointed and ultimately fruitless is an
understatement.
5. Companies tell you what you want to hear and these days
are very good at it. The CEO of one large technology
RWC Q2 2015 Investor Letter | 7
RWC Equity Income
7. Taken from the title of a play by Damian Trasler
8. Dave Barry is a Pulitzer Prize-winning American author and columnist
Taking Minutes and Wasting Hours7
company knew investors were concerned about him making a
large acquisition and sought to assure them by saying that he
would ‘not make an acquisition that would make them lose
sleep at night’ before promptly making a $12bn deal at an
80% premium to the market price which wiped this amount
and more off the value of his own shareholders company.
6. The final and most important reason is that company
meetings tend to result in a wood from the trees problem
which we originally discussed in 2012 and re-visit below.
Consider the following statement, taken from Rick
Bookstaber’s “Why are We “Irrational”: The Path from
Neoclassical to Behavioural Economics 2.0.
“Linda is 31, single, outspoken and very bright. She majored
in philosophy. As a student she was deeply concerned with
issues surrounding equality and discrimination.
Is it more likely that Linda is a) a bank clerk or b) a bank clerk
and active in the feminist movement?”9
Most people choose answer b) because they focus on the
information provided about Linda’s past and use it to paint a
picture of her. This is, however, irrational as group b) is a sub
set of group a) i.e. there are more bank tellers in the US than
bank tellers who are active in the feminist movement.
Probability therefore favours answer a). In the same way, fund
managers use company meetings to drill down into the
minutest detail (the tax rate on the new Taiwanese subsidiary,
the CEO’s choice of bow tie) which is invariably less relevant
than bigger issues.
Is it possible for investors to shut out the entertaining but
misleading noise and hence improve the accuracy of the
forecasts that they make? According to American
psychologists Daniel Kahneman and Amos Tversky, there is
one way in which all forecasters could improve and that is to
distinguish between the two types of information available to
them: singular (or case) data and distributional (or base)
data10. Singular data consists of evidence about a particular
case under consideration so if you were analysing the spirits
company Diageo, this might involve making forecasts about
Chinese demographics and income distribution, propensity to
spend on branded spirits etc. Distributional data, on the other
hand, consists of knowledge about the distribution of
outcomes in similar situations. In this sense, a forecaster may
look at the financial performance of all large companies, for
example, to see what lessons he might draw from their
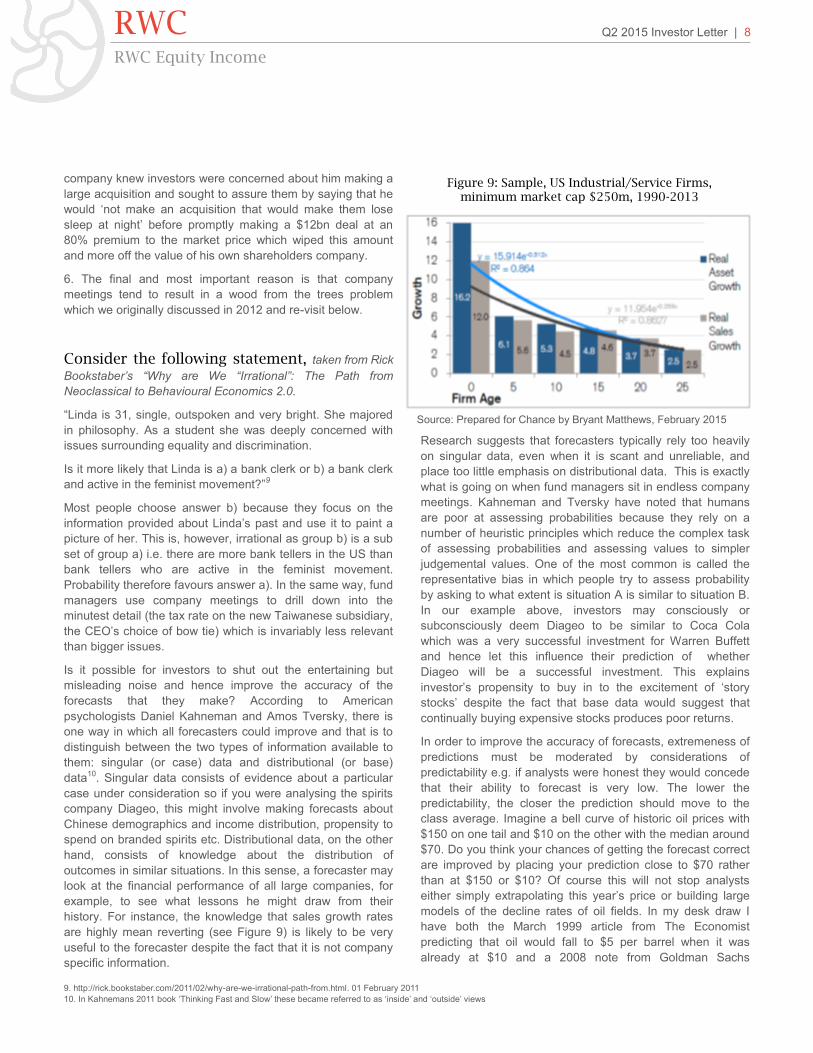
history. For instance, the knowledge that sales growth rates
are highly mean reverting (see Figure 9) is likely to be very
useful to the forecaster despite the fact that it is not company
specific information.
Research suggests that forecasters typically rely too heavily
on singular data, even when it is scant and unreliable, and
place too little emphasis on distributional data. This is exactly
what is going on when fund managers sit in endless company
meetings. Kahneman and Tversky have noted that humans
are poor at assessing probabilities because they rely on a
number of heuristic principles which reduce the complex task
of assessing probabilities and assessing values to simpler
judgemental values. One of the most common is called the
representative bias in which people try to assess probability
by asking to what extent is situation A is similar to situation B.
In our example above, investors may consciously or
subconsciously deem Diageo to be similar to Coca Cola
which was a very successful investment for Warren Buffett
and hence let this influence their prediction of whether
Diageo will be a successful investment. This explains
investor’s propensity to buy in to the excitement of ‘story
stocks’ despite the fact that base data would suggest that
continually buying expensive stocks produces poor returns.
In order to improve the accuracy of forecasts, extremeness of
predictions must be moderated by considerations of
predictability e.g. if analysts were honest they would concede
that their ability to forecast is very low. The lower the
predictability, the closer the prediction should move to the
class average. Imagine a bell curve of historic oil prices with
$150 on one tail and $10 on the other with the median around
$70. Do you think your chances of getting the forecast correct
are improved by placing your prediction close to $70 rather
than at $150 or $10? Of course this will not stop analysts
either simply extrapolating this year’s price or building large
models of the decline rates of oil fields. In my desk draw I
have both the March 1999 article from The Economist
predicting that oil would fall to $5 per barrel when it was
already at $10 and a 2008 note from Goldman Sachs
RWC Q2 2015 Investor Letter | 8
RWC Equity Income
9. http://rick.bookstaber.com/2011/02/why-are-we-irrational-path-from.html. 01 February 2011
10. In Kahnemans 2011 book ‘Thinking Fast and Slow’ these became referred to as ‘inside’ and ‘outside’ views
Figure 9: Sample, US Industrial/Service Firms, minimum market cap $250m, 1990-2013
Source: Prepared for Chance by Bryant Matthews, February 2015
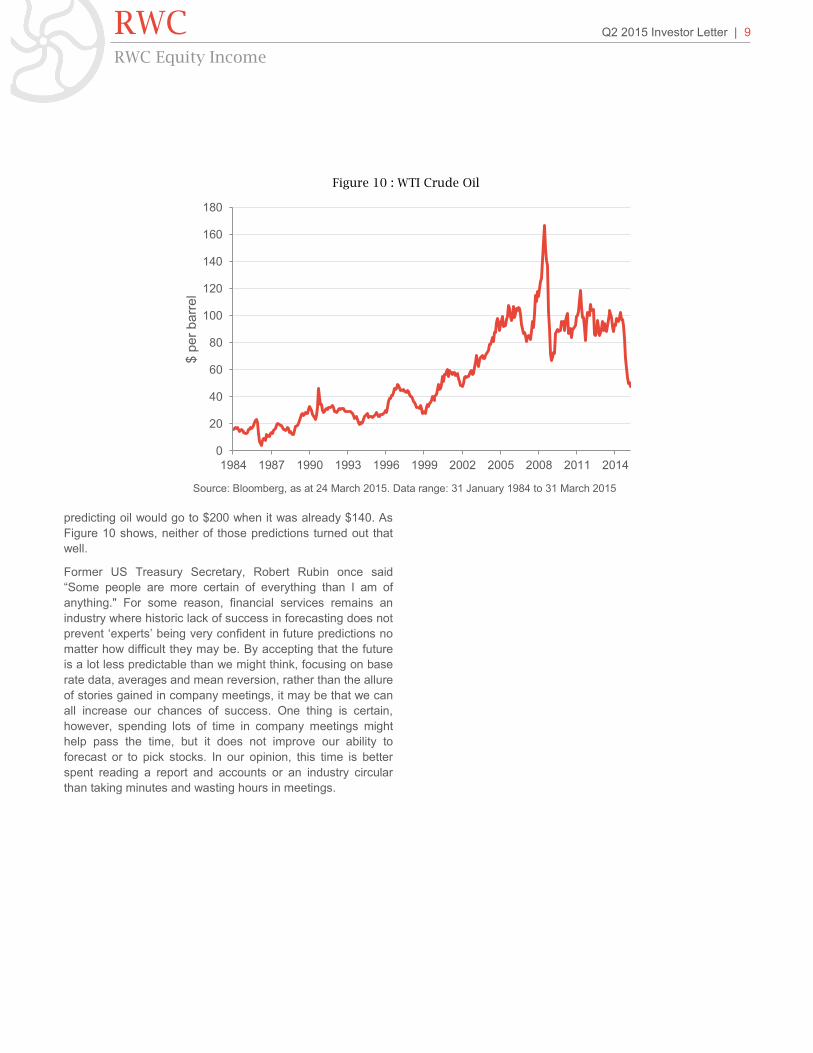
predicting oil would go to $200 when it was already $140. As
Figure 10 shows, neither of those predictions turned out that
well.
Former US Treasury Secretary, Robert Rubin once said
“Some people are more certain of everything than I am of
anything." For some reason, financial services remains an
industry where historic lack of success in forecasting does not
prevent ‘experts’ being very confident in future predictions no
matter how difficult they may be. By accepting that the future
is a lot less predictable than we might think, focusing on base
rate data, averages and mean reversion, rather than the allure
of stories gained in company meetings, it may be that we can
all increase our chances of success. One thing is certain,
however, spending lots of time in company meetings might
help pass the time, but it does not improve our ability to
forecast or to pick stocks. In our opinion, this time is better
spent reading a report and accounts or an industry circular
than taking minutes and wasting hours in meetings.
RWC Q2 2015 Investor Letter | 9
RWC Equity Income
Figure 10 : WTI Crude Oil
Source: Bloomberg, as at 24 March 2015. Data range: 31 January 1984 to 31 March 2015
0
20
40
60
80
100
120
140
160
180
1984 1987 1990 1993 1996 1999 2002 2005 2008 2011 2014
$ p
er
barr
el

What is going on in financial markets strikes us as more
bizarre than anything we have ever experienced in our life
time and yet it has been going on for so long it has now
become accepted as the norm and as such never really
attracts any comment. Of course, all this craziness can be
traced back to the same source; bubble loving central banks
who believe the way to cure too little aggregate demand is to
send prices of all financial assets to the moon. Below we
highlight ten things that suggest the lunatics really have taken
over the asylum.
1. $3.6 trillion of government debt or in other words nearly a
fifth of all global government debt is now trading with a
negative yield and yet a few weeks ago EPFR data showed
inflows to all fixed income funds of $16.04 billion – the highest
on record going back to at least 2008. This is despite
repeated warnings from regulators about the lack of liquidity in
bond markets and the fact that the actions of the ECB are
making liquidity even worse.
2. €2.0 trillion of Euro area government bonds over one year
maturity have negative yields and yet Mario Draghi thinks if he
can just get interest rates down a bit further he can turn the
European economy around. The reality is that the ECB is
playing the role of ‘the greater fool’ providing an exit to those
hedge funds and prop desks who have bought bonds with a
negative yield to maturity i.e. anyone buying bonds with a
guaranteed loss to maturity can only be doing so in the belief
some ‘greater fool’ will buy them at a higher price (a greater
loss to maturity). At the first sign that the ECB is going to
taper its purchases, this money will stampede for the exit at
the same time with some ‘interesting’ results.
3. Japan are now printing money to buy equities (that is worth
repeating-printing money to buy equities – FA Hayek must
be spinning in his grave). According to The Wall Street
Journal ‘The Bank of Japan’s aggressive purchasing of stock
funds has helped Japanese shares climb to multiyear highs in
recent months. But some within the central bank are growing
uncomfortable about the fast-paced rally and the bank’s
own role in fuelling it.’
Since Gov. Haruhiko Kuroda took office in March 2013
and introduced monetary easing of what he called a
“different dimension,” the central bank has sharply
increased its buying of baskets of stocks known as
exchange-traded funds. By directly underpinning the
market, officials have tried to encourage private investors to
follow suit and put more money in stocks in the hope of
stimulating the economy and increasing inflation.
During the past two years, the central bank entered the
stock market roughly once every three days, picking up a
total of ¥2.8 trillion ($23 billion) of ETFs that track Japan’s
major stock indexes, according to Bank of Japan records.
That distinguishes it from the U.S. Federal Reserve and
European Central Bank, both of which have bought bonds to
pump up the economy but haven’t directly bought stocks.’
4. The fact that the S&P500 is close to its all-time high would
tell you the US economy is firing on all cylinders and yet the
Federal Reserve seems frightened to remove emergency
monetary policy seven years in to the recovery. Janet Yellen
removed ‘patient’ from the Federal Reserve’s statement but
promptly rushed to assure financial markets that this didn’t
mean she was ‘impatient’ to raise rates. As has been the case
with every announcement from Chairman Yellen since she
took over, the market was immediately sent in to raptures.
5. In 2007, global debt of $142 trillion was enough to nearly
blow the financial system to smithereens but seven years later
global debt stands at $199 trillion and nobody seems to
believe this is an issue.
6. In 2009, General Motors emerged from government backed
Chapter 11 with a final cost of the GM bailout to the U.S.
taxpayers of $12 billion. A group of hedge funds have recently
taken a stake in the company and have come up with the
brilliant idea of GM gearing itself up again. The company has
instantly capitulated and announced it is authorizing an
immediate $5 billion stock buyback, and plans to return all
cash above a $20 billion floor to shareholders. Another victory
for ‘activist shareholders’! Some companies that have been
leveraging up their balance sheets for a while, have now hit
the point where anymore debt will result in them being
downgraded to junk status. Viacom announced on 6th April
RWC Q2 2015 Investor Letter | 10
RWC Equity Income
10. Golding, Lynval/Hall, Terry/Staples, Neville Egunton Universal Music Publishing Group
The lunatics have taken over the asylum10
2015 it would have to cease its share buyback in order to stay
within its ‘target leverage ratio’.
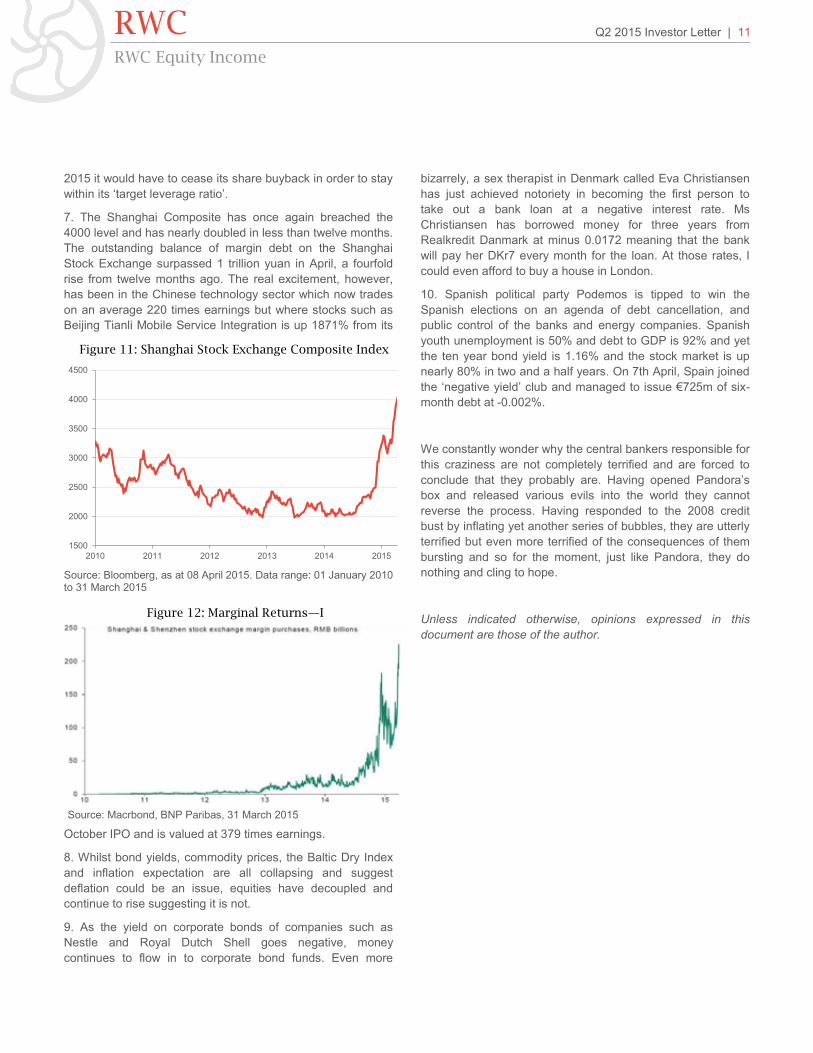
7. The Shanghai Composite has once again breached the
4000 level and has nearly doubled in less than twelve months.
The outstanding balance of margin debt on the Shanghai
Stock Exchange surpassed 1 trillion yuan in April, a fourfold
rise from twelve months ago. The real excitement, however,
has been in the Chinese technology sector which now trades
on an average 220 times earnings but where stocks such as
Beijing Tianli Mobile Service Integration is up 1871% from its
October IPO and is valued at 379 times earnings.
8. Whilst bond yields, commodity prices, the Baltic Dry Index
and inflation expectation are all collapsing and suggest
deflation could be an issue, equities have decoupled and
continue to rise suggesting it is not.
9. As the yield on corporate bonds of companies such as
Nestle and Royal Dutch Shell goes negative, money
continues to flow in to corporate bond funds. Even more
bizarrely, a sex therapist in Denmark called Eva Christiansen
has just achieved notoriety in becoming the first person to
take out a bank loan at a negative interest rate. Ms
Christiansen has borrowed money for three years from
Realkredit Danmark at minus 0.0172 meaning that the bank
will pay her DKr7 every month for the loan. At those rates, I
could even afford to buy a house in London.
10. Spanish political party Podemos is tipped to win the
Spanish elections on an agenda of debt cancellation, and
public control of the banks and energy companies. Spanish
youth unemployment is 50% and debt to GDP is 92% and yet
the ten year bond yield is 1.16% and the stock market is up
nearly 80% in two and a half years. On 7th April, Spain joined
the ‘negative yield’ club and managed to issue €725m of six-
month debt at -0.002%.
We constantly wonder why the central bankers responsible for
this craziness are not completely terrified and are forced to
conclude that they probably are. Having opened Pandora’s
box and released various evils into the world they cannot
reverse the process. Having responded to the 2008 credit
bust by inflating yet another series of bubbles, they are utterly
terrified but even more terrified of the consequences of them
bursting and so for the moment, just like Pandora, they do
nothing and cling to hope.
Unless indicated otherwise, opinions expressed in this
document are those of the author.
RWC Q2 2015 Investor Letter | 11
RWC Equity Income
Figure 11: Shanghai Stock Exchange Composite Index
Figure 12: Marginal Returns—I
Source: Macrbond, BNP Paribas, 31 March 2015
Source: Bloomberg, as at 08 April 2015. Data range: 01 January 2010 to 31 March 2015
1500
2000
2500
3000
3500
4000
4500
2010 2011 2012 2013 2014 2015
About RWC
RWC is an independent investment firm founded in 2000,
providing high-alpha asset management to institutions,
professional investors and intermediaries.
The firm provides an intense focus on investment performance
and extracting maximum ‘alpha’ (manager skill). Each of our
select range of strategies is based around the proven skills of
talented investment professionals.
The firm only launches strategies where it can secure top-
performing managers to run them. The firm provides an
environment in which talented managers, supported by
dedicated analysts, can focus on delivering performance using
their preferred process and philosophy.
This focus on performance sits within a culture of strong risk
management. At all times, the firm’s results are based on
delivering returns within known and acceptable levels of risk. In
each strategy, protecting clients’ assets is as important as
capturing return.
RWC is independently managed and controlled. The majority of
the firm’s equity is owned by the firm’s portfolio managers,
directors and other employees. Schroders owns a minority stake
in the business. Most RWC staff have chosen to invest directly in
equity and/or funds managed by the business.
RWC Asset Management LLP is a wholly-owned subsidiary of
RWC Partners Limited and provides the majority of investment
management services for the group. Both businesses are UK
based and are regulated by the Financial Conduct Authority.
About the team
Nick Purves
Nick joined RWC in August 2010. He was previously senior
portfolio manager at Schroders for over 16 years managing both
Institutional Specialist Value Funds and the Schroder Income
Fund and Income Maximiser Fund together with Ian Lance.
During his time at Schroders, Nick was Citywire AAA, Nick and
Ian’s Income fund was Morningstar 5 star rated, AA rated by
OBSR and won the Moneywise award in 2009 in the UK Equity
Income and Equity Income and Growth sectors. Nick is a
qualified Chartered Accountant.
Ian Lance
Ian joined RWC in August 2010. He was previously senior
portfolio manager at Schroders managing both Institutional
Specialist Value Funds and the Schroder Income Fund and
Income Maximiser Fund together with Nick Purves. During his
time at Schroders, Ian was Citywire AAA rated, Nick and Ian’s
Income fund was Morningstar 5 star rated, AA rated by OBSR
and won the Moneywise award in 2009 in the UK Equity Income
and Equity Income and Growth sectors. Previously Ian was the
Head of European Equities and Director of Research at Citigroup
Asset Management and Head of Global Research at Gartmore.
John Teahan
John joined RWC and the Equity Income Team in September
2010. He previously worked at Schroders, where he co-managed
the Schroder Income Maximiser with Nick Purves and Ian Lance.
John also co-managed the Schroder Global Dividend Maximiser,
Schroder European Dividend Maximiser and Schroder UK
Income Defensive funds, all three of which employed a covered
call strategy. John also specialised in trading and managing
derivative securities for a range of structured funds. Previously he
worked as a performance and risk analyst for Bank of Ireland
Asset Management UK. John is a CFA Charterholder.
Larry Furness
Larry joined RWC in August 2010 as a graduate recruit and
currently works in the Equity Income Team. He graduated from
the University of Nottingham in 2009 with an honours degree in
Economics and during his tenure successfully completed two
intern positions; the first at Permal Investment Management
where he was involved in manager research for the firm as an
Investment Analyst, and the Government Economic Service as
an Assistant Economist. Larry is a CFA Level II candidate.
Q2 2015 Investor Letter | 12
RWC Equity Income
RWC

This document contains information relating to RWC Partners Limited, RWC Focus Asset Management Limited and RWC Asset Management LLP (collectively, “RWC”), each of which is authorised and
regulated in the United Kingdom by the Financial Conducr Authority (“FCA”), and services provided by them and may also contain information relating to certain products managed or advised by RWC
(“RWC Funds”).
RWC may act as investment manager or adviser, or otherwise provide services, to more than one product pursuing a similar investment strategy or focus to the product detailed in this document. RWC
seeks to minimise any conflicts of interest, and endeavours to act at all times in accordance with its legal and regulatory obligations as well as its own policies and codes of conduct.
This document is issued by RWC Partners Limited, 60 Petty France, London SW1H 9EU, only for, and is directed only at, persons that qualify as Professional Clients or Eligible Counterparties under
rules of the FCA. The services provided by RWC are available only to such persons. It is not intended for distribution to and should not be relied on by any person who would qualify as a Retail Client.
This document is provided for informational purposes only. The information contained in it is subject to updating, completion, modification and amendment. RWC does not accept any liability (whether
direct or indirect) arising from the reliance on or other use of the information contained in it. The information set out in this document is to the reasonable belief of RWC, reliable and accurate at the date
hereof, but is subject to change without notice. In producing this document, RWC may have relied on information obtained from third parties and no representation or guarantee is made hereby with
respect to the accuracy or completeness of such information.
This document contains information that is not purely historical in nature. Such forward looking information is based upon certain assumptions about future events or conditions and is intended only to
illustrate hypothetical results under those assumptions (not all of which are set out or specified in this document). Actual events or conditions are unlikely to be consistent with, and may differ materially
from, those assumed. In addition, not all relevant events or conditions may have been considered in developing such assumptions. Accordingly, actual results will vary and the variations may be materi-
al.
This document is for discussion purposes only and is not an offer, or solicitation of an offer, to buy or sell any security or financial instrument or to participate in any trading strategy. The information
contained in this document is RWC’s summary, interpretation and analysis of available information, research, assumptions, estimates, views, predictions and opinions.
As mentioned above, this document does not constitute an invitation, inducement, offer or solicitation to anyone in any jurisdiction of or to acquire interests in any RWC Fund. Nevertheless, investment
in any RWC Fund should be considered high risk. Past performance is not a reliable indicator of future performance and may not be repeated. The value of investments in RWC Funds and the income
from them may fall as well as rise and may be subject to sudden and substantial falls. Changes in rates of exchange may cause the value of such investments to fluctuate. An investor may not be able to
get back the amount invested and the loss on realisation may be very high and could result in a substantial or complete loss of the investment. No representations or warranties of any kind are intended
or should be inferred with respect to the economic return from, or the tax consequences of, an investment in RWC Funds. Current tax levels and reliefs may change. Depending on individual circum-
stances, this may affect investment returns. There is no guarantee that the securities referred to in this document will be held by RWC Funds in the future. Nothing in this document constitutes advice on
the merits of buying or selling a particular investment. This document does not constitute investment, legal or tax advice.
The distribution and offering of RWC Funds in the United Kingdom and other jurisdictions may be restricted by law. It is the responsibility of every person reading this document to satisfy himself as to
the full observance of the laws of any relevant country, including obtaining any government or other consent which may be required or observing any other formality which needs to be observed in that
country. Nothing in this document constitutes an offer or solicitation by anyone in any jurisdiction in which such an offer is not authorised or to any person to whom it is unlawful to make such an offer or
solicitation. Interests in RWC Funds are available only in jurisdictions where their promotion and sale are permitted.
A United Kingdom investor may not have the right (otherwise provided under the FCA Handbook of Rules and Guidance) to cancel any agreement constituted by acceptance by or on behalf of an RWC
Fund of an application for interests in an RWC Fund. In addition, most if not all of the protections provided by the United Kingdom regulatory structure will not apply to investments in an RWC Fund.
Investors in an RWC Fund will not receive compensation under the Financial Services Compensation Scheme in the United Kingdom in the event that the fund is unable or likely to be unable to satisfy
claims against it.
RWC Partners Limited is registered in England and Wales (No. 03517613) with its registered address as above.
Contact Us
Please contact us if you have any questions
or want to discuss any of our strategies.
RWC 60 Petty France
London
SW1H 9EU
Tel: +44 20 7227 6000
Fax: +44 20 7227 6003
Email: [email protected]
Web: www.rwcpartners.com
RWC Equity Income
RWC