Embed Size (px)
DESCRIPTION
Russian Stock Market: Tested by Crisis. E. Ellinski, MICEX Vice-President. The Russian stock market and the world financial crisis. D . Medvedev wins presidential election. Bear Stearns announces losses on bonds backed by subprime mortgage. - PowerPoint PPT Presentation
Citation preview
August 28, 2008
Russian Stock Market: Tested by Crisis
E. Ellinski, MICEX Vice-President
2
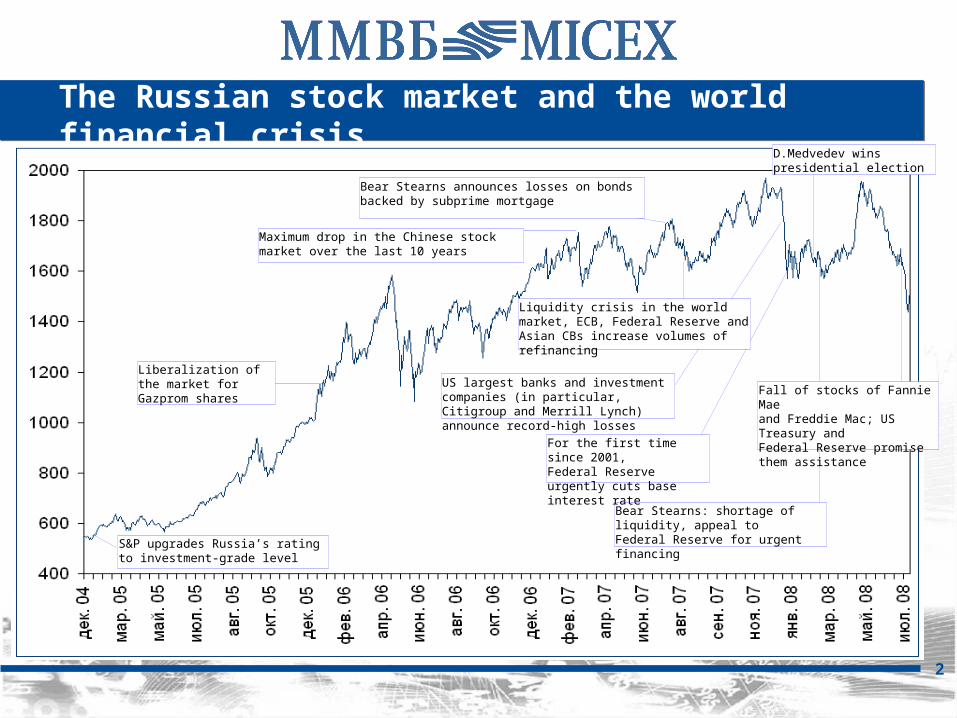
The Russian stock market and the world financial crisis
S&P upgrades Russia’s rating to investment-grade level
Liberalization of the market for Gazprom shares
Maximum drop in the Chinese stock market over the last 10 years
Bear Stearns announces losses on bonds backed by subprime mortgage
US largest banks and investment companies (in particular, Citigroup and Merrill Lynch) announce record-high losses
D.Medvedev wins presidential election
Bear Stearns: shortage of liquidity, appeal to Federal Reserve for urgent financing
For the first time since 2001, Federal Reserve urgently cuts base interest rate
Fall of stocks of Fannie Maeand Freddie Mac; US Treasury and Federal Reserve promise them assistance
Liquidity crisis in the world market, ECB, Federal Reserve and Asian CBs increase volumes of refinancing
3
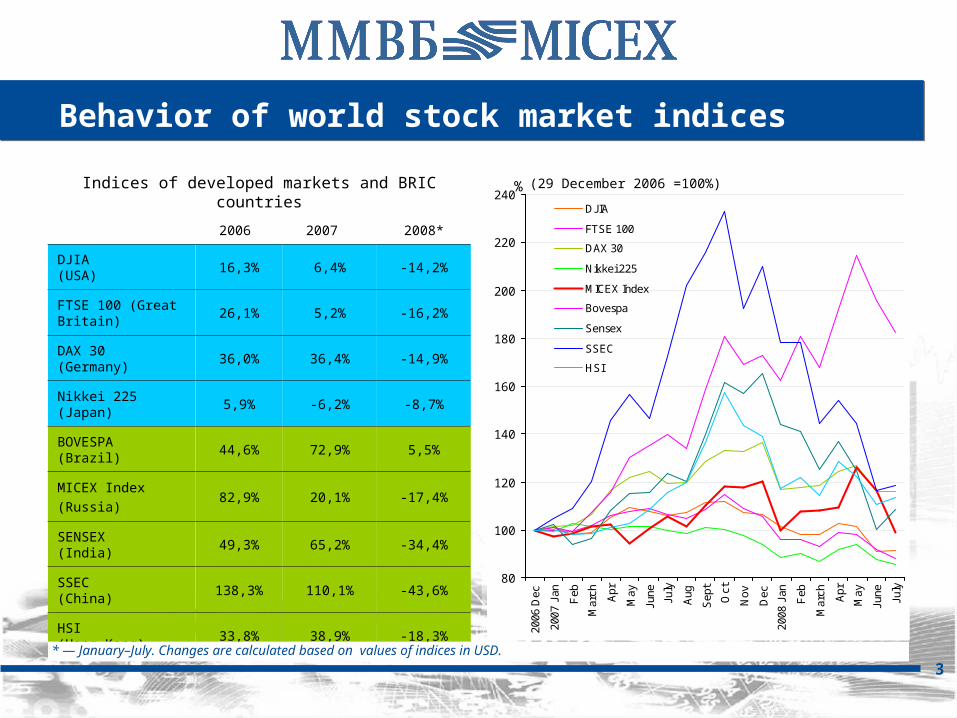
Behavior of world stock market indices
Indices of developed markets and BRIC countries
2006 2007 2008*
DJIA(USA)
16,3% 6,4% -14,2%
FTSE 100 (Great Britain)
26,1% 5,2% -16,2%
DAX 30(Germany)
36,0% 36,4% -14,9%
Nikkei 225(Japan)
5,9% -6,2% -8,7%
BOVESPA(Brazil)
44,6% 72,9% 5,5%
MICEX Index(Russia)
82,9% 20,1% -17,4%
SENSEX(India)
49,3% 65,2% -34,4%
SSEC(China)
138,3% 110,1% -43,6%
HSI(Hong Kong)
33,8% 38,9% -18,3%
80
100
120
140
160
180
200
220
240
2006
Dec
2007
Jan
Feb
Mar
ch Apr
May
June
July
Aug
Sep
t
Oct
Nov
Dec
2008
Jan
Feb
Mar
ch Apr
May
June
July
%
DJ IA
FTSE 100
DAX 30
Nikkei 225
MICEX Index
Bovespa
Sensex
SSEC
НSI
(29 December 2006 =100%)
* — January–July. Changes are calculated based on values of indices in USD.

4
Corporate bonds market
Volume and number of placements
513324
31
89449854
4642
31
8
30
18
493745
24
2424
0
5
10
15
20
25
1Q2006
2Q 3Q 4Q 1Q2007
2Q 3Q 4Q 1Q2008
2Q
billion USD
External market
MICEX SE
Bonds yield in the secondary market, % (at the end of six months)
Issuer’s rating
2nd half of 2006
1st half of 2007
2nd half of 2007
1st half of 2008
BBB- and up
6,7 6,7 7,4 7,9
ВВ- — ВВ+ 8,2 7,7 9,3 9,5
B+ and below
9,5 9,3 11,6 11,6
Without rating
10,8 10,8 12,0 12,9
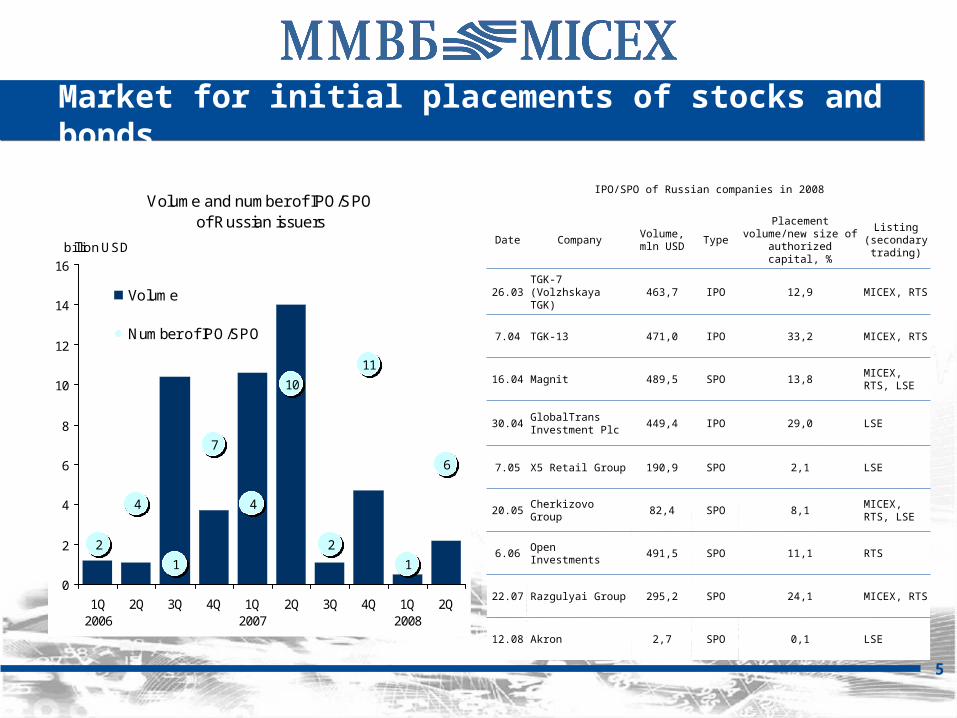
Market for initial placements of stocks and bonds
Volume and number of IPO/SPOof Russian issuers
2
4
1
7
4
10
2
11
1
6
0
2
4
6
8
10
12
14
16
1Q2006
2Q 3Q 4Q 1Q2007
2Q 3Q 4Q 1Q2008
2Q
billion USD
Volume
Number of IPO/SPO
5
IPO/SPO of Russian companies in 2008
Date CompanyVolume,mln USD
TypePlacement
volume/new size of authorized capital, %
Listing (secondary
trading)
26.03TGK-7(Volzhskaya TGK)
463,7 IPO 12,9 MICEX, RTS
7.04 TGK-13 471,0 IPO 33,2 MICEX, RTS
16.04 Magnit 489,5 SPO 13,8MICEX, RTS, LSE
30.04GlobalTrans Investment Plc
449,4 IPO 29,0 LSE
7.05 X5 Retail Group 190,9 SPO 2,1 LSE
20.05 Cherkizovo Group 82,4 SPO 8,1MICEX, RTS, LSE
6.06 Open Investments 491,5 SPO 11,1 RTS
22.07 Razgulyai Group 295,2 SPO 24,1 MICEX, RTS
12.08 Akron 2,7 SPO 0,1 LSE
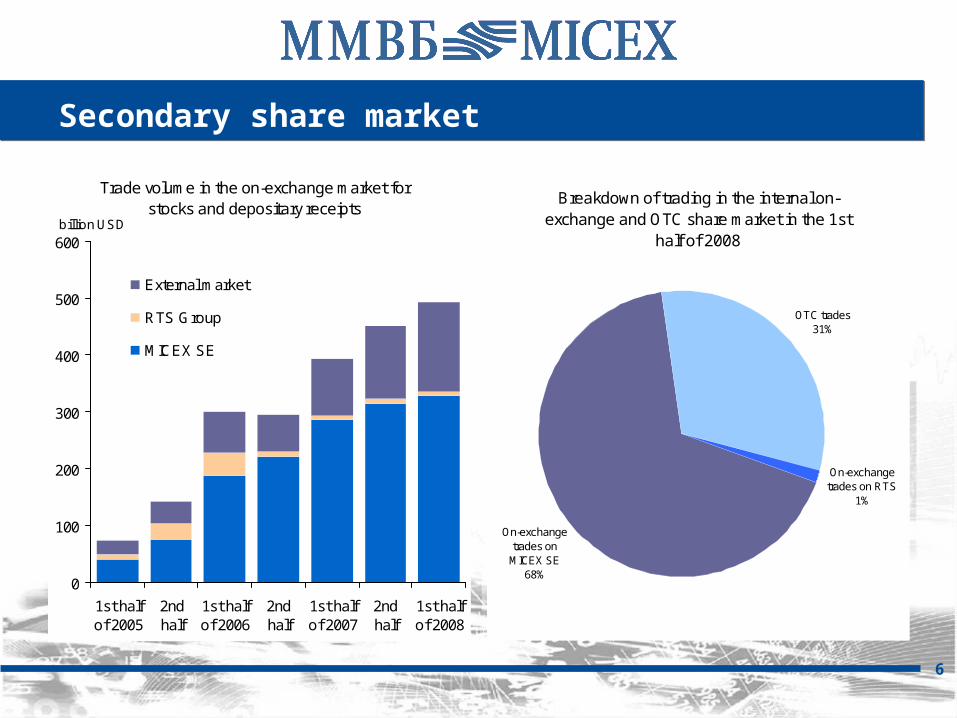
Secondary share market
Breakdown of trading in the internal on-exchange and OTC share market in the 1st
half of 2008
On-exchange trades on MICEX SE
68%
OTC trades31%
On-exchange trades on RTS
1%
Trade volume in the on-exchange market for stocks and depositary receipts
0
100
200
300
400
500
600
1st halfof 2005
2ndhalf
1st halfof 2006
2ndhalf
1st halfof 2007
2ndhalf
1st halfof 2008
billion USD
External market
RTS Group
MICEX SE
6
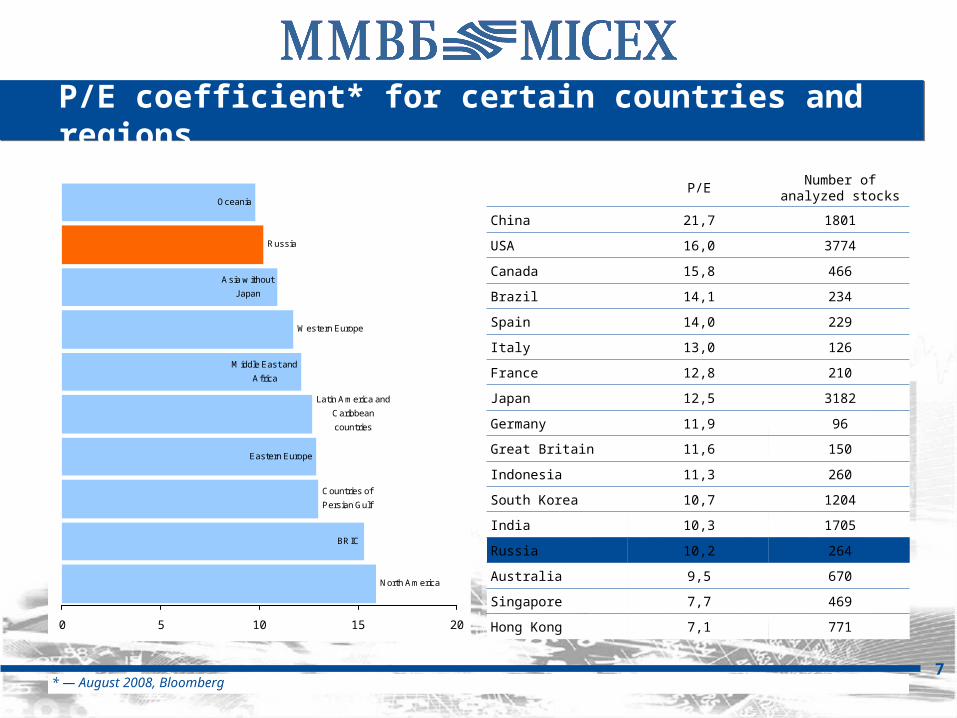
P/E coefficient* for certain countries and regions
BRIC
Eastern Europe
Middle East and
Africa
Asia without
J apan
Oceania
North America
Countries of
Persian Gulf
Latin America and
Caribbean
countries
Western Europe
Russia
0 5 10 15 20
P/ENumber of analyzed
stocks
China 21,7 1801
USA 16,0 3774
Canada 15,8 466
Brazil 14,1 234
Spain 14,0 229
Italy 13,0 126
France 12,8 210
Japan 12,5 3182
Germany 11,9 96
Great Britain 11,6 150
Indonesia 11,3 260
South Korea 10,7 1204
India 10,3 1705
Russia 10,2 264
Australia 9,5 670
Singapore 7,7 469
Hong Kong 7,1 771
7* — August 2008, Bloomberg
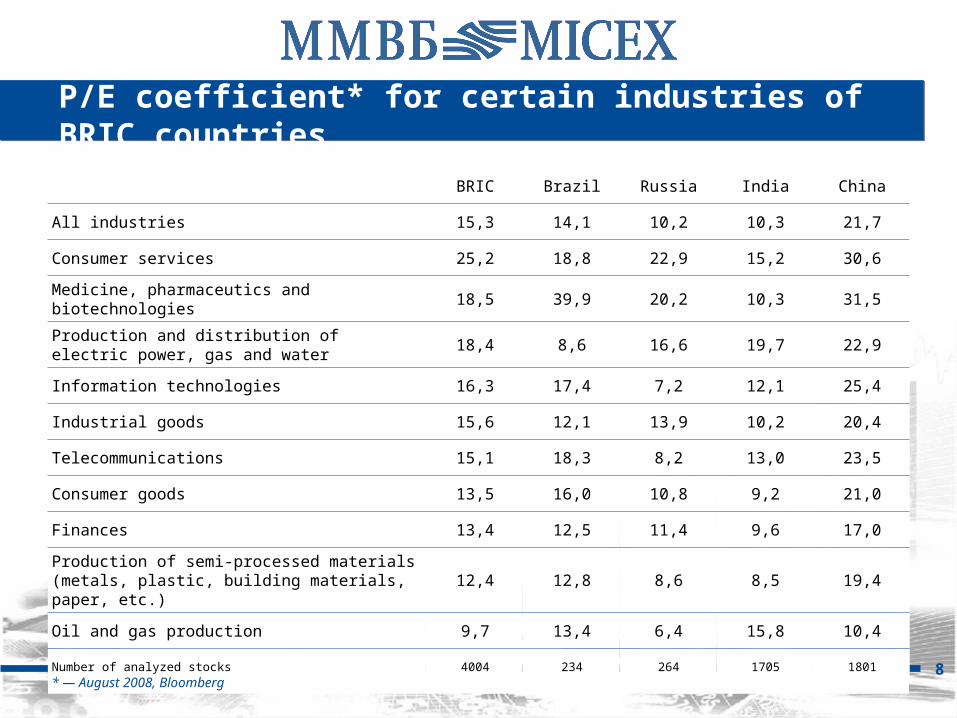
P/E coefficient* for certain industries of BRIC countries
BRIC Brazil Russia India China
All industries 15,3 14,1 10,2 10,3 21,7
Consumer services 25,2 18,8 22,9 15,2 30,6
Medicine, pharmaceutics and biotechnologies 18,5 39,9 20,2 10,3 31,5
Production and distribution of electric power, gas and water
18,4 8,6 16,6 19,7 22,9
Information technologies 16,3 17,4 7,2 12,1 25,4
Industrial goods 15,6 12,1 13,9 10,2 20,4
Telecommunications 15,1 18,3 8,2 13,0 23,5
Consumer goods 13,5 16,0 10,8 9,2 21,0
Finances 13,4 12,5 11,4 9,6 17,0
Production of semi-processed materials (metals, plastic, building materials, paper, etc.)
12,4 12,8 8,6 8,5 19,4
Oil and gas production 9,7 13,4 6,4 15,8 10,4
Number of analyzed stocks 4004 234 264 1705 1801
8* — August 2008, Bloomberg
9
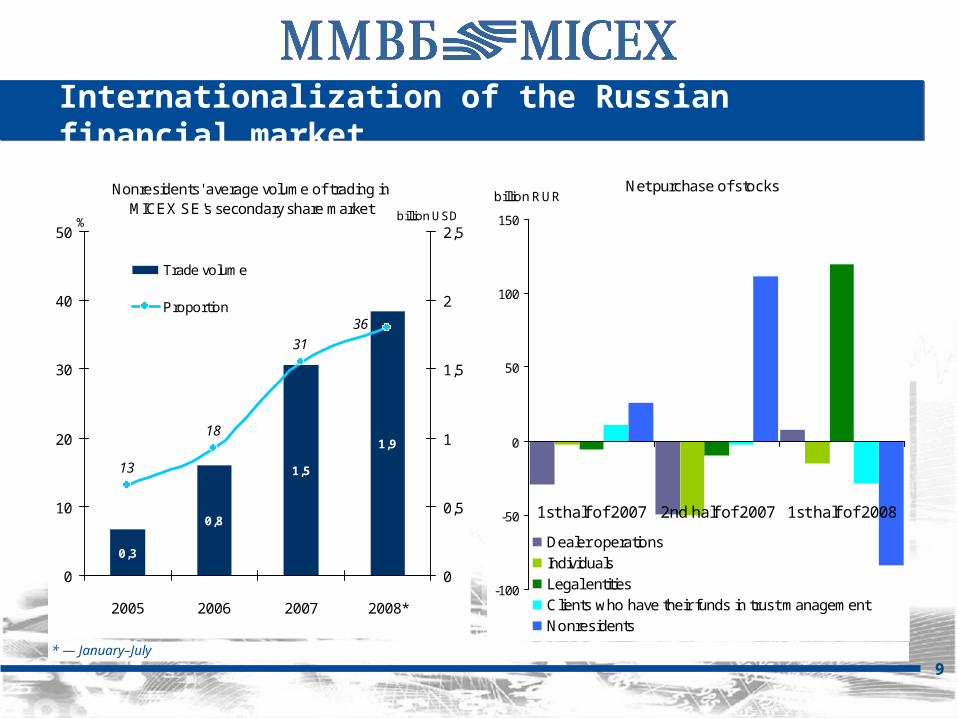
Internationalization of the Russian financial market
Nonresidents' average volume of trading in MICEX SE's secondary share market
0,3
0,8
1,5
1,918
13
31
36
0
10
20
30
40
50
2005 2006 2007 2008*
%
0
0,5
1
1,5
2
2,5billion USD
Trade volume
Proportion
Net purchase of stocks
-100
-50
0
50
100
150
1st half of 2007 2nd half of 2007 1st half of 2008
billion RUR
Dealer operationsIndividualsLegal entitiesClients who have their funds in trust managementNonresidents
9* — January–July
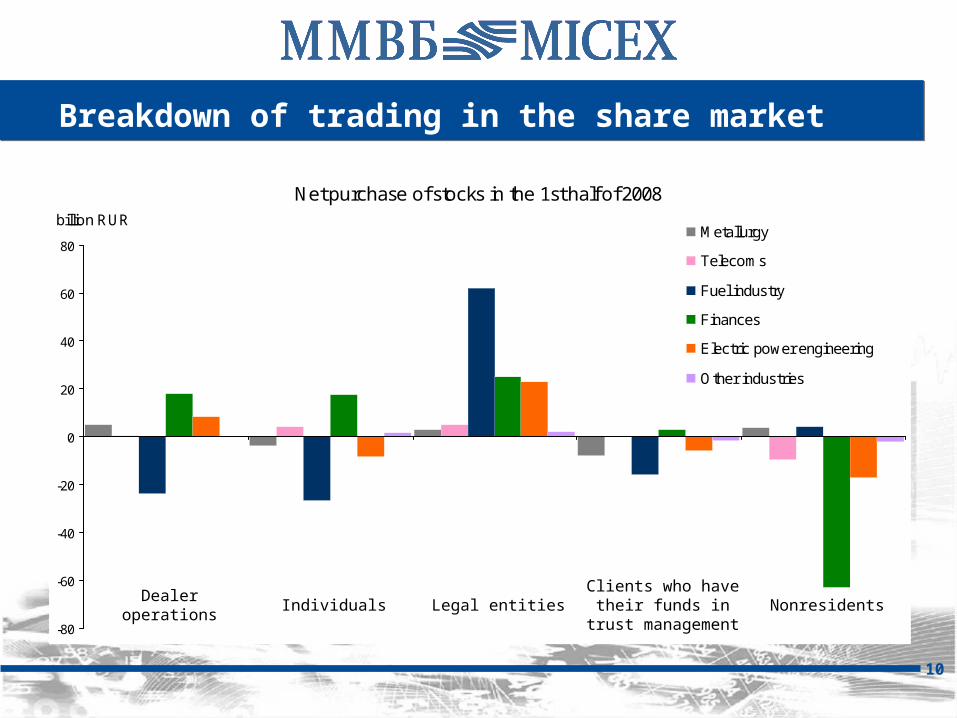
Breakdown of trading in the share market
Net purchase of stocks in the 1st half of 2008
-80
-60
-40
-20
0
20
40
60
80
billion RURMetallurgy
Telecoms
Fuel industry
Finances
Electric power engineering
Other industries
10
Dealer operations Individuals Legal entitiesClients who have
their funds in trust management
Nonresidents

Attraction of long-term foreign investors
Clients-nonresidents on MICEX Stock Exchange
CountriesNumber of registered clients-
nonresidents
Cyprus 2 036
Japan 379
Ukraine 319
Byelorussia 259
Kazakhstan 92
Great Britain 90
Uzbekistan 61
British Virgin Islands 59
Lithuania 58
Armenia 57
USA 54
Latvia 50
Germany 46
Moldova 39
China 28
Israel 27
Seychelles 22
Azerbaijan 17
Vietnam 15
India 15
Foreign investors in Russian stocks and depositary receipts*(at year-end)
2005 2006 2007
Assets under management,billion USD.
1 092,1 1 432,62
206,7
Investments in Russian stocks, billion USD.
22,8 49,5 73,4
Share of Russian assets in assets 2,1% 3,4% 3,3%
Portfolio turnover:
high (>70%) 50,3% 55,9% 57,7%
average (33%—70%) 39,1% 29,5% 35,9%
low (<33%) 10,6% 14,6% 6,4%
* Source: Interfax Business Service (materials from Thomson One for IR)
11
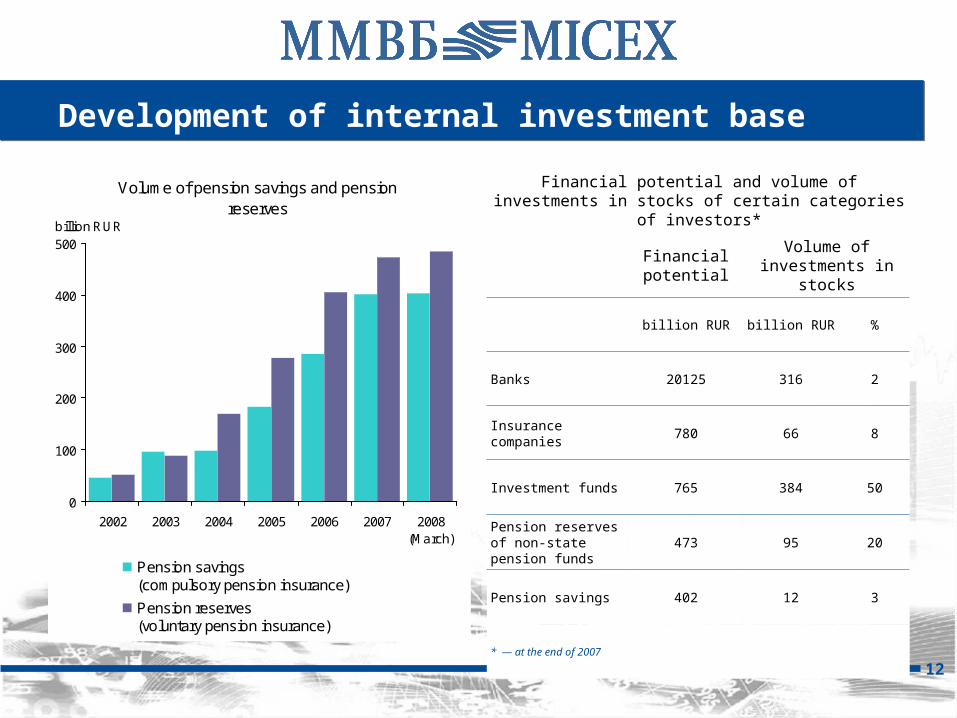
Development of internal investment base
Volume of pension savings and pension reserves
0
100
200
300
400
500
2002 2003 2004 2005 2006 2007 2008(March)
billion RUR
Pension savings (compulsory pension insurance)
Pension reserves (voluntary pension insurance)
Financial potential and volume of investments in stocks of certain categories of investors*
Financial potential
Volume of investments in
stocks
billion RUR billion RUR %
Banks 20125 316 2
Insurance companies
780 66 8
Investment funds 765 384 50
Pension reserves of non-state pension funds
473 95 20
Pension savings 402 12 3
* — at the end of 2007
12
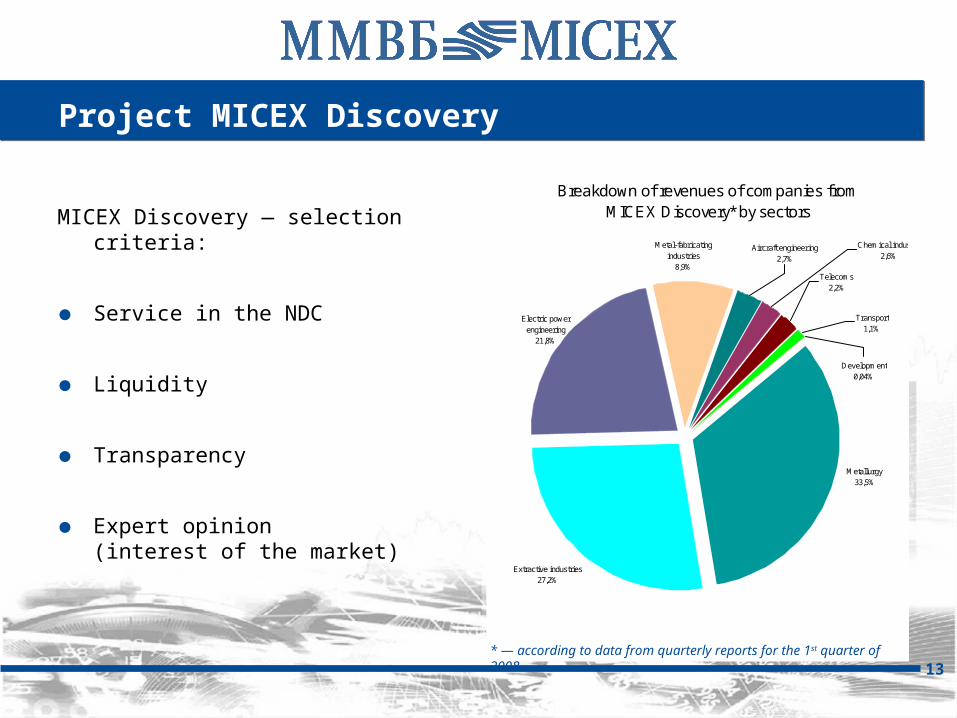
Project MICEX Discovery
MICEX Discovery — selection criteria:
● Service in the NDC
● Liquidity
● Transparency
● Expert opinion(interest of the market)
Breakdown of revenues of companies from MICEX Discovery* by sectors
Extractive industries27,2%
Transport1,1%
Telecoms2,2%
Development0,04%
Electric power engineering
21,8%
Chemical industry2,6%
Aircraft engineering2,7%
Metal-fabricating industries
8,9%
Metallurgy33,5%
* — according to data from quarterly reports for the 1st quarter of 2008 13
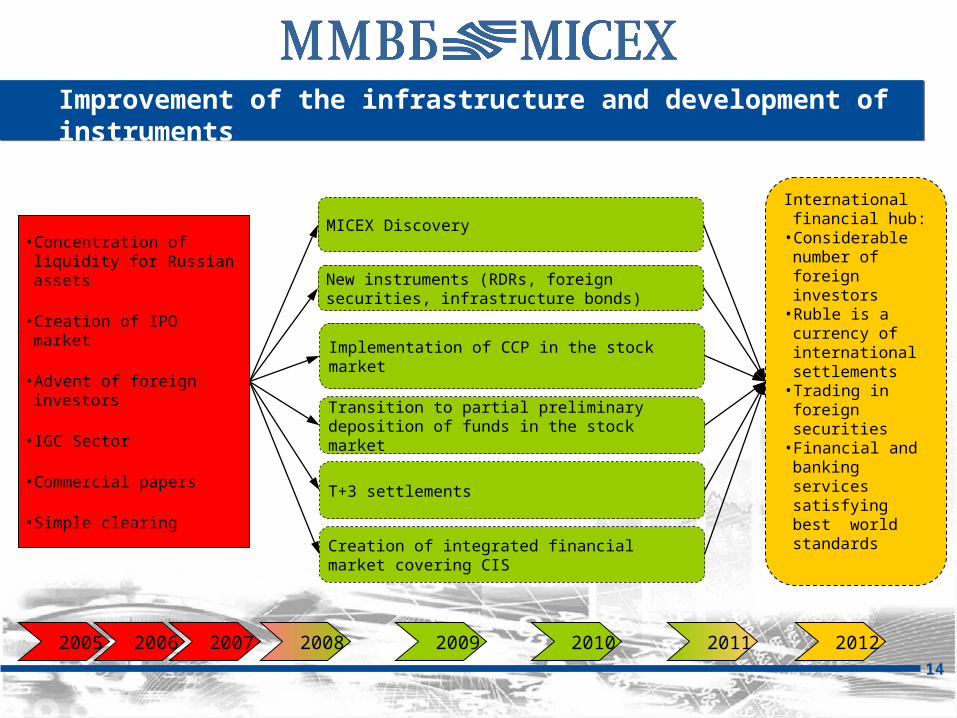
Improvement of the infrastructure and development of instruments
14
•Concentration of liquidity for Russian assets
•Creation of IPO market
•Advent of foreign investors
•IGC Sector
•Commercial papers
•Simple clearing
International financial hub:
•Considerable number of foreign investors
•Ruble is a currency of international settlements
•Trading in foreign securities
•Financial and banking services satisfying best world standards
MICEX Discovery
New instruments (RDRs, foreign securities, infrastructure bonds)
T+3 settlements
Creation of integrated financial market covering CIS
2006 2007 2008 2009 2010 2011 2012
Transition to partial preliminary deposition of funds in the stock market
Implementation of CCP in the stock market
2005

NEW YORKNEW YORK LONDONLONDON
PARISPARIS FRANKFURTFRANKFURT
MOSCOW
SYNGAPORESYNGAPORE
HONG KONGHONG KONG
TOKYOTOKYO
15
Moscow: an international financial hub
16
Contacts
● Address:۰ 13 B.Kislovskiy Per., Moscow, 125009, Russia
● Telephone:۰ (495) 234-48-11
● Fax:۰ (495) 705-96-22
● E-mail:۰ [email protected]
● Web site:۰ www.micex.ru
Prepared by Information and Analysis Division of MICEX