Embed Size (px)
Citation preview

+7 (499) 409-3696 | www.globalreach.ru | Copyright © GLOBAL REACH CONSULTING (GRC) 1
RUSSIAN SAUSAGE MARKET | 2011
RUSSIAN SAUSAGE MARKET
Issue 2 – Sample Pages
2011
GRC

+7 (499) 409-3696 | www.globalreach.ru | Copyright © GLOBAL REACH CONSULTING (GRC) 2
RUSSIAN SAUSAGE MARKET | 2011
1. EXECUTIVE SUMMARY
1.1. Background
This report was produced by GLOBAL REACH CONSULTING (GRC) and presents the results of
market research conducted in August-September 2011.
The aim of this research is to provide a comprehensive overview of the Russian sausage market.
The report covers the following key products:
Cooked and cooked-smoked sausage products, including stuffed ones;
Smoked sausages;
Sausage from heat treated ingredients;
Blood sausage.
Pages: 124
Language: English
The Report includes: 45 Tables, 58 Figures (Graphics, Diagrams)
Date of Issue: 26 January, 2012
Price: 45,000 RUB (1,500 USD)

+7 (499) 409-3696 | www.globalreach.ru | Copyright © GLOBAL REACH CONSULTING (GRC) 3
RUSSIAN SAUSAGE MARKET | 2011
1.2. Key Research Areas
Specifically, the research aims to cover:
Domestic sausage production, including:
o Production of all types of sausages;
o Production of cooked and cooked-smoked sausage products, including stuffed ones;
o Production of smoked sausages;
o Production of sausage from heat treated ingredients;
o Production of blood sausage;
Competitor analysis, including:
o Russian largest sausage producers;
o Largest producers by major types of sausage products, including:
Cooked sausage made without poultry meat;
Cooked sausage made from poultry meat;
Semi-cooked sausage made without poultry meat;
Semi-cooked sausage made from poultry meat;
Hard-smoked sausage.
Sausage imports:
o Value and volume of imports;
o Structure of imports by types of products;
o Geographical distribution of imports;
o Imports structure by importers;
Sausage exports:
o Value and volume of exports;
o Structure of exports by types of products;
o Geographical distribution of exports;
o Exports structure by exporters.

+7 (499) 409-3696 | www.globalreach.ru | Copyright © GLOBAL REACH CONSULTING (GRC) 4
RUSSIAN SAUSAGE MARKET | 2011
Sausage market balance:
o Market Trends;
o Market structure.
Domestic retail sales of meat products and canned meat:
o Sales volume;
o Geographical distribution of retail sales.
Consumer preferences.

+7 (499) 409-3696 | www.globalreach.ru | Copyright © GLOBAL REACH CONSULTING (GRC) 5
RUSSIAN SAUSAGE MARKET | 2011
1.3. Management Summary
Domestic Sausage Production
In 2010, the production of sausage products in the Russian Federation amounted to
nearly *** million tons, 7% rise over the previous year.
According to GLOBAL REACH CONSULTING forecasts for 2011, the production of
sausage products is to increase by.
Figure 10. Sausage Production Dynamics, 2006-2011(Forecast), 1,000 metric tons and %
Source: ***
In the first half of 2011 cheaper sausages - cooked and cooked-smoked sausages,
including stuffed - still dominate in the Russian production structure.
***
The Central Federal District is the largest sausage producer with a share of ***%.
According to 2010 totals, the sausage production here reached *** thousand tons.
During the first half of 2011 the production growth totaled ***% compared to the
same period of 2010.
In 2010, Moscow was ranked the 1st among Russian sausage producing regions
with a share of ***%. In the first half of 2011 the production here grew by ***%,
compared to the same period in 2010.
***
Sausage Imports
-10,0%
-5,0%
0,0%
5,0%
10,0%
15,0%
2 000 000
2 100 000
2 200 000
2 300 000
2 400 000
2 500 000
2 600 000
2006 2007 2008 2009 2010 2011 F
Production volume, metric tons
Growth rate, %
SAMPLE
+7 (499) 409-3696 | www.globalreach.ru | Copyright © GLOBAL REACH CONSULTING (GRC) 6
RUSSIAN SAUSAGE MARKET | 2011
In 2010 imports of sausage products totaled *** thousand metric tons. According to
2010 totals, the volume of imports dropped by ***%.
The share of Frankfurt and Vienna sausages accounts for ***% of total sausage
imports. The share of liver sausages and liver puree reaches ***% of Russian
sausage imports.
The United States of America is a leading supplier of sausage products to the
Russian Federation with a share of ***% of imports in volume and ***% in value
terms.
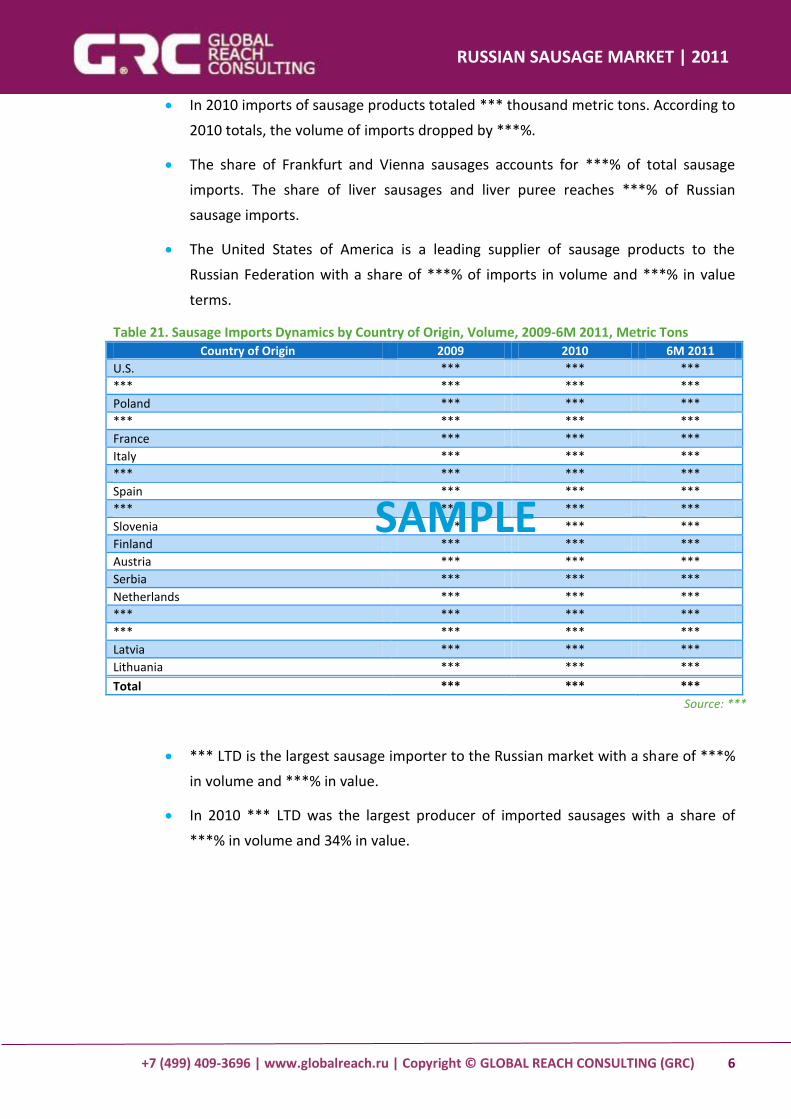
Table 21. Sausage Imports Dynamics by Country of Origin, Volume, 2009-6М 2011, Metric Tons Country of Origin 2009 2010 6M 2011
U.S. *** *** *** *** *** *** *** Poland *** *** *** *** *** *** *** France *** *** *** Italy *** *** *** *** *** *** *** Spain *** *** *** *** *** *** *** Slovenia *** *** *** Finland *** *** *** Austria *** *** *** Serbia *** *** *** Netherlands *** *** *** *** *** *** *** *** *** *** *** Latvia *** *** *** Lithuania *** *** ***
Total *** *** *** Source: ***
*** LTD is the largest sausage importer to the Russian market with a share of ***%
in volume and ***% in value.
In 2010 *** LTD was the largest producer of imported sausages with a share of
***% in volume and 34% in value.
SAMPLE

+7 (499) 409-3696 | www.globalreach.ru | Copyright © GLOBAL REACH CONSULTING (GRC) 7
RUSSIAN SAUSAGE MARKET | 2011
Sausage Exports
In 2010 Russian sausage exports accounted for *** thousand tons, a ***% decline.
The share of cooked and cooked-smoked sausages (except for Frankfurt and Vienna
sausages) accounts for ***% of total sausage exports.
In 2010 *** was the major destination country in the Russian sausage exports
structure with a share of ***% in volume and ***% in value terms.
*** is the largest producers of exported sausages with a share of ***% in volume
and ***% in value terms.
*** LTD is the leading sausage exporter with a share of ***% in volume and ***% in
value terms.
Sausage Market Balance
***.
According to GLOBAL REACH CONSULTING forecasts, in 2011 Russian sausage
market might grow by ***% to *** million tons due to domestic production growth.
***
In 2010 the share of cooked and cooked-smoked sausages in the Russian market
accounted for ***%, the share of smoked sausage is ***%, the share of sausages
made of heat treated ingredients figured up to ***%, the share of other sausage
products accounted for ***%.
Figure 48. Russian Sausage Market Structure by Type of Sausage, 2010, %
Source: ***
Cooked and cooked-smoked, including stuffed
Smoked sausage
Sausages from heattreated ingredients
Others
SAMPLE

+7 (499) 409-3696 | www.globalreach.ru | Copyright © GLOBAL REACH CONSULTING (GRC) 8
RUSSIAN SAUSAGE MARKET | 2011
TABLE OF CONTENTS 1. EXECUTIVE SUMMARY
1.1. Key Research Areas
1.2. Methodology
1.3. Management Summary
2. DEFINITIONS
2.1. Subject Definition
2.2. Sausage Classification
American Classification
Russian Classification
3. RUSSIAN ECONOMY DEVELOPMENT AND FORECAST FOR 2011-2013
3.1. GDP
3.2. Industrial Production Index
3.3. Foreign Trade
3.4. Forecast Of Economy Development for 2011-2013
4. DOMESTIC SAUSAGE PRODUCTION
4.1. Total Sausage Production
4.1.1. Production Trends
4.1.2. Production Structure by Type of Sausage
4.1.3. Geographical Distribution of Sausage Production
By Federal District
By Region
4.2. Production of Cooked And Cooked-Smoked Sausage Products, Including Stuffed
Sausage
4.2.1. Production Trends
4.2.2. Geographical Distribution of Production
By Federal District
By Region
4.3. Production of Smoked Sausages
4.3.1. Production Trends

+7 (499) 409-3696 | www.globalreach.ru | Copyright © GLOBAL REACH CONSULTING (GRC) 9
RUSSIAN SAUSAGE MARKET | 2011
4.3.2. Geographical Distribution of Production
By Federal District
By Region
4.4. Production of Sausages Made of Heat Treated Ingredients
4.4.1. Production Trends
4.4.2. Geographical Distribution of Production
By Federal District
By Region
4.5. Production of Blood Sausages
4.5.1. Production Trends
4.5.2. Geographical Distribution of Production
By Federal District
By Region
5. COMPETITOR ANALYSIS
5.1. Russian Largest Sausage Producers
5.2. Largest Producers by Major Type of Sausage
5.2.1. Cooked Sausage Made Without Poultry Meat
5.2.2. Cooked Sausage Made of Poultry Meat
5.2.3. Semi-Cooked Sausage Made Without Poultry Meat
5.2.4. Semi-Cooked Sausage Made of Poultry Meat
5.2.5. Hard Smoked Sausage
6. SAUSAGE IMPORTS
6.1. Imports Trends
6.2. Structure Of Imports by Type of Products
6.3. Geographical Distribution of Imports
6.4. Sausage Imports Structure by Importer
6.5. Sausage Imports Structure by Producer
7. SAUSAGE EXPORTS
7.1. Exports Trends
7.2. Structure of Exports by Type of Products
7.3. Geographical Distribution of Exports

+7 (499) 409-3696 | www.globalreach.ru | Copyright © GLOBAL REACH CONSULTING (GRC) 10
RUSSIAN SAUSAGE MARKET | 2011
7.4. Exports Structure by Producer
7.5. Exports Structure by Exporters
8. RUSSIAN SAUSAGE MARKET BALANCE
8.1. Market Trends
8.2. Market Structure
8.2.1. By Product Origin
8.2.2. By Type of Sausage
9. DOMESTIC RETAIL SALES OF MEAT PRODUCTS AND CANNED MEAT
9.1. Sales Volume
9.2. Geographical Distribution of Retail Sales
By Federal District
By Region
10. CONSUMER PREFERENCES
Appendix 1. Russian Sausage Imports by Country of Origin
Appendix 2. Russian Sausage Imports by Importer
Appendix 3. Russian Sausage Imports by Producer
Appendix 4. Russian Sausage Exports by Destination Country
Appendix 5. Russian Sausage Exports by Producer
Appendix 6. Russian Sausage Exports by Exporter
GLOBAL REACH CONSULTING (GRC) About

+7 (499) 409-3696 | www.globalreach.ru | Copyright © GLOBAL REACH CONSULTING (GRC) 11
RUSSIAN SAUSAGE MARKET | 2011
LIST OF FIGURES
Figure 1. American Sausage Classification
Figure 2. Production of GDP, 1995-2010, Current Prices; Billion Rubles
Figure 3. Physical Volume Indices of GDP, 2000-2010, at Constant Prices; % of the
Corresponding Period of Previous Year
Figure 4. Physical Volume Indices of GDP by Economic Activity, 2009-2010, at Constant
Prices; % of the Corresponding Period of Previous Year
Figure 5. Industrial Production Index, 1992-2010, as % of the Corresponding Month of
Previous Year
Figure 6. Dynamics of Trade Surplus, Exports and Imports, 2000-2010, Billion $
Figure 7. Actual and Estimated Urals Oil Prices, 2005-2014, Dollars per Barrel
Figure 8. Main Macroeconomic Indices, 2002-2014, % of the Previous Year
Figure 9. Main Income Indices, 2002-2014, % of the Previous Year
Figure 10. Sausage Production Dynamics, 2006-2011 (Forecast), 1,000 metric tons and %
Figure 11. Seasonal Sausage Production Variability, 2010-6М 2011, %
Figure 12. Sausage Production Structure by Type of Sausage, 2009- 2010, %
Figure 13. Russian Sausage Production Geography by Federal District, 2010, %
Figure 14. Russian Sausage Production Geography by Region, 2010, %
Figure 15. Cooked and Cooked-Smoked Sausage Production Dynamics, 2009 – 6М 2011,
1,000 metric tons and %
Figure 16. Russian Cooked and Cooked-Smoked Sausage Production Geography by Federal
District, 2010, %
Figure 17. Russian Cooked and Cooked-Smoked Sausage Production Geography by Region,
2010, %
Figure 18. Smoked Sausage Production Dynamics, 2009-2011, tons, %
Figure 19. Russian Smoked Sausage Production Geography by Federal District, 2010, %
Figure 20. Russian Smoked Sausage Production Geography by Region, 2010, %
Figure 21. Production of Sausage Made of Heat treated Ingredients, 2009-2011, metric
tons, %
Figure 22. Production Geography of Sausages Made of Heat Treated Ingredients by Federal
District, 2010, %
Figure 23. Production Geography of Sausages Made of Heat Treated Ingredients by Region,
2010, %

+7 (499) 409-3696 | www.globalreach.ru | Copyright © GLOBAL REACH CONSULTING (GRC) 12
RUSSIAN SAUSAGE MARKET | 2011
Figure 24. Blood Sausages Production Dynamics, 2009-2011, metric tons and %
Figure 25. Production Geography of Blood Sausages by Federal District, 2010, %
Figure 26. Production Geography of Blood Sausages by Region, 2010, %
Figure 27. Largest Russian Sausage Producers, 2009, %
Figure 28. Largest Russian Producers of Cooked Sausage Made without Poultry Meat, 2009,
%
Figure 29. Largest Russian Producers of Cooked Sausage Made of Poultry Meat, 2009, %
Figure 30. Largest Producers of Semi-Cooked Sausage Made without Poultry Meat, 2009, %
Figure 31. Largest Russian Producers of Semi-cooked Sausage Made of Poultry Meat, 2009,
%
Figure 32. Largest Russian Producers of Hard-smoked Sausage, 2009, %
Figure 33. Sausage Imports Dynamics, Volume and Value, 2007-6М 2011, Metric Tons and
$1,000
Figure 34. Sausage Products Imports Structure by Type of Sausages, Volume and Value,
2010, %
Figure 35. Geographical Distribution of Sausage Imports, Volume and Value, 2010 , %
Figure 36. Sausage Imports Structure by Importer, 2010, %
Figure 37. Sausage Imports Structure by Producer, Volume and Value, 2010 , %
Figure 38. Sausage Exports Dynamics, Volume and Value, 2007-6М 2011, Metric Tons and
$1,000
Figure 39. Sausage Exports Structure by Type of Sausage, Volume and Value, 2010, %
Figure 40. Sausage Exports Structure by Destination Country, Volume and Value, 2010, %
Figure 41. Sausage Exports Structure by Producer, Volume and Value, 2010, %
Figure 42. Sausage Exports Structure by Exporter, 2010, %
Figure 43. Comparative Dynamics of Production, Exports and Imports of Sausage Products,
2007-6М 2011, Metric Tons
Figure 44. Comparative Dynamics of Imports, Exports and Apparent Consumption Growth
Rates, 2008-2010, %
Figure 45. Apparent Consumption of Sausage Products in Russia, 2007-2011(F), Metric Tons
and %
Figure 46. Sausage Exports Share Dynamics in Domestic Production, 2008-2010, %
Figure 47. Russian Sausage Market Structure Dynamics by Product Origin, 2008-6М 2011, %
Figure 48. Russian Sausage Market Structure by Type of Sausage, 2010, %

+7 (499) 409-3696 | www.globalreach.ru | Copyright © GLOBAL REACH CONSULTING (GRC) 13
RUSSIAN SAUSAGE MARKET | 2011
Figure 49. Dynamics of Shares of Cooked and Semi-Cooked Sausages in the Russian Sausage
Market Structure, 2009-6М 2011, %
Figure 50. Retail Sales of Meat, Meat Products And Canned Meat Dynamics in Russia, 2009-
6М 2011, million RUB
Figure 51. Retail Sales of Meat, Meat Products And Canned Meat Structure Dynamics by
Federal District, 2009-6М 2011, %
Figure 52. Shares of Russian Regions in the Retail Sales of Meat, Meat Products and Canned
Meat, 2010, %
Figure 53. Frequency of Sausage Consumption
Figure 54. Average Check of Sausage Purchase, RUB
Figure 55. Places to Purchase Sausage Products
Figure 56. Consumer Preferences by Type of Sausage Products
Figure 57. Consumer Preferences by Trademark
Figure 58. Factors of Choosing Sausage by Certain Trademark/Producer
LIST OF TABLES
Table 1. Major Parameters of Macroeconomic Forecast for 2011-2014
Table 2. Sausage Production Dynamics by Type of Sausage, 2009-6М 2011, metric tons
Table 3. Geographical Distribution of Sausage Production by Federal District, 2006-6М
2011, metric tons and %
Table 4. Geographical Distribution of Sausage Production by Region, 2009-6М 2011,
metric tons and %
Table 5. Geographical Distribution of Cooked and Cooked-Smoked Sausages Production
by Federal District, 2009-6М 2011, metric tons and %
Table 6. Geographical Distribution of Cooked and Cooked-Smoked Sausages Production
by Region, 2009-6М 2011, metric tons and %
Table 7. Geographical Distribution of Smoked Sausage Production by Federal District,
2009-6М 2011, metric tons and %
Table 8. Geographical Distribution of Smoked Sausage Production by Region, 2009- 6М
2011, tons and %
Table 9. Geographical Distribution of Sausages Made of Heat Treated Ingredients
Production by Federal District, 2009-6М 2011, tons and %
Table 10. Geographical Distribution of Sausages Made of Heat Treated Ingredients
Production by Region, 2009- 6М 2011, Tons and %

+7 (499) 409-3696 | www.globalreach.ru | Copyright © GLOBAL REACH CONSULTING (GRC) 14
RUSSIAN SAUSAGE MARKET | 2011
Table 11. Geographical Distribution of Blood Sausage Production by Federal District, 2009-
6М 2011, Metric Tons and %
Table 12. Geographical Distribution of Blood Sausage Production by Russian Region, 2009-
6М 2011, Metric Tons and %
Table 13. TOP 100 Russian Sausage Producers, 2006-2009, Metric Tons and %
Table 14. TOP 20 Russian Producers of Cooked Sausage Made without Poultry Meat, 2007-
2009, Tons and %
Table 15. TOP 20 Russian Producers of Cooked Sausages Made of Poultry Meat, 2007-2009,
Metric Tons and %
Table 16. TOP 20 Russian Producers of Semi-Cooked Sausages Made Without Poultry Meat,
2007-2009, Metric Tons and %
Table 17. TOP 20 Russian Producers Of Semi-Cooked Sausages Made of Poultry Meat,
2007-2009, Metric Tons and %
Table 18. TOP 20 Russian Producers of Hard Smoked Sausage, 2007-2009, Metric Tons and
%
Table 19. Sausage Imports Dynamics, Volume and Value, 2007-6М 2011, Metric Tons and
$1,000
Table 20. Sausage Products Imports Structure by Type of Sausages, 2010, Metric Tons and
$1,000
Table 21. Sausage Products Imports Dynamics, Volume, 2007-6М 2011, Metric Tons
Table 22. Geographical Distribution of Sausage Imports, Volume and Value, 2010, Metric
Tons and $1,000
Table 23. Sausage Imports Dynamics by Country of Origin, Volume, 2009-6М 2011, Metric
Tons
Table 24. Sausage Imports Structure by Importer, Volume and Value, 2010, Metric Tons
and $1,000
Table 25. Sausage Imports Dynamics by Importer, Volume, 2009-6М 2011, Metric Tons
Table 26. Sausage Imports Structure by Producer, Volume and Value, 2010, Metric Tons
and $1,000
Table 27. Sausage Imports Dynamics by Producer, Volume, 2009-6М 2011, Metric Tons
Table 28. Sausage Exports Dynamics, Volume and Value, 2007-6М 2011, Metric Tons and
$1,000
Table 29. Sausage Exports Structure by Type of Sausage, Volume and Value, 2010, Metric
Tons and $1,000 %
Table 30. Sausage Exports Dynamics by Type of Sausage, Volume, 2007-6М 2011, Metric
+7 (499) 409-3696 | www.globalreach.ru | Copyright © GLOBAL REACH CONSULTING (GRC) 15
RUSSIAN SAUSAGE MARKET | 2011
Tons
Table 31. Sausage Exports Structure by Destination Country, Volume and Value, 2010,
Metric Tons and $1,000
Table 32. Sausage Exports Dynamics by Destination Country, Volume, 2009-6М 2011,
Metric Tons
Table 33. Sausage Exports Structure by Producer, 2010, tons, $1,000 and %
Table 34. Sausage Exports Dynamics by Producer, Volume, 2007-6М 2011, Metric Tons
Table 35. Sausage Exports Structure by Exporter, 2010, tons, $1,000, %
Table 36. Sausage Exports Dynamics by Exporter, Volume, 2009-6M 2011, Metric Tons
Table 37. Russian Sausage Market Balance, 2007-2011, Metric Tons
Table 38. Retail Sales of Meat, Meat Products and Canned Meat Dynamics by Federal
District, 2009-6М 2011, 1,000 RUB and %
Table 39. Retail Sales of Meat, Meat Products and Canned Meat Dynamics by Region,
2009-6М 2011, 1,000 RUB and %
Table A1. Geographical Distribution of Russian Sausage Imports by Country of Origin,
Volume and Value, 2009-6M 2011
Table A2. Russian Sausage Imports Structure by Importer, Volume and Value, 2009-6M
2011
Table A3. Russian Sausage Imports Structure by Producer, Volume and Value, 2009-6M
2011
Table A4. Geographical Distribution of Russian Sausage Exports by Destination Country,
Volume and Value, 2009-6M 2011
Table A5. Russian Sausage Exports Structure by Producer, Volume and Value 2009-6M
2011
Table A6. Russian Sausage Exports Structure by Exporter, Volume and Value, 2009-6M
2011

+7 (499) 409-3696 | www.globalreach.ru | Copyright © GLOBAL REACH CONSULTING (GRC) 16
RUSSIAN SAUSAGE MARKET | 2011
ABOUT GLOBAL REACH CONSULTING (GRC)
GLOBAL REACH CONSULTING is specialized in developing high-quality marketing research and
business plans for different industries and regions of Russia and other countries. We give our
customers practical ways to achieve competitive advantages by providing reliable business
data, analysis and recommendations based on sound research methods.
Among GLOBAL REACH CONSULTING clients are Russian and International companies,
governmental organizations, large, medium, and small businesses as well as startups and
investors, including the Economic Mission of the French Embassy to Russian Federation, Trade
Exchange Development Department (ICE) of the Embassy in Italy in Russian Federation,
Sberbank, Zurich, S7Airlines, Bobcat, Knauf, Mareven Food Central, Estee Lauder and many
other companies.
GLOBAL REACH CONSULTING unique methods of work and service, a highly professional team,
extensive knowledge of markets and rich experience allows us to focus on results and complete
satisfaction of our customers.
Our business is to help our clients to identify and implement initiatives that lead to growth and
prosperity.
Our goal – is your global reach!


![LOUIE’S FINER MEATS Cumberland, WI POTENTIAL KEYWORDS sausage bratwurst cheddarwurst “wisconsin bratwurst” “italian sausage” [cotto salami] “hunter sausage”](https://img.pdfslide.us/doc/110x75/56649cec5503460f949b8cc6/louies-finer-meats-cumberland-wi-potential-keywords-sausage-bratwurst-cheddarwurst.jpg)