Embed Size (px)
Citation preview
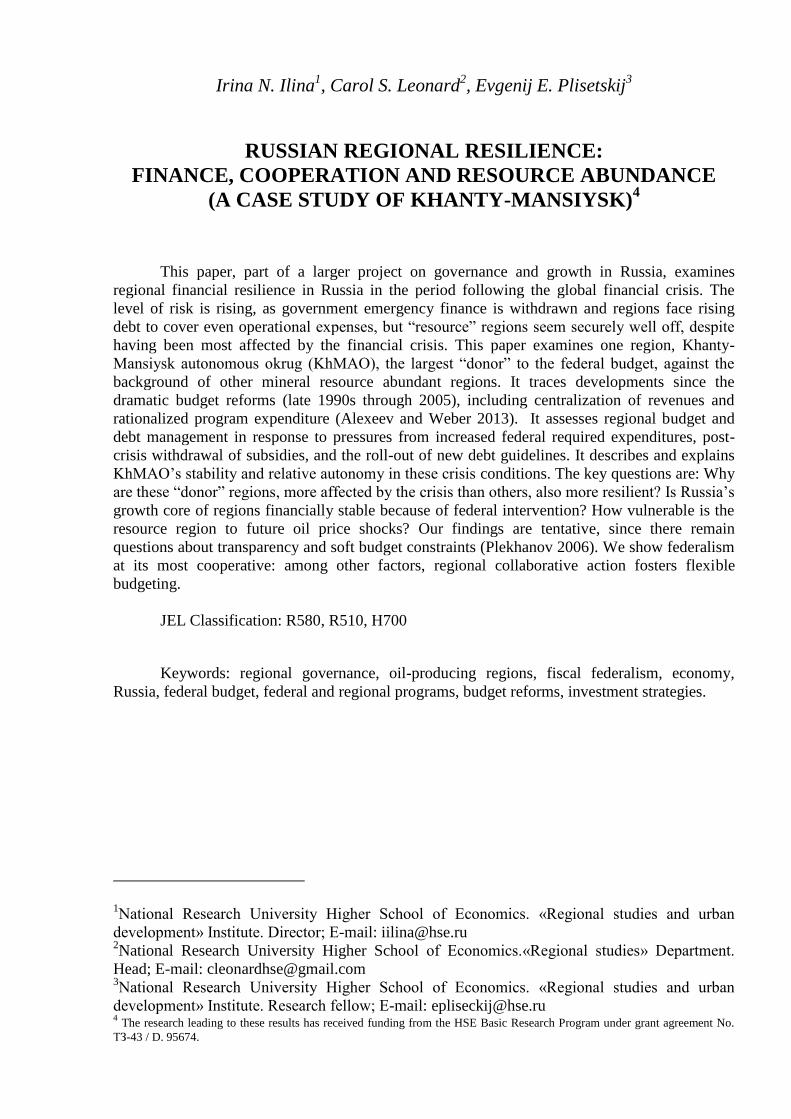
Irina N. Ilina, Carol S. Leonard, Evgenij E. Plisetskij
RUSSIAN REGIONAL
RESILIENCE: FINANCE,
COOPERATION AND RESOURCE
ABUNDANCE (A CASE STUDY OF
KHANTY-MANSIYSK)
BASIC RESEARCH PROGRAM
WORKING PAPERS
SERIES: PUBLIC ADMINISTRATION
WP BRP 15/PA/2014
This Working Paper is an output of a research project implemented as part of the Basic Research Program at the
National Research University Higher School of Economics (HSE). Any opinions or claims contained in this
Working Paper do not necessarily reflect the views of HSE.
Irina N. Ilina1, Carol S. Leonard
2, Evgenij E. Plisetskij
3
RUSSIAN REGIONAL RESILIENCE:
FINANCE, COOPERATION AND RESOURCE ABUNDANCE
(A CASE STUDY OF KHANTY-MANSIYSK)4
This paper, part of a larger project on governance and growth in Russia, examines
regional financial resilience in Russia in the period following the global financial crisis. The
level of risk is rising, as government emergency finance is withdrawn and regions face rising
debt to cover even operational expenses, but “resource” regions seem securely well off, despite
having been most affected by the financial crisis. This paper examines one region, Khanty-
Mansiysk autonomous okrug (KhMAO), the largest “donor” to the federal budget, against the
background of other mineral resource abundant regions. It traces developments since the
dramatic budget reforms (late 1990s through 2005), including centralization of revenues and
rationalized program expenditure (Alexeev and Weber 2013). It assesses regional budget and
debt management in response to pressures from increased federal required expenditures, post-
crisis withdrawal of subsidies, and the roll-out of new debt guidelines. It describes and explains
KhMAO’s stability and relative autonomy in these crisis conditions. The key questions are: Why
are these “donor” regions, more affected by the crisis than others, also more resilient? Is Russia’s
growth core of regions financially stable because of federal intervention? How vulnerable is the
resource region to future oil price shocks? Our findings are tentative, since there remain
questions about transparency and soft budget constraints (Plekhanov 2006). We show federalism
at its most cooperative: among other factors, regional collaborative action fosters flexible
budgeting.
JEL Classification: R580, R510, H700
Keywords: regional governance, oil-producing regions, fiscal federalism, economy,
Russia, federal budget, federal and regional programs, budget reforms, investment strategies.
1National Research University Higher School of Economics. «Regional studies and urban
development» Institute. Director; E-mail: [email protected] 2National Research University Higher School of Economics.«Regional studies» Department.
Head; E-mail: [email protected] 3National Research University Higher School of Economics. «Regional studies and urban
development» Institute. Research fellow; E-mail: [email protected] 4 The research leading to these results has received funding from the HSE Basic Research Program under grant agreement No.
ТЗ-43 / D. 95674.
3
Introduction
This paper, part of a larger project on governance and growth in Russia, examines
regional financial resilience in Russia in the period following the global financial crisis. The
level of risk is rising, as government emergency finance is withdrawn and regions face rising
debt to cover even operational expenses, but “resource” regions seem securely well off, despite
having been most affected by the financial crisis. This paper examines one region, Khanty-
Mansiysk autonomous okrug (KhMAO), the largest “donor” to the federal budget, against the
background of other mineral resource abundant regions. It traces developments since the
dramatic budget reforms (late 1990s through 2005), including centralization of revenues and
rationalized program expenditure (Alexeev and Weber 2013). It assesses regional budget and
debt management in response to pressures from increased federal required expenditures, post-
crisis withdrawal of subsidies, and the roll-out of new debt guidelines. It describes and explains
KhMAO’s stability and relative autonomy in these crisis conditions.
KhMAO is clearly an outlier, as are most other resource regions. This can be seen in
terms of budget flexibility, investment, and livelihood, which are generally depicted by more
typical regions (less well off) in the enormous quantitative literature on Russia’s highly
centralized fiscal federalism in the 83 regions (Treisman 2000, Ahmad and Tanzi 2002, Alexeev
and Kurlyandskaya 2003, Ahrend 2005, Plekhanov 2006, Spilimbergo 2007, Akhmedjonov
2011, Berkowitz and DeJong 2011, Vartapetov 2011, Alexeev, Weber et al. 2013). From a look
at both budget and credit management, however, it is important to observe and ask why, in
regions of greatest growth potential, regional finance is so secure. It is in these “donor” regions,
which were more affected by the crisis than others, that there is greater resilience in the medium
term. Is Russia’s growth core of regions financially stable because of federal intervention? How
vulnerable is the resource region to future oil price shocks? Our findings are tenative, since there
remain questions about transparency and soft budget constraints (Plekhanov 2006). We shows
federalism at its most cooperative: neighboring regional action fosters growth and stability.
We use a case study approach for a number of reasons. Most important, although there is
a considerable quantitative literature on Russia’s fiscal federal system, as pointed out, we aim on
a smaller scale to combine a study of budget and credit management with a closer look at a
representative example in a particular group of regions.
A case study approach is widely used for conceptual clarification prior to and during
statistical analyses of large data bases (Eisenhardt 1989, Ragin and Becker 1992, Geddes 2003,
Gerring 2007). A case study isolates for closer examination either extremes in a trend, or a
typical case. Since we examine the growth process and not, for example, inequality, we explore
4
regional finance in a territory especially vulnerable in its growth potential and not its general
economic state.
The paper is organized as follows. The case study, broken down by sub-section, is in part
3. The introduction is followed by a review of the large literature on fiscal federalism, with
emphasis on analysis appropriate to oil abundant federations. This sets a foundation for looking
at KhMAO in comparative context. Russia’s fiscal federalism is of scholarly interest within and
beyond the borders of Russia in large part because of intense and continuing effective reform
through the 2010s, improving the delivery of both equity and efficiency. We use this literature
about ongoing centralizing reform, however, to the continuing diversity still apparent in regional
finance and regulatory regimes across the enormous country (Commander, Plekhanov et al.
2013). We note in conclusion the importance of cooperation as well as competition among oil
abundant regions, although exploring in any detail is beyond the scope of our research. The final
section is a conclusion.
Literature Review: Fiscal Rigidity in Russia
There is wide agreement among researchers about fiscal rigidity on the revenue side of
Russia’s federalism. After the transformation of Russia’s federalist system in the 2000s,
revenues have been almost entirely centralized, with allocated funds to cover federal social
policy along with other expenditures (Treisman 2000, Ahmad and Tanzi 2002, Alexeev and
Kurlyandskaya 2003, Ahrend 2005, Plekhanov 2006, Spilimbergo 2007, Akhmedjonov 2011,
Berkowitz and DeJong 2011, Vartapetov 2011, Alexeev, Weber et al. 2013). Revenues are
collected centrally and allocated to regions by formula in transfers, earmarked grants, subsidies
and other allocations, in turn partially allocated to districts and municipalities.5 Local
government provides services in health, education and social welfare (Searle 2007). Reviewing
the major budget reforms, Fitch ratings (28 September 2005) finds that:
… budgetary results showed increasing budgetary rigidity among the regions, the
subordination of budgets to rapidly growing social spending and a lack of capital
expenditure. Budget reforms have introduced a more structured system of public
administration, but regional governments now operate under considerable constraints of
having revenue sources reduced through centralization and responsibilities increased by
5See Table for a review of fiscal federalist development in Russia since 1991 Alexeev, M. V., S. Weber (2013).
Russian fiscal federalism: impact of political and fiscal (de)centralization. London, Centre for Economic Policy
Research Discussion Papers, No 9356. See also Vartapetov, K. (2011). "Russian Fiscal Federalism under Stress:
Federal Support of Regions during the Global Financial Crisis." Eurasian Geography and Economics 52 (4): 529-
542.
5
higher social welfare targeted expenditures. The vital indicator is economic
development-related expenditure as a proportion to total expenditure.6
The important constraint is not the collection of revenues but the access to them through
shared spending authority. The spending side, for all regions, has been pressed by President
Putin’s “May 7 decrees” in 2012, guaranteeing a standard of services, including a pay raise for
government staff, and the provision of benefits to all citizens. To be sure, these decrees were not
only a constraint but a benefit, promising greater efficiency, reduction of duplication and waste,
monitoring of implementation of federal programs.7 Rigidity in the budget process, however, as
Fitch points out, is important because it conflicts with another key priority objective: “At the
same time, there is a clear policy to reduce regions dependency on federal revenues and
stimulate greater tax initiative and new local resources8. In other words, excessive centralization
will inhibit local initiative in finding resources, which many economists find to be the key
objective of government, as Qian and Weingast (1997, p. 84) maintain:
The state must maintain ''positive" market incentives that reward economic success.
When the government is tempted to take away too much income and wealth generated by
the future success, individuals have no incentives to take risks and make effort today. In
the terms of North (1990), this is the "state predation" problem. The state must also
commit to "negative" market incentives that punish economic failure; if the government is
tempted to bail out failed projects or continue costly, inefficient public programs,
individuals have no incentives to avoid mistakes and waste. In the terms of Kornai
(1986), this is the "soft budget constraint" problem (Qian and Weingast 1997).
An incentive orientation, in its largest significance, is an argument for decentralization
that among advanced countries has mostly replaced the former “cooperative fiscal federalism” as
the dominant approach to intergovernmental relations (Musgrave 1997) (pp. 65-66).
Russia’s seemingly relatively inflexible budget therefore seems not entirely aligned with
current trends. The history of Russian budget reform explains why. To end a decade of struggle
with separatism, after 2000, the evolving post-Yeltsin state under President Putin sharply
reduced political autonomy of regions. It ended—briefly reinstating and then ending, once more-
-direct gubernatorial elections.9 The government helped forget a single dominant party
10 and
6 URL: http://www.fitchratings.com/creditdesk/press_releases/detail.cfm?pr_id=180771, accessed 27.01.2014. 7 For example, as implemented by prikaz, “O forme I sroke predstavleniia zaiavki na perechislenie subsidii iz federal’nogo
biudzheta biudzetu sub’ekta Rossiiskoi Federatsii na sofinansirovanie raskhodnykh obiazatel’sv sub’ekta Rossiiskoi Federatsii, ot
7 maia 2012 g. N 606, Prikaz Ministerstva truda I sotsial’noi zashchity Rossiiskoi Federatsiiot 29 noiabria 2012 g. N556H. 8 URL: http://www.fitchratings.com/creditdesk/press_releases/detail.cfm?pr_id=180771, accessed 27.01.2014). 9 Direct elections of regional governors were reinstated in 2012, after being suspended in 2004, and a new law in 2013 gave
regional legislatures the option of either direct election or a choosing from candidates proposed by the federal government. 10Further reduction of choice is seen in one-party dominance in the regions of “United Russia” (Hale, 2006; Gel’man, 2008;
Golosov, 2008).
6
bring to heel «regional authoritarianism», which was an obstacle to well functioning political and
market institutions (Golosov, 2004; Stoner-Weiss, 2006). Centralization also brought economic
reforms, by which small and medim scale enterprises were disadvantaged. Concentration in
economic activity increased, as nation-wide companies penetrated local markets. The state
actively intervened in the private sector, and it now owns two-thirds of the market capitalization
in the Russian stock market (limited to four industries, energy (oil, gas, and electricity), banks,
defense industries and transportation.11
The government has centralized the investment oriented
economic policy (Martinez-Vazquez and Boex 2001, Desai, Freinkman et al. 2005, Bahl,
Martinez-Vazquez et al. 2006, Martinez-Vazquez, Timofeev et al. 2006, Martinez-Vazquez,
Rider et al. 2008, Alexeev, Weber et al. 2013).
It is important to underscore that centralization has not resulted in the degree of
uniformity that may have been envisioned in policy. The regulatory environment remains diverse
and federal laws are still sometimes not well enforced,
…substantial inter-regional variation in terms of the quality of the business environment.
The differences are particularly large in the areas of competition from the informal
sector, access to physical infrastructure, access to land and tax administration
(European Bank for Reconstruction and Development (2012), p. 43).
Thus centralizing budget reform continues. The historical and current regional revenue
and expenditure system is described in detail in numerous articles (Siluanov, Kadochnikov et al.
2009, Vartapetov 2010, Siluanov 2011, Vartapetov 2011, Alexeev, Weber et al. 2013, Mamedov,
Nazarov et al. 2013), and in a magisterial chapter in the Oxford Handbook of the Russian
Economy (2013) (Alexeev, Weber et al. 2013). Emphasis on key developments before 2002 can
be found in Desai, Freinkman et al (2005) and (Lavrov et al. 2001). Briefly, to review Russia’s
budget reform history: under President Putin, the government eliminated most of the
disadvantageous bilateral tax treaties between the federal government and the regions, which
were no longer justified in a more unified state (Zhuravskaya and Handelsho gskolan i
Stockholm. O stekonomiska 2000, Martinez-Vazquez and Boex 2001, Solanko 2001).
The results are as follows: 100 percent of the VAT was recentralized (in the 1990s),
along with 80% of the oil and gas extraction tax, leaving by 2012 one quarter of the revenue base
of regions from the corporate profit tax (including on resource industries) and personal income
tax (28%), approximately the same percentages regional revenues from these sources in Canada.
The property tax represents, on average, some 9% of regional revenues (2011), amounting to 1.9
11 Dresen F. Joseph, “The role of state corporations in the Russian economy,” Kennan Institute, 1 October 2012, Washington
D.C, (URL: http://www.wilsoncenter.org/publication/the-role-state-corporations-the-russian-economy, accessed 27.01.2014)).
7
% of GRP, roughly in line with property taxes elsewhere.12
Total regional tax revenues in Russia
amount to roughly 11% of GRP (Siluanov, Kadochnikov et al. 2009, Vartapetov 2010), again,
comparable to other states (Canada, 12.1%, Australia, 4%; Germany, 7.9%; and the US, 5%)13
.
As in other countries, expenditures are allocated by equalization grants (mainly for balancing the
budget), earmarked grants (including unconditional grants for center delegated spending
(subventions) and earmarked matching grants (subsidies) for priority federal programs, and
compensation grants to adjust distribution of these allocations (Vartapetov 2011).
The main result of these reforms, we argue, is considerable standardization of Russia’s
budget process. Budget centralization, arguably, is too often assumed to be synonymous with
political recentralization. Instead, some recentralization has been a natural evolution in Russian
governance, similar to all other transition economies, both unitary and federalist. Among results of
standardizing reform, for example, is that regions tend to retain a generous share of total revenues
(in consolidated budget). It has varied since the start of reforms from 38 and to 51%, and in 2011,
it was 46.8%. This is well within the range of tax shares allocated to sub-national governments in
most federations, with the figure of 34% in the US to 44% in Canada (Blöchliger and Rabesona
2009) (Table 2, p. 5). The budget rules are fairly transparent although adjusted every year (Shleifer
and Treisman 2005, Unleashing the Potential 2006, Hauner 2008, Kondratʹeva 2008, Siluanov
2011).
In summary, partial centralization is usual in federations. Revenue collections are
centralized including for efficiency of the collection process. This also prevents “beggar-thy-
neighbor” outcomes and mis-allocation of factors of production produced by autonomous
budgeting and general inefficiency (Christenko 2002, Sakwa 2004, Chebankova 2008, Alexeev,
Weber et al. 2013).14
Centralized revenues allows adjustment of trade-offs between centralization
and decentralization (Trujillo, Martinez et al. 1986, Mello 2000, Iimi 2005, Sepulveda and
Martinez-Vazquez 2011, Hatfield and Miquel 2012, Alexeev, Weber et al. 2013). For example, the
federal level must take responsibility for equalization, as required, and have the resources to do so
over the long run. Two examples illustrate the extent of centralization for federations and show the
range: in Australia, horizontal fiscal imbalance drives a strong trend toward centralization, with
revenue sharing and allocations by formula (according to measures of regional fiscal capacity) in
transfers, grants, subventions and subsidies to sub-national governments. By contrast, in Canada,
problems of asymmetry have resulted in more autonomy of regional revenues: mining royalties are
allocated to the regions, for example, a considerable source of revenue from non-renewable
120.5 to 1.5% of GRP , http://stats.oecd.org/Index.aspx?DataSetCode=REV. 13See footnote 12. 14 Ahmad and Mottu (2003), p. 3; Broadway and Shah (1994); McLure (1983); Ter-Minassian (1997);
8
resources that is missing in Russia’s regional budgets. Also, Canada removes restrictions on how
provinces can raise money, and the federal level has taken over the unemployment program. In
Canada, mineral resource abundant regions thus have considerably more autonomy than in the
Russian Federation. Even so, all of these federations experience political pressure from provinces,
some favoring more autonomy and some, more equalization.
To continue, it is especially where endowments are uneven, as in Canada, Russia and
Australia, that most taxes on energy production and export collected at the federal level, since
the federal level can better absorb the uncertainty and volatility of oil prices. Searle (2007, p. 11)
summarizes: “the usual starting point in an allocation of revenue sources between levels of
government is that the level with the greatest fiscal capacity has the best tools for overcoming
fluctuations in revenue collections.” In this regard, taking oil extraction revenues away from the
regions is a preferred option: it promises to incentivize more efficient use of the profit, or
corporate income, tax, to diversify expenditures (Cottarelli, 2012). With oil, the aim is to
mitigate the threat of a regional “curse,” a phenomenon having a political aspect, where
influential lobbies secure tax privileges that affect regional budgets (Sachs and Warner 2001,
Papyrakis and Gerlagh 2007, Alexeev and Conrad 2009, Freinkman and Plekhanov 2009,
Walker 2013). Centralization aims to mitigate the curse, while guaranteeing comparable
services at comparable taxation and providing “insurance” for region-specific shocks.15
In regard to spending, similarly, Russia’s federation provides a range of transfer amounts:
in 2012, for example, in Russia, officially recorded transfers from the federal to regional level
averaged 20.8% of total income, but the range was 86.4% (Republic of Ingushetia) to 4.9 %
(Khanty-Mansiysk autonomous okrug).16
Among sources of support during the crisis for the
regions in Russia has been the Fund for Financial Support to regions with high deficits, and for
social expenditures. It is difficult to determine the “system” of allocations: rules exist, but they are
not always public information (Siluanov, Kadochnikov et al. 2009, Vartapetov 2010). IN general,
these transfers consist of: (1) equalization grants, or formula-based grants aimed building capacity
to deliver country-wide a standard level of services; (2) earmarked unconditional grants to finance
center-delegated spending and earmarked matching grants designed to co-finance regional
expenditures the federal government considers important; and (3) compensation grants, or one time
unconditional grants adjust above allocations (Vartapetov 2011).
The rigidity of recent decline in subsidies following the end of financial crisis is not a
15Otto, J. (2001). Fiscal Decentralization and Mining Taxation. Washington, D.C., World Bank Mining Group, Bishop, G. and A.
A. Shah (2011). Fiscal Federalism and Petroleum Resources in Iraq. Obstacles to Decentralization: Lessons from Selected
Countries" (Cheltenham, UK: Edward Elgar, 2011) 549. J. Marzquez and F. Vaillancourt. Cheltenham, UK, Edward Elgar. 16 Data regarding regional budgets are from the database of the Russian Federation Ministry of Finance and as reported by the
Russian state statistical agency (Rosstat).
9
specifically “Russian” phenomenon. Even in advanced economies, it is no easy matter to
demonstrate that decentralization is effective in producing growth (Iimi 2005, p. 449). KhMAO
seems one of those few regions (some 30% in the EU) likely to use transfers to promote growth:
normally this kind of effect is only expected where human capital is significant and institutions
are strong.17
In such economies, decentralized decision-making primarily is used to build
community-government relations. However, the impact on growth is uncertain (Allers and
Ishemoi 2011).18
In Russia, equalization is aimed to resolve both the inadequacy of some
territorial administration in the post-Soviet era as well as deeply embedded informal networks
that do, indeed, allow “rentier” regions (those with mineral resource abundance) to still derive
some rent revenue from “explicit and implicit taxation of extraction of mineral resources,
primarily oil and gas”(Desai, Freinkman et al. 2005, Freinkman, Plekhanov et al. 2005, Kumar,
Leigh et al. 2007). It is also important to note, that in Russia, there is a current expectation that
the government will supply services and there is support for the May decrees.19
By 2011, it was evident that fiscal regimes in the regions had successfully passed the
“stress test” of the financial crisis (Vartapetov 2011). By 2013, the funds extended during the
crisis were dramatically cut back incomes of regional budgets for the first 8 months of 2013,
transfers were 7% lower than in the previous year; corporate income tax also fell by 20%
less.20
Regions were encouraged to rely on credit to cover deficits. Regions (and municipalities)
began borrowing more heavily, albeit within strict limits, and some regions were allowed to do
so on international capital markets (Martinez-Vazquez and Searle , Martinez-Vazquez and
Timofeev 2008). This helped by 2011-2012 in reducing financial transfers to the weaker regions
and fostered hope of ending regional “dependency” on “non-reimbursable [bezvozmezdnye]”
federal subsidies (see Appendix Table 1). In its review of the budget in 2012, the Accounts
Chamber of the Russian Federation has recommended even more income to the regions, since
17 Ordinarily, it would not be expected that all or even most regions can turn transfers (targeted in Objective 1 in the EU, for
example, or funds for the poorest regions) into growth. A study reported for the EU in 2013, found “Only about 30 percent and
21 percent of the regions—those with sufficient human capital and good-enough institutions—are able to turn transfers into faster
per capita income growth and per capita investment, respectively.” See Becker, S. O., P. H. Egger and M. von Ehrlich (2013).
"Absorptive Capacity and the Growth and Investment Effects of Regional Transfers: A Regression Discontinuity Design with
Heterogeneous Treatment Effects." American Economic Journal-Economic Policy 5(4): 29-77. 18Arguments in favor of decentralization-- effective governance, preservation of cultural and ethnic identity, and growth are not
always based on an empirical foundation. See Rodriguez-Pose, A. and R. Sandall (2008). "From identity to the economy:
analysing the evolution of the decentralisation discourse." Environment and Planning C-Government and Policy 26(1): 54-72. In
any case, as Musgove (1997, p. 66 shows, a country’s particular objectives determine the degree of devolution: “the case for or
against devolution cannot be made in general terms. Distinctions have to be drawn between the various taxing and spending
functions which government performs.” . 19 Population surveys of how budgets are implemented show some positive results. Surveys show only 35% was satisfied with
administrative effectiveness in de facto privatized health care, but 63% was satisfied in the sphere of education. “Ob otsenke
effektivnosti deiatel’nosti organov ispolnitelnoi vlasti subijektove Rossiiskoi Federatsii,” as determined by regulation of 15 April
2009, 2011, no 322. 20 Cherniavskii A., “Regioinal’nye biudzhety v period stagnatsii,” Novyj KGB (Kommentarii o Gosudarstve i Biznese), Centre of
Development Institute, National Research University - Higher School of Economics, 5–18 October 2013, (URL:
http://www.hse.ru/data/2013/10/23/1280159682/bd_13-16.pdf, accessed 27.01.2014)).
10
regional indebtedness was rapidly becoming the main issue.21
Current reform emphasizes
indepence on the part of regions, local initiative in attracting investment resources, competition
among regions, and greater efficiency (Siluanov 2011).22
Case study: Khanty-Mansiysk autonomous okrug
Background: Resource Regions in Russia
Risk in oil abundant regions is generally viewed as a potential curse, similar to how it is
viewed for countries: it can lower the rate of growth level over the long term and hollow out the
non-oil sector (Sachs and Warner 2001, Papyrakis and Gerlagh 2007, Alexeev and Conrad 2009,
Freinkman and Plekhanov 2009, Walker 2013). Alexeev and Conrad (2009) argue that
empirically in a survey of countries this threat is not born out.
Certainly, in regard to regions of Russia the sustained rapid pace of growth of the ten
leading (resource rich) regions from 1992 is clear: the pace of growth in these regions in 1992
exceeded those in the slowest growing regions by 2.5 times; in 2000 the ratio was 3.2 times.
They are still growing steady with budgets in surplus, low debts and an enviable standard of
living. These regions have led others in attracting investment. To be sure, there is a threat. If the
oil sector loses its productive potential and/or oil prices dramatically fall, the region could suffer
a number of consequences: a plunge in the corporate and private income tax, outmigration of
highly mobile unemployed labor and decreased producitivty of fields and mines.
In regard to public administration, budgets are fragile because they are dependent on the
profit tax. The budget of KhMAO in 2012, this tax formed 40.6%, and in 2013-2015, 43.5% of
okrug revenues.23
The extent of revenues from the profit and income tax is characteristic for
“resource regions,” characterized by a significant endowment of globally traded natural
resources, unusually adverse natural and climatic conditions creating high transport costs; steep
infrastructure (including transportation) requirements for production; low population density and
extensive casual migrant labor. An exacting taxonomy is debated, but most simply, they are a
21 The Accounts Chamber of the Russian Federation recommended that regional allocations from taxes be increased in percent,
that only regions be allowed to establish tax exemptions for firms (a loss in 2012 of some 200 bln rubles to the regions from
federal regulations), and that—as soon as the cadastral survey was complete—that individual property tax on expensive real
estate be raised. ZakliuchenieSchetnoipalatyRossiiskoiFederatsiinaproektfederal’nogozakona “O federal’nombiudzhetena 2013
god I naplanovyi period 2014 i 2015 gg.” (8 October 2012), No ZAM, 26/01, (protocol ot 5 oktiabria 2012 g. No 41K (874),
Accounts Chamber of the Russian Federation, pp. 263-267. 22 Diversifying Russia (EBRD 2013) shows results from the World Bank survey from 2012, the Doing Business Subnational
survey, covering 30 Russian cities for region-specific regulations and practices that matter most: starting a business; dealing with
construction permits; registering property; and gaining access to electricity and for the latest round of the Business Environment
and Enterprise Performance Survey (BEEPS) carried out by by the EBRD and the World Bank (the fifth round of that survey
(2011-12), covering about 4,000 manufacturing and service sector firms in Russia, with respondents in all federal districts and
representative samples for 37 of Russia’s 83 regions.2 23 V. V. Korosteleva and T. A. Kurbanova, “Rol’ nalogov v ykh dokhodov v biud]ete subijekta RF (na primere Khanty-
Mansiyskogo Avtonomnogo Okruga - Yugry),” SiBAK, (URL: http://sibac.info/index.php/2009-07-01-10-21-16/4315-2012-10-
22-04-02-12, accessed 27.01.2014).
11
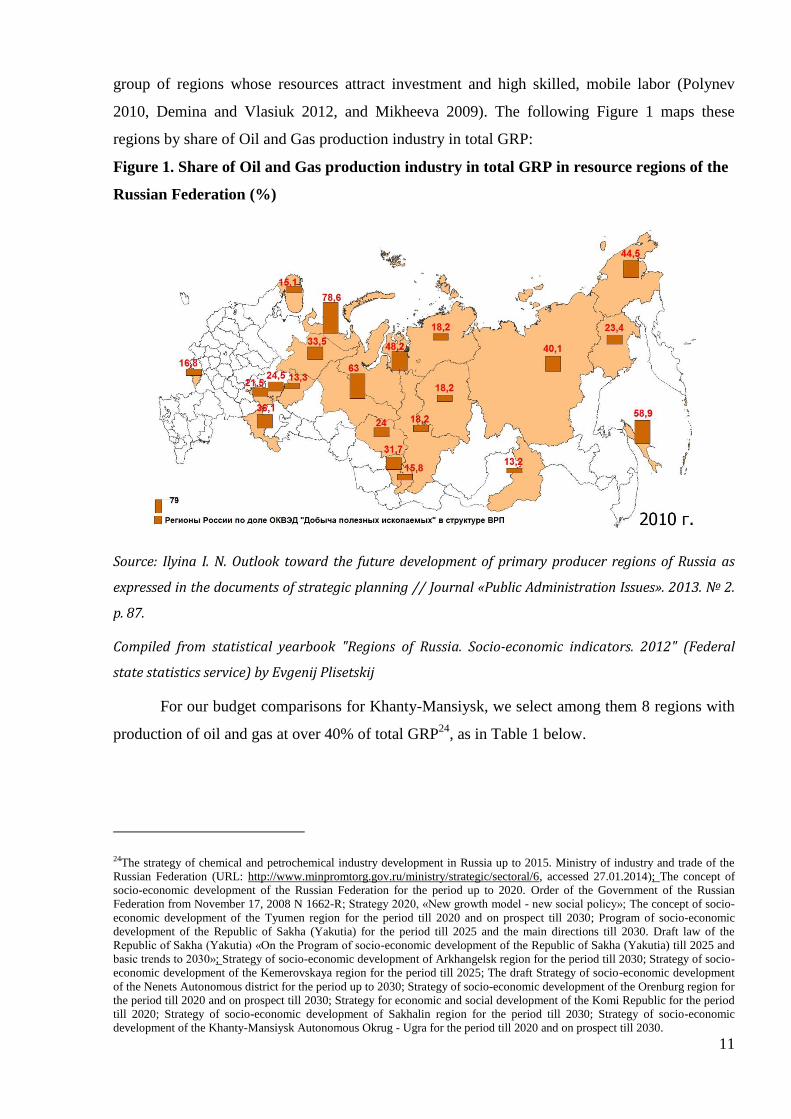
group of regions whose resources attract investment and high skilled, mobile labor (Polynev
2010, Demina and Vlasiuk 2012, and Mikheeva 2009). The following Figure 1 maps these
regions by share of Oil and Gas production industry in total GRP:
Figure 1. Share of Oil and Gas production industry in total GRP in resource regions of the
Russian Federation (%)
Source: Ilyina I. N. Outlook toward the future development of primary producer regions of Russia as
expressed in the documents of strategic planning // Journal «Public Administration Issues». 2013. № 2.
p. 87.
Compiled from statistical yearbook "Regions of Russia. Socio-economic indicators. 2012" (Federal
state statistics service) by Evgenij Plisetskij
For our budget comparisons for Khanty-Mansiysk, we select among them 8 regions with
production of oil and gas at over 40% of total GRP24
, as in Table 1 below.
24The strategy of chemical and petrochemical industry development in Russia up to 2015. Ministry of industry and trade of the
Russian Federation (URL: http://www.minpromtorg.gov.ru/ministry/strategic/sectoral/6, accessed 27.01.2014); The concept of
socio-economic development of the Russian Federation for the period up to 2020. Order of the Government of the Russian
Federation from November 17, 2008 N 1662-R; Strategy 2020, «New growth model - new social policy»; The concept of socio-
economic development of the Tyumen region for the period till 2020 and on prospect till 2030; Program of socio-economic
development of the Republic of Sakha (Yakutia) for the period till 2025 and the main directions till 2030. Draft law of the
Republic of Sakha (Yakutia) «On the Program of socio-economic development of the Republic of Sakha (Yakutia) till 2025 and
basic trends to 2030»; Strategy of socio-economic development of Arkhangelsk region for the period till 2030; Strategy of socio-
economic development of the Kemerovskaya region for the period till 2025; The draft Strategy of socio-economic development
of the Nenets Autonomous district for the period up to 2030; Strategy of socio-economic development of the Orenburg region for
the period till 2020 and on prospect till 2030; Strategy for economic and social development of the Komi Republic for the period
till 2020; Strategy of socio-economic development of Sakhalin region for the period till 2030; Strategy of socio-economic
development of the Khanty-Mansiysk Autonomous Okrug - Ugra for the period till 2020 and on prospect till 2030.
12
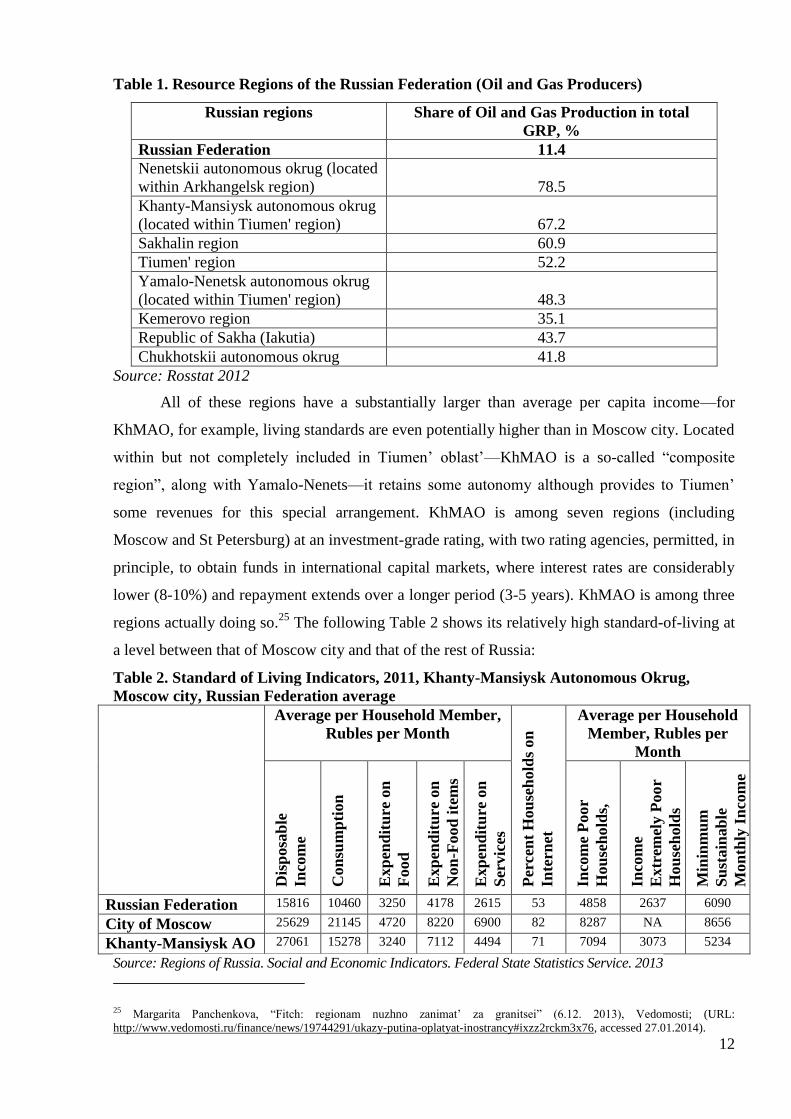
Table 1. Resource Regions of the Russian Federation (Oil and Gas Producers)
Russian regions Share of Oil and Gas Production in total
GRP, %
Russian Federation 11.4
Nenetskii autonomous okrug (located
within Arkhangelsk region) 78.5
Khanty-Mansiysk autonomous okrug
(located within Tiumen' region) 67.2
Sakhalin region 60.9
Tiumen' region 52.2
Yamalo-Nenetsk autonomous okrug
(located within Tiumen' region) 48.3
Kemerovo region 35.1
Republic of Sakha (Iakutia) 43.7
Chukhotskii autonomous okrug 41.8
Source: Rosstat 2012
All of these regions have a substantially larger than average per capita income—for
KhMAO, for example, living standards are even potentially higher than in Moscow city. Located
within but not completely included in Tiumen’ oblast’—KhMAO is a so-called “composite
region”, along with Yamalo-Nenets—it retains some autonomy although provides to Tiumen’
some revenues for this special arrangement. KhMAO is among seven regions (including
Moscow and St Petersburg) at an investment-grade rating, with two rating agencies, permitted, in
principle, to obtain funds in international capital markets, where interest rates are considerably
lower (8-10%) and repayment extends over a longer period (3-5 years). KhMAO is among three
regions actually doing so.25
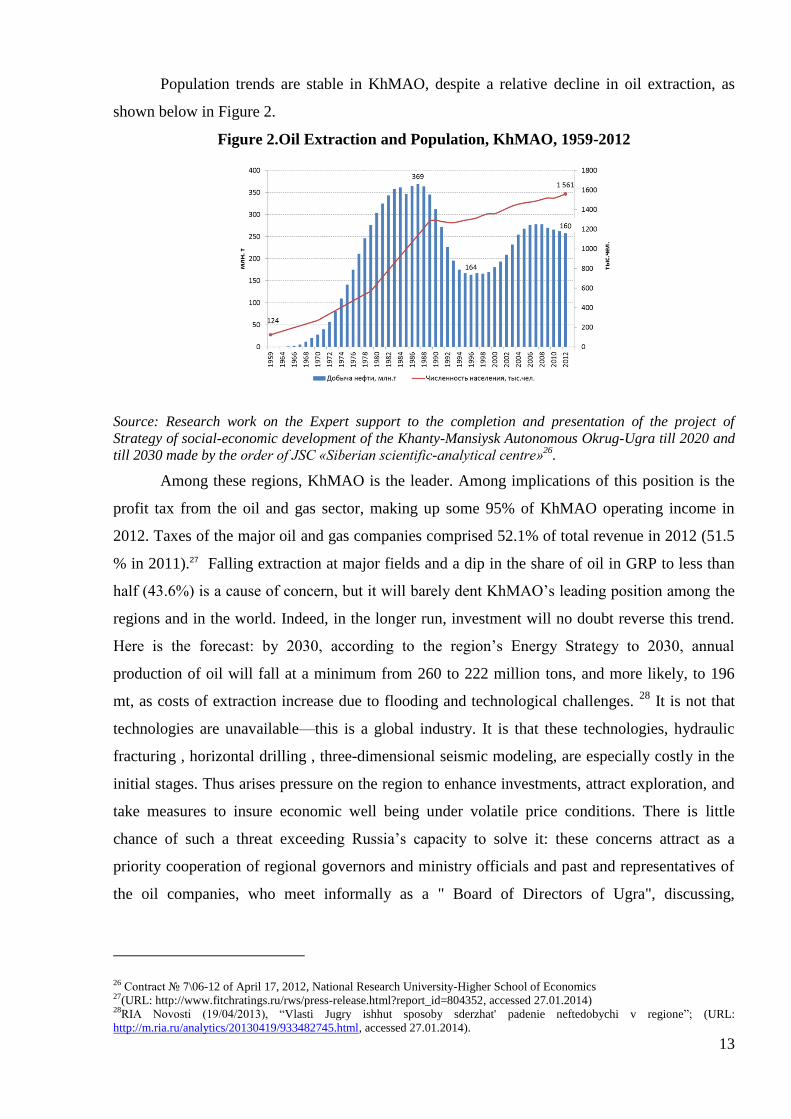
The following Table 2 shows its relatively high standard-of-living at
a level between that of Moscow city and that of the rest of Russia:
Table 2. Standard of Living Indicators, 2011, Khanty-Mansiysk Autonomous Okrug,
Moscow city, Russian Federation average
Average per Household Member,
Rubles per Month
Per
cen
t H
ou
seh
old
s on
Inte
rnet
Average per Household
Member, Rubles per
Month
Dis
posa
ble
Inco
me
Con
sum
pti
on
Exp
end
itu
re o
n
Food
Exp
end
itu
re o
n
Non
-Food
ite
ms
Exp
end
itu
re o
n
Ser
vic
es
Inco
me
Poor
Hou
seh
old
s,
Inco
me
Extr
emel
y P
oo
r
Hou
seh
old
s
Min
inm
um
Su
stain
ab
le
Mon
thly
In
com
e
Set
by R
egio
n
Russian Federation 15816 10460 3250 4178 2615 53 4858 2637 6090
City of Moscow 25629 21145 4720 8220 6900 82 8287 NA 8656
Khanty-Mansiysk AO 27061 15278 3240 7112 4494 71 7094 3073 5234
Source: Regions of Russia. Social and Economic Indicators. Federal State Statistics Service. 2013
25 Margarita Panchenkova, “Fitch: regionam nuzhno zanimat’ za granitsei” (6.12. 2013), Vedomosti; (URL:
http://www.vedomosti.ru/finance/news/19744291/ukazy-putina-oplatyat-inostrancy#ixzz2rckm3x76, accessed 27.01.2014).
13
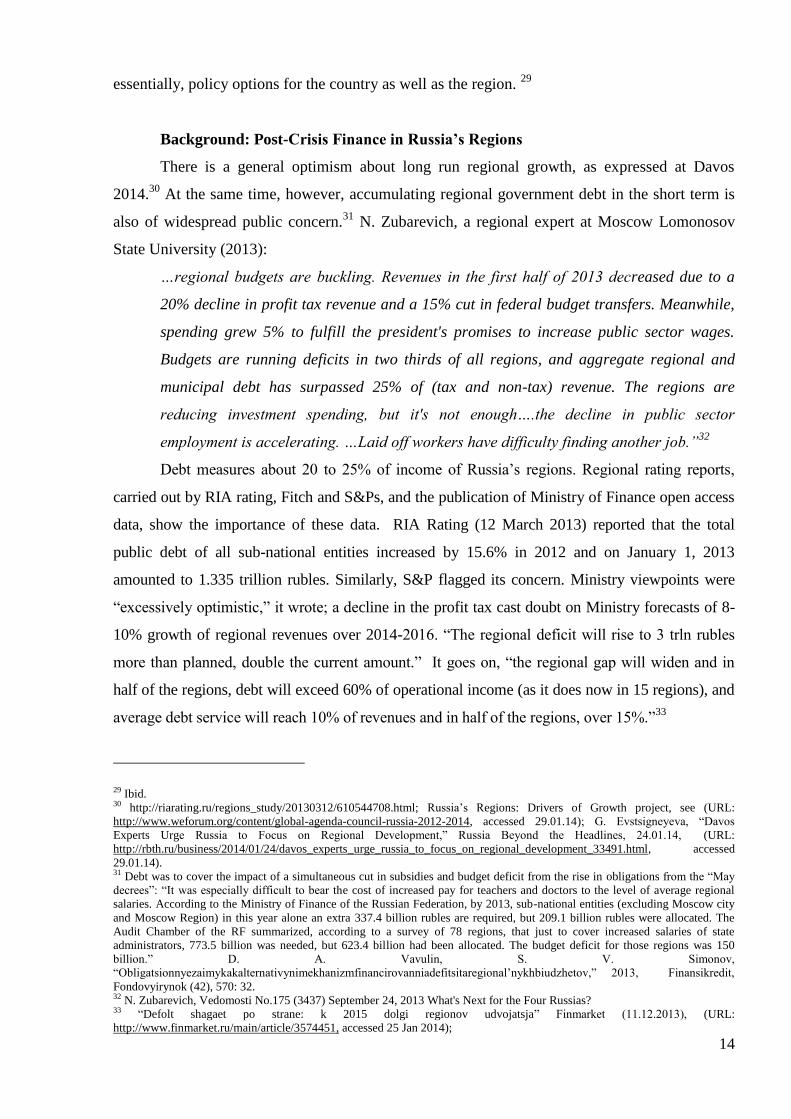
Population trends are stable in KhMAO, despite a relative decline in oil extraction, as
shown below in Figure 2.
Figure 2.Oil Extraction and Population, KhMAO, 1959-2012
Source: Research work on the Expert support to the completion and presentation of the project of
Strategy of social-economic development of the Khanty-Mansiysk Autonomous Okrug-Ugra till 2020 and
till 2030 made by the order of JSC «Siberian scientific-analytical centre»26
.
Among these regions, KhMAO is the leader. Among implications of this position is the
profit tax from the oil and gas sector, making up some 95% of KhMAO operating income in
2012. Taxes of the major oil and gas companies comprised 52.1% of total revenue in 2012 (51.5
% in 2011).27 Falling extraction at major fields and a dip in the share of oil in GRP to less than
half (43.6%) is a cause of concern, but it will barely dent KhMAO’s leading position among the
regions and in the world. Indeed, in the longer run, investment will no doubt reverse this trend.
Here is the forecast: by 2030, according to the region’s Energy Strategy to 2030, annual
production of oil will fall at a minimum from 260 to 222 million tons, and more likely, to 196
mt, as costs of extraction increase due to flooding and technological challenges. 28
It is not that
technologies are unavailable—this is a global industry. It is that these technologies, hydraulic
fracturing , horizontal drilling , three-dimensional seismic modeling, are especially costly in the
initial stages. Thus arises pressure on the region to enhance investments, attract exploration, and
take measures to insure economic well being under volatile price conditions. There is little
chance of such a threat exceeding Russia’s capacity to solve it: these concerns attract as a
priority cooperation of regional governors and ministry officials and past and representatives of
the oil companies, who meet informally as a " Board of Directors of Ugra", discussing,
26 Contract № 7\06-12 of April 17, 2012, National Research University-Higher School of Economics 27(URL: http://www.fitchratings.ru/rws/press-release.html?report_id=804352, accessed 27.01.2014) 28RIA Novosti (19/04/2013), “Vlasti Jugry ishhut sposoby sderzhat' padenie neftedobychi v regione”; (URL:
http://m.ria.ru/analytics/20130419/933482745.html, accessed 27.01.2014).
14
essentially, policy options for the country as well as the region. 29
Background: Post-Crisis Finance in Russia’s Regions
There is a general optimism about long run regional growth, as expressed at Davos
2014.30
At the same time, however, accumulating regional government debt in the short term is
also of widespread public concern.31
N. Zubarevich, a regional expert at Moscow Lomonosov
State University (2013):
…regional budgets are buckling. Revenues in the first half of 2013 decreased due to a
20% decline in profit tax revenue and a 15% cut in federal budget transfers. Meanwhile,
spending grew 5% to fulfill the president's promises to increase public sector wages.
Budgets are running deficits in two thirds of all regions, and aggregate regional and
municipal debt has surpassed 25% of (tax and non-tax) revenue. The regions are
reducing investment spending, but it's not enough….the decline in public sector
employment is accelerating. …Laid off workers have difficulty finding another job.”32
Debt measures about 20 to 25% of income of Russia’s regions. Regional rating reports,
carried out by RIA rating, Fitch and S&Ps, and the publication of Ministry of Finance open access
data, show the importance of these data. RIA Rating (12 March 2013) reported that the total
public debt of all sub-national entities increased by 15.6% in 2012 and on January 1, 2013
amounted to 1.335 trillion rubles. Similarly, S&P flagged its concern. Ministry viewpoints were
“excessively optimistic,” it wrote; a decline in the profit tax cast doubt on Ministry forecasts of 8-
10% growth of regional revenues over 2014-2016. “The regional deficit will rise to 3 trln rubles
more than planned, double the current amount.” It goes on, “the regional gap will widen and in
half of the regions, debt will exceed 60% of operational income (as it does now in 15 regions), and
average debt service will reach 10% of revenues and in half of the regions, over 15%.”33
29 Ibid. 30 http://riarating.ru/regions_study/20130312/610544708.html; Russia’s Regions: Drivers of Growth project, see (URL:
http://www.weforum.org/content/global-agenda-council-russia-2012-2014, accessed 29.01.14); G. Evstsigneyeva, “Davos
Experts Urge Russia to Focus on Regional Development,” Russia Beyond the Headlines, 24.01.14, (URL:
http://rbth.ru/business/2014/01/24/davos_experts_urge_russia_to_focus_on_regional_development_33491.html, accessed
29.01.14). 31 Debt was to cover the impact of a simultaneous cut in subsidies and budget deficit from the rise in obligations from the “May
decrees”: “It was especially difficult to bear the cost of increased pay for teachers and doctors to the level of average regional
salaries. According to the Ministry of Finance of the Russian Federation, by 2013, sub-national entities (excluding Moscow city
and Moscow Region) in this year alone an extra 337.4 billion rubles are required, but 209.1 billion rubles were allocated. The
Audit Chamber of the RF summarized, according to a survey of 78 regions, that just to cover increased salaries of state
administrators, 773.5 billion was needed, but 623.4 billion had been allocated. The budget deficit for those regions was 150
billion.” D. A. Vavulin, S. V. Simonov,
“Obligatsionnyezaimykakalternativynimekhanizmfinancirovanniadefitsitaregional’nykhbiudzhetov,” 2013, Finansikredit,
Fondovyirynok (42), 570: 32. 32 N. Zubarevich, Vedomosti No.175 (3437) September 24, 2013 What's Next for the Four Russias? 33 “Defolt shagaet po strane: k 2015 dolgi regionov udvojatsja” Finmarket (11.12.2013), (URL:
http://www.finmarket.ru/main/article/3574451, accessed 25 Jan 2014);
15
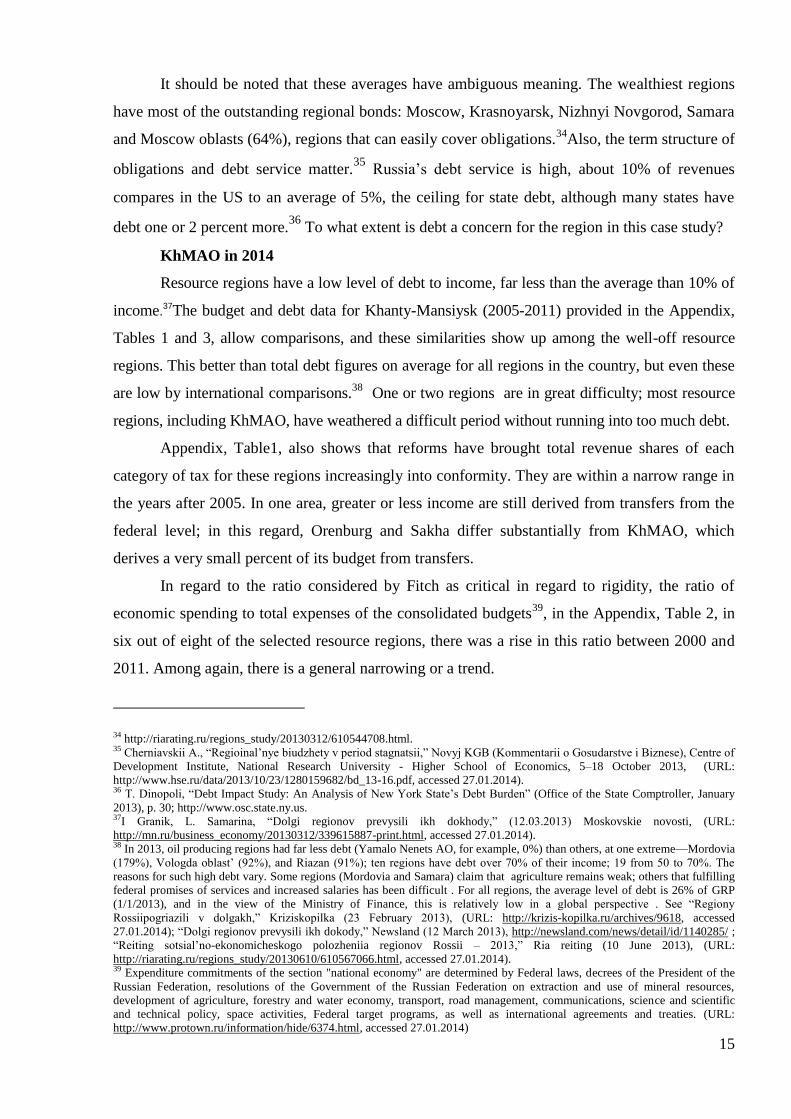
It should be noted that these averages have ambiguous meaning. The wealthiest regions
have most of the outstanding regional bonds: Moscow, Krasnoyarsk, Nizhnyi Novgorod, Samara
and Moscow oblasts (64%), regions that can easily cover obligations.34
Also, the term structure of
obligations and debt service matter.35
Russia’s debt service is high, about 10% of revenues
compares in the US to an average of 5%, the ceiling for state debt, although many states have
debt one or 2 percent more.36
To what extent is debt a concern for the region in this case study?
KhMAO in 2014
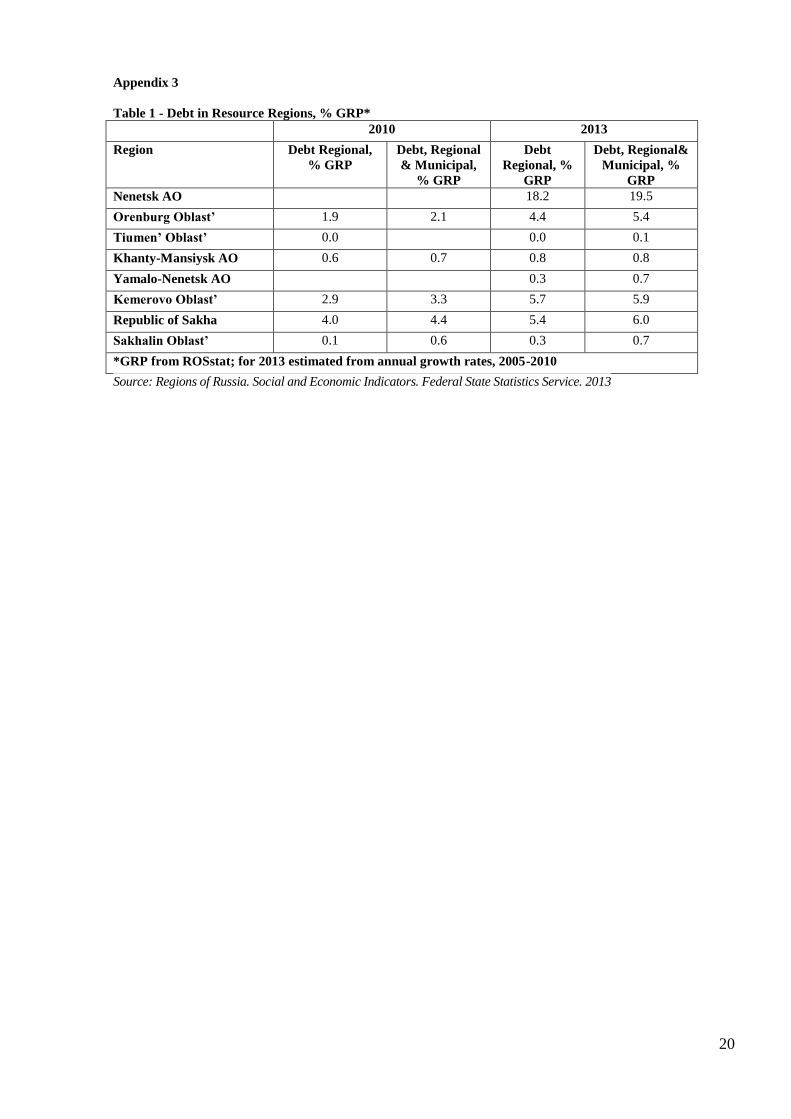
Resource regions have a low level of debt to income, far less than the average than 10% of
income.37The budget and debt data for Khanty-Mansiysk (2005-2011) provided in the Appendix,
Tables 1 and 3, allow comparisons, and these similarities show up among the well-off resource
regions. This better than total debt figures on average for all regions in the country, but even these
are low by international comparisons.38
One or two regions are in great difficulty; most resource
regions, including KhMAO, have weathered a difficult period without running into too much debt.
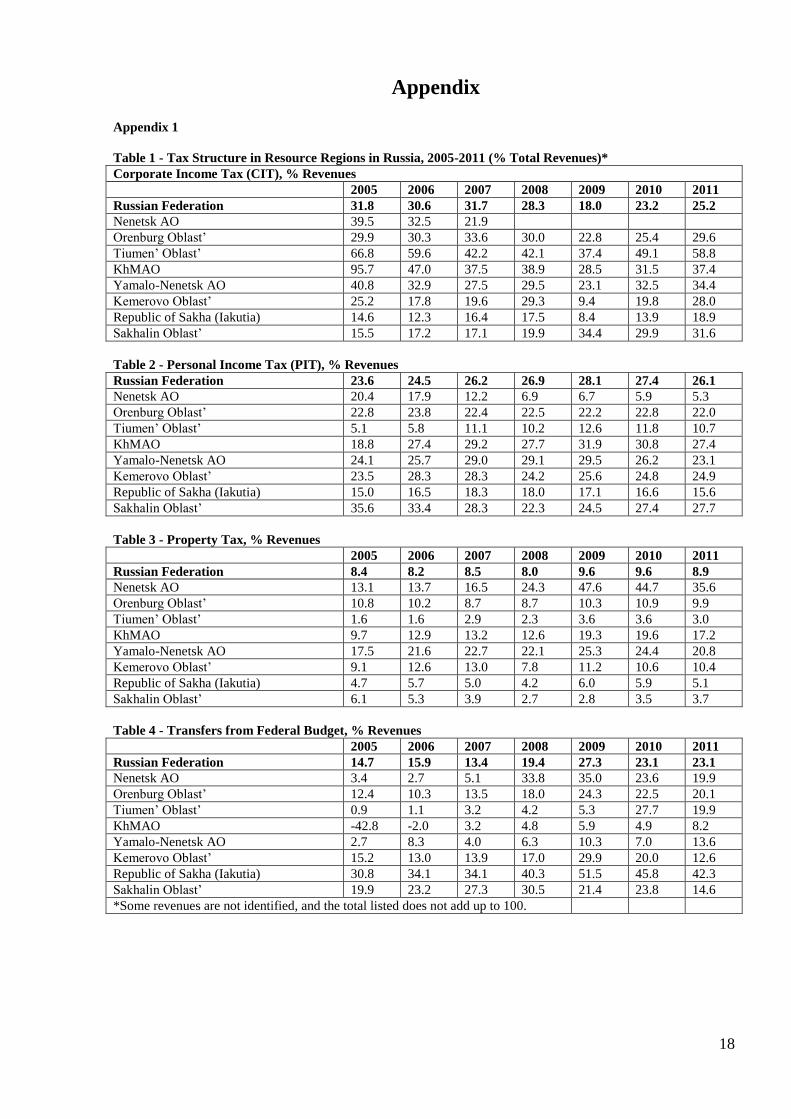
Appendix, Table1, also shows that reforms have brought total revenue shares of each
category of tax for these regions increasingly into conformity. They are within a narrow range in
the years after 2005. In one area, greater or less income are still derived from transfers from the
federal level; in this regard, Orenburg and Sakha differ substantially from KhMAO, which
derives a very small percent of its budget from transfers.
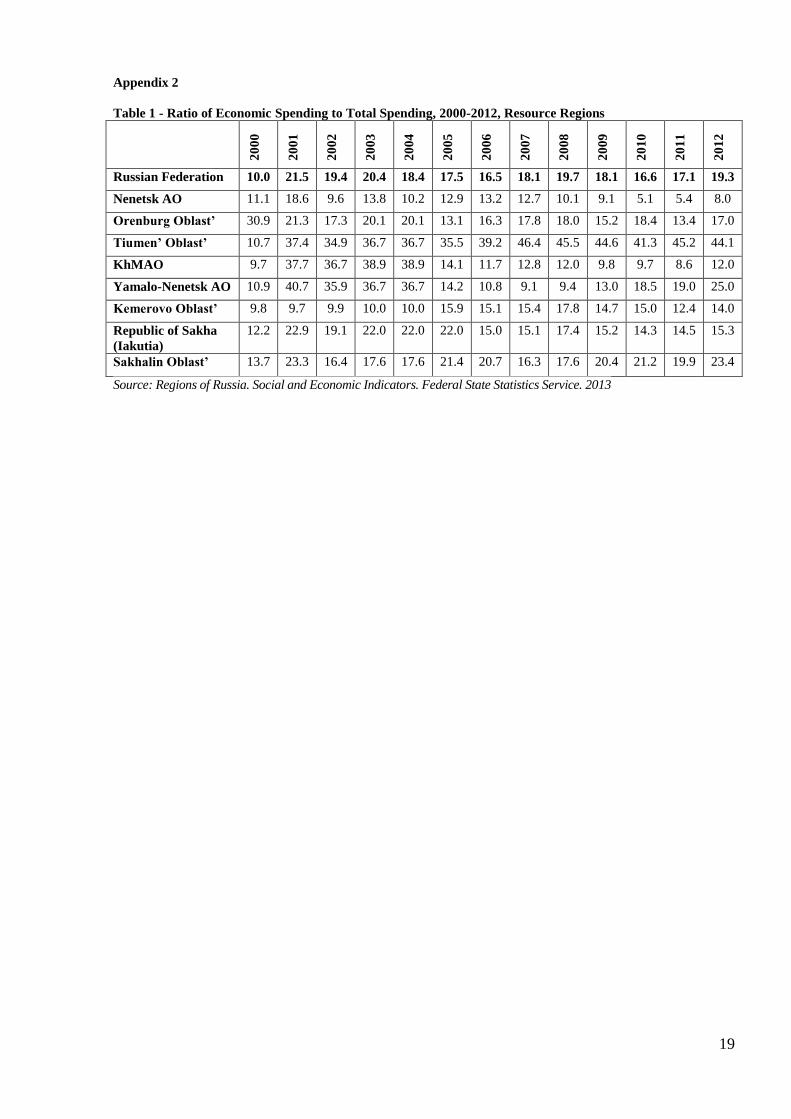
In regard to the ratio considered by Fitch as critical in regard to rigidity, the ratio of
economic spending to total expenses of the consolidated budgets39
, in the Appendix, Table 2, in
six out of eight of the selected resource regions, there was a rise in this ratio between 2000 and
2011. Among again, there is a general narrowing or a trend.
34 http://riarating.ru/regions_study/20130312/610544708.html. 35 Cherniavskii A., “Regioinal’nye biudzhety v period stagnatsii,” Novyj KGB (Kommentarii o Gosudarstve i Biznese), Centre of
Development Institute, National Research University - Higher School of Economics, 5–18 October 2013, (URL:
http://www.hse.ru/data/2013/10/23/1280159682/bd_13-16.pdf, accessed 27.01.2014). 36 T. Dinopoli, “Debt Impact Study: An Analysis of New York State’s Debt Burden” (Office of the State Comptroller, January
2013), p. 30; http://www.osc.state.ny.us. 37I Granik, L. Samarina, “Dolgi regionov prevysili ikh dokhody,” (12.03.2013) Moskovskie novosti, (URL:
http://mn.ru/business_economy/20130312/339615887-print.html, accessed 27.01.2014). 38 In 2013, oil producing regions had far less debt (Yamalo Nenets AO, for example, 0%) than others, at one extreme—Mordovia
(179%), Vologda oblast’ (92%), and Riazan (91%); ten regions have debt over 70% of their income; 19 from 50 to 70%. The
reasons for such high debt vary. Some regions (Mordovia and Samara) claim that agriculture remains weak; others that fulfilling
federal promises of services and increased salaries has been difficult . For all regions, the average level of debt is 26% of GRP
(1/1/2013), and in the view of the Ministry of Finance, this is relatively low in a global perspective . See “Regiony
Rossiipogriazili v dolgakh,” Kriziskopilka (23 February 2013), (URL: http://krizis-kopilka.ru/archives/9618, accessed
27.01.2014); “Dolgi regionov prevysili ikh dokody,” Newsland (12 March 2013), http://newsland.com/news/detail/id/1140285/ ;
“Reiting sotsial’no-ekonomicheskogo polozheniia regionov Rossii – 2013,” Ria reiting (10 June 2013), (URL:
http://riarating.ru/regions_study/20130610/610567066.html, accessed 27.01.2014). 39 Expenditure commitments of the section "national economy" are determined by Federal laws, decrees of the President of the
Russian Federation, resolutions of the Government of the Russian Federation on extraction and use of mineral resources,
development of agriculture, forestry and water economy, transport, road management, communications, science and scientific
and technical policy, space activities, Federal target programs, as well as international agreements and treaties. (URL:
http://www.protown.ru/information/hide/6374.html, accessed 27.01.2014)
16
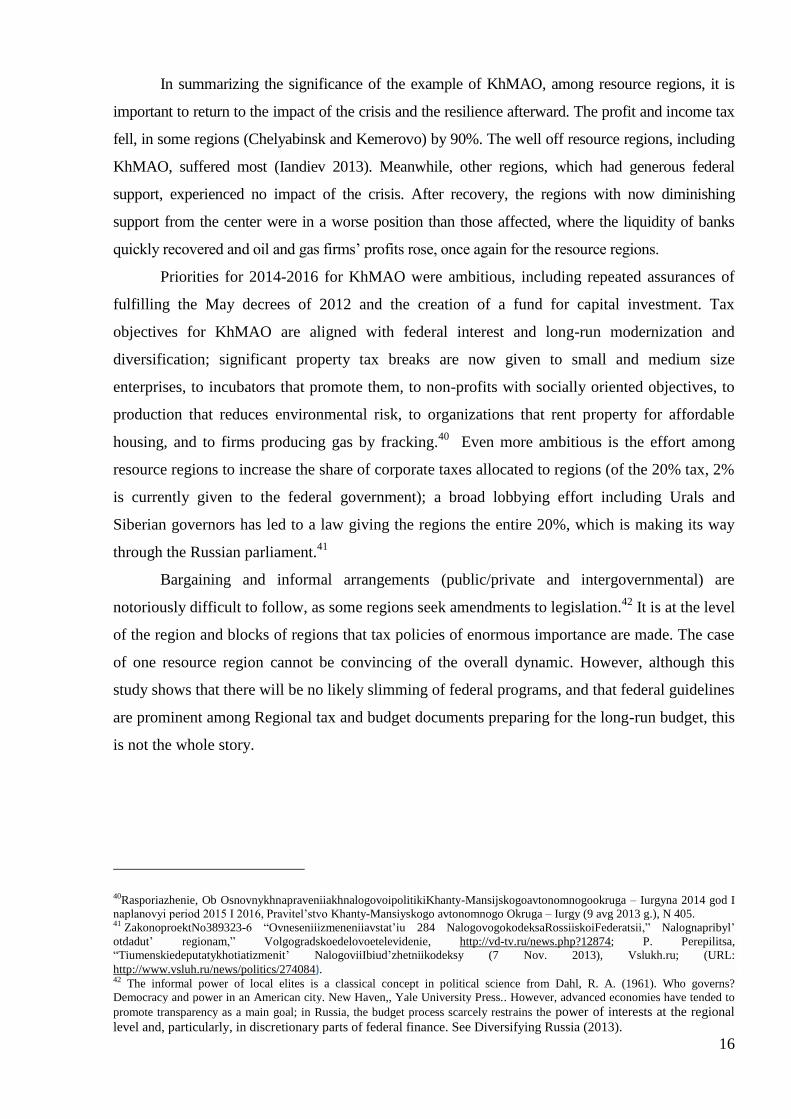
In summarizing the significance of the example of KhMAO, among resource regions, it is
important to return to the impact of the crisis and the resilience afterward. The profit and income tax
fell, in some regions (Chelyabinsk and Kemerovo) by 90%. The well off resource regions, including
KhMAO, suffered most (Iandiev 2013). Meanwhile, other regions, which had generous federal
support, experienced no impact of the crisis. After recovery, the regions with now diminishing
support from the center were in a worse position than those affected, where the liquidity of banks
quickly recovered and oil and gas firms’ profits rose, once again for the resource regions.
Priorities for 2014-2016 for KhMAO were ambitious, including repeated assurances of
fulfilling the May decrees of 2012 and the creation of a fund for capital investment. Tax
objectives for KhMAO are aligned with federal interest and long-run modernization and
diversification; significant property tax breaks are now given to small and medium size
enterprises, to incubators that promote them, to non-profits with socially oriented objectives, to
production that reduces environmental risk, to organizations that rent property for affordable
housing, and to firms producing gas by fracking.40
Even more ambitious is the effort among
resource regions to increase the share of corporate taxes allocated to regions (of the 20% tax, 2%
is currently given to the federal government); a broad lobbying effort including Urals and
Siberian governors has led to a law giving the regions the entire 20%, which is making its way
through the Russian parliament.41
Bargaining and informal arrangements (public/private and intergovernmental) are
notoriously difficult to follow, as some regions seek amendments to legislation.42
It is at the level
of the region and blocks of regions that tax policies of enormous importance are made. The case
of one resource region cannot be convincing of the overall dynamic. However, although this
study shows that there will be no likely slimming of federal programs, and that federal guidelines
are prominent among Regional tax and budget documents preparing for the long-run budget, this
is not the whole story.
40Rasporiazhenie, Ob OsnovnykhnapraveniiakhnalogovoipolitikiKhanty-Mansijskogoavtonomnogookruga – Iurgyna 2014 god I
naplanovyi period 2015 I 2016, Pravitel’stvo Khanty-Mansiyskogo avtonomnogo Okruga – Iurgy (9 avg 2013 g.), N 405. 41 ZakonoproektNo389323-6 “Ovneseniiizmeneniiavstat’iu 284 NalogovogokodeksaRossiiskoiFederatsii,” Nalognapribyl’
otdadut’ regionam,” Volgogradskoedelovoetelevidenie, http://vd-tv.ru/news.php?12874; P. Perepilitsa,
“Tiumenskiedeputatykhotiatizmenit’ NalogoviiIbiud’zhetniikodeksy (7 Nov. 2013), Vslukh.ru; (URL:
http://www.vsluh.ru/news/politics/274084). 42 The informal power of local elites is a classical concept in political science from Dahl, R. A. (1961). Who governs?
Democracy and power in an American city. New Haven,, Yale University Press.. However, advanced economies have tended to
promote transparency as a main goal; in Russia, the budget process scarcely restrains the power of interests at the regional
level and, particularly, in discretionary parts of federal finance. See Diversifying Russia (2013).
17
Conclusion
There is a major EU investigative effort to discover factors in regional resilience, as
illustrated in a one report (October 2012, the European Commission’s brief on ‘The EU
approach to resilience’), which will be developed into an EC action plan. This paper has focused
on budgetary resilience in some of the regions hardest hit by the recent financial crisis (2008-
2009). The budget for these years in the context of the medium run shows that these donor
regions suffered a temporary decline in income (substantial fall in corporate and personal income
tax receipts) and without taking on much credit, reestablished surplus budgets while also
covering the new 2012 requirements of increased salaries and other obligations announced in
President Putin’s “May decrees”. The resilience of most of these regions was due in the short
run to two main factors: the lack of dependence before the crisis on budgetary subsidies, whose
reduction within a few years after the crisis had, therefore, almost no effect, and relative rapid
restoration of adequate receipts from the CIT.
In the longer run, the resilience of resource regions, such as KhMAO, with their overall
steady growth, despite volatility in oil prices, arguably is due geopolitical factors, which attract
energy producers and industrial giants other than in the oil sector, and the business environemnt,
including steady maintenance of a higher standard of living and skills attracted in new clusters,
which are supported by innovation-oriented budgets. The findings here, however, also include,
even more fundamentally, an evolving cooperative federalist agenda, with groups of regions
acting together to secure negotiated decisions on tax allocations and spending requirements.
Supportive of the conclusion in Chebankova (2008), the term adaptive federalism applies to
finance, and compels a rethinking of the concept of fiscal rigidity as applied to the Russian
Federation.
18
Appendix
Appendix 1
Table 1 - Tax Structure in Resource Regions in Russia, 2005-2011 (% Total Revenues)*
Corporate Income Tax (CIT), % Revenues
2005 2006 2007 2008 2009 2010 2011
Russian Federation 31.8 30.6 31.7 28.3 18.0 23.2 25.2
Nenetsk AO 39.5 32.5 21.9
Orenburg Oblast’ 29.9 30.3 33.6 30.0 22.8 25.4 29.6
Tiumen’ Oblast’ 66.8 59.6 42.2 42.1 37.4 49.1 58.8
KhMAO 95.7 47.0 37.5 38.9 28.5 31.5 37.4
Yamalo-Nenetsk AO 40.8 32.9 27.5 29.5 23.1 32.5 34.4
Kemerovo Oblast’ 25.2 17.8 19.6 29.3 9.4 19.8 28.0
Republic of Sakha (Iakutia) 14.6 12.3 16.4 17.5 8.4 13.9 18.9
Sakhalin Oblast’ 15.5 17.2 17.1 19.9 34.4 29.9 31.6
Table 2 - Personal Income Tax (PIT), % Revenues
Russian Federation 23.6 24.5 26.2 26.9 28.1 27.4 26.1
Nenetsk AO 20.4 17.9 12.2 6.9 6.7 5.9 5.3
Orenburg Oblast’ 22.8 23.8 22.4 22.5 22.2 22.8 22.0
Tiumen’ Oblast’ 5.1 5.8 11.1 10.2 12.6 11.8 10.7
KhMAO 18.8 27.4 29.2 27.7 31.9 30.8 27.4
Yamalo-Nenetsk AO 24.1 25.7 29.0 29.1 29.5 26.2 23.1
Kemerovo Oblast’ 23.5 28.3 28.3 24.2 25.6 24.8 24.9
Republic of Sakha (Iakutia) 15.0 16.5 18.3 18.0 17.1 16.6 15.6
Sakhalin Oblast’ 35.6 33.4 28.3 22.3 24.5 27.4 27.7
Table 3 - Property Tax, % Revenues
2005 2006 2007 2008 2009 2010 2011
Russian Federation 8.4 8.2 8.5 8.0 9.6 9.6 8.9
Nenetsk AO 13.1 13.7 16.5 24.3 47.6 44.7 35.6
Orenburg Oblast’ 10.8 10.2 8.7 8.7 10.3 10.9 9.9
Tiumen’ Oblast’ 1.6 1.6 2.9 2.3 3.6 3.6 3.0
KhMAO 9.7 12.9 13.2 12.6 19.3 19.6 17.2
Yamalo-Nenetsk AO 17.5 21.6 22.7 22.1 25.3 24.4 20.8
Kemerovo Oblast’ 9.1 12.6 13.0 7.8 11.2 10.6 10.4
Republic of Sakha (Iakutia) 4.7 5.7 5.0 4.2 6.0 5.9 5.1
Sakhalin Oblast’ 6.1 5.3 3.9 2.7 2.8 3.5 3.7
Table 4 - Transfers from Federal Budget, % Revenues
2005 2006 2007 2008 2009 2010 2011
Russian Federation 14.7 15.9 13.4 19.4 27.3 23.1 23.1
Nenetsk AO 3.4 2.7 5.1 33.8 35.0 23.6 19.9
Orenburg Oblast’ 12.4 10.3 13.5 18.0 24.3 22.5 20.1
Tiumen’ Oblast’ 0.9 1.1 3.2 4.2 5.3 27.7 19.9
KhMAO -42.8 -2.0 3.2 4.8 5.9 4.9 8.2
Yamalo-Nenetsk AO 2.7 8.3 4.0 6.3 10.3 7.0 13.6
Kemerovo Oblast’ 15.2 13.0 13.9 17.0 29.9 20.0 12.6
Republic of Sakha (Iakutia) 30.8 34.1 34.1 40.3 51.5 45.8 42.3
Sakhalin Oblast’ 19.9 23.2 27.3 30.5 21.4 23.8 14.6
*Some revenues are not identified, and the total listed does not add up to 100.
19
Appendix 2
Table 1 - Ratio of Economic Spending to Total Spending, 2000-2012, Resource Regions
20
00
20
01
20
02
20
03
20
04
20
05
20
06
20
07
20
08
20
09
20
10
20
11
20
12
Russian Federation 10.0 21.5 19.4 20.4 18.4 17.5 16.5 18.1 19.7 18.1 16.6 17.1 19.3
Nenetsk AO 11.1 18.6 9.6 13.8 10.2 12.9 13.2 12.7 10.1 9.1 5.1 5.4 8.0
Orenburg Oblast’ 30.9 21.3 17.3 20.1 20.1 13.1 16.3 17.8 18.0 15.2 18.4 13.4 17.0
Tiumen’ Oblast’ 10.7 37.4 34.9 36.7 36.7 35.5 39.2 46.4 45.5 44.6 41.3 45.2 44.1
KhMAO 9.7 37.7 36.7 38.9 38.9 14.1 11.7 12.8 12.0 9.8 9.7 8.6 12.0
Yamalo-Nenetsk AO 10.9 40.7 35.9 36.7 36.7 14.2 10.8 9.1 9.4 13.0 18.5 19.0 25.0
Kemerovo Oblast’ 9.8 9.7 9.9 10.0 10.0 15.9 15.1 15.4 17.8 14.7 15.0 12.4 14.0
Republic of Sakha
(Iakutia)
12.2 22.9 19.1 22.0 22.0 22.0 15.0 15.1 17.4 15.2 14.3 14.5 15.3
Sakhalin Oblast’ 13.7 23.3 16.4 17.6 17.6 21.4 20.7 16.3 17.6 20.4 21.2 19.9 23.4
Source: Regions of Russia. Social and Economic Indicators. Federal State Statistics Service. 2013
20
Appendix 3
Table 1 - Debt in Resource Regions, % GRP*
2010 2013
Region Debt Regional,
% GRP
Debt, Regional
& Municipal,
% GRP
Debt
Regional, %
GRP
Debt, Regional&
Municipal, %
GRP
Nenetsk AO 18.2 19.5
Orenburg Oblast’ 1.9 2.1 4.4 5.4
Tiumen’ Oblast’ 0.0 0.0 0.1
Khanty-Mansiysk AO 0.6 0.7 0.8 0.8
Yamalo-Nenetsk AO 0.3 0.7
Kemerovo Oblast’ 2.9 3.3 5.7 5.9
Republic of Sakha 4.0 4.4 5.4 6.0
Sakhalin Oblast’ 0.1 0.6 0.3 0.7
*GRP from ROSstat; for 2013 estimated from annual growth rates, 2005-2010
Source: Regions of Russia. Social and Economic Indicators. Federal State Statistics Service. 2013
21
References
1. Ahmad, E. and V. Tanzi (2002). Managing fiscal decentralization. London, Routledge.
2. Ahrend, R. (2005). “Speed of reform, initial conditions or political orientation? Explaining Russian regions’
economic performance.” Post-Communist Economies 17(3): 289-317.
3. Ahrend, R. (2012). “Understanding Russian regions’ economic performance during periods of decline and
growth-An extreme bound analysis approach.” Economic Systems 36(3): 426-443.
4. Akhmedjonov, A. (2011). “Do Higher Levels of Education Raise Earnings in Post-Reform Russia?” Eastern
European Economics 49(4): 47-60.
5. Akhmedjonov, A., M. Lau and B. Izgi (2013). “New evidence of regional income divergence in post-reform
Russia.” Applied Economics 45(18): 2675-2682.
6. Alexeev, M. and R. Conrad (2009). “The Russian Oil Tax Regime: A Comparative Perspective.” Eurasian
Geography and Economics 50(1): 93-114.
7. Alexeev, M. and G. Kurlyandskaya (2003). “Fiscal federalism and incentives in a Russian region.” Journal of
Comparative Economics 31(1): 20-33.
8. Alexeev, M. V., S. Weber. (2013). “Russian fiscal federalism : impact of political and fiscal
(de)centralization”. London, Centre for Economic Policy Research.
9. Allers, M. A. and L. J. Ishemoi (2011). “Equalising spending needs of sub national governments in a
developing country: the case of Tanzania.” Environment and Planning C-Government and Policy 29 (3): 487-
501.
10. Bahl, R. W., J. Martinez-Vazquez and World Bank. Public Sector Board. (2006). Sequencing fiscal
decentralization. Washington, D.C., World Bank.
11. Becker, S. O., P. H. Egger and M. von Ehrlich (2013). “Absorptive Capacity and the Growth and Investment
Effects of Regional Transfers: A Regression Discontinuity Design with Heterogeneous Treatment Effects.”
American Economic Journal-Economic Policy 5(4): 29-77.
12. Berkowitz, D. and D. DeJong (2003). “Policy reform and growth in post-Soviet Russia.” European Economic
Review 47(2): 337-352.
13. Berkowitz, D. and D. DeJong (2005). “Entrepreneurship and post-socialist growth.” Oxford Bulletin of
Economics and Statistics 67(1): 25-46.
14. Berkowitz, D. and D. DeJong (2011). “Growth in post-Soviet Russia: A tale of two transitions.” Journal of
Economic Behavior & Organization 79(1-2): 133-143.
15. Bishop, G. and A. A. Shah (2011). Fiscal Federalism and Petroleum Resourcesin Iraq. Obstacles to
Decentralization: Lessons from Selected Countries” (Cheltenham, UK: Edward Elgar, 2011) 549. J. Marzquez
and F. Vaillancourt. Cheltenham, UK, Edward Elgar.
16. Blöchliger, H. and J. Rabesona (2009). The Fiscal Autonomy of Sub-Central Governments: An Update. OECD
Working Papers on Fiscal Federalism. Paris, OECD. 9.
17. Chebankova, E. (2008). “Adaptive federalism and federation in Putin’s Russia.” Europe-Asia studies 60(6):
989-1009.
18. Cherniavskii A., “Regioinal’nye biudzhety v period stagnatsii,” Novyj KGB (Kommentarii o Gosudarstve i
Biznese), Centre of Development Institute, National Research University - Higher School of Economics, 5–18
October 2013
19. Christenko, V. B. (2002). Mezhbiudzhetnye otnosheniia I upravlenie regionalʹnymi finansami: opyt,
problemy, perspekivy. Moscow, Delo.
20. Commander, S., A. Plekhanov and J. Zettelmeyer (2013). Diversifying Russia: Harnessing Regional Diversity.
London, EBRD.
21. Cottarelli, C. (2012) 'Fiscal Regimes for Extractive Industries: Design and Implementation ', Washington,
D.C., IMF Fiscal Affairs Department.
22. Dahl, R. A. (1961). Who governs? Democracy and power in an American city. New Haven,, Yale University
Press.
23. Demina, O. V. and L. I. Vlasiuk (2012). “Effektivnye regiony: kriterii I klassifikatsiia.” Prostranstvennaia
Ekonomika 1: 29-42.
24. Desai, R., L. Freinkman and I. Goldberg (2005). “Fiscal federalism in rentier regions: Evidence from Russia.”
Journal of Comparative Economics 33(4): 814-834.
22
25. Desai, R. M., L. Freinkman and I. Goldberg (2005). “Fiscal federalism in rentier regions: Evidence from
Russia.” Journal of Comparative Economics 33(4): 814-834.
26. Eisenhardt, K. M. (1989). “Building Theories from Case-Study Research.” Academy of Management Review
14(4): 532-550.
27. European Bank for Reconstruction and Development (2012). Diversifying Russia: harnessing regional
diversity, England, Fulmar
28. Franc ois, P., E. Yakovlev, E. V. Zhuravskaya and R. Centre for Economic Policy (2008). Norms and
institution formation. London, Centre for Economic Policy Research.
29. Freinkman, L., K. Kholodilin and U. Thiessen (2011). “Incentive Effects of Fiscal Equalization Has Russian
Style Improved?” Eastern European Economics 49(2): 5-29.
30. Freinkman, L. and A. Plekhanov (2009). “Fiscal Decentralization in Rentier Regions: Evidence from Russia.”
World Development 37(2): 503-512.
31. Freinkman, L. M., A. Plekhanov and World Bank. Europe and Central Asia Region. Poverty Reduction and
Economic Management Unit. (2005). What determines the extent of fiscal decentralization? : the Russian
paradox.
32. Geddes, B. (2003). Paradigms and sand castles : theory building and research design in comparative politics.
Ann Arbor, University of Michigan Press.
33. Gerring, J. (2007). “What Is a Case Study Good For? Case Study versus Large-N Cross-Case Analysis.” Case
Study Research: Principles and Practices: 37-63.
34. Granville, B. and C. Leonard (2010). “Do Informal Institutions Matter for Technological Change in Russia?
The Impact of Communist Norms and Conventions, 1998-2004.” World Development 38(2): 155-169.
35. Guriev, S. and E. Vakulenko (2012). Convergence between Russian regions. Working Papers. Moscow,
CEFIR.
36. Guriev, S. M., E. Yakovlev, E. V. Zhuravskaya (2008). Interest group politics in a federation. London, Centre
for Economic Policy Research.
37. Hatfield, J. W. and G. P. I. Miquel (2012). “A Political Economy Theory of Partial Decentralization.” Journal
of the European Economic Association 10(3): 605-633.
38. Hauner, D. (2008). “Explaining Differences in Public Sector Efficiency: Evidence from Russia’s Regions.”
World Development 36(10): 1745-1765.
39. Iandiev, M. (2009) 'The Aftermath of the Financial Crisis in Russia', In Poloucek, S. a. S., D (ed) Structural
and Regional Impacts of Financial Crises". Proceedings of 12th International Conference on Finance and
Banking. Silesia, Silesian University Karvina.
40. Iandiev, M. (2013) 'Otsenka effektivnosti realizatsii tselevykh programm sub''ektov Federatsii', Finansy, 2.
41. Iandiev, M. (2013) 'Budgetary and financial sector of the Russian Federation: results of the past decade (2000-
2010)', Acta Moraviae, 12.
42. Iimi, A. (2005). “Decentralization and economic growth revisited: an empirical note.” Journal of Urban
Economics 57(3): 449-461.
43. Kondratʹeva, N. B. (2008). Regiony Rossii I Evropei skogo Soi u za na puti k stroitelʹstvu obshchego
e konomicheskogo prostranstva. Moskva, In-t Evropy RAN: Rus. Suvenir
44. Kumar, M. S., D. Leigh, A. Plekhanov and International Monetary Fund. Fiscal Affairs Department. (2007).
Fiscal adjustments : determinants and macroeconomic consequences.
45. Lavrov, A., Litwack, J. M. & Sutherland, D. (2001) ‘Fiscal Federalist Relations in Russia: A Case for
Subnational Autonomy.’, Paris, OECD.
46. Leonard, C. S. and D. Pitt-Watson (2013). Privatization and transition in Russia in the early 1990s. London ;
New York, Routledge.
47. Mamedov, A., V. Nazarov and A. Siluanov (2013). Problemy mezhbiudzhetnykh otnoshenii v Rossii.
Moscow, Institute of Economic Policy.
48. Martinez-Vazquez, J. and J. Boex (2001). Russia’s transition to a new federalism. Washington, D.C., World
Bank.
49. Martinez-Vazquez, J., M. Rider and S. Wallace (2008). Tax reform in Russia. Cheltenham, Glos ;
Northampton, MA, Edward Elgar.
50. Martinez-Vazquez, J. and R. J. Searle Fiscal Equalization Challenges in the Design of Intergovernmental
Transfers.
23
51. Martinez-Vazquez, J. and A. Timofeev (2008). “Regional-local dimension of Russia’s fiscal equalization.”
Journal of Comparative Economics 36(1): 157-176.
52. Martinez-Vazquez, J., A. Timofeev and J. Boex (2006). Reforming regional-local finance in Russia.
Washington, DC, World Bank.
53. Mello, L. d. (2000). “Fiscal decentralization and intergovernmental fiscal relations: a cross-country analysis.”
World Development (U K ) 28, No. 2: 365-380.
54. Mikheeva, N. N. (2009). Problemy razvitiia resursodobyvaiushchikh regionov i otsenka ikh role v rossiiskoi
ekonomike Rossiiskii ekoomicheskii kongress-2009. Moscow.
55. Musgrave, R. A. (1997). “Devolution, grants, and fiscal competition.” Journal of Economic Perspectives 11(4):
65-72.
56. Otto, J. (2001). Fiscal Decentralization and Mining Taxation. Washington, D.C., World Bank Mining Group.
57. Papyrakis, E. and R. Gerlagh (2007). “Resource abundance and economic growth in the United States.”
European Economic Review 51(4): 1011-1039.
58. Plekhanov, A. (2006). Are Sub-National Budget Constraints Soft: Evidence from Russia.
59. Polynev, A. O. (2010). Konkurentnye vozmo]nostsi regionov: Metodologiia issledovaniia I puti ee
povysheniia. Moscow, KRASAND.
60. Qian, Y. Y. and B. R. Weingast (1997). “Federalism as a commitment to preserving market incentives.”
Journal of Economic Perspectives 11(4): 83-92.
61. Ragin, C. C. and H. S. Becker (1992). What is a case? : exploring the foundations of social inquiry. Cambridge
England ; New York, NY, USA, Cambridge University Press.
62. Rodriguez-Pose, A. and R. Sandall (2008). “From identity to the economy: analysing the evolution of the
decentralisation discourse.” Environment and Planning C-Government and Policy 26(1): 54-72.
63. Sachs, J. D. and A. M. Warner (2001). “The curse of natural resources.” European Economic Review 45(4-6):
827-838.
64. Sakwa, R. (2004). “Putin: Russia’s choice.” Democratization 11(5): 228-230.
65. Searle, B. (2007). Revenue Sharing, Natural Resources and Fiscal Equalization. Fiscal Equalization:
Challenges in the Design of Intergovernmental Transfers. J. Martinez-Vazquez and B. Searle: 371-401.
66. Sepulveda, C. F. and J. Martinez-Vazquez (2011). “The consequences of fiscal decentralization on poverty and
income equality.” Environment and Planning C-Government and Policy 29(2): 321-343.
67. Shleifer, A. and D. Treisman (2005). “A normal country: Russia after communism.” Journal of Economic
Perspectives 19(1): 151-174.
68. Siluanov, A., P. Kadochnikov, V. Nazarov and A. Mamedov (2009). Intergovernmental Relations and
Subnational Finances in Russia in 2008. Russian Economy in 2008. E. Gaidar. Moscow, Institute for the
Economy in Transition. 30, section 2: 31-47.
69. Siluanov, A. G. (2011). Mezhbiudzhetnye otnosheniia v usloviiakh razvitiia federalizma v Rossii. Moscow,
Delo.
70. Slinko, I., E. Yakovlev, E. Zhuravskaya and R. Centre for Economic Policy (2003). Institutional subversion :
evidence from Russian regions. London, Centre for Economic Policy Research.
71. Solanko, L. (2001). Fiscal competition in a transition economy.
72. Spilimbergo, A. (2007). “Measuring the performance of fiscal policy in Russia.” Emerging Markets Finance
and Trade 43(6): 25-44.
73. Treisman, D. (2000). “The causes of corruption: a cross-national study.” Journal of Public Economics 76(3):
399-457.
74. Trujillo, D., G. Martinez, N. Minorsky and W. G. Dail (1986). “The Effect of Partial Decentralization on the
Innervation of Neurons in the Pelvic Plexus.” Anatomical Record 214(3): A137-A137.
75. Unleashing the Potential. Analytical Report on Growth and Investment in Russia’s Regions (2006). Policy
Series. Moscow, CEFIR.
76. Vartapetov, K. (2010). “Russia’s federal fiscal grants : regional equalisation and growth.” Post-communist
economies. 22: 471-481.
77. Vartapetov, K. (2011). “Russian Fiscal Federalism under Stress: Federal Support of Regions during the Global
Financial Crisis.” Eurasian Geography and Economics 52(4): 529-542.
78. Walker, A. (2013). An Empirical Analysis of Resource Curse Channels in the Appalachian Region.
Morgantown, WV, West Virginia University.
24
79. Yakovlev, A. A., I. Marques and E. Nazrullaeva (2012). From Competition to Dominance: Political
Determinants of Federal Transfers in the Russian Federation. Working Papers. Moscow, Higher School of
Economics.
80. Zhuravskaya, E. V. and i. Handelsho gskolan I Stockholm. O stekonomiska (2000). Incentives to provide local
public goods : fiscal federalism, Russian style. Stockholm, Stockholm School of Economics.
Irina N. Il’ina
National Research University Higher School of Economics. «Regional studies and urban
development» Institute. Director; E-mail: [email protected]
Carol S. Leonard
National Research University Higher School of Economics.«Regional studies» Department.
Head; E-mail: [email protected]
Evgenij E. Plisetskij
National Research University Higher School of Economics. «Regional studies and urban
development» Institute. Research fellow; E-mail: [email protected]
Any opinions or claims contained in this Working Paper do not necessarily
reflect the views of HSE.
© Il’ina, Leonard, Plisetskij, 2014