Embed Size (px)
Citation preview
THIS REPORT CONTAINS ASSESSMENTS OF COMMODITY AND TRADE ISSUES MADE BY
USDA STAFF AND NOT NECESSARILY STATEMENTS OF OFFICIAL U.S. GOVERNMENT
POLICY
Date:
GAIN Report Number:
Approved By:
Prepared By:
Report Highlights:
Russia is harvesting its largest ever grain crop that may exceed 128 MMT according to official reports.
Average wheat and barley yields are 16 to 19 percent higher than in 2016/2017, respectively.
FAS/Moscow has increased its wheat production forecast to 83 MMT, one MMT higher than the
official USDA number. Meanwhile, corn production is down despite bigger acreage and a good pace of
harvesting. FAS/Moscow decreased its corn production outlook for 17/18 to 13.8 MMT, 1.7 million
lower than the previous forecast in July 2017. FAS/Moscow estimates that total Russian exports could
reach 43.6 MMT in 2017/2018. The Government of Russia intends to launch new support measures
aimed to facilitate grain shipments from Siberia, the Urals and the Volga Valley that could feed into
export markets.
FAS/Moscow Staff
Deanna Ayala
October 2017
Grain and Feed Update
Russian Federation
RS1753
10/27/2017
Required Report - public distribution
Post:
Commodities:
General Information:
NOTE: USDA unofficial data excludes Crimean production and exports. However, as of June 2014,
Russian official statistics (ROSSTAT) began incorporating Crimean production and trade data into their
official estimates. Where possible, data reported by FAS Moscow is exclusive of information
attributable to Crimea.
Executive Summary:
Russia appears to be harvesting its largest ever grain crop that may exceed 128 MMT. According to the
Ministry of Agriculture this year’s crop may beat the record crop of 127 MMT in 1978 (exclusive of
Crimea). Average wheat and barley yields are up by 16 and 19 percent, respectively, from 2016/2017.
FAS/Moscow has increased its wheat production forecast to 83 MMT, one MMT higher than the
official USDA number for 2016/2017. Meanwhile, corn production is forecast down despite greater
acreage sown last spring and a good pace of harvesting. FAS/Moscow decreased the corn production
outlook to 13.8 MMT, 1.7 million lower than our previous estimate (Please see GAIN RS1738 Grain
and Feed Update July 2017).
Russia’s grain exports from July 1 to October 11, 2017 were 13.6 MMT, a 21 percent increase from the
marketing year 2016/2017. FAS/Moscow estimates total Russian exports of 43.6 MMT in 2017/2018,
including 33.5 MMT of wheat, 5.7 MMT of barley, 4.2 MMT of corn and 240 TMT of other grains.
Looking ahead, the winter planting campaign is going faster than a year ago and the total winter crop
acreage in 2018/2019 may increase by 3 percent compared to 2017/2018. However, soil moisture and
germination conditions are dubious in the Southern regions of Russia.
The Government of the Russian Federation announced plans to put in place rail transport subsidies
intended to facilitate the movement of grain from Siberia, the Urals and the Volga Valley thus
supporting grain prices in the most remote grain producing federal districts and increasing export
shipments. Separately, the state-run Russian Railways (the RZD) introduced a ten percent rail discount
for transportation of grains from Voronezh, Orel, Tambov, Orenburg, Saratov, Novosibirsk and Omsk
oblast through June 30, 2018. Market participants anticipate these measures may have very limited
effect on Russian grain exports in 2017/2018.
Rye
Rice, Milled
Millet
Oats
Corn
Barley
Wheat Moscow
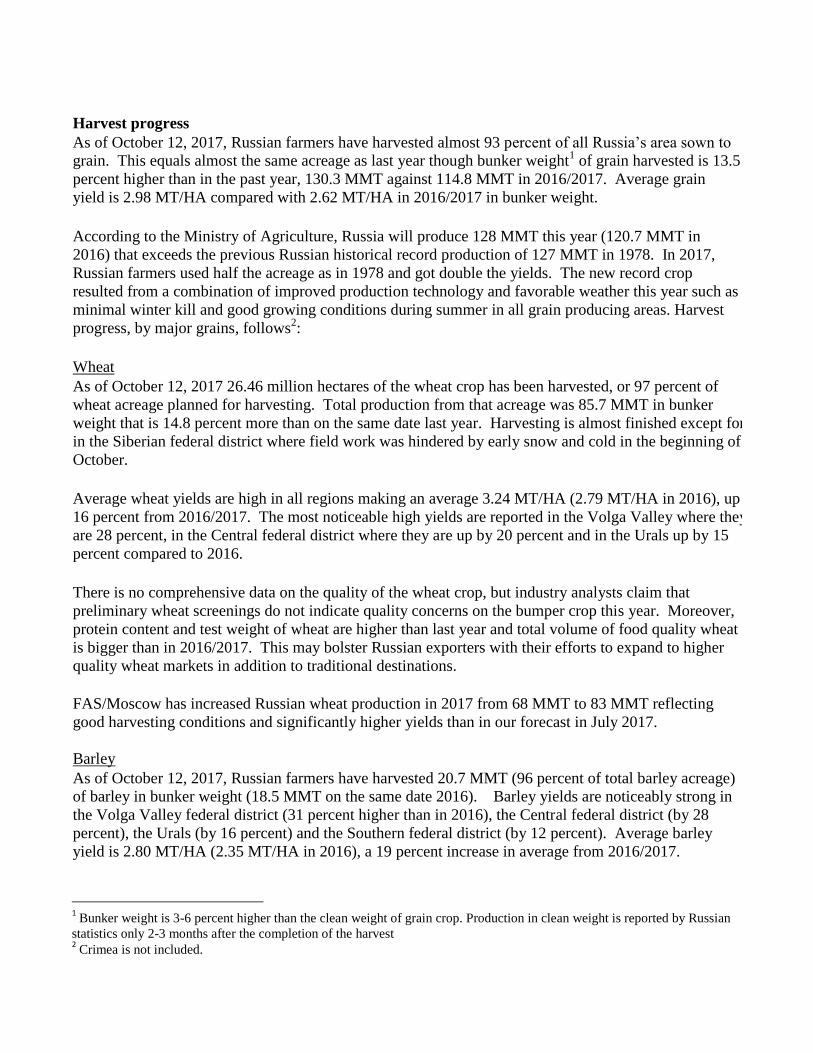
Harvest progress
As of October 12, 2017, Russian farmers have harvested almost 93 percent of all Russia’s area sown to
grain. This equals almost the same acreage as last year though bunker weight1 of grain harvested is 13.5
percent higher than in the past year, 130.3 MMT against 114.8 MMT in 2016/2017. Average grain
yield is 2.98 MT/HA compared with 2.62 MT/HA in 2016/2017 in bunker weight.
According to the Ministry of Agriculture, Russia will produce 128 MMT this year (120.7 MMT in
2016) that exceeds the previous Russian historical record production of 127 MMT in 1978. In 2017,
Russian farmers used half the acreage as in 1978 and got double the yields. The new record crop
resulted from a combination of improved production technology and favorable weather this year such as
minimal winter kill and good growing conditions during summer in all grain producing areas. Harvest
progress, by major grains, follows2:
Wheat
As of October 12, 2017 26.46 million hectares of the wheat crop has been harvested, or 97 percent of
wheat acreage planned for harvesting. Total production from that acreage was 85.7 MMT in bunker
weight that is 14.8 percent more than on the same date last year. Harvesting is almost finished except for
in the Siberian federal district where field work was hindered by early snow and cold in the beginning of
October.
Average wheat yields are high in all regions making an average 3.24 MT/HA (2.79 MT/HA in 2016), up
16 percent from 2016/2017. The most noticeable high yields are reported in the Volga Valley where they
are 28 percent, in the Central federal district where they are up by 20 percent and in the Urals up by 15
percent compared to 2016.
There is no comprehensive data on the quality of the wheat crop, but industry analysts claim that
preliminary wheat screenings do not indicate quality concerns on the bumper crop this year. Moreover,
protein content and test weight of wheat are higher than last year and total volume of food quality wheat
is bigger than in 2016/2017. This may bolster Russian exporters with their efforts to expand to higher
quality wheat markets in addition to traditional destinations.
FAS/Moscow has increased Russian wheat production in 2017 from 68 MMT to 83 MMT reflecting
good harvesting conditions and significantly higher yields than in our forecast in July 2017.
Barley
As of October 12, 2017, Russian farmers have harvested 20.7 MMT (96 percent of total barley acreage)
of barley in bunker weight (18.5 MMT on the same date 2016). Barley yields are noticeably strong in
the Volga Valley federal district (31 percent higher than in 2016), the Central federal district (by 28
percent), the Urals (by 16 percent) and the Southern federal district (by 12 percent). Average barley
yield is 2.80 MT/HA (2.35 MT/HA in 2016), a 19 percent increase in average from 2016/2017.
1 Bunker weight is 3-6 percent higher than the clean weight of grain crop. Production in clean weight is reported by Russian
statistics only 2-3 months after the completion of the harvest 2 Crimea is not included.
Post has increased the production forecast for barley from 16.5 MMT to 20.5 MMT, matching the
official USDA number.
Corn
As of October 12, 2017, Russian farmers have harvested 6.1 MMT of corn from 45 percent of area
planned for corn harvest. On the same date last year, 36 percent of the total corn acreage had been
harvested. Despite the fact that acreage sown for corn in 2017/2018 was larger than in 2016/2017, the
total area planned for harvesting this year is almost equal to the 2016/2017 season. According to the
Ministry of Agriculture, six percent of corn fields were cut for green fodder instead of grain due to poor
weather conditions during the summer. Unfavorable weather conditions also resulted in lower yields in
the main corn producing federal districts accounting for 90 percent of the total corn crop in Russia: in
the Central Federal District yield is 6.03 MT/HA (13 percent less than 2016/2017)), the Southern
Federal District is 4.49 MT/HA (13 percent less) and the Northern Caucasus 4.59 MT/HA (26 percent
less). Average corn yield is 4.79 MT/HA (5.51 MT/HA in 2016/2017), a 13 percent decrease from
2016/2017. A smaller corn crop in the South of Russia will translate into lower export numbers.
FAS/Moscow forecasts Russian corn production at 13.8 MMT, down by 1.7 MMT from our July
estimate. Post is projecting lower production than USDA’s official number to more closely reflect
decreased corn yield in 2017/2018.
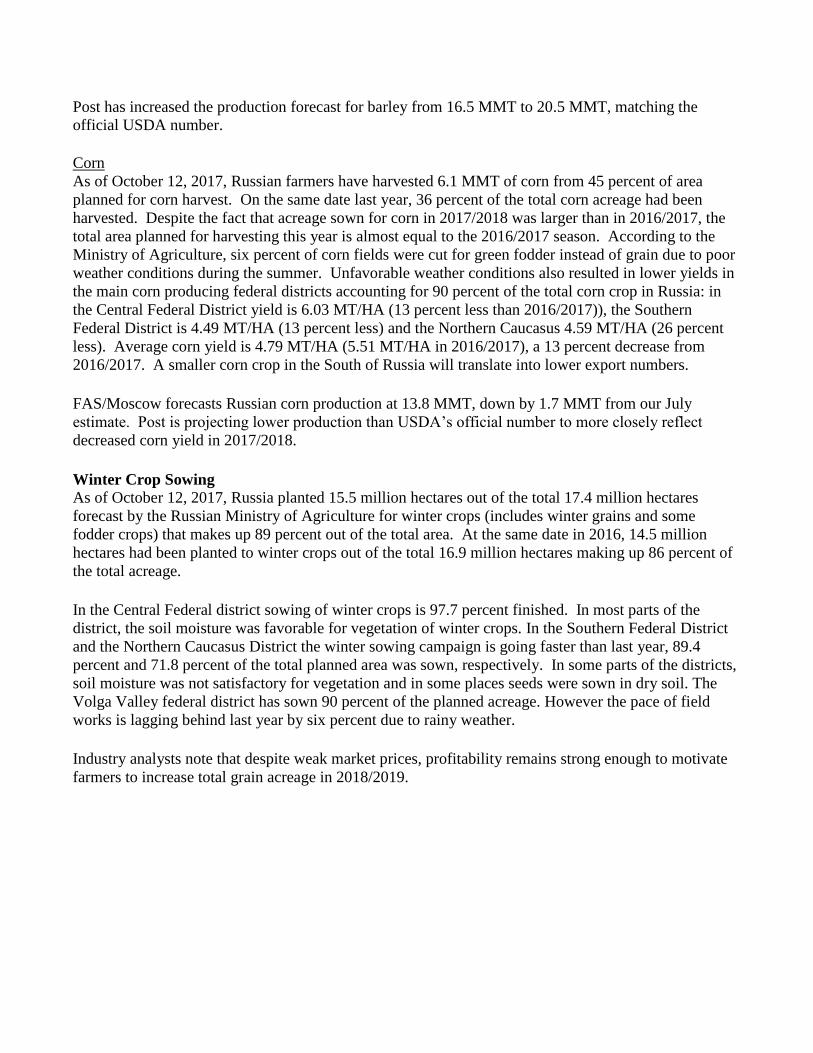
Winter Crop Sowing
As of October 12, 2017, Russia planted 15.5 million hectares out of the total 17.4 million hectares
forecast by the Russian Ministry of Agriculture for winter crops (includes winter grains and some
fodder crops) that makes up 89 percent out of the total area. At the same date in 2016, 14.5 million
hectares had been planted to winter crops out of the total 16.9 million hectares making up 86 percent of
the total acreage.
In the Central Federal district sowing of winter crops is 97.7 percent finished. In most parts of the
district, the soil moisture was favorable for vegetation of winter crops. In the Southern Federal District
and the Northern Caucasus District the winter sowing campaign is going faster than last year, 89.4
percent and 71.8 percent of the total planned area was sown, respectively. In some parts of the districts,
soil moisture was not satisfactory for vegetation and in some places seeds were sown in dry soil. The
Volga Valley federal district has sown 90 percent of the planned acreage. However the pace of field
works is lagging behind last year by six percent due to rainy weather.
Industry analysts note that despite weak market prices, profitability remains strong enough to motivate
farmers to increase total grain acreage in 2018/2019.
Source: FAS/Moscow based on Ministry of Agriculture’s data
Exports
Russia’s grain exports from July 1 to October 11, 2017 were 13.6 MMT (a 21 percent increase from
marketing year 2016/2017), including 10.5 MMT of wheat, 2.1 MMT of barley and 0.9 MMT of corn.
In the beginning of the marketing year exporters gained on the improved price spread between a
domestic market oversupplied by carry-in stocks and crop pressure on the one hand and firmer export
demand on the other hand. The Ruble exchange rate move was also in favor of grain exporters during
July and August when Russian currency changed from RBL/USD 57.03 on June 15, 2017 to RBL/USD
60.75 on August 4, 2017, down almost 7 percent against the U.S. Dollar.
Industry analysts estimate the total capacity of Russia’s grain export infrastructure to be from 48 to 55
MMT. However Russian grain exports are limited by such factors as ice conditions on the Azov Sea,
loading restrictions at Black Sea terminals and trade obstacles at the biggest destination countries. Also,
diversification of grain shipments into various types of grains and quality grades causes additional stress
on the existing technical capabilities. From July 1, 2017, Russian grain traders shipped grains to 119
countries (110 countries in 2016) including recently developing export destinations like Algeria and
Tunisia. Also, Russian traders are actively pursuing new export opportunities in Southeast Asia. In
2016/2017 Russian grain exports to the region were 1.4 MMT, including countries like Indonesia (344
TMT), Malaysia (68 TMT), the Philippines (17 TMT), Vietnam (931 TMT) and Thailand (64 TMT).
Grain exports to Japan and South Korea amounted to 351 TMT and 917 TMT respectively.
The largest buyers of Russian grain in 2016/2017 were Egypt (6.8 MMT), Turkey (3.3 MMT) and
Bangladesh (2.0 MMT). Turkey remains the number two buyer of Russian grain in 2017/2018 with 895
TMT of imports in July and August 2017 including 574 TMT of wheat, 133 TMT of barley and 189
TMT of corn. Turkey’s imports continue despite additional import requirements on Russian wheat,
sunflower oil, dry peas and corn which were put in place October 9th
, requiring Russian exporters to
obtain a stamp and certify invoices with the Turkish Trade Mission in Russia prior to shipment.
Industry analysts predict that this additional hurdle will not affect total volumes of grain exports to
Turkey. Note: Russia has had a ban on Turkish tomato imports since the end of 2015 which reportedly
could be lifted as early as November 1.
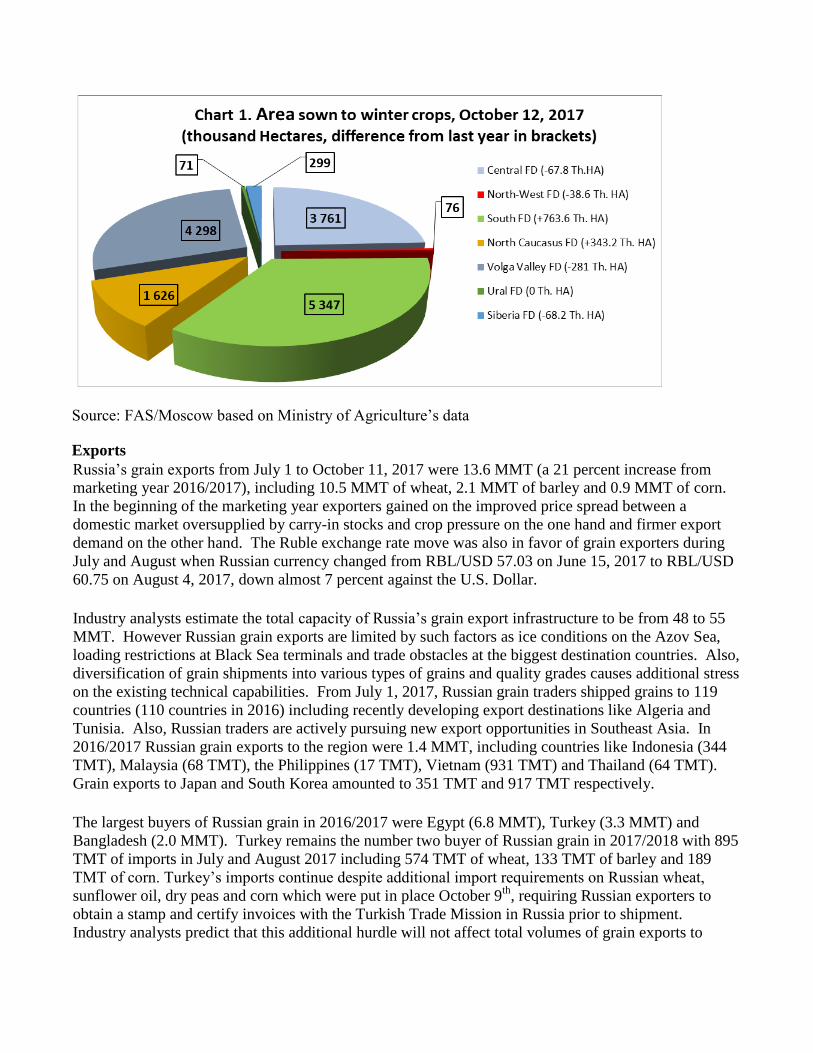
Post estimates total Russian grain exports during marketing year 2017/2018 at 43.6 MMT, including
33.5 MMT of wheat, 5.7 MMT of barley, 4.2 MMT of corn and 240 thousand MT of other grains.
Source: FAS/Moscow based on Russia’s Customs data. Exports in September 2017 is based on
estimates of industry analysts
Stocks
According to the Russian Federal Statistical Service (Rosstat) grain carry-in stocks on July 1, 2017 were
a record high 15.4 MMT compared to 13.7 MMT on July 1, 2016. Grain stocks at procuring and
processing enterprises increased by 19.4 percent (to 9.18 MMT) while agricultural producers’ stocks
increased only by 2.6 percent (to 6.17 MMT).
On September 1, 2017, Russia’s grain stocks amounted to 51.05 MMT (46.19 MMT in 2016).
Agricultural producers’ grain stocks increased by 4.3 percent and grain stocks at procuring and
processing enterprises increased by 23.9 percent compared to September 1, 2016. The highest grain
stocks were in the Central and Southern Federal Districts, 15.37 MMT and 14.25 MMT respectively, up
by 18.6 percent and 26.9 percent to 2016/2017, respectively. This concentration of stocks keeps
pressure on domestic prices despite the record high export volumes during the first three months of the
marketing year.
Post increased barley imports as well as feed use and residuals in 2016/2017 to match official USDA
numbers. Post increased its barley import forecast for 2017/2017 from 50 TMT to 220 TMT based on
new import statistics in July and August 2017.
Post increased carry-in stocks of corn for marketing year 2017/18 beginning October 1, 2017 to 929
TMT of corn, higher than official USDA number, to closely reflect stocks statistics.
Source: FAS/Moscow based on Rosstat data
Policy
The Russian Ministry of Agriculture delayed state grain procurement interventions to December 2017,
despite a previously announced plan to commence purchasing 3 MMT in September 2017. As of
October 6, 2017, the Intervention Fund had 3.97 MMT of grains in stock located in Siberia, the Urals
and the Volga Valley. Industry analysts comment that the cost of carrying this stock is very high though
the market effect is rather limited.
The Ministry of Agriculture submitted to the Government of Russia a draft decision on subsidizing
railway costs to transport grain from the inner grain producing regions such as Siberia, Urals and Volga
Valley toward export points. According to the Ministry, the subsidies should spur shipment of an
additional 3 MMT of grain from these federal districts to export terminals thus supporting grain prices in
the most price depressed grain producing regions. Industry analysts claim that this measure may have
very little effect on grain exports since the rail tariff charged by the RZD is quite a small fraction of the
total cost of grain transportation on railroads.
As of October 1, 2017, the state-owned Russian railways (the RZD) introduced a rail tariff discount of
10.3 percent for transportation of grains from Voronezh, Orel, Tambov, Orenburg, Saratov, Novosibirsk
and Omsk oblast through June 30, 2018. The RZD comments that such a decision was made "in order to
attract additional volumes of grain shipments." According to the RZD, in August shipments of grain by
railcars amounted to 1.9 MMT, which is almost 15 percent higher than the same period last year.
Market participants doubt that this measure will increase total grain export volumes this season as
railways provided less than 30 percent of grain transportation to export terminals in 2016/2017. Truck
transportation is an economical alternative to rail due in part to lack of railcars and costly freight.
Marketing
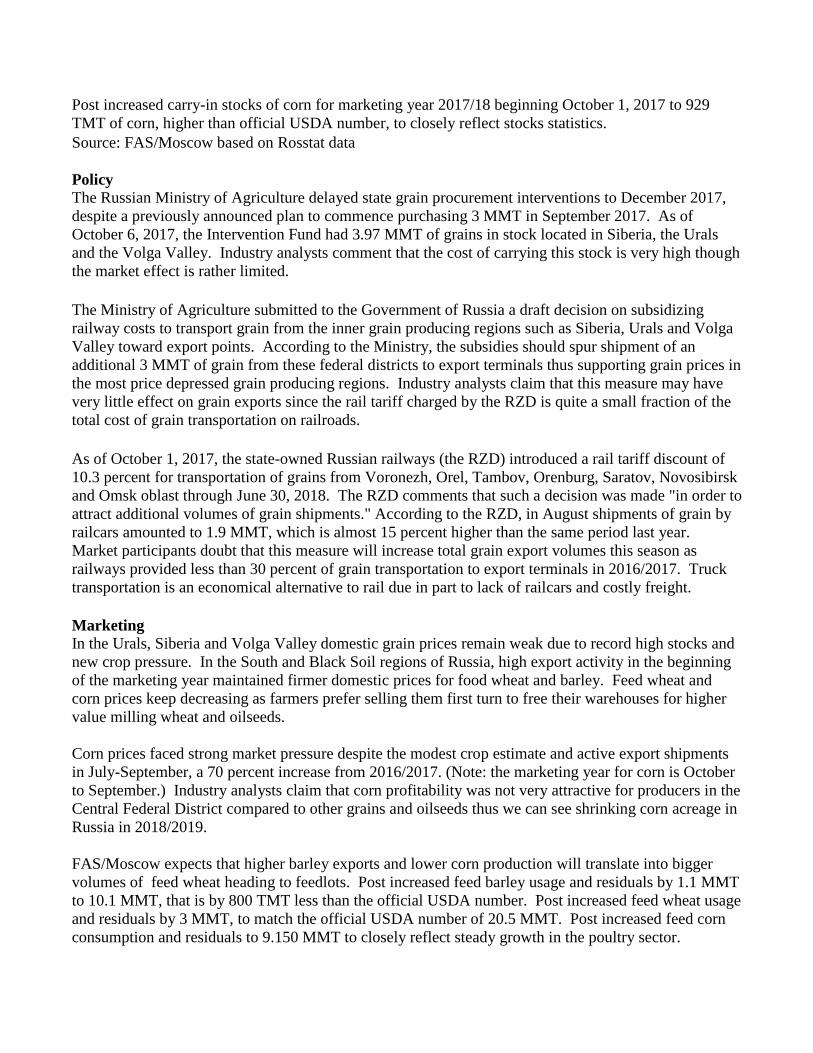
In the Urals, Siberia and Volga Valley domestic grain prices remain weak due to record high stocks and
new crop pressure. In the South and Black Soil regions of Russia, high export activity in the beginning
of the marketing year maintained firmer domestic prices for food wheat and barley. Feed wheat and
corn prices keep decreasing as farmers prefer selling them first turn to free their warehouses for higher
value milling wheat and oilseeds.
Corn prices faced strong market pressure despite the modest crop estimate and active export shipments
in July-September, a 70 percent increase from 2016/2017. (Note: the marketing year for corn is October
to September.) Industry analysts claim that corn profitability was not very attractive for producers in the
Central Federal District compared to other grains and oilseeds thus we can see shrinking corn acreage in
Russia in 2018/2019.
FAS/Moscow expects that higher barley exports and lower corn production will translate into bigger
volumes of feed wheat heading to feedlots. Post increased feed barley usage and residuals by 1.1 MMT
to 10.1 MMT, that is by 800 TMT less than the official USDA number. Post increased feed wheat usage
and residuals by 3 MMT, to match the official USDA number of 20.5 MMT. Post increased feed corn
consumption and residuals to 9.150 MMT to closely reflect steady growth in the poultry sector.
Source: FAS/Moscow based on ProZerno data
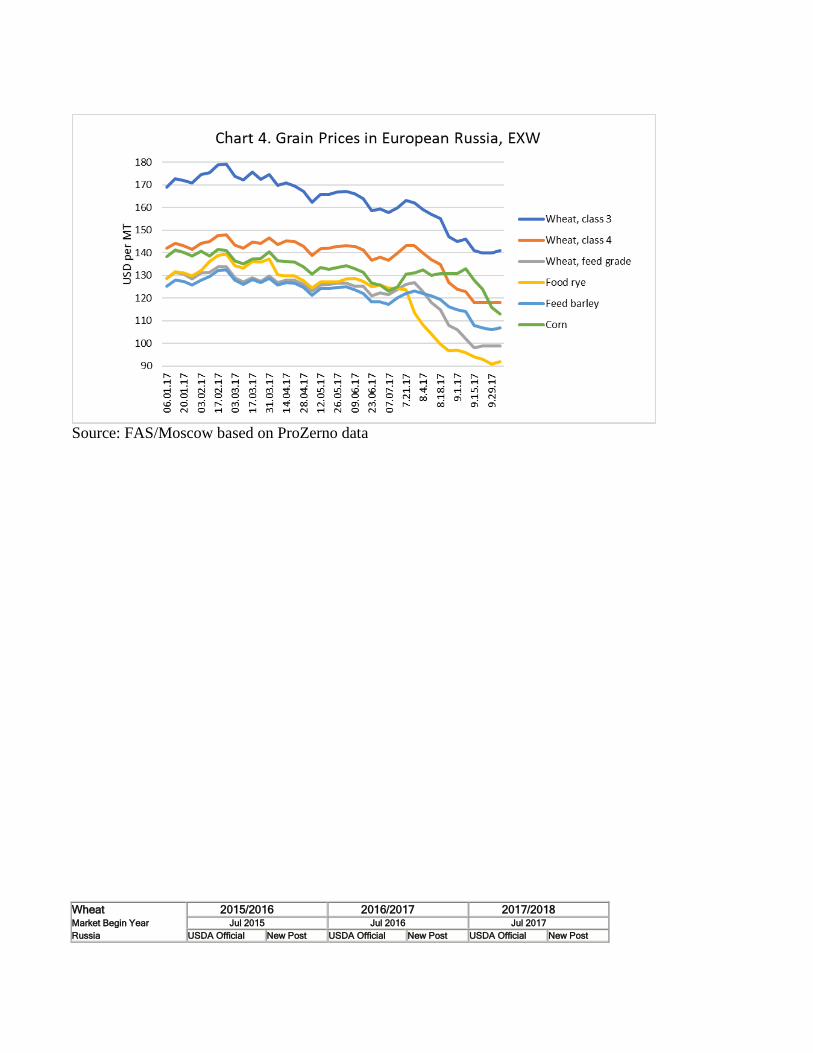
Wheat 2015/2016 2016/2017 2017/2018 Market Begin Year Jul 2015 Jul 2016 Jul 2017
Russia USDA Official New Post USDA Official New Post USDA Official New Post
Area Harvested 25577 25577 27004 27004 26800 27100
Beginning Stocks 6287 6287 5607 5607 10830 10832
Production 61044 61044 72529 72529 82000 83000
MY Imports 819 819 503 500 500 500
TY Imports 819 819 503 500 500 500
TY Imp. from U.S. 0 0 0 0 0 0
Total Supply 68150 68150 78639 78636 93330 94332
MY Exports 25543 25543 27809 27804 32500 33500
TY Exports 25543 25543 27809 27804 32500 33500
Feed and Residual 14000 14000 17000 17000 20500 20500
FSI Consumption 23000 23000 23000 23000 23000 23500
Total Consumption 37000 37000 40000 40000 43500 44000
Ending Stocks 5607 5607 10830 10832 17330 16832
Total Distribution 68150 68150 78639 78636 93330 94332
Yield 2.3867 2.3867 2.6859 2.6859 3.0597 3.0627
(1000 HA) ,(1000 MT) ,(MT/HA)
Barley 2015/2016 2016/2017 2017/2018 Market Begin Year Jul 2015 Jul 2016 Jul 2017
Russia USDA Official New Post USDA Official New Post USDA Official New Post
Area Harvested 8042 8042 7955 7955 7900 7700
Beginning Stocks 1533 1533 736 836 848 948
Production 17083 17083 17547 17547 20500 20500
MY Imports 61 61 214 214 50 220
TY Imports 99 99 200 200 50 220
TY Imp. from U.S. 0 0 0 0 0 0
Total Supply 18677 18677 18497 18597 21398 21668
MY Exports 4241 4241 2949 2949 4500 5700
TY Exports 3735 3735 3550 3550 4500 5700
Feed and Residual 9000 8900 9900 9900 10900 10100
FSI Consumption 4700 4700 4800 4800 4800 4800
Total Consumption 13700 13600 14700 14700 15700 14900
Ending Stocks 736 836 848 948 1198 1068
Total Distribution 18677 18677 18497 18597 21398 21668
Yield 2.1242 2.1242 2.2058 2.2058 2.5949 2.6623
(1000 HA) ,(1000 MT) ,(MT/HA)
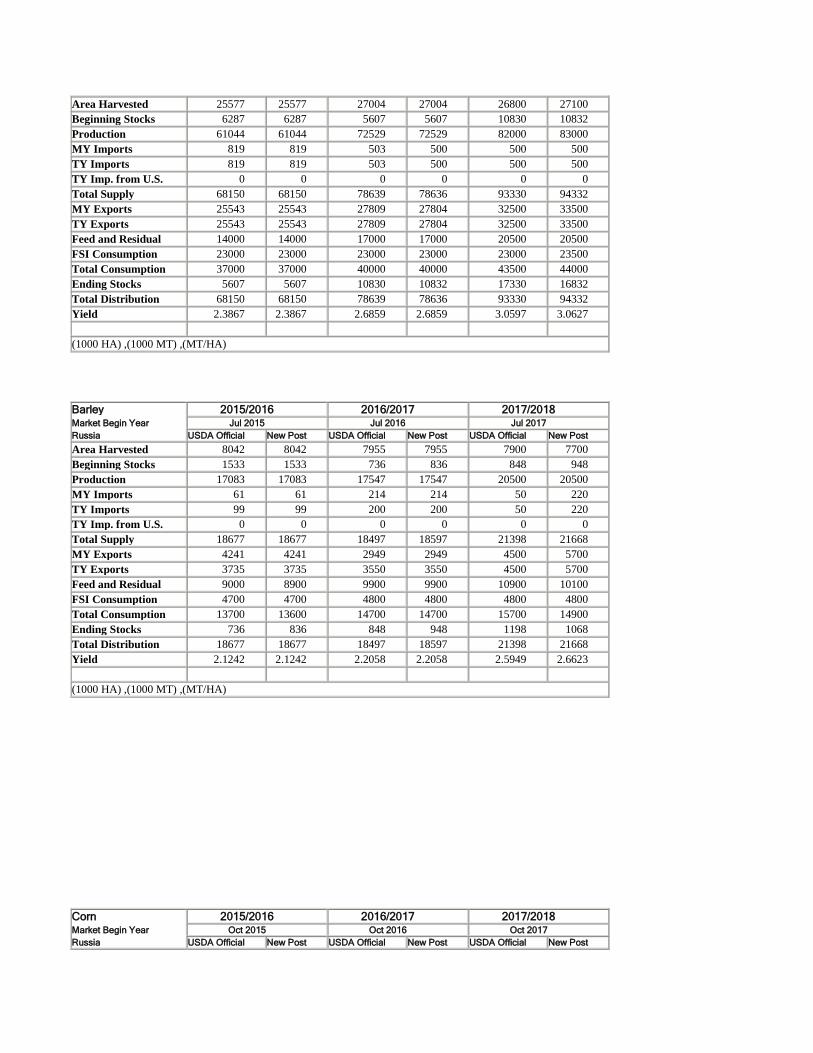
Corn 2015/2016 2016/2017 2017/2018 Market Begin Year Oct 2015 Oct 2016 Oct 2017
Russia USDA Official New Post USDA Official New Post USDA Official New Post
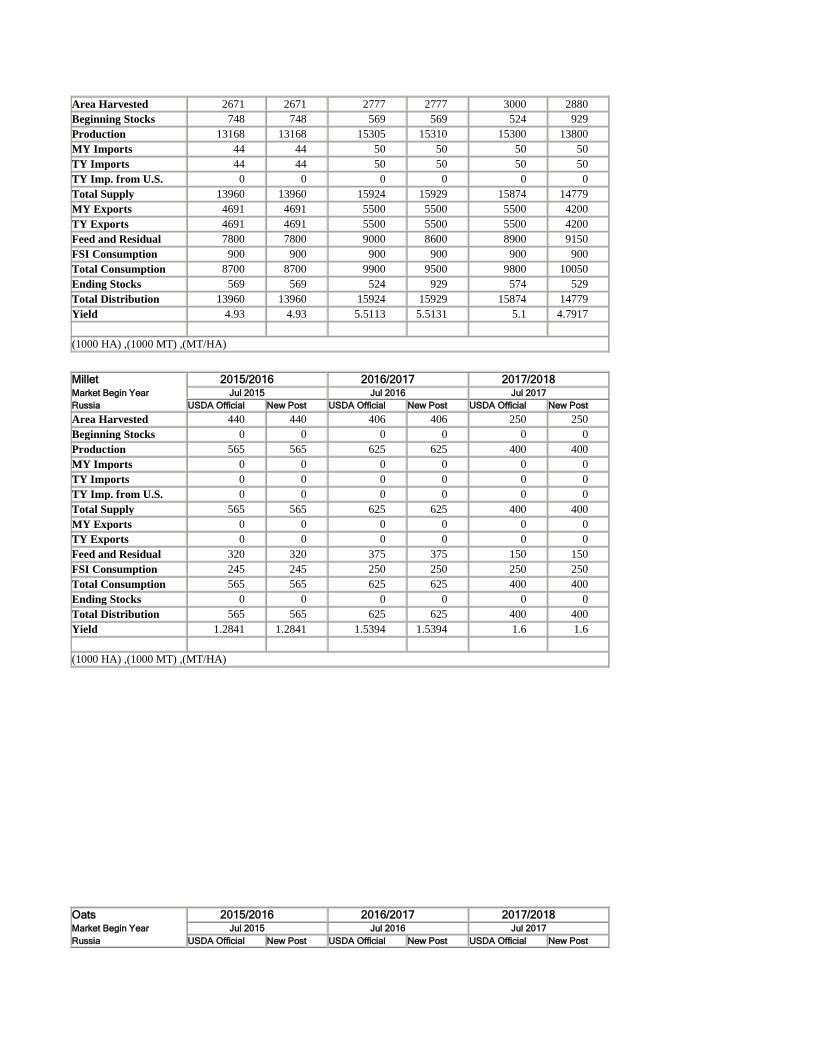
Area Harvested 2671 2671 2777 2777 3000 2880
Beginning Stocks 748 748 569 569 524 929
Production 13168 13168 15305 15310 15300 13800
MY Imports 44 44 50 50 50 50
TY Imports 44 44 50 50 50 50
TY Imp. from U.S. 0 0 0 0 0 0
Total Supply 13960 13960 15924 15929 15874 14779
MY Exports 4691 4691 5500 5500 5500 4200
TY Exports 4691 4691 5500 5500 5500 4200
Feed and Residual 7800 7800 9000 8600 8900 9150
FSI Consumption 900 900 900 900 900 900
Total Consumption 8700 8700 9900 9500 9800 10050
Ending Stocks 569 569 524 929 574 529
Total Distribution 13960 13960 15924 15929 15874 14779
Yield 4.93 4.93 5.5113 5.5131 5.1 4.7917
(1000 HA) ,(1000 MT) ,(MT/HA)
Millet 2015/2016 2016/2017 2017/2018 Market Begin Year Jul 2015 Jul 2016 Jul 2017
Russia USDA Official New Post USDA Official New Post USDA Official New Post
Area Harvested 440 440 406 406 250 250
Beginning Stocks 0 0 0 0 0 0
Production 565 565 625 625 400 400
MY Imports 0 0 0 0 0 0
TY Imports 0 0 0 0 0 0
TY Imp. from U.S. 0 0 0 0 0 0
Total Supply 565 565 625 625 400 400
MY Exports 0 0 0 0 0 0
TY Exports 0 0 0 0 0 0
Feed and Residual 320 320 375 375 150 150
FSI Consumption 245 245 250 250 250 250
Total Consumption 565 565 625 625 400 400
Ending Stocks 0 0 0 0 0 0
Total Distribution 565 565 625 625 400 400
Yield 1.2841 1.2841 1.5394 1.5394 1.6 1.6
(1000 HA) ,(1000 MT) ,(MT/HA)
Oats 2015/2016 2016/2017 2017/2018 Market Begin Year Jul 2015 Jul 2016 Jul 2017
Russia USDA Official New Post USDA Official New Post USDA Official New Post
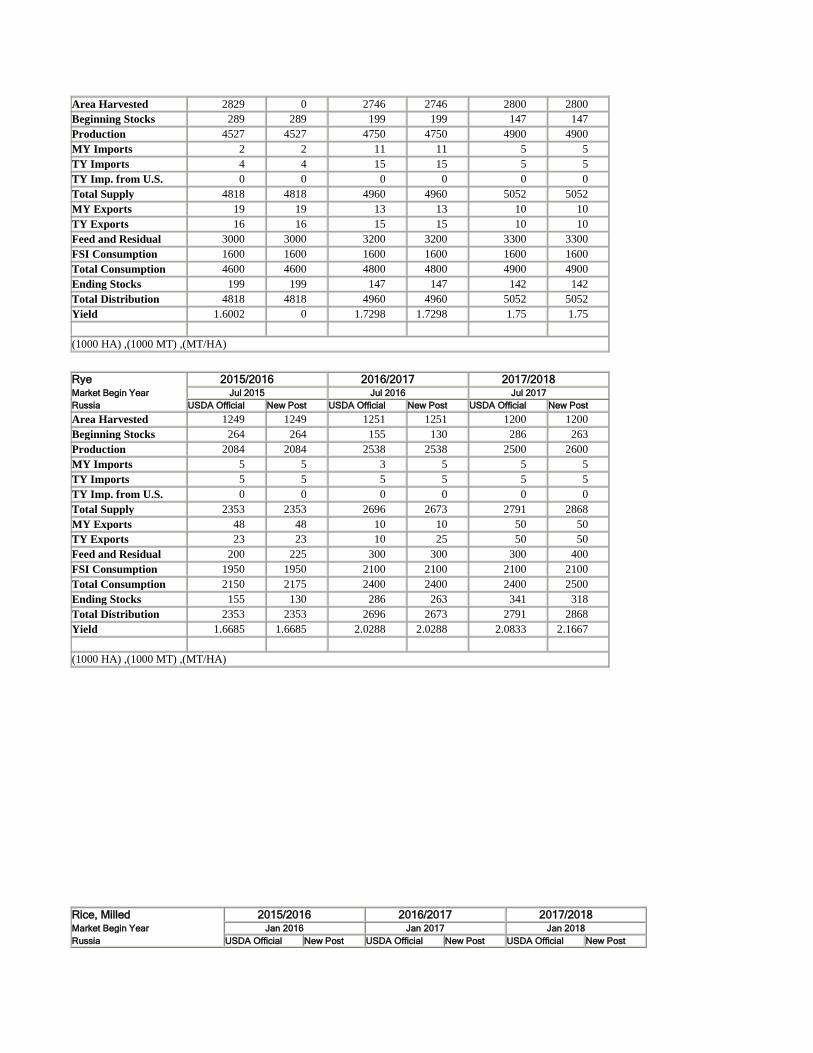
Area Harvested 2829 0 2746 2746 2800 2800
Beginning Stocks 289 289 199 199 147 147
Production 4527 4527 4750 4750 4900 4900
MY Imports 2 2 11 11 5 5
TY Imports 4 4 15 15 5 5
TY Imp. from U.S. 0 0 0 0 0 0
Total Supply 4818 4818 4960 4960 5052 5052
MY Exports 19 19 13 13 10 10
TY Exports 16 16 15 15 10 10
Feed and Residual 3000 3000 3200 3200 3300 3300
FSI Consumption 1600 1600 1600 1600 1600 1600
Total Consumption 4600 4600 4800 4800 4900 4900
Ending Stocks 199 199 147 147 142 142
Total Distribution 4818 4818 4960 4960 5052 5052
Yield 1.6002 0 1.7298 1.7298 1.75 1.75
(1000 HA) ,(1000 MT) ,(MT/HA)
Rye 2015/2016 2016/2017 2017/2018 Market Begin Year Jul 2015 Jul 2016 Jul 2017
Russia USDA Official New Post USDA Official New Post USDA Official New Post
Area Harvested 1249 1249 1251 1251 1200 1200
Beginning Stocks 264 264 155 130 286 263
Production 2084 2084 2538 2538 2500 2600
MY Imports 5 5 3 5 5 5
TY Imports 5 5 5 5 5 5
TY Imp. from U.S. 0 0 0 0 0 0
Total Supply 2353 2353 2696 2673 2791 2868
MY Exports 48 48 10 10 50 50
TY Exports 23 23 10 25 50 50
Feed and Residual 200 225 300 300 300 400
FSI Consumption 1950 1950 2100 2100 2100 2100
Total Consumption 2150 2175 2400 2400 2400 2500
Ending Stocks 155 130 286 263 341 318
Total Distribution 2353 2353 2696 2673 2791 2868
Yield 1.6685 1.6685 2.0288 2.0288 2.0833 2.1667
(1000 HA) ,(1000 MT) ,(MT/HA)
Rice, Milled 2015/2016 2016/2017 2017/2018 Market Begin Year Jan 2016 Jan 2017 Jan 2018
Russia USDA Official New Post USDA Official New Post USDA Official New Post
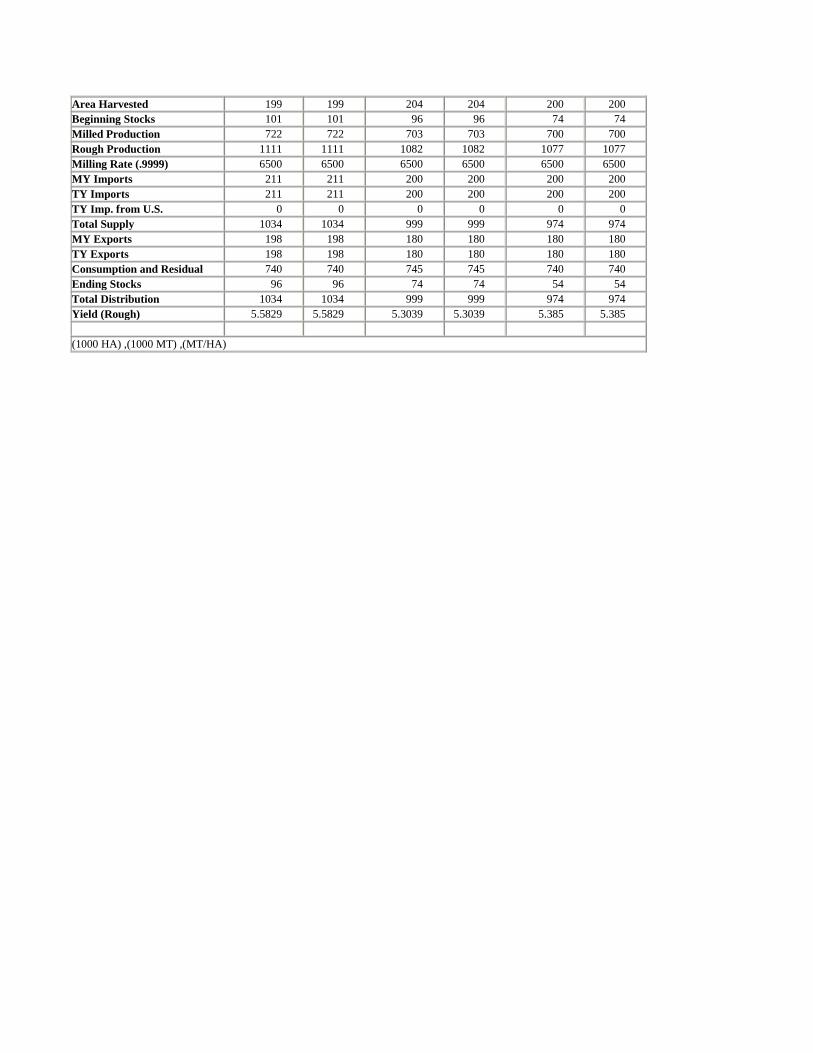
Area Harvested 199 199 204 204 200 200
Beginning Stocks 101 101 96 96 74 74
Milled Production 722 722 703 703 700 700
Rough Production 1111 1111 1082 1082 1077 1077
Milling Rate (.9999) 6500 6500 6500 6500 6500 6500
MY Imports 211 211 200 200 200 200
TY Imports 211 211 200 200 200 200
TY Imp. from U.S. 0 0 0 0 0 0
Total Supply 1034 1034 999 999 974 974
MY Exports 198 198 180 180 180 180
TY Exports 198 198 180 180 180 180
Consumption and Residual 740 740 745 745 740 740
Ending Stocks 96 96 74 74 54 54
Total Distribution 1034 1034 999 999 974 974
Yield (Rough) 5.5829 5.5829 5.3039 5.3039 5.385 5.385
(1000 HA) ,(1000 MT) ,(MT/HA)