Embed Size (px)
Citation preview

Russian energy policyin a broader context
Vladimir MilovPresident, Institute of Energy Policyhttp://www.energypolicy.ru
New York City, March 15, 2006
Popular mythology on the Russian energy policies and politics
• ‘President Putin is restoring justice by re-nationalizing the assets ‘stolen’ by oligarchs in the 1990s’
• ‘Re-nationalization of the Russian oil & gas industries benefits the public interests’
• ‘Russia may be able to build a successful economic policy through financing social programs and industrial development from oil & gas export revenues’
• ‘Russia will be able to establish competitive ‘national champions’ in energy to develop new ambitious projects and establish global leadership in energy’
None of these assertions are actually true
...in reality, however...
• Old oligarchs are simply replaced with new ones
• The state does not formally become the owner of oil & gas assets that are taken away from private owners
• National oil & gas companies pay far less taxes to the state than the old oligarchs did and do
• National oil & gas companies are so inefficient and corrupt that they are not capable of developing new ambitious projects
• ‘Petro-state’ concept simply does not work because there are not enough resources to implement it

The authorities clearly become obsessed with the ‘energy factor’ as the dominant component of the domestic and foreign policy
President Putin:
‘Today, energy serves as the key driving factor of the global economic progress. [???] Current and future condition of Russia depends on the place that we occupy in the global energy context. Such an ambitious task [as achieving global energy leadership] will act as a serious catalyst for modernization and qualitative breakthrough of the whole Russian economy’ (December 25, 2005)
Top Putin’s ideological aide Surkov:
‘Let’s just take what we are already capable of doing, and just do it better. I think that the concept of Russia as energy superpower fits such an approach just fine. If you have strong legs, better do the long-jumping, but not play chess’ (February 7, 2006)
But are there enough resources for a ‘superpower’?

Petro-state: too much population and too heavy domestic energy consumption to implement this concept
1162
2993
3319
3638
3744
4414
6319
6419
6686
7396
9746
10654
11100
12772
13399
19838
26774
29986
38590
0 20000 40000
Nigeria
Angola
Indonesia
Iraq
Ecuador
Azerbaijan
Venezuela
Algeria
Kazakhstan
Iran
Russia
Malaysia
Libya
Oman
Saudi Arabia
Kuwait
Qatar
UAE
Norway
0,2
0,9
1,0
1,0
1,4
1,7
1,9
2,7
3,0
3,9
4,0
4,9
10,8
16,5
17,4
44,5
45,7
45,8
59,2
0 20 40 60
Indonesia
Nigeria
Ecuador
Azerbaijan
Malaysia
Iraq
Iran
Kazakhstan
Russia
Angola
Algeria
Venezuela
Libya
Saudi Arabia
Oman
Kuwait
UAE
Norway
Qatar
Hydrocarbon exports per capita in various petro-states, 2003 (tons per capita, including oil, gas & petroleum products)
GDP per capita in various petro-states, 2004 (in 2004 USD by purchase power parity)
Source: The World Bank, IMF, IEA, CIA

However, the negative effects of petro-dollar pressure are already becoming visible...
• Softening budget policy: the non-interest expenses of the federal budget grew from 12.3% of GDP in 2004 to 16.7% of GDP in 2006
• Government’s financial plan for 2006-2008 is based on Urals price USD 51/bbl in 2006, USD 46/bbl in 2007-2008
• Yegor Gaidar: severe budget problems may occur if Urals price falls below USD 25/bbl
• Pension Fund deficits will rise to above USD 20bn from 2010
• Economic reforms are abandoned and replaced with ‘national projects’ (simply a budget spending related activities)
• RTSI grew by 2.4 times from May 2005 to March 2006
• Land prices in Moscow region jumped up 8-10 times in 2001-2006
• Apartment prices in Moscow jumped up 4-5 times in 2001-2006

Can Putin’s policy in the energy sector succeed?

2005: unsuccessful year for theRussian oil & gas sector
6,1
7,7
9
11
8,9
2,42,4
4,2
1,81,1
-1,1 -0,5
-2
0
2
4
6
8
10
12
2000 2001 2002 2003 2004 2005
OilGas
Source: Institute of Energy Policy
Annual growth rates in oil & gas production in Russia in 2000-2005, %

A few notes on oligarchs and their role...
300
400
500
600
1985 1987 1989 1991 1993 1995 1997 1999 2001 2003 2005
crud
e oi
l out
put i
n R
ussi
a, m
mtp
a
Beginning of restructuring and privatization
Beginning of active growth phase after 1998 price crisis
'Small economic miracle' - unexpected production growth led by private oil comapnies
Beginning of interventionist state policies - growth slowdown
Companies' consolidation, beginning of transnationalisation
1987 peak
Dramatic downfall of the centralized Soviet oil industry
Source: BP
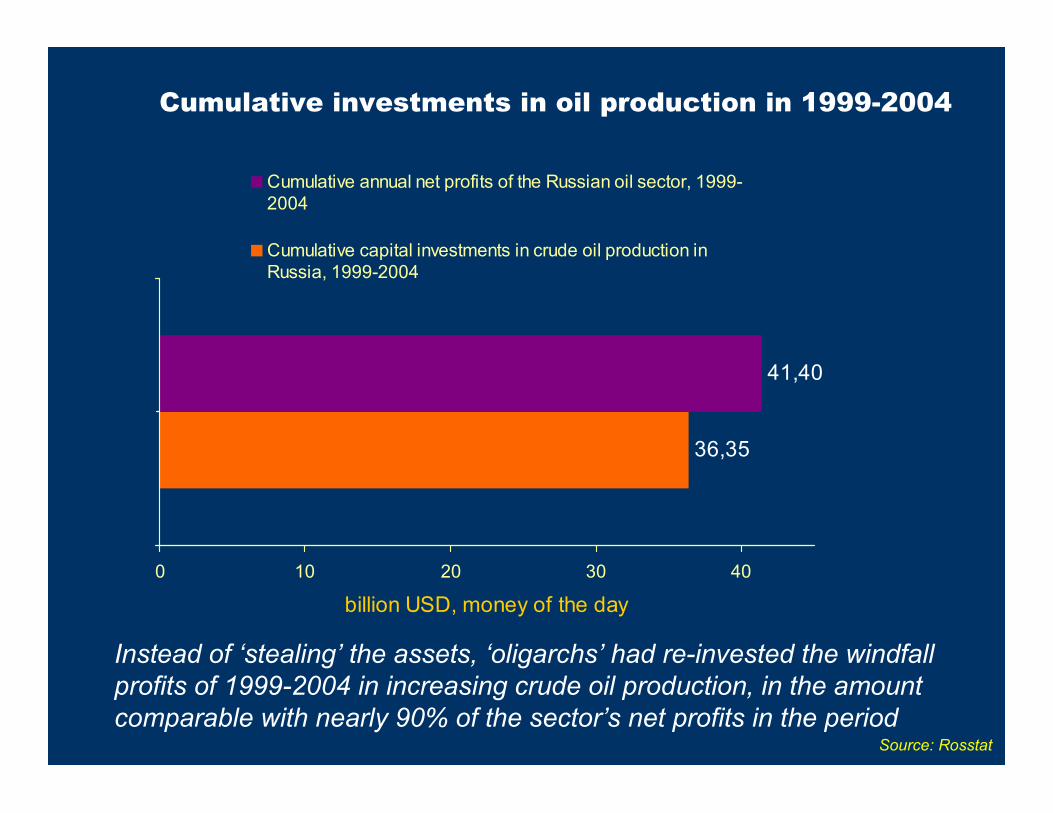
Cumulative investments in oil production in 1999-2004
36,35
41,40
0 10 20 30 40
billion USD, money of the day
Cumulative annual net profits of the Russian oil sector, 1999-2004
Cumulative capital investments in crude oil production inRussia, 1999-2004
Source: Rosstat
Instead of ‘stealing’ the assets, ‘oligarchs’ had re-invested the windfall profits of 1999-2004 in increasing crude oil production, in the amount comparable with nearly 90% of the sector’s net profits in the period

Privatized Russian oil sector had contributed most to the success of the Russian oil industry 2001-2004
Source: Oil & Capital
125
11
0
50
100
150
Annual surplus in oil production, 2004 as compared to 2000 (mtoe/year)
Private companies(Lukoil, Yukos,Surgutneftegaz, TNK-BP, Sibneft, Slavneft)State companies(Rosneft, Tatneft,Bashneft, Gazprom)

2004-2006: private sector not affected by state’s actions still doing much better
Average daily crude oil output by companies, 2004 – January 2006
Source: Oil & Capital
80%
90%
100%
110%
120%
Jan-04 May-04 Sep-04 Jan-05 May-05 Sep-05 Jan-06
% o
f the
Jan
uary
200
4 le
vel
Private-owned companies (Lukoil, Surgutneftegaz, TNK-BP, Slavneft)
Sibneft
Yukos + Yuganskneftegaz
State companies (Rosneft without YNG, Tatneft, Bashneft, Gazprom)

There was an alternative to Putin’s re-nationalization: trans-nationalization through mergers and acquisitions with IOCs, leading to de-politicized, internationally integrated and competitive oil sector in Russia
• Privatization of the 1990s was not fair
• But, it had created a well-established, internationally competitive oil sector in Russia
• Influence of oligarchs on the state’s policy was a strong negative factor
• But, privatized Russian oil sector was undergoing the process of M&As and internationalisation of oil companies (TNK-BP, YukosSibneft-ExxonMobil)

Source: Oil & Capital
Russian average daily crude output:can we reach 10.5-11 mbd?
7,5
8
8,5
9
9,5
Dec
embe
r 200
2
Febr
uary
200
3
April
200
3
June
200
3
Augu
st 2
003
Oct
ober
200
3
Dec
embe
r 200
3
Febr
uary
200
4
April
200
4
June
200
4
Augu
st 2
004
Oct
ober
200
4
Dec
embe
r 200
4
Febr
uary
200
5
April
200
5
June
200
5
Augu
st 2
005
Oct
ober
200
5
Dec
embe
r 200
5Aver
age
daily
pro
duct
ion
of o
il in
Rus
sia
milli
on b
arre
ls p
er d
ay
‘Great leap forward’ of the private Russian oil sector
Stagnation in average daily production caused by increased
administrative pressure on the sector But...
Some believed the growth had resumed...

Why sustainable growth of crude oil production was interrupted?
• Hostile ownership changes
• Increase of oil export taxes in 2004
• Ban over private oil pipeline Western Siberia-Murmansk and remaining oil export pipeline bottleneck
• Speculation on ‘barbaric production practices’
• The Yukos case

Current developments:towards state-dominated oil sector?
State-dominated companies
12%
Priv ate companies
88%
The structure of Russian crude production
2003 End of 2005
Who’s next – Slavneft? Tomskneft? Samaranegtegaz? Surgutneftegaz? If that scenario proceeds, the share of private oil companies in Russian crude production will be limited to less than 35%
Source: Institute of Energy Policy
State-dominated companies
35%
SurgutNG14%
Priv ate companies
51%
End of 2006 ?
State-dominated companies
67%
Priv ate companies
33%
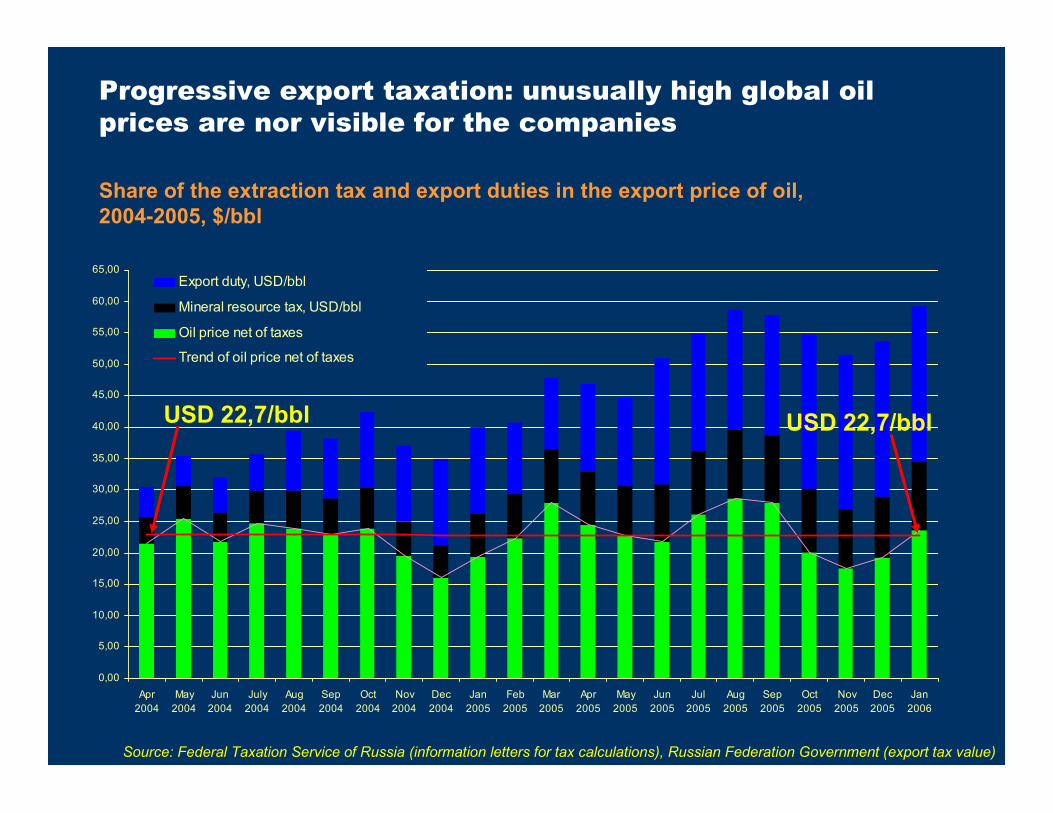
Source: Federal Taxation Service of Russia (information letters for tax calculations), Russian Federation Government (export tax value)
Progressive export taxation: unusually high global oil prices are nor visible for the companies
Share of the extraction tax and export duties in the export price of oil, 2004-2005, $/bbl
0,00
5,00
10,00
15,00
20,00
25,00
30,00
35,00
40,00
45,00
50,00
55,00
60,00
65,00
Apr2004
May2004
Jun2004
July2004
Aug2004
Sep2004
Oct2004
Nov2004
Dec2004
Jan2005
Feb2005
Mar2005
Apr2005
May2005
Jun2005
Jul2005
Aug2005
Sep2005
Oct2005
Nov2005
Dec2005
Jan2006
Export duty, USD/bbl
Mineral resource tax, USD/bbl
Oil price net of taxes
Trend of oil price net of taxes
USD 22,7/bbl USD 22,7/bbl

Russian oil pipeline infrastructure: the bottleneck continues to exist
Structure of 2004 Russian oil exports(including transit), mtoe
The Baltic:shallow waters,icing, Danish straits’marine trafficlimitations
Druzhba:a limited continentalmarket withunfavorable pricingenvironment
The Black Sea:Bosphorustraffic limitations
Other directionsare simplyunderdeveloped
Source: Institute of Energy Policy

East Siberian pipeline:too expensive to help Western Siberian exports
Source: Institute of Energy Policy estimate
15,7
20,1
20,8
86,3
94,3
99,0
101,2
0 20 40 60 80 100
West Siberia-western border
West Siberia-Novorossijsk
West Siberia-Primorsk
Taischet-Perevoznaya
Surgut-Omsk-Taischet-Perevoznaya
Surgut-Alexandrovskaya-Taischet-Perevoznaya
Surgut-Yurgamysh-Omsk-Taischet-Perevoznaya
USD/ton
The pipeline is too expensive to help more Western Siberian exports, whereas there’s
clearly not enough oil in Eastern Siberia to fill it

Oil production decline by Yukos subsidiaries in 2004-2005
Source: Oil & Capital
The Yukos factor made it’s obvious contribution to slowdown in production growth: minus 11 mmt in 2005.
If that did not happen, Russian oil production growth could have reached 4.8% in 2005 instead of just 2.4%
-24,70% -25,20%
-36,00%-37,10%
-40,00%
-35,00%
-30,00%
-25,00%
-20,00%
-15,00%
-10,00%
-5,00%
0,00%
Decline in % to August 2004
Decline in % toFebruary 2004
SamaraNefteGazTomskNeft
Average daily production decline in January 2006...

Gazprom: production decline on matured gas fields appears to be RATHER SHARP
545,6523
505477
460,7441,5
427,8
7
37 6488
100
8,115,5 15,6 15
4,5
1999 2000 2001 2002 2003 2004 2005*
Northgaz (taken over in 2005)
Purgaz (taken over in 2002)
Zapolyarnoye gas field
Gazprom production net of Zapolyarnoye and Purgaz
Source: Institute of Energy Policy; * - preliminary
Matured fields: over 20% decline in 6 years!

Gas production on Gazprom’s mature gas fields would continue to rapidly decline
2004 2010 2015 2020
bcm
pa
OtherOrenburgAstrakhanUrengoy (achimov)Yeti-PurovskoyeSouth RusskoyeVyngayakhinskoyePestsovoyeYubilyeynoeWest TarkosalinskoyeKomsomolskoyeZapolyarnoyeMedvezheAneryakhinskoyeKharvutinskoyeYamburgYen-YakhinskoyeUrengoy
Source: Jonathan Stern, Oxford Institute for Energy Studies, ‘The future of Russian gas and Gazprom’, 2005
Urengoy and Yamburg will decline by 30% by 2010 as compared to 2004!

The same story in the gas sector: increasing state domination kills the growth in the independent gas producers’ sector
5,7
9,712
4
13
30,3
0
5
10
15
20
25
30
35
2000 2001 2002 2003 2004 2005Source: Institute of Energy Policy
Annual growth rates in gas production by Russian independent gasproducers in 1999-2005, %

State-dominated energy monsters: dinosaurs of Soviet* and early 1990s**economic practices
* Gazprom** Rosneft

Development of new Yamal gas fields is delayed again
The story repeats itself: in 2000, Gazprom had asked for prolongation of the licenses for large Yamal fields, which, under previous license terms, should have been brought on-stream by second half of the 1990s
Even the project rationale is not yet approved by Gazprom management. It is clear that these fields will not be brought on-stream before 2011-2012
No clear on-stream introduction schedule
In 2001, on-stream introduction term was postponed from 1997 to 2007
In 2001, on-stream introduction term was postponed from 1995 to 2012
In 2001, on-stream introduction term was postponed from 1995 to 2009
Bovanenkovskoye
Kharasaveyskoye
Novoportovskoye

Rosneft: profile of the new ‘champion’
Oil production of the core Rosneft subsidiaries had been stagnating during the whole period of 2000-2005
Source: Oil & Capital
Average daily crude oil production by major Rosneft subsidiaries in 2000-2005, thousand tons per day
0,0
2,0
4,0
6,0
8,0
10,0
SakhalinmorneftegazKrasnodarneftegazStavropolneftegazPurneftegaz (right axis)

Heavy debt burden of state-linked oil & gas corporations complicates financing of new investment projects
• Gazprom’s debt after 9m 2005 – USD 26.8 bn
• Extra borrowings made to finance Sibneftacquisitions – USD 13 bn
• Financing of Yamal, Shtokman, NEP would require over USD 80 bn
• Rosneft’s debt after 9m 2005 – USD 11.4 bn
• Financing of East Siberian and Far East projects would require over USD 20 bn

State oil & gas companies are obviously not efficient as compared to private Russian and international oil & gas companies
-2,87,3
9,513,4
14,816,4
17,919,619,7
21,322,222,3
23,525,8
28,830,430,6
33
Pemex
Rosneft
Gazprom
BP
Novatek
ConocoPhillips
Shell
British Gas
PetroCanada
Lukoil
Total
ExxonMobil
Chevron Texaco
PetroChina
ENI
Statoil
Yukos (2002)
Sibneft
ROTA (return on total assets)of international oil & gas companies, 2004 (unless otherwise indicated)
Source: companies’ financial reports

State companies are ‘champions’ in hostile takeovers, not in the payment of taxes
19,223,0
50,8
68,0
53,1
83,0
51,1
93,7
74,4
112,6
0,0
20,0
40,0
60,0
80,0
100,0
2003 2004
Taxe
s pa
id to
Rus
sian
bud
get,
US
D p
er to
e(m
oney
of 2
004)
Gazprom Rosneft TNK-BP
Sibneft Lukoil
Source: companies’ IFRS financial reports

Are Russian policies in the oil & gas sector adequate to future challenges?

The strategic crossroads of the Russian oil & gas sector policy
Future of the oil & gassector depends on
greenfield development
New era requires new oil & gas sector policies
Brownfield ageis expiring

Are Russian oil & gas sector policies adequateto the new greenfield era?
Tax policy
Restoration ofstate domination
Closing doors todirect foreign
investment
• Green fields obviously require tax incentives• Particularly long-term and capital consuming projects
require restoration of adequate PSA regime
• Debt burden complicates new investment• Corruption and non-transparency increase costs and
threaten projects’ efficiency
• Russian financial system is not ready to provide long-term financing for capital consuming and risky projects as development of the new greenfield areas requires
• Russian companies do not possess the necessary technologies
Under present policies, successful development of new greenfield areas is impossible

Energy imperialism

Things important to understand about the Russian-Ukrainian gas crisis
• WHY did not Russia follow the path of compromise and the rule oflaw (arbitration), if this was just about prices?
• WHY had Russia outrageously demanded reconsideration of a 5-year ‘unchangeable’ agreement signed just a year ago and cheeredby Gazprom even in June 2005?
• WHY the most risky and inefficient option of cutting off gas supplies was chosen, which brought limited effect and put European gas consumers at risk?
• WHY did not Russia undertake measures to protect European consumers from possible transit risks (reserved relevant amounts of gas in European storage facilities etc.)?
• WEREN’T Russian officials irresponsible, ignorant, and lying?
Was the price issue important at all?

The importance of Ukrainian gas transit for Russia
Belarus
Blue Stream
Ukraine
Baltic pipeline
Belarus
Blue Stream
Ukraine
The structure of Russian gas export corridors
Today After the Baltic pipeline is fully commenced (55 bcmpa, 2012?)
We need a clear, sustainable and mutually respectfulgas transit solution with Ukraine, not muscles
Source: Gazprom

Gazprom: 2004 agreement with Ukraine‘very advantageous’
• A.Ryazanov, deputy CEO of Gazprom, June 7 2005:
‘The gas supply price to Ukraine is not high, but I think that the agreement [of August 2004] with Ukraine is very advantageous to us, since we have low transit fare’
• Original of the briefing:http://www.gazprom.ru/articles/article16998.shtml

• 15 bcm of reexport through RosUkrEnergo
• 57 bcm – Ukrainian imports
• 17 bcm of Russian gas• 8 bcm of Kazakh gas• 7 bcm of Uzbek gas• 41 bcm of Turkmenian gas
• WHY did Russia transfer to RosUkrEnergo the rights to export 15 bcm of Kazakh and Uzbek gas and the option for gas reexport?
• DOES the switch from direct 12-year contract relations between Gazprom and Naftogaz Ukrainy to operations through a non-transparent intermediary mean ‘transfer to transparent market relations’?
• WHY in Gazprombank’s IFRS report of H1 2005 RosUkrEnergo is listed among companies whose results are not consolidated because the bank ‘does not execute control or significant influence’ over them, despite 50% equity ownership in RosUkrEnergo by Gazprombank and a member of Gazprom’s executive board being a co-chair of RUE?
• WHO’S REALLY BEHIND ROSUKRENERGO?
RosUkrEnergo: is that what it is all about?

With this background, Russian official G8 energy security proposals are a bit ‘out of this world’...
• A sharp contrast between rhetoric and official Russian policies
• Who’s the first to blame for ‘energy egoism’?
• Why the issue of uneven distribution of oil & gas resources and access of the IOCs to their development is not addressed in the Russian proposals?
• Are we being set for a ‘fake summit’?

Some conclusions
• Various forms of administrative intervention policies had brought the era of growth in the Russian oil & gas sectors to an end
• Oil & gas corporations linked to the state obviously are ill-equipped to sustain further growth and development, Gazprom in particular
• Economic regime in the oil & gas sectors is simply not adapted to ‘greenfield challenge’
• The new environment in the Russian oil & gas sectors is obviously not adequate for the goals of development
• Re-nationalization of oil & gas assets does not benefit the public interests
• Russia has not enough resources to build a successful ‘petro-state’• Energy imperialism of the Russian authorities is quite a worrying trend• It looks like, in the long run, the policies of the Russian authorities
may lead to a total failure on all dimensions