Embed Size (px)
Citation preview
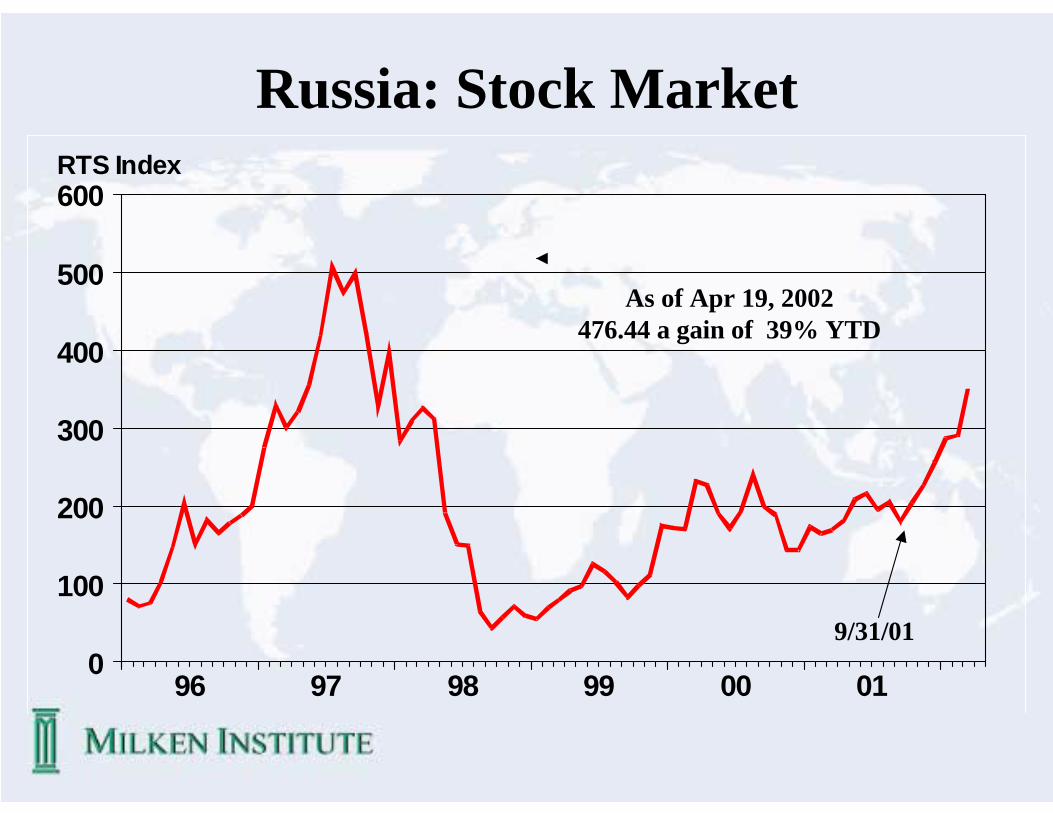
Russia: Stock Market
9/31/01
As of Apr 19, 2002476.44 a gain of 39% YTD
010099989796
600
500
400
300
200
100
0
RTS Index
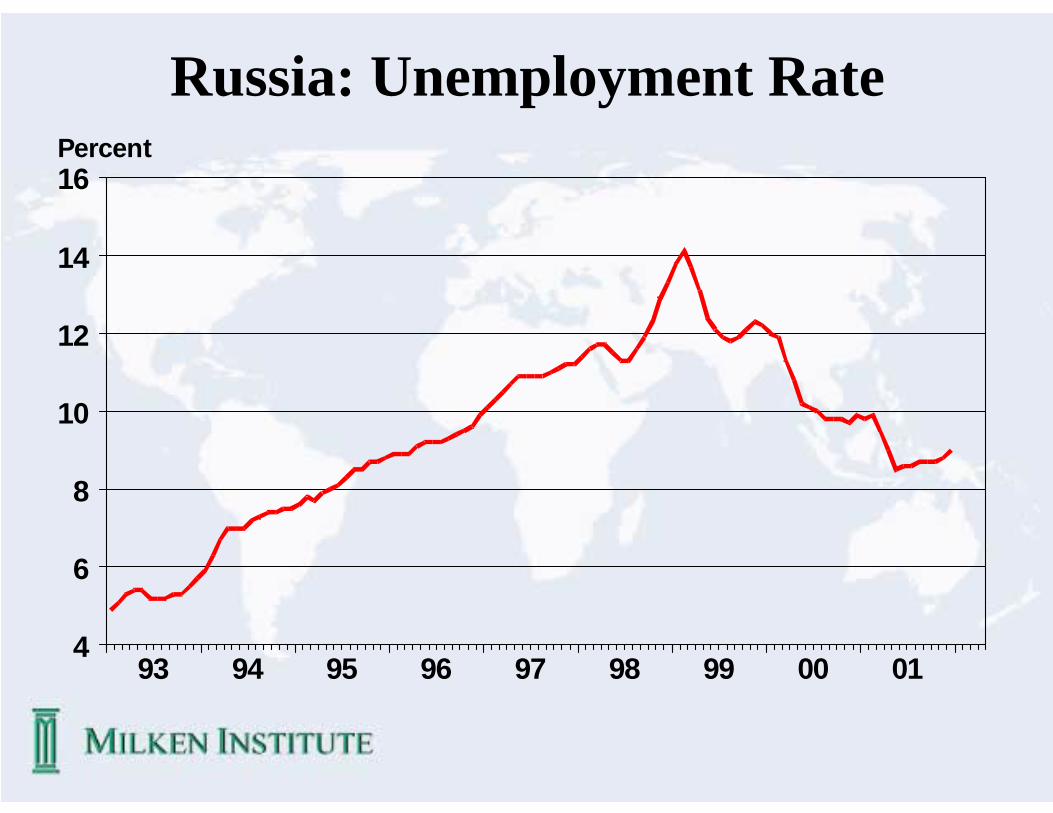
Russia: Unemployment Rate
010099989796959493
16
14
12
10
8
6
4
Percent
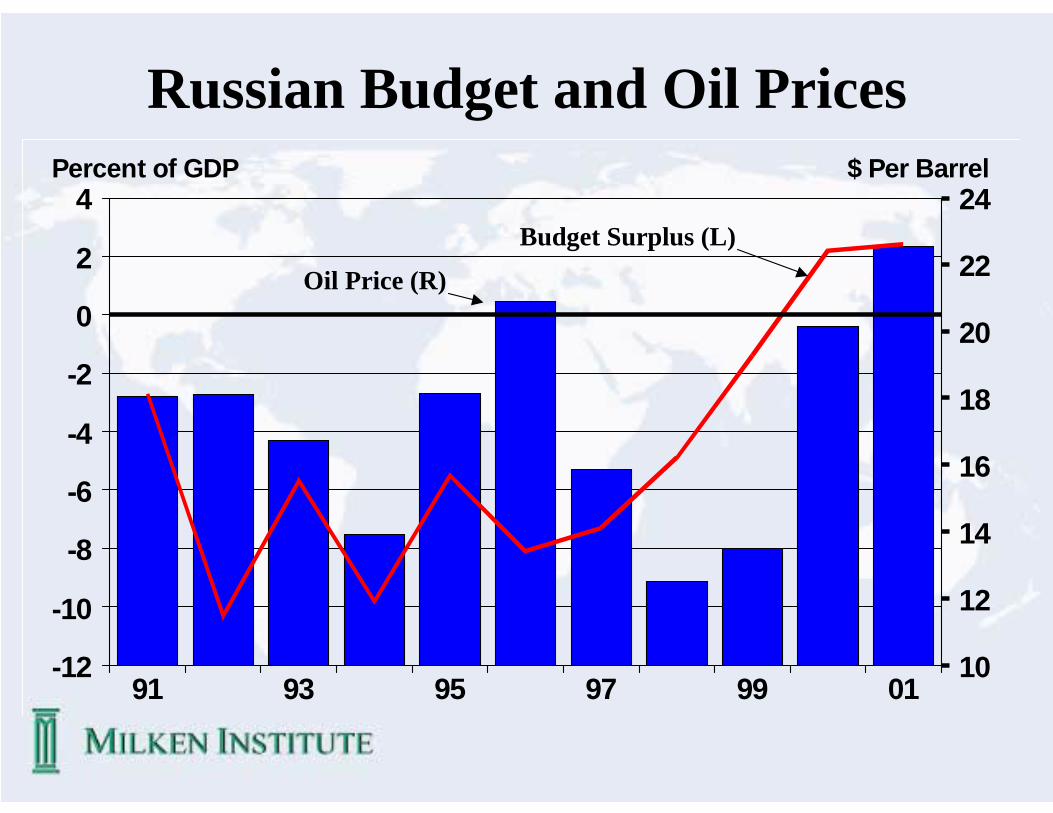
Russian Budget and Oil Prices
019997959391
4
2
0
-2
-4
-6
-8
-10
-12
24
22
20
18
16
14
12
10
Percent of GDP $ Per Barrel
Budget Surplus (L)
Oil Price (R)
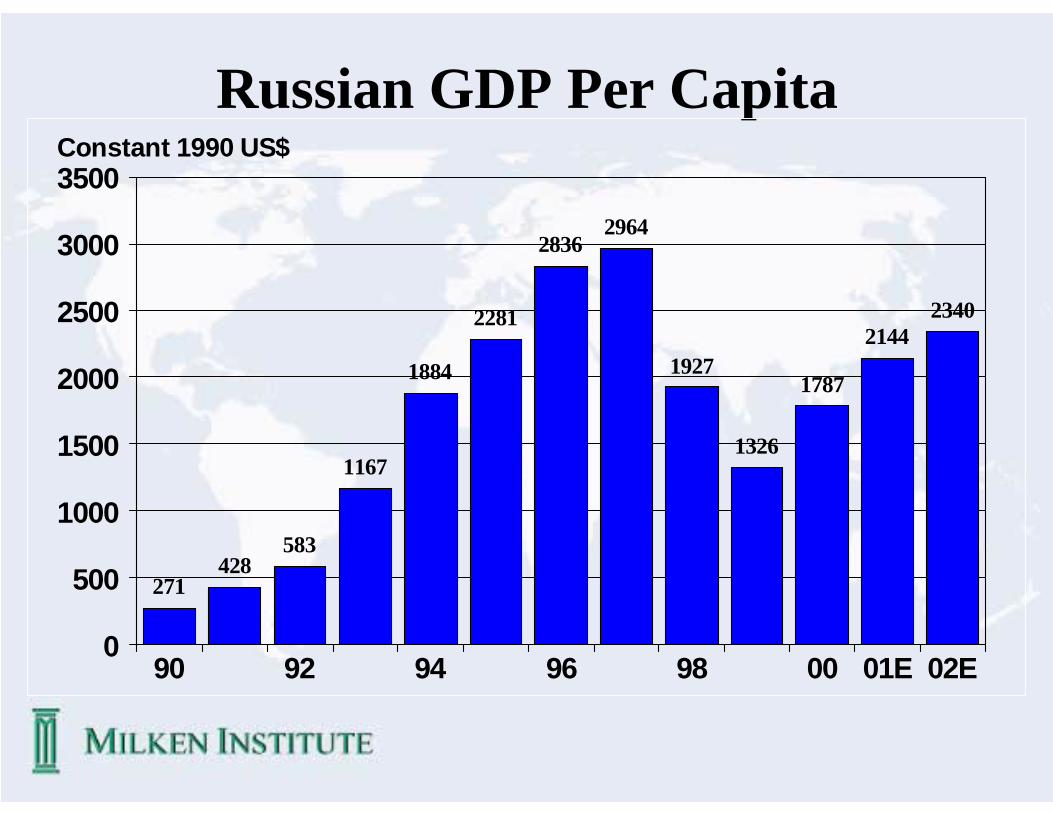
Russian GDP Per Capita
02E01E009896949290
3500
3000
2500
2000
1500
1000
500
0
Constant 1990 US$
23402144
1787
1326
1927
29642836
2281
1884
1167
583428
271

Russian Exchange Rate and Inflation
2001200019991998199719961995
350
300
250
200
150
100
50
0
-50
Percent Change
Ruble/$Devaluation
Inflation
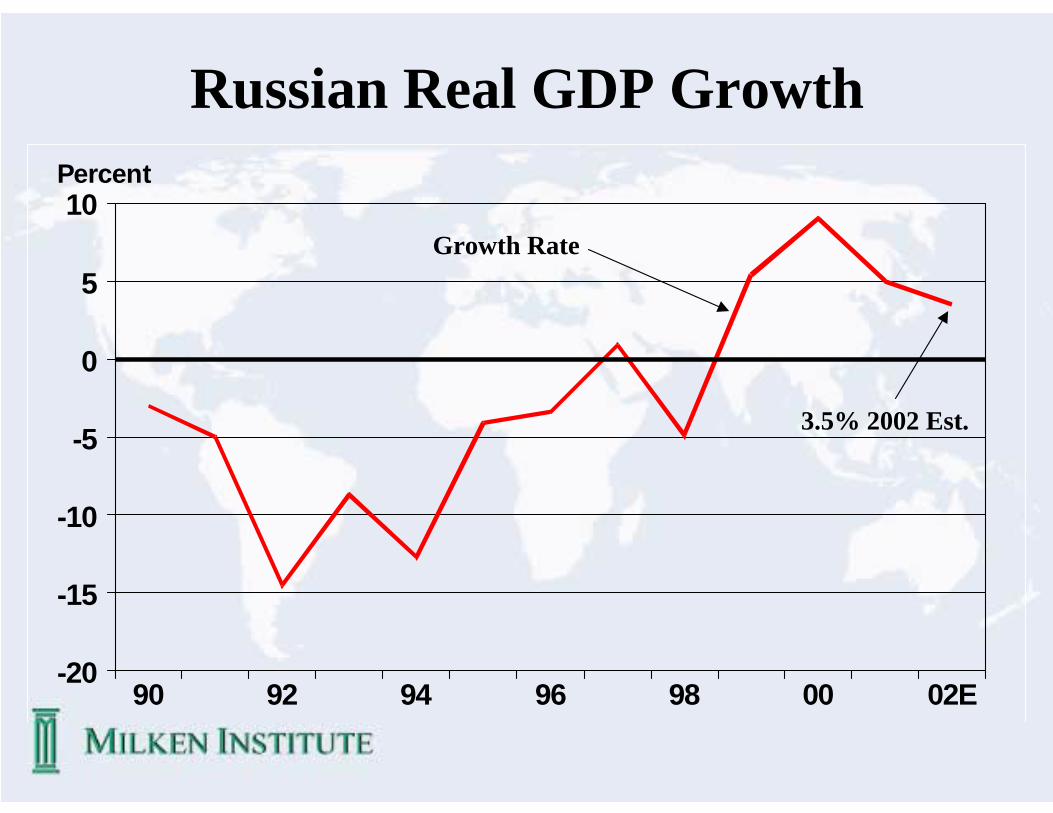
Russian Real GDP Growth
Growth Rate
3.5% 2002 Est.
02E009896949290
10
5
0
-5
-10
-15
-20
Percent
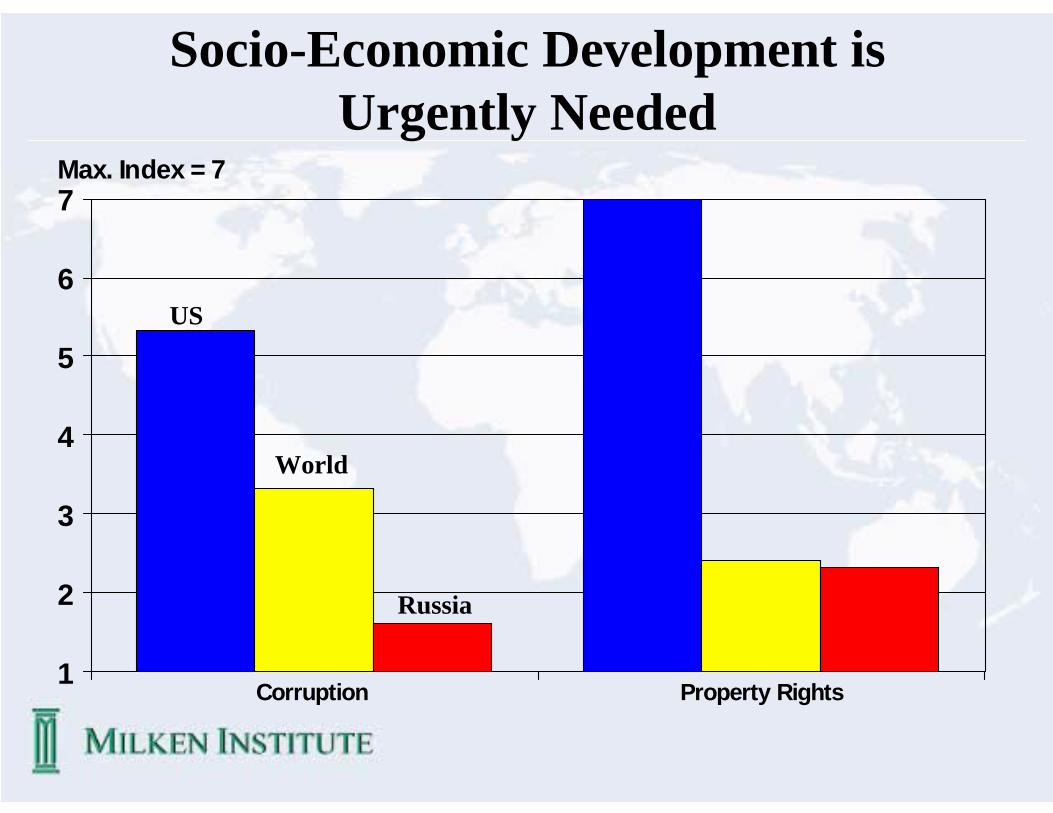
Property RightsCorruption
7
6
5
4
3
2
1
Max. Index = 7
Socio-Economic Development is Urgently Needed
US
World
Russia
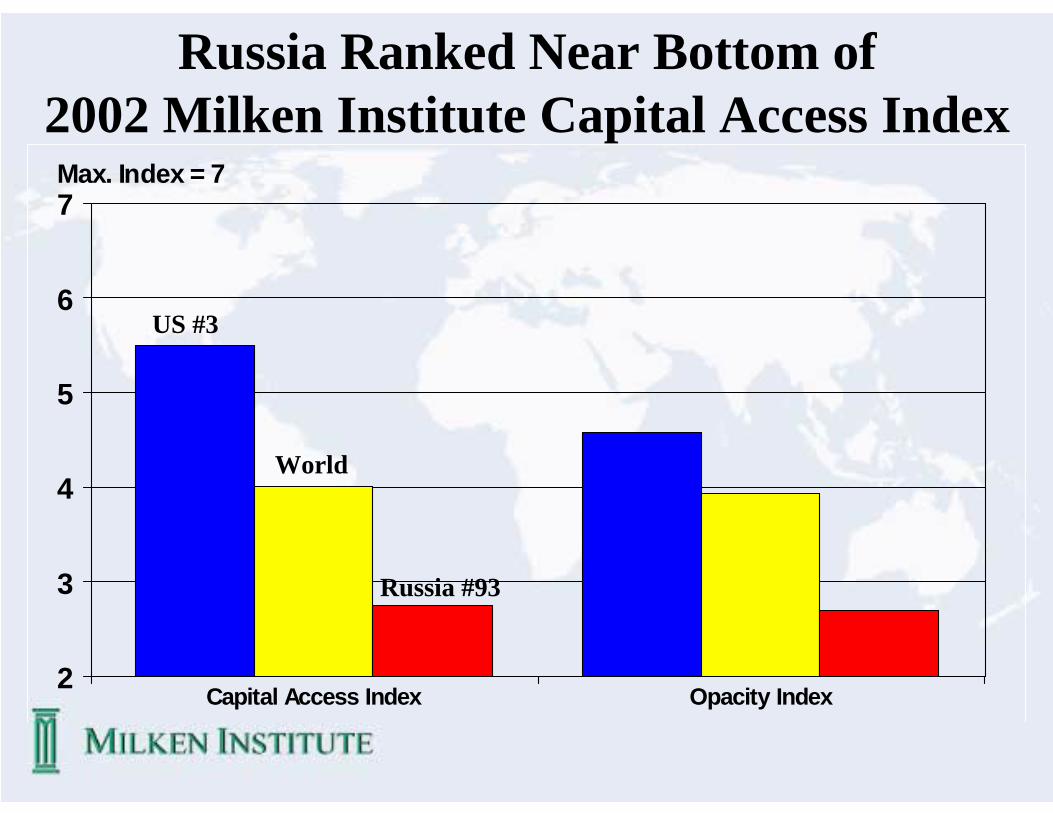
Russia Ranked Near Bottom of 2002 Milken Institute Capital Access Index
Opacity IndexCapital Access Index
7
6
5
4
3
2
Max. Index = 7
US #3
World
Russia #93
A Place In The Sun
"To secure our place under the economic
sun, we have to fight by ourselves."
President Vladimir PutinApril 18, 2002
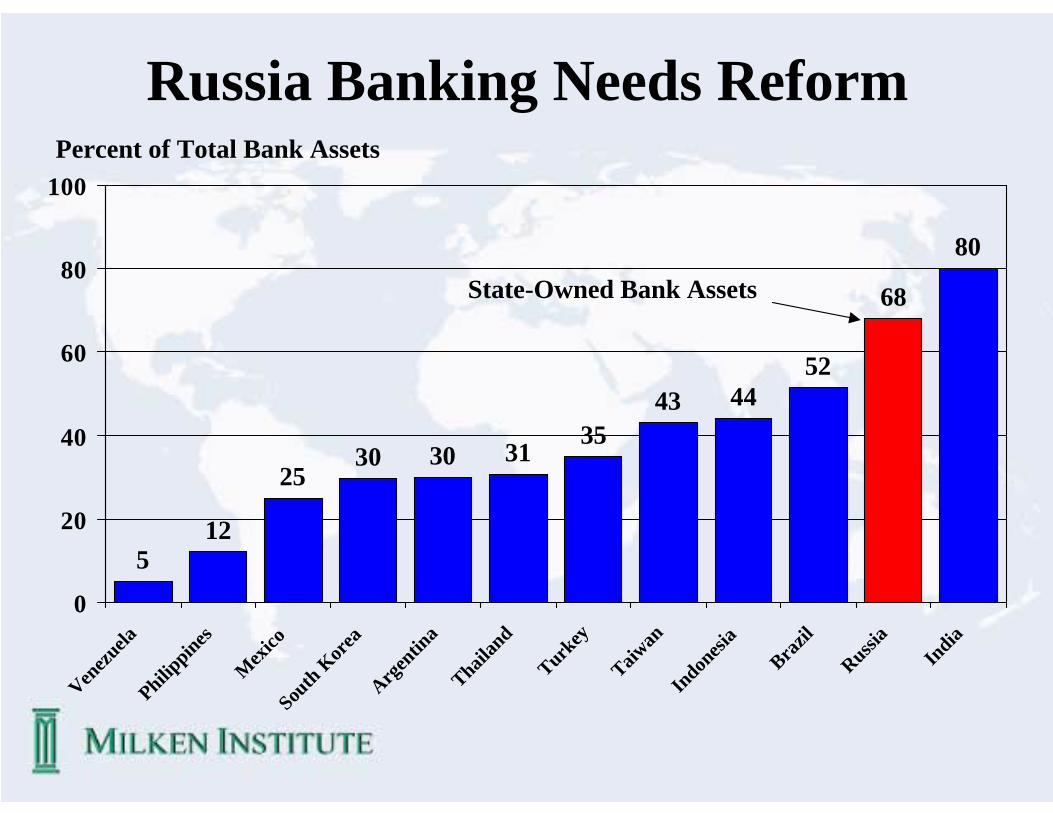
Russia Banking Needs Reform
512
2530 30
3543 44
52
68
80
31
0
20
40
60
80
100
Venezu
elaPhilip
pines
Mexi
coSou
th Kore
aArg
entin
aThail
and
Turkey
Taiwan
Indonesi
a
Brazil
Russia
India
Percent of Total Bank Assets
State-Owned Bank Assets

Russia: Trade Balance
2001200019991998199719961995199419931992
12
10
8
6
4
2
0
-2
US$ Billions
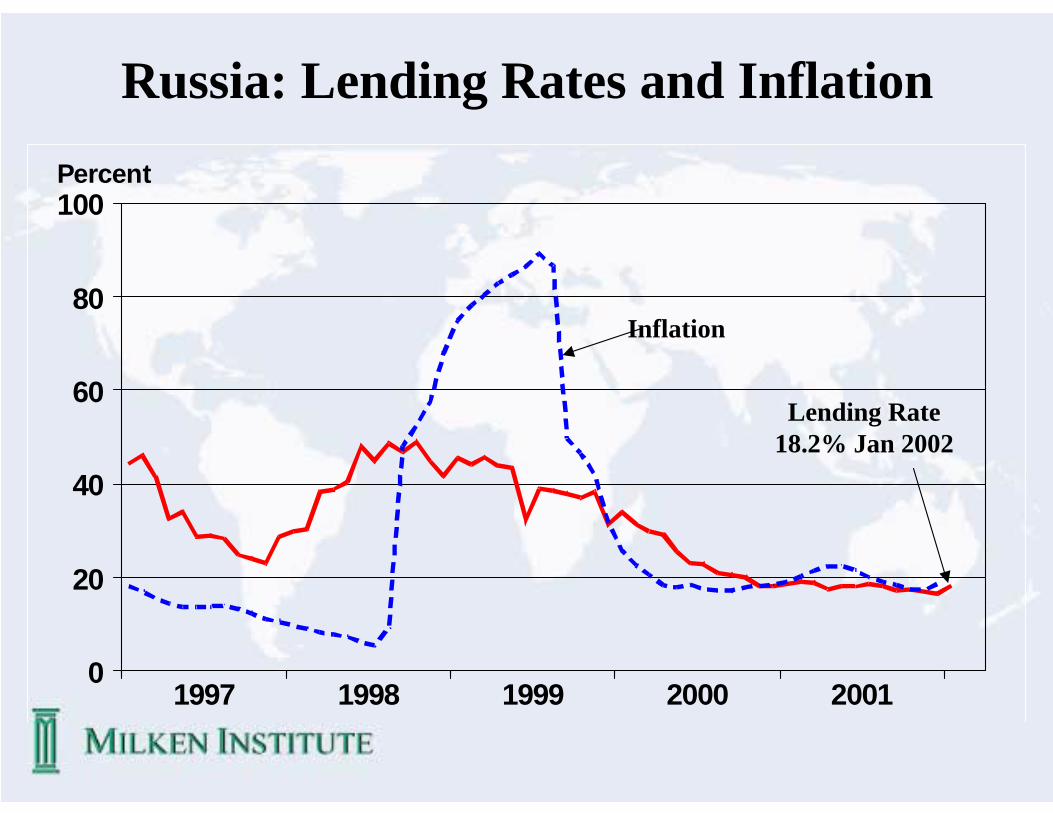
Russia: Lending Rates and Inflation
Lending Rate18.2% Jan 2002
Inflation
20012000199919981997
100
80
60
40
20
0
Percent

200120001999
300
250
200
150
100
50
1999 = 100
Nominal
Real
Diverging Dollar Exchange Rates in Russia…
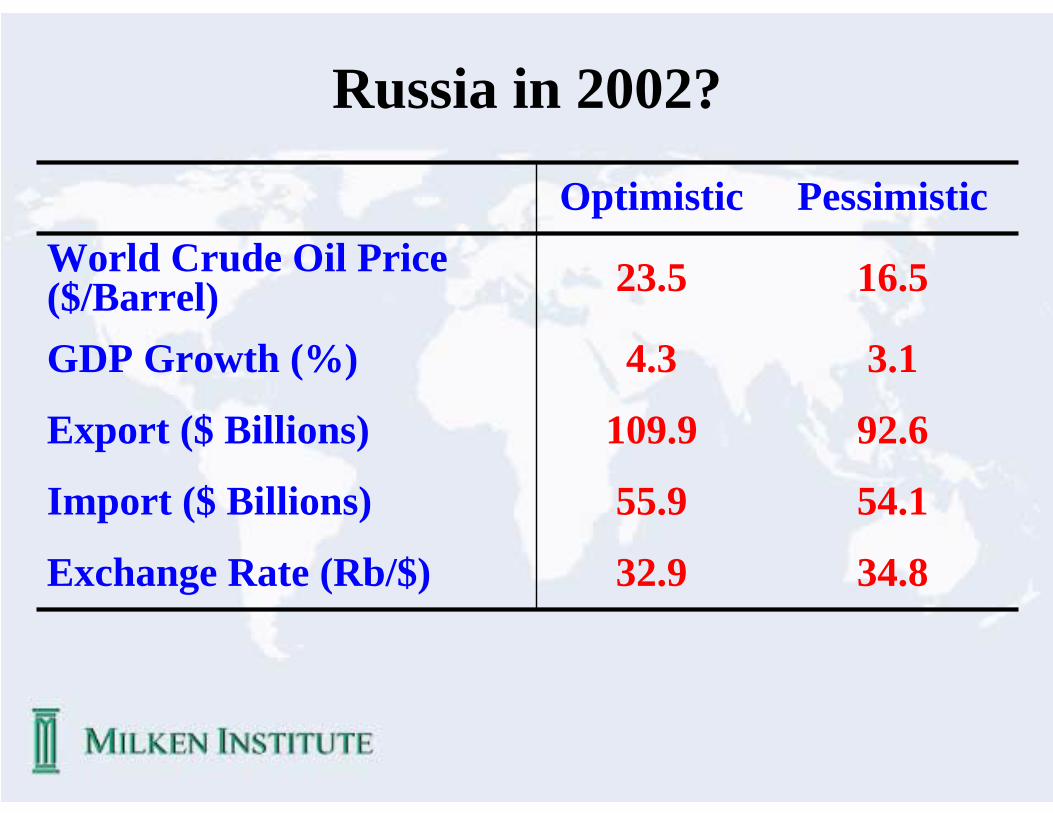
Russia in 2002?
34.832.9Exchange Rate (Rb/$)
54.155.9Import ($ Billions)
92.6109.9Export ($ Billions)
3.14.3GDP Growth (%)
16.523.5World Crude Oil Price ($/Barrel)
PessimisticOptimistic
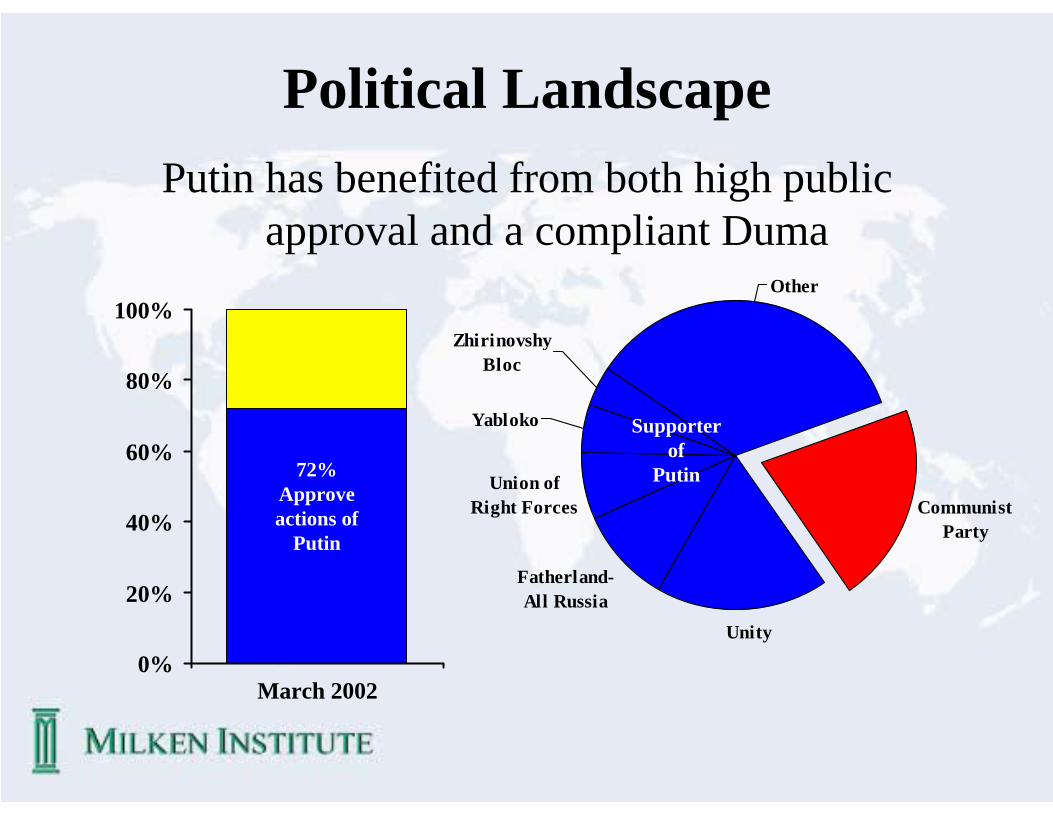
Political LandscapePutin has benefited from both high public
approval and a compliant Duma
0%
20%
40%
60%
80%
100%
Fatherland-All Russia
Communist Party
Unity
Other
Union of Right Forces
Yabloko
Zhirinovshy Bloc
March 2002
72%Approve actions of
Putin
Supporter of
Putin

ReformsFor the first time in the history of modern Russia,
significant reforms are being implemented2001 20022000
Judicial Reform
Business DeregulationLabor Cost
Banking ReformLand Code
Bankruptcy Reform
Pension ReformNatural Monopolies
Tax Reform
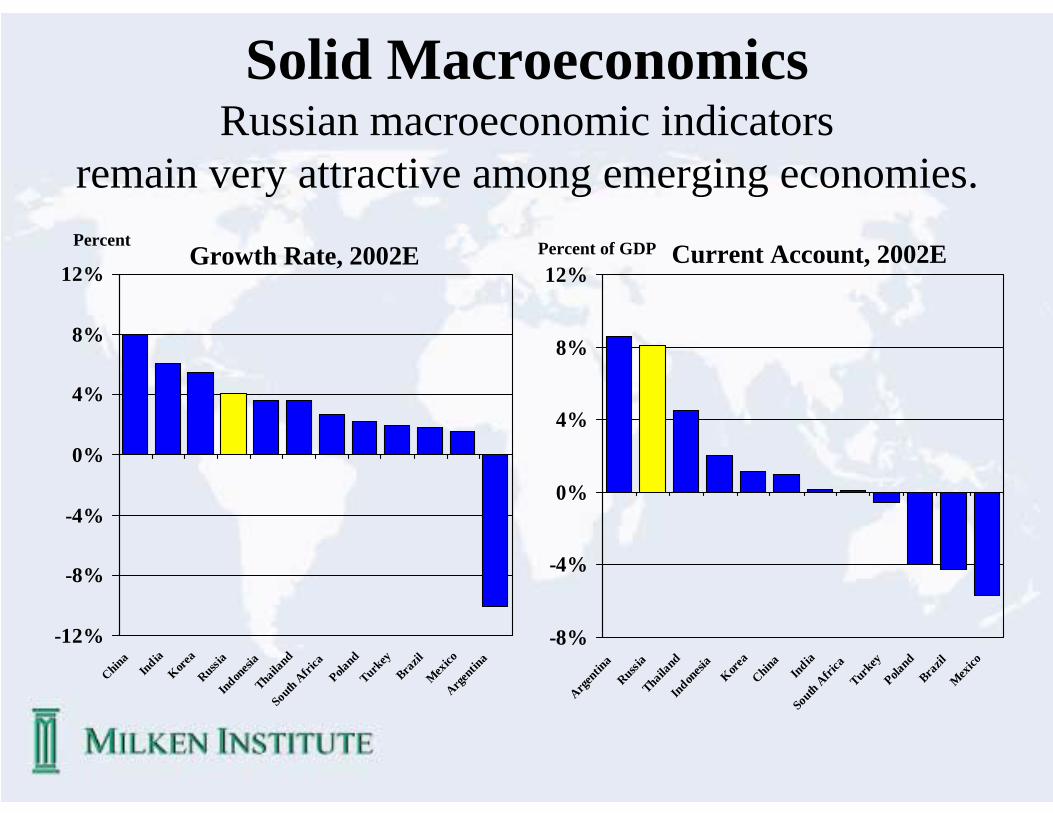
Solid MacroeconomicsRussian macroeconomic indicators
remain very attractive among emerging economies.
-12%
-8%
-4%
0%
4%
8%
12%
ChinaIndiaKore
aRussi
aIndon
esia
Thailand
South Africa
Poland
Turkey
Brazil
Mexico
Argentin
a
-8%
-4%
0%
4%
8%
12%
Argentin
aRussi
aThaila
ndIndon
esia
Korea
China
IndiaSouth Afri
caTurk
eyPola
ndBra
zilMex
ico
PercentGrowth Rate, 2002E Current Account, 2002EPercent of GDP
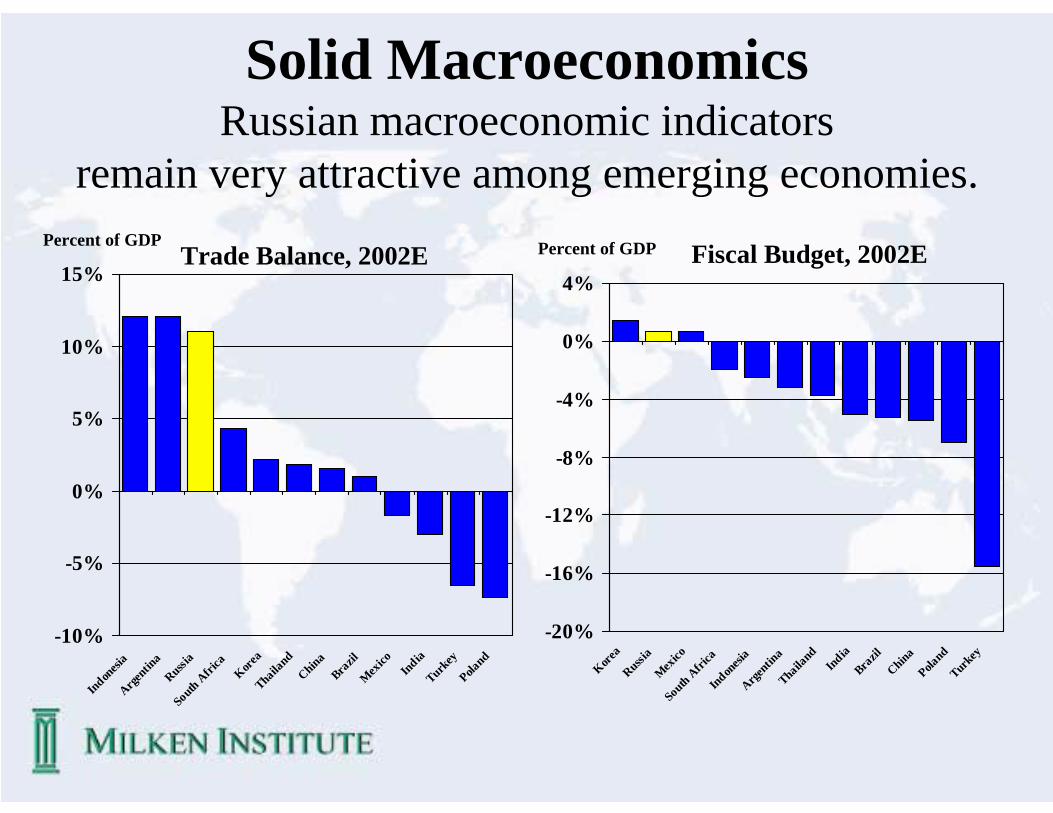
Solid MacroeconomicsRussian macroeconomic indicators
remain very attractive among emerging economies.
-10%
-5%
0%
5%
10%
15%
Indonesi
aArge
ntina
Russia
South Africa
Korea
Thailand
ChinaBra
zilMex
icoIndia
Turkey
Poland
-20%
-16%
-12%
-8%
-4%
0%
4%
Korea
Russia
Mexico
South Africa
Indonesi
aArge
ntina
Thailand
IndiaBra
zilChinaPola
ndTurk
ey
Percent of GDPTrade Balance, 2002E Fiscal Budget, 2002EPercent of GDP

Fixed Income vs. EquityRussian sovereign debt is already trading at lower yield than
Global Emerging Markets.1400
1200
1000
800
600
400
Basis Points
EMBI Russia Bond Spread
EMBI Global Emerging Markets Spread
4/15/021/1/021/1/01
636
468

Fixed Income vs. EquityDespite the recent rally, Russia remains one of the the
cheapest emerging equity market in the world.
P/E Ratios of Emerging Markets, 2002E
0
5
10
15
20
25
Taiwan
Argen
tina
Phillippine
sM
alaysi
aChil
iThail
and
China
Poland
Mex
ico
MSCI E
merg. M
kt.Kor
eaIn
diaCzec
h Rep
.Rus
siaBra
zilIndon
esia
Times
0
1000
2000
3000
4000
5000
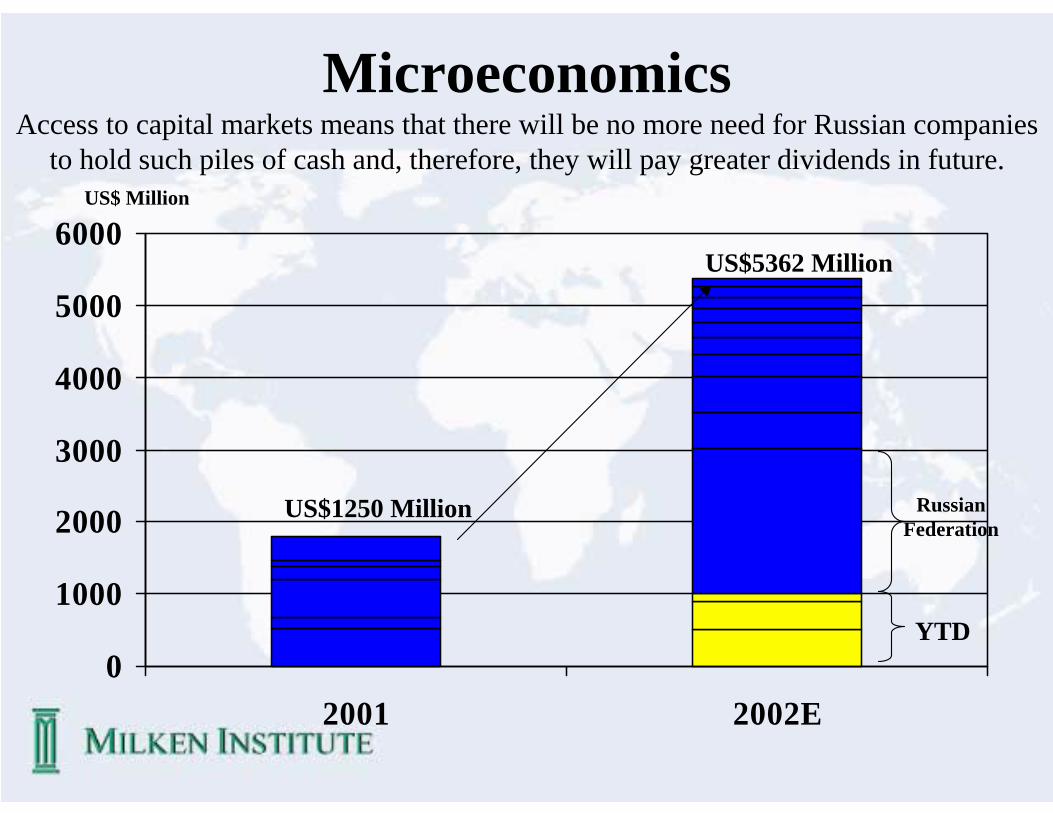
6000
2001 2002E
MicroeconomicsAccess to capital markets means that there will be no more need for Russian companies
to hold such piles of cash and, therefore, they will pay greater dividends in future.US$ Million
US$1250 Million
US$5362 Million
YTD
Russian Federation
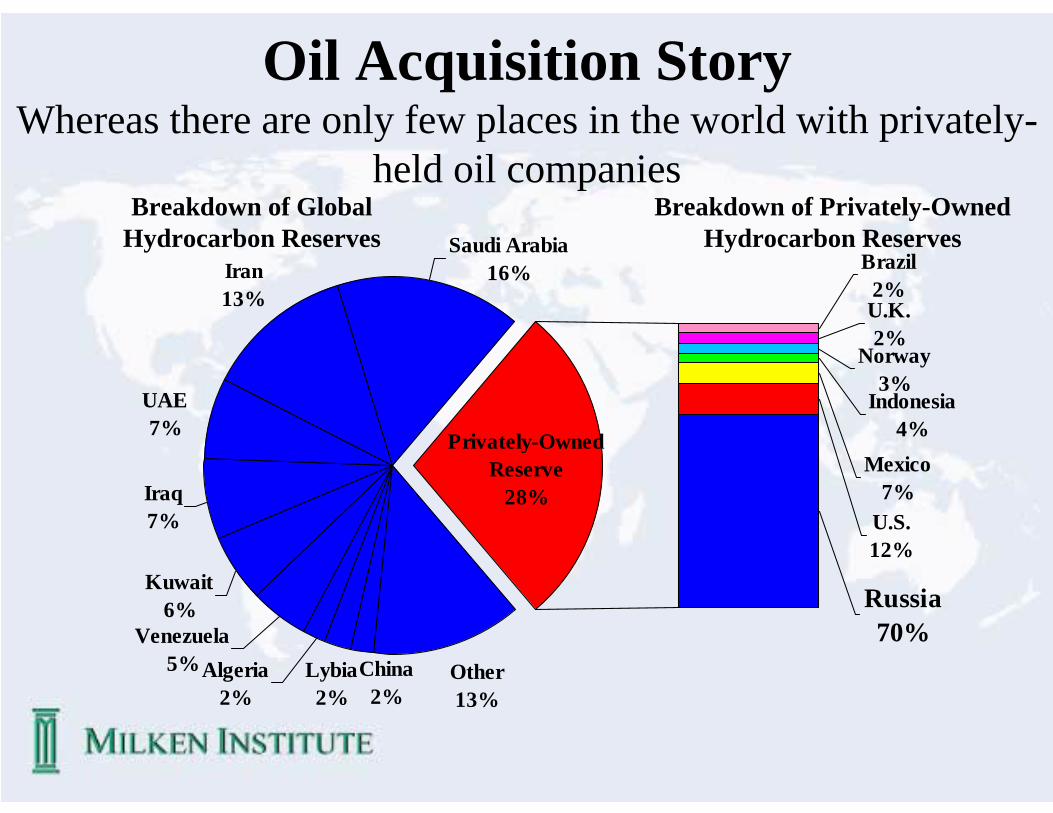
Oil Acquisition Story Whereas there are only few places in the world with privately-
held oil companiesBreakdown of Global
Hydrocarbon ReservesBreakdown of Privately-Owned
Hydrocarbon Reserves
Other13%
Iran13%
Saudi Arabia16%
Privately-Owned Reserve
28%
Venezuela5%Algeria
2%Lybia2%
China2%
Kuwait6%
Iraq7%
UAE7%
U.K.2%
Brazil2%
U.S.12%
Mexico7%
Indonesia4%
Norway3%
Russia70%

Oil Acquisition Story
1.0
4.1
0
2
4
6
8
10
12
Statoil
Nors
k-Hyd
roCon
co ENIRep
solTota
lFinaElf
AverageShell BP
Russian A
verage
SibneftYukos
Surgutneft
egazLukoilTatn
eftGazp
rom
US$ per Barrel of Oil Equivalent
Price per Barrel of Reserve for Russian
Companies
Average Cost of Adding New
Reserves for Global Oil Companies
78% Discount
It is much cheaper to buy Russian assets than find new reserves
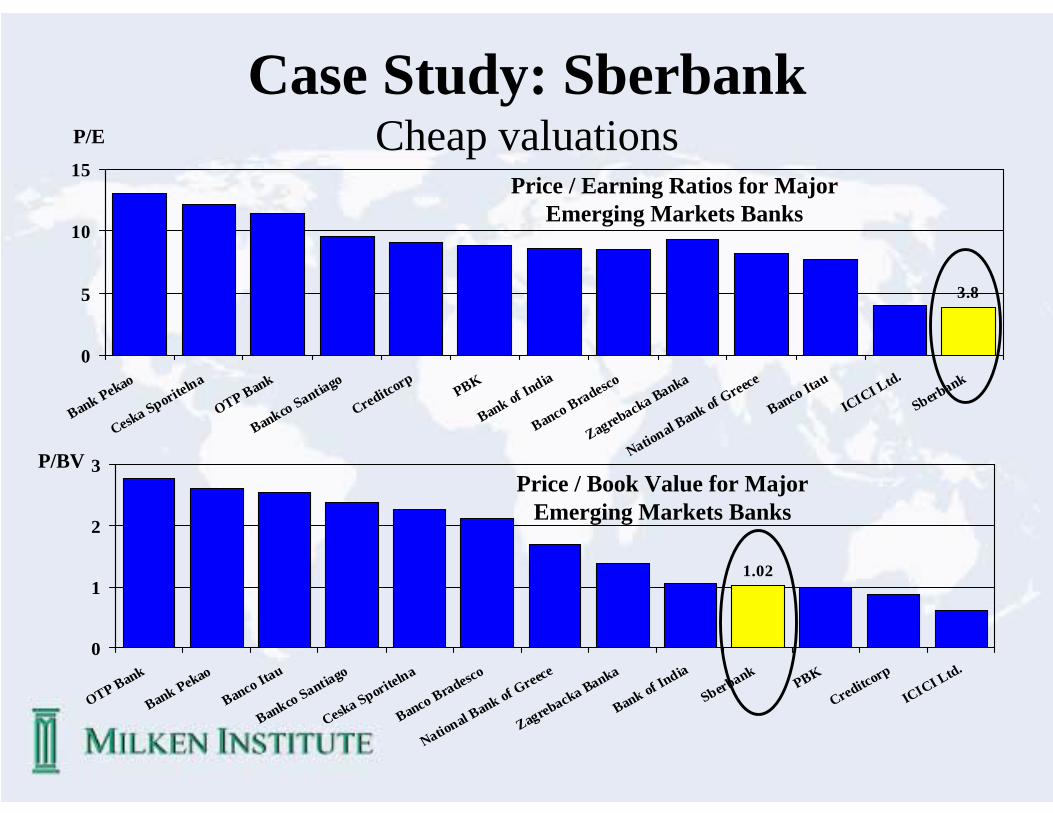
Case Study: SberbankCheap valuations
3.8
0
5
10
15
Bank Pekao
Ceska Sporitelna
OTP Bank
Bankco Santiago
CreditcorpPBK
Bank of India
Banco Bradesco
Zagrebacka Banka
National Bank of Greece
Banco Itau
ICICI Ltd.
Sberbank
Price / Earning Ratios for Major Emerging Markets Banks
P/E
P/BV
1.02
0
1
2
3
OTP Bank
Bank Pekao
Banco Itau
Bankco Santiago
Ceska Sporitelna
Banco Bradesco
National Bank of Greece
Zagrebacka Banka
Bank of India
SberbankPBK
Creditcorp
ICICI Ltd.
Price / Book Value for Major Emerging Markets Banks

Case Study: SberbankIn December 2000, Sberbank announced it wanted to sell 68% discount to book value in a new issue without granting rights to existing investors
Central Bank Central Bank
To Be Sold
0
5
10
15
20
Before New Issue Proposed New Issue
Investment Companies Individual
5 Million New
Shares will be sold for approx. $173M
Million Shares
14,002,000
19,000,000
Other
36 % Increase
0
20
40
60
80
100
120
140
160
May
-99Ju
ly-99
Septem
ber-99
Novem
ber-99
Januar
y-00
Mar
ch-00
May
-00Ju
ly-00
Septem
ber-00
Novem
ber-00
Januar
y-01
Mar
ch-01
May
-01Ju
ly-01
Septem
ber-01
December-
01Feb
ruar
y-02
April-02
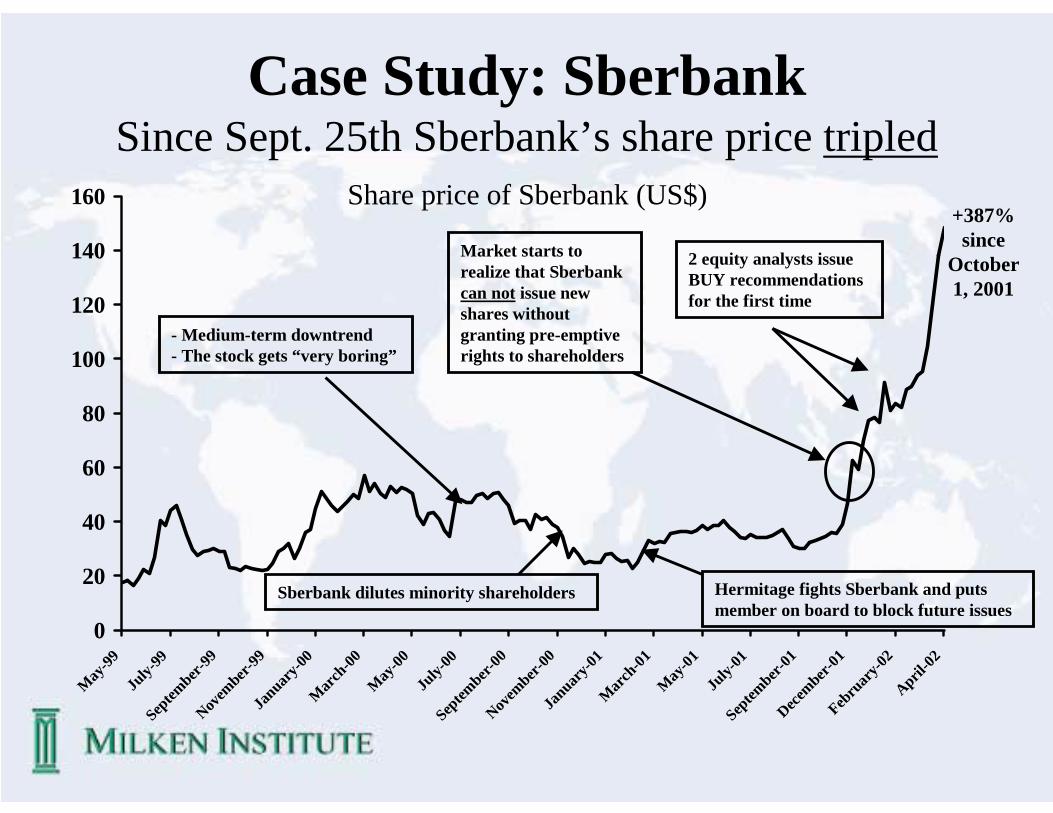
Case Study: SberbankSince Sept. 25th Sberbank’s share price tripled
- Medium-term downtrend - The stock gets “very boring”
Sberbank dilutes minority shareholders
Market starts to realize that Sberbankcan not issue new shares without granting pre-emptive rights to shareholders
Hermitage fights Sberbank and puts member on board to block future issues
Share price of Sberbank (US$)
2 equity analysts issue BUY recommendations for the first time
+387% since
October 1, 2001
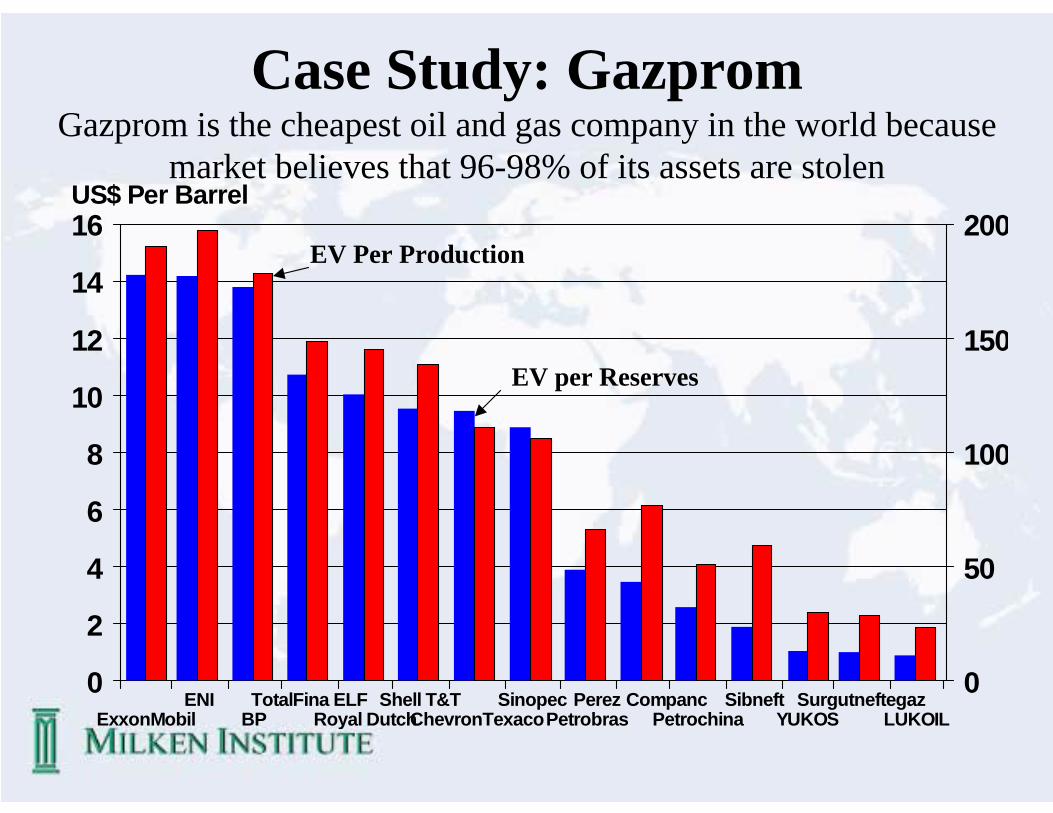
Case Study: GazpromGazprom is the cheapest oil and gas company in the world because
market believes that 96-98% of its assets are stolen
EV per Reserves
EV Per Production
LUKOILSurgutneftegaz
YUKOSSibneft
PetrochinaPerez Companc
PetrobrasSinopec
ChevronTexacoShell T&T
Royal DutchTotalFina ELF
BPENI
ExxonMobil
16
14
12
10
8
6
4
2
0
200
150
100
50
0
US$ Per Barrel
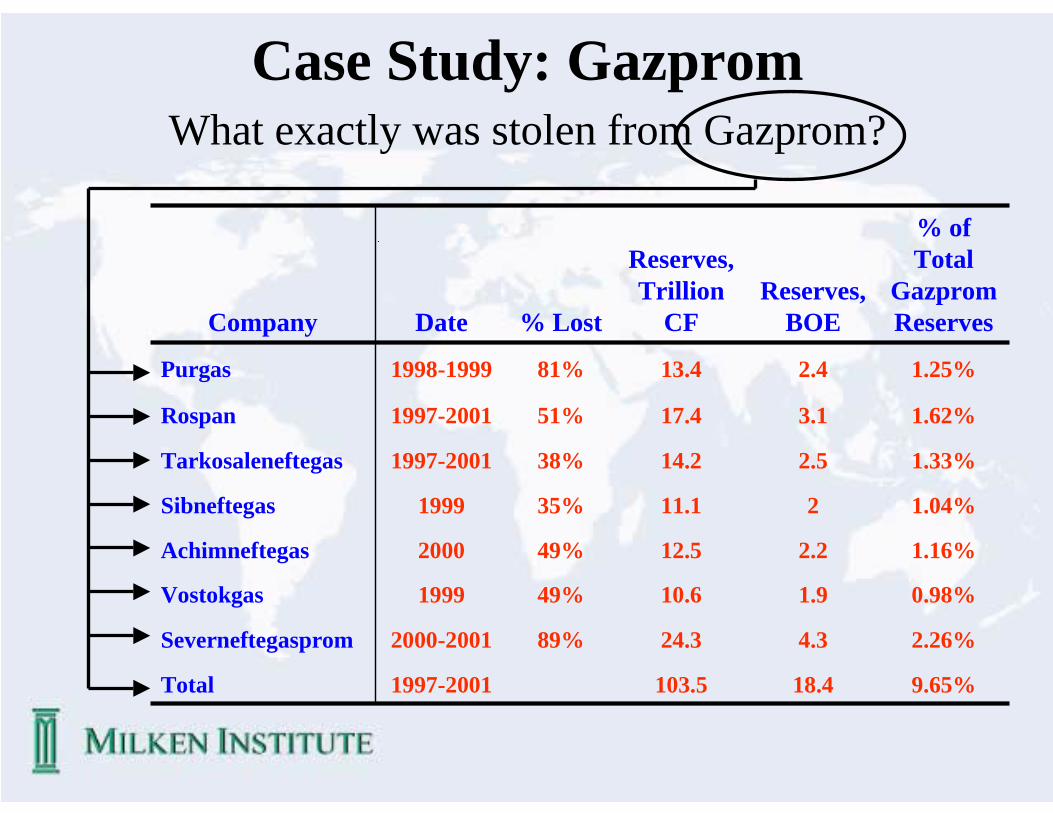
Case Study: GazpromWhat exactly was stolen from Gazprom?
9.65%18.4103.51997-2001Total
2.26%4.324.389%2000-2001Severneftegasprom
0.98%1.910.649%1999Vostokgas
1.16%2.212.549%2000Achimneftegas
1.04%211.135%1999Sibneftegas
1.33%2.514.238%1997-2001Tarkosaleneftegas
1.62%3.117.451%1997-2001Rospan
1.25%2.413.481%1998-1999Purgas
% ofTotal
GazpromReserves
Reserves,BOE
Reserves,Trillion
CF% LostDateCompany

Case Study: GazpromPerception vs. Reality
Market Perception Hermitage’s Analysisvs.0%
20%
40%
60%
80%
100%
98% Stolen Assets
2%Assets in
Place
9.7% Stolen Assets
90.3%Assets in
Place
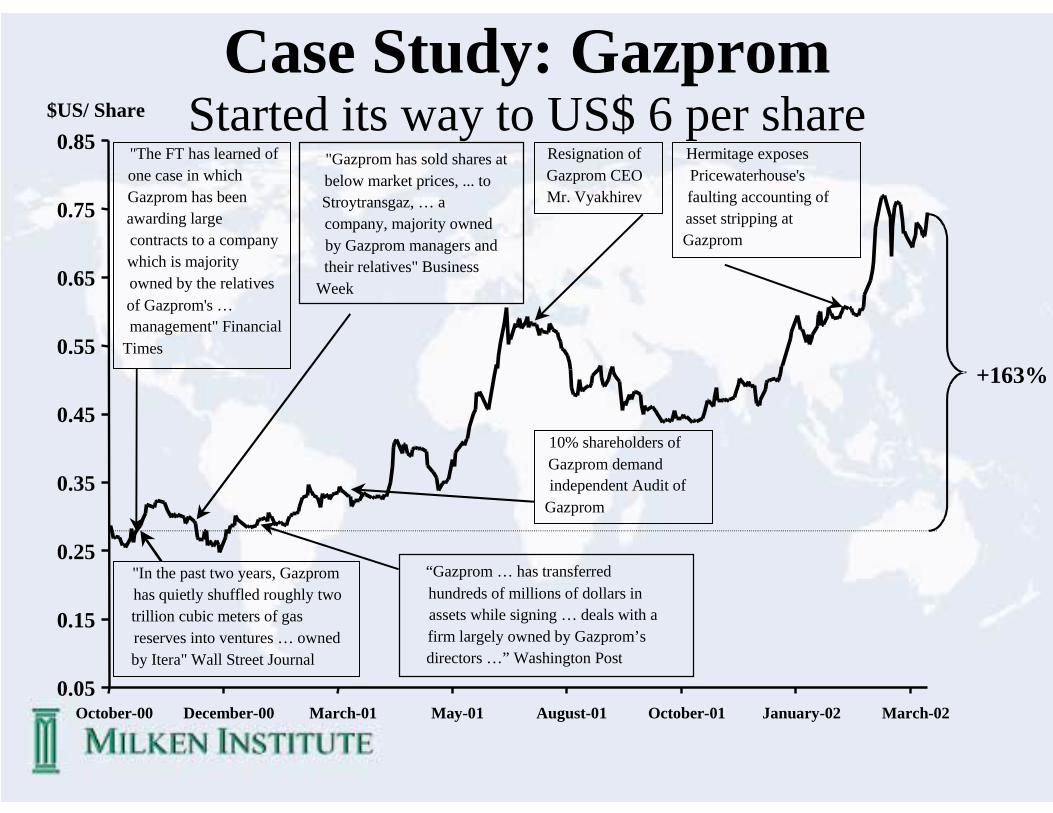
+163%
0.05
0.15
0.25
0.35
0.45
0.55
0.65
0.75
0.85
October-00 December-00 March-01 May-01 August-01 October-01 January-02 March-02
"The FT has learned of one case in which Gazprom has been awarding large contracts to a company which is majority owned by the relatives of Gazprom's …management" Financial
Times
"Gazprom has sold shares at below market prices, ... to Stroytransgaz, … a company, majority owned by Gazprom managers and their relatives" Business
Week
"In the past two years, Gazpromhas quietly shuffled roughly two trillion cubic meters of gas reserves into ventures … owned by Itera" Wall Street Journal
“Gazprom … has transferred hundreds of millions of dollars in assets while signing … deals with a firm largely owned by Gazprom’sdirectors …” Washington Post
Resignation of Gazprom CEOMr. Vyakhirev
10% shareholders of Gazprom demand independent Audit of
Gazprom
Hermitage exposes Pricewaterhouse'sfaulting accounting of asset stripping at Gazprom
$US/ Share
Case Study: GazpromStarted its way to US$ 6 per share

Hermitage Performance
Performance of Hermitage Fund vs. CSFB ROS Index
Hermitage
CSFB ROS Index
423%
188%
188%7%-7%255%20%79%22%CSFB ROS Index423%27%-8%423%68%95%26%Hermitage Fund
SinceInception5 Years4 Years3 Years2 Years1 YearYTDTotal Return
-200%
-100%
0%
100%
200%
300%
400%
500%
600%
700%
800%
900%
Febru
ary-97
July-
97Dece
mber-97
May-98
October-
98Mar
ch-99
August-
99Ja
nuary-0
0
June-0
0Nov
ember-
00April
-01Sep
tember-
01Feb
ruary
-02
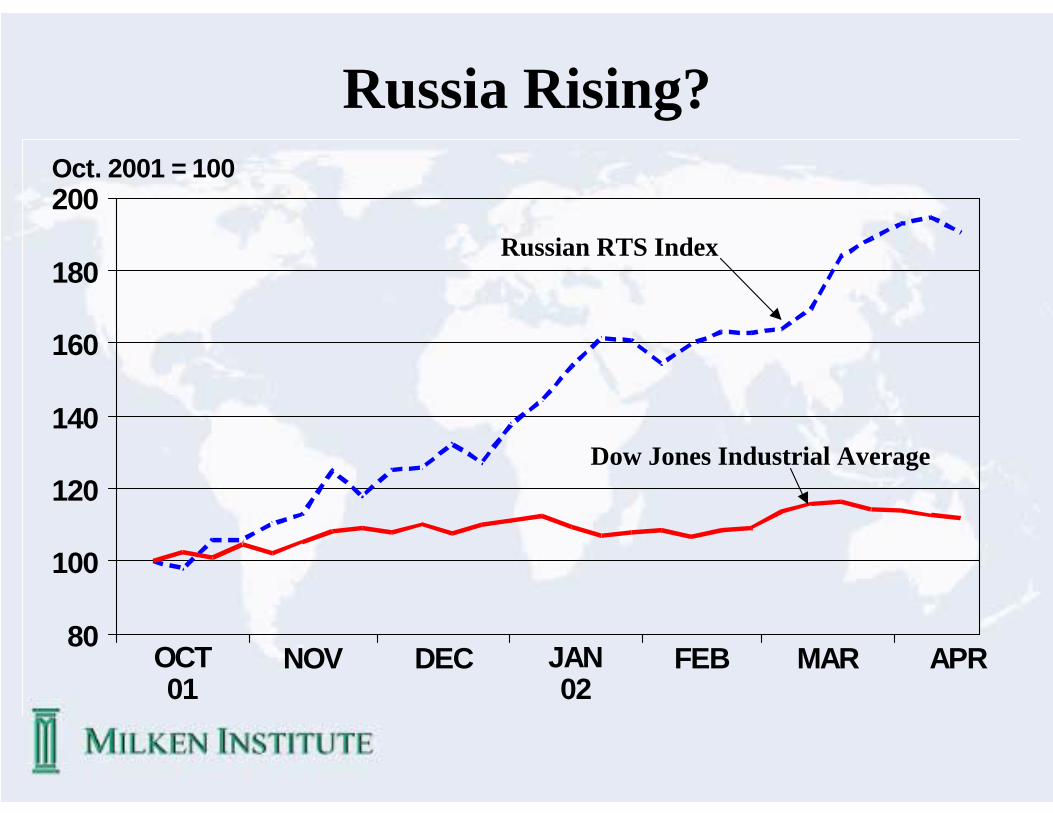
Russia Rising?
APRMARFEBJANDECNOVOCT0201
200
180
160
140
120
100
80
Oct. 2001 = 100
Dow Jones Industrial Average
Russian RTS Index
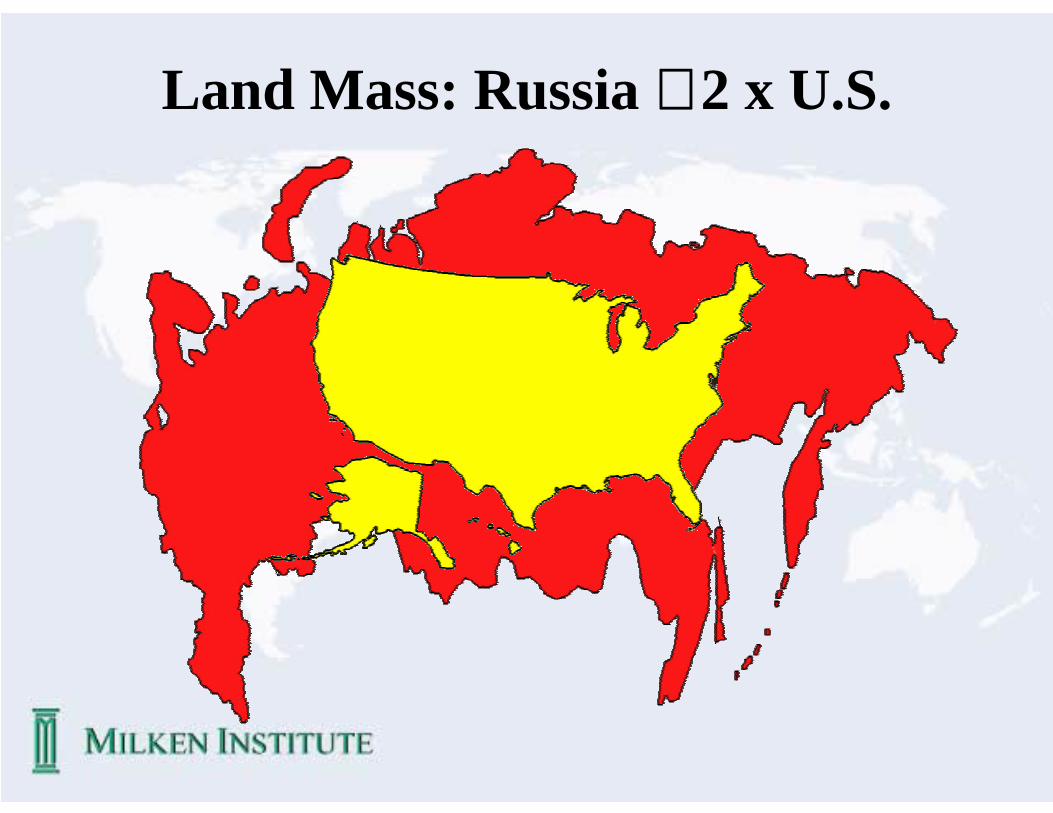
Land Mass: Russia ≅≅≅≅ 2 x U.S.

Economy: Russia ≅≅≅≅ Massachusetts
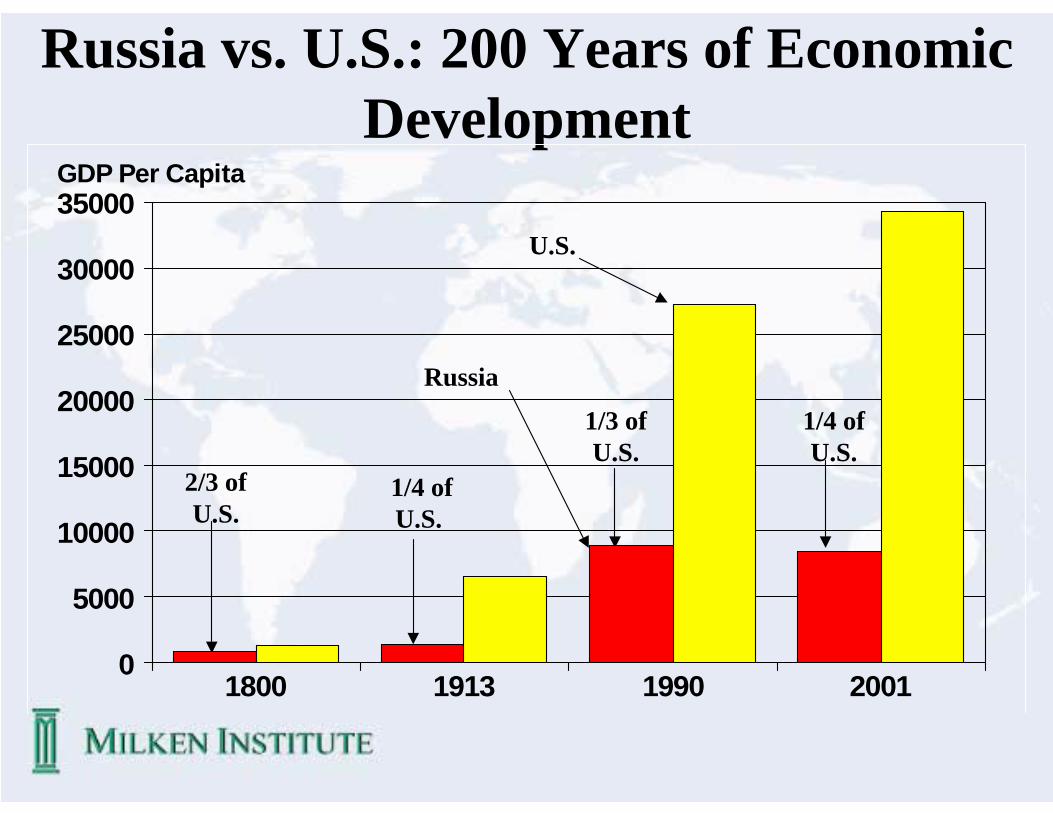
2/3 of U.S.
1/4 of U.S.
Russia
U.S.
1/4 of U.S.
1/3 of U.S.
Russia vs. U.S.: 200 Years of Economic Development
2001199019131800
35000
30000
25000
20000
15000
10000
5000
0
GDP Per Capita
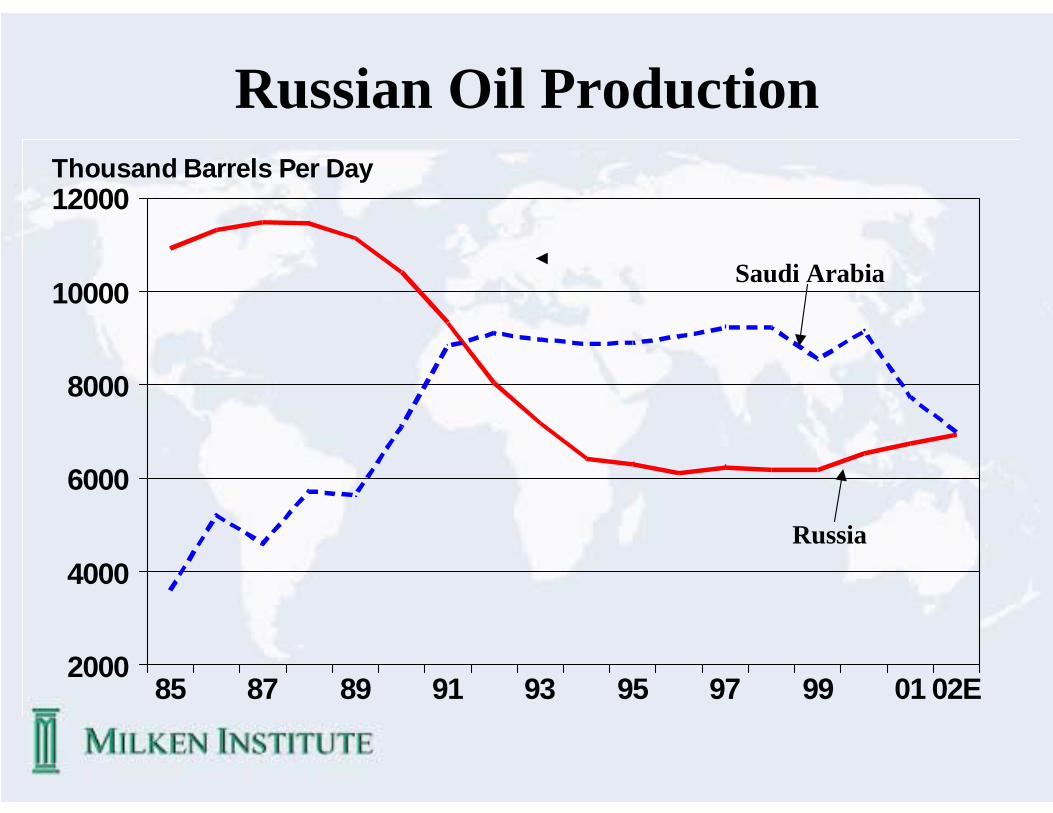
02E019997959391898785
12000
10000
8000
6000
4000
2000
Thousand Barrels Per Day
Russian Oil Production
Saudi Arabia
Russia
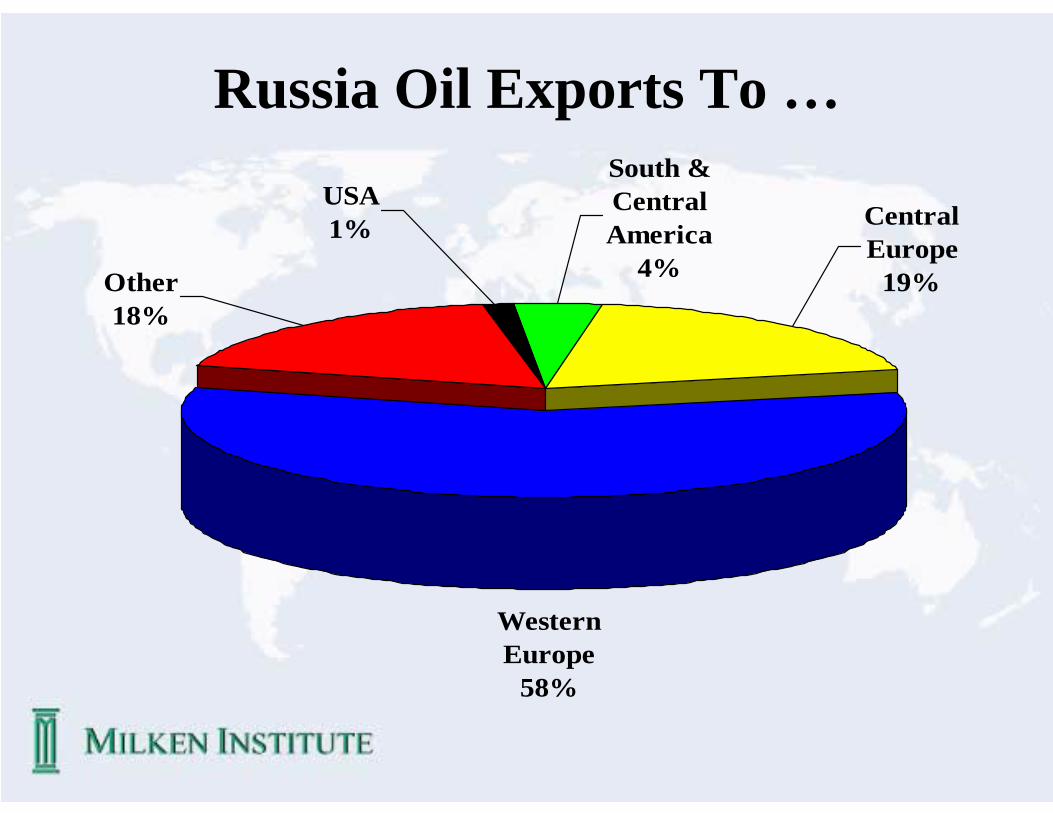
Russia Oil Exports To …
Other18%
Central Europe
19%
South & Central America
4%
USA1%
Western Europe
58%
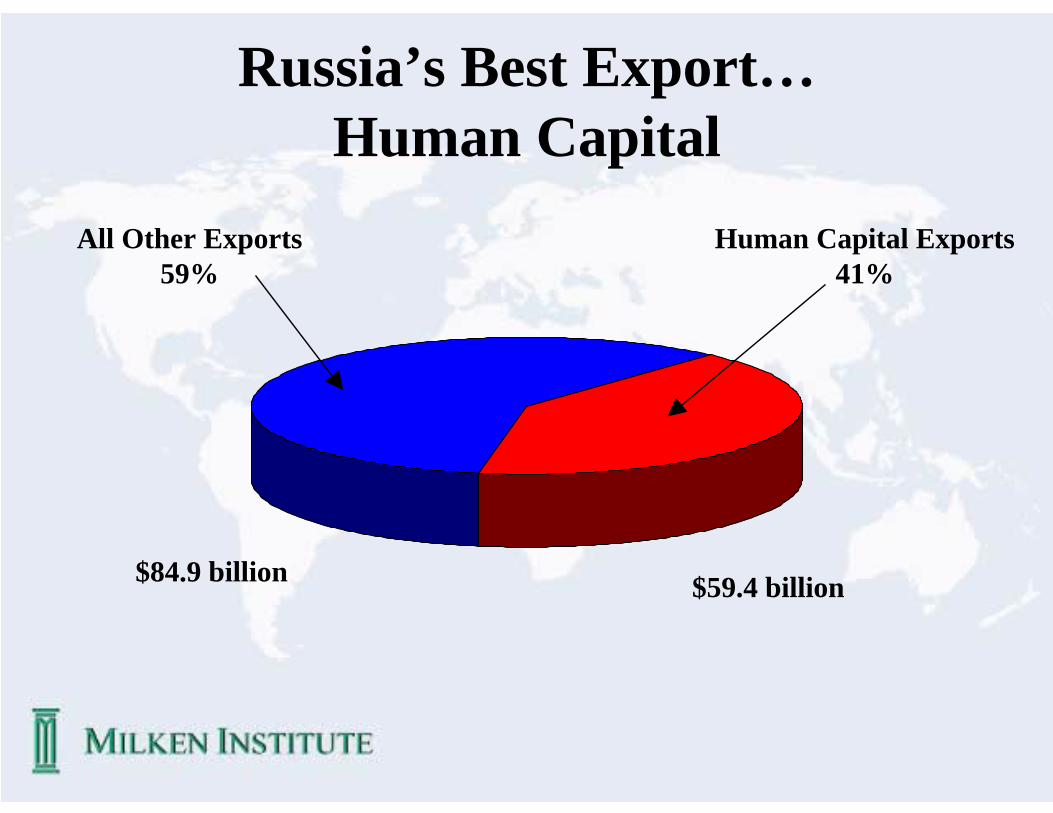
Russia’s Best Export… Human Capital
Human Capital Exports 41%
All Other Exports 59%
$84.9 billion $59.4 billion

Russia Exported 32 $bn of Human Capital to Israel, Germany and the USA in 2001
$5 billion$25 billion
$9 billion
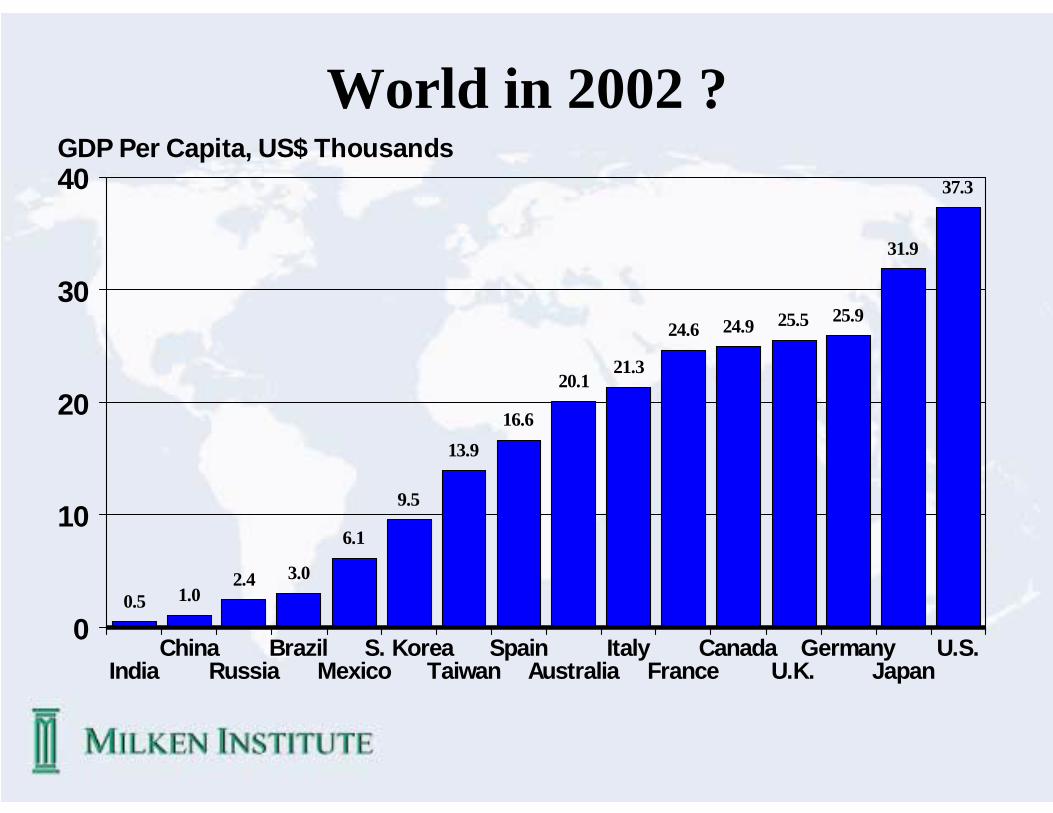
World in 2002 ?
U.S.Japan
GermanyU.K.
CanadaFrance
ItalyAustralia
SpainTaiwan
S. KoreaMexico
BrazilRussia
ChinaIndia
40
30
20
10
0
GDP Per Capita, US$ Thousands37.3
31.9
25.925.524.924.6
21.320.1
16.613.9
9.5
6.1
3.02.41.00.5
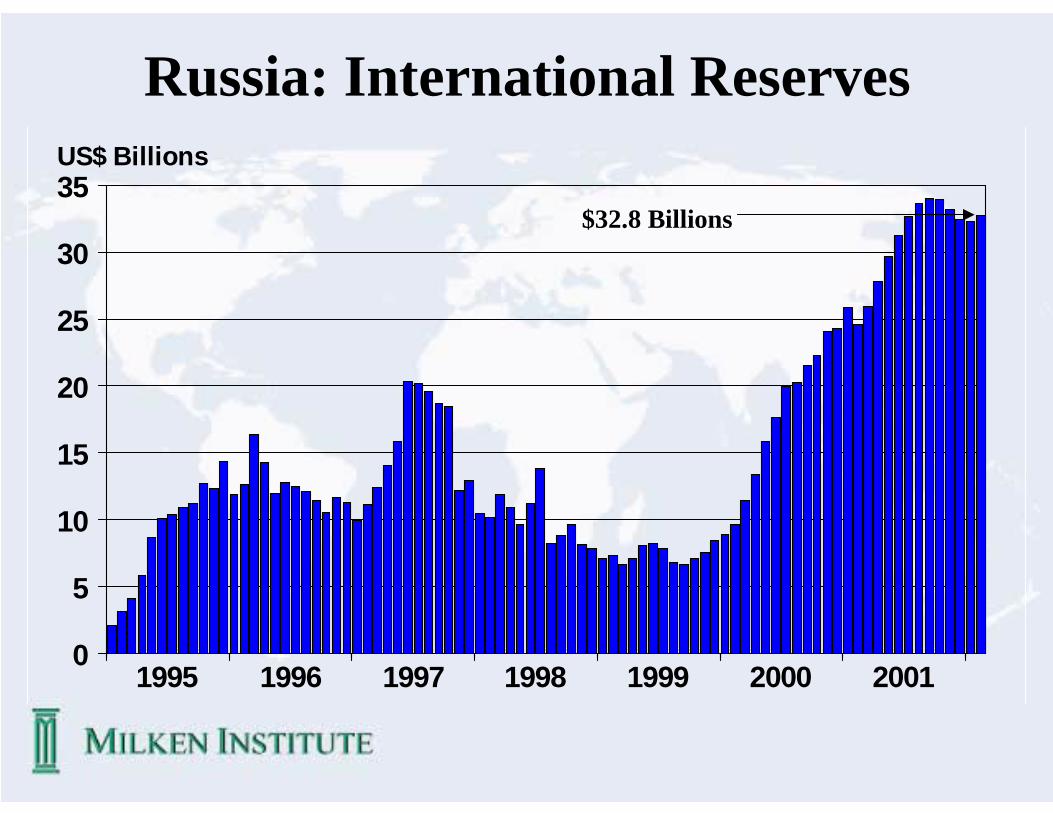
Russia: International Reserves
$32.8 Billions
2001200019991998199719961995
35
30
25
20
15
10
5
0
US$ Billions


![INDEX [assets.cambridge.org]assets.cambridge.org/97811070/36765/index/9781107036765_index.pdf · CCrP (Criminal Procedure Code 2001 (Russia)) CJEU/ECJ/CJEC (Court of Justice of the](https://img.pdfslide.us/doc/110x75/5b27a1467f8b9a12158b9867/index-ccrp-criminal-procedure-code-2001-russia-cjeuecjcjec-court.jpg)