Embed Size (px)
Citation preview
Research analysts
Japan index products
Yumiko Hirano - NSC [email protected] +81 3 6703 3986
Naoko Kato - NSC [email protected] +81 3 6703 3986
Russell/Nomura Japan Equity Indexes FY17 handbook
EQUITY QUANTITATIVE RESEARCH (INDEX)
This report constitutes the Russell/Nomura Japan Equity Indexes FY17 handbook.
Russell/Nomura Japan Equity Indexes have the following characteristics:
• They are share price indexes that are weighted by free-float adjusted market capitalization and cover the top 98% of all listed stocks in terms of float-adjusted market capitalization, thereby offering broad market coverage.
• In addition to stocks listed on the First Section of the Tokyo Stock Exchange (TSE-1), they include stocks listed on other exchanges.
• Because the indexes take into consideration the stable shareholding ratio, they reflect the stocks that are actually available for investment.
• There are style indexes for large and small companies and for value and growth stocks.
• The Prime Index consists of the top 1,000 stocks in the Total Market Index by market cap excluding stable shareholdings.
• Stocks are selected quantitatively based on clearly defined criteria.
• The composition of each index is reviewed once a year.
Global Markets Research 27 April 2017
Japanese version published on April 20, 2017
See Appendix A-1 for analyst certification, important disclosures and the status of non-US analysts.
Production Complete: 2017-04-27 06:36 UTC
Nomura | Russell/Nomura Japan Equity Indexes FY17 handbook 27 April 2017
2
Contents
1. Introduction ............................................................................................................................................. 3
2. Russell/Nomura Japan Equity Indexes ................................................................................................... 4
3. Russell/Nomura Japan Equity Indexes: composition.............................................................................. 5
3.1. Number of stocks and market capitalization ..................................................................................................... 5
3.2. Number of stocks as of date of regular reconstitution ...................................................................................... 6
3.3. Sector allocation ............................................................................................................................................... 7
3.4. Top 10 stocks by market capitalization ............................................................................................................. 8
4. Performance analysis ............................................................................................................................. 9
4.1. Annual returns .................................................................................................................................................. 9
4.2. Performance ................................................................................................................................................... 10
4.3. Relative performance of style indexes ............................................................................................................ 11
4.4. Risk-return characteristics of individual indexes ............................................................................................. 12
4.5. Impact of dividends ......................................................................................................................................... 12
5. Index investability ................................................................................................................................. 13
5.1. Turnover ratios as of regular reconstitutions .................................................................................................. 13
5.2. Estimated number of days’ impact in the case of regular reconstitutions ...................................................... 14
5.3. Estimating number of days of impact and minimum unit of investment when a fund is established .............. 15
6. Data publication services ...................................................................................................................... 16
Russell/Nomura Japan Index Contacts .................................................................................................... 17
Appendix A-1 ............................................................................................................................................ 18
Nomura | Russell/Nomura Japan Equity Indexes FY17 handbook 27 April 2017
3
1. Introduction The Russell/Nomura Japan Equity Indexes are Japanese equity indexes developed jointly by FTSE Russell Indexes and the Global Research Division, Financial Engineering & Technology Research Center, Nomura Securities Co., Ltd.
Russell/Nomura Japan Equity Indexes should be useful in:
o Determining investment strategies (strategic asset allocation)
o Determining manager structures
o Devising asset management benchmarks
o Supporting portfolio management activities
o Evaluating the performance of various investment styles
o Managing risk
Russell/Nomura Japan Equity Indexes have the following characteristics:
o They are share price indexes that are weighted by free-float adjusted market capitalization and cover the top 98% of all listed stocks in terms of float-adjusted market capitalization, thereby offering broad market coverage
o In addition to stocks listed on the First Section of the Tokyo Stock Exchange (TSE-1), they include stocks listed on other exchanges
o Because the indexes take into consideration the stable shareholding ratio, they reflect the stocks that are actually available for investment
o There are style indexes for large and small companies and for value and growth stocks
o The Prime Index consists of the top 1,000 stocks in the Total Market Index by market cap excluding stable shareholdings
o Stocks are selected quantitatively based on clearly defined criteria
o The composition of each index is reviewed once a year.
Complete details of rules for the Russell/Nomura Japan Equity Index can be found in the Russell/Nomura Japan Equity Index Rulebook.
Nomura | Russell/Nomura Japan Equity Indexes FY17 handbook 27 April 2017
4
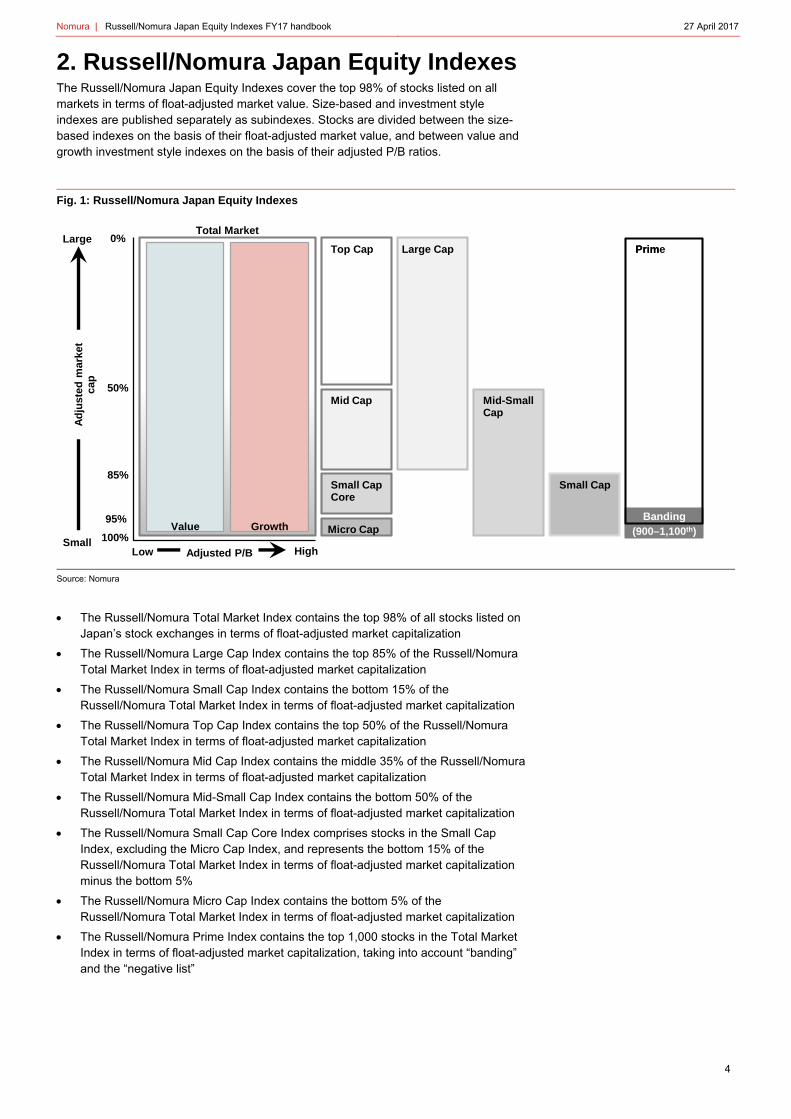
2. Russell/Nomura Japan Equity Indexes The Russell/Nomura Japan Equity Indexes cover the top 98% of stocks listed on all markets in terms of float-adjusted market value. Size-based and investment style indexes are published separately as subindexes. Stocks are divided between the size-based indexes on the basis of their float-adjusted market value, and between value and growth investment style indexes on the basis of their adjusted P/B ratios.
Fig. 1: Russell/Nomura Japan Equity Indexes
Source: Nomura
The Russell/Nomura Total Market Index contains the top 98% of all stocks listed on Japan’s stock exchanges in terms of float-adjusted market capitalization
The Russell/Nomura Large Cap Index contains the top 85% of the Russell/Nomura Total Market Index in terms of float-adjusted market capitalization
The Russell/Nomura Small Cap Index contains the bottom 15% of the Russell/Nomura Total Market Index in terms of float-adjusted market capitalization
The Russell/Nomura Top Cap Index contains the top 50% of the Russell/Nomura Total Market Index in terms of float-adjusted market capitalization
The Russell/Nomura Mid Cap Index contains the middle 35% of the Russell/Nomura Total Market Index in terms of float-adjusted market capitalization
The Russell/Nomura Mid-Small Cap Index contains the bottom 50% of the Russell/Nomura Total Market Index in terms of float-adjusted market capitalization
The Russell/Nomura Small Cap Core Index comprises stocks in the Small Cap Index, excluding the Micro Cap Index, and represents the bottom 15% of the Russell/Nomura Total Market Index in terms of float-adjusted market capitalization minus the bottom 5%
The Russell/Nomura Micro Cap Index contains the bottom 5% of the Russell/Nomura Total Market Index in terms of float-adjusted market capitalization
The Russell/Nomura Prime Index contains the top 1,000 stocks in the Total Market Index in terms of float-adjusted market capitalization, taking into account “banding” and the “negative list”
Banding(900–1,100th)
Total Market
Value Growth
0%
50%
85%
95%
100%
Top Cap
Mid Cap
Small CapCore
Micro Cap
Prim
Mid-Small Cap
Small Cap
Large Cap PrimeLarge
Ad
just
edm
arke
t ca
p
Adjusted P/BSmall
Low High
Nomura | Russell/Nomura Japan Equity Indexes FY17 handbook 27 April 2017
5
3. Russell/Nomura Japan Equity Indexes: composition
3.1. Number of stocks and market capitalization
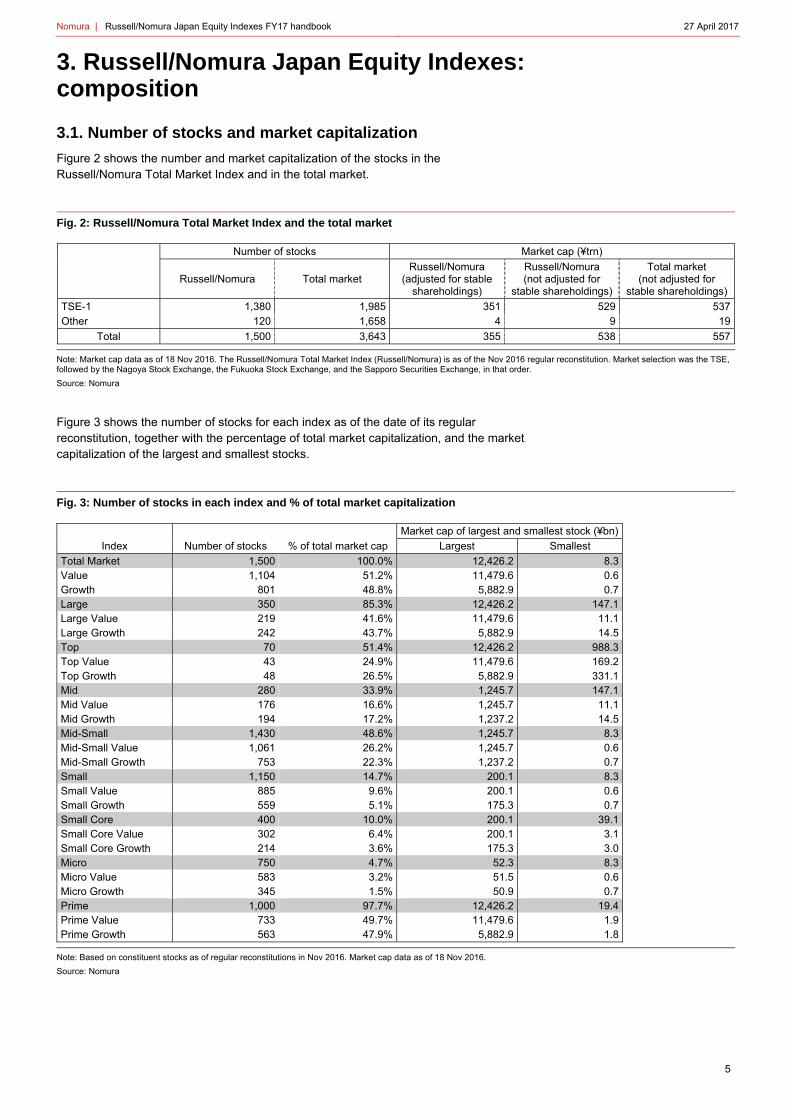
Figure 2 shows the number and market capitalization of the stocks in the Russell/Nomura Total Market Index and in the total market.
Fig. 2: Russell/Nomura Total Market Index and the total market Number of stocks Market cap (¥trn)
Russell/Nomura Total market
Russell/Nomura (adjusted for stable
shareholdings)
Russell/Nomura (not adjusted for
stable shareholdings)
Total market (not adjusted for
stable shareholdings)
TSE-1 1,380 1,985 351 529 537 Other 120 1,658 4 9 19
Total 1,500 3,643 355 538 557
Note: Market cap data as of 18 Nov 2016. The Russell/Nomura Total Market Index (Russell/Nomura) is as of the Nov 2016 regular reconstitution. Market selection was the TSE, followed by the Nagoya Stock Exchange, the Fukuoka Stock Exchange, and the Sapporo Securities Exchange, in that order.
Source: Nomura
Figure 3 shows the number of stocks for each index as of the date of its regular reconstitution, together with the percentage of total market capitalization, and the market capitalization of the largest and smallest stocks.
Fig. 3: Number of stocks in each index and % of total market capitalization
Market cap of largest and smallest stock (¥bn)
Index Number of stocks % of total market cap Largest Smallest
Total Market 1,500 100.0% 12,426.2 8.3 Value 1,104 51.2% 11,479.6 0.6 Growth 801 48.8% 5,882.9 0.7 Large 350 85.3% 12,426.2 147.1 Large Value 219 41.6% 11,479.6 11.1 Large Growth 242 43.7% 5,882.9 14.5 Top 70 51.4% 12,426.2 988.3 Top Value 43 24.9% 11,479.6 169.2 Top Growth 48 26.5% 5,882.9 331.1 Mid 280 33.9% 1,245.7 147.1 Mid Value 176 16.6% 1,245.7 11.1 Mid Growth 194 17.2% 1,237.2 14.5 Mid-Small 1,430 48.6% 1,245.7 8.3 Mid-Small Value 1,061 26.2% 1,245.7 0.6 Mid-Small Growth 753 22.3% 1,237.2 0.7 Small 1,150 14.7% 200.1 8.3 Small Value 885 9.6% 200.1 0.6 Small Growth 559 5.1% 175.3 0.7 Small Core 400 10.0% 200.1 39.1 Small Core Value 302 6.4% 200.1 3.1 Small Core Growth 214 3.6% 175.3 3.0 Micro 750 4.7% 52.3 8.3 Micro Value 583 3.2% 51.5 0.6 Micro Growth 345 1.5% 50.9 0.7 Prime 1,000 97.7% 12,426.2 19.4 Prime Value 733 49.7% 11,479.6 1.9 Prime Growth 563 47.9% 5,882.9 1.8
Note: Based on constituent stocks as of regular reconstitutions in Nov 2016. Market cap data as of 18 Nov 2016.
Source: Nomura
Nomura | Russell/Nomura Japan Equity Indexes FY17 handbook 27 April 2017
6
3.2. Number of stocks as of date of regular reconstitution
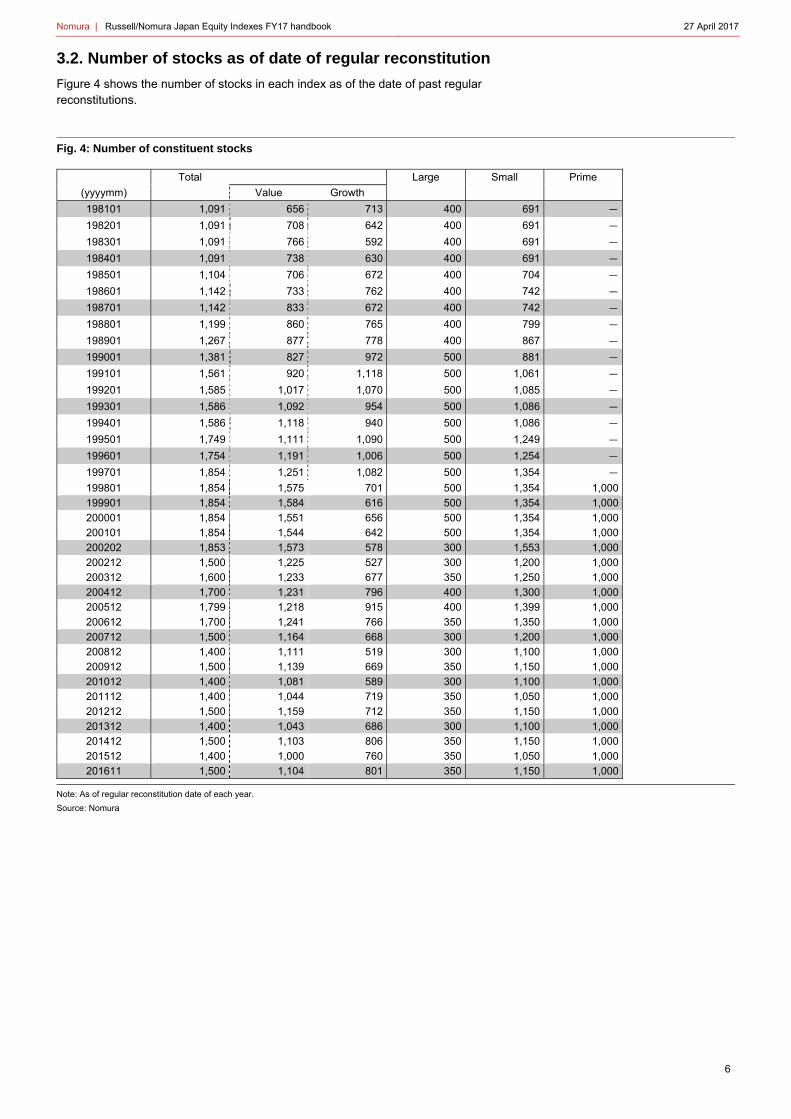
Figure 4 shows the number of stocks in each index as of the date of past regular reconstitutions.
Fig. 4: Number of constituent stocks
(yyyymm)
Total Large Small Prime
Value Growth
198101 1,091 656 713 400 691 -
198201 1,091 708 642 400 691 -
198301 1,091 766 592 400 691 -
198401 1,091 738 630 400 691 -
198501 1,104 706 672 400 704 -
198601 1,142 733 762 400 742 -
198701 1,142 833 672 400 742 -
198801 1,199 860 765 400 799 -
198901 1,267 877 778 400 867 -
199001 1,381 827 972 500 881 -
199101 1,561 920 1,118 500 1,061 -
199201 1,585 1,017 1,070 500 1,085 -
199301 1,586 1,092 954 500 1,086 -
199401 1,586 1,118 940 500 1,086 -
199501 1,749 1,111 1,090 500 1,249 -
199601 1,754 1,191 1,006 500 1,254 -
199701 1,854 1,251 1,082 500 1,354 -
199801 1,854 1,575 701 500 1,354 1,000
199901 1,854 1,584 616 500 1,354 1,000
200001 1,854 1,551 656 500 1,354 1,000
200101 1,854 1,544 642 500 1,354 1,000
200202 1,853 1,573 578 300 1,553 1,000
200212 1,500 1,225 527 300 1,200 1,000
200312 1,600 1,233 677 350 1,250 1,000
200412 1,700 1,231 796 400 1,300 1,000
200512 1,799 1,218 915 400 1,399 1,000
200612 1,700 1,241 766 350 1,350 1,000
200712 1,500 1,164 668 300 1,200 1,000
200812 1,400 1,111 519 300 1,100 1,000
200912 1,500 1,139 669 350 1,150 1,000
201012 1,400 1,081 589 300 1,100 1,000
201112 1,400 1,044 719 350 1,050 1,000
201212 1,500 1,159 712 350 1,150 1,000
201312 1,400 1,043 686 300 1,100 1,000
201412 1,500 1,103 806 350 1,150 1,000
201512 1,400 1,000 760 350 1,050 1,000
201611 1,500 1,104 801 350 1,150 1,000
Note: As of regular reconstitution date of each year.
Source: Nomura
Nomura | Russell/Nomura Japan Equity Indexes FY17 handbook 27 April 2017
7
3.3. Sector allocation
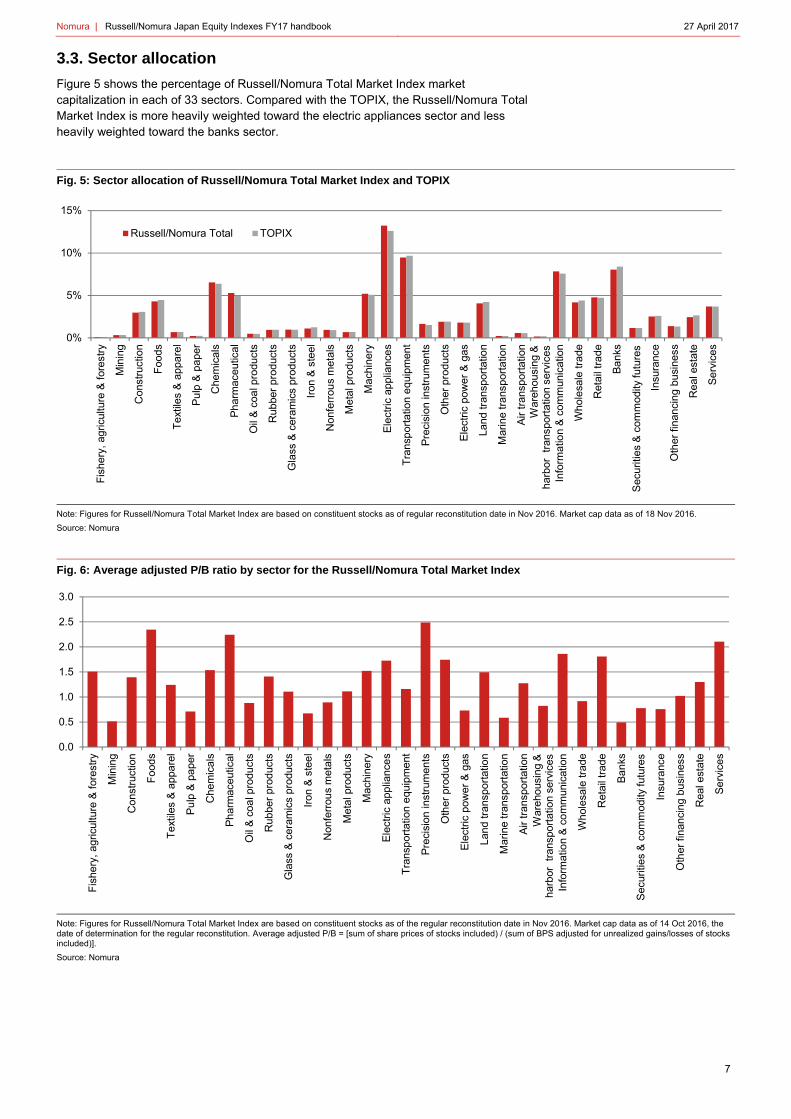
Figure 5 shows the percentage of Russell/Nomura Total Market Index market capitalization in each of 33 sectors. Compared with the TOPIX, the Russell/Nomura Total Market Index is more heavily weighted toward the electric appliances sector and less heavily weighted toward the banks sector.
Fig. 5: Sector allocation of Russell/Nomura Total Market Index and TOPIX
Note: Figures for Russell/Nomura Total Market Index are based on constituent stocks as of regular reconstitution date in Nov 2016. Market cap data as of 18 Nov 2016.
Source: Nomura
Fig. 6: Average adjusted P/B ratio by sector for the Russell/Nomura Total Market Index
Note: Figures for Russell/Nomura Total Market Index are based on constituent stocks as of the regular reconstitution date in Nov 2016. Market cap data as of 14 Oct 2016, the date of determination for the regular reconstitution. Average adjusted P/B = [sum of share prices of stocks included) / (sum of BPS adjusted for unrealized gains/losses of stocks included)].
Source: Nomura
0%
5%
10%
15%
Fis
hery
, agr
icul
ture
& fo
rest
ry
Min
ing
Con
stru
ctio
n
Foo
ds
Tex
tiles
& a
ppa
rel
Pu
lp &
pap
er
Che
mic
als
Ph
arm
aceu
tical
Oil
& c
oal p
rodu
cts
Rub
ber
prod
ucts
Gla
ss &
cer
amic
s pr
oduc
ts
Iron
& s
tee
l
Non
ferr
ous
met
als
Met
al p
rodu
cts
Mac
hine
ry
Ele
ctric
app
lianc
es
Tra
nsp
orta
tion
equ
ipm
ent
Pre
cisi
on in
stru
men
ts
Oth
er p
rodu
cts
Ele
ctric
pow
er &
gas
Land
tran
spor
tatio
n
Mar
ine
tran
spor
tatio
n
Air
tran
spor
tatio
n
Info
rmat
ion
& c
om
mun
icat
ion
Who
lesa
le tr
ade
Ret
ail t
rade
Ba
nks
Insu
ranc
e
Oth
er fi
nanc
ing
busi
ness
Rea
l est
ate
Se
rvic
es
Russell/Nomura Total TOPIX
War
ehou
sing
&ha
rbor
tr
ansp
orta
tion
serv
ices
Sec
uriti
es &
com
mod
ity fu
ture
s
0.0
0.5
1.0
1.5
2.0
2.5
3.0
Fis
hery
, agr
icul
ture
& fo
rest
ry
Min
ing
Con
stru
ctio
n
Foo
ds
Tex
tiles
& a
ppa
rel
Pu
lp &
pap
er
Che
mic
als
Ph
arm
aceu
tical
Oil
& c
oal p
rodu
cts
Rub
ber
prod
ucts
Gla
ss &
cer
amic
s pr
oduc
ts
Iron
& s
tee
l
Non
ferr
ous
met
als
Met
al p
rodu
cts
Mac
hine
ry
Ele
ctric
app
lianc
es
Tra
nsp
orta
tion
equ
ipm
ent
Pre
cisi
on in
stru
men
ts
Oth
er p
rodu
cts
Ele
ctric
pow
er &
gas
Land
tran
spor
tatio
n
Mar
ine
tran
spor
tatio
n
Air
tran
spor
tatio
n
Info
rmat
ion
& c
om
mun
icat
ion
Who
lesa
le tr
ade
Ret
ail t
rade
Ba
nks
Insu
ranc
e
Oth
er fi
nanc
ing
busi
ness
Rea
l est
ate
Se
rvic
es
War
ehou
sing
&ha
rbor
tr
ansp
orta
tion
serv
ices
Sec
uriti
es &
com
mod
ity fu
ture
s
Nomura | Russell/Nomura Japan Equity Indexes FY17 handbook 27 April 2017
8
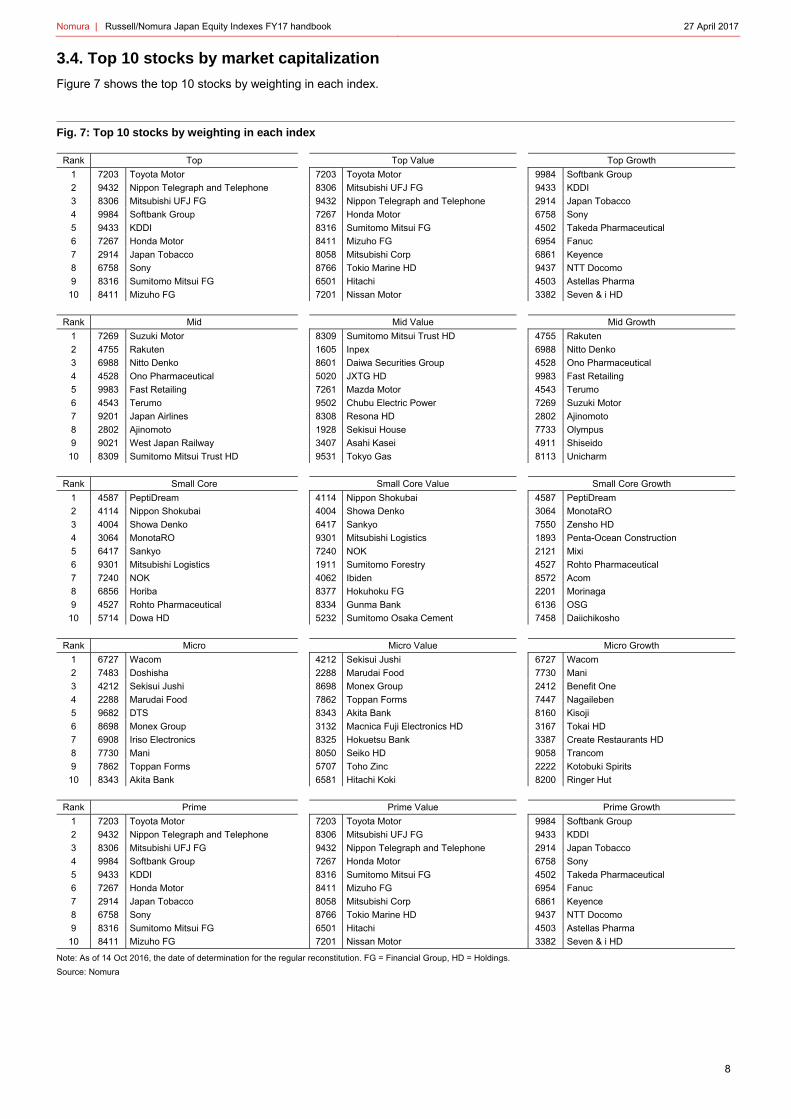
3.4. Top 10 stocks by market capitalization
Figure 7 shows the top 10 stocks by weighting in each index.
Fig. 7: Top 10 stocks by weighting in each index
Rank Top Top Value Top Growth
1 7203 Toyota Motor 7203 Toyota Motor 9984 Softbank Group
2 9432 Nippon Telegraph and Telephone 8306 Mitsubishi UFJ FG 9433 KDDI
3 8306 Mitsubishi UFJ FG 9432 Nippon Telegraph and Telephone 2914 Japan Tobacco
4 9984 Softbank Group 7267 Honda Motor 6758 Sony
5 9433 KDDI 8316 Sumitomo Mitsui FG 4502 Takeda Pharmaceutical
6 7267 Honda Motor 8411 Mizuho FG 6954 Fanuc
7 2914 Japan Tobacco 8058 Mitsubishi Corp 6861 Keyence
8 6758 Sony 8766 Tokio Marine HD 9437 NTT Docomo
9 8316 Sumitomo Mitsui FG 6501 Hitachi 4503 Astellas Pharma
10 8411 Mizuho FG 7201 Nissan Motor 3382 Seven & i HD
Rank Mid Mid Value Mid Growth
1 7269 Suzuki Motor 8309 Sumitomo Mitsui Trust HD 4755 Rakuten
2 4755 Rakuten 1605 Inpex 6988 Nitto Denko
3 6988 Nitto Denko 8601 Daiwa Securities Group 4528 Ono Pharmaceutical
4 4528 Ono Pharmaceutical 5020 JXTG HD 9983 Fast Retailing
5 9983 Fast Retailing 7261 Mazda Motor 4543 Terumo
6 4543 Terumo 9502 Chubu Electric Power 7269 Suzuki Motor
7 9201 Japan Airlines 8308 Resona HD 2802 Ajinomoto
8 2802 Ajinomoto 1928 Sekisui House 7733 Olympus
9 9021 West Japan Railway 3407 Asahi Kasei 4911 Shiseido
10 8309 Sumitomo Mitsui Trust HD 9531 Tokyo Gas 8113 Unicharm
Rank Small Core Small Core Value Small Core Growth
1 4587 PeptiDream 4114 Nippon Shokubai 4587 PeptiDream
2 4114 Nippon Shokubai 4004 Showa Denko 3064 MonotaRO
3 4004 Showa Denko 6417 Sankyo 7550 Zensho HD
4 3064 MonotaRO 9301 Mitsubishi Logistics 1893 Penta-Ocean Construction
5 6417 Sankyo 7240 NOK 2121 Mixi
6 9301 Mitsubishi Logistics 1911 Sumitomo Forestry 4527 Rohto Pharmaceutical
7 7240 NOK 4062 Ibiden 8572 Acom
8 6856 Horiba 8377 Hokuhoku FG 2201 Morinaga
9 4527 Rohto Pharmaceutical 8334 Gunma Bank 6136 OSG
10 5714 Dowa HD 5232 Sumitomo Osaka Cement 7458 Daiichikosho
Rank Micro Micro Value Micro Growth
1 6727 Wacom 4212 Sekisui Jushi 6727 Wacom
2 7483 Doshisha 2288 Marudai Food 7730 Mani
3 4212 Sekisui Jushi 8698 Monex Group 2412 Benefit One
4 2288 Marudai Food 7862 Toppan Forms 7447 Nagaileben
5 9682 DTS 8343 Akita Bank 8160 Kisoji
6 8698 Monex Group 3132 Macnica Fuji Electronics HD 3167 Tokai HD
7 6908 Iriso Electronics 8325 Hokuetsu Bank 3387 Create Restaurants HD
8 7730 Mani 8050 Seiko HD 9058 Trancom
9 7862 Toppan Forms 5707 Toho Zinc 2222 Kotobuki Spirits
10 8343 Akita Bank 6581 Hitachi Koki 8200 Ringer Hut
Rank Prime Prime Value Prime Growth
1 7203 Toyota Motor 7203 Toyota Motor 9984 Softbank Group
2 9432 Nippon Telegraph and Telephone 8306 Mitsubishi UFJ FG 9433 KDDI
3 8306 Mitsubishi UFJ FG 9432 Nippon Telegraph and Telephone 2914 Japan Tobacco
4 9984 Softbank Group 7267 Honda Motor 6758 Sony
5 9433 KDDI 8316 Sumitomo Mitsui FG 4502 Takeda Pharmaceutical
6 7267 Honda Motor 8411 Mizuho FG 6954 Fanuc
7 2914 Japan Tobacco 8058 Mitsubishi Corp 6861 Keyence
8 6758 Sony 8766 Tokio Marine HD 9437 NTT Docomo
9 8316 Sumitomo Mitsui FG 6501 Hitachi 4503 Astellas Pharma
10 8411 Mizuho FG 7201 Nissan Motor 3382 Seven & i HD
Note: As of 14 Oct 2016, the date of determination for the regular reconstitution. FG = Financial Group, HD = Holdings.
Source: Nomura
Nomura | Russell/Nomura Japan Equity Indexes FY17 handbook 27 April 2017
9
4. Performance analysis
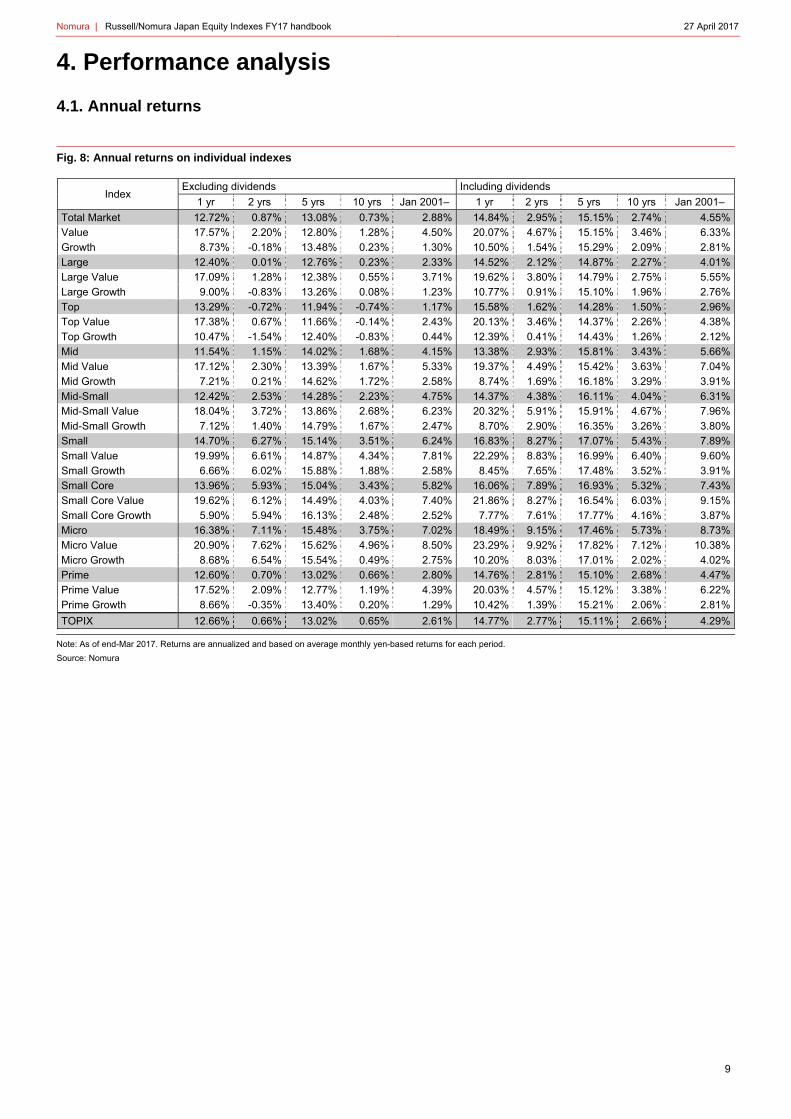
4.1. Annual returns
Fig. 8: Annual returns on individual indexes
Index Excluding dividends Including dividends
1 yr 2 yrs 5 yrs 10 yrs Jan 2001– 1 yr 2 yrs 5 yrs 10 yrs Jan 2001–
Total Market 12.72% 0.87% 13.08% 0.73% 2.88% 14.84% 2.95% 15.15% 2.74% 4.55%
Value 17.57% 2.20% 12.80% 1.28% 4.50% 20.07% 4.67% 15.15% 3.46% 6.33%
Growth 8.73% -0.18% 13.48% 0.23% 1.30% 10.50% 1.54% 15.29% 2.09% 2.81%
Large 12.40% 0.01% 12.76% 0.23% 2.33% 14.52% 2.12% 14.87% 2.27% 4.01%
Large Value 17.09% 1.28% 12.38% 0.55% 3.71% 19.62% 3.80% 14.79% 2.75% 5.55%
Large Growth 9.00% -0.83% 13.26% 0.08% 1.23% 10.77% 0.91% 15.10% 1.96% 2.76%
Top 13.29% -0.72% 11.94% -0.74% 1.17% 15.58% 1.62% 14.28% 1.50% 2.96%
Top Value 17.38% 0.67% 11.66% -0.14% 2.43% 20.13% 3.46% 14.37% 2.26% 4.38%
Top Growth 10.47% -1.54% 12.40% -0.83% 0.44% 12.39% 0.41% 14.43% 1.26% 2.12%
Mid 11.54% 1.15% 14.02% 1.68% 4.15% 13.38% 2.93% 15.81% 3.43% 5.66%
Mid Value 17.12% 2.30% 13.39% 1.67% 5.33% 19.37% 4.49% 15.42% 3.63% 7.04%
Mid Growth 7.21% 0.21% 14.62% 1.72% 2.58% 8.74% 1.69% 16.18% 3.29% 3.91%
Mid-Small 12.42% 2.53% 14.28% 2.23% 4.75% 14.37% 4.38% 16.11% 4.04% 6.31%
Mid-Small Value 18.04% 3.72% 13.86% 2.68% 6.23% 20.32% 5.91% 15.91% 4.67% 7.96%
Mid-Small Growth 7.12% 1.40% 14.79% 1.67% 2.47% 8.70% 2.90% 16.35% 3.26% 3.80%
Small 14.70% 6.27% 15.14% 3.51% 6.24% 16.83% 8.27% 17.07% 5.43% 7.89%
Small Value 19.99% 6.61% 14.87% 4.34% 7.81% 22.29% 8.83% 16.99% 6.40% 9.60%
Small Growth 6.66% 6.02% 15.88% 1.88% 2.58% 8.45% 7.65% 17.48% 3.52% 3.91%
Small Core 13.96% 5.93% 15.04% 3.43% 5.82% 16.06% 7.89% 16.93% 5.32% 7.43%
Small Core Value 19.62% 6.12% 14.49% 4.03% 7.40% 21.86% 8.27% 16.54% 6.03% 9.15%
Small Core Growth 5.90% 5.94% 16.13% 2.48% 2.52% 7.77% 7.61% 17.77% 4.16% 3.87%
Micro 16.38% 7.11% 15.48% 3.75% 7.02% 18.49% 9.15% 17.46% 5.73% 8.73%
Micro Value 20.90% 7.62% 15.62% 4.96% 8.50% 23.29% 9.92% 17.82% 7.12% 10.38%
Micro Growth 8.68% 6.54% 15.54% 0.49% 2.75% 10.20% 8.03% 17.01% 2.02% 4.02%
Prime 12.60% 0.70% 13.02% 0.66% 2.80% 14.76% 2.81% 15.10% 2.68% 4.47%
Prime Value 17.52% 2.09% 12.77% 1.19% 4.39% 20.03% 4.57% 15.12% 3.38% 6.22%
Prime Growth 8.66% -0.35% 13.40% 0.20% 1.29% 10.42% 1.39% 15.21% 2.06% 2.81%
TOPIX 12.66% 0.66% 13.02% 0.65% 2.61% 14.77% 2.77% 15.11% 2.66% 4.29%
Note: As of end-Mar 2017. Returns are annualized and based on average monthly yen-based returns for each period.
Source: Nomura
Nomura | Russell/Nomura Japan Equity Indexes FY17 handbook 27 April 2017
10
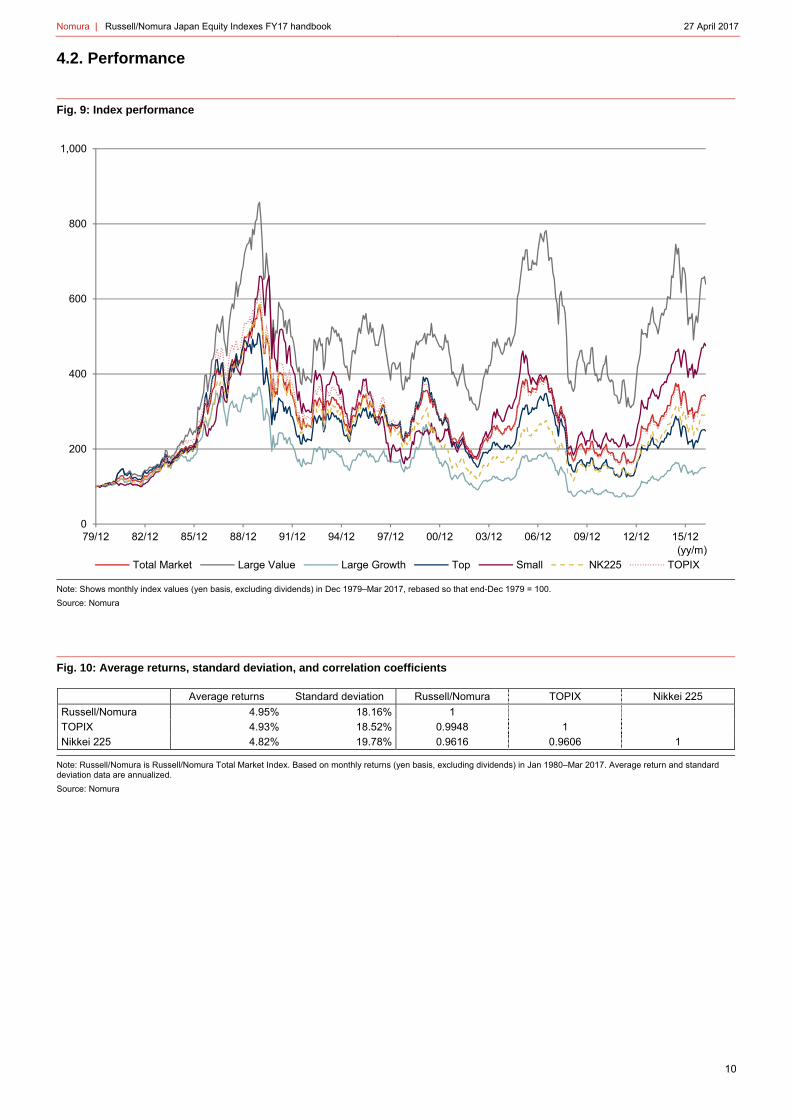
4.2. Performance
Fig. 9: Index performance
Note: Shows monthly index values (yen basis, excluding dividends) in Dec 1979–Mar 2017, rebased so that end-Dec 1979 = 100.
Source: Nomura
Fig. 10: Average returns, standard deviation, and correlation coefficients
Average returns Standard deviation Russell/Nomura TOPIX Nikkei 225
Russell/Nomura 4.95% 18.16% 1
TOPIX 4.93% 18.52% 0.9948 1
Nikkei 225 4.82% 19.78% 0.9616 0.9606 1
Note: Russell/Nomura is Russell/Nomura Total Market Index. Based on monthly returns (yen basis, excluding dividends) in Jan 1980–Mar 2017. Average return and standard deviation data are annualized.
Source: Nomura
0
200
400
600
800
1,000
79/12 82/12 85/12 88/12 91/12 94/12 97/12 00/12 03/12 06/12 09/12 12/12 15/12
Total Market Large Value Large Growth Top Small NK225 TOPIX(yy/m)
Nomura | Russell/Nomura Japan Equity Indexes FY17 handbook 27 April 2017
11
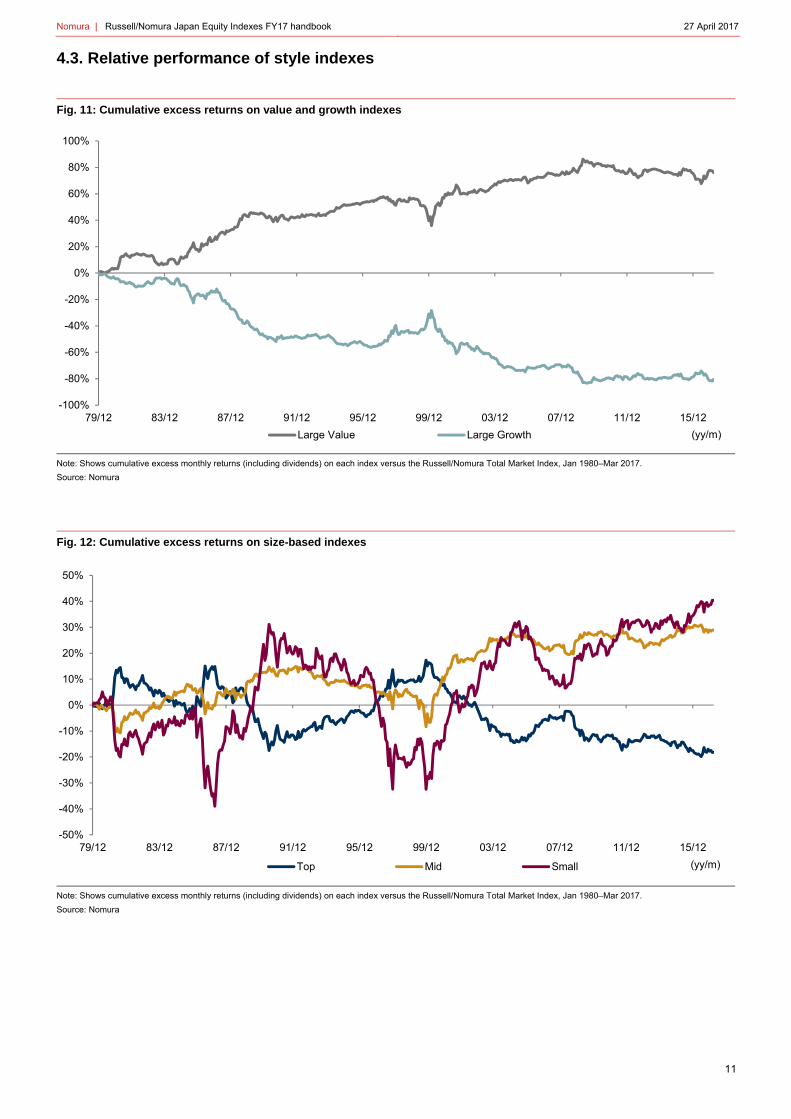
4.3. Relative performance of style indexes
Fig. 11: Cumulative excess returns on value and growth indexes
Note: Shows cumulative excess monthly returns (including dividends) on each index versus the Russell/Nomura Total Market Index, Jan 1980–Mar 2017.
Source: Nomura
Fig. 12: Cumulative excess returns on size-based indexes
Note: Shows cumulative excess monthly returns (including dividends) on each index versus the Russell/Nomura Total Market Index, Jan 1980–Mar 2017.
Source: Nomura
-100%
-80%
-60%
-40%
-20%
0%
20%
40%
60%
80%
100%
79/12 83/12 87/12 91/12 95/12 99/12 03/12 07/12 11/12 15/12
Large Value Large Growth (yy/m)
-50%
-40%
-30%
-20%
-10%
0%
10%
20%
30%
40%
50%
79/12 83/12 87/12 91/12 95/12 99/12 03/12 07/12 11/12 15/12
Top Mid Small (yy/m)
Nomura | Russell/Nomura Japan Equity Indexes FY17 handbook 27 April 2017
12
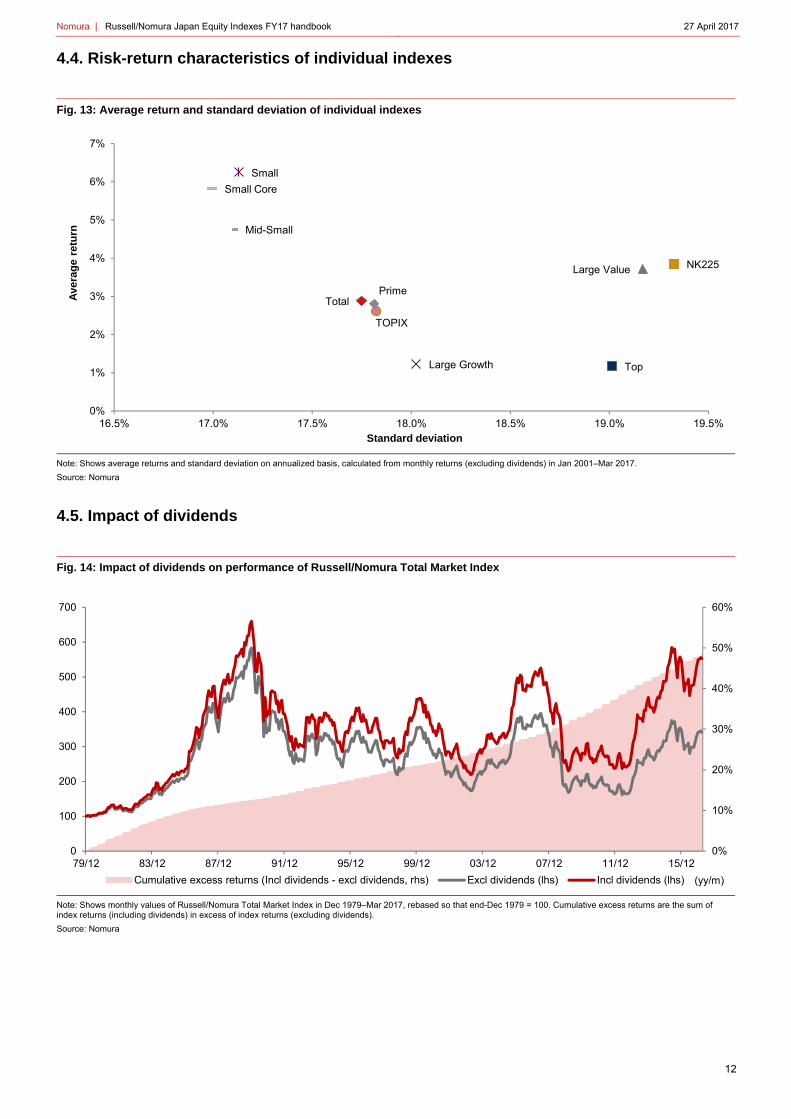
4.4. Risk-return characteristics of individual indexes
Fig. 13: Average return and standard deviation of individual indexes
Note: Shows average returns and standard deviation on annualized basis, calculated from monthly returns (excluding dividends) in Jan 2001–Mar 2017.
Source: Nomura
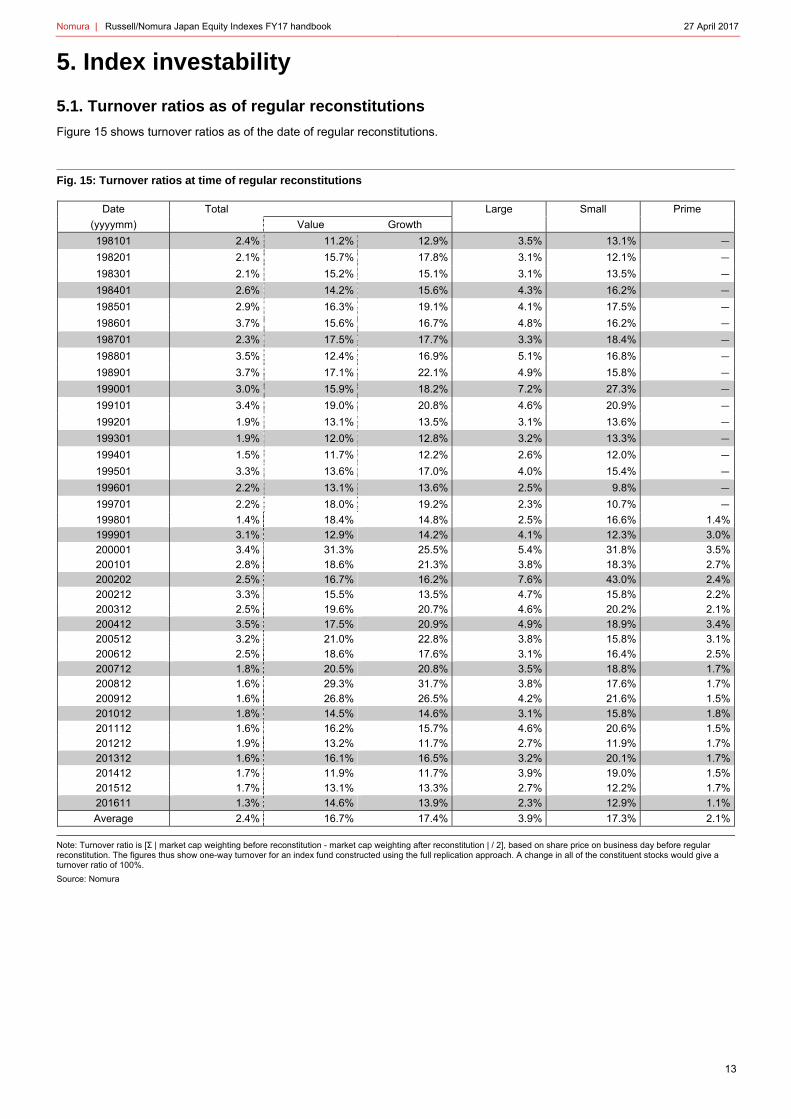
4.5. Impact of dividends
Fig. 14: Impact of dividends on performance of Russell/Nomura Total Market Index
Note: Shows monthly values of Russell/Nomura Total Market Index in Dec 1979–Mar 2017, rebased so that end-Dec 1979 = 100. Cumulative excess returns are the sum of index returns (including dividends) in excess of index returns (excluding dividends).
Source: Nomura
Total
Top
Large Value
Large Growth
Small
TOPIX
NK225
Mid-Small
Small Core
Prime
0%
1%
2%
3%
4%
5%
6%
7%
16.5% 17.0% 17.5% 18.0% 18.5% 19.0% 19.5%
Ave
rag
e re
turn
Standard deviation
0%
10%
20%
30%
40%
50%
60%
0
100
200
300
400
500
600
700
79/12 83/12 87/12 91/12 95/12 99/12 03/12 07/12 11/12 15/12
Cumulative excess returns (Incl dividends - excl dividends, rhs) Excl dividends (lhs) Incl dividends (lhs) (yy/m)
Nomura | Russell/Nomura Japan Equity Indexes FY17 handbook 27 April 2017
13
5. Index investability
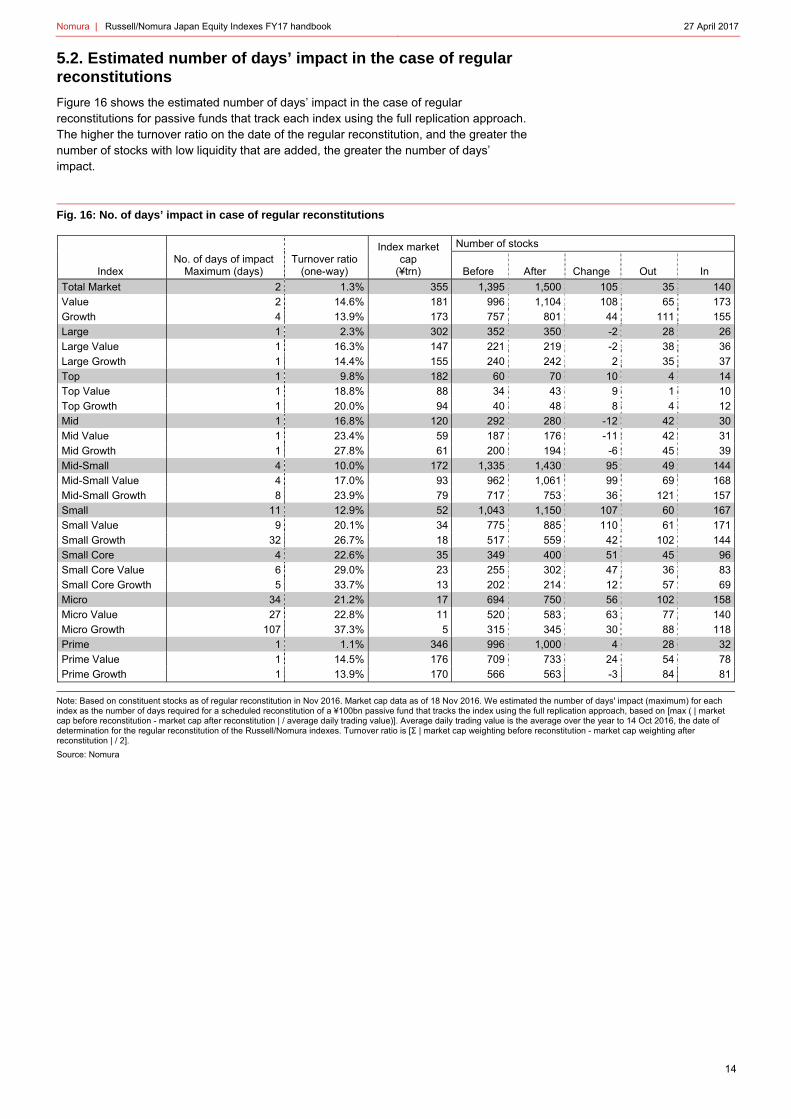
5.1. Turnover ratios as of regular reconstitutions
Figure 15 shows turnover ratios as of the date of regular reconstitutions.
Fig. 15: Turnover ratios at time of regular reconstitutions
Date Total Large Small Prime
(yyyymm) Value Growth
198101 2.4% 11.2% 12.9% 3.5% 13.1% -
198201 2.1% 15.7% 17.8% 3.1% 12.1% -
198301 2.1% 15.2% 15.1% 3.1% 13.5% -
198401 2.6% 14.2% 15.6% 4.3% 16.2% -
198501 2.9% 16.3% 19.1% 4.1% 17.5% -
198601 3.7% 15.6% 16.7% 4.8% 16.2% -
198701 2.3% 17.5% 17.7% 3.3% 18.4% -
198801 3.5% 12.4% 16.9% 5.1% 16.8% -
198901 3.7% 17.1% 22.1% 4.9% 15.8% -
199001 3.0% 15.9% 18.2% 7.2% 27.3% -
199101 3.4% 19.0% 20.8% 4.6% 20.9% -
199201 1.9% 13.1% 13.5% 3.1% 13.6% -
199301 1.9% 12.0% 12.8% 3.2% 13.3% -
199401 1.5% 11.7% 12.2% 2.6% 12.0% -
199501 3.3% 13.6% 17.0% 4.0% 15.4% -
199601 2.2% 13.1% 13.6% 2.5% 9.8% -
199701 2.2% 18.0% 19.2% 2.3% 10.7% -
199801 1.4% 18.4% 14.8% 2.5% 16.6% 1.4%
199901 3.1% 12.9% 14.2% 4.1% 12.3% 3.0%
200001 3.4% 31.3% 25.5% 5.4% 31.8% 3.5%
200101 2.8% 18.6% 21.3% 3.8% 18.3% 2.7%
200202 2.5% 16.7% 16.2% 7.6% 43.0% 2.4%
200212 3.3% 15.5% 13.5% 4.7% 15.8% 2.2%
200312 2.5% 19.6% 20.7% 4.6% 20.2% 2.1%
200412 3.5% 17.5% 20.9% 4.9% 18.9% 3.4%
200512 3.2% 21.0% 22.8% 3.8% 15.8% 3.1%
200612 2.5% 18.6% 17.6% 3.1% 16.4% 2.5%
200712 1.8% 20.5% 20.8% 3.5% 18.8% 1.7%
200812 1.6% 29.3% 31.7% 3.8% 17.6% 1.7%
200912 1.6% 26.8% 26.5% 4.2% 21.6% 1.5%
201012 1.8% 14.5% 14.6% 3.1% 15.8% 1.8%
201112 1.6% 16.2% 15.7% 4.6% 20.6% 1.5%
201212 1.9% 13.2% 11.7% 2.7% 11.9% 1.7%
201312 1.6% 16.1% 16.5% 3.2% 20.1% 1.7%
201412 1.7% 11.9% 11.7% 3.9% 19.0% 1.5%
201512 1.7% 13.1% 13.3% 2.7% 12.2% 1.7%
201611 1.3% 14.6% 13.9% 2.3% 12.9% 1.1%
Average 2.4% 16.7% 17.4% 3.9% 17.3% 2.1%
Note: Turnover ratio is [Σ | market cap weighting before reconstitution - market cap weighting after reconstitution | / 2], based on share price on business day before regular reconstitution. The figures thus show one-way turnover for an index fund constructed using the full replication approach. A change in all of the constituent stocks would give a turnover ratio of 100%.
Source: Nomura
Nomura | Russell/Nomura Japan Equity Indexes FY17 handbook 27 April 2017
14
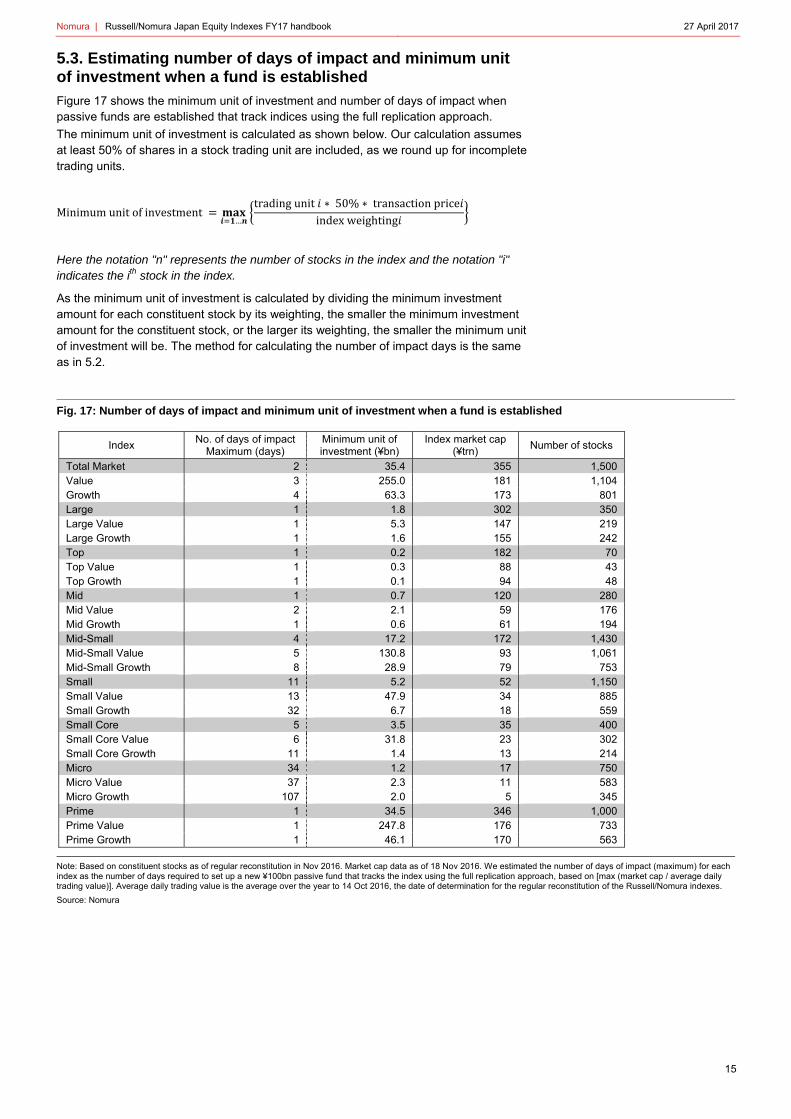
5.2. Estimated number of days’ impact in the case of regular reconstitutions
Figure 16 shows the estimated number of days’ impact in the case of regular reconstitutions for passive funds that track each index using the full replication approach. The higher the turnover ratio on the date of the regular reconstitution, and the greater the number of stocks with low liquidity that are added, the greater the number of days’ impact.
Fig. 16: No. of days’ impact in case of regular reconstitutions
Index market cap
(¥trn)
Number of stocks
Index No. of days of impact
Maximum (days) Turnover ratio
(one-way) Before After Change Out In
Total Market 2 1.3% 355 1,395 1,500 105 35 140
Value 2 14.6% 181 996 1,104 108 65 173
Growth 4 13.9% 173 757 801 44 111 155
Large 1 2.3% 302 352 350 -2 28 26
Large Value 1 16.3% 147 221 219 -2 38 36
Large Growth 1 14.4% 155 240 242 2 35 37
Top 1 9.8% 182 60 70 10 4 14
Top Value 1 18.8% 88 34 43 9 1 10
Top Growth 1 20.0% 94 40 48 8 4 12
Mid 1 16.8% 120 292 280 -12 42 30
Mid Value 1 23.4% 59 187 176 -11 42 31
Mid Growth 1 27.8% 61 200 194 -6 45 39
Mid-Small 4 10.0% 172 1,335 1,430 95 49 144
Mid-Small Value 4 17.0% 93 962 1,061 99 69 168
Mid-Small Growth 8 23.9% 79 717 753 36 121 157
Small 11 12.9% 52 1,043 1,150 107 60 167
Small Value 9 20.1% 34 775 885 110 61 171
Small Growth 32 26.7% 18 517 559 42 102 144
Small Core 4 22.6% 35 349 400 51 45 96
Small Core Value 6 29.0% 23 255 302 47 36 83
Small Core Growth 5 33.7% 13 202 214 12 57 69
Micro 34 21.2% 17 694 750 56 102 158
Micro Value 27 22.8% 11 520 583 63 77 140
Micro Growth 107 37.3% 5 315 345 30 88 118
Prime 1 1.1% 346 996 1,000 4 28 32
Prime Value 1 14.5% 176 709 733 24 54 78
Prime Growth 1 13.9% 170 566 563 -3 84 81
Note: Based on constituent stocks as of regular reconstitution in Nov 2016. Market cap data as of 18 Nov 2016. We estimated the number of days' impact (maximum) for each index as the number of days required for a scheduled reconstitution of a ¥100bn passive fund that tracks the index using the full replication approach, based on [max ( | market cap before reconstitution - market cap after reconstitution | / average daily trading value)]. Average daily trading value is the average over the year to 14 Oct 2016, the date of determination for the regular reconstitution of the Russell/Nomura indexes. Turnover ratio is [Σ | market cap weighting before reconstitution - market cap weighting after reconstitution | / 2].
Source: Nomura
Nomura | Russell/Nomura Japan Equity Indexes FY17 handbook 27 April 2017
15
5.3. Estimating number of days of impact and minimum unit of investment when a fund is established
Figure 17 shows the minimum unit of investment and number of days of impact when passive funds are established that track indices using the full replication approach.
The minimum unit of investment is calculated as shown below. Our calculation assumes at least 50% of shares in a stock trading unit are included, as we round up for incomplete trading units.
Minimumunitofinvestment…
tradingunit ∗ 50% ∗ transactionpriceindexweighting
Here the notation "n" represents the number of stocks in the index and the notation "i" indicates the ith stock in the index.
As the minimum unit of investment is calculated by dividing the minimum investment amount for each constituent stock by its weighting, the smaller the minimum investment amount for the constituent stock, or the larger its weighting, the smaller the minimum unit of investment will be. The method for calculating the number of impact days is the same as in 5.2.
Fig. 17: Number of days of impact and minimum unit of investment when a fund is established
Index No. of days of impact
Maximum (days) Minimum unit of investment (¥bn)
Index market cap (¥trn)
Number of stocks
Total Market 2 35.4 355 1,500 Value 3 255.0 181 1,104 Growth 4 63.3 173 801 Large 1 1.8 302 350 Large Value 1 5.3 147 219 Large Growth 1 1.6 155 242 Top 1 0.2 182 70 Top Value 1 0.3 88 43 Top Growth 1 0.1 94 48 Mid 1 0.7 120 280 Mid Value 2 2.1 59 176 Mid Growth 1 0.6 61 194 Mid-Small 4 17.2 172 1,430 Mid-Small Value 5 130.8 93 1,061 Mid-Small Growth 8 28.9 79 753 Small 11 5.2 52 1,150 Small Value 13 47.9 34 885 Small Growth 32 6.7 18 559 Small Core 5 3.5 35 400 Small Core Value 6 31.8 23 302 Small Core Growth 11 1.4 13 214 Micro 34 1.2 17 750 Micro Value 37 2.3 11 583 Micro Growth 107 2.0 5 345 Prime 1 34.5 346 1,000 Prime Value 1 247.8 176 733 Prime Growth 1 46.1 170 563
Note: Based on constituent stocks as of regular reconstitution in Nov 2016. Market cap data as of 18 Nov 2016. We estimated the number of days of impact (maximum) for each index as the number of days required to set up a new ¥100bn passive fund that tracks the index using the full replication approach, based on [max (market cap / average daily trading value)]. Average daily trading value is the average over the year to 14 Oct 2016, the date of determination for the regular reconstitution of the Russell/Nomura indexes.
Source: Nomura
Nomura | Russell/Nomura Japan Equity Indexes FY17 handbook 27 April 2017
16
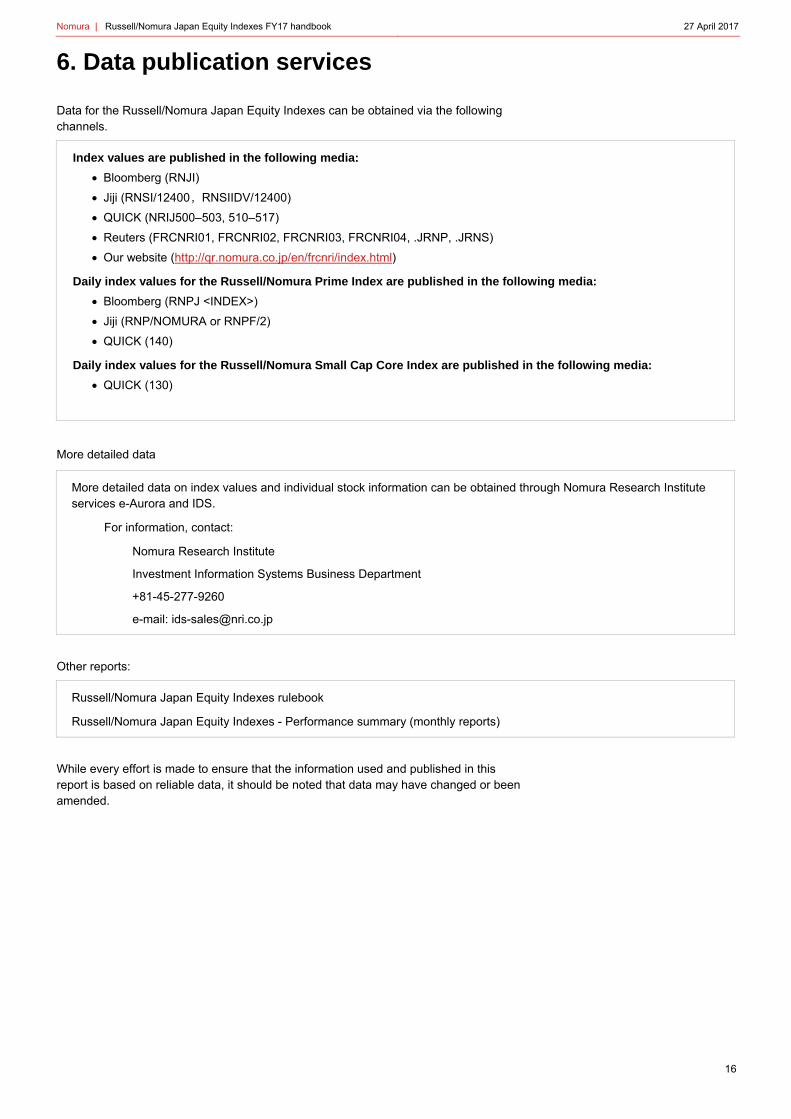
6. Data publication services
Data for the Russell/Nomura Japan Equity Indexes can be obtained via the following channels.
Index values are published in the following media:
Bloomberg (RNJI)
Jiji (RNSI/12400, RNSIIDV/12400)
QUICK (NRIJ500–503, 510–517)
Reuters (FRCNRI01, FRCNRI02, FRCNRI03, FRCNRI04, .JRNP, .JRNS)
Our website (http://qr.nomura.co.jp/en/frcnri/index.html)
Daily index values for the Russell/Nomura Prime Index are published in the following media:
Bloomberg (RNPJ <INDEX>)
Jiji (RNP/NOMURA or RNPF/2)
QUICK (140)
Daily index values for the Russell/Nomura Small Cap Core Index are published in the following media:
QUICK (130)
More detailed data
More detailed data on index values and individual stock information can be obtained through Nomura Research Institute services e-Aurora and IDS.
For information, contact:
Nomura Research Institute
Investment Information Systems Business Department
+81-45-277-9260
e-mail: [email protected]
Other reports:
Russell/Nomura Japan Equity Indexes rulebook
Russell/Nomura Japan Equity Indexes - Performance summary (monthly reports)
While every effort is made to ensure that the information used and published in this report is based on reliable data, it should be noted that data may have changed or been amended.
Nomura | Russell/Nomura Japan Equity Indexes FY17 handbook 27 April 2017
17
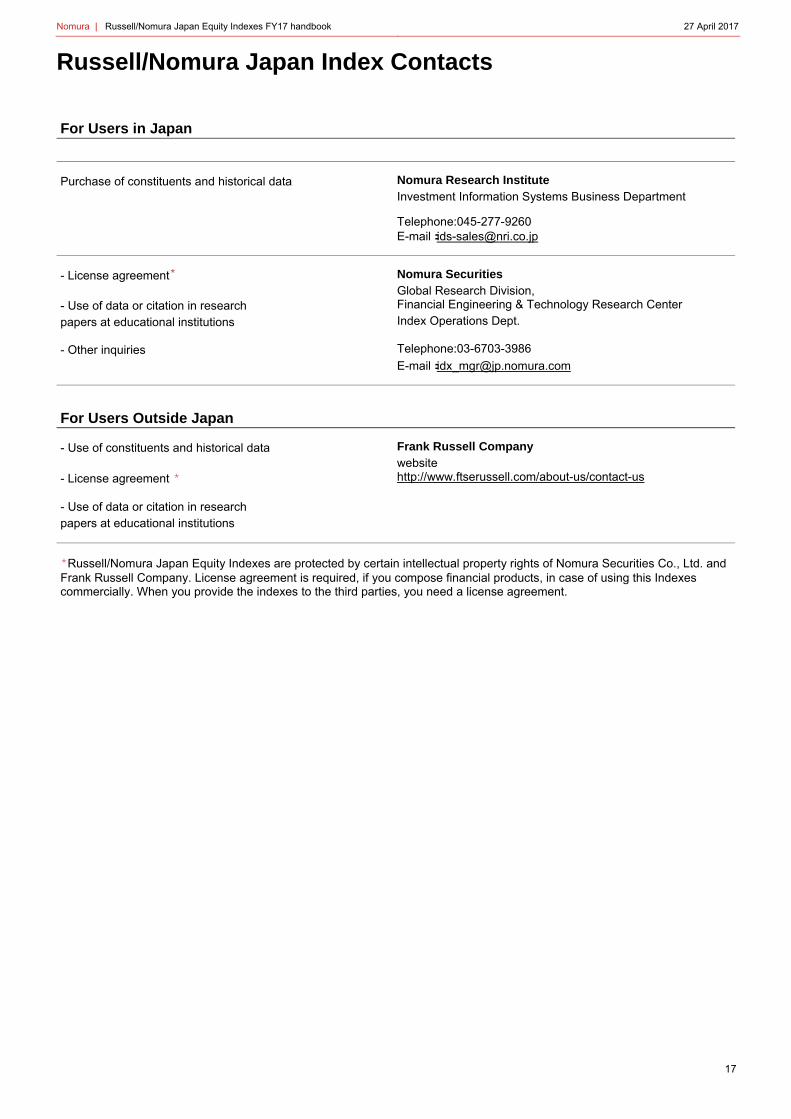
Russell/Nomura Japan Index Contacts
For Users in Japan
Purchase of constituents and historical data Nomura Research Institute
Investment Information Systems Business Department
Telephone:045-277-9260 E-mail:[email protected]
- License agreement Nomura Securities Global Research Division, - Use of data or citation in research Financial Engineering & Technology Research Center
papers at educational institutions Index Operations Dept.
- Other inquiries Telephone:03-6703-3986 E-mail:[email protected]
For Users Outside Japan
- Use of constituents and historical data Frank Russell Company website - License agreement http://www.ftserussell.com/about-us/contact-us
- Use of data or citation in research papers at educational institutions
Russell/Nomura Japan Equity Indexes are protected by certain intellectual property rights of Nomura Securities Co., Ltd. and Frank Russell Company. License agreement is required, if you compose financial products, in case of using this Indexes commercially. When you provide the indexes to the third parties, you need a license agreement.

Nomura | Russell/Nomura Japan Equity Indexes FY17 handbook 27 April 2017
18
Appendix A-1
Analyst Certification
We, Yumiko Hirano and Naoko Kato, hereby certify (1) that the views expressed in this Research report accurately reflect our personal views about any or all of the subject securities or issuers referred to in this Research report, (2) no part of our compensation was, is or will be directly or indirectly related to the specific recommendations or views expressed in this Research report and (3) no part of our compensation is tied to any specific investment banking transactions performed by Nomura Securities International, Inc., Nomura International plc or any other Nomura Group company.
Important Disclosures The lists of issuers that are affiliates or subsidiaries of Nomura Holdings Inc., the parent company of Nomura Securities Co., Ltd., issuers that have officers who concurrently serve as officers of Nomura Securities Co., Ltd., issuers in which the Nomura Group holds 1% or more of any class of common equity securities and issuers for which Nomura Securities Co., Ltd. has lead managed a public offering of equity or equity linked securities in the past 12 months are available at http://www.nomuraholdings.com/report/. Please contact the Research Product Management Dept. of Nomura Securities Co., Ltd. for additional information. Online availability of research and conflict-of-interest disclosures Nomura Group research is available on www.nomuranow.com/research, Bloomberg, Capital IQ, Factset, MarkitHub, Reuters and ThomsonOne. Important disclosures may be read at http://go.nomuranow.com/research/globalresearchportal/pages/disclosures/disclosures.aspx or requested from Nomura Securities International, Inc., or Instinet, LLC on 1-877-865-5752. If you have any difficulties with the website, please email [email protected] for help. The analysts responsible for preparing this report have received compensation based upon various factors including the firm's total revenues, a portion of which is generated by Investment Banking activities. Unless otherwise noted, the non-US analysts listed at the front of this report are not registered/qualified as research analysts under FINRA rules, may not be associated persons of NSI or ILLC, and may not be subject to FINRA Rule 2241 restrictions on communications with covered companies, public appearances, and trading securities held by a research analyst account. Nomura Global Financial Products Inc. (“NGFP”) Nomura Derivative Products Inc. (“NDPI”) and Nomura International plc. (“NIplc”) are registered with the Commodities Futures Trading Commission and the National Futures Association (NFA) as swap dealers. NGFP, NDPI, and NIplc are generally engaged in the trading of swaps and other derivative products, any of which may be the subject of this report. Distribution of ratings (Nomura Group) The distribution of all ratings published by Nomura Group Global Equity Research is as follows: 51% have been assigned a Buy rating which, for purposes of mandatory disclosures, are classified as a Buy rating; 37% of companies with this rating are investment banking clients of the Nomura Group*. 0% of companies (which are admitted to trading on a regulated market in the EEA) with this rating were supplied material services** by the Nomura Group. 41% have been assigned a Neutral rating which, for purposes of mandatory disclosures, is classified as a Hold rating; 51% of companies with this rating are investment banking clients of the Nomura Group*. 0% of companies (which are admitted to trading on a regulated market in the EEA) with this rating were supplied material services by the Nomura Group 8% have been assigned a Reduce rating which, for purposes of mandatory disclosures, are classified as a Sell rating; 7% of companies with this rating are investment banking clients of the Nomura Group*. 0% of companies (which are admitted to trading on a regulated market in the EEA) with this rating were supplied material services by the Nomura Group. As at 31 March 2017. *The Nomura Group as defined in the Disclaimer section at the end of this report. ** As defined by the EU Market Abuse Regulation Distribution of ratings (Instinet, LLC) The distribution of all ratings published by Instinet, LLC Equity Research is as follows: 53% have been assigned a Buy rating which, for purposes of mandatory disclosures, are classified as a Buy rating; Instinet LLC has provided investment banking services to 0% of companies with this rating within the previous 12 months. 41% have been assigned a Neutral rating which, for purposes of mandatory disclosures, is classified as a Hold rating; Instinet LLC has provided investment banking services to 0% of companies with this rating within the previous 12 months. 6% have been assigned a Reduce rating which, for purposes of mandatory disclosures, are classified as a Sell rating; Instinet LLC has provided investment banking services to 0% of companies with this rating within the previous 12 months. Definition of Nomura Group's equity research rating system and sectors The rating system is a relative system, indicating expected performance against a specific benchmark identified for each individual stock, subject to limited management discretion. An analyst’s target price is an assessment of the current intrinsic fair value of the stock based on an appropriate valuation methodology determined by the analyst. Valuation methodologies include, but are not limited to, discounted cash flow analysis, expected return on equity and multiple analysis. Analysts may also indicate expected absolute upside/downside relative to the stated target price, defined as (target price - current price)/current price. STOCKS A rating of 'Buy', indicates that the analyst expects the stock to outperform the Benchmark over the next 12 months. A rating of 'Neutral', indicates that the analyst expects the stock to perform in line with the Benchmark over the next 12 months. A rating of 'Reduce', indicates that the analyst expects the stock to underperform the Benchmark over the next 12 months. A rating of 'Suspended', indicates that the rating, target

Nomura | Russell/Nomura Japan Equity Indexes FY17 handbook 27 April 2017
19
price and estimates have been suspended temporarily to comply with applicable regulations and/or firm policies. Securities and/or companies that are labelled as 'Not rated' or shown as 'No rating' are not in regular research coverage. Investors should not expect continuing or additional information from Nomura relating to such securities and/or companies. Benchmarks are as follows: United States/Europe/Asia ex-Japan: please see valuation methodologies for explanations of relevant benchmarks for stocks, which can be accessed at: http://go.nomuranow.com/research/globalresearchportal/pages/disclosures/disclosures.aspx; Global Emerging Markets (ex-Asia): MSCI Emerging Markets ex-Asia, unless otherwise stated in the valuation methodology; Japan: Russell/Nomura Large Cap. SECTORS A 'Bullish' stance, indicates that the analyst expects the sector to outperform the Benchmark during the next 12 months. A 'Neutral' stance, indicates that the analyst expects the sector to perform in line with the Benchmark during the next 12 months. A 'Bearish' stance, indicates that the analyst expects the sector to underperform the Benchmark during the next 12 months. Sectors that are labelled as 'Not rated' or shown as 'N/A' are not assigned ratings. Benchmarks are as follows: United States: S&P 500; Europe: Dow Jones STOXX 600; Global Emerging Markets (ex-Asia): MSCI Emerging Markets ex-Asia. Japan/Asia ex-Japan: Sector ratings are not assigned. Target Price A Target Price, if discussed, indicates the analyst’s forecast for the share price with a 12-month time horizon, reflecting in part the analyst's estimates for the company's earnings. The achievement of any target price may be impeded by general market and macroeconomic trends, and by other risks related to the company or the market, and may not occur if the company's earnings differ from estimates. Disclaimers This publication contains material that has been prepared by the Nomura Group entity identified on page 1 and, if applicable, with the contributions of one or more Nomura Group entities whose employees and their respective affiliations are specified on page 1 or identified elsewhere in the publication. The term "Nomura Group" used herein refers to Nomura Holdings, Inc. and its affiliates and subsidiaries including: Nomura Securities Co., Ltd. ('NSC') Tokyo, Japan; Nomura International plc ('NIplc'), UK; Nomura Securities International, Inc. ('NSI'), New York, US; Instinet, LLC ('ILLC'); Nomura International (Hong Kong) Ltd. (‘NIHK’), Hong Kong; Nomura Financial Investment (Korea) Co., Ltd. (‘NFIK’), Korea (Information on Nomura analysts registered with the Korea Financial Investment Association ('KOFIA') can be found on the KOFIA Intranet at http://dis.kofia.or.kr); Nomura Singapore Ltd. (‘NSL’), Singapore (Registration number 197201440E, regulated by the Monetary Authority of Singapore); Nomura Australia Ltd. (‘NAL’), Australia (ABN 48 003 032 513), regulated by the Australian Securities and Investment Commission ('ASIC') and holder of an Australian financial services licence number 246412; PT Nomura Sekuritas Indonesia (‘PTNSI’); Nomura Securities Malaysia Sdn. Bhd. (‘NSM’), Malaysia; NIHK, Taipei Branch (‘NITB’), Taiwan; Nomura Financial Advisory and Securities (India) Private Limited (‘NFASL’), Mumbai, India (Registered Address: Ceejay House, Level 11, Plot F, Shivsagar Estate, Dr. Annie Besant Road, Worli, Mumbai- 400 018, India; Tel: +91 22 4037 4037, Fax: +91 22 4037 4111; CIN No: U74140MH2007PTC169116, SEBI Registration No. for Stock Broking activities : BSE INB011299030, NSE INB231299034, INF231299034, INE 231299034, MCX: INE261299034; SEBI Registration No. for Merchant Banking : INM000011419; SEBI Registration No. for Research: INH000001014 and NIplc, Madrid Branch (‘NIplc, Madrid’). ‘CNS Thailand’ next to an analyst’s name on the front page of a research report indicates that the analyst is employed by Capital Nomura Securities Public Company Limited (‘CNS’) to provide research assistance services to NSL under an agreement between CNS and NSL. ‘NSFSPL’ next to an employee’s name on the front page of a research report indicates that the individual is employed by Nomura Structured Finance Services Private Limited to provide assistance to certain Nomura entities under inter-company agreements. The "BDO-NS" (which stands for "BDO Nomura Securities, Inc.") placed next to an analyst’s name on the front page of a research report indicates that the analyst is employed by BDO Unibank Inc. ("BDO Unibank") who has been seconded to BDO-NS, to provide research assistance services to NSL under an agreement between BDO Unibank, NSL and BDO-NS. BDO-NS is a Philippines securities dealer, which is a joint venture between BDO Unibank and the Nomura Group. THIS MATERIAL IS: (I) FOR YOUR PRIVATE INFORMATION, AND WE ARE NOT SOLICITING ANY ACTION BASED UPON IT; (II) NOT TO BE CONSTRUED AS AN OFFER TO SELL OR A SOLICITATION OF AN OFFER TO BUY ANY SECURITY IN ANY JURISDICTION WHERE SUCH OFFER OR SOLICITATION WOULD BE ILLEGAL; AND (III) OTHER THAN DISCLOSURES RELATING TO THE NOMURA GROUP, BASED UPON INFORMATION FROM SOURCES THAT WE CONSIDER RELIABLE, BUT HAS NOT BEEN INDEPENDENTLY VERIFIED BY NOMURA GROUP. Other than disclosures relating to the Nomura Group, the Nomura Group does not warrant or represent that the document is accurate, complete, reliable, fit for any particular purpose or merchantable and does not accept liability for any act (or decision not to act) resulting from use of this document and related data. To the maximum extent permissible all warranties and other assurances by the Nomura Group are hereby excluded and the Nomura Group shall have no liability for the use, misuse, or distribution of this information. Opinions or estimates expressed are current opinions as of the original publication date appearing on this material and the information, including the opinions and estimates contained herein, are subject to change without notice. The Nomura Group is under no duty to update this document. Any comments or statements made herein are those of the author(s) and may differ from views held by other parties within Nomura Group. Clients should consider whether any advice or recommendation in this report is suitable for their particular circumstances and, if appropriate, seek professional advice, including tax advice. The Nomura Group does not provide tax advice. The Nomura Group, and/or its officers, directors and employees, may, to the extent permitted by applicable law and/or regulation, deal as principal, agent, or otherwise, or have long or short positions in, or buy or sell, the securities, commodities or instruments, or options or other derivative instruments based thereon, of issuers or securities mentioned herein. The Nomura Group companies may also act as market maker or liquidity provider (within the meaning of applicable regulations in the UK) in the financial instruments of the issuer. Where the activity of market maker is carried out in accordance with the definition given to it by specific laws and regulations of the US or other jurisdictions, this will be separately disclosed within the specific issuer disclosures. This document may contain information obtained from third parties, including ratings from credit ratings agencies such as Standard & Poor’s. Reproduction and distribution of third-party content in any form is prohibited except with the prior written permission of the related third-party. Third-party content providers do not guarantee the accuracy, completeness, timeliness or availability of any information, including ratings, and are not responsible for any errors or omissions (negligent or otherwise), regardless of the cause, or for the results obtained from the use of such content. Third-party content providers give no express or implied warranties, including, but not limited to, any warranties of merchantability or fitness for a particular purpose or use. Third-party content providers shall not be liable for any direct, indirect, incidental, exemplary, compensatory, punitive, special or consequential damages, costs, expenses, legal fees, or losses (including lost income or profits and opportunity costs) in connection with any use of their content, including ratings. Credit ratings are statements of opinions and are not statements of fact or recommendations to purchase hold or sell securities. They do not address the suitability of securities or the suitability of securities for investment purposes, and should not be relied on as investment advice. Any MSCI sourced information in this document is the exclusive property of MSCI Inc. (‘MSCI’). Without prior written permission of MSCI, this information and any other MSCI intellectual property may not be reproduced, re-disseminated or used to create any financial products, including
Nomura | Russell/Nomura Japan Equity Indexes FY17 handbook 27 April 2017
20
any indices. This information is provided on an "as is" basis. The user assumes the entire risk of any use made of this information. MSCI, its affiliates and any third party involved in, or related to, computing or compiling the information hereby expressly disclaim all warranties of originality, accuracy, completeness, merchantability or fitness for a particular purpose with respect to any of this information. Without limiting any of the foregoing, in no event shall MSCI, any of its affiliates or any third party involved in, or related to, computing or compiling the information have any liability for any damages of any kind. MSCI and the MSCI indexes are services marks of MSCI and its affiliates. The intellectual property rights and any other rights, in Russell/Nomura Japan Equity Index belong to Nomura Securities Co., Ltd. ("Nomura") and Frank Russell Company ("Russell"). Nomura and Russell do not guarantee accuracy, completeness, reliability, usefulness, marketability, merchantability or fitness of the Index, and do not account for business activities or services that any index user and/or its affiliates undertakes with the use of the Index. Investors should consider this document as only a single factor in making their investment decision and, as such, the report should not be viewed as identifying or suggesting all risks, direct or indirect, that may be associated with any investment decision. Nomura Group produces a number of different types of research product including, among others, fundamental analysis and quantitative analysis; recommendations contained in one type of research product may differ from recommendations contained in other types of research product, whether as a result of differing time horizons, methodologies or otherwise. The Nomura Group publishes research product in a number of different ways including the posting of product on the Nomura Group portals and/or distribution directly to clients. Different groups of clients may receive different products and services from the research department depending on their individual requirements. Figures presented herein may refer to past performance or simulations based on past performance which are not reliable indicators of future performance. Where the information contains an indication of future performance, such forecasts may not be a reliable indicator of future performance. Moreover, simulations are based on models and simplifying assumptions which may oversimplify and not reflect the future distribution of returns. Certain securities are subject to fluctuations in exchange rates that could have an adverse effect on the value or price of, or income derived from, the investment. With respect to Fixed Income Research: Recommendations fall into two categories: tactical, which typically last up to three months; or strategic, which typically last from 6-12 months. However, trade recommendations may be reviewed at any time as circumstances change. ‘Stop loss’ levels for trades are also provided; which, if hit, closes the trade recommendation automatically. Prices and yields shown in recommendations are taken at the time of submission for publication and are based on either indicative Bloomberg, Reuters or Nomura prices and yields at that time. The prices and yields shown are not necessarily those at which the trade recommendation can be implemented. The securities described herein may not have been registered under the US Securities Act of 1933 (the ‘1933 Act’), and, in such case, may not be offered or sold in the US or to US persons unless they have been registered under the 1933 Act, or except in compliance with an exemption from the registration requirements of the 1933 Act. Unless governing law permits otherwise, any transaction should be executed via a Nomura entity in your home jurisdiction. This document has been approved for distribution in the UK and European Economic Area as investment research by NIplc. NIplc is authorised by the Prudential Regulation Authority and regulated by the Financial Conduct Authority and the Prudential Regulation Authority. NIplc is a member of the London Stock Exchange. This document does not constitute a personal recommendation within the meaning of applicable regulations in the UK, or take into account the particular investment objectives, financial situations, or needs of individual investors. This document is intended only for investors who are 'eligible counterparties' or 'professional clients' for the purposes of applicable regulations in the UK, and may not, therefore, be redistributed to persons who are 'retail clients' for such purposes. This document has been approved by NIHK, which is regulated by the Hong Kong Securities and Futures Commission, for distribution in Hong Kong by NIHK. This document has been approved for distribution in Australia by NAL, which is authorized and regulated in Australia by the ASIC. This document has also been approved for distribution in Malaysia by NSM. In Singapore, this document has been distributed by NSL. NSL accepts legal responsibility for the content of this document, where it concerns securities, futures and foreign exchange, issued by their foreign affiliates in respect of recipients who are not accredited, expert or institutional investors as defined by the Securities and Futures Act (Chapter 289). Recipients of this document in Singapore should contact NSL in respect of matters arising from, or in connection with, this document. Unless prohibited by the provisions of Regulation S of the 1933 Act, this material is distributed in the US, by NSI, a US-registered broker-dealer, which accepts responsibility for its contents in accordance with the provisions of Rule 15a-6, under the US Securities Exchange Act of 1934. The entity that prepared this document permits its separately operated affiliates within the Nomura Group to make copies of such documents available to their clients. This document has not been approved for distribution to persons other than ‘Authorised Persons’, ‘Exempt Persons’ or ‘Institutions’ (as defined by the Capital Markets Authority) in the Kingdom of Saudi Arabia (‘Saudi Arabia’) or 'professional clients' (as defined by the Dubai Financial Services Authority) in the United Arab Emirates (‘UAE’) or a ‘Market Counterparty’ or ‘Business Customers’ (as defined by the Qatar Financial Centre Regulatory Authority) in the State of Qatar (‘Qatar’) by Nomura Saudi Arabia, NIplc or any other member of the Nomura Group, as the case may be. Neither this document nor any copy thereof may be taken or transmitted or distributed, directly or indirectly, by any person other than those authorised to do so into Saudi Arabia or in the UAE or in Qatar or to any person other than ‘Authorised Persons’, ‘Exempt Persons’ or ‘Institutions’ located in Saudi Arabia or 'professional clients' in the UAE or a ‘Market Counterparty’ or ‘Business Customers’ in Qatar . By accepting to receive this document, you represent that you are not located in Saudi Arabia or that you are an ‘Authorised Person’, an ‘Exempt Person’ or an ‘Institution’ in Saudi Arabia or that you are a 'professional client' in the UAE or a ‘Market Counterparty’ or ‘Business Customers’ in Qatar and agree to comply with these restrictions. Any failure to comply with these restrictions may constitute a violation of the laws of the UAE or Saudi Arabia or Qatar. Notice to Canadian Investors: This research report is not a personal recommendation and does not take into account the investment objectives, financial situation or particular needs of any particular individual or account. It is made available to you in reliance on NI 31-103, section 8.25. For report with reference of TAIWAN public companies or authored by Taiwan based research analyst: THIS DOCUMENT IS SOLELY FOR REFERENCE ONLY. You should independently evaluate the investment risks and are solely responsible for your investment decisions. NO PORTION OF THE REPORT MAY BE REPRODUCED OR QUOTED BY THE PRESS OR ANY OTHER PERSON WITHOUT WRITTEN AUTHORIZATION FROM NOMURA GROUP. Pursuant to Operational Regulations Governing Securities Firms Recommending Trades in Securities to Customers and/or other applicable laws or regulations in Taiwan, you are prohibited to provide the reports to others (including but not limited to related parties, affiliated companies and any other third parties) or engage in any activities in connection with the reports which may involve conflicts of interests. INFORMATION ON SECURITIES / INSTRUMENTS NOT EXECUTABLE BY NOMURA INTERNATIONAL (HONG KONG) LTD., TAIPEI BRANCH IS FOR INFORMATIONAL PURPOSES ONLY AND IS NOT BE CONSTRUED AS A RECOMMENDATION OR A SOLICITATION TO TRADE IN SUCH SECURITIES / INSTRUMENTS. NO PART OF THIS MATERIAL MAY BE (I) COPIED, PHOTOCOPIED, OR DUPLICATED IN ANY FORM, BY ANY MEANS; OR (II) REDISTRIBUTED WITHOUT THE PRIOR WRITTEN CONSENT OF A MEMBER OF THE NOMURA GROUP. If this document has been distributed by electronic transmission, such as e-mail, then such transmission cannot be guaranteed to be secure or error-free as information could be intercepted, corrupted, lost, destroyed, arrive late or incomplete, or contain viruses. The sender therefore does not accept liability for any errors or omissions in the contents of this document, which may arise as a result of electronic transmission. If verification is required, please request a hard-copy version. ------ Disclaimers required in Japan
Nomura | Russell/Nomura Japan Equity Indexes FY17 handbook 27 April 2017
21
Credit ratings in the text that are marked with an asterisk (*) are issued by a rating agency not registered under Japan’s Financial Instruments and Exchange Act (“Unregistered Ratings”). For details on Unregistered Ratings, please contact the Research Product Management Dept. of Nomura Securities Co., Ltd. Investors in the financial products offered by Nomura Securities may incur fees and commissions specific to those products (for example, transactions involving Japanese equities are subject to a sales commission of up to 1.404% on a tax-inclusive basis of the transaction amount or a commission of ¥2,808 for transactions of ¥200,000 or less, while transactions involving investment trusts are subject to various fees, such as commissions at the time of purchase and asset management fees (trust fees), specific to each investment trust). In addition, all products carry the risk of losses owing to price fluctuations or other factors. Fees and risks vary by product. Please thoroughly read the written materials provided, such as documents delivered before making a contract, listed securities documents, or prospectuses. ------ Transactions involving Japanese equities (including Japanese REITs, Japanese ETFs, and Japanese ETNs) are subject to a sales commission of up to 1.404% of the transaction amount (or a commission of ¥2,808 for transactions of ¥200,000 or less). When Japanese equities are purchased via OTC transactions (including offerings), only the purchase price shall be paid, with no sales commission charged. However, Nomura Securities may charge a separate fee for OTC transactions, as agreed with the customer. Japanese equities carry the risk of losses owing to price fluctuations. Japanese REITs carry the risk of losses owing to fluctuations in price and/or earnings of underlying real estate. Japanese ETFs carry the risk of losses owing to fluctuations in the underlying indexes or other benchmarks. Transactions involving foreign equities are subject to a domestic sales commission of up to 1.026% of the transaction amount (which equals the local transaction amount plus local fees and taxes in the case of a purchase or the local transaction amount minus local fees and taxes in the case of a sale) (for transaction amounts of ¥750,000 and below, maximum domestic sales commission is ¥7,668). Local fees and taxes in foreign financial instruments markets vary by country/territory. When foreign equities are purchased via OTC transactions (including offerings), only the purchase price shall be paid, with no sales commission charged. However, Nomura Securities may charge a separate fee for OTC transactions, as agreed with the customer. Foreign equities carry the risk of losses owing to factors such as price fluctuations and foreign exchange rate fluctuations. Margin transactions are subject to a sales commission of up to 1.404% of the transaction amount (or a commission of ¥2,808 for transactions of ¥200,000 or less), as well as management fees and rights handling fees. In addition, long margin transactions are subject to interest on the purchase amount, while short margin transactions are subject to fees for the lending of the shares borrowed. A margin equal to at least 30% of the transaction amount and at least ¥300,000 is required. With margin transactions, an amount up to roughly 3.3x the margin may be traded. Margin transactions therefore carry the risk of losses in excess of the margin owing to share price fluctuations. For details, please thoroughly read the written materials provided, such as listed securities documents or documents delivered before making a contract. Transactions involving convertible bonds are subject to a sales commission of up to 1.08% of the transaction amount (or a commission of ¥4,320 if this would be less than ¥4,320). When convertible bonds are purchased via OTC transactions (including offerings), only the purchase price shall be paid, with no sales commission charged. However, Nomura Securities may charge a separate fee for OTC transactions, as agreed with the customer. Convertible bonds carry the risk of losses owing to factors such as interest rate fluctuations and price fluctuations in the underlying stock. In addition, convertible bonds denominated in foreign currencies also carry the risk of losses owing to factors such as foreign exchange rate fluctuations. When bonds are purchased via public offerings, secondary distributions, or other OTC transactions with Nomura Securities, only the purchase price shall be paid, with no sales commission charged. Bonds carry the risk of losses, as prices fluctuate in line with changes in market interest rates. Bond prices may also fall below the invested principal as a result of such factors as changes in the management and financial circumstances of the issuer, or changes in third-party valuations of the bond in question. In addition, foreign currency-denominated bonds also carry the risk of losses owing to factors such as foreign exchange rate fluctuations. When Japanese government bonds (JGBs) for individual investors are purchased via public offerings, only the purchase price shall be paid, with no sales commission charged. As a rule, JGBs for individual investors may not be sold in the first 12 months after issuance. When JGBs for individual investors are sold before maturity, an amount calculated via the following formula will be subtracted from the par value of the bond plus accrued interest: (1) for 10-year variable rate bonds, an amount equal to the two preceding coupon payments (before tax) x 0.79685 will be used, (2) for 5-year and 3-year fixed rate bonds, an amount equal to the two preceding coupon payments (before tax) x 0.79685 will be used. When inflation-indexed JGBs are purchased via public offerings, secondary distributions (uridashi deals), or other OTC transactions with Nomura Securities, only the purchase price shall be paid, with no sales commission charged. Inflation-indexed JGBs carry the risk of losses, as prices fluctuate in line with changes in market interest rates and fluctuations in the nationwide consumer price index.The notional principal of inflation-indexed JGBs changes in line with the rate of change in nationwide CPI inflation from the time of its issuance. The amount of the coupon payment is calculated by multiplying the coupon rate by the notional principal at the time of payment. The maturity value is the amount of the notional principal when the issue becomes due. For JI17 and subsequent issues, the maturity value shall not undercut the face amount. Purchases of investment trusts (and sales of some investment trusts) are subject to a purchase or sales fee of up to 5.4% of the transaction amount. Also, a direct cost that may be incurred when selling investment trusts is a fee of up to 2.0% of the unit price at the time of redemption. Indirect costs that may be incurred during the course of holding investment trusts include, for domestic investment trusts, an asset management fee (trust fee) of up to 5.4% (annualized basis) of the net assets in trust, as well as fees based on investment performance. Other indirect costs may also be incurred. For foreign investment trusts, indirect fees may be incurred during the course of holding such as investment company compensation. Investment trusts invest mainly in securities such as Japanese and foreign equities and bonds, whose prices fluctuate. Investment trust unit prices fluctuate owing to price fluctuations in the underlying assets and to foreign exchange rate fluctuations. As such, investment trusts carry the risk of losses. Fees and risks vary by investment trust. Maximum applicable fees are subject to change; please thoroughly read the written materials provided, such as prospectuses or documents delivered before making a contract. In interest rate swap transactions and USD/JPY basis swap transactions (“interest rate swap transactions, etc.”), only the agreed transaction payments shall be made on the settlement dates. Some interest rate swap transactions, etc. may require pledging of margin collateral. In some of these cases, transaction payments may exceed the amount of collateral. There shall be no advance notification of required collateral value or collateral ratios as they vary depending on the transaction. Interest rate swap transactions, etc. carry the risk of losses owing to fluctuations in market prices in the interest rate, currency and other markets, as well as reference indices. Losses incurred as such may exceed the value of margin collateral, in which case margin calls may be triggered. In the event that both parties agree to enter a replacement (or termination) transaction, the interest rates received (paid) under the new arrangement may differ from those in the original arrangement, even if terms other than the interest rates are identical to those in the original transaction. Risks vary by transaction. Please thoroughly read the written materials provided, such as documents delivered before making a contract and disclosure statements. In OTC transactions of credit default swaps (CDS), no sales commission will be charged. When entering into CDS transactions, the protection buyer will be required to pledge or entrust an agreed amount of margin collateral. In some of these cases, the transaction payments may exceed the amount of margin collateral. There shall be no advance notification of required collateral value or collateral ratios as they vary depending on the financial position of the protection buyer. CDS transactions carry the risk of losses owing to changes in the credit position of some or all of the referenced entities, and/or fluctuations of the interest rate market. The amount the protection buyer receives in the event that the CDS is triggered by a credit event may undercut the total amount of premiums that he/she has paid in the course of the transaction. Similarly, the amount the protection seller pays in the event of a credit event may exceed the total amount of premiums that he/she has received in the

Nomura | Russell/Nomura Japan Equity Indexes FY17 handbook 27 April 2017
22
transaction. All other conditions being equal, the amount of premiums that the protection buyer pays and that received by the protection seller shall differ. In principle, CDS transactions will be limited to financial instruments business operators and qualified institutional investors. No account fee will be charged for marketable securities or monies deposited. Transfers of equities to another securities company via the Japan Securities Depository Center are subject to a transfer fee of up to ¥10,800 per issue transferred depending on volume. Nomura Securities Co., Ltd. Financial instruments firm registered with the Kanto Local Finance Bureau (registration No. 142) Member associations: Japan Securities Dealers Association; Japan Investment Advisers Association; The Financial Futures Association of Japan; and Type II Financial Instruments Firms Association. The Nomura Group manages conflicts with respect to the production of research through its compliance policies and procedures (including, but not limited to, Conflicts of Interest, Chinese Wall and Confidentiality policies) as well as through the maintenance of Chinese walls and employee training. Additional information regarding the methodologies or models used in the production of any investment recommendations contained within this document is available upon request by contacting the Research Analysts listed on the front page. Disclosures information is available upon request and disclosure information is available at the Nomura Disclosure web page: http://go.nomuranow.com/research/globalresearchportal/pages/disclosures/disclosures.aspx Copyright © 2017 Nomura Securities Co., Ltd. All rights reserved.