Embed Size (px)
Citation preview

RUSH UNIVERSITY MEDICAL CENTER
Community Health Needs Assessment Report
Adopted on May 8, 2013
2
Ack
no
wle
dg
emen
ts Rush University Medical Center would like to extend a
special thank you to everyone who participated in the
Community Health Needs Assessment process. The insight
and collaboration of many people allowed Rush to develop
a comprehensive understanding of the community and
its health needs and prepare for a productive community
outreach planning effort. Specifically, we would like to
thank the following individuals:
Interview Participants
Walter BurnettAlderman 27th Ward, Chicago
Reverend Marshall Elijah Hatch Sr.Pastor, New Mount Pilgrim Missionary Baptist Church
Reverend George HendersonPastor, Greater Garfield Park Missionary Baptist Church
Art Jones, MDChief Medical Officer, Medical Home Network
Roderick Jones, MPHDirector of Epidemiology, Chicago Department of Public Health
Sally Lemke, MS, RN, WHNP-BCRush Clinic at Simpson Academy
José E. LopezExecutive Director, Puerto Rican Cultural Center
Cheryl LuliasPresident and Executive Director, Medical Home Network
Reverend Johnny Lee MillerPastor, New Mount Pilgrim Missionary Baptist Church
Crystal PalmerCAC Liaison, Chicago Housing Authority
Christopher ProvenzanoExecutive Director, University Village Association
Reverend Charles RobinsonPastor, Holy Starlight Missionary Baptist Church
Erica Salem, MPHDeputy Commissioner, Chicago Department of Public Health
Andrew Teitelman, LCSWVice President, Resident Services, Chicago Housing Authority
Reverend Albert D. Tyson IIIPresiding Elder, North District Chicago Conference of African Methodist Episcopal Churches
Debra G. WesleyPresident, Sinai Community Institute; Executive Vice President for Community Outreach – Sinai Health System
Community Health Needs Assessment Steering Committee
Cynthia Barginere, RN, DNP, FACHEVice President, Clinical Nursing, Chief Nursing Officer
Elizabeth M. CullenAdministrative Project Assistant
Melanie C. Dreher, PhD, RN, FAANJohn L. and Helen Kellogg Dean of College of Nursing of Rush University
Gena P. Faas, MPAManager, Government Affairs
Sarah FinneganAssociate Vice President, Donor Engagement
Francis Fullam, MA Senior Director, Marketing Research and Patient Relations
Lauren L. Goebel, MBA, MHSAAssistant Vice President, Rush System for Health
Robyn L. Golden, MA, LCSWDirector of Health and Aging
Joan E. Kurtenbach, MPHVice President, Strategic Planning, Marketing and Communications
Neha MehtaSenior Analyst, Strategic Planning, Marketing and Program Development
Martha Clare Morris, ScDAssistant Provost for Community Research
Terry Peterson, MPAVice President, Corporate and External Affairs
Steven K. Rothschild, MDVice Chairman, Preventive Medicine
Katharine E. Struck, JDAssociate General Counsel
Susan M. Swider, PhD, APHN-BCProfessor, College of Nursing
Simone Tseng, MHSAAssociate Vice President, Strategic Planning and Program Development
Marilyn Wideman, DNP, RN-BC, FAANAssociate Vice President for Community Healthcare Practice, Associate Provost for Professional Education and Community Engagement
Elizabeth Wurth, MHSAAdministrative Fellow
3
Table o
f Co
nten
ts
Introduction and Mission 4
Executive Summary 5
Description of Rush’s Service Area 6
Methodology 7
Demographics and Health Trends 9
Section 1: Social Determinants of Health 12
Section 2: Access to Health Services 14
Section 3: Physical Activity, Nutrition, and Weight Control 15
Section 4: Diabetes 17
Section 5: Heart Disease and Cardiovascular Risk Factors 18
Section 6: Women’s Health 19
Section 7: Mental Health 20
Section 8: Asthma and Chronic Respiratory Disease 21
Reflections 22
Appendix A: Health Care Asset Map 23
Appendix B: Health Resources in Rush’s Service Area 24
Appendix C: References and Secondary Sources 31
4
Intr
od
uct
ion
an
d M
issi
on Rush University Medical Center’s long-standing
commitment to the community spans more than 175
years. This commitment has grown and evolved through
significant thought and care in considering our community’s
most pressing health needs. As part of this effort, Rush
will conduct a periodic, comprehensive Community Health
Needs Assessment (CHNA), which represents a combination
of quantitative and qualitative data that serve to guide both
our community benefits and strategic planning.
The assessment will be conducted every three years
in accordance with regulations promulgated by the
Internal Revenue Service pursuant to Section 501(r)(3)
of the Internal Revenue Code. The CHNA will serve as a
foundation for developing an implementation strategy to
address those needs that (a) the hospital determines it is
able to meet in whole or in part, (b) are otherwise part of
its mission, and (c) are not met or are not adequately met
by other programs and services in the defined service area.
The CHNA process was guided by a Community Health
Needs Assessment Steering Committee. Rush is fortunate
to have many representatives that are involved with our
outreach, research and partnership efforts, also providing
public health and local expertise of the community (see
acknowledgements page for list of Steering Committee
members).
Rush University Medical Center is an academic medical
center that encompasses a hospital for adults and children
with 669 staffed beds (including Rush Children’s Hospital),
the 72-bed Johnston R. Bowman Health Center for older
adult and rehabilitative care, and Rush University. It also
operates Rush Oak Park Hospital, which has conducted a
separate CHNA with a distinct service area.
This assessment considered multiple data sources, including
secondary data (regarding demographics, health status
indicators, and measures of health care access), assessments
prepared by other organizations in recent years, and
primary data derived from interviews with persons who
represent the broad interests of the community, including
those with expertise in public health.
The report brings together and provides an analysis of
these various sources, and sets forth the community health
priorities identified through the CHNA process.
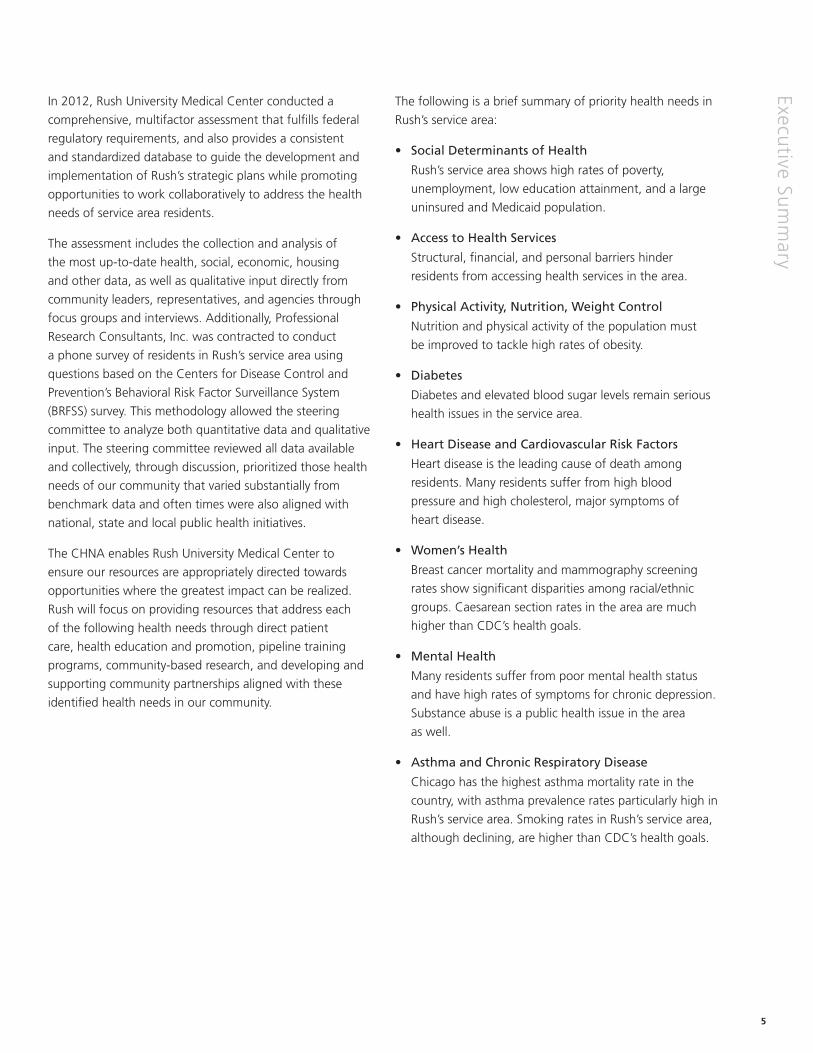
Our Investment in the Community
At Rush University Medical Center, our mission is
to provide the best possible care — whether it’s
on our campus or in the community — through
collaboration with local institutions. Rush joins
its neighbors in serving the greater Chicago area
by providing health care, educating future health
care providers, supporting research, and sending
volunteers throughout our community. In fiscal
year 2011 (July 2010-June 2011), the cost to
Rush to provide these community benefits to the
West Side and the Chicago area was more than
$220 million.
5
Executive Su
mm
ary
In 2012, Rush University Medical Center conducted a
comprehensive, multifactor assessment that fulfills federal
regulatory requirements, and also provides a consistent
and standardized database to guide the development and
implementation of Rush’s strategic plans while promoting
opportunities to work collaboratively to address the health
needs of service area residents.
The assessment includes the collection and analysis of
the most up-to-date health, social, economic, housing
and other data, as well as qualitative input directly from
community leaders, representatives, and agencies through
focus groups and interviews. Additionally, Professional
Research Consultants, Inc. was contracted to conduct
a phone survey of residents in Rush’s service area using
questions based on the Centers for Disease Control and
Prevention’s Behavioral Risk Factor Surveillance System
(BRFSS) survey. This methodology allowed the steering
committee to analyze both quantitative data and qualitative
input. The steering committee reviewed all data available
and collectively, through discussion, prioritized those health
needs of our community that varied substantially from
benchmark data and often times were also aligned with
national, state and local public health initiatives.
The CHNA enables Rush University Medical Center to
ensure our resources are appropriately directed towards
opportunities where the greatest impact can be realized.
Rush will focus on providing resources that address each
of the following health needs through direct patient
care, health education and promotion, pipeline training
programs, community-based research, and developing and
supporting community partnerships aligned with these
identified health needs in our community.
The following is a brief summary of priority health needs in
Rush’s service area:
• SocialDeterminantsofHealth
Rush’s service area shows high rates of poverty,
unemployment, low education attainment, and a large
uninsured and Medicaid population.
• AccesstoHealthServices
Structural, financial, and personal barriers hinder
residents from accessing health services in the area.
• PhysicalActivity,Nutrition,WeightControl
Nutrition and physical activity of the population must
be improved to tackle high rates of obesity.
• Diabetes
Diabetes and elevated blood sugar levels remain serious
health issues in the service area.
• HeartDiseaseandCardiovascularRiskFactors
Heart disease is the leading cause of death among
residents. Many residents suffer from high blood
pressure and high cholesterol, major symptoms of
heart disease.
• Women’sHealth
Breast cancer mortality and mammography screening
rates show significant disparities among racial/ethnic
groups. Caesarean section rates in the area are much
higher than CDC’s health goals.
• MentalHealth
Many residents suffer from poor mental health status
and have high rates of symptoms for chronic depression.
Substance abuse is a public health issue in the area
as well.
• AsthmaandChronicRespiratoryDisease
Chicago has the highest asthma mortality rate in the
country, with asthma prevalence rates particularly high in
Rush’s service area. Smoking rates in Rush’s service area,
although declining, are higher than CDC’s health goals.
6
Des
crip
tio
n o
f R
ush
’s S
ervi
ce A
rea
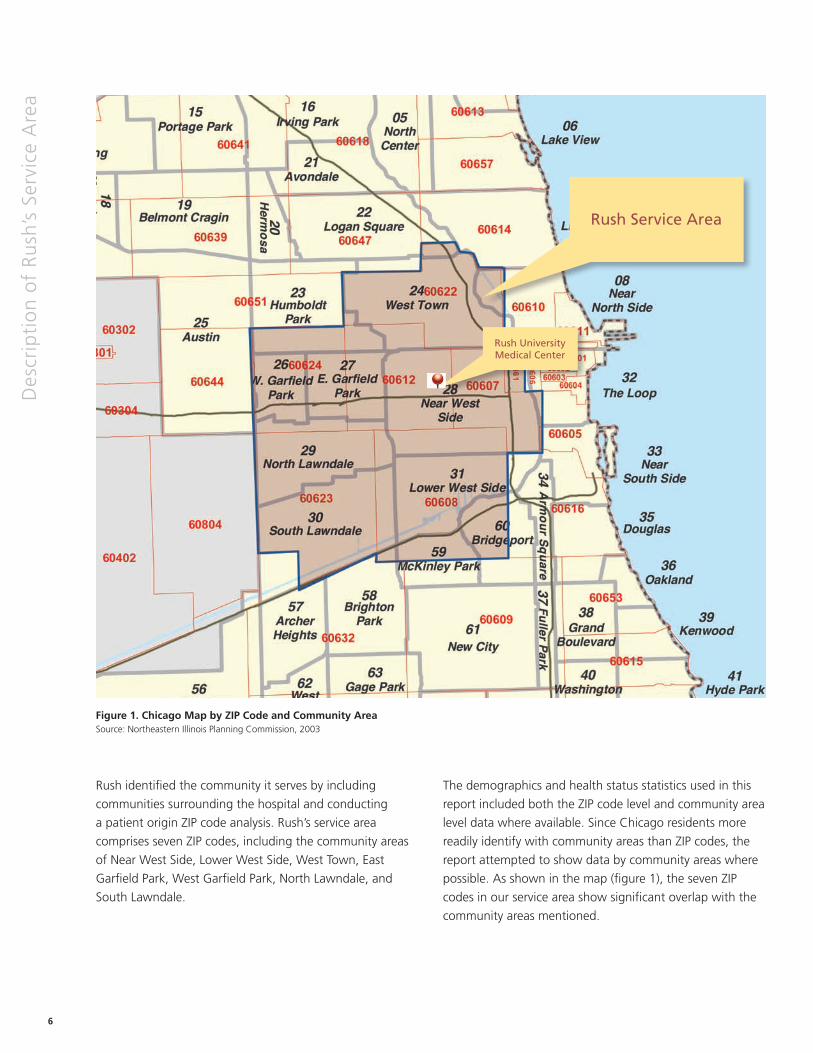
Rush identified the community it serves by including
communities surrounding the hospital and conducting
a patient origin ZIP code analysis. Rush’s service area
comprises seven ZIP codes, including the community areas
of Near West Side, Lower West Side, West Town, East
Garfield Park, West Garfield Park, North Lawndale, and
South Lawndale.
The demographics and health status statistics used in this
report included both the ZIP code level and community area
level data where available. Since Chicago residents more
readily identify with community areas than ZIP codes, the
report attempted to show data by community areas where
possible. As shown in the map (figure 1), the seven ZIP
codes in our service area show significant overlap with the
community areas mentioned.
Figure 1. Chicago Map by ZIP Code and Community AreaSource: Northeastern Illinois Planning Commission, 2003
Rush Service Area
Rush University Medical Center
7
Meth
od
olo
gy
Community Surveys
Rush retained Professional Research Consultants, Inc. (PRC),
facilitated by the Metropolitan Chicago Healthcare Council
(MCHC), to conduct community interviews in Rush’s service
area. More information on PRC is provided in Appendix C.
The final 216-question survey instrument was approved
by MCHC and PRC, with input from participating member
hospitals. The survey instrument used for this study is based
largely on the U.S. Department of Health and Human
Services’ Behavioral Risk Factor Surveillance System, as well
as various public health surveys and customized questions
addressing gaps in indicator data relative to health
promotion and disease prevention objectives and other
recognized health issues.
To ensure the best representation of the population
surveyed, a telephone interview methodology — one that
incorporates both landline and cell phones interviews —
was employed. The primary advantages of telephone
interviewing are timeliness, efficiency, and random-selection
capabilities. For comparison purposes, PRC gave Rush
access to data from all ZIP codes within DuPage, Lake, and
Cook counties.
Surveys were administered among a random sample of
households within each ZIP code. Once the surveys were
completed, they were weighted in proportion to the actual
population distribution at the ZIP code level to appropriately
represent the demographics (gender, age, race, ethnicity,
and poverty status) of the hospital’s service area.
While this assessment is comprehensive, it cannot measure
all possible aspects of health in the community, nor
can it adequately represent all possible populations of
interest. It must be recognized that certain information
gaps might, in some ways, limit Rush’s ability to assess
all of the community’s health needs. For example, certain
population groups, such as the homeless, institutionalized
persons, or those who only speak a language other than
English or Spanish, are not represented in the survey data.
Other population groups, for example, pregnant women,
lesbian/gay/bisexual/transgender residents, undocumented
residents, and members of certain racial/ethnic or immigrant
groups, might not be identifiable or might not be represented
in numbers sufficient for independent analyses.
Focus Groups
As part of the study, PRC also conducted two focus groups
in June 2012 relevant to Rush’s location — Cook County
and Downtown/West Chicago. Sixteen key informants took
part. These included physicians, other health professionals,
social service providers, community leaders, and public health
experts, as well as individuals who work with low-income,
minority, or medically underserved populations, and those
who work with persons with chronic disease conditions.
Interviews
Rush conducted in-person individual interviews with
external stakeholders and internal staff between September
2012 and January 2013. Participants were chosen because
of their ability to identify the primary health concerns of
the community, their expertise in public health or their
association with the types of program interventions or
resources that could address identified concerns.
The interviewees consisted of government officials,
community organization leaders, church leaders, school
leaders, physicians, public health officials and nurses.
By virtue of their positions and professional training,
these individuals have considerable expertise related to
their constituent groups and have provided invaluable
insights throughout Rush’s CHNA process. Please see the
acknowledgements page for the list of all participants
including those with special knowledge or expertise in
public health and leaders or representatives of medically
underserved, low-income, and minority populations.
8
Secondary Sources
Existing data sources were consulted to complement
the research quality of the CHNA. This data included
demographics, social and health indicators, mortality
statistics, and other public health data. Additionally,
Appendix A, a health care asset map, and Appendix B,
a list of various health resources in Rush’s service area,
have been included to identify the existing health care
facilities and other resources within the community
which are available to meet the needs identified through
this CHNA.
The following sources were referenced for this report:
• CentersforDiseaseControlandPrevention(CDC)
• CDC’sHealthyPeople2020
• ChicagoDepartmentofPublicHealth(CDPH)
• CDPH’sChicagoPlan
• CDPH’sHealthyChicagoPlan
• Journal of Allergy and Clinical Immunology
• NationalCenterforHealthStatistics
• NationalPreventionStrategy
• PatientProtectionandAffordableCareActof2010
• SinaiUrbanHealthInstitute
• UnitedWayofMetropolitanChicago’sHealth&Wellness
Impact Plan 2012 – 2016
• U.S.BureauofLaborStatistics
• U.S.CensusBureau
• U.S.DepartmentofHealth&HumanServices
• TheCHNASteeringCommittee
Met
ho
do
log
y
9
Dem
og
raph
ics and
Health
Trend
s
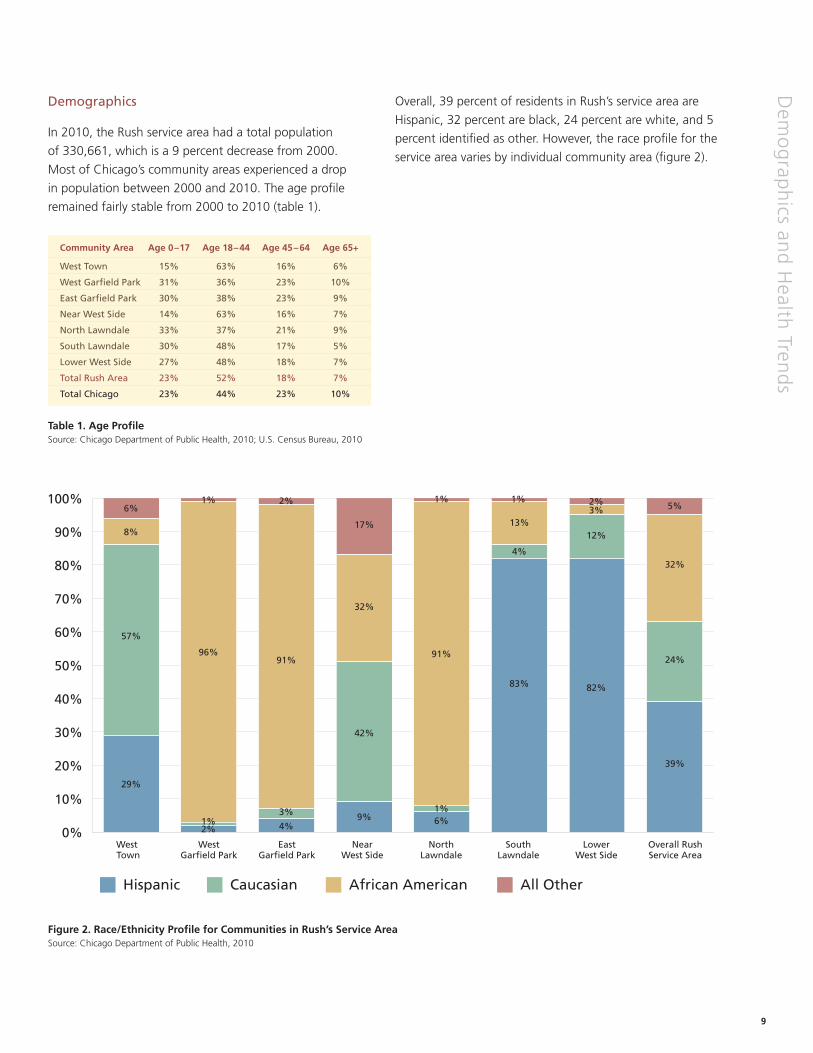
Demographics
In 2010, the Rush service area had a total population
of 330,661, which is a 9 percent decrease from 2000.
Most of Chicago’s community areas experienced a drop
in population between 2000 and 2010. The age profile
remained fairly stable from 2000 to 2010 (table 1).
Overall, 39 percent of residents in Rush’s service area are
Hispanic, 32 percent are black, 24 percent are white, and 5
percent identified as other. However, the race profile for the
service area varies by individual community area (figure 2).
Table 1. Age ProfileSource: Chicago Department of Public Health, 2010; U.S. Census Bureau, 2010
Community Area Age 0–17 Age 18–44 Age 45–64 Age 65+
West Town 15% 63% 16% 6%
West Garfield Park 31% 36% 23% 10%
East Garfield Park 30% 38% 23% 9%
Near West Side 14% 63% 16% 7%
North Lawndale 33% 37% 21% 9%
South Lawndale 30% 48% 17% 5%
Lower West Side 27% 48% 18% 7%
Total Rush Area 23% 52% 18% 7%
Total Chicago 23% 44% 23% 10%
Figure 2. Race/Ethnicity Profile for Communities in Rush’s Service AreaSource: Chicago Department of Public Health, 2010
0%
10%
20%
30%
40%
50%
60%
70%
80%
90%
100%
29%
57%
8%
6%
4%
3%
91%
2%
1%
96%
1% 1% 1%
2%9%
42%
32%
17%
6%1%
91%
13%
4%
83% 82%
12%
3%2% 5%
32%
24%
39%
West West East Near North South Lower Overall Rush Town Garfield Park Garfield Park West Side Lawndale Lawndale West Side Service Area
Hispanic Caucasian African American All Other
10
Dem
og
rap
hic
s an
d H
ealt
h T
ren
ds
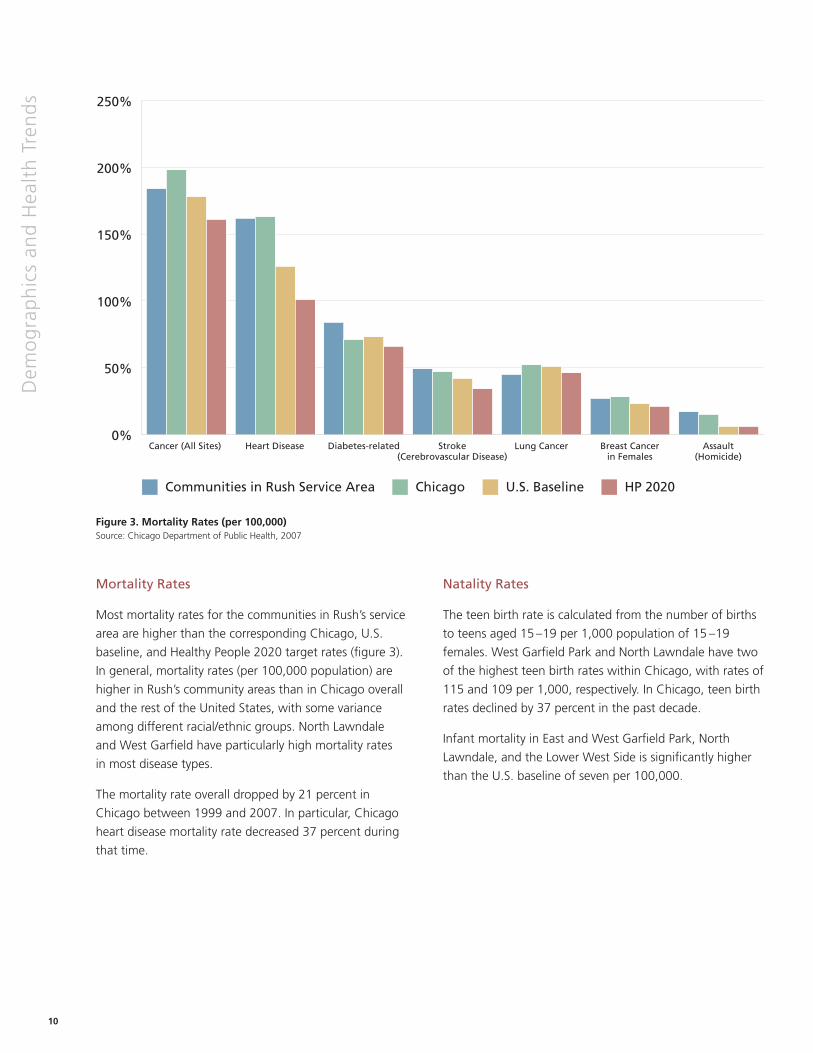
Mortality Rates
Most mortality rates for the communities in Rush’s service
area are higher than the corresponding Chicago, U.S.
baseline, and Healthy People 2020 target rates (figure 3).
In general, mortality rates (per 100,000 population) are
higher in Rush’s community areas than in Chicago overall
and the rest of the United States, with some variance
among different racial/ethnic groups. North Lawndale
and West Garfield have particularly high mortality rates
in most disease types.
The mortality rate overall dropped by 21 percent in
Chicago between 1999 and 2007. In particular, Chicago
heart disease mortality rate decreased 37 percent during
that time.
Natality Rates
The teen birth rate is calculated from the number of births
to teens aged 15 –19 per 1,000 population of 15 –19
females. West Garfield Park and North Lawndale have two
of the highest teen birth rates within Chicago, with rates of
115 and 109 per 1,000, respectively. In Chicago, teen birth
rates declined by 37 percent in the past decade.
Infant mortality in East and West Garfield Park, North
Lawndale, and the Lower West Side is significantly higher
than the U.S. baseline of seven per 100,000.
Figure 3. Mortality Rates (per 100,000)Source: Chicago Department of Public Health, 2007
Cancer (All Sites) Heart Disease Diabetes-related Stroke Lung Cancer Breast Cancer Assault (Cerebrovascular Disease) in Females (Homicide)
Communities in Rush Service Area Chicago U.S. Baseline HP 2020
0%
50%
100%
150%
200%
250%
11
Dem
og
raph
ics and
Health
Trend
s
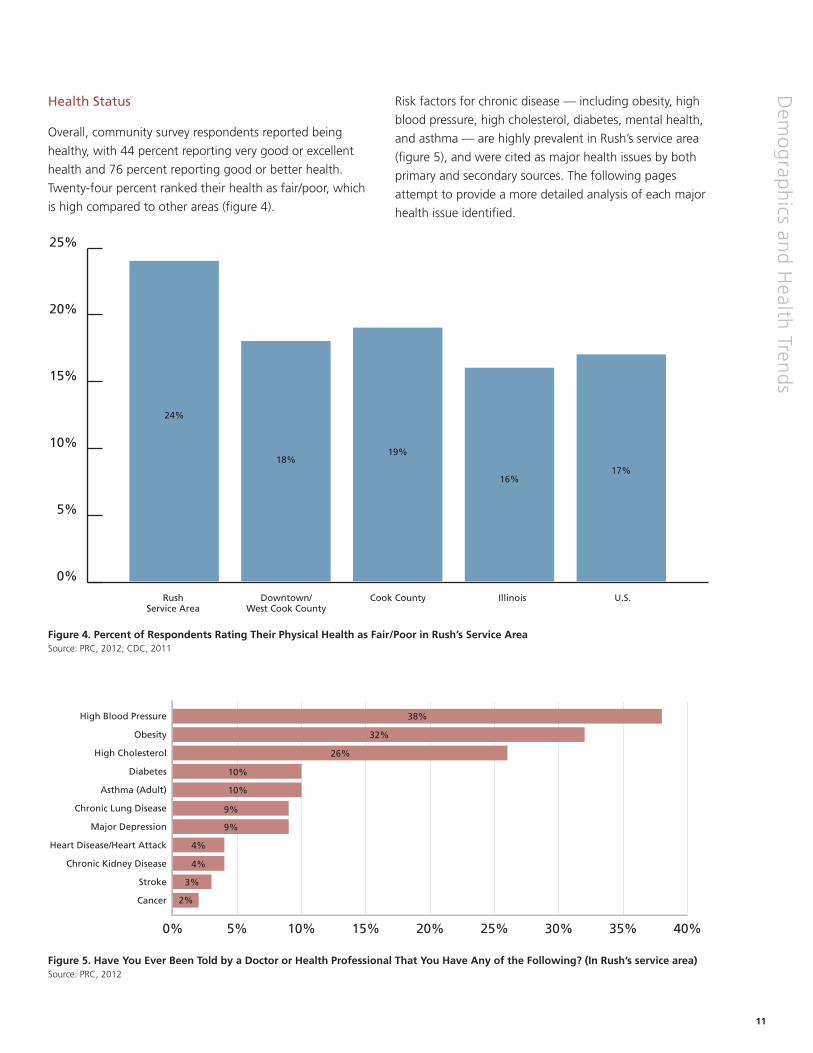
Health Status
Overall, community survey respondents reported being
healthy, with 44 percent reporting very good or excellent
health and 76 percent reporting good or better health.
Twenty-four percent ranked their health as fair/poor, which
is high compared to other areas (figure 4).
Risk factors for chronic disease — including obesity, high
blood pressure, high cholesterol, diabetes, mental health,
and asthma — are highly prevalent in Rush’s service area
(figure 5), and were cited as major health issues by both
primary and secondary sources. The following pages
attempt to provide a more detailed analysis of each major
health issue identified.
Figure 4. Percent of Respondents Rating Their Physical Health as Fair/Poor in Rush’s Service AreaSource: PRC, 2012; CDC, 2011
Figure 5. Have You Ever Been Told by a Doctor or Health Professional That You Have Any of the Following? (In Rush’s service area)Source: PRC, 2012
Rush Downtown/ Cook County Illinois U.S. Service Area West Cook County
0%
5%
10%
15%
20%
25%
24%
18%19%
16%17%
0% 5% 10% 15% 20% 25% 30% 35% 40%
38%
32%
26%
10%
10%
9%
9%
4%
4%
3%
2%
High Blood Pressure
Obesity
High Cholesterol
Diabetes
Asthma (Adult)
Chronic Lung Disease
Major Depression
Heart Disease/Heart Attack
Chronic Kidney Disease
Stroke
Cancer
12
Soci
al D
eter
min
ants
of
Hea
lth Overview
The World Health Organization defines social determinants
of health as circumstances shaped by the distribution of
wealth, power, and resources. These social determinants
are largely responsible for the differences in health status
among communities.
Poverty, Unemployment, and Education
Rush’s community areas have high rates of poverty. Five
of the seven communities report a higher percentage of
households living below the poverty line ($23,550) than in
Chicago as a whole, and all seven communities have higher
rates than Illinois and the U.S. A few of Rush’s communities
have particularly high rates of poverty. The poverty rate in
East and West Garfield Park is 40 percent and is 38 percent
in North Lawndale. Six communities had an unemployment
rate above 10 percent in 2011, including West Garfield Park
with 25 percent and North Lawndale with 19 percent.
Many of the same communities with high poverty and
unemployment rates also have a low level of educational
attainment among the adult population. In five of the seven
communities in the Rush service area, more than a quarter
of residents 25 years of age and older do not have a high
school diploma. In South Lawndale, 59 percent of people in
this age group do not have a high school diploma, which is
the worst rate among all communities in Chicago.
Violence
Violence is a major issue in Rush’s service area. The CDPH’s
Chicago Plan ranked violence as the 2nd most important
health-related issue in Chicago’s West Side. Figure 3 shows
mortality rates due to homicide as much higher in Rush’s
service area compared to overall Chicago, U.S., and Healthy
People 2020 target rates. Violence prevention is a focus of
the Chicago Department of Public Health over the next five
years. In 2010 alone, violence claimed 435 lives in Chicago.
According to PRC’s surveys, 16 percent of respondents in
Rush’s service area ranked their neighborhood as “not at all
safe” and 9 percent have been victims of violent crime in
the past five years.
Students missing school due to safety issues was also noted
as a major concern in Rush’s service area.
13
Social D
etermin
ants o
f Health
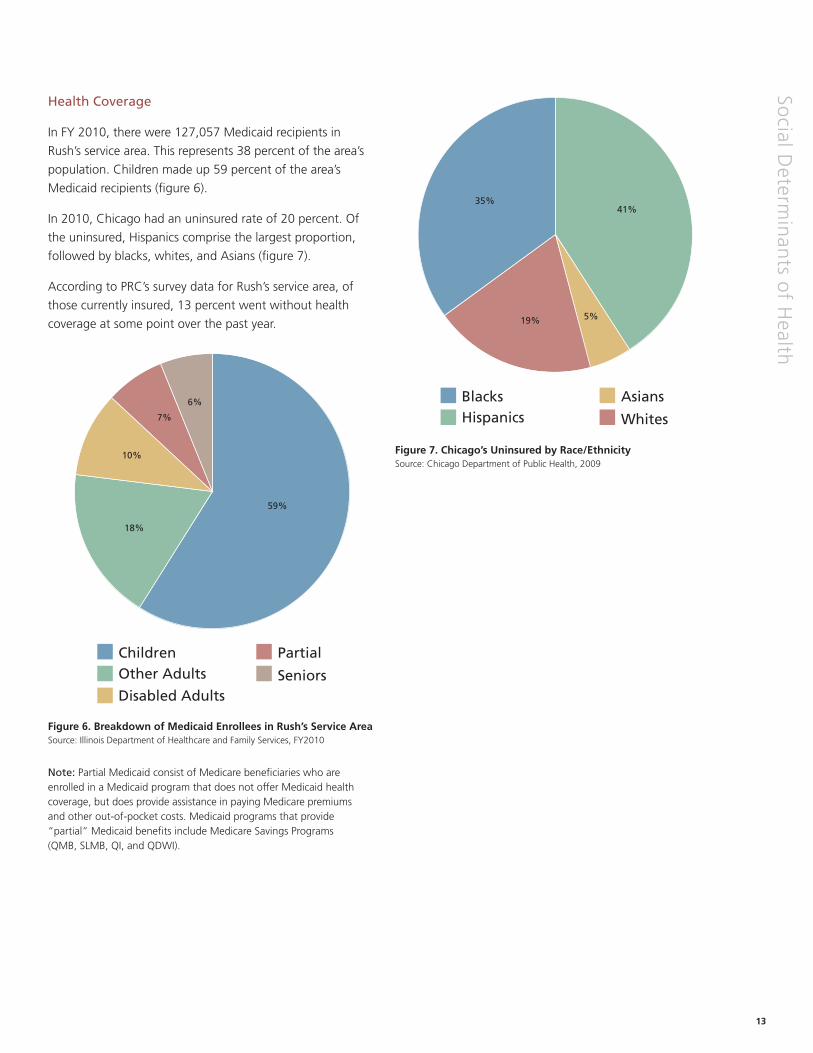
Health Coverage
In FY 2010, there were 127,057 Medicaid recipients in
Rush’s service area. This represents 38 percent of the area’s
population. Children made up 59 percent of the area’s
Medicaid recipients (figure 6).
In 2010, Chicago had an uninsured rate of 20 percent. Of
the uninsured, Hispanics comprise the largest proportion,
followed by blacks, whites, and Asians (figure 7).
According to PRC’s survey data for Rush’s service area, of
those currently insured, 13 percent went without health
coverage at some point over the past year.
Figure 6. Breakdown of Medicaid Enrollees in Rush’s Service AreaSource: Illinois Department of Healthcare and Family Services, FY2010
Figure 7. Chicago’s Uninsured by Race/EthnicitySource: Chicago Department of Public Health, 2009
ChildrenOther Adults
Disabled Adults
Partial
Seniors
59%
18%
10%
7%
6%
Note: Partial Medicaid consist of Medicare beneficiaries who are enrolled in a Medicaid program that does not offer Medicaid health coverage, but does provide assistance in paying Medicare premiums and other out-of-pocket costs. Medicaid programs that provide “partial” Medicaid benefits include Medicare Savings Programs (QMB, SLMB, QI, and QDWI).
BlacksHispanics
Asians
Whites
41%35%
5%19%
14
Acc
ess
to H
ealt
h S
ervi
ces Overview
The Patient Protection and Affordable Care Act of 2010
highlights the importance of access to health care as a
public health issue on a national level. In Chicago, access
to care was found to be an important issue as well. Having
access to health services is an important determinant of
health status and is critical to eliminating health disparities
and increasing years of healthy life.
According to the U.S. Department of Health and Human
Services, structural, financial, and personal barriers can
limit access to health care. Structural barriers include the
lack of providers or facilities to meet special needs or
the difficulties in the scheduling process for a patient to
get needed care. The key financial barriers that patients
experience are a lack of health insurance and not having
the financial capacity to cover health services outside their
health plan or insurance program. Personal barriers include
cultural or spiritual differences, language and transportation
barriers, not knowing how or when to seek care, or
concerns about confidentiality or discrimination.
Several data sources and community interviews indicated
that there are major concerns in Rush’s service area related
to access to health services, particularly financial and
structural barriers.
Ratings and Use of Health Services in Rush’s Area
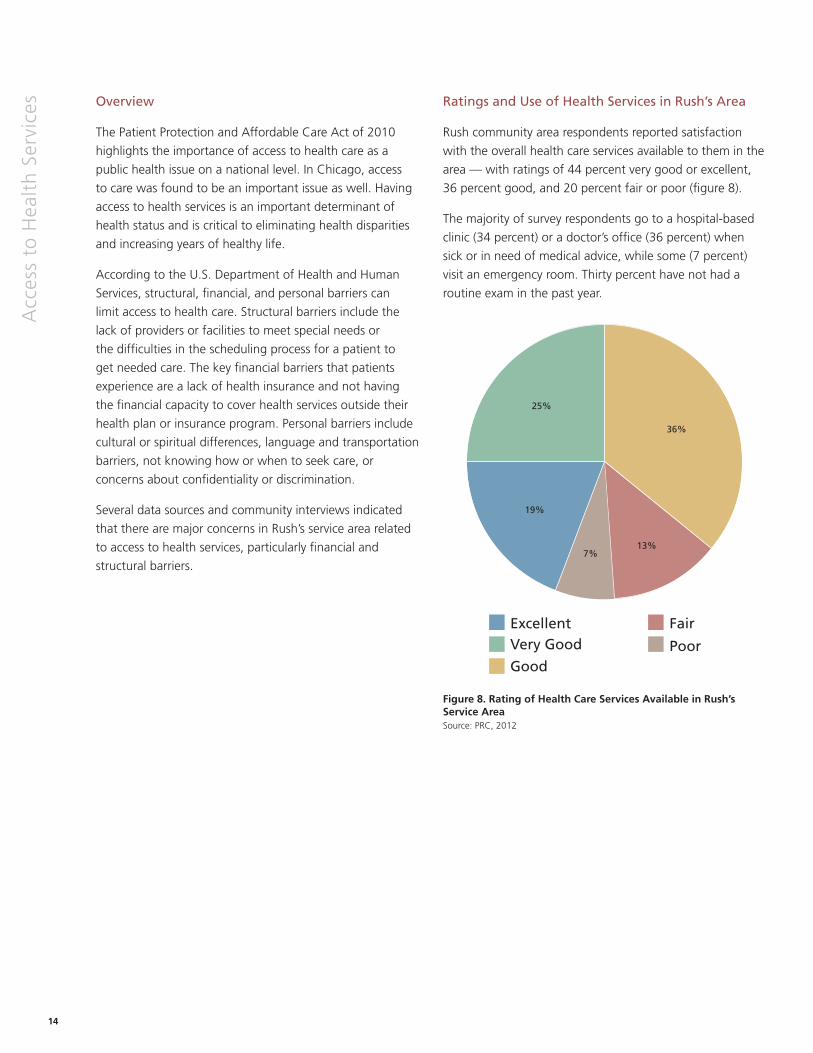
Rush community area respondents reported satisfaction
with the overall health care services available to them in the
area — with ratings of 44 percent very good or excellent,
36 percent good, and 20 percent fair or poor (figure 8).
The majority of survey respondents go to a hospital-based
clinic (34 percent) or a doctor’s office (36 percent) when
sick or in need of medical advice, while some (7 percent)
visit an emergency room. Thirty percent have not had a
routine exam in the past year.
Figure 8. Rating of Health Care Services Available in Rush’s Service AreaSource: PRC, 2012
ExcellentVery Good
Good
Fair
Poor
36%
19%
25%
13%7%
15
Access to
Health
Services
Structural Barriers
Structural barriers include difficulty getting appointments
and receiving continuity of care.
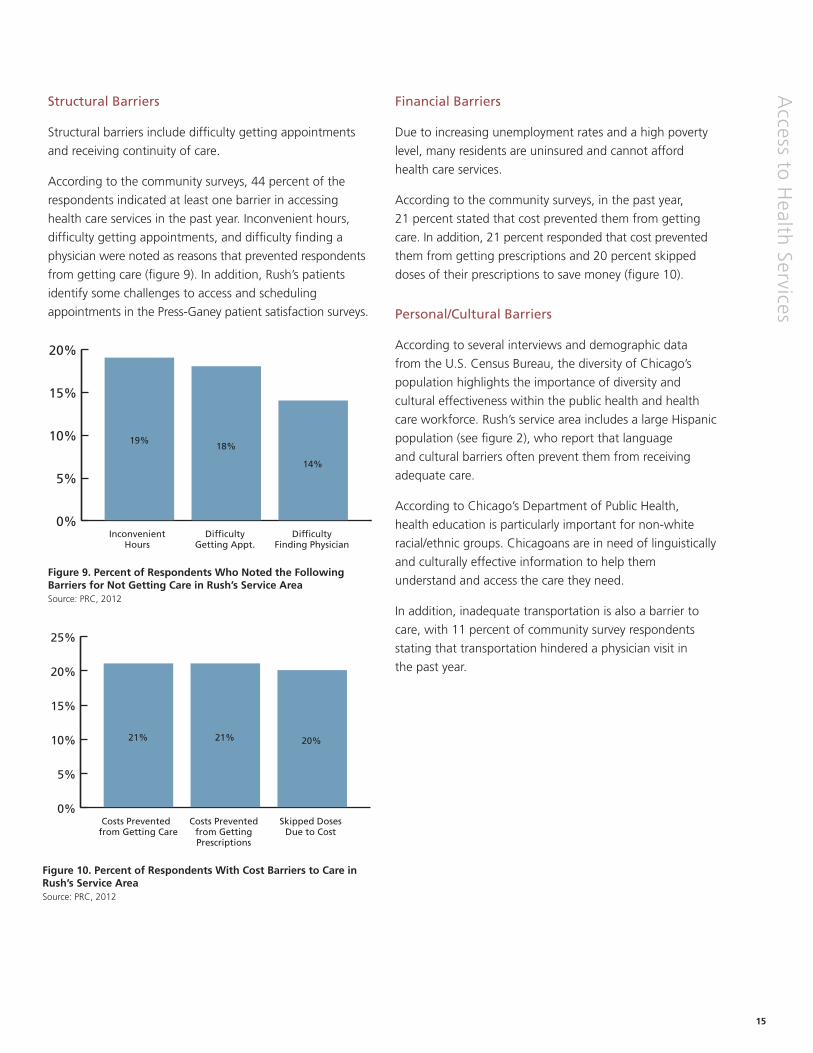
According to the community surveys, 44 percent of the
respondents indicated at least one barrier in accessing
health care services in the past year. Inconvenient hours,
difficulty getting appointments, and difficulty finding a
physician were noted as reasons that prevented respondents
from getting care (figure 9). In addition, Rush’s patients
identify some challenges to access and scheduling
appointments in the Press-Ganey patient satisfaction surveys.
Financial Barriers
Due to increasing unemployment rates and a high poverty
level, many residents are uninsured and cannot afford
health care services.
According to the community surveys, in the past year,
21 percent stated that cost prevented them from getting
care. In addition, 21 percent responded that cost prevented
them from getting prescriptions and 20 percent skipped
doses of their prescriptions to save money (figure 10).
Personal/Cultural Barriers
According to several interviews and demographic data
from the U.S. Census Bureau, the diversity of Chicago’s
population highlights the importance of diversity and
cultural effectiveness within the public health and health
care workforce. Rush’s service area includes a large Hispanic
population (see figure 2), who report that language
and cultural barriers often prevent them from receiving
adequate care.
According to Chicago’s Department of Public Health,
health education is particularly important for non-white
racial/ethnic groups. Chicagoans are in need of linguistically
and culturally effective information to help them
understand and access the care they need.
In addition, inadequate transportation is also a barrier to
care, with 11 percent of community survey respondents
stating that transportation hindered a physician visit in
the past year.
0%
5%
10%
15%
20%
Inconvenient Difficulty Difficulty Hours Getting Appt. Finding Physician
14%
18%19%
Figure 9. Percent of Respondents Who Noted the Following Barriers for Not Getting Care in Rush’s Service AreaSource: PRC, 2012
Figure 10. Percent of Respondents With Cost Barriers to Care in Rush’s Service AreaSource: PRC, 2012
0%
5%
10%
15%
20%
25%
Costs Prevented Costs Prevented Skipped Doses from Getting Care from Getting Due to Cost Prescriptions
20%21%21%
16
Phys
ical
Act
ivit
y, N
utr
itio
n,
and
Wei
gh
t C
on
tro
l Overview
The problem of adult and child obesity has reached
epidemic levels, both nationally and in Chicago. Sixty-seven
percent of Chicago adults are considered either overweight
or obese; this shows a 48 percent increase over the past
decade. The Healthy People 2020 target is 31 percent or
less in the population.
It is widely recognized that being overweight or obese can
lead to a variety of chronic diseases, including heart disease,
diabetes, hypertension, cancer, stroke, and osteoarthritis.
It is critical to address this issue not only to enhance health
and well-being within the community but also to reduce
health care costs over the long term.
According to the Chicago Department of Public Health,
71 percent of high school students and 29 percent of adults
do not get adequate physical activity, and over 70 percent
of students and adults do not eat the recommended
number of servings of fruits and vegetables. In 2010, an
estimated 380,000 Chicagoans lived in food deserts, an
area where there is little to no access to foods needed to
maintain a healthy diet.
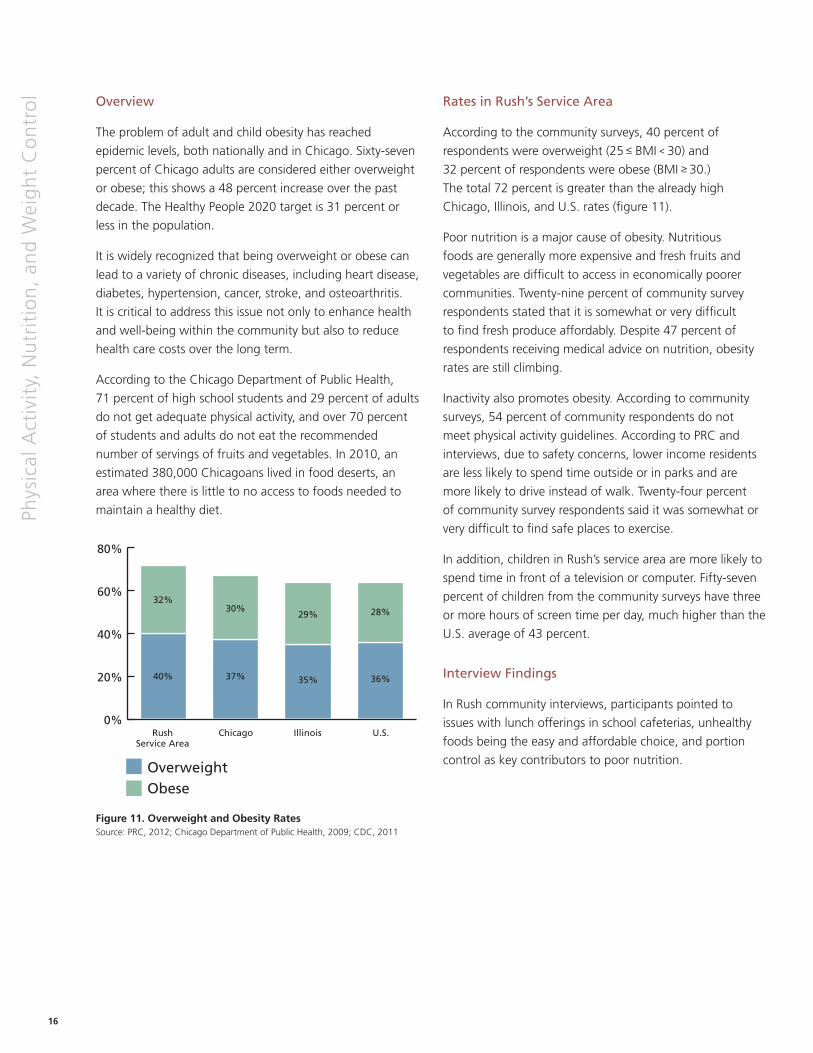
Rates in Rush’s Service Area
According to the community surveys, 40 percent of
respondents were overweight (25 ≤ BMI < 30) and
32 percent of respondents were obese (BMI ≥ 30.)
The total 72 percent is greater than the already high
Chicago, Illinois, and U.S. rates (figure 11).
Poor nutrition is a major cause of obesity. Nutritious
foods are generally more expensive and fresh fruits and
vegetables are difficult to access in economically poorer
communities. Twenty-nine percent of community survey
respondents stated that it is somewhat or very difficult
to find fresh produce affordably. Despite 47 percent of
respondents receiving medical advice on nutrition, obesity
rates are still climbing.
Inactivity also promotes obesity. According to community
surveys, 54 percent of community respondents do not
meet physical activity guidelines. According to PRC and
interviews, due to safety concerns, lower income residents
are less likely to spend time outside or in parks and are
more likely to drive instead of walk. Twenty-four percent
of community survey respondents said it was somewhat or
very difficult to find safe places to exercise.
In addition, children in Rush’s service area are more likely to
spend time in front of a television or computer. Fifty-seven
percent of children from the community surveys have three
or more hours of screen time per day, much higher than the
U.S. average of 43 percent.
Interview Findings
In Rush community interviews, participants pointed to
issues with lunch offerings in school cafeterias, unhealthy
foods being the easy and affordable choice, and portion
control as key contributors to poor nutrition.
Figure 11. Overweight and Obesity RatesSource: PRC, 2012; Chicago Department of Public Health, 2009; CDC, 2011
0%
20%
40%
60%
80%
Rush Chicago Illinois U.S. Service Area
40%
32%
37%
30%
35%
29%
36%
28%
OverweightObese
17
Diab
etes
Overview
As with many chronic diseases, diabetes mellitus is often
the result of behavioral risk factors, such as poor diet and
being overweight or obese. As diabetes rates increase,
so does the risk for other chronic and acute conditions.
Education, screening, and effective medical management
can help control these conditions, which are often lifestyle
and diet-related.
Diabetes-Related Mortality and Hospitalizations
Diabetes is the fifth leading cause of death in Chicago.
Rush’s service area has a diabetes-related age-adjusted
death rate of 84 per 100,000, higher than Chicago’s rate
of 71 and the Healthy People 2020 target of 66 (figure 3).
Significant variation exists among racial/ethnic groups,
with Hispanics and blacks having higher diabetes-related
mortality rates than whites.
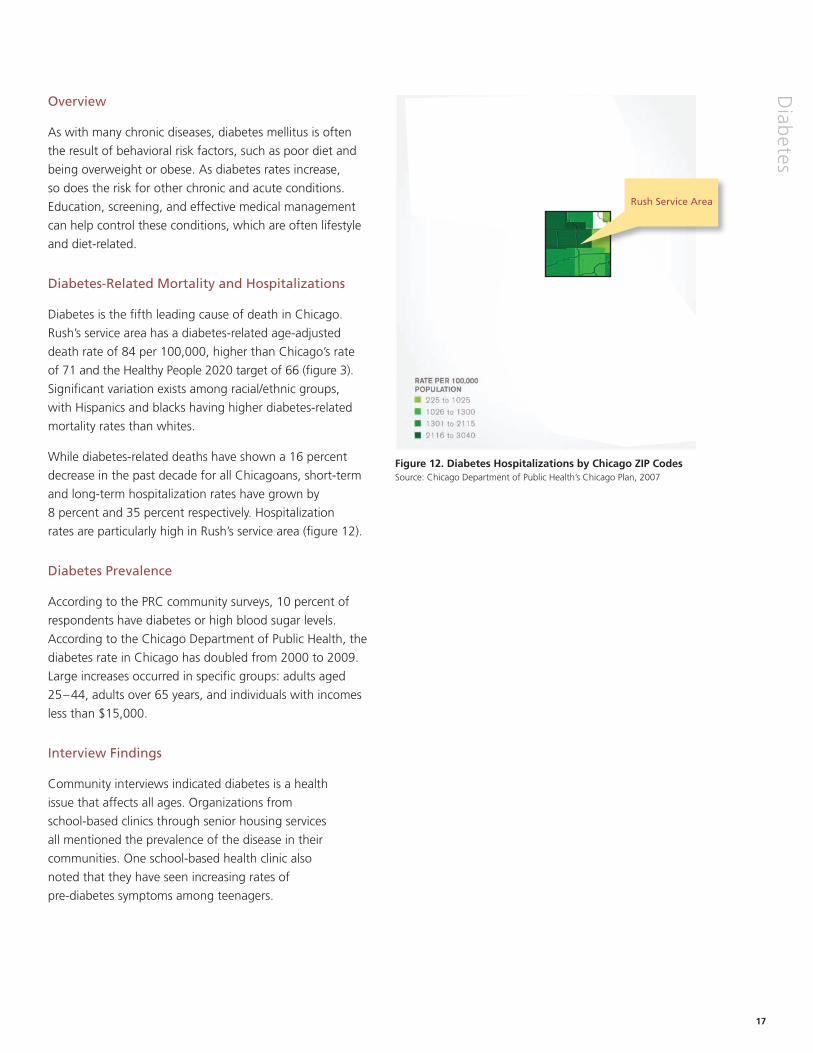
While diabetes-related deaths have shown a 16 percent
decrease in the past decade for all Chicagoans, short-term
and long-term hospitalization rates have grown by
8 percent and 35 percent respectively. Hospitalization
rates are particularly high in Rush’s service area (figure 12).
Diabetes Prevalence
According to the PRC community surveys, 10 percent of
respondents have diabetes or high blood sugar levels.
According to the Chicago Department of Public Health, the
diabetes rate in Chicago has doubled from 2000 to 2009.
Large increases occurred in specific groups: adults aged
25–44, adults over 65 years, and individuals with incomes
less than $15,000.
Interview Findings
Community interviews indicated diabetes is a health
issue that affects all ages. Organizations from
school-based clinics through senior housing services
all mentioned the prevalence of the disease in their
communities. One school-based health clinic also
noted that they have seen increasing rates of
pre-diabetes symptoms among teenagers.
Figure 12. Diabetes Hospitalizations by Chicago ZIP CodesSource: Chicago Department of Public Health’s Chicago Plan, 2007
Rush Service Area
18
Hea
rt D
isea
se a
nd
Car
dio
vasc
ula
r R
isk
Fact
ors Overview
Heart disease is the leading cause of death in the United
States. Heart disease is one of the most widespread and
costly health problems facing the nation today, accounting
for more than $500 billion in health care expenditures and
related expenses in 2010 alone. High blood pressure and
cholesterol are the leading risk factors for heart disease,
along with obesity, diabetes, cigarette smoking, and
poor diet, which are discussed in other sections of this
assessment.
Mortality Rates
Heart disease is the leading cause of death in Chicago.
Rush’s service area has a similar age-adjusted mortality rate
as Chicago as a whole, at 163 deaths per 100,000. This
is much higher than the U.S. average and Healthy People
2020 targets (figure 3). However, according to the Chicago
Department of Public Health, coronary heart disease
mortality rates have been declining steadily with a 36
percent decrease from 2000 to 2009.
While heart disease also showed a decrease in hospitalization
rates, with a 37 percent decrease between 1999 and
2007, hypertension-related hospitalizations went up by
14 percent.
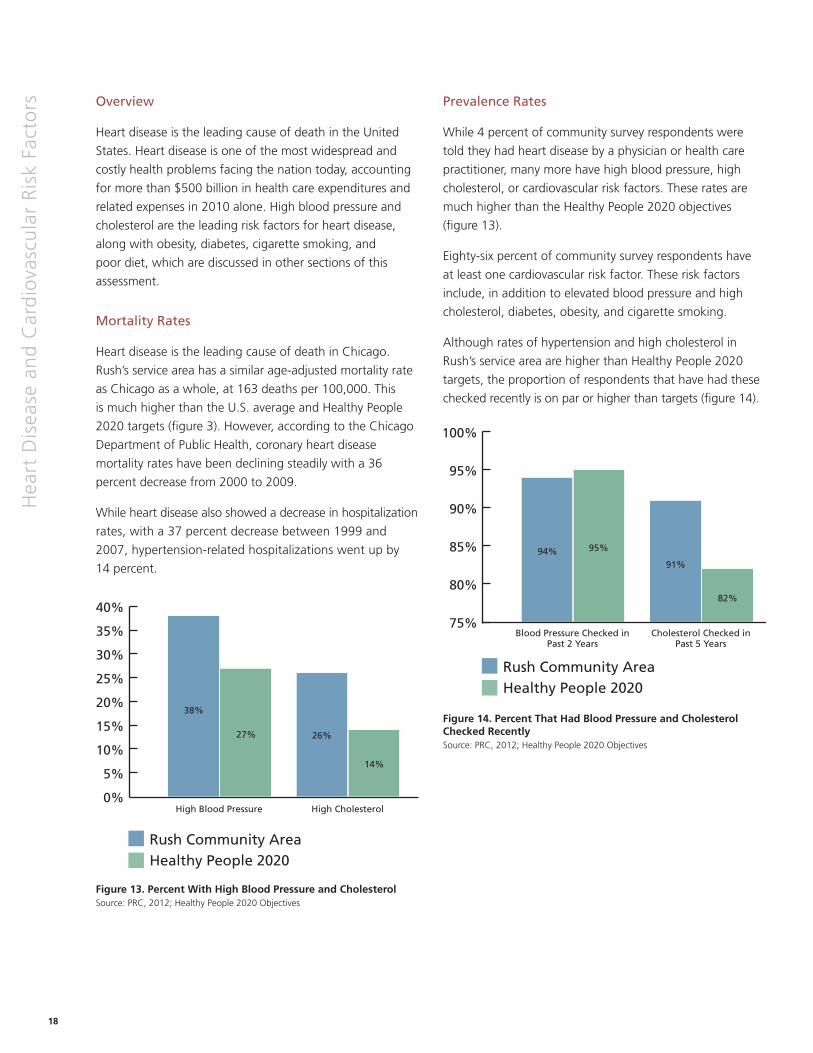
Prevalence Rates
While 4 percent of community survey respondents were
told they had heart disease by a physician or health care
practitioner, many more have high blood pressure, high
cholesterol, or cardiovascular risk factors. These rates are
much higher than the Healthy People 2020 objectives
(figure 13).
Eighty-six percent of community survey respondents have
at least one cardiovascular risk factor. These risk factors
include, in addition to elevated blood pressure and high
cholesterol, diabetes, obesity, and cigarette smoking.
Although rates of hypertension and high cholesterol in
Rush’s service area are higher than Healthy People 2020
targets, the proportion of respondents that have had these
checked recently is on par or higher than targets (figure 14).
Figure 13. Percent With High Blood Pressure and CholesterolSource: PRC, 2012; Healthy People 2020 Objectives
High Blood Pressure High Cholesterol0%
5%
10%
15%
20%
25%
30%
35%
40%
Rush Community AreaHealthy People 2020
38%
27% 26%
14%
75%
80%
85%
90%
95%
100%
Blood Pressure Checked in Cholesterol Checked in Past 2 Years Past 5 Years
Rush Community AreaHealthy People 2020
94% 95%
91%
82%
Figure 14. Percent That Had Blood Pressure and Cholesterol Checked RecentlySource: PRC, 2012; Healthy People 2020 Objectives
19
Wo
men
’s Health
Overview
According to the Society of Women’s Health Research,
women’s health is generally defined as issues specific to
human female anatomy, including areas where biological
sex differences between women and men exist. This
encompasses reproductive health, breast cancer, routine
screenings, maternal health, and childbirth. They can also
include medical situations in which women face problems
not directly related to their biology, such as gender-
differentiated access to medical treatment.
Breast Cancer and Mammography
Breast cancer is the most common type of cancer among
women and accounts for one-fourth of all cancer diagnoses
in the United States. In the Rush service area, the breast
cancer mortality rate is 27 per 100,000. The Healthy People
2020 target is 21 per 100,000.
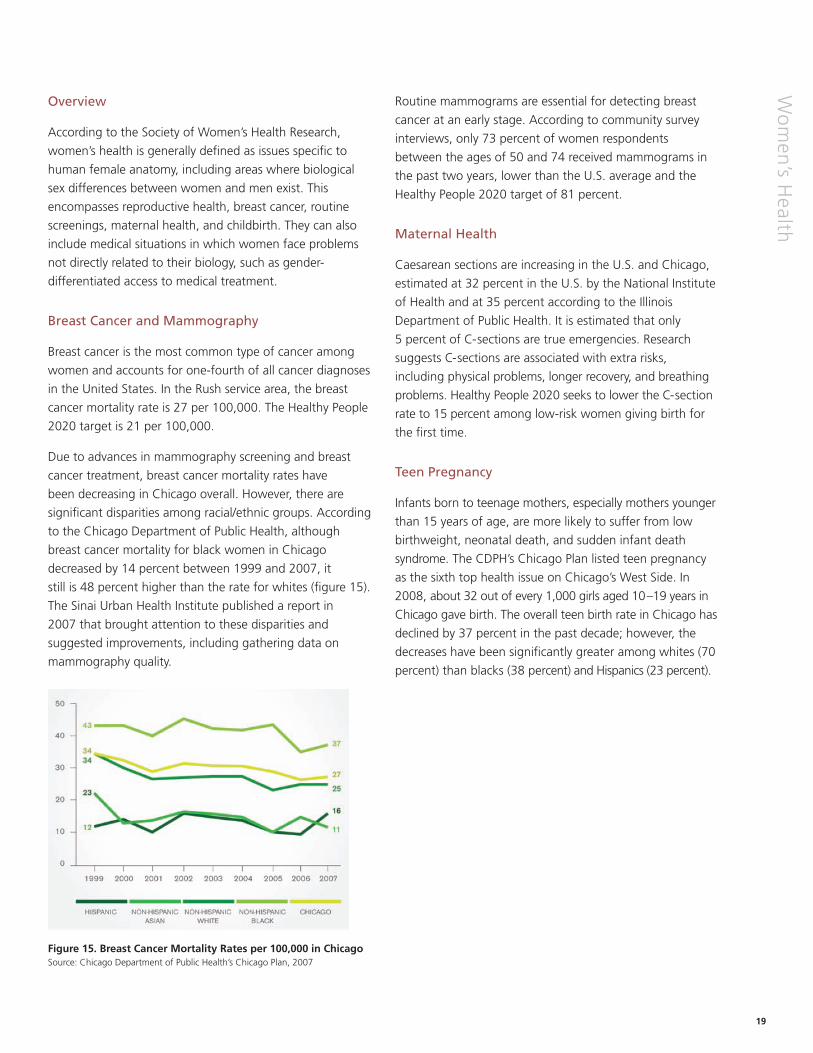
Due to advances in mammography screening and breast
cancer treatment, breast cancer mortality rates have
been decreasing in Chicago overall. However, there are
significant disparities among racial/ethnic groups. According
to the Chicago Department of Public Health, although
breast cancer mortality for black women in Chicago
decreased by 14 percent between 1999 and 2007, it
still is 48 percent higher than the rate for whites (figure 15).
The Sinai Urban Health Institute published a report in
2007 that brought attention to these disparities and
suggested improvements, including gathering data on
mammography quality.
Routine mammograms are essential for detecting breast
cancer at an early stage. According to community survey
interviews, only 73 percent of women respondents
between the ages of 50 and 74 received mammograms in
the past two years, lower than the U.S. average and the
Healthy People 2020 target of 81 percent.
Maternal Health
Caesarean sections are increasing in the U.S. and Chicago,
estimated at 32 percent in the U.S. by the National Institute
of Health and at 35 percent according to the Illinois
Department of Public Health. It is estimated that only
5 percent of C-sections are true emergencies. Research
suggests C-sections are associated with extra risks,
including physical problems, longer recovery, and breathing
problems. Healthy People 2020 seeks to lower the C-section
rate to 15 percent among low-risk women giving birth for
the first time.
Teen Pregnancy
Infants born to teenage mothers, especially mothers younger
than 15 years of age, are more likely to suffer from low
birthweight, neonatal death, and sudden infant death
syndrome. The CDPH’s Chicago Plan listed teen pregnancy
as the sixth top health issue on Chicago’s West Side. In
2008, about 32 out of every 1,000 girls aged 10–19 years in
Chicago gave birth. The overall teen birth rate in Chicago has
declined by 37 percent in the past decade; however, the
decreases have been significantly greater among whites (70
percent) than blacks (38 percent) and Hispanics (23 percent).
Figure 15. Breast Cancer Mortality Rates per 100,000 in ChicagoSource: Chicago Department of Public Health’s Chicago Plan, 2007
20
Men
tal H
ealt
h Overview
According to the National Institute of Mental Health, one
in four adults across the nation experiences a mental health
disorder in any given year. Chicago is no exception.
Mental Health Statistics
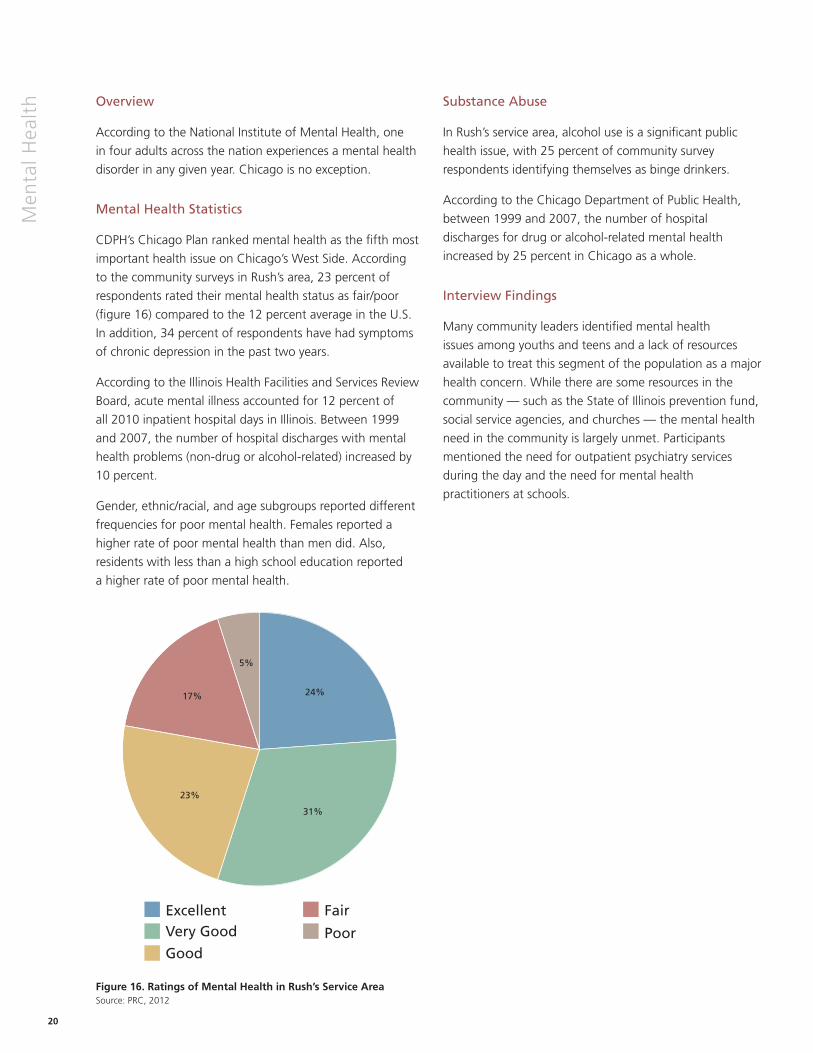
CDPH’s Chicago Plan ranked mental health as the fifth most
important health issue on Chicago’s West Side. According
to the community surveys in Rush’s area, 23 percent of
respondents rated their mental health status as fair/poor
(figure 16) compared to the 12 percent average in the U.S.
In addition, 34 percent of respondents have had symptoms
of chronic depression in the past two years.
According to the Illinois Health Facilities and Services Review
Board, acute mental illness accounted for 12 percent of
all 2010 inpatient hospital days in Illinois. Between 1999
and 2007, the number of hospital discharges with mental
health problems (non-drug or alcohol-related) increased by
10 percent.
Gender, ethnic/racial, and age subgroups reported different
frequencies for poor mental health. Females reported a
higher rate of poor mental health than men did. Also,
residents with less than a high school education reported
a higher rate of poor mental health.
Substance Abuse
In Rush’s service area, alcohol use is a significant public
health issue, with 25 percent of community survey
respondents identifying themselves as binge drinkers.
According to the Chicago Department of Public Health,
between 1999 and 2007, the number of hospital
discharges for drug or alcohol-related mental health
increased by 25 percent in Chicago as a whole.
Interview Findings
Many community leaders identified mental health
issues among youths and teens and a lack of resources
available to treat this segment of the population as a major
health concern. While there are some resources in the
community — such as the State of Illinois prevention fund,
social service agencies, and churches — the mental health
need in the community is largely unmet. Participants
mentioned the need for outpatient psychiatry services
during the day and the need for mental health
practitioners at schools.
Figure 16. Ratings of Mental Health in Rush’s Service AreaSource: PRC, 2012
ExcellentVery Good
Good
Fair
Poor
24%
23%
17%
31%
5%
21
Asth
ma an
d C
hro
nic R
espirato
ry Disease
Asthma
Asthma affects people of all ages, but it most often starts
during childhood. In the United States, more than 22
million people are known to have asthma.
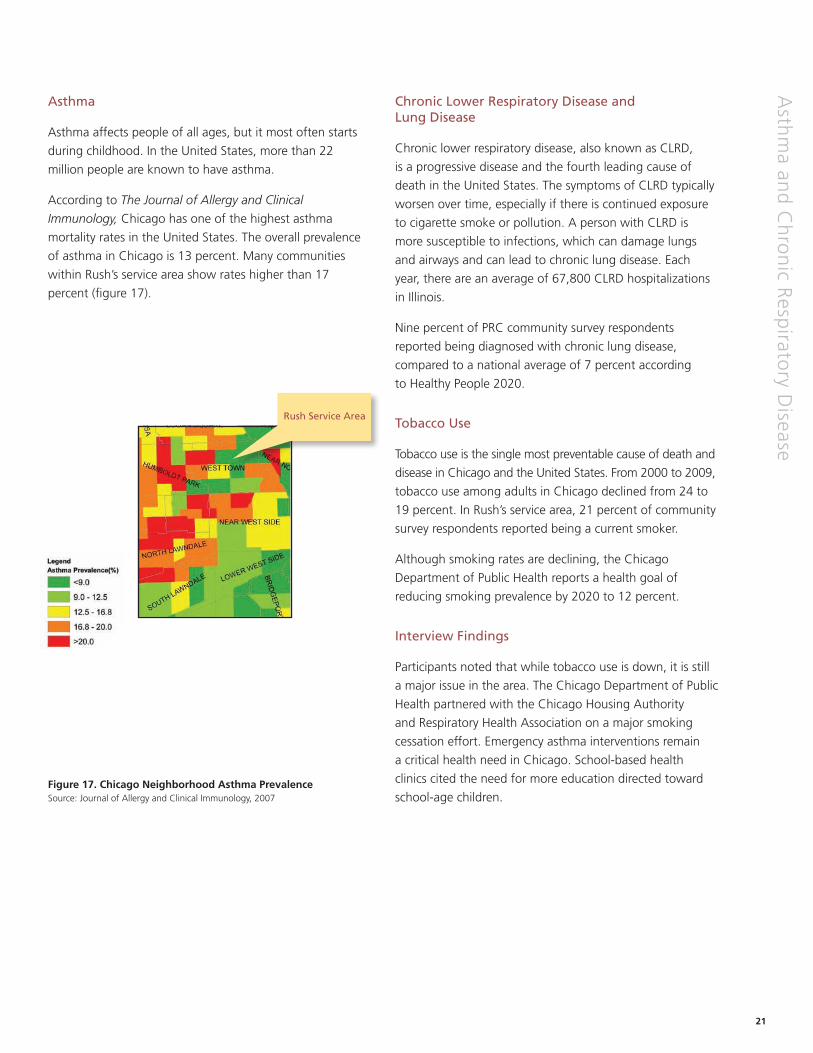
According to The Journal of Allergy and Clinical
Immunology, Chicago has one of the highest asthma
mortality rates in the United States. The overall prevalence
of asthma in Chicago is 13 percent. Many communities
within Rush’s service area show rates higher than 17
percent (figure 17).
Chronic Lower Respiratory Disease and Lung Disease
Chronic lower respiratory disease, also known as CLRD,
is a progressive disease and the fourth leading cause of
death in the United States. The symptoms of CLRD typically
worsen over time, especially if there is continued exposure
to cigarette smoke or pollution. A person with CLRD is
more susceptible to infections, which can damage lungs
and airways and can lead to chronic lung disease. Each
year, there are an average of 67,800 CLRD hospitalizations
in Illinois.
Nine percent of PRC community survey respondents
reported being diagnosed with chronic lung disease,
compared to a national average of 7 percent according
to Healthy People 2020.
Tobacco Use
Tobacco use is the single most preventable cause of death and
disease in Chicago and the United States. From 2000 to 2009,
tobacco use among adults in Chicago declined from 24 to
19 percent. In Rush’s service area, 21 percent of community
survey respondents reported being a current smoker.
Although smoking rates are declining, the Chicago
Department of Public Health reports a health goal of
reducing smoking prevalence by 2020 to 12 percent.
Interview Findings
Participants noted that while tobacco use is down, it is still
a major issue in the area. The Chicago Department of Public
Health partnered with the Chicago Housing Authority
and Respiratory Health Association on a major smoking
cessation effort. Emergency asthma interventions remain
a critical health need in Chicago. School-based health
clinics cited the need for more education directed toward
school-age children.Figure 17. Chicago Neighborhood Asthma PrevalenceSource: Journal of Allergy and Clinical Immunology, 2007
Rush Service Area
22
Ref
lect
ion
s The development of the Community Health Needs
Assessment (CHNA) has enabled Rush to continue
its exploration and strengthen its commitment to the
community. The CHNA process presented an exciting
opportunity to engage a diverse group of stakeholders
internally at Rush and across the community. We are
grateful for the access and analysis of data that the
Chicago Department of Public Health was able to provide.
Rush also worked diligently to gain a broad perspective
of health issues from a wide range of service providers
and community leaders. Community input is equally as
important as data and statistics in forming a comprehensive
profile of Rush’s service area.
Internally, the relationships that were strengthened
between different Rush departments and community
efforts, and particularly between many Rush leaders with
interest and expertise in community health, will facilitate
a more coordinated Rush presence in our community.
The formation and participation of the CHNA Steering
Committee was an invaluable way to promote collaboration
among all relevant parties and a perfect example of how
our organization can and will contribute to our community.
Finally, Rush feels that the CHNA process offers an exciting
opportunity for hospitals, local health departments, and
other organizations dedicated to improving health to
strengthen collaborative work. Incorporating community
input and collaboration is an ongoing process, and Rush
will continue to work with current and future partners to
play a role in a collective and collaborative approach for
addressing the community’s health needs.
From the results of the Community Health Needs
Assessment and guidance from the CHNA Steering
Committee, Rush developed a comprehensive
implementation plan to address each of the priority health
needs in Rush’s service area. This plan lays out how Rush
will contribute to creating a solution for the health needs
of the community. Rush is focused on supporting and
fostering programs and partnerships that involve direct
patient care, health education and promotion, pipeline
training, and community-based research. A more detailed
approach will be available for the Internal Revenue Service,
as part of this fiscal year’s Form 990 submission. Additional
information about current programming that Rush
participates with can be found in our annual Community
Benefit Report, available on www.rush.edu.
Again, we would like to take this time to thank everyone
for their contributions to this report.
23
Ap
pen
dix A
: Health
Care A
sset Map
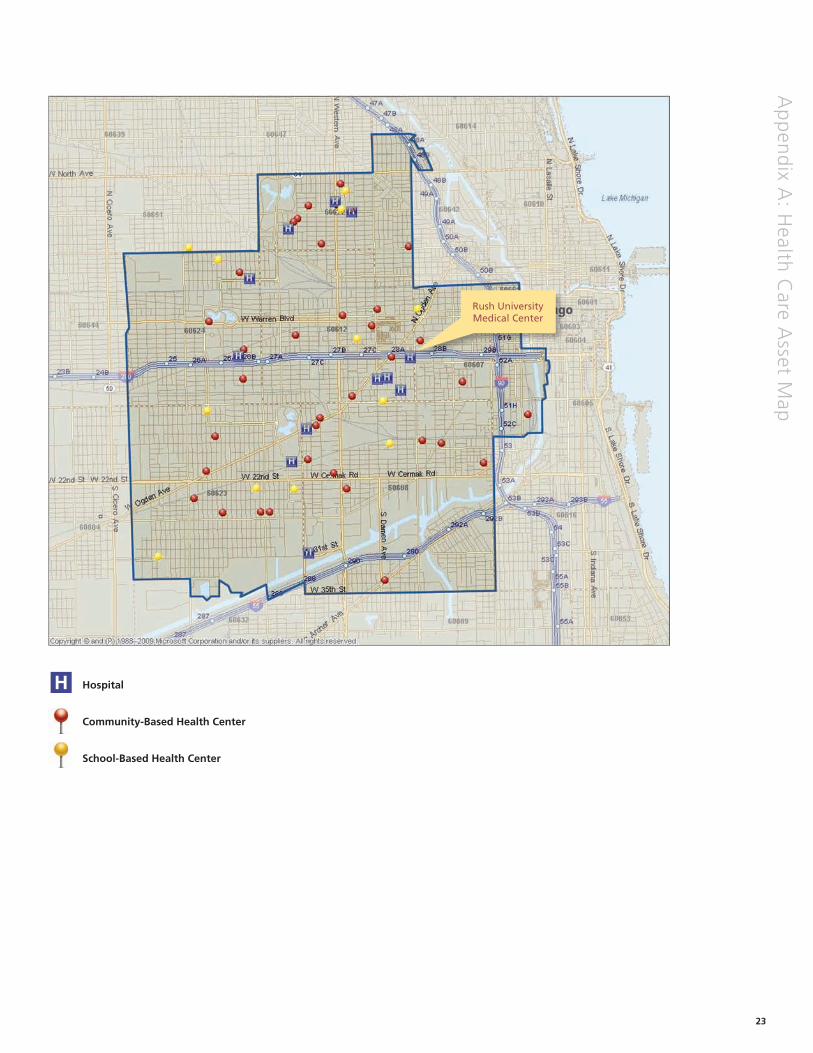
Hospital
Community-Based Health Center
School-Based Health Center
H
Rush University Medical Center
24
Ap
pen
dix
B:
Hea
lth
Res
ou
rces
in R
ush
’s S
ervi
ce A
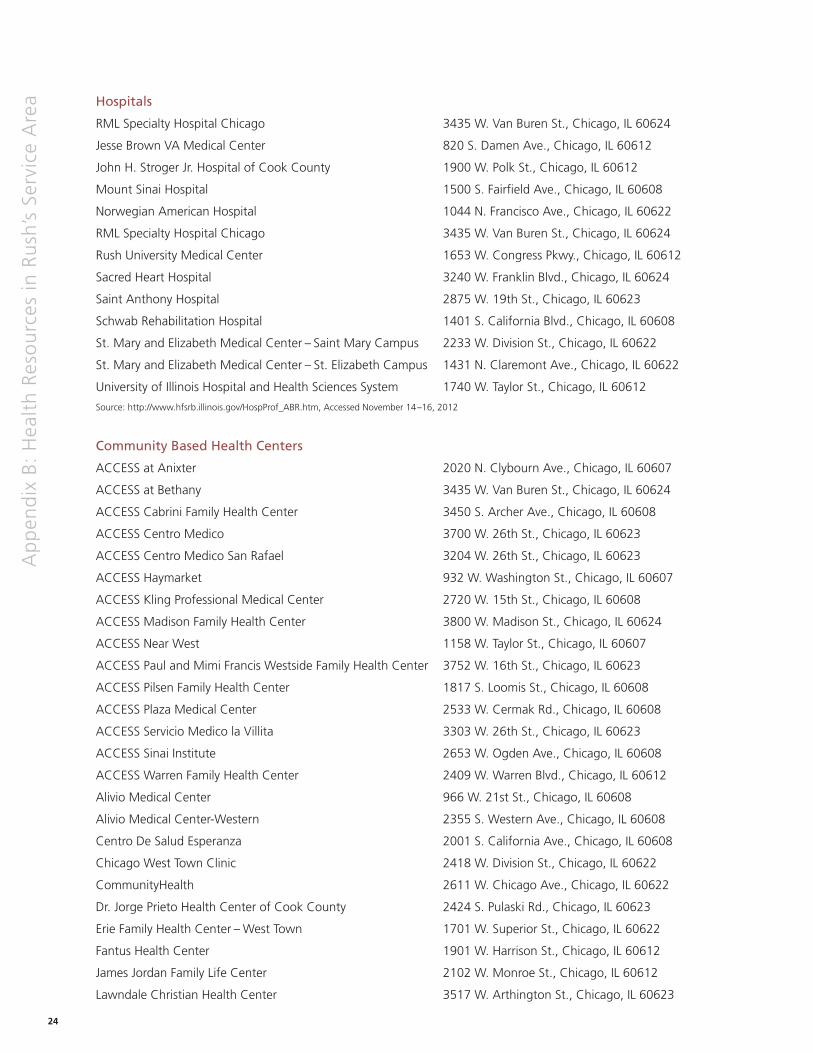
rea Hospitals
RML Specialty Hospital Chicago 3435 W. Van Buren St., Chicago, IL 60624
Jesse Brown VA Medical Center 820 S. Damen Ave., Chicago, IL 60612
John H. Stroger Jr. Hospital of Cook County 1900 W. Polk St., Chicago, IL 60612
Mount Sinai Hospital 1500 S. Fairfield Ave., Chicago, IL 60608
Norwegian American Hospital 1044 N. Francisco Ave., Chicago, IL 60622
RML Specialty Hospital Chicago 3435 W. Van Buren St., Chicago, IL 60624
Rush University Medical Center 1653 W. Congress Pkwy., Chicago, IL 60612
Sacred Heart Hospital 3240 W. Franklin Blvd., Chicago, IL 60624
Saint Anthony Hospital 2875 W. 19th St., Chicago, IL 60623
Schwab Rehabilitation Hospital 1401 S. California Blvd., Chicago, IL 60608
St. Mary and Elizabeth Medical Center – Saint Mary Campus 2233 W. Division St., Chicago, IL 60622
St. Mary and Elizabeth Medical Center – St. Elizabeth Campus 1431 N. Claremont Ave., Chicago, IL 60622
University of Illinois Hospital and Health Sciences System 1740 W. Taylor St., Chicago, IL 60612
Source: http://www.hfsrb.illinois.gov/HospProf_ABR.htm, Accessed November 14–16, 2012
Community Based Health Centers
ACCESS at Anixter 2020 N. Clybourn Ave., Chicago, IL 60607
ACCESS at Bethany 3435 W. Van Buren St., Chicago, IL 60624
ACCESS Cabrini Family Health Center 3450 S. Archer Ave., Chicago, IL 60608
ACCESS Centro Medico 3700 W. 26th St., Chicago, IL 60623
ACCESS Centro Medico San Rafael 3204 W. 26th St., Chicago, IL 60623
ACCESS Haymarket 932 W. Washington St., Chicago, IL 60607
ACCESS Kling Professional Medical Center 2720 W. 15th St., Chicago, IL 60608
ACCESS Madison Family Health Center 3800 W. Madison St., Chicago, IL 60624
ACCESS Near West 1158 W. Taylor St., Chicago, IL 60607
ACCESS Paul and Mimi Francis Westside Family Health Center 3752 W. 16th St., Chicago, IL 60623
ACCESS Pilsen Family Health Center 1817 S. Loomis St., Chicago, IL 60608
ACCESS Plaza Medical Center 2533 W. Cermak Rd., Chicago, IL 60608
ACCESS Servicio Medico la Villita 3303 W. 26th St., Chicago, IL 60623
ACCESS Sinai Institute 2653 W. Ogden Ave., Chicago, IL 60608
ACCESS Warren Family Health Center 2409 W. Warren Blvd., Chicago, IL 60612
Alivio Medical Center 966 W. 21st St., Chicago, IL 60608
Alivio Medical Center-Western 2355 S. Western Ave., Chicago, IL 60608
Centro De Salud Esperanza 2001 S. California Ave., Chicago, IL 60608
Chicago West Town Clinic 2418 W. Division St., Chicago, IL 60622
CommunityHealth 2611 W. Chicago Ave., Chicago, IL 60622
Dr. Jorge Prieto Health Center of Cook County 2424 S. Pulaski Rd., Chicago, IL 60623
Erie Family Health Center – West Town 1701 W. Superior St., Chicago, IL 60622
Fantus Health Center 1901 W. Harrison St., Chicago, IL 60612
James Jordan Family Life Center 2102 W. Monroe St., Chicago, IL 60612
Lawndale Christian Health Center 3517 W. Arthington St., Chicago, IL 60623
25
Ap
pen
dix B
: Health
Reso
urces in
Ru
sh’s Service A
rea
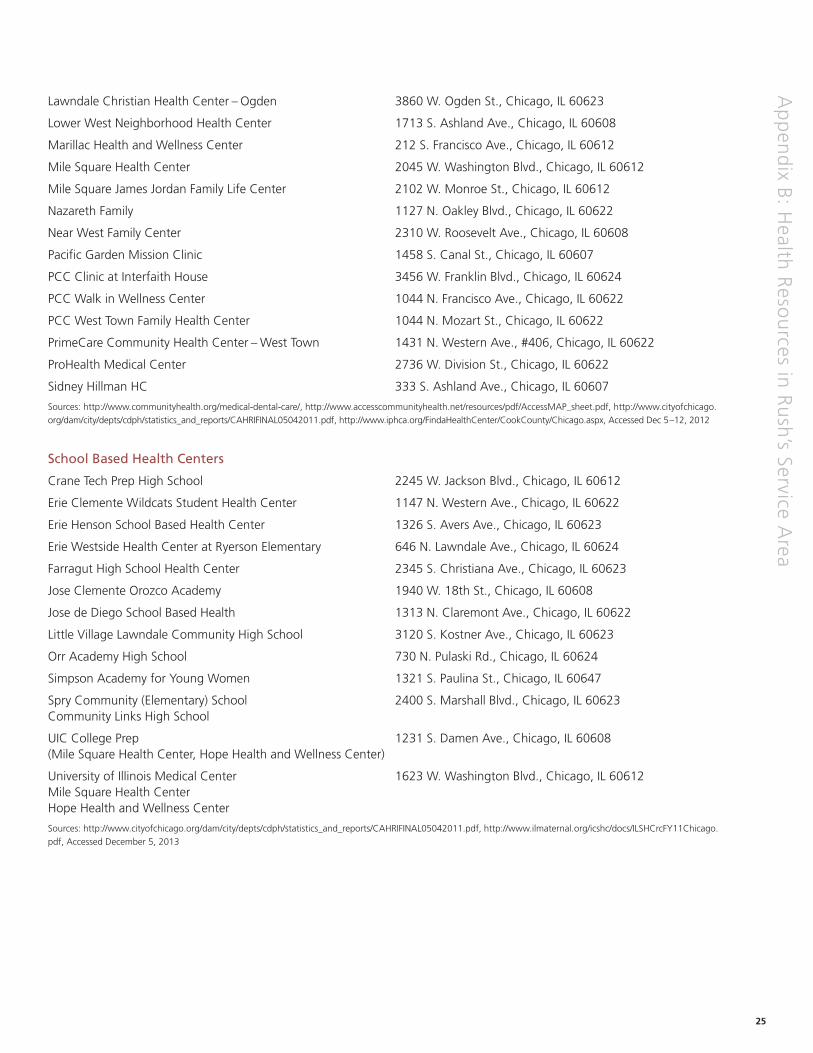
Lawndale Christian Health Center – Ogden 3860 W. Ogden St., Chicago, IL 60623
Lower West Neighborhood Health Center 1713 S. Ashland Ave., Chicago, IL 60608
Marillac Health and Wellness Center 212 S. Francisco Ave., Chicago, IL 60612
Mile Square Health Center 2045 W. Washington Blvd., Chicago, IL 60612
Mile Square James Jordan Family Life Center 2102 W. Monroe St., Chicago, IL 60612
Nazareth Family 1127 N. Oakley Blvd., Chicago, IL 60622
Near West Family Center 2310 W. Roosevelt Ave., Chicago, IL 60608
Pacific Garden Mission Clinic 1458 S. Canal St., Chicago, IL 60607
PCC Clinic at Interfaith House 3456 W. Franklin Blvd., Chicago, IL 60624
PCC Walk in Wellness Center 1044 N. Francisco Ave., Chicago, IL 60622
PCC West Town Family Health Center 1044 N. Mozart St., Chicago, IL 60622
PrimeCare Community Health Center – West Town 1431 N. Western Ave., #406, Chicago, IL 60622
ProHealth Medical Center 2736 W. Division St., Chicago, IL 60622
Sidney Hillman HC 333 S. Ashland Ave., Chicago, IL 60607
Sources: http://www.communityhealth.org/medical-dental-care/, http://www.accesscommunityhealth.net/resources/pdf/AccessMAP_sheet.pdf, http://www.cityofchicago.
org/dam/city/depts/cdph/statistics_and_reports/CAHRIFINAL05042011.pdf, http://www.iphca.org/FindaHealthCenter/CookCounty/Chicago.aspx, Accessed Dec 5–12, 2012
School Based Health Centers
Crane Tech Prep High School 2245 W. Jackson Blvd., Chicago, IL 60612
Erie Clemente Wildcats Student Health Center 1147 N. Western Ave., Chicago, IL 60622
Erie Henson School Based Health Center 1326 S. Avers Ave., Chicago, IL 60623
Erie Westside Health Center at Ryerson Elementary 646 N. Lawndale Ave., Chicago, IL 60624
Farragut High School Health Center 2345 S. Christiana Ave., Chicago, IL 60623
Jose Clemente Orozco Academy 1940 W. 18th St., Chicago, IL 60608
Jose de Diego School Based Health 1313 N. Claremont Ave., Chicago, IL 60622
Little Village Lawndale Community High School 3120 S. Kostner Ave., Chicago, IL 60623
Orr Academy High School 730 N. Pulaski Rd., Chicago, IL 60624
Simpson Academy for Young Women 1321 S. Paulina St., Chicago, IL 60647
Spry Community (Elementary) School 2400 S. Marshall Blvd., Chicago, IL 60623 Community Links High School
UIC College Prep 1231 S. Damen Ave., Chicago, IL 60608 (Mile Square Health Center, Hope Health and Wellness Center)
University of Illinois Medical Center 1623 W. Washington Blvd., Chicago, IL 60612 Mile Square Health Center Hope Health and Wellness Center
Sources: http://www.cityofchicago.org/dam/city/depts/cdph/statistics_and_reports/CAHRIFINAL05042011.pdf, http://www.ilmaternal.org/icshc/docs/ILSHCrcFY11Chicago.
pdf, Accessed December 5, 2013
26
Ap
pen
dix
B:
Hea
lth
Res
ou
rces
in R
ush
’s S
ervi
ce A
rea Chicago Housing Authority Sites
Albany Terrace Apartments (Senior) 3030 W. 21st Pl., Chicago, IL 60623
Apartamentos Las Americas (Senior) 1611 S. Racine Ave., Chicago, IL 60608
Irene McCoy Gaines Apartments (Senior) 3700 W. Congress Pkwy., Chicago, IL 60624
Judge Green Apartments (Senior) 4030 S. Lake Park Ave., Chicago, IL 60624
Lidia Pucinska Apartments (Senior) 847 N. Greenview Ave., Chicago, IL 60622
Patrick Sullivan Apartments (Senior) 1633 W. Madison St., Chicago, IL 60612
Bridgeport Homes (Traditional) 3175 S. Lituanica Ave., Chicago, IL 60608
Lawndale Gardens (Traditional) California Ave. and 25th St., Chicago, IL 60608
Wicker Park Apartments and Annex (Senior) 141 N. Damen Ave., Chicago, IL 60622
William Jones Apartments (Senior) 1447 S. Ashland Ave., Chicago, IL 60608
North Town Village (Mixed) 1311 N. Halsted St., Chicago, IL 60622
Jackson Square at West End (Mixed) 2433 W. Adams St., Chicago, IL 60612
Westhaven Park/Village of Westhaven (Mixed/Traditional) 100 N. Hermitage Ave., Chicago, IL 60612
Roosevelt Square/Brooks Homes (Mixed/Traditional) 1222 W. Roosevelt Rd., Chicago, IL 60608
Loomis Courts (Traditional) 1314 W. 15th St., Chicago, IL 60608
Harrison Courts (Traditional) 2309 W. Harrison St., Chicago, IL 60612
Park Douglas (Mixed) Not built yet, Chicago, IL
Source: http://www.thecha.org/pages/housing/19.php, Accessed October 19, 2012
Pharmacy Walk-in Clinics
Take Care Clinic at Walgreens 3401 W. Roosevelt Rd., Chicago, IL 60624
Minute Clinic at CVS 1165 N. Clark St., Chicago, IL 60610
Source: http://takecarehealth.com/LocationSearchResults.aspx?location_query=60624, http://www.minuteclinic.com/locations/,
Accessed December 5, 2012
Parks and Recreation
Mary Bartelme Park 115 S. Sangamon St., Chicago, IL 60607
Miller Playlot Park 846 S. Miller St., Chicago, IL 60607
Sheridan Park 910 S. Aberdeen St., Chicago, IL 60607
Skinner Park 1331 W. Monroe St., Chicago, IL 60607
Arrigo Park 801 S. Loomis St., Chicago, IL 60607
Garibaldi Playground Park 1520 W. Polk St., Chicago, IL 60607
Park No. 516 2900 S. Ashland Ave., Chicago, IL 60608
Canal Origins 2701 S. Ashland Ave., Chicago, IL 60608
Florian S. Jacolik Park 2731 South Eleanor St., Chicago, IL 60608
Harrison Park 1824 S. Wood St., Chicago, IL 60608
Barrett Park 2022 W. Cermak Rd., Chicago, IL 60608
Throop Park 1811 S. Throop St., Chicago, IL 60608
Mulberry Playlot Park 3150 S. Robinson St., Chicago, IL 60608
Baraga Playlot Park 2434 S. Leavitt St., Chicago, IL 60608
Dvorak Park 1119 W. Cullerton St., Chicago, IL 60608
27
Ap
pen
dix B
: Health
Reso
urces in
Ru
sh’s Service A
rea
Kucinski-Murphy Park 1635 W. 33rd Pl., Chicago, IL 60608
Addams/Medill Park 1301 W. 14th St., Chicago, IL 60608
Bosley Playground Park 3044 S. Bonfield St., Chicago, IL 60608
Wilson Community Center Park 3225 S. Racine Ave., Chicago, IL 60608
Fosco Park 1312 S. Racine Ave., Chicago, IL 60608
McGuane Park 2901 S. Poplar Ave., Chicago, IL 60608
Hoyne Playground Park 3417 S. Hamilton Ave., Chicago, IL 60608
Guadalupe Reyes Park 821 W. 19th St., Chicago, IL 60608
Palmisano Park 2700 S. Halsted St., Chicago, IL 60608
Wilson (John P.) Park 1122 W. 34th Pl., Chicago, IL 60608
Daley (Richard J.) Park 3150 S. Western Ave., Chicago, IL 60608
Washtenaw Park 2521 S. Washtenaw Ave., Chicago, IL 60608
Sain Park 2453 W. Monroe St., Chicago, IL 60612
Park No. 489 2420 W. Adams St., Chicago, IL 60612
Ellen Gates Starr Park 2306 W. Maypole Ave., Chicago, IL 60612
Touhy-Herbert Park 2106 W. Adams St., Chicago, IL 60612
Claremont Playlot Park 2334 W. Flournoy St., Chicago, IL 60612
Altgeld Park 515 S. Washtenaw Ave., Chicago, IL 60612
Park No. 510 2162 W. Polk St., Chicago, IL 60612
Dogwood Playlot Park 2732 W. Polk St., Chicago, IL 60612
Barberry Park 2825 W. Arthington St., Chicago, IL 60612
Superior Playlot Park 2101 W. Superior St., Chicago, IL 60612
Horan Park 3035 W. Van Buren St., Chicago, IL 60612
Nancy Jefferson Park 3101 W. Fulton St., Chicago, IL 60612
Snapping Turtle 534 N. Albany Ave., Chicago, IL 60612
Commercial Club Playground 1845 W. Rice St., Chicago, IL 60622
Park No. 520 916 N. Honore St., Chicago, IL 60622
Snowberry Playlot Park 1851 W. Huron St., Chicago, IL 60622
Bickerdike Square Park 1461 W. Ohio St., Chicago, IL 60622
Dean Playground Park 1344 N. Dean St., Chicago, IL 60622
Wicker Park 1425 N. Damen Ave., Chicago, IL 60622
Western Park 907 N. Western Ave., Chicago, IL 60622
Clemente Park 2334 W. Division St., Chicago, IL 60622
Park No. 399 1420 N. Artesian Ave., Chicago, IL 60622
Humboldt Park 1440 N. Humboldt Dr., Chicago, IL 60622
Shedd Park 3660 W. 23rd St., Chicago, IL 60623
Limas Playground Park 2410 S. Trumbull Ave., Chicago, IL 60623
Miami Playlot Park 2754 S. Trumbull Ave., Chicago, IL 60623
Park No. 519 1944 S. St. Louis Ave., Chicago, IL 60623
Homan Park 2140 S. Homan Ave., Chicago, IL 60623
London Playlot Park 1654 S. Trumbull Ave., Chicago, IL 60623
Madero Park 3203 W. 28th St., Chicago, IL 60623
28
Ap
pen
dix
B:
Hea
lth
Res
ou
rces
in R
ush
’s S
ervi
ce A
rea Ginkgo Playlot Park 1448 S. Trumbull Ave., Chicago, IL 60623
Christiana Playlot Park 1533 S. Christiana Ave., Chicago, IL 60623
Hornbeam Playlot Park 1416–26 S. Hamlin Ave., Chicago, IL 60623
Ninebark Playlot Park 1447 S. Harding Ave., Chicago, IL 60623
Piotrowski Park 4247 W. 31st St., Chicago, IL 60623
Millard Playlot Park 1331 S. Millard Ave., Chicago, IL 60623
Crawford Playlot Park 1516 S. Karlov Ave., Chicago, IL 60623
Park No. 534 1300 S. St. Louis St., Chicago, IL 60623
Franklin Park 4320 W. 15th St., Chicago, IL 60623
Douglas Park 1401 S. Sacramento Dr., Chicago, IL 60623
Smith Park 4320 W. 5th Ave., Chicago, IL 60624
Park No. 550 730 S. Springfield Ave., Chicago, IL 60624
Mason Playlot Park 4100 W. West End Ave., Chicago, IL 60624
Garfield Park 100 N. Central Park Ave., Chicago, IL 60624
Violet Playlot Park 4120 W. Taylor St., Chicago, IL 60624
Roscoe Lee Boler Park 3601 W. Arthington St., Chicago, IL 60624
Sumner Park 4320 W. 5th Ave., Chicago, IL 60624
Garfield Park Conservatory 300 N. Central Park Ave., Chicago, IL 60624
Homan Square Park 3559 W. Arthington St., Chicago, IL 60624
St. Louis Playlot Park 339 N. St. Louis Ave., Chicago, IL 60624
Ohio and Harding Park 601 N. Harding Ave., Chicago, IL 60624
Tilton Park 305 N. Kostner Ave., Chicago, IL 60624
Gladys Playlot Park 3301 W. Gladys Ave., Chicago, IL 60624
Playlot Park No. 422 3232 W. Congress Pkwy., Chicago, IL 60624
Orr Park 744 N. Pulaski Rd., Chicago, IL 60624
Magnolia Playlot Park 3224 W. Flournoy St., Chicago, IL 60624
Central Playlot Park 721 N. Central Park Ave., Chicago, IL 60624
Kells Playground Park 3201 W. Chicago Ave., Chicago, IL 60624
Smith Park 4320 W. 5th Ave., Chicago, IL 60624
Source: http://www.chicagoparkdistrict.com/parks/search/ Accessed January 3, 2012
Childcare Centers
Cordi Marian Center 1100 S. May St., Chicago, IL 60607
Corporate Child Care C.C.C. Learning Center 610 S. Canal St., Chicago, IL 60607
It Takes a Village At River City, LLC 800 S. Wells St., Ste. 90, Chicago, IL 60607
Laurance Armour Day School 2150 W. Harrison St., Chicago, IL 60612
Little Green Tree House 118 S. Ashland Ave., Chicago, IL 60607
Montessori Academy of Chicago 1335 W. Randolph St., Chicago, IL 60607
The Northern Trust Child Care Center 801 S. Canal St., Chicago, IL 60607
Wholly Innocence Day Care Center 120 N. Sangamon St., Chicago, IL 60607
29
Ap
pen
dix B
: Health
Reso
urces in
Ru
sh’s Service A
rea
American Kidz Academy West Loop LLC 229 S. Peoria St., Chicago, IL 60607
Discovery Days Learning Academy 1417 W. Taylor St., Chicago, IL 60607
Carole Robertson Center for Learning 2020 W. Roosevelt Rd., Chicago, IL 60608
Easter Seals Gilchrist-Marchman Center 1001 W. Roosevelt Rd., Chicago, IL 60608
El Hogar Del Niño/Cuidar 1710 S. Loomis St., #18, Chicago, IL 60608
Gads Hill Child Care Center 2653 W. Ogden Ave., Chicago, IL 60608
Guadalupano Family Center 1814 S. Paulina St., Chicago, IL 60608
Marcy-Newberry Asso Inc/Alba/Fosco Cmty 1073 W. Maxwell St., Chicago, IL 60608
New Zion Child Care Academy 1252 S. Wolcott Ave., Chicago, IL 60608
Rauner YMCA 2700 S. Western Ave., Chicago, IL 60608
The Guadalupe Reyes Children and Family Center 1951 W. 19th St., Chicago, IL 60608
Daly Day Care Center 834 W. 31st St., #836, Chicago, IL 60608
Fellowship House Day Care Center 844 W. 32nd St., Chicago, IL 60608
Gads Hill Center After School 1919 W. Cullerton St., Chicago, IL 60608
Lil’ Einstein’s Institute for Scholars 1854 S. Racine Ave., Chicago, IL 60608
Richard J. Daley/AVI-CDC 2800 S. Western Ave., Chicago, IL 60608
Smart Learning Center 2841 S. Archer Ave., Chicago, IL 60608
Dr. Effie O. Ellis YMCA Day Care Center 10 S. Kedzie Ave., Chicago, IL 60612
Malcolm X. College Child Development Center 1900 W. Van Buren St., Chicago, IL 60612
Marillac Social Center 212 S. Francisco Ave., Chicago, IL 60612
Onward Neighborhood House Day Care Program 600 N. Leavitt St., Chicago, IL 60612
UIC Children’s Center II 1919 W. Taylor St., Rm. 116 #M/c5, Chicago, IL 60612
Great Expectations Learning Academy Inc. 1146 S. California Ave., Chicago, IL 60612
Casa Central CSC Child Development Center 1343 N. California Ave., Chicago, IL 60622
Centro Infantil Consulo Lee Corretje 2739 W. Division St., #41, Chicago, IL 60622
Erie Community Center 1701 W. Superior St., Chicago, IL 60622
North Avenue Day Nursery 2001 W. Pierce Ave., Chicago, IL 60622
ABC Daycare and Preschool 1634 W. North Ave., Chicago, IL 60622
Casa Central After School Program 1343 N. California Ave., Chicago, IL 60622
Erie Neighborhood House D.C. Program 1701 W. Superior St., Chicago, IL 60622
The Nicholson School 1700 W. Cortland St., Chicago, IL 60622
Fifth City Child Development Institute Inc. 3411 W. 5th Ave. Bldg. C, Chicago, IL 60624
Little Giant’s Child Care Center 3863 W. Harrison St., Chicago, IL 60624
Nia Family Center 744 N. Monticello Ave., Chicago, IL 60624
North Lawndale YMCA 3449 W. Arthington St., Chicago, IL 60624
YMCA Orr Family Development Center 730 N. Pulaski Rd., Chicago, IL 60624
Source: http://childcarecenter.us/search, Accessed January 4, 2013
Grocery Stores
Dominick’s 1 N. Halsted Ave., Chicago, IL 60661
Dominick’s 1340 S. Canal St., Chicago, IL 60607
Dominick’s 2021 W. Chicago Ave., Chicago, IL 60622
30
Ap
pen
dix
B:
Hea
lth
Res
ou
rces
in R
ush
’s S
ervi
ce A
rea Dominick’s 3145 S. Ashland Ave., Chicago, IL 60608
Jewel 1220 S. Ashland Ave., Chicago, IL 60608
Jewel 370 N. Desplaines St., Chicago, IL 60661
Jewel 1341 N. Paulina St., Chicago, IL 60622
Aldi 1739 W. Cermak St., Chicago, IL 60608
Aldi 3835 W. Madison St., Chicago, IL 60624
Aldi 5629 W. Fillmore St., Chicago, IL 60612
Mariano’s 40 S. Halsted St., Chicago, IL 60661
Whole Foods 1101 S. Canal St., Chicago, IL 60607
Costco 1430 S. Ashland Ave., Chicago, IL 60608
Sources:http://www.dominicks.com/IFL/Grocery/Store-Locator-Results,http://www.jewelosco.com/stores/store-search-results.html?ZIPCode=60623&city=&state=,http://
traderjoes.com/stores/index.asp?q=60130, http://www.wholefoodsmarket.com/stores/list, http://aldi.us/us/html/service/store_locator_ENU_HTML.htm?WT.z_src=main,
http://www.marianos.com/default.aspx , http://www.costco.com/ Accessed January 16, 2013
Nursing Homes
Monroe Pavilion Health Treatment Center 1400 W. Monroe St., Chicago, IL 60607
California Gardens and Rehab 2829 S. California Blvd., Chicago, IL 60608
El Valor Residence 1931 W. 19th St., Chicago, IL 60608
Schwab Rehabilitation Center SNU 1401 S. California Blvd., Chicago, IL 60608
Center Home Hispanic Elderly 1401 N. California Blvd., Chicago, IL 60622
Winston Manor CNV and Nursing 2155 W. Pierce St., Chicago, IL 60622
Saints Mary and Elizabeth Medical Center 1431 N. Claremont Ave., Chicago, IL 60622
Park House Nursing and Rehab Center 2320 S. Lawndale Ave., Chicago, IL 60623
Sacred Heart Home 1550 S. Albany St., Chicago, IL 60623
Source: http://www.idph.state.il.us/webapp/LTCApp/ltc.jsp, Accessed January 16, 2013
Mental Health Facilities
Lawndale Mental Health Center 1201 S. Campbell St., Chicago, IL 60608
Bobby E. Wright Community Mental Health Center 9 S. Kedzie St., Chicago, IL 60612
Cook County Hospital System 1969 Ogden St., Chicago, IL 60612
Haymarket Center 108 N. Sangamon St., Chicago, IL 60607
Sinai Mile Square 2040 W. Washington Blvd., Chicago, IL 60612
Near West Men’s Residential Home 2207 W. 18th St., Chicago, IL 60608
Norwegian American Hospital 1044 N. Francisco Ave., Chicago, IL 60622
Pilsen Wellness Center 2319 S. Damen Ave., Chicago, IL 60608
Pilsen Wellness Center 3113 W. Cermak Rd., Chicago, IL 60623
Pilsen Wellness Center 2635 W. 23rd St., Chicago, IL 60608
Rush University Medical Center 1653 W. Congress Pkwy., Chicago, IL 60612
Saint Anthony Hospital 2875 W. 19th St., Chicago, IL 60623
University of Illinois Hospital and Health Sciences System 1740 W. Taylor St., Chicago, IL 60612
Jesse Brown VA Medical Center 820 S. Damen Ave., Chicago, IL 60612
Source: http://www.cityofchicago.org/content/dam/city/depts/cdph/clinical_care_and_more/CDPHLocationsUpdatedCMHC2011Ver2.pdf, Accessed January 14, 2013,
http://www.hrdi.org/hrdi/BedAvailability/tabid/91/Default.aspx Accessed February 12, 2013
31
Ap
pen
dix C
: Referen
ces and
Secon
dary So
urces
Centers for Disease Control and Prevention (CDC). (2012). National Center for Health Statistics. Retrieved from: http://www.cdc.gov/nchs/
Chicago Department of Public Health. (2010). Retrieved from: http://www.cityofchicago.org/city/en/depts/cdph/provdrs/pol_plan_report/svcs/office_of_epidemiologydataanalysisrequests.html
Chicago Department of Public Health. (n.d.). Retrieved from: http://www.cityofchicago.org/city/en/depts/cdph/provdrs/pol_plan_report.html
Chicago Department of Public Health. (2011). Healthy Chicago: Transforming the Health of City Chicago Answers the Call. Retrieved from http://www.cityofchicago.org/content/dam/city/depts/cdph/CDPH/PublicHlthAgenda2011.pdf
Chicago Department of Public Health. (2012). Chicago Plan: The Chicago Plan for Public Health System Improvement 2012–2016. Chicago Department of Public Health Retrieved from: http://www.cityofchicago.org/city/en/depts/cdph/supp_info/info_stats_reports/chicago_plan_forpublichealthsystemimprovement2012–2016.html
Gupta, R.S., Zhang, X., Sharp, L.K., Shannon, J.J., Weiss, K.B. The protective effect of community factors on childhood asthma. Journal of Allergy and Clinical Immunology, Volume 123, Issue 6, June 2009. Pages 1297–1304.e2, ISSN 0091-6749, 10.1016/j.jaci.2009.03.039. (http://www.sciencedirect.com/science/article/pii/S0091674909005491)
Illinois Department of Healthcare and Family Services. (2010). Numbers of Persons Enrolled in Cook County. Retrieved from: http://www2.illinois.gov/hfs/agency/Program%20Enrollment/Pages/cook.aspx (page 13 figure6)
Illinois Health Facilities and Services Review Board, State Hospital Data Summary. (2010). Retrieved from: http://www.hfsrb.illinois.gov/pdf/2010%20Hospital%20State%20Summary.pdf
National Institute of Health. (n.d.) Retrieved from: http://www.nlm.nih.gov/medlineplus/cesareansection.html
National Institute of Mental Health. (n.d.) Retrieved from: http://www.nimh.nih.gov/index.shtml
National Prevention Council. (2011). National Prevention Strategy. Washington, DC: U.S. Department of Health and Human Services, Office of the Surgeon General.
Northeastern Illinois Planning Commission. (2003). Chicago Community Areas and ZIP codes. Northeastern Illinois Planning Commission 17 Feb. 2003.
Patient Protection and Affordable Care Act. (2010). Pub. L. No. 111–148, §2702, 124 Stat. 119, 318 –319.
Professional Research Consultants, Inc. PRC is a national healthcare marketing research firm based in Omaha, Nebraska. For more than 30 years, it has helped over 2,000 hospitals and healthcare organizations by providing meaningful information and high quality research, to support their efforts in improving healthcare for all and in becoming better places for patients to be treated, physicians to practice medicine, and employees to work. PRC offers a full portfolio of research services such as patient experience, satisfaction and loyalty surveys, employee engagement surveys, medical staff engagement, loyalty and alignment surveys, referring physician studies, community health needs assessments, emergency medical services surveys, and consumer perception and awareness studies. For more information on PRC, please visit http://www.prconline.com/.
Society of Women’s Health Research. (n.d.). Retrieved from: http://www.womenshealthresearch.org/site/PageServer?pagename=hs_main
United Way of Metropolitan Chicago. Health & Wellness Community Impact Plan. (2009). Retrieved from: www.uw-mc.org/wp-content/uploads/.../HW-Impact-Plan-RFI.doc
U.S. Bureau of Labor Statistics. (n.d.). Retrieved from: http://www.cdc.gov/nchs/
U.S. Census Bureau. (n.d.). Retrieved from: http://www.census.gov/
U.S. Department of Health and Human Services. (2011). Healthy People 2020 Objectives. Retrieved from: http://www.healthypeople.gov/2020/topicsobjectives2020/default.aspx
U.S. Department of Health and Human Services. Retrieved from: http://aspe.hhs.gov/poverty

Rush is a not-for-profit health care, education and research enterprise comprising Rush University Medical Center, Rush University, Rush Oak Park Hospital and Rush Health.