Embed Size (px)
Citation preview
Journal of Water Resource and Protection, 2013, 5, 208-221 http://dx.doi.org/10.4236/jwarp.2013.52022 Published Online February 2013 (http://www.scirp.org/journal/jwarp)
Rural Water Supply Management and Sustainability: The Case of Adama Area, Ethiopia
Abebe Tadesse*, Techane Bosona, Girma Gebresenbet Department of Energy and Technology, Swedish University of Agricultural Sciences (SLU), Uppsala, Sweden
Email: *[email protected]
Received December 3, 2012; revised January 5, 2013; accepted January 13, 2013
ABSTRACT
Wise utilization of water resources is becoming very important as world faces water crises. The main objective of this study was to investigate the rural water supply systems with case study in Adama area, in central Ethiopia. Both quanti- tative and qualitative data were collected and analyzed. Four sample water schemes were selected and totally 148 (63 were female) representative households were selected for answering the questionnaires. Key informant interviews and group discussions were also conducted. The study assessed issues such as community participation, water committee empowerment, management and governance of water supply schemes, women participation, functional status of water supply scheme, sanitation and hygiene issues, external support, and monitoring system of water supply schemes. The findings indicated that the community participation in planning and implementation was very good while monitoring mechanism of operation and management as well as community participation on choice of technology was poor. The water schemes were located at reasonable distances i.e. less than 2 km in most cases and the time taken for round trip to fetch water from source was less than or equal to 30 minutes in most cases, however the queuing time was more than an hour. The water supply was inadequate as only about 15% of beneficiaries could get 20 liters of water per day per capita. The water sources were exposed in many cases to human waste, wild life, livestock and uncontrolled flooding. Sanitary practices in the study area were poor as only about 3.4% had ventilated and improved pit latrine and open pit and/or open field defecation were widely practiced. Keywords: Ethiopia; Rural Water Supply; Water Fee; Community Participation; Safe Drinking Water
1. Introduction
Wise utilization of water resources is becoming very important as world faces water crises which could hold back human development. According to Millennium De- velopment Goal (MDG) summit Report [1], progress on the MDG 7 target “to reduce by half the proportion of people without sustainable access to safe drinking water and basic sanitation by 2015” is presently on pathway. However rural areas in developing countries across the world remain severely underprivileged, with eight out of ten people not having access to safe water supply. As per WHO and UNICEF [2], 87% of the world population could have access to safe drinking water, a progress of 10% within the last two decades. The report also pointed out that about 884 million people worldwide, out of which 37% living in sub-Saharan Africa, still utilize drinking water from unsafe supply spots. Africa is lag-ging behind the attainment of the MDG as 340 million Africans lack access to safe drinking water [3]. The pro-portion of the African population who had access to safe
drinking water accounted for only 60% by 2010, which is about 11% increase compared to the situation in 1990 [2]. In Ethiopia, the percentage was about 68.5% by 2010 indicating good efforts made in the sector during the last two decades [4].
As per urban-rural disparities concerning access to safe drinking water, out of the world population who lacked access to safe drinking water, about 84% were living in rural areas [5]. Accordingly, urban safe drinking water coverage for Africa was estimated to be 85% (281 million people) while the rural coverage was about 51% (294 million people) by 2008 [6]. In this respect, Ethio-pia has made an encouraging progress as access to safe drinking water has increased from 35% and 80% in 2005 to 65.8% and 91.5% in 2010 for rural and urban areas respectively [1].
About 84% of Ethiopian populations live in rural areas. For sizable proportion of the rural population, the major sources of drinking water are unprotected springs, ponds, rivers, and hand dug wells which are exposed to con- tamination caused by human beings, livestock, wildlife and uncontrolled flooding. The safety and quality of *Corresponding author.
Copyright © 2013 SciRes. JWARP
A. TADESSE ET AL. 209
drinking water is further in jeopardy as the culture of open defecation has been socially accepted and widely practiced in most of the rural settings and partly in urban areas as well [7]. As a result, the prevalence of water borne diseases has increased at alarming rate. As noted by Dessalegn [8], rural safe drinking water supply provi-sion has commenced in Ethiopia during the late 1950s. Since then, efforts have been made to provide safe drink- ing water for rural areas although there was more focus on urban water supply before two decades. This condi- tion coupled with other factors, has contributed a lot for the low level of safe drinking water supply provisions of the country until quite recently. Access to safe drinking water has been improved from 19% in 1990 [1] to 68.5% by 2010 [4].
The driving force behind the expansion of access to safe drinking water in Ethiopia was attributed to the in- cidence of drought and famine in the 70s and the 80s. In response to this devastating situation, and adverse effects associated with years of environmental crises, quite a lot of multi-lateral and bilateral international NGOs, donor agencies and indigenous organizations have devoted sig- nificant proportion of their fund for the provision of rural safe drinking water supply and vigorously engaged in this endeavors [8]. Despite active mobilization of re- sources by international and local NGOs and the Ethio- pian government, the national safe drinking water cov- erage of the country has not been improved that much especially in the rural areas [9]. The main reasons for this very low level of performance in the supply of safe drinking water, and the quandary for not efficiently util- izing the water resources potential of the country towards realizing sustainable water supply, is attributed to lack of articulate and holistic water policy and insufficient in- vestment for safe drinking water supply [10]. In addition to this, communities lack capability in managing the wa-ter supply schemes. Such problems indicate the need of in depth studies to investigate the rural water supply sys-tems in the country and finding out the strategies to im-prove the sustainability of the schemes.
The objective of this study was to investigate the rural water supply systems in Adama area of central Ethiopia. The study focused on assessing household water use practices, assessing communities’ attitudes towards water safety and benefits of safe water supply, investigating the contributions of community for water source protection and maintenance, and investigating institutional approa- ches to enhance the sustainability of water supply sche- mes. This contributes towards the knowledge base for future research and development of water supply systems in the area. Understanding these aspects of rural water supply systems can give an insight into developing a useful strategy that can potentially address water supply system with lasting benefits over time for the intended
communities.
2. Sustainability of Water Supply Schemes
The concept of sustainability has taken its root from the debate on sustainable development during the early 70s. It becomes a concept that is found out to be more “com-plex and contested” [11]. As per the United Nations document entitled “Our Common Future” (1987) “sus-tainable development is development that meets the needs of the present generations without compromising the ability of future generations to meet their own needs.” This being the case, different organizations used their own version of definition to address their intended objective.
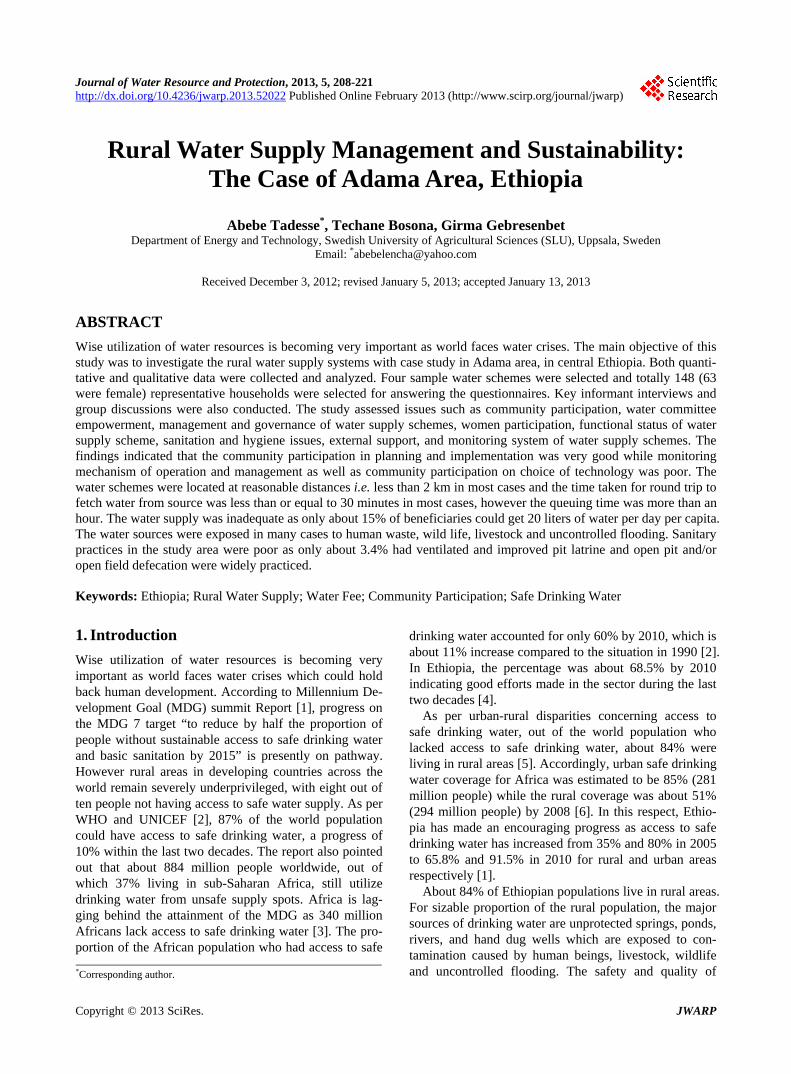
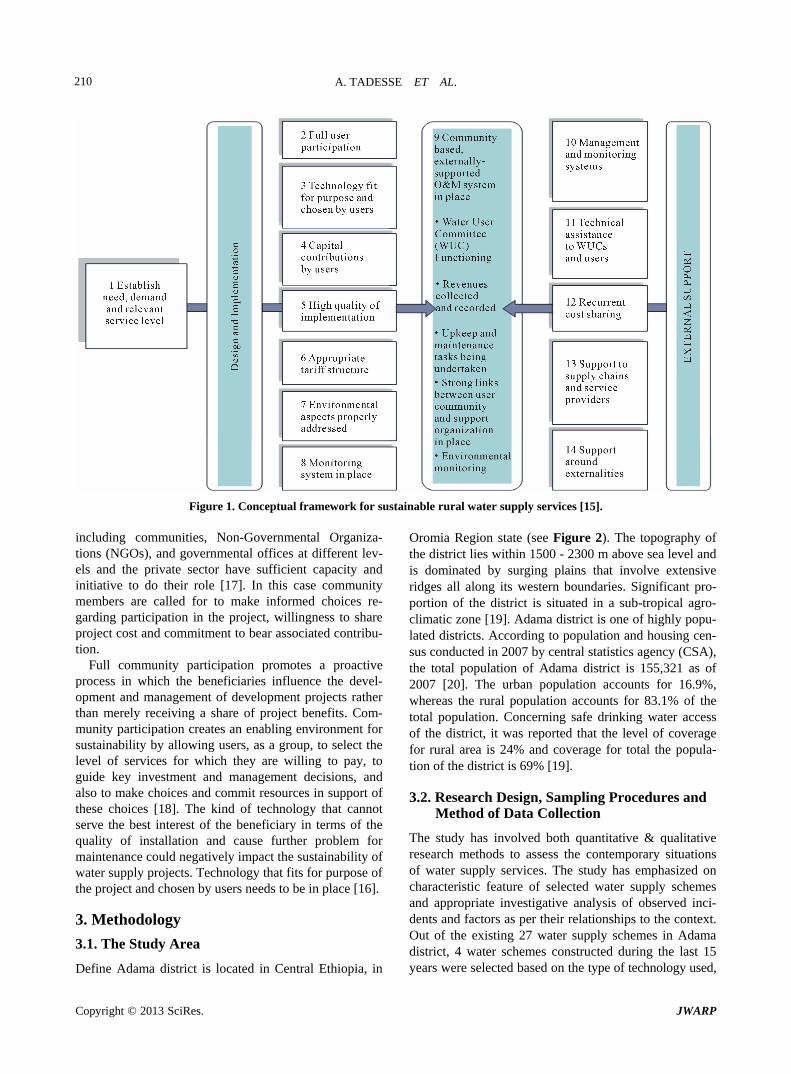
Accordingly, various studies conducted pertaining to water supply services have produced definitions con- cerning sustainability in the context of water supply pro- jects. Most of these definitions capitalize on financing of regular operation and maintenance costs by users, mini- mal external assistance in the long term, and continued flow of benefits over a long period [12]. In this study, the following water supply sustainability definition of Ab- rams [13] has been adapted: “Sustainability is about whether or not water and sanitation services and good hygiene practices continue to work over time”. Accord- ing to this definition, the achievement of sustainability engrosses the realization of enduring “beneficial” changes in rural water services. In this case, the issue of sustain- ability is considered further than limiting itself on tech- nical functionality debate; the expression “beneficial” highlights the outcome on the lives of people and it indi- cates to services other than technology [14]. Over years, several conceptual frameworks have been produced to better understand the essence of rural water supply sus- tainability. Among those developed conceptualization frameworks, the one that has been shared by many re-searchers has five key dimensions [12,13]: institutional (organizational), social, environmental, technical, and financial. It is well noted that the success of lasting sus- tainable water supply services is dependent on the inter- action of a combination of factors that give due emphasis for community participation, external collaboration and technical support in order to ensure operation and main- tenance of the system [12,13]. In order to have a close look at the interplay of these factors, the recently devel-oped conceptual framework of sustainable rural water services [15] is presented in Figure 1.
Factors listed above are interdependent, interactive and crucial for achieving sustainable water services with a corresponding behavior changes over time [16]. This delicate balance of interacting factors requires the in-volvement of a number of stakeholders working together. Sustainability will be achieved only if all stakeholders
Copyright © 2013 SciRes. JWARP
A. TADESSE ET AL.
Copyright © 2013 SciRes. JWARP
210
Figure 1. Conceptual framework for sustainable rural water supply services [15]. including communities, Non-Governmental Organiza- tions (NGOs), and governmental offices at different lev- els and the private sector have sufficient capacity and initiative to do their role [17]. In this case community members are called for to make informed choices re- garding participation in the project, willingness to share project cost and commitment to bear associated contribu- tion.
Full community participation promotes a proactive process in which the beneficiaries influence the devel- opment and management of development projects rather than merely receiving a share of project benefits. Com- munity participation creates an enabling environment for sustainability by allowing users, as a group, to select the level of services for which they are willing to pay, to guide key investment and management decisions, and also to make choices and commit resources in support of these choices [18]. The kind of technology that cannot serve the best interest of the beneficiary in terms of the quality of installation and cause further problem for maintenance could negatively impact the sustainability of water supply projects. Technology that fits for purpose of the project and chosen by users needs to be in place [16].
3. Methodology
3.1. The Study Area
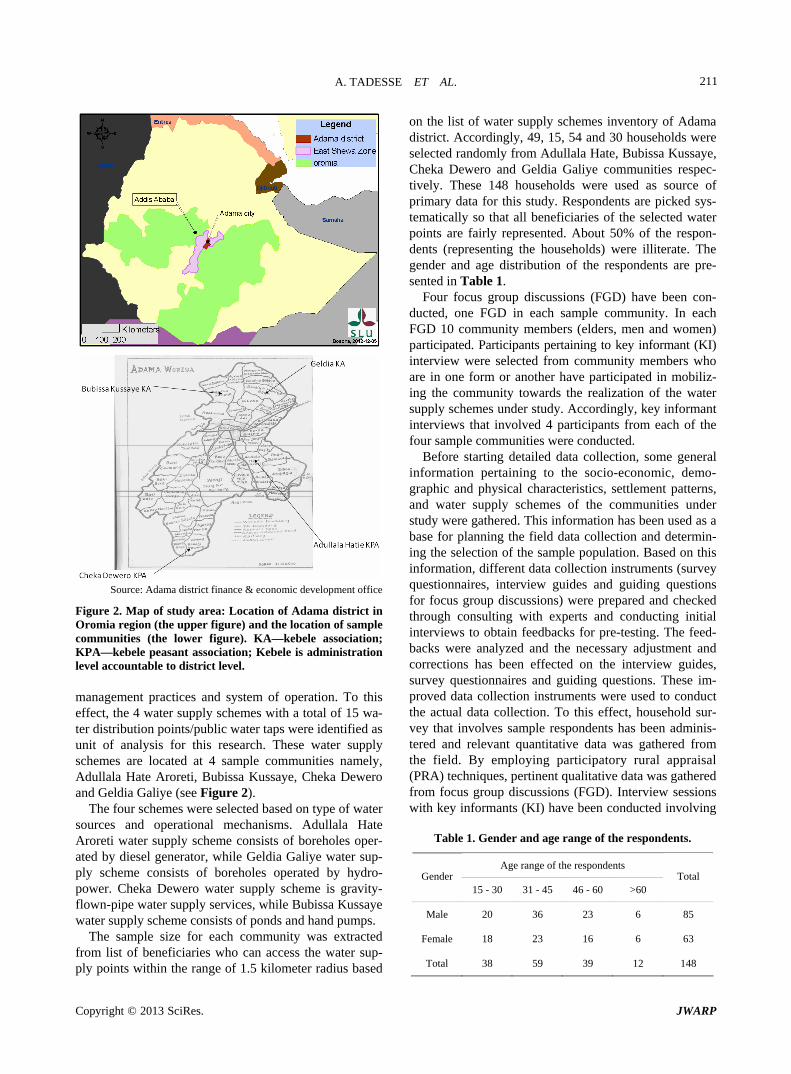
Define Adama district is located in Central Ethiopia, in
Oromia Region state (see Figure 2). The topography of the district lies within 1500 - 2300 m above sea level and is dominated by surging plains that involve extensive ridges all along its western boundaries. Significant pro-portion of the district is situated in a sub-tropical agro- climatic zone [19]. Adama district is one of highly popu- lated districts. According to population and housing cen- sus conducted in 2007 by central statistics agency (CSA), the total population of Adama district is 155,321 as of 2007 [20]. The urban population accounts for 16.9%, whereas the rural population accounts for 83.1% of the total population. Concerning safe drinking water access of the district, it was reported that the level of coverage for rural area is 24% and coverage for total the popula- tion of the district is 69% [19].
3.2. Research Design, Sampling Procedures and Method of Data Collection
The study has involved both quantitative & qualitative research methods to assess the contemporary situations of water supply services. The study has emphasized on characteristic feature of selected water supply schemes and appropriate investigative analysis of observed inci- dents and factors as per their relationships to the context. Out of the existing 27 water supply schemes in Adama district, 4 water schemes constructed during the last 15 years were selected based on the type of technology used,
A. TADESSE ET AL. 211
Source: Adama district finance & economic development office
Figure 2. Map of study area: Location of Adama district in Oromia region (the upper figure) and the location of sample communities (the lower figure). KA—kebele association; KPA—kebele peasant association; Kebele is administration level accountable to district level. management practices and system of operation. To this effect, the 4 water supply schemes with a total of 15 wa- ter distribution points/public water taps were identified as unit of analysis for this research. These water supply schemes are located at 4 sample communities namely, Adullala Hate Aroreti, Bubissa Kussaye, Cheka Dewero and Geldia Galiye (see Figure 2).
The four schemes were selected based on type of water sources and operational mechanisms. Adullala Hate Aroreti water supply scheme consists of boreholes oper- ated by diesel generator, while Geldia Galiye water sup-ply scheme consists of boreholes operated by hydro- power. Cheka Dewero water supply scheme is gravity- flown-pipe water supply services, while Bubissa Kussaye water supply scheme consists of ponds and hand pumps.
The sample size for each community was extracted from list of beneficiaries who can access the water sup- ply points within the range of 1.5 kilometer radius based
on the list of water supply schemes inventory of Adama district. Accordingly, 49, 15, 54 and 30 households were selected randomly from Adullala Hate, Bubissa Kussaye, Cheka Dewero and Geldia Galiye communities respec-tively. These 148 households were used as source of primary data for this study. Respondents are picked sys- tematically so that all beneficiaries of the selected water points are fairly represented. About 50% of the respon- dents (representing the households) were illiterate. The gender and age distribution of the respondents are pre- sented in Table 1.
Four focus group discussions (FGD) have been con-ducted, one FGD in each sample community. In each FGD 10 community members (elders, men and women) participated. Participants pertaining to key informant (KI) interview were selected from community members who are in one form or another have participated in mobiliz- ing the community towards the realization of the water supply schemes under study. Accordingly, key informant interviews that involved 4 participants from each of the four sample communities were conducted.
Before starting detailed data collection, some general information pertaining to the socio-economic, demo- graphic and physical characteristics, settlement patterns, and water supply schemes of the communities under study were gathered. This information has been used as a base for planning the field data collection and determin- ing the selection of the sample population. Based on this information, different data collection instruments (survey questionnaires, interview guides and guiding questions for focus group discussions) were prepared and checked through consulting with experts and conducting initial interviews to obtain feedbacks for pre-testing. The feed- backs were analyzed and the necessary adjustment and corrections has been effected on the interview guides, survey questionnaires and guiding questions. These im- proved data collection instruments were used to conduct the actual data collection. To this effect, household sur- vey that involves sample respondents has been adminis- tered and relevant quantitative data was gathered from the field. By employing participatory rural appraisal (PRA) techniques, pertinent qualitative data was gathered from focus group discussions (FGD). Interview sessions with key informants (KI) have been conducted involving
Table 1. Gender and age range of the respondents.
Age range of the respondents Gender
15 - 30 31 - 45 46 - 60 >60 Total
Male 20 36 23 6 85
Female 18 23 16 6 63
Total 38 59 39 12 148
Copyright © 2013 SciRes. JWARP
A. TADESSE ET AL. 212
community influential’s, elders and others who are active in community mobilization. In addition to pre-testing efforts, triangulation method has been used to ensure the quality and reliability of the data. For this, available do- cuments and technical reports were used. The findings are presented and discussed in the following sections.
4. Major Findings and Discussions
4.1. Summary of Major Findings from FGD and KI Interview Sessions
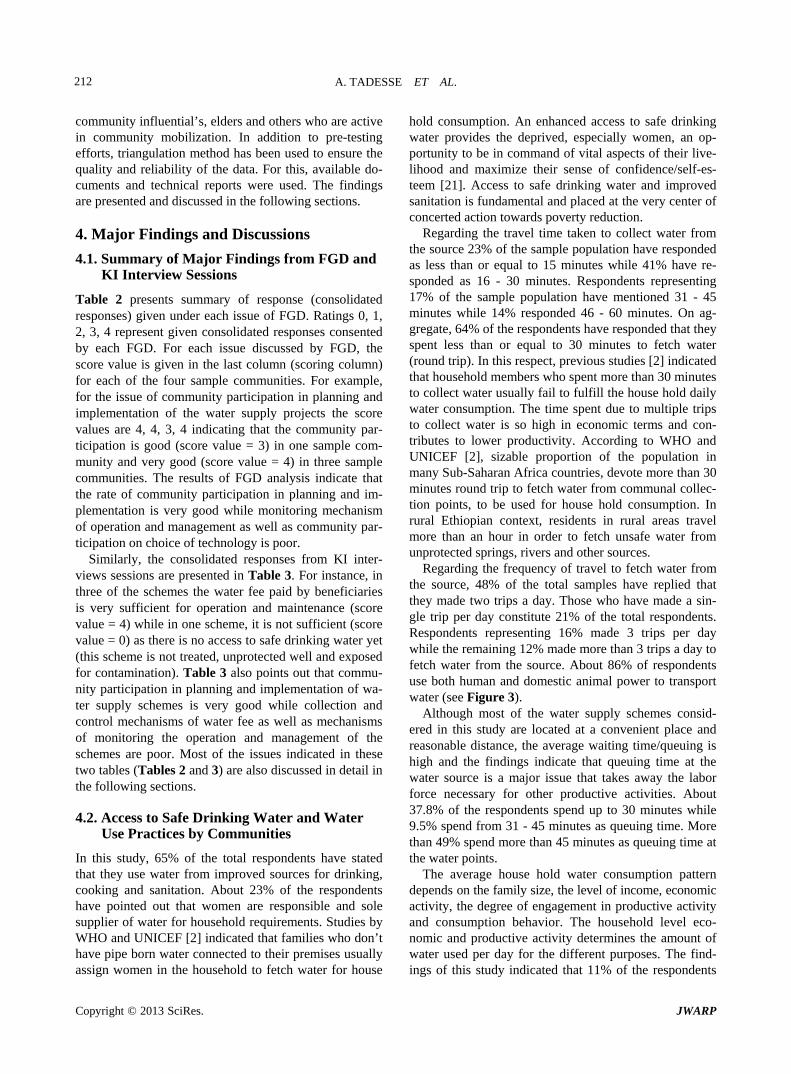
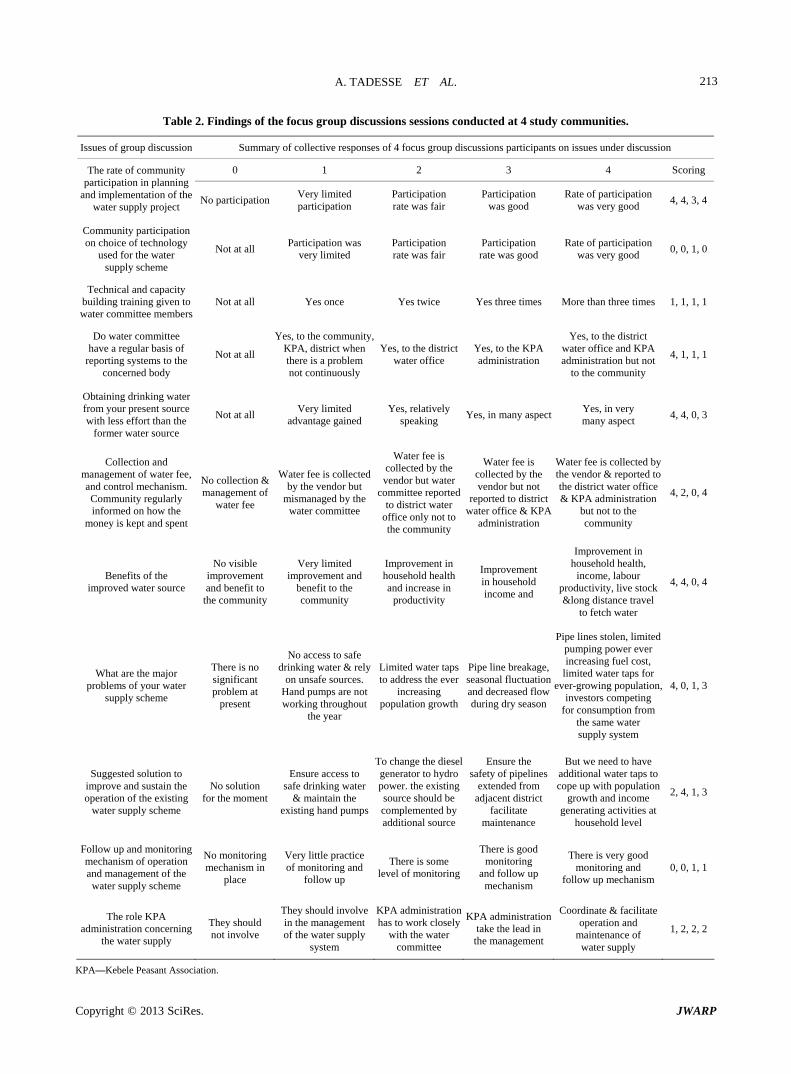
Table 2 presents summary of response (consolidated responses) given under each issue of FGD. Ratings 0, 1, 2, 3, 4 represent given consolidated responses consented by each FGD. For each issue discussed by FGD, the score value is given in the last column (scoring column) for each of the four sample communities. For example, for the issue of community participation in planning and implementation of the water supply projects the score values are 4, 4, 3, 4 indicating that the community par-ticipation is good (score value = 3) in one sample com-munity and very good (score value = 4) in three sample communities. The results of FGD analysis indicate that the rate of community participation in planning and im- plementation is very good while monitoring mechanism of operation and management as well as community par- ticipation on choice of technology is poor.
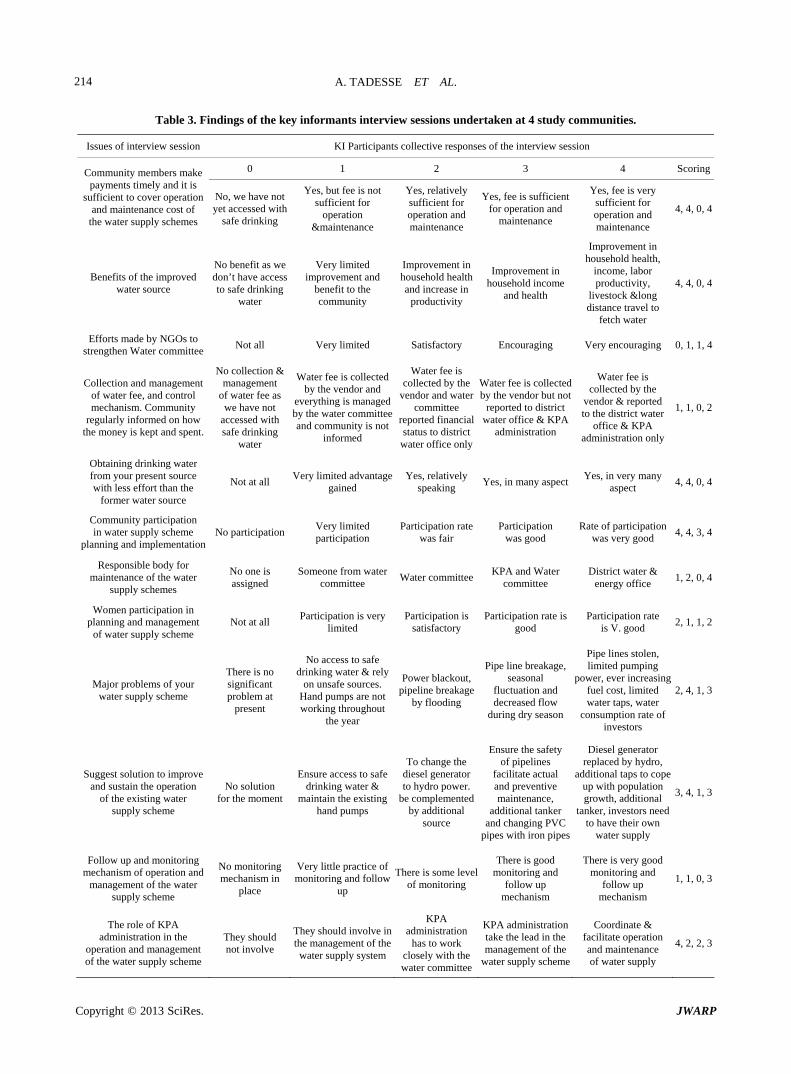
Similarly, the consolidated responses from KI inter- views sessions are presented in Table 3. For instance, in three of the schemes the water fee paid by beneficiaries is very sufficient for operation and maintenance (score value = 4) while in one scheme, it is not sufficient (score value = 0) as there is no access to safe drinking water yet (this scheme is not treated, unprotected well and exposed for contamination). Table 3 also points out that commu- nity participation in planning and implementation of wa- ter supply schemes is very good while collection and control mechanisms of water fee as well as mechanisms of monitoring the operation and management of the schemes are poor. Most of the issues indicated in these two tables (Tables 2 and 3) are also discussed in detail in the following sections.
4.2. Access to Safe Drinking Water and Water Use Practices by Communities
In this study, 65% of the total respondents have stated that they use water from improved sources for drinking, cooking and sanitation. About 23% of the respondents have pointed out that women are responsible and sole supplier of water for household requirements. Studies by WHO and UNICEF [2] indicated that families who don’t have pipe born water connected to their premises usually assign women in the household to fetch water for house
hold consumption. An enhanced access to safe drinking water provides the deprived, especially women, an op-portunity to be in command of vital aspects of their live- lihood and maximize their sense of confidence/self-es- teem [21]. Access to safe drinking water and improved sanitation is fundamental and placed at the very center of concerted action towards poverty reduction.
Regarding the travel time taken to collect water from the source 23% of the sample population have responded as less than or equal to 15 minutes while 41% have re-sponded as 16 - 30 minutes. Respondents representing 17% of the sample population have mentioned 31 - 45 minutes while 14% responded 46 - 60 minutes. On ag-gregate, 64% of the respondents have responded that they spent less than or equal to 30 minutes to fetch water (round trip). In this respect, previous studies [2] indicated that household members who spent more than 30 minutes to collect water usually fail to fulfill the house hold daily water consumption. The time spent due to multiple trips to collect water is so high in economic terms and con-tributes to lower productivity. According to WHO and UNICEF [2], sizable proportion of the population in many Sub-Saharan Africa countries, devote more than 30 minutes round trip to fetch water from communal collec-tion points, to be used for house hold consumption. In rural Ethiopian context, residents in rural areas travel more than an hour in order to fetch unsafe water from unprotected springs, rivers and other sources.
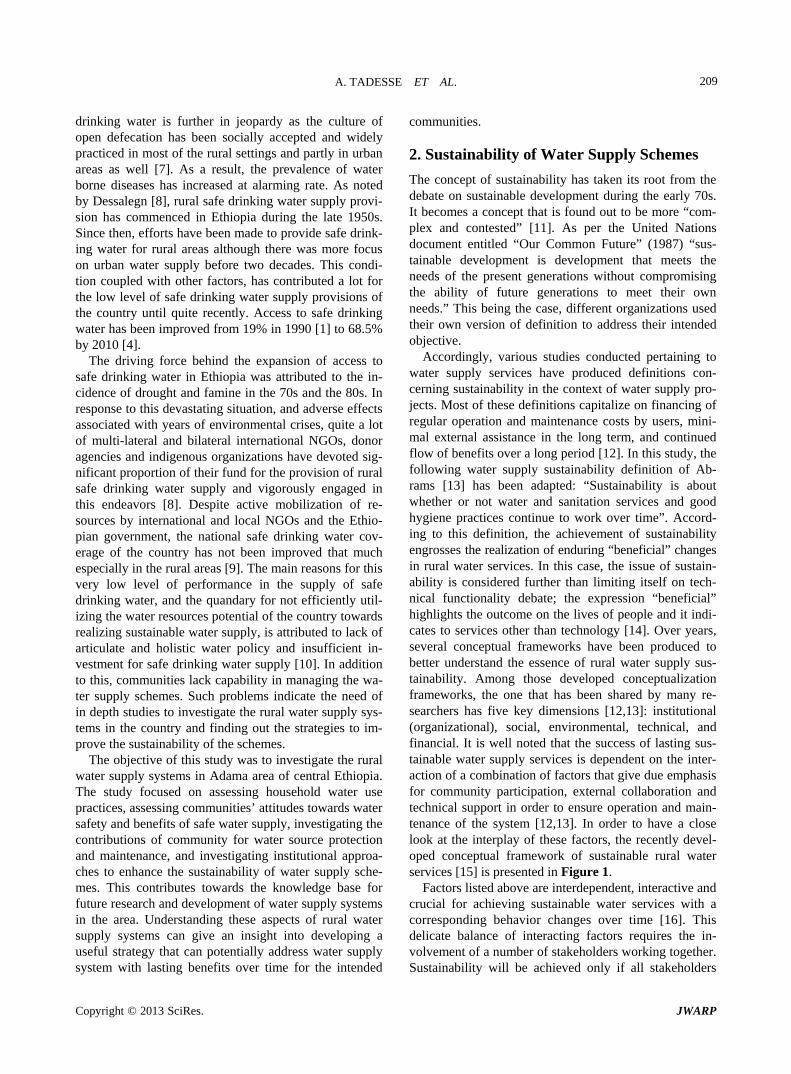
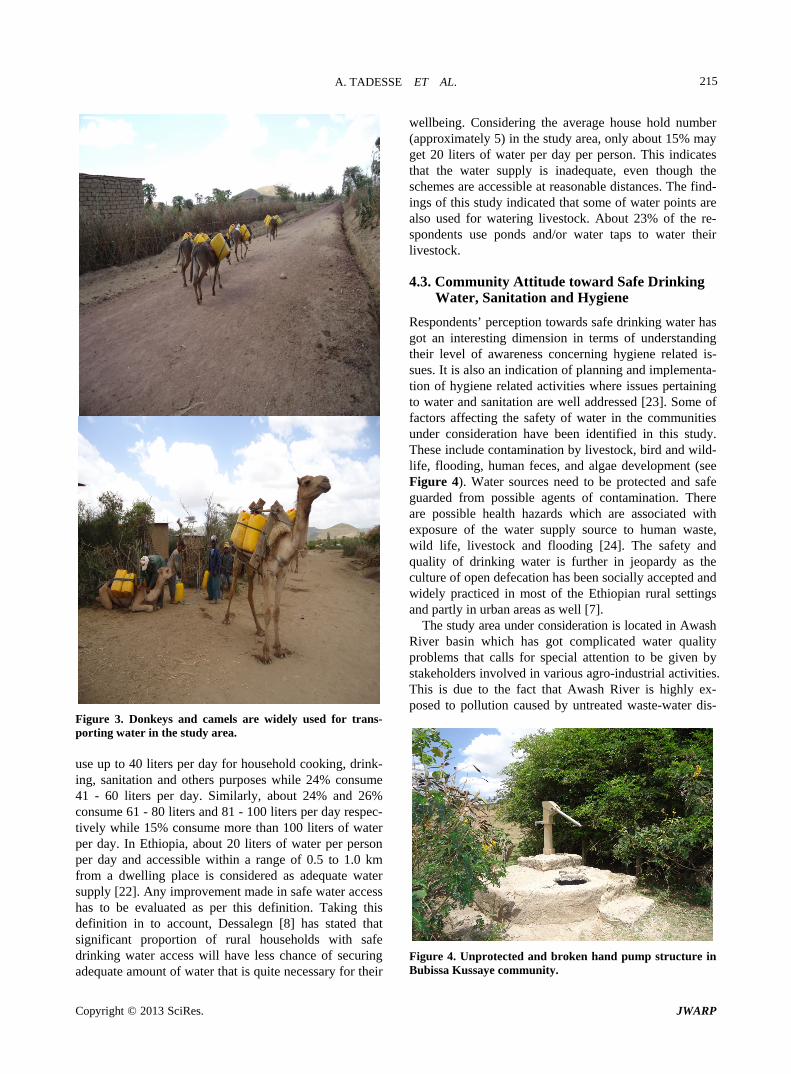
Regarding the frequency of travel to fetch water from the source, 48% of the total samples have replied that they made two trips a day. Those who have made a sin-gle trip per day constitute 21% of the total respondents. Respondents representing 16% made 3 trips per day while the remaining 12% made more than 3 trips a day to fetch water from the source. About 86% of respondents use both human and domestic animal power to transport water (see Figure 3).
Although most of the water supply schemes consid-ered in this study are located at a convenient place and reasonable distance, the average waiting time/queuing is high and the findings indicate that queuing time at the water source is a major issue that takes away the labor force necessary for other productive activities. About 37.8% of the respondents spend up to 30 minutes while 9.5% spend from 31 - 45 minutes as queuing time. More than 49% spend more than 45 minutes as queuing time at the water points.
The average house hold water consumption pattern depends on the family size, the level of income, economic activity, the degree of engagement in productive activity and consumption behavior. The household level eco- nomic and productive activity determines the amount of water used per day for the different purposes. The find- ings of this study indicated that 11% of the respondents
Copyright © 2013 SciRes. JWARP
A. TADESSE ET AL.
Copyright © 2013 SciRes. JWARP
213
Table 2. Findings of the focus group discussions sessions conducted at 4 study communities.
Issues of group discussion Summary of collective responses of 4 focus group discussions participants on issues under discussion
0 1 2 3 4 ScoringThe rate of community participation in planning
and implementation of the water supply project
No participation Very limited participation
Participation rate was fair
Participation was good
Rate of participation was very good
4, 4, 3, 4
Community participation on choice of technology
used for the water supply scheme
Not at all Participation was
very limited Participation rate was fair
Participation rate was good
Rate of participation was very good
0, 0, 1, 0
Technical and capacity building training given to water committee members
Not at all Yes once Yes twice Yes three times More than three times 1, 1, 1, 1
Do water committee have a regular basis of
reporting systems to the concerned body
Not at all
Yes, to the community, KPA, district when there is a problem not continuously
Yes, to the district water office
Yes, to the KPA administration
Yes, to the district water office and KPA administration but not
to the community
4, 1, 1, 1
Obtaining drinking water from your present source with less effort than the
former water source
Not at all Very limited
advantage gained Yes, relatively
speaking Yes, in many aspect
Yes, in very many aspect
4, 4, 0, 3
Collection and management of water fee, and control mechanism. Community regularly informed on how the
money is kept and spent
No collection & management of
water fee
Water fee is collected by the vendor but
mismanaged by the water committee
Water fee is collected by the vendor but water
committee reported to district water
office only not to the community
Water fee is collected by the vendor but not
reported to district water office & KPA
administration
Water fee is collected by the vendor & reported to the district water office & KPA administration
but not to the community
4, 2, 0, 4
Benefits of the improved water source
No visible improvement and benefit to
the community
Very limited improvement and
benefit to the community
Improvement in household health and increase in
productivity
Improvement in household income and
Improvement in household health,
income, labour productivity, live stock &long distance travel
to fetch water
4, 4, 0, 4
What are the major problems of your water
supply scheme
There is no significant problem at
present
No access to safe drinking water & rely
on unsafe sources. Hand pumps are not working throughout
the year
Limited water taps to address the ever
increasing population growth
Pipe line breakage, seasonal fluctuation and decreased flow during dry season
Pipe lines stolen, limited pumping power ever increasing fuel cost,
limited water taps for ever-growing population,
investors competing for consumption from
the same water supply system
4, 0, 1, 3
Suggested solution to improve and sustain the operation of the existing
water supply scheme
No solution for the moment
Ensure access to safe drinking water
& maintain the existing hand pumps
To change the diesel generator to hydro power. the existing source should be complemented by additional source
Ensure the safety of pipelines
extended from adjacent district
facilitate maintenance
But we need to have additional water taps to cope up with population
growth and income generating activities at
household level
2, 4, 1, 3
Follow up and monitoring mechanism of operation and management of the water supply scheme
No monitoring mechanism in
place
Very little practice of monitoring and
follow up
There is some level of monitoring
There is good monitoring
and follow up mechanism
There is very good monitoring and
follow up mechanism0, 0, 1, 1
The role KPA administration concerning
the water supply
They should not involve
They should involve in the management of the water supply
system
KPA administration has to work closely
with the water committee
KPA administration take the lead in the management
Coordinate & facilitate operation and
maintenance of water supply
1, 2, 2, 2
KPA—Kebele Peasant Association.
A. TADESSE ET AL. 214
Table 3. Findings of the key informants interview sessions undertaken at 4 study communities.
Issues of interview session KI Participants collective responses of the interview session
0 1 2 3 4 ScoringCommunity members make payments timely and it is
sufficient to cover operation and maintenance cost of
the water supply schemes
No, we have not yet accessed with
safe drinking
Yes, but fee is not sufficient for
operation &maintenance
Yes, relatively sufficient for operation and maintenance
Yes, fee is sufficient for operation and
maintenance
Yes, fee is very sufficient for operation and maintenance
4, 4, 0, 4
Benefits of the improved water source
No benefit as we don’t have access to safe drinking
water
Very limited improvement and
benefit to the community
Improvement in household health and increase in
productivity
Improvement in household income
and health
Improvement in household health,
income, labor productivity,
livestock &long distance travel to
fetch water
4, 4, 0, 4
Efforts made by NGOs to strengthen Water committee
Not all Very limited Satisfactory Encouraging Very encouraging 0, 1, 1, 4
Collection and management of water fee, and control mechanism. Community
regularly informed on how the money is kept and spent.
No collection & management
of water fee as we have not
accessed with safe drinking
water
Water fee is collected by the vendor and
everything is managed by the water committee and community is not
informed
Water fee is collected by the
vendor and water committee
reported financial status to district
water office only
Water fee is collected by the vendor but not
reported to district water office & KPA
administration
Water fee is collected by the
vendor & reported to the district water
office & KPA administration only
1, 1, 0, 2
Obtaining drinking water from your present source with less effort than the
former water source
Not at all Very limited advantage
gained Yes, relatively
speaking Yes, in many aspect
Yes, in very many aspect
4, 4, 0, 4
Community participation in water supply scheme
planning and implementation No participation
Very limited participation
Participation rate was fair
Participation was good
Rate of participation was very good
4, 4, 3, 4
Responsible body for maintenance of the water
supply schemes
No one is assigned
Someone from water committee
Water committee KPA and Water
committee District water &
energy office 1, 2, 0, 4
Women participation in planning and management
of water supply scheme Not at all
Participation is very limited
Participation is satisfactory
Participation rate is good
Participation rate is V. good
2, 1, 1, 2
Major problems of your water supply scheme
There is no significant problem at
present
No access to safe drinking water & rely
on unsafe sources. Hand pumps are not working throughout
the year
Power blackout, pipeline breakage
by flooding
Pipe line breakage, seasonal
fluctuation and decreased flow
during dry season
Pipe lines stolen, limited pumping
power, ever increasing fuel cost, limited water taps, water
consumption rate of investors
2, 4, 1, 3
Suggest solution to improve and sustain the operation
of the existing water supply scheme
No solution for the moment
Ensure access to safe drinking water &
maintain the existing hand pumps
To change the diesel generator to hydro power.
be complemented by additional
source
Ensure the safety of pipelines
facilitate actual and preventive maintenance,
additional tanker and changing PVC
pipes with iron pipes
Diesel generator replaced by hydro,
additional taps to cope up with population growth, additional
tanker, investors need to have their own
water supply
3, 4, 1, 3
Follow up and monitoring mechanism of operation and
management of the water supply scheme
No monitoring mechanism in
place
Very little practice of monitoring and follow
up
There is some level of monitoring
There is good monitoring and
follow up mechanism
There is very good monitoring and
follow up mechanism
1, 1, 0, 3
The role of KPA administration in the
operation and management of the water supply scheme
They should not involve
They should involve in the management of the water supply system
KPA administration
has to work closely with the water committee
KPA administration take the lead in the management of the
water supply scheme
Coordinate & facilitate operation and maintenance of water supply
4, 2, 2, 3
Copyright © 2013 SciRes. JWARP
A. TADESSE ET AL.
Copyright © 2013 SciRes. JWARP
215
Figure 3. Donkeys and camels are widely used for trans- porting water in the study area. use up to 40 liters per day for household cooking, drink- ing, sanitation and others purposes while 24% consume 41 - 60 liters per day. Similarly, about 24% and 26% consume 61 - 80 liters and 81 - 100 liters per day respec- tively while 15% consume more than 100 liters of water per day. In Ethiopia, about 20 liters of water per person per day and accessible within a range of 0.5 to 1.0 km from a dwelling place is considered as adequate water supply [22]. Any improvement made in safe water access has to be evaluated as per this definition. Taking this definition in to account, Dessalegn [8] has stated that significant proportion of rural households with safe drinking water access will have less chance of securing adequate amount of water that is quite necessary for their
wellbeing. Considering the average house hold number (approximately 5) in the study area, only about 15% may get 20 liters of water per day per person. This indicates that the water supply is inadequate, even though the schemes are accessible at reasonable distances. The find- ings of this study indicated that some of water points are also used for watering livestock. About 23% of the re- spondents use ponds and/or water taps to water their livestock.
4.3. Community Attitude toward Safe Drinking Water, Sanitation and Hygiene
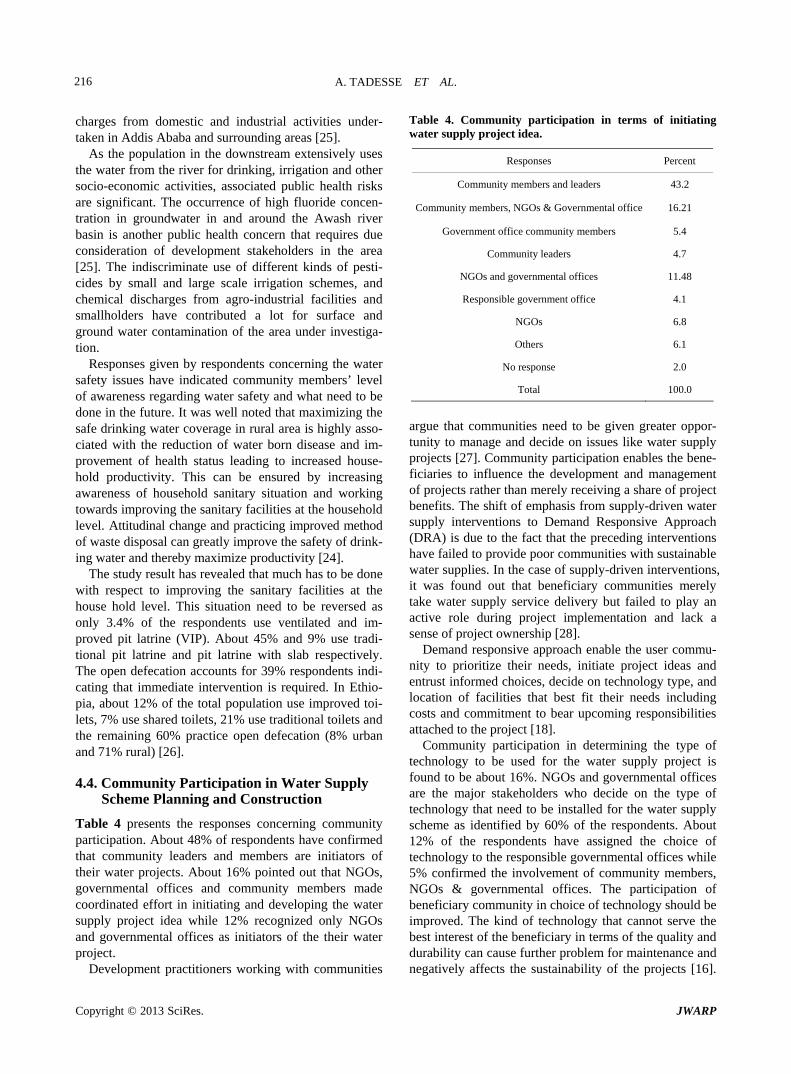
Respondents’ perception towards safe drinking water has got an interesting dimension in terms of understanding their level of awareness concerning hygiene related is- sues. It is also an indication of planning and implementa- tion of hygiene related activities where issues pertaining to water and sanitation are well addressed [23]. Some of factors affecting the safety of water in the communities under consideration have been identified in this study. These include contamination by livestock, bird and wild-life, flooding, human feces, and algae development (see Figure 4). Water sources need to be protected and safe guarded from possible agents of contamination. There are possible health hazards which are associated with exposure of the water supply source to human waste, wild life, livestock and flooding [24]. The safety and quality of drinking water is further in jeopardy as the culture of open defecation has been socially accepted and widely practiced in most of the Ethiopian rural settings and partly in urban areas as well [7].
The study area under consideration is located in Awash River basin which has got complicated water quality problems that calls for special attention to be given by stakeholders involved in various agro-industrial activities. This is due to the fact that Awash River is highly ex-posed to pollution caused by untreated waste-water dis-
Figure 4. Unprotected and broken hand pump structure in Bubissa Kussaye community.
A. TADESSE ET AL. 216
charges from domestic and industrial activities under- taken in Addis Ababa and surrounding areas [25].
As the population in the downstream extensively uses the water from the river for drinking, irrigation and other socio-economic activities, associated public health risks are significant. The occurrence of high fluoride concen- tration in groundwater in and around the Awash river basin is another public health concern that requires due consideration of development stakeholders in the area [25]. The indiscriminate use of different kinds of pesti-cides by small and large scale irrigation schemes, and chemical discharges from agro-industrial facilities and smallholders have contributed a lot for surface and ground water contamination of the area under investiga- tion.
Responses given by respondents concerning the water safety issues have indicated community members’ level of awareness regarding water safety and what need to be done in the future. It was well noted that maximizing the safe drinking water coverage in rural area is highly asso- ciated with the reduction of water born disease and im- provement of health status leading to increased house- hold productivity. This can be ensured by increasing awareness of household sanitary situation and working towards improving the sanitary facilities at the household level. Attitudinal change and practicing improved method of waste disposal can greatly improve the safety of drink- ing water and thereby maximize productivity [24].
The study result has revealed that much has to be done with respect to improving the sanitary facilities at the house hold level. This situation need to be reversed as only 3.4% of the respondents use ventilated and im- proved pit latrine (VIP). About 45% and 9% use tradi- tional pit latrine and pit latrine with slab respectively. The open defecation accounts for 39% respondents indi- cating that immediate intervention is required. In Ethio- pia, about 12% of the total population use improved toi- lets, 7% use shared toilets, 21% use traditional toilets and the remaining 60% practice open defecation (8% urban and 71% rural) [26].
4.4. Community Participation in Water Supply Scheme Planning and Construction
Table 4 presents the responses concerning community participation. About 48% of respondents have confirmed that community leaders and members are initiators of their water projects. About 16% pointed out that NGOs, governmental offices and community members made coordinated effort in initiating and developing the water supply project idea while 12% recognized only NGOs and governmental offices as initiators of the their water project.
Development practitioners working with communities
Table 4. Community participation in terms of initiating water supply project idea.
Responses Percent
Community members and leaders 43.2
Community members, NGOs & Governmental office 16.21
Government office community members 5.4
Community leaders 4.7
NGOs and governmental offices 11.48
Responsible government office 4.1
NGOs 6.8
Others 6.1
No response 2.0
Total 100.0
argue that communities need to be given greater oppor-tunity to manage and decide on issues like water supply projects [27]. Community participation enables the bene- ficiaries to influence the development and management of projects rather than merely receiving a share of project benefits. The shift of emphasis from supply-driven water supply interventions to Demand Responsive Approach (DRA) is due to the fact that the preceding interventions have failed to provide poor communities with sustainable water supplies. In the case of supply-driven interventions, it was found out that beneficiary communities merely take water supply service delivery but failed to play an active role during project implementation and lack a sense of project ownership [28].
Demand responsive approach enable the user commu- nity to prioritize their needs, initiate project ideas and entrust informed choices, decide on technology type, and location of facilities that best fit their needs including costs and commitment to bear upcoming responsibilities attached to the project [18].
Community participation in determining the type of technology to be used for the water supply project is found to be about 16%. NGOs and governmental offices are the major stakeholders who decide on the type of technology that need to be installed for the water supply scheme as identified by 60% of the respondents. About 12% of the respondents have assigned the choice of technology to the responsible governmental offices while 5% confirmed the involvement of community members, NGOs & governmental offices. The participation of beneficiary community in choice of technology should be improved. The kind of technology that cannot serve the best interest of the beneficiary in terms of the quality and durability can cause further problem for maintenance and negatively affects the sustainability of the projects [16].
Copyright © 2013 SciRes. JWARP
A. TADESSE ET AL. 217
It also could increase the transparency in project devel-opment and management.
The community participation goes to the point of con- tributing cash and labor during the prime time of project construction. Once the water supply scheme is in place, stated the respondents as well as participants of the focus group discussion, “the degree of community participation diminishes living aside all the responsibilities on the shoulder of the water committee members”. The water committee took all the responsibilities ranging from col- lecting water fee to operation and maintenance of the water supply scheme without adequate backup from the KPA administration as well as the beneficiary communi- ties. In most cases, the water committee has no reporting mechanism to the community but they communicate to district water and energy office. The communities in-volved in this study participated mainly by providing local materials (wood, stone and sand), labor, cash, by active involvement in community consultation, commu-nity mobilization and acting as a focal person in those dealings with other stakeholders (see Table 5).
The kind of community participations indicated above is the widely practiced form of community participation in Ethiopian context. In general, community willingness to contribute their share of capital costs is crucial to community participation because it acts as an indicator of community commitment to the project [28]. The Com- munity participation could be influenced by combined factors such as the kind of community for whom the pro- ject is initiated, the potential benefits to be generated from the project at the household and community level, and identity of project initiators and stakeholders.
4.5. Tariff Collection and Financial Management
According to the information gathered, there is no stan- dard water tariff structure in place in the study area or elsewhere in other rural areas of the Adama district. As per the sample communities, the amount paid for water supplied varies in accordance with the type of technology Table 5. Types of community participation in water supply scheme construction.
Given responses Percent
Providing labour 7.4
Providing cash & labour 15.5
Providing local materials, labour &cash 29.0
Providing labour and local materials 19.0
Providing local materials (wood, stone and sand) 24.3
Others 4.7
Total 100.0
used for operating the water supply scheme. Those who use boreholes operated by diesel generator pay US$ 0.056 per 50 liters of water while those who use hydro-power pay US$ 0.014 per 50 liters. Those using gravity based water supply pay about US$ 0.17 per 50 liters while those using traditional ponds and hand pumps con-tributes only labor force participating in construction and maintenance.
However, an effective mechanism to administer the water supply tariff in terms of cost sharing practices to cover the ever increasing operation and maintenance cost is crucial for sustained water supply service delivery and benefit over time. This requires a working tariff structure in place that is reasonably framed in order to cope up the ever increasing operation and maintenance cost. The whole issue behind applying appropriate tariff structure is to create a sense of ownership in the community [12] and ensure sustained water supply service over time.
One of the many factors contributing for sustainable rural water supply system is the practice of cost sharing associated with consumers’ payment for water service delivered. It was assumed that users should pay as per the water delivered for their house hold consumption. In this respect, the user community is expected to assess the prevailing costs associated with the operation and main- tenance of the scheme and thereby revising the existing water service fee as per the ever increasing cost of opera- tion. It is well understood that water users are not in a position to finance the entire replacement costs of their water and sanitation services, it is essential to think about cost sharing as one alternative alongside other new fund- ing mechanism [16].
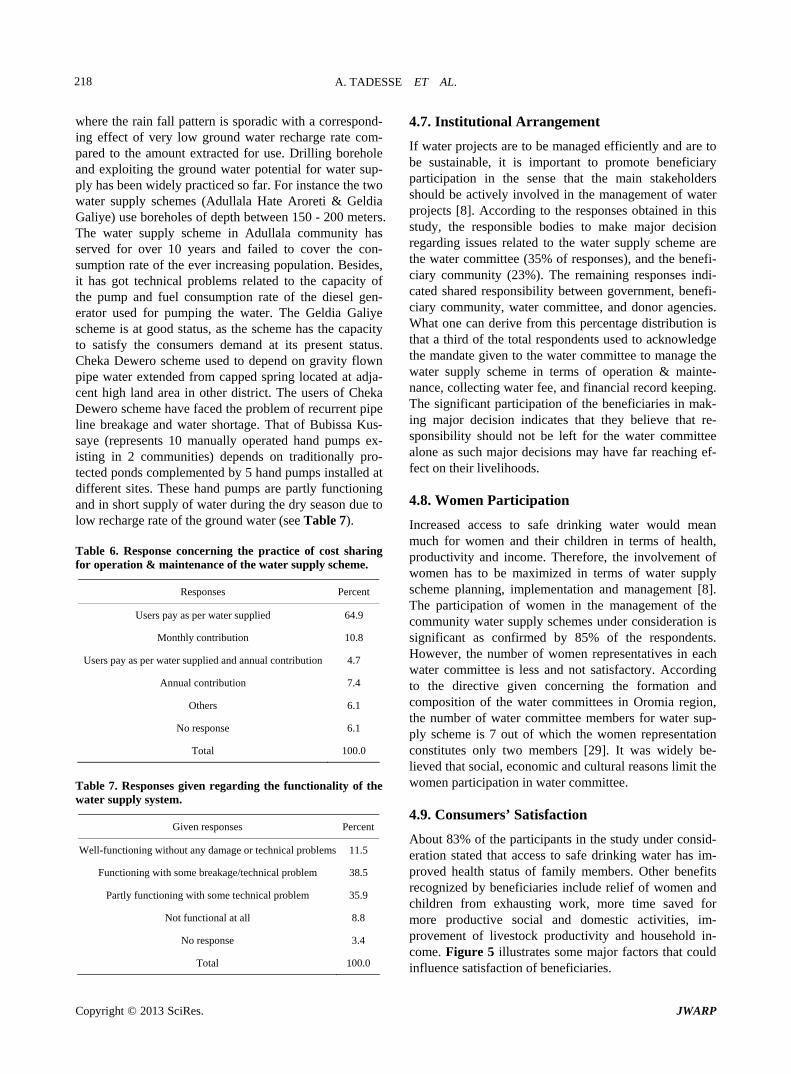
Table 6 indicates that about 65% of the respondents have practiced cost sharing by paying as per water sup- plied. There is growing awareness of the respondents concerning the importance of cost sharing paying the water fee on time. They tend to be well aware of the es-sence of operation and maintenance costs for sustainabil-ity of the service. The principle of user pay has been widely practiced in Adama district and the beneficiary communities are willing to pay as per the water supply service delivered. They beneficiaries believe that the fee will be used for covering operation and maintenance cost and building new water scheme. Building new water schemes is required as about 55% of the sample popula- tion have stated that the water supplied is not sufficient for the growing population.
4.6. Reliability of the Water Supply Schemes
The issue of functionality of the water supply system and seasonal fluctuations is an area that needs to be given greater emphasis. This is due to the fact that Adama dis-trict is geographically located in the rift valley area
Copyright © 2013 SciRes. JWARP
A. TADESSE ET AL. 218
where the rain fall pattern is sporadic with a correspond-ing effect of very low ground water recharge rate com-pared to the amount extracted for use. Drilling borehole and exploiting the ground water potential for water sup-ply has been widely practiced so far. For instance the two water supply schemes (Adullala Hate Aroreti & Geldia Galiye) use boreholes of depth between 150 - 200 meters. The water supply scheme in Adullala community has served for over 10 years and failed to cover the con- sumption rate of the ever increasing population. Besides, it has got technical problems related to the capacity of the pump and fuel consumption rate of the diesel gen-erator used for pumping the water. The Geldia Galiye scheme is at good status, as the scheme has the capacity to satisfy the consumers demand at its present status. Cheka Dewero scheme used to depend on gravity flown pipe water extended from capped spring located at adja-cent high land area in other district. The users of Cheka Dewero scheme have faced the problem of recurrent pipe line breakage and water shortage. That of Bubissa Kus- saye (represents 10 manually operated hand pumps ex- isting in 2 communities) depends on traditionally pro- tected ponds complemented by 5 hand pumps installed at different sites. These hand pumps are partly functioning and in short supply of water during the dry season due to low recharge rate of the ground water (see Table 7). Table 6. Response concerning the practice of cost sharing for operation & maintenance of the water supply scheme.
Responses Percent
Users pay as per water supplied 64.9
Monthly contribution 10.8
Users pay as per water supplied and annual contribution 4.7
Annual contribution 7.4
Others 6.1
No response 6.1
Total 100.0
Table 7. Responses given regarding the functionality of the water supply system.
Given responses Percent
Well-functioning without any damage or technical problems 11.5
Functioning with some breakage/technical problem 38.5
Partly functioning with some technical problem 35.9
Not functional at all 8.8
No response 3.4
Total 100.0
4.7. Institutional Arrangement
If water projects are to be managed efficiently and are to be sustainable, it is important to promote beneficiary participation in the sense that the main stakeholders should be actively involved in the management of water projects [8]. According to the responses obtained in this study, the responsible bodies to make major decision regarding issues related to the water supply scheme are the water committee (35% of responses), and the benefi-ciary community (23%). The remaining responses indi-cated shared responsibility between government, benefi-ciary community, water committee, and donor agencies. What one can derive from this percentage distribution is that a third of the total respondents used to acknowledge the mandate given to the water committee to manage the water supply scheme in terms of operation & mainte- nance, collecting water fee, and financial record keeping. The significant participation of the beneficiaries in mak- ing major decision indicates that they believe that re-sponsibility should not be left for the water committee alone as such major decisions may have far reaching ef- fect on their livelihoods.
4.8. Women Participation
Increased access to safe drinking water would mean much for women and their children in terms of health, productivity and income. Therefore, the involvement of women has to be maximized in terms of water supply scheme planning, implementation and management [8]. The participation of women in the management of the community water supply schemes under consideration is significant as confirmed by 85% of the respondents. However, the number of women representatives in each water committee is less and not satisfactory. According to the directive given concerning the formation and composition of the water committees in Oromia region, the number of water committee members for water sup- ply scheme is 7 out of which the women representation constitutes only two members [29]. It was widely be- lieved that social, economic and cultural reasons limit the women participation in water committee.
4.9. Consumers’ Satisfaction
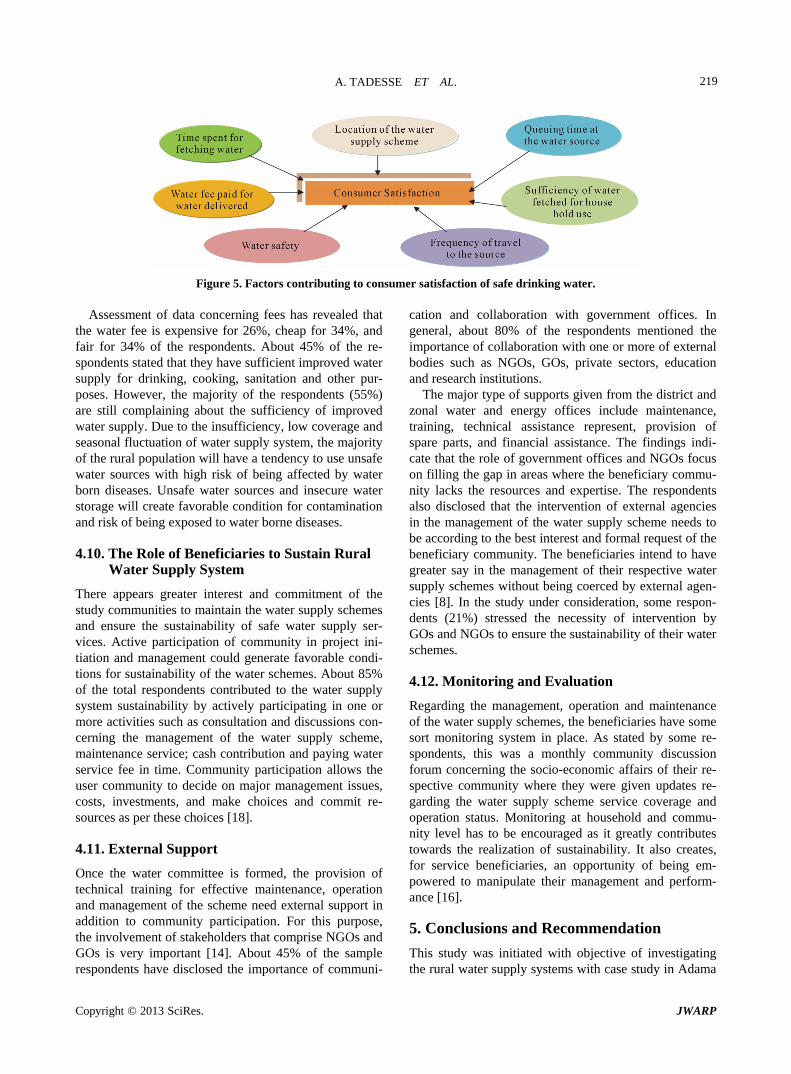
About 83% of the participants in the study under consid-eration stated that access to safe drinking water has im- proved health status of family members. Other benefits recognized by beneficiaries include relief of women and children from exhausting work, more time saved for more productive social and domestic activities, im- provement of livestock productivity and household in- come. Figure 5 illustrates some major factors that could nfluence satisfaction of beneficiaries. i
Copyright © 2013 SciRes. JWARP
A. TADESSE ET AL.
Copyright © 2013 SciRes. JWARP
219
Figure 5. Factors contributing to consumer satisfaction of safe drinking water.
Assessment of data concerning fees has revealed that the water fee is expensive for 26%, cheap for 34%, and fair for 34% of the respondents. About 45% of the re-spondents stated that they have sufficient improved water supply for drinking, cooking, sanitation and other pur-poses. However, the majority of the respondents (55%) are still complaining about the sufficiency of improved water supply. Due to the insufficiency, low coverage and seasonal fluctuation of water supply system, the majority of the rural population will have a tendency to use unsafe water sources with high risk of being affected by water born diseases. Unsafe water sources and insecure water storage will create favorable condition for contamination and risk of being exposed to water borne diseases.
4.10. The Role of Beneficiaries to Sustain Rural Water Supply System
There appears greater interest and commitment of the study communities to maintain the water supply schemes and ensure the sustainability of safe water supply ser- vices. Active participation of community in project ini- tiation and management could generate favorable condi- tions for sustainability of the water schemes. About 85% of the total respondents contributed to the water supply system sustainability by actively participating in one or more activities such as consultation and discussions con- cerning the management of the water supply scheme, maintenance service; cash contribution and paying water service fee in time. Community participation allows the user community to decide on major management issues, costs, investments, and make choices and commit re- sources as per these choices [18].
4.11. External Support
Once the water committee is formed, the provision of technical training for effective maintenance, operation and management of the scheme need external support in addition to community participation. For this purpose, the involvement of stakeholders that comprise NGOs and GOs is very important [14]. About 45% of the sample respondents have disclosed the importance of communi-
cation and collaboration with government offices. In general, about 80% of the respondents mentioned the importance of collaboration with one or more of external bodies such as NGOs, GOs, private sectors, education and research institutions.
The major type of supports given from the district and zonal water and energy offices include maintenance, training, technical assistance represent, provision of spare parts, and financial assistance. The findings indi- cate that the role of government offices and NGOs focus on filling the gap in areas where the beneficiary commu- nity lacks the resources and expertise. The respondents also disclosed that the intervention of external agencies in the management of the water supply scheme needs to be according to the best interest and formal request of the beneficiary community. The beneficiaries intend to have greater say in the management of their respective water supply schemes without being coerced by external agen- cies [8]. In the study under consideration, some respon- dents (21%) stressed the necessity of intervention by GOs and NGOs to ensure the sustainability of their water schemes.
4.12. Monitoring and Evaluation
Regarding the management, operation and maintenance of the water supply schemes, the beneficiaries have some sort monitoring system in place. As stated by some re-spondents, this was a monthly community discussion forum concerning the socio-economic affairs of their re- spective community where they were given updates re- garding the water supply scheme service coverage and operation status. Monitoring at household and commu- nity level has to be encouraged as it greatly contributes towards the realization of sustainability. It also creates, for service beneficiaries, an opportunity of being em- powered to manipulate their management and perform- ance [16].
5. Conclusions and Recommendation
This study was initiated with objective of investigating the rural water supply systems with case study in Adama
A. TADESSE ET AL. 220
area, in central Ethiopia. Both quantitative and qualita- tive data were collected and analyzed. Four sample water schemes were selected and totally 148 representative households were selected and interviewed. Four focus group discussions were also conducted to gather infor- mation necessary for in-depth analysis.
The study assessed issues such as community partici-pation, water committee empowerment, management and governance of water supply schemes, women participa- tion, and functional status of water supply scheme, sani- tation and hygiene issues, external support and monitor- ing system of water supply schemes. The findings indi- cated that it is important to promote beneficiary partici- pation that gives them greater opportunity to manage and decide on issues affecting their water supply systems.
The study confirmed that the community members have participated well in initiating the project idea, op- eration, maintenance and management of their water supply schemes, even though their participation in choice of technology required for the scheme was limited. They participated by providing local materials, labor, cash and ideas during consultative discussions. The water com- mittees are established to manage the water schemes in collaboration with concerned government offices and NGOs to enhance the sustainability of the water supply systems.
The water schemes are located at reasonable distances i.e. less than 2 km in most cases and the time taken for round trip to fetch water from source is known to be less than or equal to 30 minutes in most cases. However, the queuing time is more than one hour in most cases indi- cating that it is a major issue that takes away the labor force necessary for productive activities. Even though the schemes are accessible at reasonable distances, the water supply is inadequate as only about 15% of beneficiaries may get 20 liters of water per day per person.
The cost sharing for operation and maintenance of the water supply scheme is well practiced promoting the financial sustainability of the water supply schemes. However, there are possible health hazards which are associated with exposure of the water supply source to human waste, wild life, livestock and uncontrolled flood- ing. The indiscriminate use of different kinds of pesti-cides by small and large scale irrigation schemes, un- treated waste water and chemical discharges from agro- industrial firms and smallholders could contribute a lot for surface and ground water contamination of the area under investigation. The issue of ensuring environmental sustainability is out of reach as this requires broader ap- proach of environmental management strategies. Sanitary practices in the study area are poor as only about 3.4% have ventilated and improved pit latrine. The rest use either pit latrine with slab/open pit and/or open field defecation.
The beneficiaries understand well the importance of collaboration with external agencies such as government and non-government bodies, and private firms for effec- tive planning, implementing and managing the water schemes.
Based on the findings of this study some recommenda- tions can be made: Providing training for capacity building and refresher
training are important in order to scale up the capacity of the water committees to manage the schemes properly. However, the possibility for refresher train- ing is unthinkable in most cases due to the budget constraint at the district level. Therefore, financial and technical support is required not only at commu- nity level but at district levels.
The study revealed that the supplied safe water by these schemes is insufficient. Therefore new schemes as well as expansion of the existing systems should be planned and implemented.
The study finding has revealed that open defecation is widely practiced in the study area. Therefore, coordi- nated measures should be taken by concerned gov- ernment and non-government bodies to provide im- proved sanitary facilities and appropriate trainings at household level, project level, and community level and district level concerning sanitation and hygiene issues, waste management and protecting water sche- mes from potential contaminators.
The present environmental stress in the Awash River basin affects the quality of drinking water in the study area. For this environmental protection measures has to be taken involving governmental agencies, NGOs and the community at large.
6. Acknowledgements
The authors would like to express their sincere gratitude to Unicef-Ethiopia for financing this study partially. The community members and experts who participated, in one or other way, during data collection and consultation also deserve due acknowledgement.
REFERENCES [1] UNDP, “Ethiopia: 2010 Millennium Development Goals
Report: Trends and Prospects towards Meeting MDG by 2015,” UNDP Ethiopia Office, Addis Ababa, 2010.
[2] WHO and UNICEF, “Progress on Sanitation and Drink- ing-Water 2010 Update,” 2010. http://whqlibdoc.who.int/publications/2010/9789241563956_eng_full_text.pdf
[3] UN World Water Development, “In a Changing World: The United Nations World Water Development Report,” 2009. http://www.unesco.org/water/wwap/wwdr/wwdr3/pdf/WDR 3_Water_in_a_Changing_ World.pdf
Copyright © 2013 SciRes. JWARP
A. TADESSE ET AL.
Copyright © 2013 SciRes. JWARP
221
[4] ADB, “The African Development Bank in Action: Ac- tivities in the Water and Sanitation Sector in Ethiopia; Overview & Key Elements of Interventions,” 2010. http://www.afdb.org/fileadmin/uploads/afdb/Documents/Project-and-Operations/2_AfDB_watsan_ETHIOPIA_Au gust_8_Oct.pdf
[5] World Water Week, “Presentation from the 2010 World Water Week in Stockholm,” 2010. http://www.worldwaterweek.org/documents/WWW_PDF/2010/thursday/T5/2_JMP_latest.pdf
[6] WHO and UNICEF, “A Snapshot of Drinking Water and Sanitation in Africa: A Regional Perspective Based on New Data from the WHO/UNICEF Joint Monitoring Pro- gramme for Water Supply and Sanitation,” 2008. http://www.wssinfo.org/fileadmin/user_upload/resources/ 1251454622-A_Snapshot_of_Drinking_Water_in_Africa_Eng.pdf.
[7] D. Aschalew, “Determinants of Household Participation in Water Source Management: Achefer, Amhara Region, Ethiopia,” MPS Thesis, 2009. http://soilandwater.bee.cornell.edu/research/ international/ docs/Aschalew_THESIS_FOR%20PRINT%20AND%20B OUND.pdf
[8] R. Dessalegn, “Water Resource Development in Ethio- pia,” 1999. http://www.ethiopians.com /Main_FSS_Paper1.htm#rfethio
[9] ADF, “Rural Water Supply and Sanitation Program in Ethiopia: Appraisal Report, Infrastructure Department,” 2005. http://www.afdb.org/fileadmin/uploads/afdb/Documents/Project-and-Operations/ET-2005-135-EN-ADF-BD-WP- REV.1-ETHIOPIA-AR-RWSSP-REV-1
[10] EWRMP, “Ethiopian Water Resource Management Pol- icy,” The Federal Democratic Republic of Ethiopia Min- istry of Water Resources, Addis Ababa, 2001.
[11] J. N. Pretty, “Participatory Learning for Sustainable Ag- riculture,” World Development, Vol. 23, No. 8, 1995, pp. 1247-1263. doi:10.1016/0305-750X(95)00046-F
[12] S. Parry-Jones, R. Reed and B. H. Skinner, “Sustainable Hand Pump Projects in Africa: A Literature Review,” WEDC, Loughborough University, Leicestershire, 2001.
[13] L. Abrams, “Understanding Sustainability of Local Water Services,” 1998. http://www.africanwater.org/ sustainability.htm
[14] S. Jansz, “A Study into Rural Water Supply Sustainability in Niassa Province, Mozambique,” Water Aid, 2011.
[15] Water Aid, “Sustainability Framework,” 2011. http://www.wateraid.org/documents/plugin_documents/sustainability_framework_final.pdf
[16] R. C. Carter, “Study of Sustainability of Water Supply Services in Madagascar,” Water Aid, London, 2010.
[17] P. A. Harvey, R. A. Reed and B. H. Skinner, “Guidelines for Sustainable Hand Pump Projects in Africa,” Interim
Report, WEDC, Leicestershire, 2002.
[18] J. Sara and T. Katz, “Making Rural Water Supply Sus- tainable: Report on the Impact of Project Rules,” UNDP World Bank Water and Sanitation Program, 1997. http://www.wsp.org/sites/wsp.org/files/publications/global_ruralreport.pdf
[19] Oromia Regional State, “Adama District Profile,” 2011. http://oromiyaa.com/index.php?option=com_content&view=article&id=250&Itemid=516
[20] CSA, “Summary and Statistical Report of the 2007 Po- pulation and Housing Census Results of Ethiopia,” Cen- tral Statistical Agency, Addis Ababa, 2008.
[21] N. Mukherjee and C. van Wijk, “Sustainability Planning and Monitoring in Community Water Supply and Sanita- tion,” Water and Sanitation Program, World Bank, IRC International Water and Sanitation Centre, 2003. http://ec.europa.eu/echo/files/evaluation/watsan2005/annex_files/WB/WB1%20-%20Sustainability%20planning%20and%20monitoring.pdf
[22] Ministry of Water Resources, “Ethiopian Water Sector Programme,” The Federal Democratic Republic of Ethio-pia Ministry of Water Resources, Addis Ababa, 2001.
[23] WASH, “Financing Water, Sanitation and Hygiene in Ethiopia: Making Every Drop Count Water, Sanitation and Hygiene for All,” Tear Fund, 2005. http://www.wsscc.org/sites/default/files/publications/tearfund_wsscc_making_every_drop_count_financing_wash_in_ethiopia_2005.pd
[24] NHSSAP, “National Health & Sanitation Strategic Action Plan,” The Federal Democratic Republic of Ethiopia, Mi- nistry of Health, Addis Ababa, 2011.
[25] G. Taddese, “The Water of the Awash River Basin a Fu- ture Challenge to Ethiopia,” 2003. http://www.iwmi.cgiar.org/assessment/files/pdf/publications/WorkingPapers/WaterofAwasBasin.pdf
[26] AMCOW, “Country Status Overview: Ethiopia,” Africa Ministers Council on Water, 2010. http://www.wsp.org/sites/wsp.org/files/publications/CSO-Ethiopia.pdf
[27] D. Narayan, “The Contribution of People’S Participation: Evidence from 121 Rural Water Supply Projects,” Envi- ronmentally Sustainable Development Occasional Paper No.1, World Bank, Washington DC, 1995.
[28] E. D. Breslin, “Demand Response Approach in Practice: Why Sustainability Remains Elusive, Discussion Paper,” Water Aid Mozambique, 2003. http://www.wateraid.org/documents/plugin_documents/elusivesustainability.pdf
[29] OWMERDB, “Amendments of Guidelines for Manage- ment of Water Supply Systems,” Oromia Water, Mineral and Energy Resources Development Bureau, Addis Aba- ba, 2000.