Embed Size (px)
Citation preview

Rural Water and Sanitation Strategy and Investment Plan 2000-2015
Table of Contents
Chapter 1 Background................................................................................................................... 1 1.1 Introduction.......................................................................................................................... 1 1.2 Policy and Legal Framework ............................................................................................... 2 1.3 The National Planning Strategy -Rural Water Supply Programme (RWP) (1991)............... 2 1.4 Uganda National Programme of Action for Children (UNPAC, 1992) ................................. 3 1.5 Poverty Eradication Action Plan (PEAP) ............................................................................. 3 1.6 Other Sector relevent programmes ..................................................................................... 4 1.7 Sector Reform ..................................................................................................................... 4 Chapter 2 Overview of Rural Water and Sanitation Sub-sector..................................................... 6 2.1 Policy and Legal Framework ............................................................................................... 6
2.1.1 The Local Governments Act 1997................................................................................. 6 2.1.2 The Water Statute, 1995............................................................................................... 6 2.1.3 The National Environment Statute, 1995 .................................................................... 11 2.1.4 Other Related Policies and Laws................................................................................ 11
2.2 Institutional Framework ..................................................................................................... 12 2.2.1 Central Government.................................................................................................... 12 2.2.2 Local Governments ..................................................................................................... 13 2.2.3 User Community ......................................................................................................... 13 2.2.4 Private Sector.............................................................................................................. 13 2.2.5 Donors & NGOS.......................................................................................................... 14
2.3 Rural Water and Sanitation Status .................................................................................... 14 2.3.1 Rural Water Coverage ................................................................................................ 14 2.3.2 Water Supply Technology Options.............................................................................. 16 2.3.3 Community Based Maintenance System (CBMS) ...................................................... 17 2.3.4 Water Quality .............................................................................................................. 18 2.3.5 Rural Sanitation Coverage.......................................................................................... 18 2.3.6 Sanitation Technology options.................................................................................... 18
Chapter 3 Investment Plan .......................................................................................................... 20 3.1 Strategy Concept............................................................................................................... 20 3.2 Sector Objectives and Goals ............................................................................................. 21 3.3 Rural Water Supply Investments ....................................................................................... 21
3.3.1 Planning Criteria ......................................................................................................... 21 3.3.2 Unit Capital and Maintenance Costs........................................................................... 22 3.3.3 Technology Mix/Options for Rural Water Systems ..................................................... 22 3.3.4 Population to be Served.............................................................................................. 23 3.3.5 District Level Rural Water Supply Investments ........................................................... 23
3.4 Rural Sanitation Investments............................................................................................. 23 3.4.1 Assumptions ............................................................................................................... 23 3.4.2 Rural Sanitation Investment ........................................................................................ 24
3.5 Sector Investments and milestones................................................................................... 24 Chapter 4 Implementation Strategy ............................................................................................. 28 4.1 Sector Challenges ............................................................................................................. 28 4.2 Sector Investment Financing ............................................................................................. 28
4.2.1 Procurement of Goods and Services .......................................................................... 30 4.3 Roles and Responsibilities ................................................................................................ 30 4.4 Modalities for Capacity Building and Support to enhanced Improved Performance......... 34 4.5 Modalities to Ensure Accountability and Donor Specific Requirements ............................ 39
i
ii
List of Tables
Table 1: Rural Water Facilities by 1986, 1996 and 2000 ............................................................. 14 Table 2: Rural Water Supply Coverage by District....................................................................... 15 Table 3: Water Quality Standards ................................................................................................ 18 Table 4: Service Criteria............................................................................................................... 21 Table 5: Unit Capital and Maintenance Cost................................................................................ 22 Table 6: Summary of Rural Water Supply and Sanitation Investments to 2015 .......................... 25 Table 7: Physical and Investment Milestones .............................................................................. 27 Table 8: Institutional Development Milestones............................................................................. 36
List of Appendixes
Appendix 1 Rural Water and Sanitation Investments by Districts

1
CHAPTER 1 BACKGROUND
1.1 INTRODUCTION
The Uganda population is currently estimated at 22 million, of which only 13% live in the urban areas and the rest (87%) live in rural areas sub-divided into Rural Growth Centers (2000-5000 people) and scattered homesteads (< 2000 people).
Water is a key strategic resource, vital for sustaining life, promoting development and maintaining the environment. Access to clean and safe water and improved sanitation facilities and practices leads to improved health and are essential investments in human capital and therefore have a direct and immediate impact on the quality of life and contributing to long-term social and economic development, thus eventual elimination of poverty in rural areas.
Although Uganda is considered (within the region) as being well endowed with water resources, the country is experiencing water management issues relating to seasonal and spatial variability of water resources, increasing water demand and deteriorating water quality. Rapid population growth; increasing agricultural, urbanization and industrial activities; poor sanitation facilities and habits; and poverty are causing serious depletion and degradation problems of the available water resources in the rural and peri-urban areas.
Provision of safe water supply and sanitation facilities, their proper management and utilization, are necessary conditions for health and economic development. Inaccessibility to safe water supply was reported as one of the ten community priority problems in The Uganda Participatory Poverty Assessment Project (UPPAP, 2000). Poverty was/is partly caused by lack of clean water and poor sanitation because of the resultant disease burden and restricted production. The lack of access to clean water places a heavy workload on women and children who collect it from distant sources and who often have to wait for hours in queues. This practice results in children missing school and women having limited time for agricultural and other productive tasks. Owing to the long distances they travel to collect water, the average water use per capita is half the minimum recommended amount for drinking, cooking and adequate hygiene. Water handling and storage is often unhygienic, resulting in water from a safe source becoming contaminated by the time it is consumed, which limits the achievement of the intended health benefits. Sanitation awareness on the relationship between safe water, hygienic practices, wastes disposal and health remains low. The construction of excreta management and disposal facilities at household; institutions (schools, health facilities, offices etc.); and public places (markets, eating places, parks etc.) is not accorded the deserved priority, often considered an additional expense. The UPPAP (2000) report identified cost of construction, difficult soil types, high water table, lack of digging implements, laziness, ignorance, high mobility of some populations and lack of commitment by local authorities as some of the reasons for failure to construct and maintain latrines. In some cases, proper utilisation of the latrines where they exist is not universal by all members of the community due to various taboos and beliefs.

2
DEVELOPMENTS IN THE SECTOR IN 1990S
1.2 POLICY AND LEGAL FRAMEWORK
A number of policy and legal issues have been sorted out to guide the sub-sector development efforts. The policies, laws and regulations that have been put in place include: The Uganda Water Action Plan (1995) for the Water Resources Management and establishment of Water Policy Committee; The Water Statute (1995), The National Water Policy (1999), Water Resource Regulations (1998)), Waste Discharge Regulations (1998)), the Water Supply Regulations ( 1999) and the Sewerage Regulations (1999), Others include: The Environment Management Statute (1995), the Children Statute (1996), the Land Act (1998), the National Health Policy and Health Sector Strategic Plan (1999), the Local Governments Act (1997), the National Gender Policy (1997) and the Constitution of Uganda (1995).
1.3 THE NATIONAL PLANNING STRATEGY -RURAL WATER SUPPLY PROGRAMME (RWP) (1991)
The RWP was designed in 1991 with support form DANIDA, as a 5-yaer programme up to year 2000. In brief, the programme i) Outlined the demand for water in the rural areas of Uganda, ii) Described the water supply potential of the country iii) Reviewed the technical options for the provision of water to the rural areas. iv) Determined the Investments required to provide 50%, 75% and 100% of the
Rural population with safe water by the year 2000. v) Estimated a realistic level of investments and set a target of 75% coverage by
year 2000. vi) Presented a model for the preparation of district-based plans which will make
he communities full-fledged partners in the planning process.
As may be noted, the current national coverage for rural water supply and sanitation at 47%and 49% respectively still remains among the lowest in the world. A number of constraints have hindered the achievement of the set target of 75% by 2000; Insufficient funding; while the sub-sector required investment of US$ 30 million
annually, only about US$ 15 million was made available during the five years( 1995 to 2000).
Poor coordination; Donors supported individual projects without a common
approach, which led to fragmented interventions, duplication of efforts and misuse of resources by the different sector players.
Low managerial and technical functional capacities at district and sub-county
level, and delayed accountabilities leading to under-utilisation of earmarked resources.
Slow involvement and implementation by the private sector as a result of their
internal managerial and technical deficiencies, coupled with slow district bureaucratic systems.

3
Review of the above factors lead to the realization that it was necessary to undertake reforms so as to increase both the effective use of sector inputs and efficiencies of sector outputs.
1.4 UGANDA NATIONAL PROGRAMME OF ACTION FOR CHILDREN (UNPAC, 1992)
The government of Uganda launched the UNPAC in 1992 as the main policy framework for provision of social services for survival, protection and development of children in the fields of primary health care, clean water and sanitation, primary education and adult literacy, and community care of children. The UNPAC aim was to increase the provision of safe water within less than 1.5 km of the user from 23% to 75% and access to adequate sanitation facilities from 30% to 75% of the population by 2000. The following strategies were employed to achieve the stated goals and objectives; Cost-effectiveness and sustainability criteria in choice of intervention technology, Information, education and communication for effective demand, Promote systems that are financially and institutionally sustainable, Decentralized planning and implementation, Integration and coordination of institutional support, Private sector participation, Strengthening institutional capacity.
1.5 POVERTY ERADICATION ACTION PLAN (PEAP)
Poverty eradication is a fundamental objective of Uganda’s development strategy for the next two decades, wherein government has resolved to reduce the proportion of the population living in absolute poverty to 10% [from 56%(1992) and 44%(1997)] and in relative poverty to 30% by the year 2017. The PEAP(1997, revised 2000) is the guiding framework for the achievement of poverty eradication. It adopts a multisectoral approach, recognising the multi-dimensional nature of poverty and the interlinkages between the influencing factors. Within the context of continuing macro-economic stability and broad-based economic growth, it aims to promote the following; Creating a framework for economic growth and structural transformation, Ensuring good governance and security, Directly increasing the ability of the poor to raise their incomes, Directly increasing the quality of life of the poor.
Implementation of the PEAP is performed under the Medium Term Expenditure Framework (MTEF), which integrates policy-making with expenditure based on strategic priorities and budget constraints. Priorities have been set under the PEAP as rural feeder roads, modernisation of agriculture, implementation of land act, strengthening of rural credit, financial services and rural market infrastructure, rural electrification, primary health care, primary education, water supply and sanitation. Poverty Action Fund [PAF] was created in 1998, in order to channel the additional resources resulting from the debt relief from Highly Indebted Poor Countries [HIPC] initiative and to further mobilise donor funds towards key sectors. Government seeks to improve efficiency and effectiveness, starting with programmes funded by PAF, leading to maximising the delivery of services to the end user. In principle,

4
implementation will be through local government institutions, but where capacity is lacking, PAF can be used to mobilise additional capacity and technical assistance through hiring extra staff, consultants and private firms and purchase of equipment. This is a necessary measure in order to ensure the delivery of services to the end user.
1.6 OTHER SECTOR RELEVENT PROGRAMMES
Vision 2025, the Poverty Eradication Action Plan (1997, revised 2000), Programme for Modernisation of Agriculture (2000)
1.7 SECTOR REFORM In 1998, the Ministry of Water, Lands and Environment through its Directorate of Water Development launched the Water Sector Reform studies comprising four components; (i) Rural Water Supply and Sanitation, (ii) Urban Water Supply and Sanitation, (iii) Water for Production, and (iv) Water Resources Management. This was in response to the need for a holistic approach, common strategies, and concerted efforts involving all partners, including the private sector, to participate in the sector development. The long-term objective of the rural water supply and sanitation sub-sector reform is to ensure that services are provided and managed with increased performance and cost effectiveness, and to decrease the governments burden while maintaining the government’s commitment to sustainability and equitable development in the rural areas. The reform study process involved reviews of policy and legal documents, field investigations in 10 selected districts (Rukingiri, Ntungamo, Masaka, Hoima, Arua, Apac, Kamuli, Mukono, Kotido and Mbale) and intensive consultations with major stakeholders in central government, local governments, development partners and NGOs through meetings and consultative workshops. In all, 13 consultative meetings were held with the Study Team and DWD, 8 Regional Consultative workshops (2 in each region) at different stages of the study, and culminating in 2 National workshops held in July and November 1999. The study has come up with district specific strategic plans, and made recommendations on investment needs, cost recovery, operation and maintenance aspects, financing arrangements, institutional and management issues. The Rural Water and Sanitation reform study has been completed with the following major outcomes: Review of the institutional framework involving all partners/stakeholders including
the private sector in implementation of the sector activities. The rural water and sanitation strategy for the sub-sector, ensuring that policies,
legislation and management/institutional roles are incorporated as appropriate and applying a holistic approach and common strategies.
Sector development and investment plans to increase coverage of rural water
supply and sanitation to 95-100% by 2015.
The Government of Uganda led by the Ministry of Water, Lands and Environment and in partnership with all relevant stakeholders has developed the Rural Water Supply and Sanitation Strategy and Investment Plan (2000-2015). It is intended to operationalise the National Water Policy as a broad strategic, sector-wide framework in line with Governments decentralisation policy.

5
MWLE has began implementation of some of the recommendations of the Rural Water Supply and Sanitation sub-sector reform recommendations beginning with FY 2000/2001. These include: • Sector wide approach to planning (SWAP) for improved coordination and
collaboration of all stakeholders at national, district, sub-county and community levels. This has laid the foundation for merging all existing projects into one “Umbrella Programme” with agreed common approaches and methodologies to planning, funding, implementation, monitoring and accountability.
• Sector planning and management capacity building through strengthening the
District Water Offices and provision of technical assistance through Technical Support Units.
Strengthening decentralised planning and implementation through District Annual
Workplans and Budgets (the Local Government Budget Framework process), issuing of Planning and Operational Guidelines for District Rural Water Supply and Sanitation Development Conditional Grant, agreement on priority interventions through Letters of Understanding (LoUs) and provision of funds for approved activities as District Rural Water and Sanitation Development Conditional Grant.
• Promotion and engagement of additional stakeholders (the private sector, NGOs,
CBOs, etc) for accelerated implementation. This Rural Water and Sanitation Strategy and Investment Plan is Governments programme aimed at poverty eradication through the provision and sustainable use of water and sanitation facilities. The Government of Uganda is taking major steps to rationalise water resources management and the delivery of water and sanitation services, by this strategic Action Plan

6
CHAPTER 2 OVERVIEW OF RURAL WATER AND SANITATION SUB-SECTOR
Although Uganda is considered as being well endowed with water resources, the country is experiencing water management issues relating to seasonal and spatial variability of water resources, increasing water demand and deteriorating water quality. Rapid population growth; increased agricultural, urbanization and industrial activities; poverty in the rural and peri-urban areas, and poor sanitation facilities and habits are causing serious depletion and degradation of the available water resources. There are increasingly cases of water quality degradation caused by both natural and human factors. For example, the deterioration of he water quality of Lake Victoria attributed to the direct industrial and municipal waste discharges, the poor agricultural and sanitation practices in the lake basin is a cause of great concern. Uganda is interested in securing her equitable share of the water resources and ensuring good quality water is maintained for sustainable use. It is strongly recommended that support to rural water and sanitation programme should complement and strengthen the efforts in water resources, land and environment management.
2.1 POLICY AND LEGAL FRAMEWORK
Policy and legal framework for managing the sector are now in place. The existing Policies and Laws represent a comprehensive regulatory framework for the management of the rural water and sanitation sub sector. There are a number of other legal documents and policies that help define a general framework and determine priorities for sub-sector development. Most notably these include the Local Governments Act (1997), the Water Statute (1995) and the National Water Policy.
2.1.1 The Local Governments Act 1997
In conformity with the constitution, the Local Governments Act (1997) was enacted and specify functions and services for which central government is responsible, those for district councils, those for urban councils and those to be devolved by the district council to lower government councils. District Local Governments are now responsible for the provision and maintenance of water supplies in liaison with the Ministry responsible for water, where applicable. The Districts are also responsible for Environmental sanitation. The RWSS programme aims to strengthen and support such structures and the systems they use to provide and manage services; in particular the process of developing, implementing and monitoring District Development Plans.
2.1.2 The Water Statute, 1995
The Water Statute was enacted in 1995 in line with the principles from the Water Action Plan(WAP) to:
"... provide for the use, protection and management of water resources and supply; to provide for the constitution of water and sewerage authorities, and to facilitate the devolution of water supply and sewerage undertakings". The main objectives of the statute are:-

7
(a) to promote the rational management and use of the waters of Uganda by: -
(i) the progressive introduction and application of appropriate standards and
techniques for the investigation, use, control, protection, management and administration of water resources;
(ii) the co-ordination of all public and private activities which may influence the quality, quantity, distribution, use or management of water resources;
(iii) the co-ordination, allocation and delegation of responsibilities among Ministers and public authorities for the investigation, use, control, protection, management or administration of water resources;
(b) to promote the provision of a clean, safe and sufficient supply of water for
domestic purposes to all persons;
(c) to allow for the orderly development and use of water resources for purposes other than domestic use, such as the watering of stock, irrigation and agriculture, industrial, commercial and mining uses, energy, navigation, fishing, preservation of flora and fauna and recreation in ways which minimises harmful effects to the environment;
(d) to control pollution and to promote the safe storage treatment, discharge and
disposal of waste which may pollute water or otherwise harm the environment and human health.
The statute defines the rights in water and water administration vested in Government, the Water Policy Committee (constitution and functions), water resources planning tools (Water Action Plan), parameters affecting hydraulic works and uses of water, water and waste discharge permits.
The statute also defines the mode of water supply and sewerage emphasizing the concept of service delivery using Water and Sanitation Authorities, Water User Groups and Water User Associations.
In particular, the responsibilities of the Directorate of Water Development are: to act as Secretariat for the Water Policy Committee, Water Resources investigation, issue permits for construction and operation of works, abstraction of water and discharge of water, maintain a register of permits, approve tariffs proposed by Water User Groups, supervise Water and Sanitation Committees and Water and Sanitation Associations. The Directorate of Water Development of the Ministry of Water, Lands and Environment is there to develop policy, set standards and inspect, monitor, offer technical advice, support supervision and training of the Local Governments in under taking the water and sanitation sector services.
3.1.3 The National Water Policy
The National Water Policy promotes a new integrated approach to water management to guide the allocation of water and the associated investments. This new approach is based on the continuing recognition of the social value of water, while at the same time giving much more attention to the economic value of water.
The water policy is based on the following six guiding principles
• Integrated management of water resources and waste to protect the environment and safeguard health.
• An integrated approach with full participation of women.

8
• Community management of services • Financial viability of public utilities • Provision of services through demand driven approaches, where users are fully
involved and contribute to costs so as to promote ownership.
The policy document sets the stage for water resources management and guides development efforts aimed at improving water supply and sanitation in Uganda. To a large extent, the policies reflect the socio-economic, development and financial fabric prevailing in present-day Uganda, but with foresight to the future
The Water Policy outlines the strategy under five main headings:
1. Technology and Service Provision 2. Financing, Subsidies and tariffs 3. Management and Sustainability Aspects 4. Private Sector Participation 5. Co-ordination and Collaboration
Technology and Service Provision
The majority of hand pumps in use around the Country are the U2 and U3 type which have been developed from Indian prototypes taking into account the local conditions. The stocking and availability of spare parts is therefore facilitated through this technology “standardization”.
Financing, Subsidies and Tariffs
Funding of rural water supplies, sanitation facilities and health education should receive an increased share of public funding to reflect its national priority.
Monitoring of public sector funding should ensure that equitable and effective use is made of resources in accordance with politically defined priorities. Thus the public investments and subsidies in the sector should be clearly monitored as a share of the national and local government budgets. The share of funding for software activities – for health and sanitation education and community mobilisation should be clearly monitored. The per capita investments and subsidies for both urban and rural water supplies and sanitation should be monitored and compared to ensure that political priorities are adhered to nationally and locally.
Guidelines for Community contributions towards construction should be based on technology choices and be of a national character rather than project specific as present. RUWASA, WES and NGOs have experimented with various approaches.
One common approach should apply for cash contributions from the beneficiary communities. The present guidelines from RUWASA could be adopted nationally:
Technology Community Cash Contribution
(Ushs) Bore hole 180,000 Spring protection 45,000 Gravity flow Scheme 45,000 (per tap) Borehole Rehabilitation 45,000
These contributions should be viewed as the absolute minimum.
The communities are required to raise the contributions before construction starts as an element of a demand driven approach.

9
In very rare cases Local Authorities may decide to assist communities that cannot afford the cash contributions. This is allowed only in extreme situations, otherwise community-based operation and maintenance in the future will be jeopardized. However, if a community genuinely cannot afford the outlined contributions either in cash or in kind, or, unless the project is truly not the community’s priority, it must be recognized that the operation and maintenance of the scheme is also beyond their financial capability. In such a case it becomes a “social mission” on the part of Government or local government to intervene to bring such disadvantaged community up to the minimum national sector standard.
• Cash contributions should be reviewed as the financial standing of rural
communities improves and as a reflection of general cost increases. However, changes in rates should be uniform and not occur too often. The contributions and associated guidelines should be widely communicated.
• Operation and maintenance costs for rural water supplies should be fully borne
by communities although Central and local governments may have to subsidise certain costly repairs. However, full cost recovery of capital costs should not be expected from communities. Clear national guidelines should be instituted to this effect in order to avoid confusion and community expectations regarding full government responsibilities for operation and maintenance. This is further elaborated in the section below.
Management and Sustainability Aspects
The Water Policy discusses management and sustainability aspects under three headings:
1. Capacity building, 2. Operation and maintenance and 3. Sustainability and ownership,
Capacity Building
The Policy outline of capacity building of all relevant stakeholders is to be fully supported: • Capacity building at central level to take into account the changing roles of Government
under Decentralisation, • Capacity building at District and Sub-county level to enhance their role in planning,
monitoring and technical service delivery, • Users to be empowered to effectively participate in planning and construction activities
as well as being fully responsible for operation and maintenance, • Special emphasis be given to training of women to ensure female user participation in
planning and management. • Facilitation of increased and improved private sector involvement in rural water and
sanitation activities.
Operation and Maintenence
The principles of the Community Based Maintenance System are generally clear. Thus for rural water supplies:
• Users are in principle responsible for operation and maintenance of facilities,
10
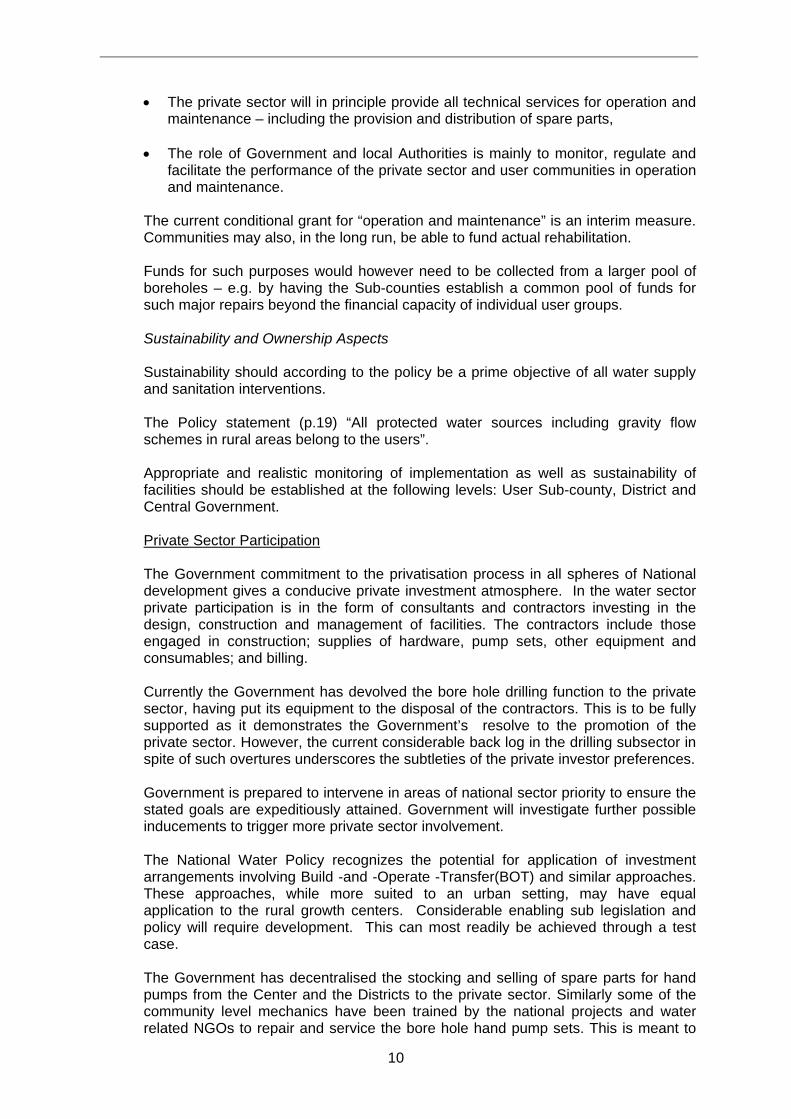
• The private sector will in principle provide all technical services for operation and
maintenance – including the provision and distribution of spare parts, • The role of Government and local Authorities is mainly to monitor, regulate and
facilitate the performance of the private sector and user communities in operation and maintenance.
The current conditional grant for “operation and maintenance” is an interim measure. Communities may also, in the long run, be able to fund actual rehabilitation.
Funds for such purposes would however need to be collected from a larger pool of boreholes – e.g. by having the Sub-counties establish a common pool of funds for such major repairs beyond the financial capacity of individual user groups.
Sustainability and Ownership Aspects
Sustainability should according to the policy be a prime objective of all water supply and sanitation interventions.
The Policy statement (p.19) “All protected water sources including gravity flow schemes in rural areas belong to the users”.
Appropriate and realistic monitoring of implementation as well as sustainability of facilities should be established at the following levels: User Sub-county, District and Central Government.
Private Sector Participation
The Government commitment to the privatisation process in all spheres of National development gives a conducive private investment atmosphere. In the water sector private participation is in the form of consultants and contractors investing in the design, construction and management of facilities. The contractors include those engaged in construction; supplies of hardware, pump sets, other equipment and consumables; and billing. Currently the Government has devolved the bore hole drilling function to the private sector, having put its equipment to the disposal of the contractors. This is to be fully supported as it demonstrates the Government’s resolve to the promotion of the private sector. However, the current considerable back log in the drilling subsector in spite of such overtures underscores the subtleties of the private investor preferences. Government is prepared to intervene in areas of national sector priority to ensure the stated goals are expeditiously attained. Government will investigate further possible inducements to trigger more private sector involvement. The National Water Policy recognizes the potential for application of investment arrangements involving Build -and -Operate -Transfer(BOT) and similar approaches. These approaches, while more suited to an urban setting, may have equal application to the rural growth centers. Considerable enabling sub legislation and policy will require development. This can most readily be achieved through a test case. The Government has decentralised the stocking and selling of spare parts for hand pumps from the Center and the Districts to the private sector. Similarly some of the community level mechanics have been trained by the national projects and water related NGOs to repair and service the bore hole hand pump sets. This is meant to

11
ensure sustainability in water supply. However, the low consumption levels of spare parts coupled with the robustness of the pumps(leading to long service life) tends to discourage interested private sector investors.
Co-ordination and Collaboration
The National Water Policy for Uganda identifies the need to enhance co-ordination and collaboration between the water and sanitation sub-sectors, so that they both adequately address environmental health and sanitation issues. This is done through:
• The Water Policy Committee (WPC) and Inter-Ministerial Steering Committee
(IMSC) at present to carry out co-ordination, especially for policy setting, of the rural water and sanitation sector.
• Strengthen the Policy Setting role of the IMSC: – this would ideally require
formalisation of its composition and functions in the Water Statute or other relevant legislation. The membership should furthermore include: i) Representation of local authorities. The best option would be to include
representation of the Uganda Local Authorities Association rather than e.g. picking a particular LC Chairman for this purpose.
ii) Representation of the private sector (Private contractors and consultants through their relevant associations).
iii) Representation of NGOs active in the sector.
2.1.3 The National Environment Statute, 1995 The objective of the National Environmental Statute is:
".. to provide for sustainable management of the environment; to establish an Authority as a coordinating, monitoring and supervisory body..."
As lead agency in the water sector, the Directorate of Water Development has a shared responsibility with the National Environmental Management Authority (NEMA) for water quality standards, standards for discharge of effluent into water, limits on the uses of lakes and rivers, management of riverbanks and lake shores, restriction on the use of wetlands, and management of wetlands
The above legal frameworks provide for the decentralization of functions to the lowest possible level. For example the Water Statute provide for decentralization by devolution of functions to the water user groups, water associations and water authorities, while the local Government Act decentralized functions to Administrative Units (District Towns and Sub counties).
2.1.4 Other Related Policies and Laws
National Health Policy (1999)
The policy is given to addressing the main contributors to the burden of disease, which includes malaria, HIV, TB and diarrhea disease. Government places greater emphasis on rural areas where the population has low access to safe water and low sanitation coverage. This is to be achieved through the promotion of personal, household, institutional, community sanitation and hygiene.

12
National Gender Policy (1999)
The affirmative action by Government in support of gender equity in the national socio economic activities has encouraged women to play a major role in decision making with respect to issues that affect them most such as water and sanitation quality and quantity. On the basis of this policy, the level, in terms of percentage of the total membership, of women participation in decision-making organs has been nationally agreed and is respected. With respect to water, the National Gender Policy recognizes women and children as the main carriers and users of water.
The current regulatory framework requires review in order to harmonize the existing laws and regulatory functions; to allow greater participation of all stakeholders, including the private sector, to improve the delivery of sector services. The Local Government Act, the Water Statue, the NEMA statute, and many other laws need to be harmonized.
2.2 INSTITUTIONAL FRAMEWORK
The sector institutional framework, as presented hereafter, are in place to facilitate the planning, implementation and monitoring of the water sector programmes. Therefore, emphasis is directed at strengthening the roles, strengthening capacity and co-ordination and collaboration for improved performance and results-oriented management and development of the water sector programmes at all levels for the benefit of target Ugandans.
2.2.1 Central Government
The Central Government is responsible for strategic planning, coordination, quality assurance and technical assistance systems, including collaboration efforts with donors/ NGOs and the private sector.
In addition the center has responsibilities as spelt out in the Local Governments Act (1997) – article 97 and 98, where the line ministries shall inspect, monitor and shall where necessary, offer technical, support and training to ensure the implementation of national policies and adherence to performance standards by the Local governments.
(i) Ministry of Water, Lands and Environment
Ministry of Water, Lands and Environment (MWLE), through the Directorate of Water Development (DWD) is the lead agency for rural water supplies and sanitation sub sector. The Ministry co-ordinates sector activities. The involvement of stakeholders has been promoted by Inter-ministerial Steering Committee (IMSC) and Technical Committees. MWLE also houses the Land and Environment Directorates.
(ii) The Ministry of Finance, Planning and Economic Development
The Ministry of Finance, Planning and Economic Development (MoFPED) has the role of allocating funds, general mobilisation of funding, co-ordination of donor inputs and the co-ordination of annual planning and budget cycles.

13
(iii) Ministry of Local Government
Ministry of Local Government has the mandate to establish, develop and facilitate the management of self sustaining, efficient and effective decentralised government systems capable of delivering the required services to the people, in order to foster good governance and integrated social and economic development.
iv) Ministry of Health
Ministry of Health has the responsibility for policy on hygiene promotion and sanitation development.
v) The Ministry of Gender, Labour and Social Development
The Ministry of Gender, Labour and Social Development is responsible for initiating and co-ordinating gender responsive development and community mobilisation.
vi) Ministry of Agriculture, Animal Industry, and Fisheries (MAAIF)
The Ministry of Agriculture, Animal Industry and Fisheries is responsible for the development of agriculture, animal husbandry and fisheries and is a major stakeholder in the availability and utilisation of water for agriculture production.
2.2.2 Local Governments
In the Sector, under the Local Governments Act (1995), Local Governments (districts, sub counties and urban authorities) have been charged with responsibilities for the provision and management of rural water services, in liaison with the Ministry responsible for water. The Local Governments responsibilities also include rural sanitation services and community mobilisation. Local Governments now carry out planning, budgeting and resource allocation, community mobilization and ensure their effective participation and involvement, follow up implementation by private sector and support the operation and maintenance of water services, monitoring prompt accountability and reporting. However, the capacities of most Local Governments are still inadequate to undertake these tasks.
2.2.3 User Community The planning, implementation and sustainability of water and sanitation activities are heavily dependent on participation of the user communities. These require an organised community to enable full participation in planning and implementation stages through to operation and maintenance (O&M) of the facilities. The Water Statute provides for the formation of Water and Sanitation Committees, Water User Groups, Water User Association and Water and Sewerage Authorities as community level organisations/institutions that will ensure proper management of the facilities and sustainability.
2.2.4 Private Sector Government of Uganda is firmly committed to the privatisation process. Involvement of the private sector, which is considered to represent a viable resource for design,

14
construction, operation, maintenance, training, capacity- building and commercial services has been promoted. The private sector is also being considered for mobilizing resources and financing for sub-sector development in the on-going Water Sector Reform studies.
2.2.5 Donors & NGOS The country has received considerable donor support for funding the development budget including rural water and sanitation. The following donors have played a key role in promoting national rural water and sanitation programmes: DANIDA UNICEF EU AUSTRIA GTZ NETHERLANDS SIDA DFID JICA The donor support has taken several forms including technical assistance in which capacity building has been implemented at various local and national government levels, sharing of best practices, as well as funds for program implementation. In the rural water and sanitation country programs the donors are the major source of funding. In the period 1995 to 2002 the donors will have invested over US$ 100 million. As well, the donors have played a key role in contributing 80 – 90% of costs for policy development and capacity building. NGOs and CBOs are mainly involved in point source protection and in borehole drilling and rehabilitation especially for institutions and in the emergency areas. Apart from these hardware tasks the NGOs are very instrumental in developing and implementing community mobilisation programs. NGO / CBO inputs is a component which is increasingly being emphasised by donors in the area of mobilisation and actual project implementation. There are over 50 NGOs and CBOs currently undertaking water and sanitation activities in Uganda. Major NGOs active in the sector include: Italian Institute for Co-operation and Development (IICD), Associazione Centro Aiuti Voluntari (ACAV),Plan International,World Vision International, CARE,VEDCO ,Associazione Voluntari per il Servizio Internazionale (AVSI), Water Aid, Busoga Trust, and Action Aid.
2.3 RURAL WATER AND SANITATION STATUS Provision of safe water supply and sanitation facilities, their proper management and utilization, are essential for health and economic development.
2.3.1 Rural Water Coverage
The water facilities in place by 1986, 1996 and 2000 are as shown in the table below:
Table 1: Rural Water Facilities by 1986, 1996 and 2000
1986
1996
2000 Achievement Between 1986 and 2000
Protected Springs 1,000 15,081 17,783 16,783Deep Boreholes 5,000 12,982 16,967 11,967Shallow Wells - 1,364 3,284 3,284GFS (public taps) 2 (15) 67 (640) 96 (2,945) 94 (2,940)Population Served 1,440,000 6,191,857 9,344,614 7,904,614Coverage 12% 39.4% 50% 38%

15
The following Table presents the current level of rural water supply coverage based on recorded systems in each District and also projections of the population to be served over the design period assuming the desirable 95/100% coverage. The table shows that 11 Districts currently have rural water supply coverage of 30% or below, from a low of 14% (Pallisa), to a high of 84% (Kasese). These coverage statistics put Ugandans among the least served in the world.
Table 2: Rural Water Supply Coverage by District
Districts Estimated Population
2000
Population Served,
2000
% Population
Served
Estimated Population
2015
Population to be Served by
2015 Apac 560,184 268,888 48% 719,960 451,071 Arua 680,314 374,177 55% 959,660 585,483 Yumbe 131,590 93,430 71% 185,623 92,193Hoima 268,893 209,737 78% 412,127 202,391 Kamuli 637,160 324,952 51% 910,890 585,939 Kotido 239,238 162,682 68% 323,015 160,334 Masaka 816,373 220,421 27% 1,076,189 855,768 Mbale 599,205 227,700 38% 872,921 645,220Sironko 286,075 105,848 37% 416,754 310,906Mukono 679,161 319,206 47% 1,006,912 687,706Kayunga 286,946 137,734 48% 425,421 287,687Ntungamo 358,960 251,272 70% 618,894 367,622 Rukungiri 320,072 195,244 61% 518,633 323,389Kanungu 232,232 169,529 73% 376,300 206,771Bundibugyo 164,539 106,950 65% 280,450 173,499 Bushenyi 830,808 423,712 51% 1,333,294 909,582 Gulu 416,560 224,942 54% 635,852 410,909 Bugiri 303,009 69,692 23% 397,860 328,168 Iganga 594,962 196,337 33% 780,954 584,617Mayunge 274,553 90,602 33% 360,381 269,779Jinja 318,360 124,160 39% 502,684 378,524 Kabale 585,282 316,052 54% 1,005,842 689,789 Kabarole 336,531 225,476 67% 441,734 216,258Kyenjonjo 312,329 159,288 51% 409,967 250,679Kamwenge 254,374 195,868 77% 333,894 138,026Kalangala 18,912 7,187 38% 21,340 14,154 Kapchorwa 153,243 33,713 22% 214,250 180,537 Kasese 422,959 355,286 84% 583,942 228,657 Kibaale 266,000 164,920 62% 321,124 156,204 Kiboga 178,600 94,658 53% 233,890 139,232 Kisoro 254,673 86,589 34% 395,913 309,325 Kitgum 225,114 110,306 49% 347,162 236,856Pader 251,400 123,186 49% 387,699 264,513Kumi 341,374 102,412 30% 582,288 479,875 Lira 615,429 301,560 49% 847,714 546,154 Nakasongola 141,638 36,826 26% 218,825 181,999 Luwero 461,607 249,268 54% 707,836 458,568 Sembabule 182,283 29,165 16% 240,305 211,140 Masindi 350,747 182,389 52% 535,368 352,979Mbarara 972,068 495,755 51% 1,373,245 877,490 Moroto 141,041 114,243 81% 265,986 151,742Nakapiripirit 124,356 101,972 82% 234,520 132,548Moyo 100,296 21,062 21% 131,494 110,432 Adjumani 105,206 61,019 58% 137,918 76,898 Mpigi 433,155 112,620 26% 586,408 473,788Wakiso 655,502 203,206 31% 887,423 684,217Mubende 565,518 220,552 39% 652,632 432,080

16
Districts Estimated Population
2000
Population Served,
2000
% Population
Served
Estimated Population
2015
Population to be Served by
2015 Nebbi 423,123 291,955 69% 623,108 331,153 Pallisa 473,611 66,306 14% 670,962 604,656 Rakai 455,705 154,940 34% 547,713 392,773 Katakwi 265,206 95,474 36% 489,000 393,526 Soroti 299,606 173,771 58% 552,160 378,389Kaberamaido 149,603 76,298 51% 275,711 199,413Busia 164,745 49,424 30% 230,914 181,490 Tororo 506,661 207,731 41% 724,370 516,639 Total 20,189,091 9,519,692 47% 29,329,446 19,811,752
The average water use per capita is half the minimum recommended amount, due to long distance to water point. The burden of water collection falls mainly on women and girls. Water handling and storage is often unhygienic, resulting in water from a safe source becoming contaminated by the time it is consumed. Inadequate use of services limits the achievement of intended health benefits.
2.3.2 Water Supply Technology Options
(i) Protected Springs: Protected springs offer the lowest cost of approximately per
capita, serving 150 individuals. Because of their cheap cost, several thousand springs have been protected and put into use through the 1990’s, to the extent where this resource is now almost fully utilized in the areas where they are prevalent and accessible. Where they still exist, they will be considered as priority.
(ii) Boreholes: Drilled boreholes are and will continue to be the main option for rural
water supply, particularly over the long term and will substitute for the shortfall in cheaper supply options. The main aquifer in Uganda is within crystalline basement rocks and regolithic overburden but variations in the factors affecting aquifer occurrence – bedrock lithology, mineralogy and structure, geomorphology, relief and rainfall are reflected in aquifer occurrence. In the past these variations caused high rates of unsuccessful or inadequate boreholes. However, recent hydrogeological and geophysical techniques utilising aerial photography, topographic map interpretation, side looking airborne radar (SLAR) and satelite imagery as well as ground surveys using electro-magnetic, gravity and resistivity VES equipment has greatly reduced the number of failures and success rates are now in the 70 to 90% range in most areas.
Acceptable yield from boreholes should be in the order of 900 liters per hour, to cater for the estimated 300 people per installation and discharge rate of a deep borehole hand pump such as the U2, where the pumping level is less than 50 meters.
The majority of hand pumps in use around the country are the U2 and U3 type (developed from Indian prototypes). The faster rate of wear and tear of some of the pump components, due to the aggressive nature of water in some areas of the country, shall be assessed and suitable parts adopted.

17
(iii) Shallow Wells: Shallow or dug wells offer low cost and generally reliable source for water supply. Current practice is to use pre-cast concrete rings, a caisson method of construction and 2-3 meters penetration below the water table with the bottom two rings perforated. Depths up to 10 meters are common. Similar siting techniques as for boreholes are recommended.
(iv) Gravity Flow Supply: Gravity flow systems are relatively expensive to construct,
however, they are also relatively cheap to maintain and for this reason and in areas where the population is relatively dense, GFS can provide an acceptable water supply.
(v) Valley Tanks/ Dams: In areas where boreholes and shallow wells are not feasible,
valley Tanks/dams can be considered to provide an acceptable domestic water source provided water is abstracted via a infiltration gallery to shallow well with hand pump constructed adjacent to the dam. Connection to the dam through an infiltration gallery may be required. For estimating purposes it is assumed a valley dam will supply sufficient water for 600 people, and require that two shallow wells be constructed adjacent to the dam. The cost for the valley dam with shallow wells represents the most expensive water supply option per person and for this reason will only be considered where there are no other viable water options.
(vi) Other Water Supply Sources:Other water supply sources that are acceptable
from a quality basis include rainwater harvesting systems , but are usually limited to individual households. Rainwater harvesting systems for community will be considered where there are no other viable water options. The yield from these sources is expected to be relatively small and it is estimated they could serve a maximum of 300 people
(vii) Piped Water Supply Systems:For communities of over 2000 population , in the
Rural Growth Center, it may be prudent and more economical in the long run to consider a limited mechanized piped-water system. Rural growth centers have been defined as those communities where the population is between 2000 and 5000. The number of growth centers are projected to increase to approximately 670 by 2015. A typical mechanized system might consist of a borehole (s) with motorized pumps as the supply; reticulation piping of various sizes; storage reservoir (s) and standpipes for distribution.
2.3.3 Community Based Maintenance System (CBMS)
The sector has adopted the concept of Community Based Maintenance System (CBMS) where the operation and maintenance costs for rural water supplies are to be fully borne by communities. Local and the Central Government are to provide backup support and subsidize rehabilitation and costly repairs.
Major rehabilitation (e.g. re-drilling) may be beyond the scope of most communities given the poverty levels and present arrangements of fund collections. Government shall support the cost of major rehabilitation of water facilities where such costs are beyond the ability of the community to meet.
Communities shall however, in the medium to long term pay major contributions for de-silting or the recovery of lost pipes. In the long term, it is envisaged that communities will be able to fund major rehabilitation through collective effort, by remitting a percentage of community contributions for O&M to a common pool at the Sub-county.

18
2.3.4 Water Quality
Potable water should ideally meet WHO minimum quality standards. However, for rural areas, the National Interim Rural Water Quality Guidelines (1995) were established as the maximum permissible standard. These Guidelines have been in use for over 5 years now and their impact/effect on the water quality will be reviewed prior to effecting a National Standard. The following Table provides the permissible standards.
Table 3: Water Quality Standards
Parameter Acceptable Standard
Parameter Acceptable Standard
Min. /Max. pH 6.5 – 8.5 Manganese 0.1 – 0.5 mg/l Total dissolved solids <1000 mg/l Arsenic 0.01 mg/l Total hardness 500 mg/l Cadmium 0.01 mg/l Chlorides 250 mg/l Cyanide 0.01 mg/l Sulphate 200 mg/l Mercury 0.001 mg/l Fluoride 1.5 mg/l Lead 0.01 mg/l Iron 0.3 – 3.5 mg/l Nitrate 45 mg/l Faecal Coliforms 10/100 ml
2.3.5 Rural Sanitation Coverage
The national household latrine coverage is estimated at 48% . However the coverage vary from district to district, with as low coverage of 4% in Karamoja District and over 80% in South-Western Districts
The coverage of public latrines is also very low (19%). Most of these latrines (40%) are located at schools, 33% in markets and 13% at health units. There are hardly any public latrines in the Rural Growth Centers despite the increasing populations.
Sanitation awareness remains low and the construction of excreta management and disposal facilities at households and institutions (schools, health centers, offices etc.), public places (markets, eating places, parks etc.) is not accorded the deserved priority, often considered an additional expense in money and time. In some cases, proper utilization of the latrine where it exists is not universal by all members of the household due to various taboos and beliefs.
There are number of factors that are responsible for the low sanitation coverage, including the apathy and laziness by some households, specific constraints (rocky, sandy (loose) soils and high water tables), lack of suitable local materials and, socio-cultural practices affecting the use of sanitation facilities.
2.3.6 Sanitation Technology options
The technological options for rural household and public sanitation include:
(i) Traditional Pit latrines: This comprises of a simple pit, of depth varying from 3
to 10 metres, normally covered with wooden logs and mud, walls of mud and wattle and a grass thatched roof. This needs no water for operation, is relatively cheap to construct because it does not need skilled labour. Perhaps this explains why approximately 88% of the rural residents who have latrines, had this type. Notwithstanding the above, the type has considerable smell and fly nuisances, slab may fail prematurely due to termite damage and life of the latrine is limited.

19
Although the traditional pit latrine may not meet some of the standards set by MoH, they give a plausible short term alternative for excreta disposal and can be rapidly replaced when full up but should be limited to households and only in cases where other types cannot be afforded. The expectation is that with intensified hygiene and health education communities will use and accept the principle of a latrine they will easily adapt to higher technologies and standards in due course.
(ii) Sanitary Platform Latrines: This latrine is similar to the traditional pit latrine but
the floor slab made of reinforced or shaped concrete which is supported with wooden logs. This needs no water for operation, is relatively cheap to construct (once slab is purchased can be re-used), the squat hole can be made safe for children, the concrete area can be easily cleaned and can be built by the householder. The slab construction requires a competent tradesman. This is recommended for households and institutions in rural areas.
(iii) Ventilated Improved Pit Latrine (VIP): Unlike a traditional pit latrine, a VIP
latrine is built with permanent building materials. These include a concrete slab for the floor, brick superstructure, and galvanized iron roof. In addition, the latrine is fitted with a vent pipe to reduce odors. It has minimum fly and mosquito nuisance, needs no water for operation, and is a fairly permanent structure.
Despite the long-term efforts by existing initiatives, the coverage of sanitary platforms, VIP and double VIP is still very low at 8.4%, 1.7% and 0.4% respectively. This is attributed to the high costs involved in the construction of these types of latrines.
(iv) Communal and Institutional VIP Latrine (multiple stance) This is a permanent
structure latrine suitable for public use at institutions and market areas. It often has 5 stances, 2 for men and 3 for women. This needs no water for operation although hand washing facilities are normally provided.
(v) Communal and Institutional Water closets (WCs) with septic tank: These
systems are not common in rural areas and are more suitable for public or institutional use. The recommended water closets are the cistern flush toilets (including urinals for male stances) and hand washing facilities discharging into a two-compartment septic tank. The effluent of the tank finally drains into a soakage trench with an evapotranspiration bed. This type may be the most appropriate for the rural growth centres where a piped water supply system is in place.

20
CHAPTER 3 INVESTMENT PLAN
3.1 STRATEGY CONCEPT
The concept relates to provision and management of water and sanitation services to the rural communities and rural growth centers with populations less than 5,000. The key strategy concepts or guiding principals are: i) A demand responsive approach- A full demand responsive approach will be
introduced in all programmes so that all support is determined by demand. The users, after receiving appropriate information/advice, will decide on what type of facilities they want, pay their share of the construction costs, and manage the operation and maintenance of the facilities. The local governments (Districts and Sub-counties) will be responsible for influencing and regulating demand by (a) promoting appropriate demand and (b) supporting poor communities.
ii) A decentralized Approach, with funds channeled directly to Districts as
conditional grants for implementation, and central ministries responsible for sector coordination, setting standards, preparing guidelines, monitoring, sector reporting, sector-relevant research and development. Guidelines for planning and operation of Conditional Grants will be issued and updated as required.
iii) An overall Sector-Wide Approach to Planning (SWAP) The mechanism for
Government/donor collaboration to achieve improvement in sector performance, increased resource flows, more effective use of resources and leading to positive outcomes for the poor in society will be provided for the Sector Development, other than through projects.
iv) Integrated approach and Integrated management of water resources, liquid
and solid wastes, safe-guarding of health and protection of the environment. A “Package“ approach for rural water supply that not only includes construction and installation, but also all software aspects associated with the water supply provision namely mobilization, community-based planning and monitoring, hygiene education (including maintaining a safe water chain and promotion of household sanitation), gender awareness/creation, capacity building at user level required for continued use and sustainable operation.
v) Sustainability to be a prime objective of all water and sanitation interventions:
to guide regulations and policies, technology and design options and standards as well as guide implementation arrangements, capacity building strategies and thus ultimately the speed of achievement of sector targets.
vi) Financial viability of public utilities and sound financial practices, user
contributions for capital cost, plus full responsibility for operation and maintenance.
vii) Co-ordination and collaboration of the major actors (including the national
institutions, local governments, donors, NGOs, and communities) to agree and recognize a common approach, adoption of innovations and best practices.
viii) Institutional reform: strengthening of local institutions and good management
of facilities, full involvement of users, community management of services, sense of ownership, participation of women at all levels and mechanisms to

21
develop local public and private capacities for promoting, identifying and preparing RWSS programmes, construction and O&M of facilities.
ix) Private Sector Participation: The Government commitment to the privatization
process in all spheres of National development gives a conducive private sector participation atmosphere, especially in the form of consultants and contractors in the design, construction and management of facilities.
3.2 SECTOR OBJECTIVES AND GOALS
The key sector goals are: a) “Sustainable safe water supply and sanitation facilities, based on management
responsibility and ownership by the users, within easy reach of 65% of the rural population and 80% of the urban population by the year 2005 with an 80%-90% effective use and functionality of facilities. Then eventually to100% of the urban population by 2010 and 100% of the rural population by the year 2015”.
b) “To promote co-ordinated, integrated and sustainable water resources management to ensure conservation of water resources and provision of water for all social and economic activities.”
3.3 RURAL WATER SUPPLY INVESTMENTS
3.3.1 Planning Criteria
The following Table present basic technical criteria that have been established for the planning of rural water supply schemes.
Table 4: Service Criteria Parameter Design Criteria Residential water demand per person per day 20 liters Institutional water demands - Day school/ student/ day - Residential school/ student/ day - Hospital/ bed/ day - Health center per day - Government office/ employee/ day - Hotel/ bed/ day - Camps/ person/ day
5 liters
25 liters 100 liters 100 liters 10 liters
100 liters 80 liters
Livestock watering (where served by system supplying human needs also) - Per head of cattle/day - Per goat or sheep/day - Per pig - Per donkey/day - Per 100 chickens/day
40 liters 5 liters
10 liters 20 liters 25 liters
Max number of people per handpump (borehole or well) 300
Volume of water per borehole per day, cu.m 7.5 Max number of people per protected spring 150 Volume of water per protected spring per day, cu.m. 5 Maximum number of people per standpipe/tap at a kiosk 500 Volume of water per standpipe/tap per day, cu.m. 10

22
Parameter Design Criteria Maximum walking distance to water supply point 1.5 km Maximum walking distance to a spring or standpipe/kiosk
0.5 km Minimum distance between boreholes 300 m Minimum distance between water source and source of contamination
30 m
In addition, an allowance of 20 – 25% should be allowed for spillage and unaccounted for water loss.
3.3.2 Unit Capital and Maintenance Costs
The following Table presents the estimated unit capital and annual maintenance costs associated with the various water supply technologies.
Table 5: Unit Capital and Maintenance Cost Type of Water Supply Annual
M’tce, $ Unit Capital Cost1, $
Boreholes c/w Hand Pump $100 $9,133 Protected Spring $20 $2,080 Shallow Well c/w Hand Pump $50 $3,990 Gravity Flow System, per tap $50 $7,636 Mechanized System, Rural Growth Centers $2,100 $248,500 Valley Dams $50 $66,400 Other Acceptable Water Supplies2 $20 $10,460
3.3.3 Technology Mix/Options for Rural Water Systems
DWD have set the distinction between urban and rural water supply areas at a population of 5000. In the context of this rural water supply programme, the demand is further divided into two categories, rural villages and rural growth centers as follows:
• Rural villages – scatter population to 2000 likely to be serviced with point water
sources. • Rural growth center (population 2000 to 5000) where it likely is more economical
to consider a limited mechanized piped water system DWD have compiled an inventory of current water supply facilities in each District. The percentage of Rural population to be served by borehole water systems will most likely be maintained in the future. Further, all potential gravity supply systems have been identified. However most of the springs are already developed and relatively few remain in close proximity to villages, the percentage that would otherwise come from springs is assumed to be catered for in the number of new shallow wells.
The numbers of boreholes, shallow wells, gravity flow schemes and pumped-piped water systems to be developed for each District to achieve the desired coverage by 2015 was then arrived at and summarized in the Appendix.
1 Includes a factor of 8% to cater for social mobilisation, design, supervision 2 Other acceptable water supplies include rainwater harvesting systems.

23
3.3.4 Population to be Served
Projected rural population for the Districts of Uganda were compiled with growth rates provided by Statistics Department of the Ministry of Finance, Planning and Economic Development and are based on the 1991 population census projected at varying rates to the planning horizon of 2015. The rural population growth rates as suggested by the Statistics Department vary from a low of 0.81% in Kalangala District to a high of 4.17% in Moroto District with an average rural rate of growth of 2.48%.
The Statistics Department suggests that urbanisation in Uganda is growing at a rate of 6.35%. In the 15 year planning horizon the number of rural growth centres is expected to increase to at least one per sub-county for total of approximately 670 rural growth centers by 2015
3.3.5 District Level Rural Water Supply Investments
Districts rural water supply investment plans were projected, based on the principal of SOME FOR ALL and NOT MORE FOR SOME and each district is allowed to progressively increase her present coverage to the 95% coverage by 2015(over the 15 year planning horizon). The investment requirements for each district were determined, based on the estimated water resources and technology mix required to reach 95%-100% rural population coverage by the year 2015
The following additional cost items were allowed in arriving at the total district investment plan:
• 10% of total capital investment is allowed for programme administration cost at
District level and includes for financing of District Water Office (2%), district project administration (1%), design (3%), construction supervision (2%) and support to Sub county technical offices (2%);
• 3% inflation rate (suggested by the World Bank to take into account future price fluctuations);
• Rehabilitation cost as 25% of Capital cost (when no specific costing information is available)
• Additional rehabilitation work as 10% to allow for future repairs of existing functional works.
3.4 RURAL SANITATION INVESTMENTS
3.4.1 Assumptions
The rural sanitation investment program is based on the following main assumptions: i) The pit latrine construction costs for households are to be met by the
individual households and are not part of the investment program. The program will only invest in the software components as a strategy for improving human excreta disposal at households;
ii) Education sector, under UPE program will plan and built sanitation facilities in
the new schools;

24
iii) No direct investment will be made in physical facilities around economic projects (like markets) but emphasis will be put on hygiene and health promotion, encouraging private sector participation and enforcement of laws;
iv) The users will meet operation and maintenance costs for the facilities. The
program will not support the replacement of facilities but a provision is made to pilot options for re-using the facilities.
3.4.2 Rural Sanitation Investment
i) Rural Sanitation Sector component investment estimates will be limited to
support of communal sanitation facilities in Rural Growth Centers and institutions (primary schools and health units);
ii) For every Rural Growth Center four communal type VIP multiple stance
latrine facilities are estimated. This is on the assumption that they will be located at convenient un-served public places. An additional 10% of the cost of works of facilities in RGCs is provided to cater for solid waste management facilities and start off equipment. It is assumed that the private sector and NGOs will provide investment in RGCs and institutions to fill the funding gaps;
iii) One 5 stance VIP latrine for approximately 2850 primary schools. Uganda
currently has approximately 9,500 primary schools. It is estimated that approximately 30% of these schools currently have no acceptable sanitation facilities. The proposed program will provide multiple stance VIP latrines for these existing schools.
3.5 SECTOR INVESTMENTS AND MILESTONES
Table 6 presents the total water and sanitation investment (to 2015) per district for rehabilitation of existing schemes, new point source development (boreholes, springs and shallow wells), mechanized systems for rural growth centers, gravity flow schemes, valley tanks/dams, other water sources, sanitation capital investments and sanitation program support. Also presented are allowances for District monitoring and accounting, contributions from users and sub National governments.
It is proposed to implement the programme over three phases; Immediate and short term - 2001 to 2005, medium term - 2006 to 2010 and long term - 2011 to 2015. The following Table 7 provides the physical and investment milestones proposed to be met under each phase.

Table 6: Summary of Rural Water Supply and Sanitation Investments to 2015
Sanitation Investment District Rehab. Point Sources
Rural Growth Centers
Gravity Flow Schemes
Valley Tanks/ Dams
Other Sources (rainwater) Capital Program
District M&E
User Cont.
District/ Sub-county Cont.
Total Investment
Apac 880,732 10,425,734 6,448,405 - - 689,352 470,229 329,160 553,327 268,157 989,847 19,796,938 Arua 237,287 13,422,262 8,060,506 228,266 - 383,496 580,256 406,179 669,955 327,854 1,199,410 23,988,207 Yembe 103,068 2,518,649 1,612,101 - - 100,649 114,360 80,052 130,034 67,156 232,946 4,658,914 Hoima 876,360 4,489,433 3,224,202 184,916 - - 230,880 161,616 263,247 119,361 471,533 9,430,655 Kamuli 1,222,282 18,053,946 6,770,825 - 923,286 - 512,253 358,577 809,110 395,205 1,432,514 28,650,279 Kotido 660,916 3,253,809 5,158,724 82,123 - - 297,201 208,041 274,667 145,792 496,774 9,935,480 Masaka 282,271 22,318,011 3,224,202 - - 1,343,450 437,865 306,505 815,038 357,678 1,436,367 28,727,343 Mbale 246,025 13,347,563 5,481,144 620,215 - - 446,215 312,351 590,848 254,682 1,052,218 21,044,361 Sironko 115,777 6,261,614 3,224,202 290,810 - - 237,376 166,163 296,772 132,480 529,636 10,592,715 Mukono 40,237 14,997,448 6,770,825 149,685 - 1,172,709 515,210 360,647 693,927 325,000 1,235,034 24,700,688 Kayunga 17,244 6,377,467 2,579,362 63,510 - 498,679 224,784 157,348 286,088 132,194 510,224 10,204,481 Ntungamo 755,235 11,155,023 3,224,202 85,808 - 2,255,018 264,932 185,452 524,259 240,985 922,496 18,449,929 Rukungiri 128,634 5,402,596 1,934,521 379,287 - 592,344 250,229 175,161 253,121 101,016 455,795 9,115,894 Kanungu 133,332 3,113,102 1,289,681 790,560 - 63,690 178,254 124,778 161,711 60,457 292,755 5,855,108 Bundibugyo 25,115 2,846,208 1,934,521 202,038 - - 139,739 97,817 150,236 65,772 269,784 5,395,676 Bushenyi 414,085 19,304,466 8,705,346 511,968 - - 662,997 464,098 868,076 391,354 1,546,552 30,931,037 Gulu 325,785 9,340,175 5,803,564 - - - 390,085 273,059 464,086 224,817 829,838 16,596,754 Bugiri 152,900 9,335,559 2,579,362 - - - 217,934 152,554 362,035 169,844 640,017 12,800,344 Iganga 442,612 17,748,981 7,415,665 - - - 522,143 365,500 768,218 380,685 1,363,156 27,263,120 Mayuge 208,288 8,687,349 1,934,521 - - - 181,332 126,932 324,905 152,442 573,166 11,463,328 Jinja 183,411 9,645,682 1,612,101 - - - 184,972 129,480 343,236 144,960 604,944 12,098,882 Kabale 144,221 10,045,653 3,869,043 3,947,565 - - 376,341 263,439 540,194 198,871 959,323 19,186,455 Kabarole 339,604 2,510,439 2,579,362 123,819 - 4,226,556 230,608 161,426 293,393 154,436 523,260 10,465,207 Kyenjonjo 347,101 2,850,445 3,869,043 217,747 - 6,515,587 273,146 191,202 413,998 230,877 733,913 14,678,269 Kamwenge 256,181 1,559,941 1,934,521 117,403 - 2,112,308 173,703 121,592 179,411 92,049 322,753 6,455,060 Kalangala 2,005 - 1,934,521 - - - 84,682 59,278 58,096 38,690 106,929 2,138,582 Kapchorwa 33,087 2,313,850 3,224,202 1,186,489 - - 187,157 131,010 202,729 96,381 363,926 7,278,523 Kasese 167,439 3,752,311 4,191,463 538,979 - - 327,894 229,526 259,506 125,833 473,356 9,467,117 Kibaale 144,221 2,408,683 4,191,463 - - - 268,553 187,987 202,331 109,015 370,162 7,403,237 Kiboga 108,825 1,520,947 1,934,521 667,074 1,751,824 721,234 145,055 101,539 201,133 105,944 357,608 7,152,152 Kisoro 13,034 5,346,977 1,934,521 91,450 - - 160,894 112,626 221,579 85,402 394,054 7,881,082 Kitgum 307,124 7,695,703 3,224,202 - - - 214,329 150,030 336,811 168,067 596,410 11,928,200 Pader 346,332 8,678,702 3,224,202 - - - 224,267 156,987 367,477 181,319 649,898 12,997,967 Kumi 257,822 15,541,879 4,513,883 - - - 309,971 216,980 609,408 293,943 1,072,497 21,449,943 Lira 384,070 11,167,746 7,415,665 84,080 - 717,834 529,881 370,917 593,082 289,288 1,063,164 21,263,275 Nakasongola 111,586 6,251,931 1,289,681 - 1,764,242 - 105,237 73,666 282,523 145,648 493,943 9,878,867 Luwero 681,314 14,587,497 4,513,883 - - - 355,428 248,799 593,481 283,114 1,049,020 20,980,402 Sembabule 97,424 5,726,051 1,289,681 - 5,235,981 722,073 120,604 84,422 392,136 222,402 683,419 13,668,371 Masindi 339,443 9,057,647 3,869,043 393,055 - 239,918 287,671 201,370 416,973 194,263 740,256 14,805,119 Mbarara 690,809 16,459,332 9,995,027 1,620,403 3,546,114 - 768,091 537,664 969,351 476,818 1,729,340 34,586,791 Moroto 341,685 4,117,002 4,191,463 42,378 - - 221,310 154,917 260,776 140,121 466,477 9,329,530
25

Sanitation Investment District Rehab. Point
Sources Rural Growth Centers
Gravity Flow Schemes
Valley Tanks/ Dams
Other Sources (rainwater)
District M&E
User Cont.
District/ Sub-county Cont.
Total Investment
Capital Program Nakapiripirit 303,004 4,295,278 1,612,101 125,359 - - 111,625 78,138 190,072 91,290 335,779 6,715,577 Moyo 32,084 1,892,460 2,256,942 296,476 - - 128,373 89,861 134,339 68,739 241,527 4,830,534 Adjumani 159,152 2,050,741 1,289,681 94,874 - - 91,463 64,024 107,833 52,688 192,888 3,857,769 Mpigi 91,165 10,059,275 3,224,202 65,170 730,034 375,303 305,905 214,133 436,354 193,718 775,077 15,501,542 Wakiso 230,810 16,063,425 4,513,883 67,523 1,059,383 544,617 428,733 300,113 674,389 304,169 1,194,144 23,882,877 Mubende 212,202 9,645,219 5,803,564 177,212 1,755,387 - 446,401 312,481 527,808 256,226 944,014 18,880,273 Nebbi 580,825 8,342,984 4,191,463 417,366 - - 327,956 229,569 405,979 190,645 724,807 14,496,142 Pallisa 131,639 16,450,931 5,803,564 - - - 424,576 297,203 671,584 321,559 1,188,975 23,779,497 Rakai 355,421 8,991,075 5,803,564 - 3,469,627 1,367,502 404,884 283,419 599,616 325,368 1,063,755 21,275,108 Katakwi 245,112 12,315,856 4,191,463 - - - 268,253 187,777 502,573 246,109 885,552 17,711,034 Soroti 373,586 11,200,201 4,191,463 - - - 281,258 196,881 472,957 227,323 835,817 16,716,346 Kaberamaido 163,290 6,004,875 1,934,521 - - - 159,936 111,956 243,081 115,690 430,883 8,617,659 Busia 94,207 4,696,741 2,579,362 - - - 165,661 115,963 221,109 109,028 393,652 7,873,044 Tororo 628,647 17,117,561 5,481,144 - - - 411,227 287,859 696,821 340,616 1,231,163 24,623,258 National Program Support (DWD) in Water Sector 123,822,205 20,156,881 143,979,087 Total Uganda
16,166,067 472,764,436 215,054,295 13,863,607 20,235,879 24,642,318 16,380,320 31,623,105 22,881,798 10,933,540 40,672,747 957,434,031
.
26

27
Table 7: Physical and Investment Milestones
Programme Goals Programme 2000 – 2005 Programme 2006 - 2010 Programme 2011 – 2015
• Physical Implementation Targets
Water Supply Sanitation, Health and Hygiene
1. Rural water supply facilities constructed to serve additional 5.7 million people raising National water supply coverage to 65%.
2. Investment in the rural water sector totaling: • 15,130 Point source supplies:
Rehabilitation: $14.1 million New Boreholes: $60.5 million New Dug Wells/Springs: $53.4 million
• 250 Rural growth centre:$69 million • Gravity Flow Schemes: $11.7 million • • • • •
• • • • •
• • • •
71 Valley Tanks/Dams: $5.3 million Other source Investment: $6.3 million District Monitoring: $6.6 million National Support Prog.: $55.7 million Total Water Investment: $ 283 million
3. 75% of rural households with access to
acceptable sanitation facilities. 4. 100% of existing primary schools and 250
rural growth centres with access to improved sanitation facilities;
5. Investment in rural sanitation activities totaling: • Sanitation facilities (rural growth
centres, institutions): $10.5 million • Sanitation Programmes (National and
District level programs): $13.8 million • Sanitation Investment: $24.3 million
Total 6 Year Investment: $307 million
1. Rural water supply facilities constructed to serve additional 6.1 million people raising National water supply coverage to 80%.
2. Investment in the rural water sector totaling: • 16,840 Point source supplies:
Rehabilitation: $1 million New Boreholes: $78.7 million New Dug Wells/Springs: $69.5 million
• 208 Rural growth centre: $67.6 million • Gravity Flow Schemes: $2.2 million
73 Valley Tanks/Dams: $6.4 million Other source Investment: $7.8 million District Monitoring: $7 million National Support Prog.: $38 million Total Water Investment: $ 278 million
3. 85% of rural households with access to
acceptable sanitation facilities. 4. 209 additional rural growth centres with
access to improved sanitation facilities; 5. Investment in rural sanitation activities
totaling: • Sanitation facilities (rural growth
centres, institutions): $2.9 million • Sanitation Programmes (National and
District level programs): $8.9 million • Sanitation Investment: $11.8 million
Total 5 Year Investment: $290 million
1. Rural water supply facilities constructed to serve additional 7.3 million people raising National water supply coverage to 95%.
2. Investment in the rural water sector totaling: • 20,650 Point source supplies:
Rehabilitation: $1.1 million New Boreholes: $112 million New Dug Wells/Springs: $99 million
• 208 Rural growth centre:$78.4 million • 85 Valley Tanks/Dams: $8.6 million
Other source Investment: $10.6 million District Monitoring: $9.3 million National Support Prog.: $30 million Total Water Investment: $ 349 million
3. 100% of rural households with access to acceptable sanitation facilities.
4. 209 additional rural growth centres with access to improved sanitation facilities;
5. Investment in rural sanitation activities totaling: • Sanitation facilities (rural growth
centres, institutions): $2.9 million • Sanitation Programmes (National and
District level programs): $8.9 million • Sanitation Investment: $11.8 mill
Total 5 Year Investment: $361 million

28
CHAPTER 4 IMPLEMENTATION STRATEGY
4.1 SECTOR CHALLENGES
There are a number of challenges that need to be addressed in order to maximise benefits and outcome of Sector investments, these are:
(i) Need for capacity building and institutional reform at the national and district level to undertake their roles.
(ii) Need for efficient coordination and management at local governments level,
including interaction between different departments and the interaction between staff at district and lower levels with the private sector, non-governmental organisations, communities and households;
(iii) The need to strengthen community influence over the planning, financing,
implementation, monitoring and control of community related water and sanitation development. Firstly, mobilisation and awareness creation need to be enhanced, not the least through the involvement of women and community-based organizations. Secondly, there is need to enhance sustainability through the promotion of solutions that are manageable, affordable and adaptable at community level. Issues relating to community financing, choice of technology, community-based management and interaction with civil society and the private sector are examples of key issues in the latter regard. Furthermore, gender aspects need to be observed in all community-related interventions;
(iv) The need to strengthen the delivery of sanitation and hygiene education services,
including the gradual introduction of ecological sanitation;
(v) The need to strengthen the interaction between MWLE, other line ministries and development partners in order to promote a sector-wide approach to developments in the sector;
(vi) The need to strengthen and build capacity for private sector participation; (vii) The need to build the capacity to operate and maintain the established facilities
sustainably.
4.2 SECTOR INVESTMENT FINANCING
Presently, funding the rural water and sanitation sub sector development is primarily from donors and in the form of project specific transfers, and only partially in line with local government financial regulations.
In 1997/98, Government established a Poverty Action Fund (PAF), where funds from both Government resources, including HIPC and Donors could be channeled either earmarked for specific sector or as budget support.
Starting in the financial Year 2000/2001, Government introduced the District Water and Sanitation Development Conditional Grant, as a channel through which government water development funds are sent to the local governments.

29
In medium term, all available development funds (from Government and Donors/NGOs) for rural water and sanitation will be channeled to the Districts as conditional grants for rural water supply and sanitation on the basis of the District’s sector investment plan.
In the long term, a pooling of resources (common Basket funding) for the sector will be aimed at in order to ensure an overall prioritisation of sector investments, among Districts as well as among various activities.
The following guidelines will be used to manage the grant:
(i) Indicative Planning Figures for the districts will be prepared by the MWLE/DWD
on the basis of the investment plan.
(ii) Districts should plan based on outputs rather than inputs (i.e. less interference in whether they budget for e.g. sanitation – more emphasis on achievements of targets). A provision will be set aside for Districts to use for implementation costs, this will include costs for social mobilization, information, council planning, fees for technical surveys, appraisals and designs as well as consultants supervisory costs. The districts should submit their workplan with budget to the MWLE/DWD.
(iii) A certain percentage of funds allocated to Districts will be distributed to sub-
counties for planning for water and sanitation activities. Communities are made aware of the criteria to be met (including co-funding) before they apply to their respective sub-counties for funding. Sub-counties screen applications and make funds available from their own share of grants to minor projects (spring protection, shallow well construction, etc) that can be managed at sub-county level. The Sub-county refers applications for major projects (in particular boreholes) to the District with the indication of sub-county priorities. The District Council makes the final decision regarding the use of resources.
(iv) Letter of Understanding (LOU) is signed between the Districts and MWLE/DWD.
The LOU specifies the roles between the center and the Districts, with fund releases and accountability issues clearly spelt out. The responsibilities of the various stakeholders in the management of this grant will clearly reflect the principle division of roles as outlined in the Water Policy and the Local Governments Act. However, the capacity shortcomings of local authorities is recognized, just as economies of scale will justify elements of contract management and procurement to be centrally administered
(v) The grant will be used to promote and encourage good management practices
among local authorities. Districts should ensure proper financial management, guided by the Local Government Financial Regulations regarding general financial accountability; i.e. operational District Tender Board, timely completion of final accounts, monthly returns and annual audit. Districts should establish fully functional District Water Office, use the private sector, gender sensitivity and adherence to the principles of demand responsive planning are among the key issues. In order to encourage such good management practices the allocation of funds to Districts will be adjusted based on previous performance. Improved performance in sector service delivery, will be measured against the following performance indicators:
♦ Timely completion of activities and reporting, ♦ Monitoring system in place and timely accountability ♦ Evidence of participation of lower councils and communities, ♦ Increased acceptable water coverage, ♦ Sanitation and health improvements,

30
(vi) Conditions for District co-funding will eventually be developed in consultation
with DWD and Districts. Initially there will be no precondition as this would stifle the good intentions of newly created Districts trying to cope with the start-up challenges and thus retard the achievement of the national sector targets.
4.2.1 Procurement of Goods and Services
The involvement of the Private Sector in the development of the rural water and sanitation sector is considered paramount to success. The Private Sector is envisaged to provide consultative, management, equipment supply, construction and supervisory services to the Sector at all levels, National and sub National. The involvement of the Private Sector will be enhanced through Capacity Building initiatives promoted at both National and sub National levels particularly in the areas of procurement procedures, contract administration and management.
District level The Districts are carrying out the procurement of contractors for minor and medium size activities like small gravity schemes, dug wells, spring protection, and school latrines. However, District level tendering, contract management, financial management and reporting, have some tithing problems. All these have led to very substantial delays and under-utilisation of allocated funds.
There is need to streamline the procurement process by the Local Governments. The sector line ministry will “veto” any procurement with glaring anomalies.
Central Level Procurement and management of large contracts, like drilling programs covering more than one District, may be done centrally to take advantage of economies of scale and need for specialised contract management. Private consultancy firm (s) could be engaged centrally to carry out siting and supervision of borehole drilling. The center may also handle handpump supply and possibly the supervision of firms carrying out the implementation of Rural Growth Center water supply systems. The District Councils would still plan and allocate resources from their budgets for these centrally administered activities.
4.3 ROLES AND RESPONSIBILITIES
a) National Level The ministry of Water, Lands and Environment, through the Directorate of Water Development (DWD) will play a supporting role in the implementation of the rural water investment programmme by the local governments. These roles can be broadly grouped as:
Central level strategic planning, coordination, Quality assurance and technical assistance systems, including collaboration efforts with donors/NGOs and other players (lines ministries and private sector).
In addition the center has responsibilities to inspect, monitor and where necessary, offer technical advice, support supervision and training to ensure the implementation of national policies and adherence to performance standards by the local Governments [ the Local Governments Act(1997)- Articles 97 and 98],

31
MWLE/DWD intend to establish 8 Technical Support Units (TSU) responsible for groups of districts to give dedicated support to the Local Governments, to enable them carryout their new functions effectively.
The roles at National level can be specifically stated as: (i) Provision of policy framework and strategy for the investment in the sector.
Actual planning for investment in the sector by the DWD will be limited to those areas which are national in nature.
(ii) The Sector ministry, in collaboration with local authorities establish or agree on
set criteria for minimum conditions to be met before local authorities are granted funds, including how the performance of local authorities will be measured .
(iii) Provide guidelines to local authorities on the use of the development grant. This
includes procedures for participatory, transparent and technical competent planning of investments, balancing of sanitation, health education and water construction activities, procedures for financial arrangements including cost sharing principles and accountability, procedures for operation and maintenance,
(iv) In collaboration with local consultants undertake an annual assessment of local
authorities to assess whether they can meet minimum conditions for receiving water and sanitation development grants, and advise Ministry of Finance, Planning and Economic Development on grant allocations accordingly.
(v) Ensure that local authorities are offered assistance for capacity building –
including assistance to the local private contractors, local NGOs, communities, the District Local Government Tender Boards, the technical staff of the departments of Water and Health as well as the local councilors.
(vi) In collaboration with local consultants undertake annual assessments of
Districts’ performance and recommend for adjusted grant allocation accordingly.
(vii) DWD will provide the needed technical assistance not available at the District level. In particular for borehole drilling the DWD will provide a centrally managed annual program for cost-effective procurement and supervision. The management of the program may be contracted out and include responsibilities for preparation of tender documents, tendering, technical evaluations, and management of supervisory consultancy services.
(viii) The sanitation, health and hygiene programs will be supported at National and
Local Government levels
b) District Level The District Local Governments are the overall planning authorities for the Districts and have the general responsibility for the provision of services in the water and sanitation sector. As such the District responsibilities include: (i) Prepare workplans and Budget for the water and sanitation sector that integrate
lower councils plans and co-ordinate health education, sanitation, water construction and operation and maintenance activities;
(ii) Establish Management Information system and ensure lower councils and communities are adequately informed on planning and management procedures for water and sanitation under a demand driven approach;

32
(iii) Promote health education and sanitation campaigns;
(iv) Ensure training and other capacity building measures are in place for lower
councils, private sector and communities;
(v) Procure private sector services for the construction of water and sanitation facilities from local and national contractors, through the District Tender Board (DTB). The borehole drilling and piped water supply systems for Rural Growth Centers could be done with support or initially be centrally managed.
(vi) Carryout technical supervision, physical and financial accountability and backup technical support for construction, operation and maintenance beyond the capacity of the communities.
(vii) The Districts shall institute a District Water Office (DWO) based in the
Directorate of Works and Engineering as a section head under the District Engineer. The functions of the DWO would be as follows:
♦ Planning and Budgeting, ♦ Monitoring and technical supervision, ♦ Accountability, and ♦ Co-ordination with the Health ,Community Departments.
c) Country and Sub-county Level County and Sub-counties are required to meet the minimum conditions described above for Districts in order to qualify for development grants for the water and sanitation sector. Initial years of direct funding may well be limited to health education and sanitation activities. As Water User Groups (WUG) lack legal recognition formal ownership of water and sanitation facilities will vest with the Sub-county local government on behalf of the WUG. Sub-counties will have responsibility to:
(i) Plan and budget for the provision of rural water and sanitation within the sub-
county.
(ii) Enact and enforce bylaws for water and sanitation
(iii) Inform communities on planning and implementation arrangements for water and sanitation activities;
(iv) Carry out health education and sanitation campaigns through the Health Assistant;
(v) Ensure the availability of private handpump mechanics.
(vi) Assist Water User Groups with proper financial management (possibly through the operation of a joint bank account and or assistance from Sub-county Accountant),
(vii) Monitor water and sanitation facilities in the sub-county and ensure the local supervision of construction works; payments and accountability.

33
(viii) Undertake local procurement of minor construction works(below tender threshold);
d) Parish Level
Parishes shall be more directly involved in the planning of the use of a conditional development grant for the water and sanitation sector. Sub-county shall provide indicative-planning figures for funding to each Parish. The Parish will have responsibility to: (i) Inform communities on planning and implementation arrangements for water
and sanitation activities;
(ii) Facilitate the establishment of Water User Groups;
(iii) Assist Water User Groups with communication to Sub-county Local Government,
(iv) Monitor water and sanitation facilities in the parish;
(v) Enforce local bylaws on water and sanitation; and
(vi) Assist with the monitoring of construction works. e) Community level
Community members may form a Water User Group (WUG) to collectively plan and manage a water (point source) facility. Under a demand driven approach to planning for water facilities the following steps will apply:
(i) The communities through Parish and Village Councils will be informed about and
mobilized to buy into the procedures to follow in order to apply for support to a water project:
(ii) Households will form a Water User Group and apply through Village and Parish Councils to Sub-county Local Government for funding – commitment will at a later stage be indicated by partial upfront payment of user contributions;
(iii) The Sub-county will consider funding from own sources/own share of conditional grant or recommend for District funding.
(iv) If a project is approved for funding, a contract will be made with the Water User Group as a client. Private consultant, District or sub-county staff may undertake all or part of technical supervision. However, work completion and other crucial stages of contractors’ certification will need WUG endorsement.
(v) WUG will manage and operate the facility.
(vi) WUG will request and meet the cost of technical assistance for repairs mainly from Sub-county based private contractors (handpump mechanics etc),
(vii) In rare cases of repairs beyond the technical capacity of handpump mechanics WUGs will request assistance from District based technicians – private or local government employed.

34
(viii) WUG will apply through Sub-county to District for support to rehabilitate a water source whose cost of rehabilitation is beyond their capacity.
4.4 MODALITIES FOR CAPACITY BUILDING AND SUPPORT TO ENHANCED IMPROVED PERFORMANCE
Many of the capacity and performance shortcomings can be ascribed to the newness of the fundamental institutional changes that have taken place: privatization and decentralization in particular. Many of the ongoing support activities to the stakeholders in the sector should contribute to improved implementation performance. However, additional measures may contribute to further improvements. In particular it is intended to pursue the following strategies.
1. Central Government (MWLE/DWD) will pay particular attention to the monitoring
of the performance of the stakeholders, especially District local governments. Clear measures and procedures will be developed for this purpose.
2. Districts that perform well will be rewarded: the allocation of conditional grants for
water and sanitation development will be adjusted based on assessments of previous performance. This may lead to some inequalities among Districts. However, in a medium term perspective (next five years) this cannot be avoided and is preferred to slow implementation rate and the existing inequalities among Districts based on donor choice.
3. Capacity building measures will be targeted towards performance gaps and be
guided by local governments rather than purely supply driven by specific donor programs.
4. Support for capacity building will focus on the entire institutional set up rather
than on human resource development alone. On this basis it is recommended that the office of DWO is facilitated through a portion of the allowance for District Monitoring and Accountability Costs of 5% of the conditional grant from the Center. The principles are outlined in the box below.
In addition, the following institutional development and support activities will be undertaken:
(i) Establish water sector Management Information System (MIS), with databases depicting WSS technology and their location (GIS), service coverage ,and functionality by sub-county/districts,
(ii) Carry out operational research, demonstration and promotion of appropriate
technological options de to develop: (i) technical designs for low cost technological options, technological options for areas with low yielding underground waters, hard rock areas and other specific areas, (ii) simple and affordable water treatment systems (iii) promotion techniques that support communities’ capacity to control the factors that determine their behavioral actions towards the hygienic use of water and sanitation facilities and strengthening research institutions.
(iii) Development, dissemination and enforcement of policies laws, regulations,
guidelines and operation manuals , including documentaries, radio and TV messages, talks and shows, .to the Local Governments and other service providers.

35
(iv) Carryout specific capacity building requirements to the key stakeholders at the National, District, sub-county, NGOs/CBOs and the private sector. This will include training, seminars/ workshops/exposure trips and Human Resources Development/retooling (provision of Transport, Equipment and other logistics).
(v) Monitor, Quality Assurance and regulation of Water Sector Service providers to
ensure adherence to a national Standard and performance contracts, including technical assitstance and backup support in the design, construction, operation and maintenance of the water and sanitation facilities, in particular the piped water systems for the Rural Growth Centers.
(vi) Undertake specific Institutional and Human Resources development for the key
player role of the ministry of Water, Lands and Environment, in particular Directorate of water Development to carry out new roles.
The following table provides milestones for institutional development targets expected to be achieved during each program phase.

Table 8: Institutional Development Milestones
Programme Goals Programme 2000 – 2005 Programme 2006 - 2010 Programme 2011 – 2015
• Institutional Development Targets
Central Government Ministries Long term objective for Central Government Ministries, particularly the Ministry of Water, Land and Environment and the Ministry of Health is to move away from specific project implementation modalities to programme co-ordination, facilitation, monitoring, mentoring, standards compliance, policy development, and specialised technical assistance.
Programme Milestones: 1. Water Statute, 1995 revised to reflect
clearly the roles and responsibilities of local authorities.
2. Water policy principle on community ownership of facilities clarified and implemented.
3. Rural water quality guidelines reviewed and adopted into National Standard.
4. National guidelines on community contribution for construction of water and sanitation facilities based on technology choices developed and adopted by all implementing agencies, donors and NGOs.
5. Conditional grant facility for District sector investments and DWO facilitation developed and implemented.
6. Annual District minimum condition and performance assessment conducted.
7. Additional donors supporting National funding (budgetary support) for Conditional development grant to LGs for water and sanitation capital investment.
8. National bore hole drilling programme and Rural Growth Centre water supply systems co-ordinated by DWD with sites selected based on Districts development plans.
9. Private sector drilling capacity increased to provide up to 1500 bore holes per year. This to be facilitated by: • Divestiture of DWD owned drilling rigs
(10) to form new drilling companies. Retain four drilling rigs for emergency operations. Newly formed drilling companies to be contracted to construct a minimum number of boreholes for first two years.
Programme Milestones: 1. DWD substantially devolves direct project
implementation to LGs and private sector. 2. All Donor investment in Water and
Sanitation sector channelled through conditional development grants.
3. National borehole drilling programme phased out with Local Governments taking on responsibility.
4. Conditional grant facility available to all Districts.
5. DWD continues to conduct annual minimum condition and performance assessments on all Disticts.
6. National and District sanitation and hygiene education programmes continue.
Programme Milestones: 1. DWD devolves all direct project
implementation to LGs and private sector.
2. 50% of investment in Water and Sanitation sector channelled through block grants and 50% through conditional development grants.
3. DWD continues to conduct annual minimum condition and performance assessments on all Districts.
4. National and District sanitation and hygiene education programmes continue.
36

Programme Goals Programme 2000 – 2005 Programme 2006 - 2010 Programme 2011 – 2015
• Attract additional drilling capacity to ensure country capacity of 1500 bore holes per year.
10. Sanitation and hygiene education programme developed and initiated through: • UPE programme; and including
teacher in-service training; • Mass media taking advantage of the
increased access to radio in the country;
• Religious organisations. 11. Water supply and sanitation planning and
allocation guidelines, manuals and training programmes for Districts and Sub-counties developed and implemented.
12. Improved hand pump and pertinent spares distribution through private sector or LG stores. Detailed spares distribution study to identify constraints, possible subsidies, managerial arrangements conducted.
Local Governments Long term objective is for LGs (Districts and Sub-counties) to effectively take responsibility for planning, implementation and management of rural water supply, sanitation and hygiene education.
Programme Milestones: 1. Majority of Districts planning and
implementing WSS projects though access to Conditional Development Grant (Districts self selected through MoLG minimum conditions assessment).
2. The Districts with current rural water coverage of <30% be given priority to raise coverage to at least 50%. May require specific donor support.
3. At least half the Districts have functional District Water Offices under the District Engineer/Works Department with improved capacity in: • Planning and resource allocation; • Project implementation including
Programme Milestones: 1. Local Authorities executing the roles and
responsibilities as outlined in the revised Water Statute.
2. 100% of Districts planning and implementing WSS projects though a conditional development grant
3. All Districts have functional District Water Offices.
4. Agreed upon technical capacity at Sub-county level implemented in half the Sub-counties.
Programme Milestones: 1. 50% of Districts planning and
implementing WSS projects though a block grant
2. All Sub-counties have agreed upon technical capacity.
37

38
Programme Goals Programme 2000 – 2005 Programme 2006 - 2010 Programme 2011 – 2015 procurement through DTBs, monitoring and reporting on consultants and contractors;
• Operations and maintenance support to communities;
4. Appropriate technical capacity reviewed and defined at the level of Sub-county local governments.
Private Sector Long term objective is for the private sector to develop capacity and capability in contracting with LGs to deliver rural water, sanitation and hygiene education projects.
Programme Milestones: 1. Districts implement bore hole maintenance
and repair through the private sector. 2. Districts have hand pump spares
distributed through the private sector or the Districts’ own system.
3. At least half the Districts utilising consultants to assist with delivery of water, sanitation and hygiene projects.
4. At least three quarters of the Districts using local construction firms and artisans contracted through the District Tender Boards for construction of water and sanitation facilities.
5. At least 5 new bore hole drilling companies established.
Programme Milestones: 1. All Districts implementing bore hole
maintenance and repair through the private sector.
2. All Districts substantially have hand pump spares distributed through the private sector.
3. All Districts substantially utilising consultants to assist with delivery of water, sanitation and hygiene projects.
4. All Districts using local construction firms and artisans contracted through the District Tender Boards for construction of water and sanitation facilities.
Programme Milestones: 1. Sufficient numbers of capable
consultants located within Region providing planning, design and supervision services to Districts.
2. Sufficient numbers of competent contractors located within the Region providing contracting services to Districts and Sub-counties.
Non-Government / Community Based Organisations Objective is to facilitate NGOs/CBOs to continue their role as innovators of water supply, sanitation and hygiene activities.
Programme Milestones: 1. At least half the Districts have an
NGO/CBO actively supporting Local Authorities through innovative approaches to the delivery of water, sanitation and hygiene programmes.
Programme Milestones: 1. At least three quartiers of the Districts
having an NGO/CBO supporting Local Authorities through innovative approaches to the delivery of water, sanitation and hygiene programmes.
Programme Milestones: 1. All Districts having an NGO/CBO
supporting Local Authorities through innovative approaches to the delivery of water, sanitation and hygiene programmes.
39
4.5 MODALITIES TO ENSURE ACCOUNTABILITY AND DONOR SPECIFIC REQUIREMENTS
Various donors have different accountability requirements. It would therefore be unrealistic to expect all donors from the beginning to be willing to pool funds into a common basket for a general conditional development grant. However certain measures can be established to ensure accountability in accordance with donor requirements.
1. Support to District finance departments and audit departments to ensure
proper internal financial management and internal audits;
2. Support to the Auditor General to ensure timely and proper audit of all District accounts; the Auditor General can contract private companies to act on his behalf;
3. Reserve particular Districts for support from particular donors – while still maintaining the national mechanisms for planning, transfers etc of the conditional development grant. This would allow the particular donor to “flag” its support as well as provide options for relevant technical assistance directly from the particular donor to particular Districts. This would also allow the donors to follow up accountability – both physical and financial at a closer range.
4. Reserve areas of national support for a particular donor: e.g. training of Tender Boards in contract management across the country, development of national planning guidelines and standards, and the development and institutionalization of a national monitoring and evaluation system. This would in a similar way as described above allow the donor to “flag” its support and provide clear accountability.