Embed Size (px)
Citation preview

Rural Poverty and Agricultural Diversification in Thailand*
Alia Ahmad1 Department of Economics
Lund University
Somporn Isvilanonda2 Department of Agricultural and Resource Economics
Kasetsart University, Bangkok
October 2003
Abstract: Thailand has experienced steady economic growth and structural changes in the economy in the last four decades that enabled her to gain a position among the newly industrialized nations. The structural changes associated with economic growth reflect the changing role of agriculture in the economy. The share of agriculture in GDP declined from 44% in early 1960s to 10% in recent years (Isvilanonda 1998). Its share in employment has shown similar trend albeit at a slower pace. The share of agriculture in employment has fallen from 83% in 1957 to 57% in 1999. The difference between the shares of agriculture in GDP and employment suggests a huge labour productivity gap between agriculture and manufacturing, and it has serious implications for rural poverty and rural/urban inequality. Although Thailand has been very successful in reducing poverty because of rapid and steady economic growth, rural poverty especially in certain regions is a serious problem. 90% of the poor live in rural areas and 2/3 of the poor live in northeastern provinces indicating high regional inequality. The productivity gap is mainly due to the inability of the manufacturing sector to absorb rural labour at a rapid rate. One of the ways of dealing with this problem is to diversify agriculture and the rural economy both at sectoral and farm-level. Thailand has been successful in sector-level diversification with regional specialization. However, this has resulted in regional disparity in agricultural development because of the inability of farmers in certain regions to diversify towards more profitable crops. This paper analyses the pattern of diversification at farm level, its effects on farm income and the constraints faced by farmers in different regions and production environments. The study is based on longitudinal household level data from two regions in Thailand – the Central Plains near Bangkok and Khon Kaen in the northeast of the country. JEL classification: O13, O18, Q18 Key Words: crop diversification, intensification and regional inequality
*Paper presented at the Second Annual Swedish School of Advanced Asia and Pacific Studies (SSAAP), 24-26 October, 2003 in Lund, Sweden. It is a part of a large study, Agricultural and Rural Diversification in Selected Rice Economies of Asia jointly undertaken by researchers, Professor Franz-Michael Rundquist and Dr. Magnus Jirström, Department of Social and Economic Geography, Lund University, and several research institutions in Vietnam and Thailand, financed by the Swedish Research Council, and the Centre for Est and Southeast Asian Studies, Lund University. 1. Department of Economics, Lund University, P. O. Box 7082, S-220 07 Lund, Sweden. Phone: +46(0)462228660, fax+46(0)462224613. E-mail:[email protected] Homepage:http//wwwnek.lu.se/NEKAAH 2 Department of Agricultural and Resource Economics, Kasetsart University, Bangkok, Thailand.

Rural Poverty and Agricultural Diversification in Thailand
I. Introduction Rapid economic development and poverty reduction in the rice economies of Asia in the last
three decades have been possible largely due to increased productivity and commercialization
in the agricultural sector. Two phases of development may be discerned:
First is the intensification in rice production and its impact on agricultural income, food
security and the fuels for industrial development in terms of market for consumer and
producers´ goods, and capital/foreign exchange. Increasing farm income through
intensification of rice production, however, faces certain limits. It is a well-known fact that
the role of agriculture in GDP and employment declines as the economy progresses into an
industrial phase. Two important reasons are the inelastic demand for staple foodcrops as
income increases and secondly, the improved technology that increases the supply of
agricultural products (Timmer 1988). The problem of declining farm income and increasing
rural/urban disparity often arises when agriculture´s share of employment remains high while
its share in GDP goes down. Almost all rice growing economies of Asia have experienced this
phenomenon in varying degrees largely due to the inability of the industrial sector to absorb
rural labour at a rapid rate (Timmer 1992) while rice is losing its importance (Barker and
Dawe 2002, pp. 17-18).
Being encountered with these limitations, several countries in Asia have entered the second
phase – diversification of the agricultural sector – expanding production in high-value-added
activities (often for export) like coffee, sugar, cassava, maize, palm oil, fruits, vegetables,
flowers, livestock, fisheries, etc. (Barghouti, et al, 1992; Barker and Dawe, p. 19, 2002).
Diversification is seen as one of the important ways of maintaining farm income and reducing
disparity in urban/rural income which are associated with the changing role agriculture in the
process of economic development. In Peter Timmer´s words, ”the link between agricultural
diversification and longer-run structural change occurs mainly because diversification is a
bridge between the declining income-earning opportunities from growing food staples and
an exit from agriculture altogether.” (Timmer 1992, p. 29).
2
This paper deals with agricultural and rural diversification in Thailand. Thailand is
undergoing similar processes and is faced with a need to reconsider the role of agriculture in
economic development in the coming decades. Declining profitability of rice has led to efforts
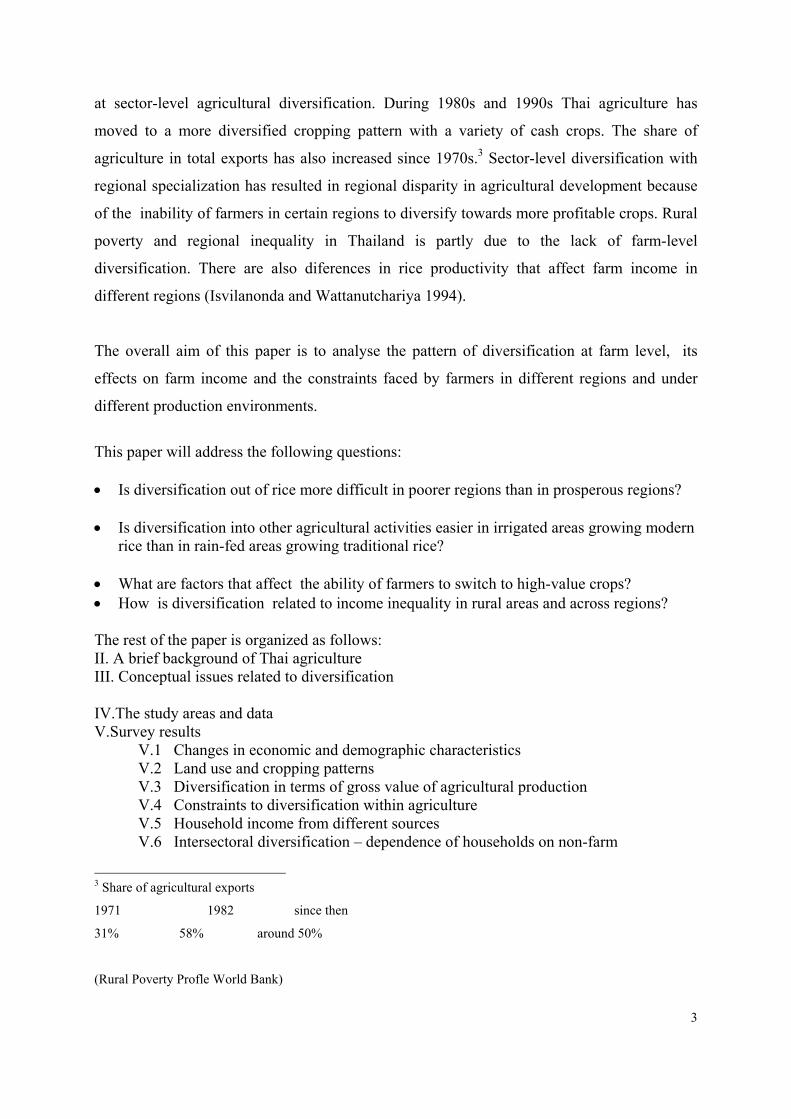
at sector-level agricultural diversification. During 1980s and 1990s Thai agriculture has
moved to a more diversified cropping pattern with a variety of cash crops. The share of
agriculture in total exports has also increased since 1970s.3 Sector-level diversification with
regional specialization has resulted in regional disparity in agricultural development because
of the inability of farmers in certain regions to diversify towards more profitable crops. Rural
poverty and regional inequality in Thailand is partly due to the lack of farm-level
diversification. There are also diferences in rice productivity that affect farm income in
different regions (Isvilanonda and Wattanutchariya 1994).
The overall aim of this paper is to analyse the pattern of diversification at farm level, its
effects on farm income and the constraints faced by farmers in different regions and under
different production environments.
This paper will address the following questions: • Is diversification out of rice more difficult in poorer regions than in prosperous regions? • Is diversification into other agricultural activities easier in irrigated areas growing modern
rice than in rain-fed areas growing traditional rice? • What are factors that affect the ability of farmers to switch to high-value crops? • How is diversification related to income inequality in rural areas and across regions? The rest of the paper is organized as follows: II. A brief background of Thai agriculture III. Conceptual issues related to diversification IV.The study areas and data V.Survey results V.1 Changes in economic and demographic characteristics V.2 Land use and cropping patterns V.3 Diversification in terms of gross value of agricultural production V.4 Constraints to diversification within agriculture V.5 Household income from different sources V.6 Intersectoral diversification – dependence of households on non-farm
3 Share of agricultural exports
1971 1982 since then
31% 58% around 50%
(Rural Poverty Profle World Bank)
3

Activities V.7 Rice intensification, diversification and poverty/inequality VI. Determinants of agricultural diversification VII. Summary, conclusions and policy implications
II. A brief background of Thai agriculture
Thailand has experienced steady economic growth and structural changes in the economy in
the last four decades that enabled her to gain a position among the newly industrialized
nations. While a great deal of this growth comes from industrial development, agricultural
sector has contributed significantly in the process through exports, cheap food supply and
release of labour for industrial development. The structural changes associated with economic
growth reflect the changing role of agriculture in the economy. The share of agriculture in
GDP declined from 44% in early 1960s to 10% in recent years (Isvilanonda 1998). Its share in
employment has shown similar trend albeit at a slower pace. The share of agriculture in total
employment has fallen from 83% in 1957 to 57% in 1999. In more recent years it has hovered
around 50%. (Mundlak, Larson and Butzer 2002).
The difference between the shares of agriculture in GDP and employment suggests a huge
labour productivity gap between agriculture and manufacturing, and it has serious
implications for rural poverty and rural/urban inequality. Although Thailand has been very
successful in reducing poverty because of rapid and steady economic growth, rural poverty
especially in certain regions is a serious problem. 90% of the poor live in rural areas and 2/3
of the poor live in northeastern provinces indicating high regional inequality ( Mundlak et al
2002; World Bank 1999; Kakwani 1998). Rural-urban disparities have also increased after the
financial crisis because of the inability of the urban sector to absorb rural labour at a rapid
rate, and the declining importance of agriculture in the total value-added. We underscore in
this paper that Thai agriculture has still a major role to play, and the major challenge is to
switch to high value-added products- in other words, agricultural diversification.
Agricultural diversification in Thailand means primarily deintensification of rice
production.Thailand became a major rice exporting nations in the second half of 19th century
because of her abundant suitable land. The favourable land/man ratio is one of the reasons
behind Thailand´s late adoption of land-saving modern rice technology. However, she started
losing her monopoly position in international market in the late 1960s. The Green Revolution 4

has enabled other Asian countries to achieve not only food self-sufficiency but also to have
surplus rice for export. Other reasons behind Thailand´s weakening position are the gradual
exhaustion of suitable land for rice, water scarcity and lack of expanded irrigation facilities.
Traditionally, squeezing rice farmers through export tax, rice premium and government
control of rice sale were the main features of Thai policies (Siamwala 1975). Discrimination
of rice farmers has weakened since the 1970s partly because of competition in the
international market. Government supported the adoption of new technology through
investment in irrigation/ infrastructure, although this constitutes a small proportion of total
rice area (Isvilanonda 1998). In spite of this, rice is facing the problem of low profitability
mainly because of the declining demand in both international and domestic markets. Ideally,
declining profitability of rice should induce farmers to switch to other crops. But this has not
happened uniformly– the pattern of deintensification of rice and diversification into other
crops and non-farm activities differs from region to region. We analyze these differences on
the basis of our primary household-level data in the following sections. First, some conceptual
issues have to be clarified.
III. Conceptual issues: Definitions and measures of farm/household-level diversification
used in the study
Traditionally, diversification strategies undertaken by households are primarily to deal with
various risks and to maintain food security. Diversification in the new perspective, however,
aims at a higher goal, that is to reduce urban-rural income gap through a switch to high-value
agricultural products.
Three types of diversification has been considered: 1. Crop diversification – diversification out of rice intensification
2. Diversification of agricultural production
3. Intersectoral diversification into non-agricultural activities
Crop (including tree crops) diversification: With this concept we primarily focus on land use
pattern and refer to the need to diversify out of rice monoculture. The central issue is to
register the degree and patterns of rice specialization/dependence under different
agroecological conditions that is irrigated, rain-fed, flood-prone and drought-prone.
5

Agriculture-sector diversification. This involves increasing the variety of agricultural
commodities produced at the farm level. This kind of diversification towards a more
diversified output portfolio including different crops, livestock, aquaculture and other
agricultural activities is also referred to as horizontal diversification. Although broader than
crop diversification, it still represents a rather narrow concept of agricultural diversification.
Intersectoral diversification refers to economic activities outside the agricultural sector.
Households may diversify their economic activities in different ways. Some or all working
members may devote to either on-farm or off-farm non-agricultural activities. They may be
self-employed or employed as wage worker in the village or nearby towns. The degree of
diversification may be reflected in the proportion of household income derived from non-
agricultural activities.
Obviously, the three concepts overlap. Crop diversification forms part of a sectoral change.
Inter-sectoral diversification may involve processes of vertical diversification encompassing
non-farm activities such as marketing, storage and processing. The growth of agro-food based
industrial activities often represents an important, intermediary step in the process of rural
income diversification.
Measurements
In order to study the patterns of crop diversification we use three measurements. First, we
measure the allocation of land to rice, upland crops and fruit trees respectively. Measuring the
proportion of cultivated area of the three categories respectively, however, provides a rather
rough description of the importance of crop diversification. Fruit trees, for example, may
occupy a proportionally small area, but represent an important contributor to the total value of
agricultural output.
For this reason we have measured the proportion of cultivation income stemming from the
three different categories of cultivation. In the same manner we calculate the proportion of
total cultivation income from the most important crop. In our samples, the ‘topcrop’ is rice for
some 90% or more of the farm households.
Thirdly, we have calculated a crop diversification index: 6

n CDIi = 1/ Σ [X ij/ xi]2 j=1 where CDIi is the diversification diversity index for household i (i = 1, 2, 3,…, n), Xij is the
gross value of production of commodity j (j = 1, 2, 3, …, m) by household i, and Xi is the
total value of all crop production by household i (Pakpahan, Kasryno, Djauhari, and Saleh
1990:34 cited in Lindvall, L. 1999). The minimum value of CDI is one implying total
specialzation or monoculture. In our case the maximum value is three as the included
commodities are (1) rice, (2) cashcrops and (3) fruits.
In addition to crop diversification index agriculture-sectoral diversification is analyzed in
terms of the proportions of total agricultural income accounted for by rice, other crops, and
livestock (including aquaculture).
Inter-sectoral diversification is measured in two ways. The household’s dependence on rice
cultivation is defined as the proportion of total household income deriving from rice
cultivation. This will tell us something about the household’s diversification away from rice.
Here we need to keep in mind the sometimes confusing but more or less widespread use of the
term diversification. A lower proportion of income deriving from rice may represent a
simultaneous ‘diversification out of rice’ (Pingali et. al. 1997) but specialization in another
crop. The importance of non-farm income (the sum of wages, non-farm self-employment,
pensions, subsidies, remittances, capital income, land rent etc) is also measured in relation to
total income and the ratio may be used as an indicator of the overall process of economic
diversification. IV. The study areas and data The study is based on household-level data from two regions, Suphan Buri in the Central
Plain and Khon Kaen in the Northeastern Province- the commercial and traditional rice
growing areas in Thailand respectively. The Central Plain has higher adoption of modern
variety due to higher proportion of irrigated land compared to Northeast (Isvilanonda 1994).
Rice exports come mainly from the Central Plain. In each province, there are, however,
7

villages with different production environments that influence rice intensification and
diversification - farm-level as well as intersectoral.
In Suphan Buri, three village sites were purposively selected based on production
environments. Wang Yang village (SP1) in the District of Sri Prachan , Sa Ka Chome village
(SP2) in the Distict of Don Chedi and Jora Khae Yai village (SP3) in the District of Bang
Plama represent irrigated, rainfed, and flood prone environments respectively. Unlike
Suphan Buri, the three production environments in Khon Kaen are irrigated, rainfed, and
drought-prone. Ban Koak village (KK1) and Ban Kai Na village (KK2) in the District of
Muang represent irrigated and rainfed environments respectively. Ban Meng village (KK3) in
Nam Pong District represents drought-prone environment. The recent improvement of
irrigation ditch in nearby KK2, the rain-fed village has improved farmers´ access to
irrigation water.
Suphan Buri 3 production environments Irrigated SP1 rain-fed SP2 flood-prone SP3 Sri Prachan Don Chedi Bang Plama
8

Khon Kaen 3 production environments Irrigated KK1 rain-fed KK2 drought-prone KK3 Koak (Mor Fiel) Kaina Meng V. Survey results Sample description
These two regions were investigated in surveys at different points of time - 1995, 1998 and
2001/2002. The number of households investigated are 234 in 1995, 240 in 1998 and 280 in
2001/2002. A survey in the same region was conducted in 1987 as well when 295 households
were investigated. Our study does not document the results from 1987 since diversification
was not in focus then, and data are not available. The objective of generating panel household
data could not be fulfilled thoroughly as the same households could not found due to out- and
in-migration. In Thailand rural/urban mobility has been particularly high because of rapid
industrialization in the 1980s and early part of 1990s. This was interrupted by the financial
crisis in 1997.
V.1. Changes in economic and demographic characteristics (Table 1)
Size of the household: In Suphan Buri the number of household members increased on
average between 1995-1998, but later came down in 2001/2002. In Khon Kaen, on the other
hand, the average size of the household has increased throughout the period. The 2000 study
(Isvilanonda, Ahmad and Hossain, 2000) based on data from 1987 and 1998 indicate that the
size of the households including all members has declined in both regions during 1987 to
1998, whereas the number of working members did not change significantly. It suggests the
effect of slowing down of population growth and a reduction in the number of children.
The increase in the size of households between 1995-1998 was mainly due to an increase in
the average number of workers per household in both regions – in SB, it rose from 2.6 to
3.98, and in KK, from 3.35 to 3.82. The reason behind the rise may be the financial crisis that
hit the urban population hard and pushed them to rural areas. The data from 2001/2002 points
towards differences between the regions. In the Central Plain, the average number of workers
per household came down to 3.28 suggesting a recovery from the crisis and a movement of
workers to urban areas. But in the Northeast KK, average number of workers per household
9

has continued to increase in 2001/2002. It indicates that region has not recovered from the
crisis yet.
On the whole, the size of the rural labour force is greater in the Northeast than in the Central
Plain. The demographic pressure in the former region is also reflected in the lower
land/worker ratio discussed below.
Age of household heads: In both SB and KK, the average age went down during 1998-
2001/2002 suggesting that the older generation may be handing over farming to the younger
generation and/or younger people are moving in. This is a reverse trend as the previous study
(2000) indicates a rise in the age of HH during 1987-1998. This has an impact on the quality
of rural labour force as the younger people are likely to have higher level of education.
Education of household heads: In both regions, there has been an increase of education in
spite of the generally low level of education among the rural population. This may be due to
the younger generation being involved in farming.
Size of holding: SB has much larger size of landholding than KK - 7.26 hectares as against
2.08 as observed in 2001/2002. In both regions the size declined between 1995-1998 and
increased during 1998 and 2001/2002. The increase has been much faster in SB suggesting a
tendency toward land consolidation partly due to migration to urban areas mainly Bangkok,
changes in factor prices and mechanization in agriculture (Hossain, Isvilanonda 1994). The
continuing small size of landholding in KK indicates the lack of employment opportunities
outside the farm to make permanent migration possible, and hence, increasing pressure on
agricultural land. Both per capita and per worker landholding have declined in both regions
during 1995-2001/2002 but the decline is more in KK than in SB (Table 1).
The description of the economic and demographic features of the two regions indicates that
one important factor behind regional inequality is the demographic pressure on land in the
northeast.
10

V.2 Land use and cropping patterns:
Available community-level data and general observation suggest that in the irrigated areas of
central plain SB 5 crops are grown in two years, mainly rice, depending on family labour.
The cost of labour has gone up in recent years inducing mechanization of many agricultural
activities (Somporn and Hossain, 1994). The cultivation of water chestnuts on different plots
are quite common and brings high income to the farmers. Since processing of water chestnuts
is a labour-intensive activity, this created a lot of wage employment and put an upward
pressure on agricultural wage rates in the region. The flood-prone areas grow low-yield rice in
deep water, and some specialization in fish has been observed. Diversification into high-value
aqua-culture like lotus seeds and flowers as export goods to Japan is a new development in
this area. The rain-fed area is characterized by cultivation of one-rice crop (mainly
traditional), cassava, sugarcane and livestock. Infrastructure - roads, electricity, has been
developed to attract industrial investors and promote non-farm activities. Broadcast method is
used in rice cultivation in Suphan Buri because of high wage cost and soil condition.
The scarcity of irrigation water in the north-east KK particularly in the dry season has induced
farmers to grow one rice crop basically under rain-fed conditions in the wet season and to
keep most of the land in fallow during the dry season. In one of the villages, with the
availability of pump irrigation facilities, farmers have adopted a rice-rice cropping pattern. In
contrast to broadcasting method in SB, transplantation of rice is common in Khon Kaen in all
production environments –broadcast rice is not suitable for KK except in irrigated areas near
the city where wages rates are higher. In 1987, only 6% of the area was allocated to upland
crops such as vegetables, soybeans, water chestnuts and some perennial crops like sugarcane
and mulberry fruit trees (Isvilanonda, Ahmad and Hossain, 2000).
According to our household-level survey data (2001), total sown area is much smaller (only
2.19 hectares) in KK in compared to Suphan Buri (11.7 hectares) (see Table 1). There has
been a decline since 1995 in KK but an increase in SB. The larger sown area in SB is partly
due to greater cropping intensity because of the availability of irrigation facilities and the
spread of new modern rice varieties with shorter cropping period. Cropping intensity for SB
for all villages is 1.5 and for KK 1.05 but it differs a great deal according to production
environment within each region. The irrigated village (2.0) and the flood-prone one (1.83) in
11

SB have much higher cropping intensity compared to the rain-fed village (0.85). Furthermore,
the change in the cropping pattern from single crop of local rice variety to double crops of
modern varieties (leaving the land idle during the wet season) in the flood-prone village has
led to the increase in rice cropping intensity of SB. The larger farm size coupled with the
increase in cropping intensity has resulted in a rise in average sown area in SB. In KK, the
cropping intensity in the irrigated village is 1.6 whereas in the rain-fed villages it varies
between less than to one.
Rice intensification (Table 2): In spite of greater cropping intensity, the percentage of sown
area under rice in 2001 in SB is lower (86.67) than in KK (90.67). In SB, there has been a
decline in rice intensification since 1995 in contrast to KK where it has increased. There are
considerable differences among the villages in SB. The irrigated village has rice
intensification 74% whereas the rainfed and flood-prone villages have 86.7% and 99%
respectively. Both irrigated and rain-fed villages have experienced a decline in rice
intensification since 1995. In KK, the villages do not differ very much in terms of rice
intensification. Only the drought-prone village has experienced some decline.
While all households grow rice in both regions, the proportion of households growing only
rice varies. In SB the proportion is lower, 54% in 2001/02 compared to 61% in KK. In KK,
it is increasing while in SB it is decreasing. In SB, the proportion of households growing
cashcrops is high, 40% and is growing. In KK, the proportion of households growing upland
crops has become half in 2001/02 since 1995, while the proportion growing fruits is going up
steadily.
In SB, rice intensification is lower in irrigated areas. Almost 78% of the households are
involved in cash crop cultivation devoting 22% of the sown area. Rice intensification in the
flood prone areas is extremely high and has influenced the region average. In KK on the other
hand, rice intensification is higher in irrigated than in rain-fed or drought-prone areas. High
intensification of rice in KK is due to poverty and food insecurity. The lack of resources,
(land and capital) and too much risks make the switch to other crops difficult. Looking at the
diversification pattern, it appears that in SB, it is cashcrops, water chestnuts, rather than fruits
that led to diversification out of rice. In KK, the importance of uplands crops has declined
with a corresponding increase in fruit trees.
12
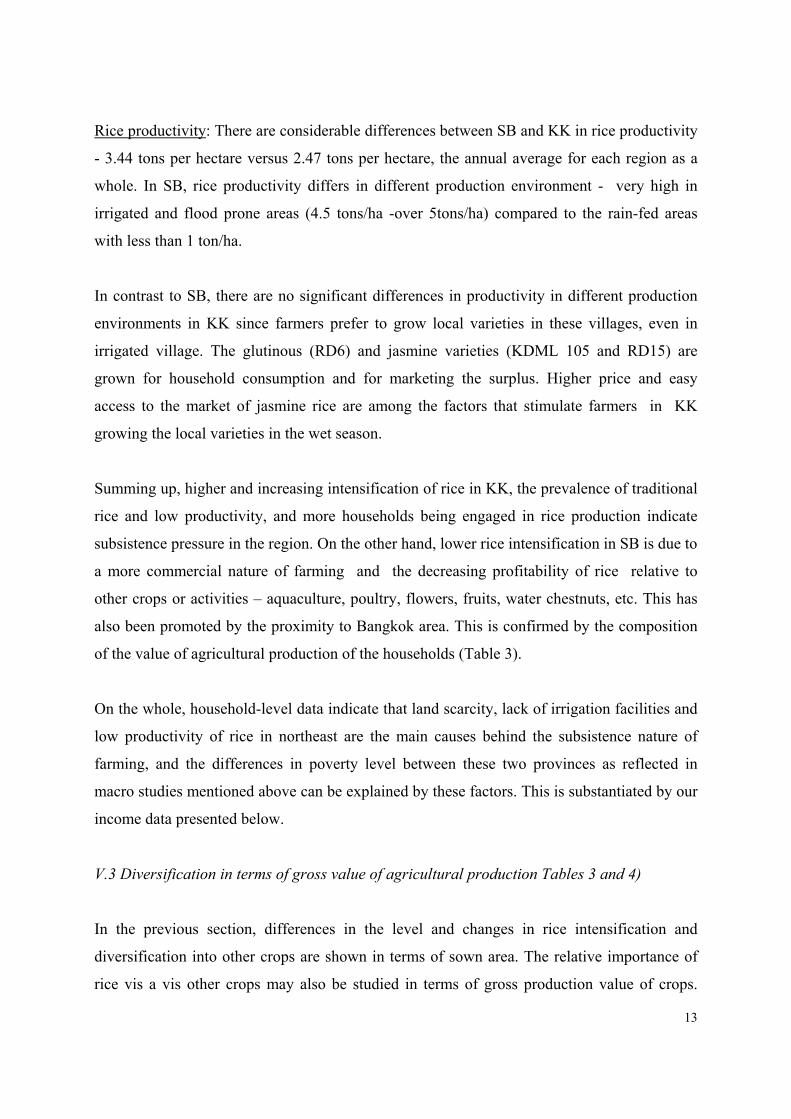
Rice productivity: There are considerable differences between SB and KK in rice productivity
- 3.44 tons per hectare versus 2.47 tons per hectare, the annual average for each region as a
whole. In SB, rice productivity differs in different production environment - very high in
irrigated and flood prone areas (4.5 tons/ha -over 5tons/ha) compared to the rain-fed areas
with less than 1 ton/ha.
In contrast to SB, there are no significant differences in productivity in different production
environments in KK since farmers prefer to grow local varieties in these villages, even in
irrigated village. The glutinous (RD6) and jasmine varieties (KDML 105 and RD15) are
grown for household consumption and for marketing the surplus. Higher price and easy
access to the market of jasmine rice are among the factors that stimulate farmers in KK
growing the local varieties in the wet season.
Summing up, higher and increasing intensification of rice in KK, the prevalence of traditional
rice and low productivity, and more households being engaged in rice production indicate
subsistence pressure in the region. On the other hand, lower rice intensification in SB is due to
a more commercial nature of farming and the decreasing profitability of rice relative to
other crops or activities – aquaculture, poultry, flowers, fruits, water chestnuts, etc. This has
also been promoted by the proximity to Bangkok area. This is confirmed by the composition
of the value of agricultural production of the households (Table 3).
On the whole, household-level data indicate that land scarcity, lack of irrigation facilities and
low productivity of rice in northeast are the main causes behind the subsistence nature of
farming, and the differences in poverty level between these two provinces as reflected in
macro studies mentioned above can be explained by these factors. This is substantiated by our
income data presented below.
V.3 Diversification in terms of gross value of agricultural production Tables 3 and 4)
In the previous section, differences in the level and changes in rice intensification and
diversification into other crops are shown in terms of sown area. The relative importance of
rice vis a vis other crops may also be studied in terms of gross production value of crops.
13
This would indicate the profitability of growing rice vis a vis cash crops – both level and
changes.
In both Suphan Buri and Khon Kaen, the shares of rice in terms of sown area is much greater
than the shares in terms of gross value of crops. But the trend is moving in the opposite
direction. Rice is gaining importance both in terms of value and sown area in KK, and is
declining in importance in Suphan Buri. Since there are significant differences within each
region depending on the production environments, we discuss the data village-wise.
Suphan Buri
In the irrigated areas of SB, the share of rice in total sown area is 70% but in terms of gross
value it is only 48%. On the other hand, the cash crops use only 22% of the sown area but its
share in gross value is more than that of rice, 49%. These differences have widened over the
years due to either a decline of rice price and/or rise in the price of cash crops, in this case
water chestnut. In the rain-fed village, the shares of rice in total sown area and in gross value
were almost the same. But in 1998 and 2001 the shares of rice in terms of gross crop value
have fallen. On the other hand, shares of cash crops in gross value more than doubled with
modest increase in the shares in terms of sown area. In the flood-prone village, no cash crops
are grown. Hence, there is no difference between the share of rice in terms of sown area and
gross crop value.
There has been an increase in diversification except in flood-prone areas. In Suphan Buri both
rice and water chestnuts are topcrop, and crop diversification index indicates a high level of
diversification. However, water chestnuts are grown only in irrigated area because of the
specific soil quality.
The contribution of livestock (not aquaculture) is significant in the rain-fed village compared
to other villages. Their importance is, however, declining both in terms of gross production
value in agriculture and the number of households involved in such activities with a
corresponding rise of cash crops, particularly sugarcane. There has been an increase in the
share of livestock and aquaculture in other villages from a very low level.
14

Khon Kaen
The drought-prone and irrigated villages follow closely the average pattern mentioned above.
The drought-prone village seems to have experienced an increase in the profitability of rice.
In 1995, the share of rice in sown area was 93% but the share in gross value was 76%. By
2001/2 the share in value rose to 96% while the share in sown area declined to 91.5% slightly.
Good rainfall and higher price of Jasmine rice are some of the factors that explain the
increased share of rice income in total income. It may also mean that farmers grow low-value
crops, and little value is added in different stages such as grading, packaging, transport,
marketing and sales. The rain-fed village, on the other hand, has experienced a declining
importance of rice and rising importance of upland crops mainly in terms of value.
Because of the increasing importance of rice, crop diversification index (Table 3; method of
construction of the index is explained in p. 6). in irrigated and drought-prone villages shows
a declining trend, but a rising trend is observed in the rain-fed village. On the average, it has
declined since 1995 with a slight increase in 1998. The share of aquaculture and livestock in
household income is about 10% on average with the drought-prone having a larger share
(more than 15%). The proportion of households engaged in such production has been
declining over time.
Summing up, our discussion above on diversification out of rice and into other crops indicates
that the richer and commercial region (SB) has lower dependence on rice relative to other
cash crops compared to the poorer region (KK) where production for subsistence is more
common. Irrigation and water control facilities have promoted diversification into cash crop
production in SB whereas in KK, there is more rice intensification in the irrigated village. We
shall now see whether these differences may be explained in terms of the constraints.
V4. Constraints to diversification within agriculture
Table 7 for each region indicates the percentages of the households who identified the most
difficult constraints with respect to diversification in different agricultural activities. In both
regions, the majority of farm households consider water as the most important constraint
mainly for upland crops, fruits and aquaculture. Livestocks seem to be less affected by this.
The proportion of households complaining about water problem is higher in SB than it is in
15

KK. A much greater number of households in KK face problem with land tenure,
agricultural debt and availability of labour. On the other hand, households in SB, especially
from the irrigated village, face problems with lack of knowledge, marketing and price
fluctuations. In KK, differences among villages are not significant as they are in SB.
It appears that there are three categories of problems: basic inputs (soil, labour, water),
institutional factors (access to land, credit, knowledge) and price/marketing factors.
Households in SB face more constraints with respect to basic facilities and marketing risks
whereas those in KK experience more institutional problems. A high man-land ratio and a
smaller farm size may be important factors. The differences between the two regions are
mainly due to the commercial versus subsistence nature of production. In KK very few
households, 8 out of 142 mentioned marketing problem, and no household considered price
fluctuation as a constraint.
V.5 Household income from different sources – agriculture, non-agriculture and remittance
(Tables 5a and 5b) All sample households
While KK is more dependent on rice as a source of income within agriculture, its dependence
on rice in total income is significantly less because of its dependence on non-farm activities.
In 2001/02, only 23% of household income was from agriculture out of which 19% came
from rice. Whereas in SB, agriculture contributed 54% to total income out of which rice has
43%. The level of income is almost double in SB than in KK. There was a decline in income
in 1998 in SB but not in KK. It means that Khon Kaen depends on intersectoral
diversification to cope with their poverty problem.
V.6 Intersectoral diversification - dependence of households on non-farm activities
We have observed above that households in KK are more dependent on non-farm income
outside of the household. In 2001, the percentage of non-farm income in KK was 63%
compared to 26% in SB (Table 5b). The number and proportion of household members
engaged in non-farm activities are although larger in KK than in SB the difference is not as
great as it is with respect to income. It may be due to the difference in time devoted to such
activities ( Table 9). In SB, the workers may have devoted only part time to non-farm
16

activities that explains the lower proportion of non-farm income. In KK on the other hand, the
size of the landholding is too low to employ workers full time on the farm. There has also
been a rapid rise in the proportion of workers in non-farm activities in KK. In terms of
destination of work, most workers depend on employment in the village, rural town or the
home province. Because of the proximity to Bangkok, a greater proportion of workers from
SB work in Bangkok than workers from KK.
V.7 Rice intensification, agricultural/ intersectoral diversification and poverty/inequality
Inequality trends:
Our previous study (2000) on poverty and inequality in rural Thailand indicated an increase in
inequality during 1987-1998. Data of this study relate to a different period (1995-2001) and
exhibit different trends. First, we look at inequality between regions followed by inequality
within each region. Inequality is expressed in two ways. First, in terms of the ratio of average
per capita income in the two regions- SB/KK, and secondly, in terms of the ratios of the
incomes of the poorest 20% and the richest 20%. In 1995, average per capita income in SB
was 2.8 times of the income in KK. There has been a decline in inequality between 1995 and
1998. Inequality increased slightly in 2001 since 1998 but has not reached the level of 1995.
Table 11. Inequality between regions: (derived from Table 5a and Table 10) 1995 1998 2001 The ratio of average per 2.8 2.03 2.14 capita household income (SB/KK) Ratio of incomes of the poorest 20% in SB/KK 1.3 0.7 1.8 Ratio of incomes of the richest 20% in SB/KK 2.2 2.5 2.2 In 1995, the poorest 20% of the population in SB earned 1.3 times more than their counterpart
in KK. The ratio of income of the poorest 20% for 1998 indicates that the financial crisis was
especially hard for the poor in SB as their income fell below that of the poor in KK. But it has
picked up faster and inequality among the poor between the two regions has increased in
2001. The income of the poor in SB was 1.8 times of the income of the poor in KK. In terms
of the incomes of the rich inequality remains the same between 1995 and 2001. However,
there was a slight increase in 1998. On whole, it can be concluded that inequality between the
17

regions has increased especially for the poorest 20%. Sources of inequality between the
regions are:
• Size of landholding – average size of landholding is much higher in SB than in KK for all
quintiles. In spite of greater inequality in the distribution of land, the poorest 20% of the
population in SB has 4.17 hectare on average compared to 1.46 hectares in KK.
• Irrigation facilities – as we mentioned before, irrigation and drainage facilities are mostly
concentrated in the central plain covering SB. The northeastern province where KK is
located suffer from the lack of irrigation facilities that determine the productivity of land
and cropping intensity having significant effects on farm income.
• Size of households: Average number of household members is higher in KK than in SB
among the poorest 20% of the population while the number of workers is the same. It
means that the workers of the poorest households in KK has less land to work with and
more family members to support.
• Nearness to metropolitan areas: SB is near Bangkok metropolitan area that enhances job
opportunities as well as higher wages for the poor.
Inequality within each region
Our analysis of income data during 1995-2001/2002 for five income groups indicates a higher
level of inequality in SB than in KK. The shares of the poorest 20% in total income is higher
in KK than in SB and the opposite is the case for the shares of the richest 20% for all the
years. There is a clear declining trend of inequality within each region with larger effect in
SB. The income share of the poor in SB increased from 2.6% to 4.8% during 1995-2001. The
corresponding figures for KK are 3.7% and 4.9%. The sharper decline in inequality in SB is
also reflected in the differences in income between the poorest 20% and the richest 20%. In
1995, the richest 20% in SB earned 18 times more than the poorest 20%, and in 2001, the
figure went down to 10. In KK, on the other hand, the richest 20% earned 10 times more and
in 2001 7 times. On the whole, our data indicate that while the level of inequality in KK is
lower than in SB, inequality is declining at a faster rate in SB than in KK.
18

Table 12. Inequality within regions
Khon Kaen Income Shares (%) 1995 1998 2001 Poorest 20% 3.7 4.0 4.9 Poorest 40% 12.5 11.7 14.7 Richest 20% 52.3 53.4 47.0 Suphan Buri Poorest 20% 2.6 1.0 4.8 Poorest 40% 9.0 6.0 16.0 Richest 20% 54.0 58.0 50.0 Sources of inequality: Inequality in KK is mainly due to unequal access to land and irrigation
facilities that create differences in farm income. There is also a lack of access to credit that
prevents the poor to undertake non-farm activities like trading or services. Instead, they
depend on wage employment in farm and non-farm sector. There is no significant difference
among the rural population with respect to education. In SB, on the other hand, education
may have played a role because there is a difference of two years of schooling between the
poorest and the richest. The distribution of land is also unequal – the richest 20% having 3
times more land than the pooest 20%. The rich depends on commercial farming while the
poor depend more on non-farm activities both within farm and non-farm sectors. The poor
have benefited from agricultural development in the region that has led to higher wages.
Lower level of inequality in KK than in SB is due to more equal distribution of the access to
production factors. However, the poor in SB have managed well both in absolute terms and in
a dynamic sense because of the higher level of access to resources and opportunities.
V. Determinants of diversification – regression analyses
We have used crop diversification index for each household as the dependent variable. This
index is based on the relative contribution of rice, upland crops/aquaculture/livestock and
fruits in gross income. As for the explanatory factors, our analysis of the diversification
process above indicates that the following factors may have a role to play:
19

• access to land - average size of landholding is expected to have positive effect on
diversification
• Price of rice – declining price having positive effect
• Irrigation, infrastructure and water control - % percentage of irrigated area/water control,
distance to main road having positive effect
• Agricultural credit has positive effect
• Proximity to urban areas has positive effect
• Age of the household having negative because younger generation is more innovative.
• Demographic pressure – the man/land ratio has negative effect on diversification.
• The proportion of rental land in total land has negative effect on diversification.
The following OLS regressions were run and the results are as follows: (see Tables 13, 14 and
15 in the separate file).
Dependent variable: crop diversification index for 1995, 1998 and 2001
Explanatory variables:
• Age of household head in years
• Debt – amount of loan
• Debt – number of sources of loan
• Farm size – total landholding of household
• Man/land ratio – population/total land
• Rental ratio – rented land/total land
• Rice price – paddy price at farm gate
• Irrigation – dummy variable (irrigation 1, others = 0)
• Rainfed - dummy variable (rainfed = 1, others = 0)
In 1995, the above factors explain 25% of the variation in diversification among the sample
households. Irrigation and the age of the household head have turned out to be significant at
1% level with positive effect and negative effects respectively. The model worked poorly for
1998. It explains only 8% of the variation in the dependent variable, and irrigation is the only
significant factor at 1% level. The model using 2001 data explains 16% of the variation, and
several factors are found to be significant – irrigation, and man-land ratio are significant at
20

1% level whereas rental ratio is significant at 5% level. Man/land ratio has a negative effect
as expected. Rental ratio does not have the expected sign. The reason needs to be explored.
The region dummy has the positive sign and is significant at 1% level indicating that
diversification is higher in rain-fed villages.
VI. Summary, conclusions and policy implications
The aim of the paper was to explain rural poverty and regional inequality in Thailand in
terms of household-level agricultural diversification. The paper argues that since the Thai
industrial sector cannot absorb the rural labour force at a rate fast enough to reduce
rural/urban income gap, the attention should be focused on increased productivity of
agriculture through diversifcation into high-value crops. Since farm-level diversification is
most relevant for household poverty and inequality, the study used household-level data to
understand the process of diversification – the factors and the constraints involved. Two
major rice growing areas – the central plain (SB) and the northeastern province (KK) are
studied. Three villages in each region represent different agro-ecological environments.
Diversification primarily refers to deintensification of rice production and a switch to other
cash crops, fruits, livestock and aquaculture. It has been found that rice intensification is
higher and increasing in the northeast compared to the central plain. It also means that
diversification in terms of land use pattern and the composition of gross value of agricultural
production is lower in the former than in the latter region. Considerable differences are
observed among different production environments within each region. The extent of
diversification is higher in irrigated and rain-fed areas in contrast to the flood-prone areas in
the central plain. Whereas in the northeast, the rain-fed village has experienced higher level of
diversification than the irrigated and drought-prone areas. The lack of access to land and
irrigation facilities are major constraints for the northeast both for the cultivation of modern
rice and higher cropping intensity. The immediate impact of irrigation is, therefore, increased
rice intensification.
The factors that induce diversification in these two regions are quite different. The irrigated
village in the central plain is the most prosperous area characterized by commercial farming.
Farmers in this village face declining profitability of rice vis a vis other cash crops like water
21

chestnuts. The reasons are the long experience of modern rice cultivation and increased
productivity together with an inelastic demand for rice as well as high labour costs. These
have led to the so-called ”crisis of success”. In the poorer region, the concern for food
security explains the dominance of rice, and even diversification is attempted to maintain
income stability and to meet subsistence needs. The differences in the nature of farming
(commercial versus subsistence) are reflected in the constraints to diversification as
perceived by farmers. The main constraints perceived by KK farmers are the lack of access to
production factors whereas in SB farmers face marketing problem. The differences in the
ability to diversify in the two regions are reflected in the growing inequality between regions
while inequality has declined in the more prosperous regions.
It should be noted that these two regions are at different stages of agricultural transformation
(Timmer 1988) and the policy implications for agricultural development and diversification
are, therefore, different. In the central plain, the policies should be directed to removing
contraints in the production of and marketing of high-value crops. On the other hand, in the
north-eastern province the main problem is to increase the productivity of rice cultivation as
well as cultivation of other crops. Policies should be directed to secure property rights,
irrigation, infrastructure and credit facilities.
References: Barker R. And Dawe D. (2002) ” The Transformation of the Asian Rice Economy and
Directions to Future Research: the need for increased productivity” in Sombilla, Hossain and
Hardy cited below.
Bargouti, S. Garbus, L and Umali, D. (eds) (1992) Trends in Agricultural Diversification:
Regional Perspectives, World Bank, Washington D. C.
David, C. And Otsuka, K. (1994) Modern Rice Technology and Income Distribution in Asia, Lynne RiennerPublishers, London and IRRI, Manila. Isvilanonda, S. Ahmad, A. and Hossain, M.(2000) ”Recent Changes in Thailand´s Rural Economy” in Income distribution and poverty in Rural Asia – Economic and Political Weekly Isvilanonda, S. (1994) ”Modern Variety adoption, Factor-price differential, and income distribution in Thailand” in David, Keijiro and Otsuka´s study.
22
Isvilanonda, S. (1998) ”Rice Production and Consumption in Thailand: The Recent Trend and Future Outlook”, Thailand Journal of Agricultural Economics, 55. Kakwani, N. And Krongkaew, M. (1998) ”Poverty in Thailand: Defining, Measuring and
Analysing”, Development Evaluation Division, National Economic and Social Development
Board, Bangkok.
Lindvall, L. (1999) Diversification in Small Scale Agriculture – A Case Study of Vietnam,
Minor Field Study no. 108, Department of Economics, Lund University.
Mundlak, Larson and Butzer (2002) Determinants of agricultural productivity in Thailand, Indonesia and the Philippines – World Bank website
Pakpahan, A., Kasryno, F., Djauhari, A. And Saleh, C. (1990) A Preliminary Study on
Agricultural Diversification in Indonesia, Center for Agroeconomic Research.
Pingali, P. (1997) ”Agricultural Commercialization and Farmer Product Choices: the Case of
Diversification out of Rice” Asian Rice Bowls The Returning Crisis edited by Pingali, P.
Hossain, M. And Gerpacio, R. V., IRRI.
Siamwalla, A, (1975) ” A History of Rice Price Policies in Thailand” in Finance, Trade and
Economic Development in Thailand, Essays in honour of Kunying Suparb Yossundara, edited
by Puey Ungphakorn et. al.
Sombilla, M, Hossain, M. And Hardy, B. (2002) Developments in the Asian Rice Economy,
IRRI, Metro Manila.
Timmer. P. C. (1988) ”The Agricultural Transformation” in Handbook of Development
Economics edited by H. Chenery and T. N. Srinivasan, Elsevier Science Publishers B. V.
Amsterdam.
Timmer, P. C. (1992) ”Agricultural Diversification in Asia: Lessons from the 1980s and
Issues for the 1990s” in Trends in Agricultural Diversification: Regional Perspectives edited
by Bargouti et al. cited above.
23

24
World Bank (1999) Thailand – Rural profile, website.