Embed Size (px)
Citation preview

African Studies Centre Leiden, The Netherlands
Rural livelihood sources for urban households
A study of Nakuru town, Kenya
Samuel O. Owuor
ASC Working Paper 51/2003�
Department of Geography University of Nairobi, Kenya
� This online edition of the working paper does not include maps and appendices. Please contact African Studies Centre ([email protected]) for the complete working paper.

2
African Studies Centre P.O. Box 9555 2300 RB Leiden The Netherlands Telephone +31-71-5273372 Fax +31-71-5273344 E-mail [email protected] Website http://asc.fsw.leidenuniv.nl Department of Geography University of Nairobi P.O. Box 30197 GPO – 00100 Nairobi, Kenya Telephone +254-2-334244 Fax +254-2-336885 E-mail [email protected] � Samuel O. Owuor, 2003

3
Contents
Foreword
1: Introduction Urbanization
Urban poverty and the changing nature of urban-rural linkages Rural livelihood sources for urban households: An overview of literature
Nakuru town: Background information Research methodology
2: Characteristics of the sampled households
Household structure Characteristics of the household heads Household conditions and amenities
Livelihood sources Income and expenditure
3: Rural plots Introduction
Access to rural plots Location of rural plots
Ownership and use of rural plots Importance of rural plots to the urban households
4: Rural crop cultivation by urban households in Nakuru town
Introduction Crops cultivated
Harvests Inputs for rural crop cultivation
Nature of involvement in rural crop cultivation
5: Rural livestock keeping by urban households in Nakuru town Introduction Animals kept
Ownership and purpose of rearing livestock Animal products
Inputs and nature of involvement in rural livestock keeping
6: Importance of rural economic activities for the urban households’ food security and income situation
Rural farming Rural non-farming activities

4
7: Urban-rural linkages Migration history of the household heads
Visits to the rural plot by household head and/or spouse Visits to the Nakuru town household by rural family members
Flows between urban and rural households Future plan and attachment to rural plot
8: Multi-spatial and mono-spatial livelihoods: A preliminary comparison
Introduction Household characteristics Household food security
9: Summary and conclusions
Summary of findings Conclusions
References

5
Foreword The underlying report contains the result of a general survey, carried out between September and December, 2001 on “Rural livelihood sources for urban households: A study of Nakuru town, Kenya.” The broad objectives of this study are, firstly, to investigate in how far households in Nakuru town - and the poor in particular - depend on rural sources for their livelihoods and, secondly, to determine in how far urban-rural linkages have changed due to increased rural and urban poverty since 1980. This study is part of the Nakuru Urban Agriculture Project (NUAP), a research project on farming by urban dwellers in Nakuru town, Kenya. This is a joint undertaking by the University of Nairobi (Department of Geography, Department of Urban and Regional Planning, Centre for Urban Research) and the African Studies Centre (ASC), Leiden, The Netherlands. The results presented in this report cover the various components of the general survey. These are: household demographic characteristics; urban farming and non-farming economic activities; rural crop cultivation; rural livestock keeping; rural non-farming economic activities; urban-rural linkages; general food security situation; and housing conditions and amenities. More detailed information covering other aspects of the research will be gathered during the in-depth qualitative interviews and case studies. This work would not have materialized without the input of the eight research assistants: Daniel Okoo, Alex Obado, John Gitari, Jane Wairimu, Joyce Kariuki, Michael Nguru, Milly Gathoni, and Steve Kariuki, I thank you all very much for your work and the great moments we had together. Special thanks go to Okoo for the job he accomplished as a field supervisor and in the identification and mapping of the Enumeration Areas and the sampled households. The same goes to Jane and Joyce for the extra role they played as data entry assistants and the long hours they put in during that process. Nicole Versleijen was very helpful throughout the fieldwork while at the same time undertaking her MSc research in Nakuru, also part of NUAP. I also wish to extend my sincere gratitude to Prof. Ton Dietz (University of Amsterdam), Dr. Dick Foeken, Ir. Wijnand Klaver (ASC), Prof. Robert Obudho, Prof. Chris Macoloo and Mr. Francis Mwaura (University of Nairobi) for their effort, time and support. I am heavily indebted to Dick for his exceptional interest in this topic, encouragement and support in all stages of this research and for being a friend and a colleague in NUAP. I am grateful to WOTRO for the research fund, to ASC for according me a Visiting Fellows status for the entire period of my study, and to the University of Nairobi for granting me study leave. To all the staff at the ASC who supported me in one-way or the other: Ahsanteni Sana. Lastly, but not least, this study would have not been possible without the 344 respondents: Thank you very much for your continued cooperation, understanding and patience.

6
Chapter 1
Introduction Urbanization In the mid-1970s, Africa was the least urbanized region in the world, with 25% of its population living in urban settlements. By the year 2000, 37% of the African population was expected to be living in urban areas and in 2025 it is projected to be more than half. Although these proportions are still lower than for other continents and for the world as a whole, the annual growth rates of the urban population are highest in Africa (UNCHS/Habitat 1996). In Kenya, the share of urban population increased from 7.8% in 1962 to 20% in the year 2000 (Kenya 2000). The high rate of urbanization in Kenya and in other developing countries has been accompanied by increasing urban poverty. Close to a million more Kenyans have in the past joined the ranks of those who cannot afford a decent meal, school fees and adequate health care. The level of absolute poverty1 has increased from 44% in 1992 to 52% in 1997 (UNDP 2002). The poverty situation has particularly worsened in the urban areas in comparison to the rural areas. Therefore, although poverty is more prevalent in the rural areas, it is increasingly becoming an urban phenomenon. As a result of the escalating trends in urban poverty, many households, especially those in the low-income bracket, suffer from food insecurity. As a coping strategy, risk spreading or income diversification is increasingly becoming an important feature in many urban households. There are clear indications that many urban households in sub-Saharan Africa rely partly on rural activities (mainly farming) for their livelihood, particularly (but certainly not solely) the urban poor. The reverse situation – rural households having an urban ‘foothold’ from which an income supplement is derived – has been widely documented. Less well known (and probably of more recent date) is the situation of urban households partly depending on rural sources for their livelihood. This study is an attempt to fill that information gap by investigating the importance of rural activities (food, income) for the livelihood of urban households and for the urban poor in particular, using Nakuru town as a case study. 1 Absolute poverty refers to the inability of persons, households or communities to meet a certain minimum level of consumption at which the basic needs such as food, education/literacy, shelter, etc, are fulfilled. This is usually defined in monetary terms such as the one-dollar-a-day used internationally. In Kenya the absolute poor are defined as those members of society who are unable to afford basic minimum needs, comprising both food and non-food items. In 1997, these were valued at kshs 1,238 per month for rural areas and kshs 2,648 per month for urban areas (UNDP 2002).

7
Urban poverty and the changing nature of urban-rural linkages For both urban and rural populations in sub-Saharan Africa, recent and current global changes have resulted in deepening social differentiation and increasing poverty (Tacoli 1998). Life in the urban areas has become more expensive while employment in the formal sector has gone down and real wages do not keep up with the price increases or even declined in absolute terms (UNCHS/Habitat 1996). Increases in food prices and service charges and cuts in public expenditure on health, education and infrastructure have been particularly felt by low-income groups (Tacoli 2002). In many sub-Saharan countries, employment in the public sector was seriously cut, particularly in the lower echelons so that women, who tend to be concentrated at the lower end of the occupational hierarchy, were affected even more than men (ILO/JASPA 1992). The manufacturing sector was also badly hit due to such structural adjustment effects like shortages of imported materials, reduced investment, declining demand, etc (Gilbert 1994). This has led to the 'informalization' of the urban economy in Africa (Stren 1992). Nowadays, "the majority of the urban workforce are (...) engaged in a highly differentiated range of small-scale, micro-enterprise or informal activities" (Rogerson 1997: 346). For some time now, the informal sector has been the most rapidly expanding employment sector of African urban economies. People's responses to (urban) poverty are roughly twofold: first, try to raise or at least maintain one's income and, secondly, reduce one's expenses. Raising or maintaining one's income can usually only be done by diversification of income sources. Cutting expenses is done on such services like education and health, on material expenses, as well as on consumption and dietary pattern. An increasing number of the urban poor in sub-Saharan Africa have started to grow some food within the city. This has become an important coping mechanism in the context of cuts in food subsidies, rises in the cost of living and declines in poor family purchasing power (Kanji 1996; Nugent 2000). In the context of urban-rural linkages, the processes described above have caused two fundamental changes. First, the "dynamics of income distribution between urban and rural areas has changed" (Jamal & Weeks 1988: 274): the rural-urban income gap has substantially narrowed or, in some cases, even closed. Second, there is a relative shift over time in the locus of poverty, from rural towards urban areas (Kanji 1996). And although there is still far more rural poverty than urban poverty in tropical Africa, urban poverty is increasing at a faster rate. Moreover, in many ways the harsh economic conditions of the 1980s and 1990s have been felt even more acutely in the cities than in the rural areas, as life is generally more expensive in urban areas (O'Connor 1991). One of the consequences of these processes concerns the sectoral changes in both rural and urban areas (Tacoli 1997; Tacoli 1998). There are emerging higher levels of multi-activity, especially among younger generations and also an increase in mobility accompanied by strong social and economic links with home areas (Tacoli 2002).

8
'Typical urban' activities like e.g. manufacturing are increasingly taking place in rural areas as well. On the other hand, agriculture — an activity typically associated with the rural areas — has become very common in urban areas (Obudho & Foeken 1999). The growth of urban agriculture since the late 1970s is largely understood as a response to escalating poverty and to rising food prices or shortages which were exacerbated by the implementation of structural adjustment policies in the 1980s (Drakakis-Smith 1992; Gefu 1992; Foeken 1998; Tacoli 1998). What these changes in the two areas have in common is the element of risk spreading or risk management (Painter 1996): households perform a wide range of different activities in order to maintain a certain level of living or even to avoid starvation. This is what Jamal and Weeks (1988: 288) call the 'trader-cum-wage earner-cum-shamba growing' class. The global changes described above have also had an impact on rural-urban linkages in sub-Saharan Africa. First, new forms of migration have emerged or old ones have intensified and others have slowed down (Tacoli 1997). There are indications that the rate of rural-urban migration has decreased, while return migration, i.e. from the city to the rural 'home', is emerging (Tripp 1996; Baker 1997; Potts 1997) and circular migration between urban and rural areas is increasing (Smit 1998). Second, rural links have become "vital safety-valves and welfare options for urban people who are very vulnerable to economic fluctuations" (Potts 1997: 461). There is evidence of significant shifts in the nature of transfers of goods and cash between urban and rural households, in the sense that remittances from urban to rural areas are declining (Tacoli et al. 2003) and transfers of food from rural to urban areas are increasing. Finally, risk spreading or income diversification often implies a permanent or temporary split within the households, with one or more household members living in town and the other(s) in the rural home. This is sometimes referred to as 'multi-spatial households' (Tacoli 1998) or 'multiple-home households' (Smit 1998). However, the term 'multi-spatial livelihood' seems more appropriate because to perform different income-generating activities in different geographical areas does not necessarily imply a residential split of the household (Foeken & Owuor 2001). With 'multi-spatial livelihood', a household has both urban and rural sources of food and/or income. Rural livelihood sources for urban households: An overview of the literature Despite the increasing indications that access to rural food and income sources is a crucial element in the livelihood of many urban dwellers, studies specifically focussing on the rural livelihood sources of urban households in sub-Saharan Africa have up to now not been effected (Foeken & Owuor 2001). What is known about the topic is derived from mostly urban studies that were broader in scope and usually mentioned the aspect of rural livelihood sources but only in passing (some of them within the broader studies of rural-urban linkages). Though limited in the present focus, the general scenario that arises from such studies that have been carried out

9
across the continent2, and in Kenya3, is that the importance of rural activities (food, income) for the livelihood of urban households should not be underestimated. In a general survey (on urban agriculture) on a national scale, in Kenya in the mid-1980s, it was found that 52% of the households claimed to have access to rural land (Lee-Smith et al. 1987). Moreover, at least one-third of the households stated to have livestock back in the rural area (Lee-Smith & Memon 1994). In Gaborone and Francistown (Botswana), too, 37% of the low-income households were cattle holders, with an average herd size of more than 20 animals (Krüger 1998). A large majority of the low-income households in Enugu, Nigeria, "partly relied on food produced in the rural home", both in the 1960s and in the 1980s (Gugler 1971; Gugler 1991). For the textile workers in Kano and Kaduna, Nigeria, the claim to rural land is "important as a security mechanism" during adverse times (Andræ 1992). In the capital city of Zimbabwe (Harare), the rural produce represented "a fairly significant addition" to the households' income (Potts and Mutambirwa 1992). Correspondingly, in a smaller town of Gweru, some households practicing rural farming produced a surplus for sale in normal years while others did not need to buy maize for their own needs (Rakodi 1995). According to Krüger (1998: 128), the "long-lasting rural-urban linkages" in Botswana are more important for the food security situation of the urban households than for instance urban farming. In the slum of Korogocho, Nairobi, over one-third of those with access to rural land stated that the plot was "a regular food and/or income source" (Mwangi 1995). In a study by Baker (1996) in the small town of Biharamulo in northern Tanzania, an attempt was made to calculate the contribution of the sales of rural, agricultural produce to the urban households' income, which resulted in the surprisingly high figure of 70%. Besides obtaining food from the urban households' rural plots, there are also examples of food donations and gifts from rural to urban households. In Harare, 20% of the respondents appeared to receive gifts of food, mainly traditional basic crops, from the rural areas, which led Drakakis-Smith (1992: 276) to the conclusion that "there is still a substantial subsidy from rural to urban households." Also in Dakar, Senegal, there was found to be a considerable flow of cash and food supplies from the rural homes to the urban areas (Fall 1998). Migration case histories of four female heads of households in Masvingo, Zimbabwe found that “the respondents at times used their rural networks to source food for their own consumption and their households in town” (Muzvidziwa 2001: 94). 2 See e.g. In Nigeria (Gugler 1971; Gugler 1991; Andræ 1992), Congo-Kinshasa (Makwala 1972; Nicolai 1989), Tanzania (Baker 1996; Tripp 1996), Zimbabwe (Potts & Mutambirwa 1990; Drakakis-Smith 1992; Rakodi 1995; Kamete 1998; Muzvidziwa 2001), Senegal (Fall 1998), South Africa (Smit 1998), and Botswana (Krüger 1998). 3 See e.g. Lee-Smith et al 1987; Lee-Smith & Memon 1994; Mwangi 1995; Mwangi & Foeken 1996; and Foeken & Mwangi 1998. For Nakuru see Foeken & Owuor 2000a; Foeken & Owuor 2001; and Versleijen 2002.

10
In a few studies, a comparison was made between households with an economic base in both the urban and the rural area ('multi-spatial livelihoods') and households with one spatial-economic base only. Baker (1996: 46) found that "the most economically successful and most secure group of households are those which combine crop production and marketing with a variety of non-farm and off-farm income-generating activities." These households, with a foot in both the urban and the rural economies, were not only found in 'his' town of Biharamulo, but in the surrounding villages as well. Among the poor urban dwellers in Nairobi, it was found that those with access to both urban and rural land were somewhat better off in terms of welfare level, food intake and nutritional condition of the children than those without (Foeken & Mwangi 1998). Finally, put differently, among the poor urban households in Botswana lacking a rural foothold, quite a number were "living under severe risk" (Krüger 1998: 134). From the above overview, it is clear that access to rural food and/or income sources is a crucial element in the livelihood of many urban dwellers particularly in the present circumstances of urban unemployment and poverty. A number of studies indicated that households with access to both urban and rural economies (multi-spatial livelihoods) are relatively better off than those with one spatial-economic base only (mono-spatial livelihood). Most of the studies did not focus on multi-spatial livelihoods, let alone specifically on the topic of rural sources in the livelihood of urban households (Foeken & Owuor 2001). The present study is, therefore, an attempt to fill this gap by using Nakuru town, Kenya as a case study. Nakuru town: Background information Nakuru is located in the heart of the Great East African Rift Valley, 160 km northwest of Nairobi (see map 1). Nakuru came into existence in 1904 as a railway station on the East African Railway (or Uganda Railway) and soon developed into an important regional trading and market centre. The total area of the municipality is about 300 square kilometres, of which 40 square kilometres is covered by Lake Nakuru (MCN 1999). Over the past 30 years, the population of Nakuru town has increased fivefold from 47,000 in 1969 (Kenya 1970) to 239,000 in 1999 (Kenya 2000). At present, Nakuru is the fourth largest town in Kenya after Nairobi, Mombasa and Kisumu. The average annual growth rate between the censuses of 1989 and 1999 was 4.3%, which was much lower than the figure of 6.5 from the previous decade. In 1997, the prevalence of absolute poverty in Nakuru town was 41% compared to about 30% in 1994 (Kenya 2001). The important economic sectors of Nakuru are commerce, industry, tourism, agriculture and tertiary services (MCN 1999). Besides these economic activities, Nakuru town is an important transport and administrative centre. The town also serves

11
as a centre for agro-based industrial and manufacturing activities for its immediate rich agricultural hinterland. Nakuru’s location along the Kenya-Uganda Railway and the Trans African Highway, linking the coastal region, Nairobi and the western parts of Kenya, has played an important role in its growth. Other factors include the attractive climate (dry sub-humid equatorial climate), and a rich agricultural hinterland. The rail line and the highway that passes through the town enhance migration to the town and the subsequent urban-rural linkages (see Foeken & Owuor 2000a for more information on Nakuru). Research methodology In order to obtain an overall view of rural farming and non-farming activities by urban households in Nakuru town, a general survey was carried out in September – December 2001. Out of the total population of Nakuru, a sample of 361 households was selected using a multi-stage proportionate stratified random sampling procedure based on the administrative sub-locations4 and Central Bureau of Statistics (CBS) Enumeration Areas (EAs)5. All the five sub-locations within the municipality were covered in the sample. The 13 sampled EAs were distributed proportionately to the total number of EAs in each sub-location.6 Similarly, the number of households to be interviewed in the individual sub-locations was determined proportionately to the total number of households in each one of them. Finally, the number of sampled households in each EA was based on the total number of households in the corresponding EA and sub-location, respectively. At the end of the survey, a total of 344 households were interviewed, representing 31% of the total number of households in the selected EAs and 0.5% of the total number of households in Nakuru municipality. The 4% loss was mainly due to refusals and unavailability of household head and/or spouse to respond to the questions. Data collection was done using a pre-coded questionnaire. The questionnaire sought to gather quantitative data on: household demographic characteristics; urban farming and non-farming economic activities; rural crop cultivation by Nakuru town households; rural livestock keeping by Nakuru town households; rural non-farming economic activities; urban-rural linkages and migration history of the head of the household and the spouse; and the general food security situation (see Appendix 9 for the complete questionnaire). The respondent to the questionnaire was either the household head or the spouse. Slightly more than half (55%) of the respondents were household heads while the rest were spouses. About two-thirds (64%) of the respondents were female.
4 A sub-location is the lowest administrative unit in Kenya. 5 Enumeration Areas are conveniently determined and used by the Central Bureau of Statistics for census purposes. 6 For more details on the sampling procedure, see Appendix 1, Table A1.1.

12
Chapter 2
Characteristics of the Sampled Households This chapter presents an overview of some characteristics of the sampled households7 with an aim of understanding (1) their structure in terms of sex, age and household size; (2) the characteristics of the household heads in terms of sex, age, marital status and educational level; (3) housing conditions and amenities; (4) livelihood sources; and (5) monthly income situation and expenditure patterns. Household structure The 344 households accounted for a total population of 1,511 household members with an equal proportion of males and females (Table 2.1). Household members, for the purposes of this study, comprised all those who, at the time of survey, were physically residing in the same house as the household head. The research population is generally youthful as half of them were aged below 20 years, another one-third aged between 20-39 years while the rest were 40 years and above. The mean age of all the household members was only 22 years.
Table 2.1: Household structure (%) Sex of all household members (N=1,511)
Male Female Total
50.2 49.8
100.0
Age of all household members (N=1,511)
Less than 20 20-39 40+ Total
51.1 36.8 12.2
100.0
Household size (N=344)
1 member 2-4 members 5-7 members 8+ members Total
11.0 44.2 35.5 9.3
100.0
7 A household usually consists of a person or a group of persons who live together in the same homestead/compound but not necessarily in the same dwelling unit, have common housekeeping arrangements and are answerable to the same household head. The head of the household is that person living in the same household who is acknowledged by the other members to be its head. Such a person holds some primary authority and responsibility of the household’s affairs, mainly economical and cultural (Otieno 2001).

13
The majority of the households were of nuclear type, consisting of the household head, spouse and (biological) children. The “average household” consisted of four members. One out of every ten households was a single person household. Two-fifths of the households consisted of between two and four persons. Two-thirds of the households had between five to seven members, while another 9% could be classified as ‘large’, with at least eight members, basically implying “more mouths to feed”. Characteristics of the household heads Table 2.2 presents a summary of the characteristics of the household heads.8 Over three-quarters of the households were male-headed. The female-headed households, accounting for one-fifth of the total, could have been somewhat under-reported because most ethnic groups in Kenya, just like in other parts of Africa, still regard the male as the head of the household regardless of whether he is regularly absent. In this case, the emerging scenario is “female-managed” households. Eleven percent of the household heads in Nakuru were reported to be regularly absent, i.e. working elsewhere, living in the rural plots or living elsewhere. The majority of these were male household heads.
Table 2.2: Characteristics of the household heads (%; N=344) Sex Male
Female Total
81.1 18.9
100.0
Age Less than 20 20-29 30-39 40-49 50+ Total
0.9 23.3 35.9 22.7 17.2
100.00
Marital status Never married Married Divorced/separated/Widowed Staying together Total
15.4 73.0 11.1 0.6
100.0
Educational level None Up to primary level Up to secondary level Above secondary Total
3.2 22.1 53.3 21.3
100.0
8 For more details, see Appendix 2, Table A2.1.

14
In terms of age, the large majority of the household heads can be regarded as being within the active age cohort of 20-49 years old. 9 Out of these, two-fifths of them were concentrated within the 30-39 years age group. Unlike in rural Kenya, “child-headed households” are not a common feature in Nakuru municipality as only three household heads were below 20 years old.10 One-sixth of the household heads were 50 years and above, the oldest being 74 years. About three-quarters of the household heads were married, the large majority of them monogamously. One-sixth of them were never married while the rest constituted the divorced, widowed, separated and staying together categories. In all the eleven polygamous households, one of the spouses was staying in the rural plot. It is also important to note that although the percentage of the widowed, divorced and separated household heads is small (11%), they can be very vulnerable to the escalating trends in urban poverty, especially for the females in low-income brackets. Finally, there was a high literacy level amongst the Nakuru household heads with three-quarters of them having at least secondary level of education. Only 11 household heads had no education at all. Housing conditions and amenities To get a general picture of the housing conditions and amenities of the Nakuru households, questions were asked concerning tenure status; type of roofing material, wall and floor; and main source of water, human waste disposal, cooking fuel and type of lighting. Just like in the other major urban centers of Kenya, Nakuru municipality has a high proportion of tenants, mainly renting dwelling units (houses) from the local authority and individuals (Table 2.3).11 Abong’ Lo Weya, Kivumbini, Kaloleni B and Ngei are local authority (Municipal Council of Nakuru) estates and therefore all the houses are rented12 from the local authority. Bangladesh, Freehold, Kaptembwa, Kwa-Rhonda, Mwariki and Shabaab are estates dominated by residents renting houses from individuals. Teachers and Naka are dominated by owner-occupied houses, which are constructed by the owners themselves (in fact many houses in Naka were still under construction). The dominant type of roofing, wall and floor materials were corrugated iron sheets, stone and cement, respectively (Table 2.3). On the other hand, most households had access to piped water, though intermittently, and used the main sewer for human waste disposal. The Municipal Council of Nakuru by and large provides these services. The use of charcoal and paraffin as cooking fuel reflects the fact that gas and 9 The official retirement age (from the civil service) in Kenya is 50 years old. 10 Due to the AIDS scourge, many children in the rural areas are being left to fend for themselves after the death of their parents. 11 For more details, see Appendix 2, Table A2.2. 12 Though illegal, sometimes sub-letting is a common phenomenon in these local authority estates. However, there were no cases of sub-letting in the sampled households.

15
electricity as a cooking fuel is still relatively expensive for an average Kenyan. Most households had rather use electricity for lighting than for cooking purposes.
Table 2.3: Housing conditions and amenities (%) % Tenure status Type of roofing material Type of wall Type of floor Main source of water Main human waste disposal Main type of cooking fuel Main type of lighting
Rented Corrugated iron sheet Stone Mud and cement Cement Piped water Main sewer Pit latrine Charcoal Paraffin Electricity Paraffin
83.1
82.0
68.3 21.5
93.6
91.3
55.8 36.6
49.4 34.0
70.9 29.1
An analysis of the variation between the estates reveals that tiles as a roofing material was common in Naka (a relatively new estate), semi-permanent dwellings13 were prevalent in Kaptembwa, Kwa-Rhonda, Mwariki and Baruti while pit latrines were commonly used in Bangladesh, Kaptembwa, Kwa-Rhonda, Mwariki, Baruti and Teachers. Livelihood sources A vast majority of unemployed migrants in Kenya come to the city in the hope of finding some kind of employment as a source of livelihood. Due to the decreasing prospects of entry into the formal sector job market, the bulk of them and the urban poor at large, resort to the informal sector as their main opportunity of employment. Table 2.4 gives a summary of the occupational status of the household heads and of all other individuals aged 15 years and above. Most of the household heads were either regularly employed in the formal sector or self-employed in the informal sector. One-seventh recorded to be in temporary and casual employment. Even then, less than fifty percent of the household heads were in regular formal sector employment. One household head stated to be unemployed, three said they were homemakers and one was a retiree. 13 Houses whose walls are made up of mud and cement.

16
Table 2.4: Occupational status (%) H’hold heads
All others 15+ yearsa
(N=344) (N=601) Regular (formal) employment Self employment (informal sector) Temporary/casual employment Unemployed/Home maker/Retired None (student) Total
43.3 40.7 14.6 1.5 0.0 100
11.3 16.0 12.4 31.6 28.6 100
a: Taken as the labour force participation age. On the other hand, two-fifths of all other household members aged 15 years and above were engaged in some kind of employment (working for pay), with about three-quarters of them being in self, casual and temporary employment. Thirty percent of the other household members who had reached labour force participation age and not in school were not engaged in any economic activity, i.e. they were unemployed. If all the household members are taken into account, the results reveal that for every household there are three members not engaged in any economic activity and therefore wholly dependent on the household head. These include the children below 15 years, those aged 15 years and above but in school and the unemployed. It is clear from the introductory chapter that urban households also engage in a wide range of other income-generating activities and livelihood sources, i.e. besides the main activity or occupation, in order to maintain a certain level of living – or even to “survive”. Broadly, these can be categorized into “farming activities” and “other non-farming activities”. For both broad categories, a further distinction can be made between the location of the activity: that is either urban or rural. Contrary to the notion that farming by urban households is a side activity, it was in fact the main economic activity in 12 households. Four of them engaged in urban farming, another four in rural farming while the rest engaged in both urban and rural farming. This is a clear indication of the importance of farming to urban households with no access to any other form of employment. Table 2.5 shows the number and percentage (in parenthesis) of households in Nakuru municipality engaged in farming and other non-farming income-generating economic activities.14 The table also offers an estimation of the total number of households in Nakuru falling in each category by location of activity. The results show that rural farming by urban households is more common than farming within the municipality. Over half of the households could be classified as “rural farmers” – that is urban households practicing rural crop cultivation15 and/or livestock keeping16 – while two-
14 For practical purposes, engagement in farming activities was asked for the year 2000 while engagement in other non-farming economic activities was asked for 2001. 15 See chapter 4 for detailed information on rural crop cultivation by urban households in Nakuru town.

17
fifths could be classified as “urban farmers”, that is households practicing urban crop cultivation and/or livestock keeping. In absolute numbers, these percentages amount to about 39,000 and 30,000 households, respectively.
Table 2.5: Engagement in farming and other non-farming economic activities Urban Rural Number and
percentage in the survey
Estimated number of h’holds in
Nakuru town*
Number and percentage
in the survey
Estimated number of h’holds in
Nakuru town* Farming 148 (43%) 30,000 194 (56%) 39,000 Crop cultivation
Livestock keeping 118 (34%) 92 (27%)
24,000 19,000
173 (50%) 111 (32%)
35,000 22,000
Non-farming Economic activities
150 (44%)
31,000
35 (10%)
7,000
* Based on an estimated total number of households in Nakuru Municipality of 70,000 in 1999, calculated as follows. The 1989 population of Nakuru Municipality was 164,000 and the number of households 46,741 (Kenya 1997). Hence the average household size in 1989 was 3.5. The 1999 population was 239,000 (Kenya 2000). With unchanged average household size, the number of households in 1999 would have been about 68,000. Assuming, however, that the average household size has decreased (which may be a conservative estimate as average household size is likely to be somewhat lower), the number of households then becomes about 70,000.
Access to an urban plot is an important factor in practicing urban farming. Half of the households not practicing urban crop cultivation mentioned “no access to land” as the main reason not to practice the activity in 2000. The most common crops grown by the urban farmers are kale (sukuma wiki) and maize: cultivated by over half of the crop-cultivating households. Beans, onions, spinach, irish potatoes and bananas are cultivated by at least one-fifth of the cultivators.17 As for livestock keeping in town, small animals and especially chicken were by far the most common type of livestock kept. Other livestock were cattle, sheep and ducks. Rabbits, goats, doves and pigs were kept in small numbers. For a large majority of the urban farmers, the need for (additional) food was mentioned not only as one of the reasons but also the main reason for engaging in the activity.18 As mentioned earlier in this section, apart from the main occupation, profession or work, urban households also engage in other non-farming income-generating activities to supplement their income. Engagement in such activities was much more dominant in Nakuru town than in the rural areas. While two-fifths of the households were engaged in other urban non-farming economic activities only 10% were engaged in rural non-farming economic activities19 (Table 2.5). 16 See chapter 5 for detailed information on rural livestock keeping by urban households in Nakuru town. 17 A wide range of other crops were also cultivated, but by less than one-fifth of the households. 18 For more detailed studies on urban farming in Nakuru town, see Foeken & Owuor 2000a; Foeken & Owuor 2000b; Foeken, Owuor & Klaver 2002; Versleijen 2002. 19 See chapter 6 for more information on rural non-farming economic activities.

18
Nakuru townspeople engage in a wide range of other urban non-farming economic activities: from petty trade using acquired skills and training, to casual employment and established businesses (see Appendix 2, Table 2.3 for a list all other income-generating activities by the Nakuru townspeople). They are practiced by not only the household head or spouse, but also by other household members, either on part-time basis or on full-time basis. For the greater majority of the households, the main reason to engage in these activities was to supplement their incomes. One-third of the households indicated that they could not survive without these activities. Income and expenditure As far as monthly cash income is concerned, half of the households fell in the category of “low” to “very low-income” households: i.e. those whose monthly income do not exceed Kenya shillings (Kshs) 10,000 (Table 2.6). About one-quarter of the households could be categorized as “very low-income” households. The “medium” and “high-income” households were of the same proportion: each having one-fifth of the households, respectively. The income situation is a sensitive issue in the research location and therefore, these indications are based on the respondents’ estimation and willingness to disclose the correct information. Due to the unwillingness to disclose their monthly incomes in absolute terms (figures) the respondents were asked to point in which category of income they belonged to.
Table 2.6: Household’s monthly income situation (in Kshs)a Income category Operational definitionb % (N=344) Up to 5,000 5,001-10,000 10,001-20,000 More than 20,000 Total
“Very low-income” category “Low-income” category “Medium-income” category “High-income” category
24.4 30.5 22.4 22.7 100
a: The monthly income situation should be treated with caution as they might not reflect the incomes generated from other economic activities of the household members other than the main occupation of the household head. In a few cases, adjustments were done based on the household’s expenditure. b: The author will subsequently use these operational definitions to refer to the corresponding income categories.
It was very difficult to quantify how much other members of the household who are in gainful employment (working for pay) contribute to the household’s monthly income. All of them indicated that they usually help once in a while in buying the household’s basic necessities and food. Contributions to paying of school fees, funeral expenses and other family obligations requiring large sums of money are done voluntarily when called upon. The scenario is slightly different for friends and distant relatives who stay together in the same household. They “institutionalize” their sharing of bills and

19
other household related expenditures. In situations where both the household head and spouse are in formal and regular employment, both incomes were taken to constitute the household’s monthly income. To get some insight in the general expenditure patterns of the Nakuru households, the respondents were asked to estimate the average amount of money (in Kshs) spent during the previous month of the interview on various items: food, cooking fuel, lighting, water, house rent, transport to work, school related expenditures and other non-food household items. It is evident from Table 2.7 that the monthly expenditure in all the items increases with an increase in the household’s monthly income. On average, and in all the income categories, the main household expenditures are on food, education and shelter (house rent).
Table 2.7: Estimated monthly average expenditure patterns by income categorya Very low
income h’holds
Low income h’holds
Medium income h’holds
High income h’holds
All house holds
(N=84) (N=105) (N=77) (N=78) (N=344)Food 1,884 2,851 3,336 5,055 3,223Cooking fuel 373 428 514 926 553House rentb 720 900 1,261 1,670 1,111Lighting 157 194 350 642 322Waterc 68 123 242 468 214Transport to work 135 304 579 1,783 660School related expenses 1,062 1,276 2,432 6,498 2,667Other household items 306 565 742 720 576Total (average) expenditure
4,704
6,642
9,485
17,737
9,321
a: The figures have been weighted for all households in each category. b: In some households, the house rent was inclusive of water and lighting. c: The Municipal Council of Nakuru has been unable to collect the rates for the otherwise unreliable provision of tap water to its residents.
Similar to Rakodi’s (1995) findings, food typically accounts for a larger share of the household budget, the amount available depending partly on income, partly on the amount of food “self-produced” and partly on what is left over after other vital expenditure needs have been met. With these expenditure patterns, an average very low-income family in Nakuru is “barely surviving” with a monthly income of up to Kshs 5,000. The dominance of school related expenses is a clear indication of the need of households to educate their children – despite the prohibitive costs especially for the very low- and low-income households.20 In order to survive, the very low and low-income households cut their expenditures by renting affordable houses, cooking using charcoal and paraffin and walking or cycling to work.
20 By the time of this survey, free primary education was not yet introduced in Kenya.

20
Chapter 3
Rural plots Introduction Rural crop cultivation and/or livestock keeping by urban households can only be possible with access to a rural plot.21 The plot may be (inherited) family land “back home” or can be purchased or rented land elsewhere. This chapter presents data on access to rural plots, plot sizes, their spatial location, ownership, acquisition, who mainly uses the plot and importance of the rural plot to the urban household. It is important to point out that a large proportion of the rural plots are located at the “rural home” of the (male) household heads. It is a common feature for most ethnic groups in Kenya to identify themselves with a “rural home” as opposed to the “urban house”, partly explaining why most of them are never permanent migrants in the urban centres. A rural home is the ancestral land that is inherited from father to son. Traditionally, the daughter cannot inherit land because she is expected to get married and make her “home” in the husband’s family. The ambivalence of urban migrants, with one foot in the transient urban destination and another in the rural areas with which they identify as home, is a well-established phenomenon of African migration. In Kenya, as elsewhere in sub-Saharan Africa, the urban bias of development to which migrants respond accordingly is symbiotic with their rural bias toward home – the place to visit periodically, and to which to retire and eventually to be buried. The situation described above provides the basis that all urban dwellers in Kenya have a rural home, regardless of the circumstances that pushed or pulled them to the urban centres. Even in circumstances where a person has bought a plot outside his ancestral home, in case of death the importance of the rural home manifests itself in the disputes regarding where the remains should actually be laid. More often than not, this is done in their ancestral homes unless some peculiar reasons dictate otherwise. For those who (temporarily) cut their ties with the rural homes or maintain them at a low intensity appear to do so primarily because of economic necessity, rather than out of social choice. The rural home is therefore perceived in socio-cultural terms, not primarily as a piece of land you have access to. For example, among the Luos, establishing of a home (Luo = dala or pacho) is a ritual that involves at the very minimum the man who is to be the head of the household, his eldest son, his wife and his own father – it is not a personal matter. No matter how much one “feels at home” in a given house (Luo = ot)
21 A rural plot is herein referred to as any plot/land outside Nakuru municipality.

21
one cannot just declare it dala without the appropriate ritual, which is reducible to such essentials as may be prescribed by the consulted elders (Oucho 1996). Once married, the spouse changes her status to become a member of the husband’s rural home. In this case a house has to be built for her at the husband’s home and a piece of land allocated to her for farming. In polygamous marriages, every spouse has her own house within the homestead and a piece of land to cultivate. The piece of land is assigned with the assumption that every spouse should cater for her own household’s food requirements through cultivation. It is very rare to find the ancestral land being sold out to other individuals. This is because the land is, socio-culturally, supposed to be transferred from father to son along the generations. Furthermore, no buyer who understands the cultural practices will be willing to put a “home” on somebody else’s “home”. However, exceptions can occur where the plot is located around the urban fringes and there is need to sell part of it for urban development. Access to rural plots Almost all the households had access to a plot outside Nakuru municipality, confirming the socio-cultural (and sometimes economic) importance attached to a rural plot (and/or home). About two-fifths of these households had access to more than one plot (Table 3.1). One of the plots is usually the rural home of the household head. Seven households had access to four plots each while one household had access to five.
Table 3.1: Access to rural plots (%) Access to rural plot (N=344 h’holds)
Yes No Total
95.1 4.9
100.0
Number of plots per household (N=327 h’holds)
1 2-3 4-5 Total
61.8 35.8 2.4
100.0
Size of plots (in acres) per household (N=321 h’holds)a
Up to 2 2.1-4.0 4.1-8.0 8.1-10.0 10+ Total
34.3 20.9 20.2 6.9
17.8 100.0
a: Some households declined to give the sizes of their plots. On average, the urban households in Nakuru had access to 1.5 plots outside the municipality, with a median plot size of 2 acres and an average of 4.6 acres. Despite

22
the fact that there are some very large plots, it can be cautiously inferred that the average Nakuru household had about 7 acres of rural land at its disposal in 2000, be it with the large fluctuations. Looking at the total acreage by household, over half of the households had access to plots with a total size of up to 4 acres. Another one-quarter had access to a total of 4.1–10 acres while the rest had access to more than 10 acres of land each. It was not possible in this survey to determine how much of the rural plot is put under crop cultivation or whether the land was still an ancestral holding or what proportion of it was accessible to the urban household. There distribution of plot sizes was about the same for the four income categories. In all income categories, very small plots of less than 1 acre could be found. The same applies to the larger plots of more than 9 acres, but somewhat more among the high-income households: 24 out of the 60 plots of more than 9 acres. Location of rural plots To a large extent, the location of rural plots reflects the district of origin of the urban migrants to Nakuru municipality and therefore source district of migration. A large proportion of these plots were concentrated in Rift Valley, Central, and Nyanza provinces of Kenya (Table 3.2).
Table 3.2: Location of rural plots by province and district (%; N=489)a Location of rural plots by province
Rift Valley Central Nyanza Western Eastern Nairobib North Eastern Total
47.0 22.3 16.2 8.6 4.9 0.6 0.4
100.0
Location of rural plots by district
Nakuru Nyandarua Kakamega Siaya Nyeri Other districts Total
36.2 7.8 5.7 5.3 5.3
39.7 100.0
a: Excludes the two plots located in Tanzania. b: Nairobi is the capital city, a district and a province at the same time. Further from the central business district are areas consisting of former agricultural land being sub-divided into smaller plots for commercial, residential and agricultural purposes.
23
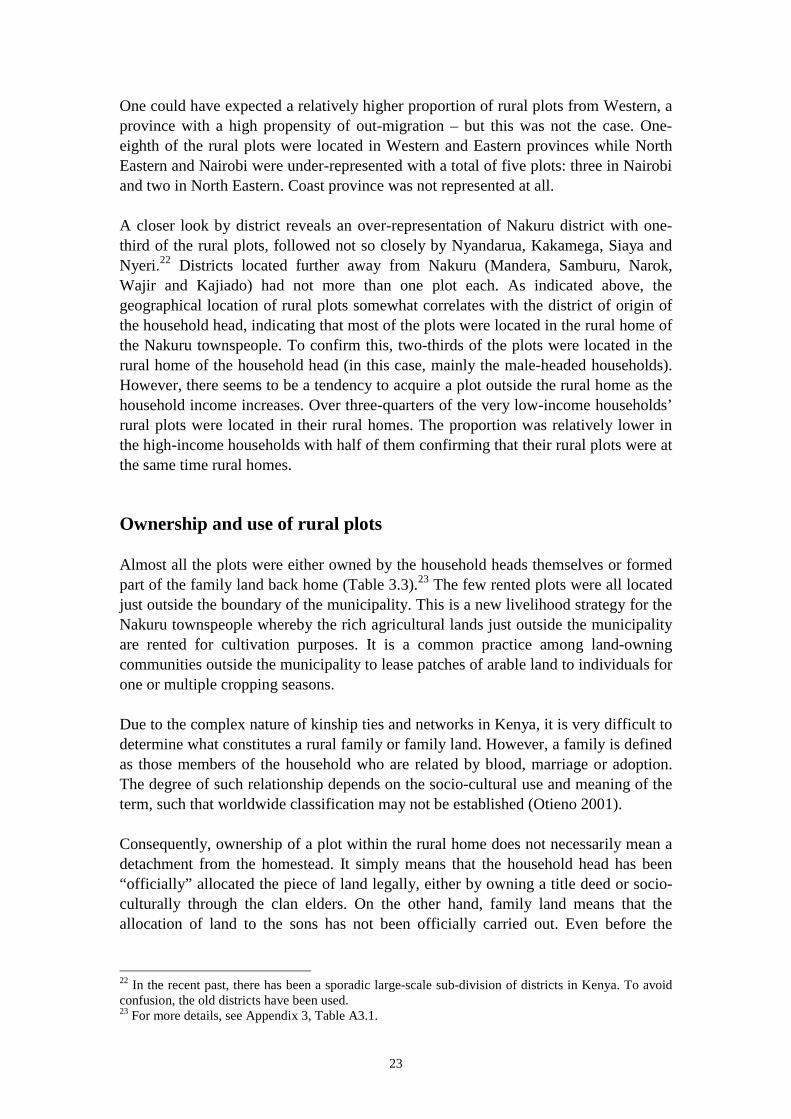
One could have expected a relatively higher proportion of rural plots from Western, a province with a high propensity of out-migration – but this was not the case. One-eighth of the rural plots were located in Western and Eastern provinces while North Eastern and Nairobi were under-represented with a total of five plots: three in Nairobi and two in North Eastern. Coast province was not represented at all. A closer look by district reveals an over-representation of Nakuru district with one-third of the rural plots, followed not so closely by Nyandarua, Kakamega, Siaya and Nyeri.22 Districts located further away from Nakuru (Mandera, Samburu, Narok, Wajir and Kajiado) had not more than one plot each. As indicated above, the geographical location of rural plots somewhat correlates with the district of origin of the household head, indicating that most of the plots were located in the rural home of the Nakuru townspeople. To confirm this, two-thirds of the plots were located in the rural home of the household head (in this case, mainly the male-headed households). However, there seems to be a tendency to acquire a plot outside the rural home as the household income increases. Over three-quarters of the very low-income households’ rural plots were located in their rural homes. The proportion was relatively lower in the high-income households with half of them confirming that their rural plots were at the same time rural homes. Ownership and use of rural plots Almost all the plots were either owned by the household heads themselves or formed part of the family land back home (Table 3.3).23 The few rented plots were all located just outside the boundary of the municipality. This is a new livelihood strategy for the Nakuru townspeople whereby the rich agricultural lands just outside the municipality are rented for cultivation purposes. It is a common practice among land-owning communities outside the municipality to lease patches of arable land to individuals for one or multiple cropping seasons. Due to the complex nature of kinship ties and networks in Kenya, it is very difficult to determine what constitutes a rural family or family land. However, a family is defined as those members of the household who are related by blood, marriage or adoption. The degree of such relationship depends on the socio-cultural use and meaning of the term, such that worldwide classification may not be established (Otieno 2001). Consequently, ownership of a plot within the rural home does not necessarily mean a detachment from the homestead. It simply means that the household head has been “officially” allocated the piece of land legally, either by owning a title deed or socio-culturally through the clan elders. On the other hand, family land means that the allocation of land to the sons has not been officially carried out. Even before the
22 In the recent past, there has been a sporadic large-scale sub-division of districts in Kenya. To avoid confusion, the old districts have been used. 23 For more details, see Appendix 3, Table A3.1.
24
official allocation, all the sons are entitled to a piece of land for farming purposes and for putting up their houses – and therefore the access to family land back home.
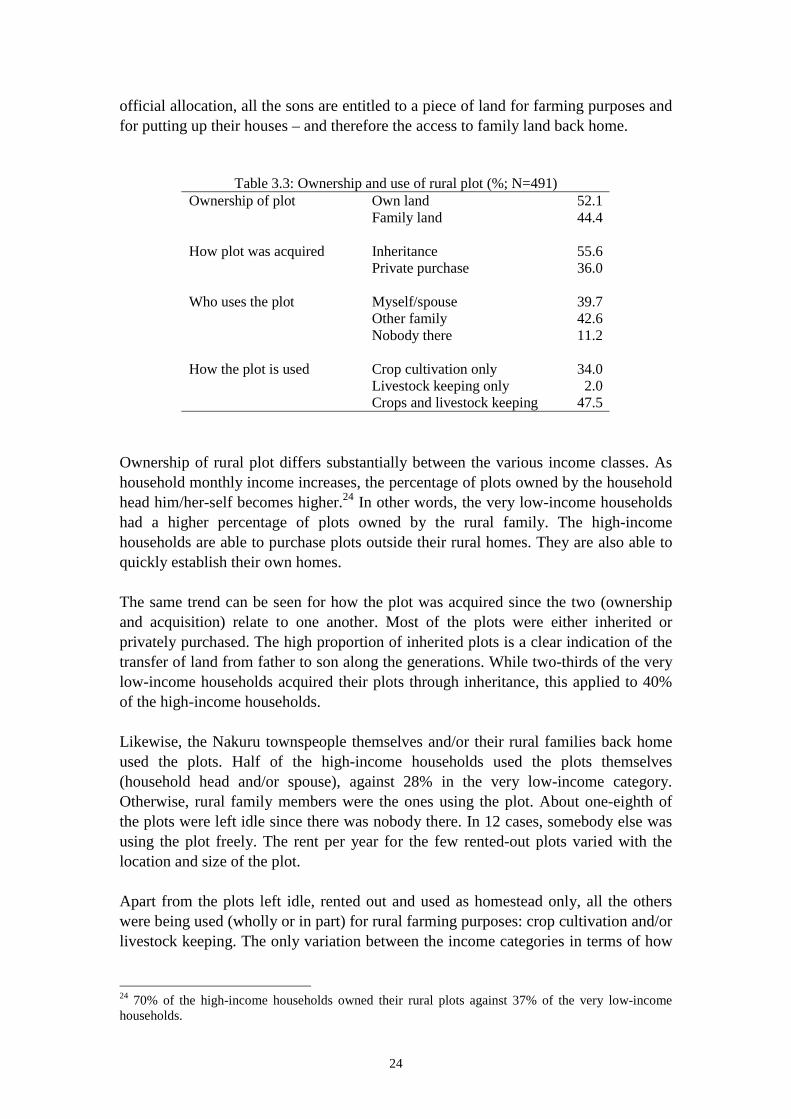
Table 3.3: Ownership and use of rural plot (%; N=491) Ownership of plot Own land
Family land
52.1 44.4
How plot was acquired Inheritance
Private purchase
55.6 36.0
Who uses the plot Myself/spouse
Other family Nobody there
39.7 42.6 11.2
How the plot is used Crop cultivation only
Livestock keeping only Crops and livestock keeping
34.0 2.0
47.5 Ownership of rural plot differs substantially between the various income classes. As household monthly income increases, the percentage of plots owned by the household head him/her-self becomes higher.24 In other words, the very low-income households had a higher percentage of plots owned by the rural family. The high-income households are able to purchase plots outside their rural homes. They are also able to quickly establish their own homes. The same trend can be seen for how the plot was acquired since the two (ownership and acquisition) relate to one another. Most of the plots were either inherited or privately purchased. The high proportion of inherited plots is a clear indication of the transfer of land from father to son along the generations. While two-thirds of the very low-income households acquired their plots through inheritance, this applied to 40% of the high-income households. Likewise, the Nakuru townspeople themselves and/or their rural families back home used the plots. Half of the high-income households used the plots themselves (household head and/or spouse), against 28% in the very low-income category. Otherwise, rural family members were the ones using the plot. About one-eighth of the plots were left idle since there was nobody there. In 12 cases, somebody else was using the plot freely. The rent per year for the few rented-out plots varied with the location and size of the plot. Apart from the plots left idle, rented out and used as homestead only, all the others were being used (wholly or in part) for rural farming purposes: crop cultivation and/or livestock keeping. The only variation between the income categories in terms of how
24 70% of the high-income households owned their rural plots against 37% of the very low-income households.

25
the plot was used is that plots left idle and the ones rented out (for income) were more common amongst the medium and high-income households. The unfolding scenario in this section is that ownership was closely related to how the plot was acquired and who mainly used it. Own land tends to be privately purchased and used by the owner while family land is in most cases inherited and mainly used by rural family members (Table 3.4). An important factor in play here, especially for the low-income households, is distance. Table 3.4: Relationship between ownership, how the plot was acquired and the person using it
How plot was acquired (%)a Who uses the plot (%)b N Inherited Purchased Myself Other family Own land 256 43.4 55.5 53.3 18.0 Family land 215 74.9 15.8c 18.6 74.9 a: Some plots were “allocated” to the household heads. b: Some plots were rented out, being used freely by somebody else or left idle. c: Some households purchase “family land” outside their ancestral rural home.
In order to establish the relationship between distance to the plot and how the plot was acquired on one hand and the user on the other, the distance variable was operationalized as follows: (1) “Nakuru district”, (2) the “inner ring” consisting of the neighbouring districts to Nakuru (Kiambu, Nyandarua, Laikipia, Baringo, Kericho and Narok), and (3) the “outer ring” consisting of all other districts. The closer the plot is located to Nakuru municipality, the higher the chances of it being purchased and used by the owner (Table 3.5). The plots further away are mostly inherited with a greater involvement of the rural family members in its usage. The frequency of visiting the rural plot is reduced as the distance increases and therefore the rural family members are left with the responsibility of utilizing the plot.
Table 3.5: Effect of distance on how plot was acquired and person using it (%) How plot was acquireda Who uses the plotb
N Purchased Inherited Myself Other family Nakuru district 177 61.6 23.7 45.2 20.9 Inner ring districts 83 30.1 61.4 41.0 51.8 Outer ring districts 229 18.3 78.2 34.5 56.3 a: Some plots were “allocated” or rented. b: Some plots were rented out, being used freely by somebody else or left idle.
Lastly, there were no gender differences regarding access to rural plots. The percentage of female-headed households having access to a rural plot was as high as the one for male-headed households: 96% and 92%, respectively. Likewise, about half of the female-headed households had inherited their plots just like in the male-headed households. When the husband dies the widow is culturally bound to continue maintaining links with her husband’s rural home. Normally, she does not forfeit her

26
access to the rural plot but while in town (fending for the children through employment), the plot is mainly used by the rural family members. Importance of rural plots to the urban households It has already been noted above (Table 3.3) that over three quarters of the plots were used for (rural) farming purposes, indicating the potential of rural plots towards enhancing food security in the urban households. The importance, in qualitative terms, of the rural plots for the Nakuru town household is shown in Table 3.6. The information was obtained by asking the respondent “in how far is the rural plot a source of food and/or income to the urban household?” Over two thirds of the plots were a source of food to the urban household, while almost half were (also) a source of income, with the food component being important to the very low-income households. The income component tends to be more important as household income is higher.
Table 3.6: Importance of rural plots by income category (%)
All h’holds
Very low-income h’holds
High income h’holds
(N=491) (N=94) (N=144) Food source only Income source only Both food and income source Neither food and income source Total
31.8 7.7 37.3 23.2 100
50.0 1.1 27.7 21.3 100
21.5 13.9 42.4 22.2 100
Although about one-quarter of the plots were not considered as either food or income source to the urban households, the potential of such plots in terms of indirect (fungible) income to the urban household should not be underscored. Despite these households reporting that the plots were neither a food nor income source to the urban households, most of them, especially in the very low-income households, were quick to add “…but the plot is being used by my parents at home [for farming] and saves me a lot of trouble to (regularly) send them money for food and in this case you can see I save a lot for my family here in town”. For both the male and female-headed households, the rural plot was equally important as a source of food and income: 79% of the male-headed households and 72% of the female-headed households.

27
Chapter 4
Rural crop cultivation by urban households in Nakuru town
Introduction Not all households with access to a rural plot engage in rural crop cultivation and/or livestock keeping. Half of the households in Nakuru municipality who had access to a rural plot could be classified as ‘rural crop cultivators’ – that is urban households practicing rural crop cultivation. The proportion of rural crop cultivators increases with an increase in household income. For example, three-quarters of the high-income households as opposed to one-fifth from the very-low income practiced rural crop cultivation in 2000. This may be because the chances of acquiring own land for crop cultivation is enhanced as the income is higher and as seen before, most low to very low-income households have access to rural land that is being used by the rural family members. In terms of gender, the percentage of male-headed households practicing rural crop cultivation (57%) was higher than that of female-headed households (37%). Generally, rural crop cultivation is a yearly practice and almost all the rural crop cultivators engaged in the activity every year. Lack of labour, fear of theft of crop, lack of capital, politically instigated tribal clashes and drought are some of the factors that hindered a few households to engage in rural crop cultivation every year. Crops cultivated A wide range of crops including cereals, legumes and nuts, starchy roots and tubers, vegetables, fruits, fodder, and cash crops were cultivated in the rural plots by the Nakuru townspeople in 2000. Table 4.1 presents a list of the ten most common crops cultivated in the rural plots.25 These crops were cultivated by at least 10% of the cultivators with maize and beans being the dominant ones. Nine out of every ten crop-cultivators cultivated maize, a staple dish, while two-thirds cultivated beans, a popular substitute for animal protein. Irish potatoes, kale (sukuma wiki), cabbage, and bananas were cultivated by 15 to 30% of the cultivators and tea, millet, green peas and coffee by 10 to 15%. Looking at food groups, a higher preference is given to cereals, legumes and nuts with the large majority of the crop cultivators planting them (see Appendix 4, Table A4.2). 25 Appendix 4, Table A4.1 offers a full list of all the crops cultivated.
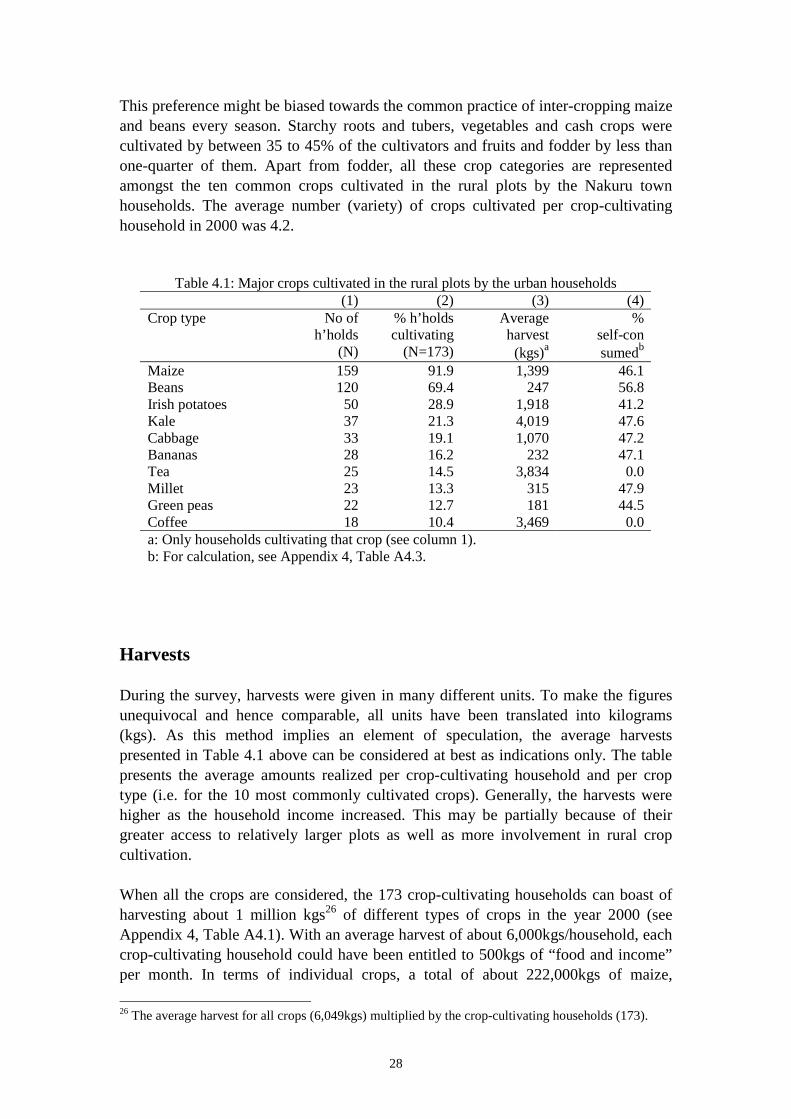
28
This preference might be biased towards the common practice of inter-cropping maize and beans every season. Starchy roots and tubers, vegetables and cash crops were cultivated by between 35 to 45% of the cultivators and fruits and fodder by less than one-quarter of them. Apart from fodder, all these crop categories are represented amongst the ten common crops cultivated in the rural plots by the Nakuru town households. The average number (variety) of crops cultivated per crop-cultivating household in 2000 was 4.2.
Table 4.1: Major crops cultivated in the rural plots by the urban households (1) (2) (3) (4)
Crop type No of h’holds
(N)
% h’holds cultivating
(N=173)
Average harvest
(kgs)a
% self-con sumedb
Maize Beans Irish potatoes Kale Cabbage Bananas Tea Millet Green peas Coffee
159 120 50 37 33 28 25 23 22 18
91.9 69.4 28.9 21.3 19.1 16.2 14.5 13.3 12.7 10.4
1,399 247
1,918 4,019 1,070
232 3,834
315 181
3,469
46.1 56.8 41.2 47.6 47.2 47.1 0.0
47.9 44.5 0.0
a: Only households cultivating that crop (see column 1). b: For calculation, see Appendix 4, Table A4.3.
Harvests During the survey, harvests were given in many different units. To make the figures unequivocal and hence comparable, all units have been translated into kilograms (kgs). As this method implies an element of speculation, the average harvests presented in Table 4.1 above can be considered at best as indications only. The table presents the average amounts realized per crop-cultivating household and per crop type (i.e. for the 10 most commonly cultivated crops). Generally, the harvests were higher as the household income increased. This may be partially because of their greater access to relatively larger plots as well as more involvement in rural crop cultivation. When all the crops are considered, the 173 crop-cultivating households can boast of harvesting about 1 million kgs26 of different types of crops in the year 2000 (see Appendix 4, Table A4.1). With an average harvest of about 6,000kgs/household, each crop-cultivating household could have been entitled to 500kgs of “food and income” per month. In terms of individual crops, a total of about 222,000kgs of maize, 26 The average harvest for all crops (6,049kgs) multiplied by the crop-cultivating households (173).

29
30,000kgs of beans, 96,000kgs of irish potatoes and 150,000kgs of sukuma wiki were harvested by the crop-cultivating households in 2000. The harvests for millet, green peas and bananas were less than 10,000kgs in each case. Coffee and tea, the two main cash crops, had a total harvest of about 158 tons. Given the number of households cultivating sukuma wiki (37) the production of roughly 4,000kgs/household can be described as relatively high. Part of the reason is that it is possible to cultivate sukuma wiki throughout the year. Furthermore, it is the most frequently harvested vegetable from the shamba (plot) as “it pushes the week”27 during periods of lack of enough food. The produce from rural crop cultivation is not only self-consumed but also sold when there is a surplus. Besides that, there are cases where part of the produce is given away, kept for seedlings or stored for future use. While both the urban and rural households benefited from the produce, it was not possible to establish the exact proportion that actually ends up being consumed by the urban household.28 However, for the time being, “self-consumption”, whether by rural or urban family members, is taken as benefiting the urban household practicing rural crop production. Without this, the urban household would after all look for other means to “feed” his/her family at home. On average, about two-fifths of the total harvest was self-consumed, another two-fifths sold, and about 10% given away (see also Appendix 4, Table A4.3). Cash crops (tea and coffee) are wholly for income while perishable crops like kale, banana and cabbages tend to be given away more than other crops. Using the percentages in Table 4.1, we can say that in the year 2000, about 640kgs of maize, 140kgs of beans, 790kgs of irish potatoes, 2,000kgs of sukuma wiki, 500kgs of cabbage, 110kgs of bananas, 150kgs of millet, and 80kgs of green peas were self-consumed by the crop producing household. The produce sold is mainly an additional income source for the urban household or, more often than not, for the rural family thus saving the urban household from (frequently) sending money home. To illustrate the importance of rural crop cultivation as an additional income source to the urban household, I shall use the example of maize-cultivating households. The maize-cultivating households sold an average of about 6 bags of maize per household in the year 2000. Given that the price of maize was roughly Kshs 1,200 per bag, each of the maize-cultivating household received an additional gross income of Kshs 7,200. Due to kinship structure in most societies and for those cultivating family land, giving away, donating or helping others with part of your produce is a common occurrence and considered as socially healthy. Some produce is given away as token of appreciation, especially those who helped in the cultivation process, some is given
27 Translated literally, sukuma wiki is a Swahili word that means “push the week” and therefore with sukuma wiki in your shamba you can keep the week going in terms of food. 28 The case studies will be able to determine the amount of produce that is brought to the urban household.

30
away as an obligation, i.e. to your mother, father or children, and others give away to help those in need. Based on the total number of about 70,000 households in Nakuru municipality (see footnote with Table 2.5), the rural crop cultivators in Nakuru town as a whole produced an estimated 45 million kgs of maize, 6 million kgs of beans, 20,000 tons of irish potatoes, 31,000 tons of sukuma wiki, 7,000 tons of cabbages, 1,200 tons of bananas, 1.5 million kgs of millet, and 0.8 million kgs of green peas. If all the other crops are included, we can estimate that the total rural crop production by Nakuru town households amounts to about 207 million kgs. When these figures are compared with the urban crop production of Nakuru town in 1998, it becomes clear that rural production is more important than urban production. In their general survey of urban farmers in Nakuru town, Foeken & Owuor (2000a) estimated that in 1998, the Nakuru crop cultivators produced, for example, 2.7 million kgs of maize, 0.8 million kgs of beans, 1,100 tons of sukuma wiki, 330 tons of irish potatoes, and 13 tons of bananas.29 The total urban crop production was estimated at 6 million kgs implying that rural crop production is 35 times more than urban crop production! Although one can argue that the variation might be due to a number of factors, including the differences in years30 and location of activity, the major contributing factor that is so far obvious concerns the differences in plot sizes. The average size of an urban plot was 964 square metres compared to 4.6 acres for the rural plots, which is 19 times higher. Even then, one could have expected urban farming to be more intensive than rural farming, but this was not the case. The productivity per square metre is higher in rural plots than in the urban plots. From the available data, it is possible to roughly calculate the contribution of self-consumed produce to the energy requirements of the Nakuru townspeople. For comparative analysis, I will use the four crops common in both surveys (Table 4.2). Although it is not easy to point out the actual amount of the rural production that was consumed by the urban households, the contribution of rural production to the Nakuru townspeople’s food requirements – based on the amounts self-consumed as indicated by the respondents – is higher for all the four crops than the urban production. Likewise, the contribution of the self-consumed maize, beans, irish potatoes and sukuma wiki to the energy requirements of the Nakuru population as a whole is 10 times higher from rural crop cultivation than from urban crop cultivation.
29 Foeken & Owuor (2000a) used a representative sample of 594 households and based their calculations on an estimated total number of 70,000 households in Nakuru municipality in 1999. 30 1998 was not a “normal” year in terms of rainfall patterns.

31
Table 4.2: Aggregate self-consumed amounts (in millions kgs) and its contribution to the annual energy requirements of the Nakuru townspeople, selected cropsa
(1) Aggregate self-consumed Ruralb Urbanc Maize Beans Irish potatoes Kale (sukuma wiki)
20.8 3.4 8.0 14.5
2.1 0.6 0.3 0.8
(2) Contribution of crop production (4 crops) to the annual energy requirements
51.2%
5.3%
a: See calculations in Appendix 4, Table A4.4. b: Figures derived from the present survey. c: Figures derived from Foeken & Owuor (2000a).
Inputs for rural crop cultivation There is a great awareness by the crop cultivators to enhance their yields through the use of inputs. All the rural crop cultivators except one used at least one type of material input31 during crop cultivation. Despite the increasing costs, the large majority of the crop cultivators used chemical fertilizers to increase their productivity (Table 4.3).
Table 4.3: Use of inputs for rural crop production (%; N=172)* Type of input % Type of input % Chemical fertilizer Manure as fertilizer Crop residue as fertilizer Irrigation Hired labour
83.1 57.0 50.0
10.5
82.1
Chemical insecticide Chemical pesticide Local seeds/seedlings Improved seeds/seedlings
36.6 32.0
48.8 69.2
* Total > 100% due to combined answers. Organic fertilizers (manure and crop residue) were used by about half of the cultivators. The use of chemical pesticide and insecticide was not very prevalent as about one-third of the cultivators used them, respectively. Pesticides and insecticides are mainly used during disease (or pests) outbreak as a curative other than preventive measure. About half of the crop-cultivators used local seeds and seedlings, although two-thirds of them used improved seeds and seedlings (as well). Most rural crop cultivators rely on the rain cycle. Irrigation was practiced by 18 households, 13 of them from the medium to high-income categories. Only one household in the very low-income category used irrigation. Even though the use of all inputs was witnessed
31 Material inputs include: chemical fertilizer, manure, crop-residue, chemical insecticide, chemical pesticide, local seed/seedlings, improved seed/seedlings and irrigation.

32
across the four income categories, the high-income households tend to use more of all types of inputs except for local seedlings.32 Chemical fertilizers, insecticides, pesticides and improved seedlings were mainly purchased from Nakuru town or at the local market/town where the plot is located. Some of these inputs are relatively cheaper at the main outlets located in towns than in the rural local centres. Crop residue, manure and local seedlings came largely from “own farm”. For those who could afford, hired labour was an essential component in their rural crop production process, especially during ploughing, planting, weeding and harvesting. Four-fifth of the crop cultivators hired labour for different activities and at varied intensities. Those with relatively high income tend to hire labour more than those with low incomes. For example, almost all of the high-income households hired labour for crop cultivation while only two-fifths of the very low-income households were able to do that. Nature of involvement in rural crop cultivation Both the household head and/or spouse33 took a keen interest in rural crop cultivation. Being a family undertaking, both were involved in rural crop production in one-way or the other, directly or indirectly. For the spouses living in rural areas, rural crop cultivation was a full-time engagement, except for two of them (Table 4.4). For the male household heads and their spouses who reside in Nakuru municipality, rural crop cultivation, as could be expected, is mainly a part-time engagement except for the eight households who mentioned that rural farming was their main activity. More often than not, the household head and spouse were involved in supervisory roles. Once in a while, one of them, and in most cases the spouse, traveled to the rural plot to oversee land preparation, planting, weeding, harvesting or marketing. This is to say that the spouses are more involved in rural crop cultivation than their husbands. The arrangement can be by design (through division of labour in the household), choice and/or necessity. While the male household heads claim to be “responsible” for rural crop production, the women do much of the work. Apart from supervisory roles, the involvement of the male household heads in rural crop cultivation increases during marketing, an indication of their control over the financial aspects. The same applies to the female-headed households who engage more in supervisory roles and leave much of the work
32 For example: chemical fertilizer (15% of the very low-income households vs 34% of the high-income households), chemical insecticide (11% vs 43%), chemical pesticide (7% vs 40%), improved seedlings (16% vs 35%), manure (17% vs 34%), crop residue (15% vs 37%), and local seedlings (25% vs 30%). 33 The spouse is the wife to the male household head in this case.

33
to be done by the rural family members. Similarly, they tend to increase their participation during marketing.
Table 4.4: Involvement in rural crop cultivation (%)a Household head Spouseb
Male
Female
Urban
Rural
Other relatives (rural)
N=116 N=17 N=95 N=21 N=127 If full time involvement (Nature of participation) Supervisory Land preparation Planting Weeding Harvesting Marketing
3.4
90.5 23.3 22.4 16.4 29.3 50.9
5.9 (01)
94.1 (16) 23.5 (04) 23.5 (04) 23.5 (04) 23.5 (04) 41.2 (07)
13.7
72.6 52.6 64.2 53.7 66.3 46.3
90.5 (19)
47.6 (10) 95.2 (20) 95.2 (20) 95.2 (20) 95.2 (20) 47.6 (10)
50.4
51.2 70.9 76.4 74.8 76.4 29.1
a: Where N in the category is small, the number of households has been given in parenthesis. Total > 100% due to combined answers. b: A distinction has been made between spouses living in Nakuru municipality and those living in the rural areas.
In the rural homes, crop cultivation is a collective responsibility of both the urban and rural household members, hence the greater involvement of the rural family in the absence of their urban counterparts. The rural family members play an important role in all stages of rural crop cultivation, except for marketing. In fact, most of the crop cultivation activities were actually carried out by the family members and spouses who are living at the rural home. Participation in rural crop cultivation was about the same for the four income categories except in two aspects: first, the involvement of female-headed households in rural crop cultivation is reduced as income is higher and secondly, more household heads and urban spouses in the high-income category commit themselves to supervisory roles, i.e. their participation in land preparation, planting and weeding is slightly reduced.

34
Chapter 5
Rural livestock keeping by urban households in Nakuru town
Introduction One-third of the households in Nakuru municipality could be classified as ‘rural livestock keepers’ – urban households practicing rural livestock keeping. A large majority of them were at the same time rural crop cultivators. Just like with rural crop cultivation, the proportion of rural livestock keepers is higher as the household income increases. There were twice as many rural livestock keepers amongst the high-income households than the very low-income ones. Likewise, there were twice as many male-headed households in Nakuru town involved in rural livestock keeping than households headed by a female. Livestock such as cattle, goats and sheep is viewed as an asset and like other physical assets they are identified as the male household head’s property. In many societies, livestock keeping is essentially “a man’s job” apart from chicken, which is often left for the women to rear. Animals kept Due to the cultural attachment to cattle, they were by far the most common type of animal kept by the rural livestock keepers. Three-quarters of the livestock-keeping households kept cattle whereas chicken and shoats were kept by between 35 and 50% of the livestock keepers (Table 5.1).34 Turkeys, pigs, ducks and rabbits are typically not preferred as not more than three households in each case kept them. The high-income households had more livestock than the very low-income households: that is, for each type of animal, the numbers kept increases with an increase in income apart from rabbits, ducks and pigs. The initial price of buying a cow, goat or sheep can be prohibitive for the low to very-low income households. Besides that, owing to the relatively smaller plots they have, lack of pasture, water and additional expenses restricts them to one or two animals only. Unlike in urban livestock keeping where the small animals are prevalent, the large animals seem to be commonly kept by rural livestock keepers.35 In 1998, the percentages of urban livestock keepers with large animals in Nakuru municipality did not exceed 5% (Foeken & Owuor 2000a). 34 For more details, see Appendix 5, Table A5.1. 35 Large animals are cattle, sheep, goats and pigs while small animals are chicken, ducks, rabbits and turkey.

35
Table 5.1: Livestock kept in the rural plotsa
Nb
%c
Number (Dec 2000)
Number (Aug. 2001)d
Number sold (2001)
Cattle Chicken Goats Sheep Otherse
86 52 44 38 9
77.5 46.8 39.6 34.2 2.0
481 734 620 229 68
477 864 716 264 84
25 69 26 19 6
Total 2,132 2,405 145 a: Total > 100% due to combined answers. b: Households keeping that livestock. c: Percentage of households keeping that type of livestock (N=111). d: The month preceding the general survey. e: These are pigs, ducks, rabbits and turkeys.
A look at the livestock “demography” reveals that by December 2000, there were a total of 2,132 animals reared in the rural plots by the rural livestock-keeping households. On average there were about 6 cows, 14 chicken, 14 goats and 6 sheep being kept by the cattle, chicken, goat and sheep-keeping households, respectively. The average number of pigs, ducks, rabbits and turkeys were concentrated within the few households keeping them. By the time of the survey (September 2001) the numbers of all animals kept by the rural livestock-keeping households had somewhat increased apart from a slight decrease in the number of cattle. Within 8 months, i.e. between January and August 2001, a total of 270 animals had been slaughtered for cultural purposes and/or ceremonies.36 Out of these 223 were chicken, 14 sheep, 12 goats and 11 cows. Within the same period the rural livestock keepers had bought 145 animals and sold 47 of them, the majority being chicken, cows, goats and sheep. Just like the crops, the animals sold are primarily an additional income source to the urban household or, more often than not, sold in times of “financial crisis” (e.g. pay school or hospital fees). The average prices of the animals sold ranged from Kshs 80 for rabbits, Kshs 200 for chicken and ducks, Kshs 500 for pigs and turkeys, Kshs 2000 for goats and sheep to Kshs 14,000 for a cow. Based on the number of households keeping certain type of animal as well as the average number of animals per household (Table 5.1) and given that there were a total of 68,328 households in Nakuru municipality (see footnote with Table 2.5), we can estimate that by the end of 2000 the number of livestock kept in the rural plots by Nakuru town households as a whole was: 102,000 cattle, 143,000 chicken, 124,000 goats and 45,000 sheep.
36 For example, animals are slaughtered during wedding and burial ceremonies. However, the magnitude varies from region to region.

36
Ownership and purpose of rearing livestock If looked at from the economic perspective, we can say that the Nakuru townspeople have invested a great deal in rural livestock keeping. Three-quarters of all the animals in the rural plots were owned37 by the household head and/or spouse. The other one-quarter constituted family property (Table 5.2). However, it becomes very difficult, in a cultural setting, to distinguish between what is ‘own’ property on the one hand and ‘family’ property on the other. As much as the animal is identified with the member of the family who bought it, they constitute part of the family property in a wider perspective since they are all reared together in the rural plots regardless of the “owner”. Livestock self-owned and family-owned were witnessed in all the income classes, albeit with comparatively higher numbers for medium to high-income households. The livestock were reared within the homestead and/or herded outside (‘free range’), the former being common. Due to the traditional and non-commercialized nature of livestock keeping, zero grazing was not as widespread as free range.
Table 5.2: Ownership and purpose of rearing of livestock (%; N=229)* Ownership % Purpose of rearing % Myself Family property Total
76.4 23.6 100
Mostly for own consumption Both consumption and selling Mostly for selling Social security/custom/cultivation Total
41.3 43.2 11.8 3.4 100
*Number of livestock kept by household and by type Urban households keep livestock in the rural plots for both own consumption and for selling. For the cattle and chicken, own consumption largely refers to the products while selling is for both the product and/or the animal itself. The extent of consumption as well as that of selling depend on the type of animal and differ from one household to another. For example, the low and very low-income households keep cattle and chicken mainly for “own consumption”, while goats and sheep are kept mainly for selling. Though it never came out strongly, livestock are also kept – regardless of income category – for social security purposes, as a custom and in one household, specifically for ploughing purposes. Animal products Milk and eggs are the most important animal products for the rural livestock keepers. Three-quarters of the livestock keepers mentioned milk as one of their products in 2000 while eggs were produced by about half of them. Meat constituted a product only when an animal was slaughtered for home consumption. One-eighth of the livestock keepers never got any product from the livestock they kept in 2000. 37 Ownership here is mainly through purchase of the animal by the urban household.

37
Table 5.338 presents production data for milk and eggs. The total average amount of milk produced per day by the 83 milk-producing households was about 930 litres, which is an average of 11 litres/day/household. The 51 eggs-producing households managed to get a total average of about 21 crates39 of eggs/day: that is about 12 eggs/day/household. However, these figures do not take into account the differences in the frequencies of production and can only at best be indications of the “average” daily production during production periods in the year.
Table 5.3: Production figures for milk and eggs Milk Eggs
Number of households getting animal product Total (average) production per daya Mean production/day/household % Self-consumedb
% Soldb
% Given awayb
83 930 litres/day 11 litres/day
52.3% 36.3% 6.5%
51 626 eggs/day 12 eggs/day
66.0% 21.3% 8.4%
a: The respondents were asked to state the average amount of milk and eggs produced per day. b: For calculation, see Appendix 5, Table A5.2.
At least half of the milk and eggs produced by rural livestock keepers were self-consumed by the urban households and their rural families at home. When the various proportions of milk and eggs self-consumed, sold and given away are taken into account, on average, half of the milk and two-thirds of the eggs were self-consumed, another one-third of the milk and one-fifth of the eggs were sold, while the rest was given away. It is not yet clear as to how these two products, especially milk, reach the urban household and at what intervals. Furthermore, in most instances the rural family also uses the milk and eggs, and in particular the milk as it is perishable. The sale of milk and eggs is a very common practice in the rural plots. Milk is sold to neighbours who do not have milk-producing cows. This earns the urban household some (additional) income or sometimes the income is used by the rural family and therefore saving the urban household from (frequently) sending money home. Inputs and nature of involvement in rural livestock keeping Nine out of every ten rural livestock keepers used at least one input during the livestock keeping process in 2000. Table 5.4 shows the types of inputs the livestock keepers used for their animals. Given that livestock has to be constantly treated against various diseases, veterinary drugs are the most common inputs. Where
38 For more details, see Appendix 5, Table A5.2. 39 One crate of eggs contains 30 eggs in Kenya.

38
available, crop residues were also regularly used as a supplement feed to the livestock. Due to the costs involved, improved breeds (Artificial Insemination) and other purchased feed supplements were used by between 25 to 50% of the rural livestock keepers while ethno-veterinary medicine was rarely used.
Table 5.4: Inputs for livestock keeping (%) Improved breeds/Artificial insemination Veterinary drugs Ethno-veterinary medicine Feed supplements Crop residue Hired labour
29.7
73.9 8.1
45.9 67.6
43.2
Apart from the crop residues that were got from “own farm” all other inputs were purchased from Nakuru town or other towns, the local market centre/town where the plot is located or from a neighbour. There were as many households in the high-income bracket using inputs for livestock keeping as those in the very low-income bracket: 94% and 84%, respectively. However, a further analysis by type of input shows that improved breeds and feed supplements were used more by the high-income households. For example, half of the households who used improved breeds were high-income households against only one very low-income household who did the same. For those using feed supplements, 40% of them were high-income households while 8% were from the very low-income category. One could have expected most of the rural livestock keepers to hire labour but only two-fifths of them did so. Labour was mainly hired for milking, herding, feeding and sometimes for marketing (perhaps to move them to the market). Hiring of labour was a common phenomenon amongst the high-income households as 82% of them hired labour compared to less than one-fifth from the very low-income households. The low to very-low income households depend more on the labour provided by the rural family members. Lastly, the nature of involvement in rural livestock keeping is quite similar to that of rural crop cultivation described in Chapter 4. Both the household head and/or spouse were directly or indirectly involved in rural livestock keeping in one-way or the other. Being spatially far, most of the livestock keeping activities were actually carried out by the family members and spouses living at the rural plots. However, the responsibility of the rural family member reduces as income increases – that is a rural family member being responsible for livestock keeping was dominant among the low and very-low income households. On the other hand, the responsibility of the household head increases with an increase in income. This might be because livestock is taken as an asset as income increases.
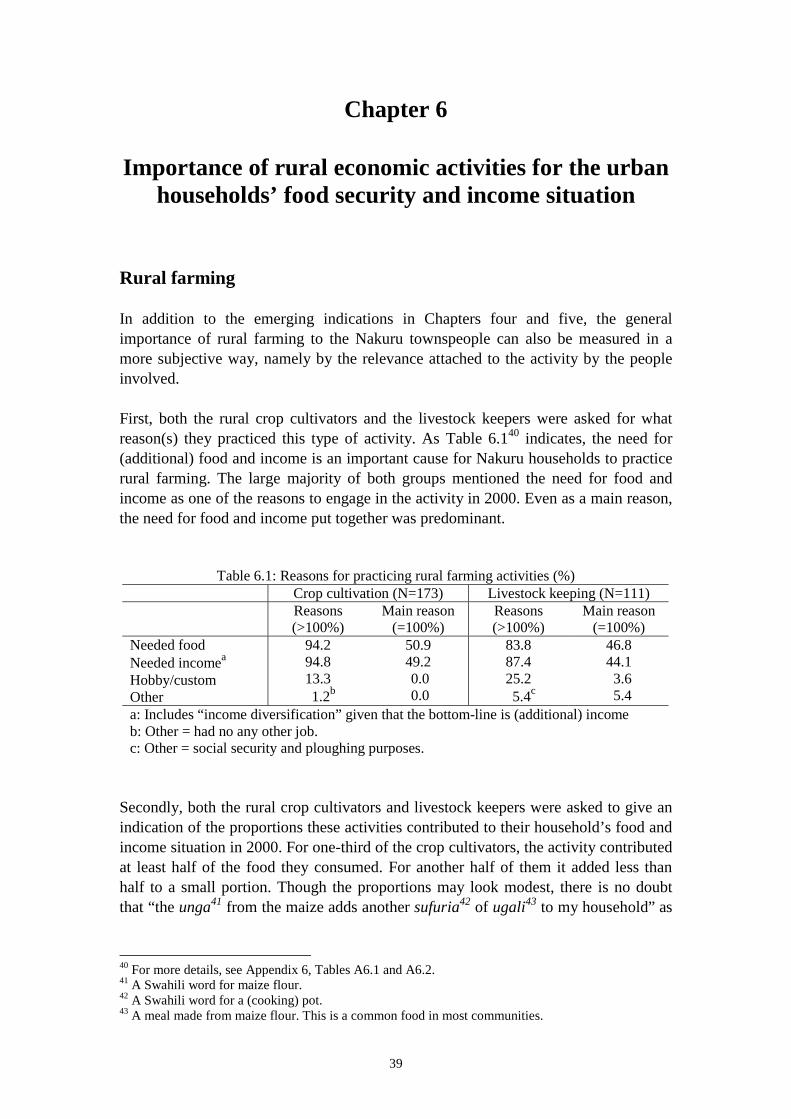
39
Chapter 6
Importance of rural economic activities for the urban households’ food security and income situation
Rural farming In addition to the emerging indications in Chapters four and five, the general importance of rural farming to the Nakuru townspeople can also be measured in a more subjective way, namely by the relevance attached to the activity by the people involved. First, both the rural crop cultivators and the livestock keepers were asked for what reason(s) they practiced this type of activity. As Table 6.140 indicates, the need for (additional) food and income is an important cause for Nakuru households to practice rural farming. The large majority of both groups mentioned the need for food and income as one of the reasons to engage in the activity in 2000. Even as a main reason, the need for food and income put together was predominant.
Table 6.1: Reasons for practicing rural farming activities (%) Crop cultivation (N=173) Livestock keeping (N=111) Reasons
(>100%) Main reason
(=100%) Reasons (>100%)
Main reason (=100%)
Needed food Needed incomea Hobby/custom Other
94.2 94.8 13.3
1.2b
50.9 49.2 0.0 0.0
83.8 87.4 25.2
5.4c
46.8 44.1 3.6 5.4
a: Includes “income diversification” given that the bottom-line is (additional) income b: Other = had no any other job. c: Other = social security and ploughing purposes.
Secondly, both the rural crop cultivators and livestock keepers were asked to give an indication of the proportions these activities contributed to their household’s food and income situation in 2000. For one-third of the crop cultivators, the activity contributed at least half of the food they consumed. For another half of them it added less than half to a small portion. Though the proportions may look modest, there is no doubt that “the unga41 from the maize adds another sufuria42 of ugali43 to my household” as
40 For more details, see Appendix 6, Tables A6.1 and A6.2. 41 A Swahili word for maize flour. 42 A Swahili word for a (cooking) pot. 43 A meal made from maize flour. This is a common food in most communities.

40
one of the respondent explained when asked how two gorogoros44 of maize from the rural plot helps the urban household. The contribution of livestock keeping to the urban household’s food security in 2000 was comparatively not as high. Two-fifth of the households indicated that rural livestock keeping never contributed to the food they consumed while for about half of them it supplemented less than half to a small portion of their food requirements. On the other hand, 71% of the rural crop cultivators and 50% of the livestock keepers said that the produce sold contributed to the urban household’s total income situation in 2000. Thirdly, Table 6.2 presents data on the perceived importance of rural crop cultivation and livestock keeping to the urban households engaging in the activity. For the large majorities, rural farming forms at least an additional food and/or income source, which is in line with the reasons for rural farming in 2000.
Table 6.2: Perceived importance of rural farming activities (%)* Crop cultivation
(N=173) Livestock keeping
(N=111) Could not survive without it Major income source Additional income source Major food source Additional food source
74.6 16.2 57.2 23.7 66.5
39.6 2.7 54.1 0.9 67.6
* Total > 100% due to combined answers The activities are an additional food source for about two-thirds of the urban households practicing them and (also) an additional income source to more than half of them. The importance of rural farming is even stressed further by the fact that three-quarters of the crop cultivators indicated that they ‘could not survive without it’ as well as being a “major food source” to one-quarter of them. Livestock becomes an important food and/or income source only in situations where need arises, and therefore acts as a form of social security. If the very low and high-income households are compared, the percentages mentioning the need for food as one of the reasons to practice rural crop cultivation and livestock keeping were very high in both cases: 100% versus 94% for rural crop cultivators and 90% versus 88% for rural livestock keepers (Table 6.3). However, when asked which was the main reason to practice rural crop cultivation, two-thirds of the very low-income households mentioned the need for food against one-third from the high-income households. For the rural livestock keepers, the figures were about half and one-third, respectively. In both groups, the need for income was much more stronger amongst the high-income households meaning that the need for food is more
44 Gorogoro is a name used locally for a 2 kg tin (mainly from used cooking oil).

41
important for the very-low income-households who practice rural farming. Notably, the very low and low-income households keep livestock for social security reasons.
Table 6.3: Reasons for practicing rural farming by income category (%) As one of the reasons As the main reason
N Needed Food
Needed incomea
Needed Food
Needed incomea
(1) Rural crop cultivationb Very-low income High-income
32 52
100 94.2
56.3 90.4
68.8 36.5
31.3 63.5
(2) Rural livestock keeping Very-low income High-income
19 33
89.5 87.9
57.9 81.8
52.6 36.4
26.3 60.6
a: Including income diversification. b: The need for food and income were the only main reason given.
Despite having no major gender differences regarding the reasons for practicing rural farming, it is important to note that all the nine female-headed households practicing rural livestock keeping did so because of the need for income. In order to establish the importance of “rural farming” for the urban households’ general food security situation in 2000, four categories of farming households will be compared in relation to two questions asked about the urban household’s food security situation. The categories of farming households were operationalized as those practicing (1) both rural and urban farming, (2) rural farming only, (3) urban farming only, and (4) those who do not practice farming at all (Table 6.4). While analysing the first question on the most important food source in 2000, it is important to note that purchased food is part and parcel of most urban household’s food budget. This is because purchased food also include other food items not necessarily sourced from the farm, but also essential to the household, such as milk, bread, butter, sugar, maize meal, wheat flour, cooking fat, salt, rice, meat, vegetables, and fruits, etc. However, it is clear from Table 6.4 that the reliance on exclusively purchased food as the most important source reduces from a very high 99% for non-farmers and 70% for those only engaged in urban farming to 50% for those practicing rural farming only and further to 28% of those combining both rural and urban farming. For one-eighth of those engaged in both rural and urban farming, and about the same proportion of those engaged in rural farming only, rural production was exclusively their main source of food in 2000. This is an indication that these households, though few in number, depend almost wholly on the produce from their rural production.
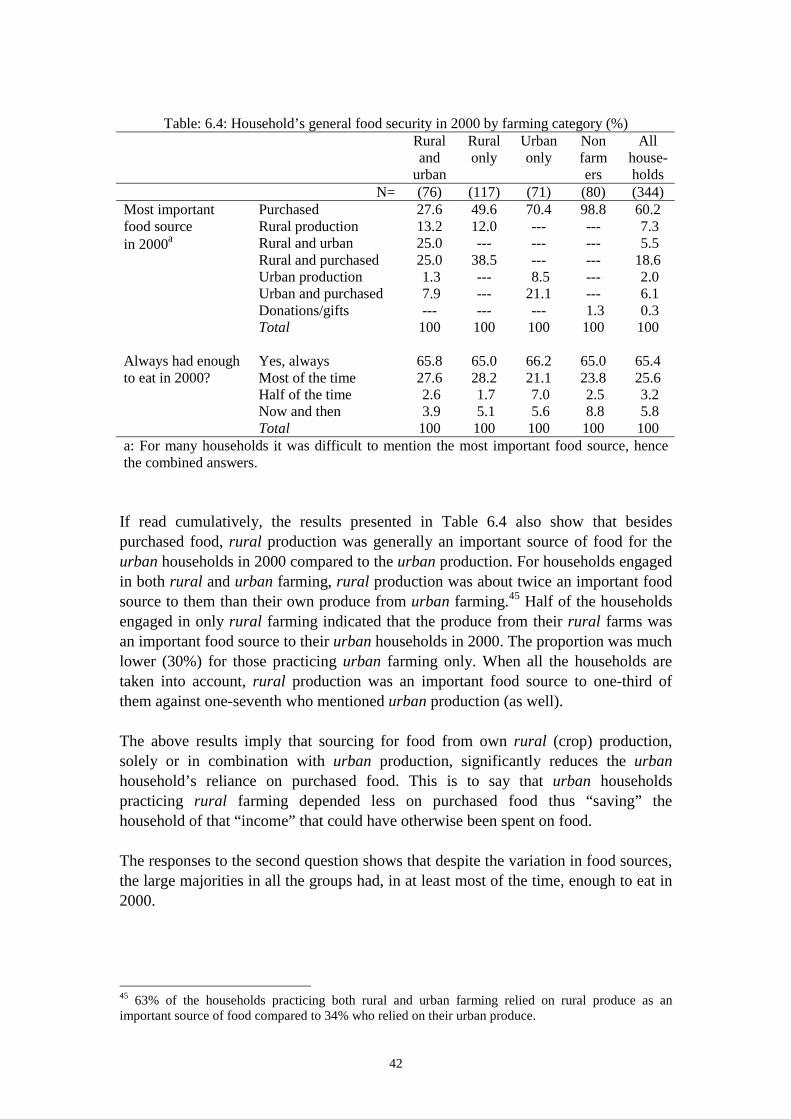
42
Table: 6.4: Household’s general food security in 2000 by farming category (%)
Rural and
urban
Rural only
Urban only
Non farm ers
All house-holds
N= (76) (117) (71) (80) (344) Most important food source in 2000a
Purchased Rural production Rural and urban Rural and purchased Urban production Urban and purchased Donations/gifts Total
27.6 13.2 25.0 25.0 1.3 7.9 ---
100
49.6 12.0 ---
38.5 --- --- ---
100
70.4 --- --- ---
8.5 21.1 ---
100
98.8 --- --- --- --- ---
1.3 100
60.2 7.3 5.5 18.6 2.0 6.1 0.3 100
Always had enough to eat in 2000?
Yes, always Most of the time Half of the time Now and then Total
65.8 27.6 2.6 3.9 100
65.0 28.2 1.7 5.1 100
66.2 21.1 7.0 5.6 100
65.0 23.8 2.5 8.8 100
65.4 25.6 3.2 5.8 100
a: For many households it was difficult to mention the most important food source, hence the combined answers.
If read cumulatively, the results presented in Table 6.4 also show that besides purchased food, rural production was generally an important source of food for the urban households in 2000 compared to the urban production. For households engaged in both rural and urban farming, rural production was about twice an important food source to them than their own produce from urban farming.45 Half of the households engaged in only rural farming indicated that the produce from their rural farms was an important food source to their urban households in 2000. The proportion was much lower (30%) for those practicing urban farming only. When all the households are taken into account, rural production was an important food source to one-third of them against one-seventh who mentioned urban production (as well). The above results imply that sourcing for food from own rural (crop) production, solely or in combination with urban production, significantly reduces the urban household’s reliance on purchased food. This is to say that urban households practicing rural farming depended less on purchased food thus “saving” the household of that “income” that could have otherwise been spent on food. The responses to the second question shows that despite the variation in food sources, the large majorities in all the groups had, in at least most of the time, enough to eat in 2000.
45 63% of the households practicing both rural and urban farming relied on rural produce as an important source of food compared to 34% who relied on their urban produce.

43
Rural non-farming activities Engagement in rural non-farming economic activities was not very popular amongst the Nakuru townspeople. Out of the 344 households, only 35 of them were engaged in non-farming economic activities in the rural plots. Nineteen of these households were from the high-income category, 11 from low-income and five from the middle-income households. There were no households from the very low-income category that engaged in rural non-farming economic activities in 2001. Apart from only two, all the other households were male-headed. Many of these activities were part time ventures for the urban households involved. Table 6.5 presents the various types of rural non-farming economic activities that the Nakuru townspeople engaged in during the previous calendar month before the survey. Three households engaged in two types of activities. The common type of activity was rural land renting practiced by 16 households. Instead of leaving the land idle, some people prefer to rent them out at a fee. Nine of the households were engaged in “other business” ranging from being an herbalist, mason, tailor, barber and managing bar, butchery and salon businesses. A few households were engaged in petty trade, posho-mill business, and shop keeping and being a landlord. Posho-mill business is an investment in the rural areas where maize, millet or sorghum is grinded for flour. Though not reflected here, it is usually common with retirees.
Table 6.5: Rural non-farming economic activities* No of households
involved Rural land renting Landlord (renting out a house) Posho-mill business Petty trade Shop keeping Other businesses
16 3 2 5 3 9
* See Appendix 6, Table A6.3 for the complete list Despite the fact that many of the households would have liked to engage in income generating activities in the rural areas, quite a number of them stated that they were committed to their current jobs in Nakuru and therefore lacked the time to engage in “other” activities. It is true that such activities require closer supervision and therefore need hired labour or a trustworthy rural family member to take care of the business. As would be expected, a large majority of the households engaging in rural non-farming economic activities did so because the activity – as they perceived it – is an additional income source to the urban household (Table 6.6). For less than one-eighth of the households it is a major income source and about half of the households could not survive without them, indicating the potential of such activities in enhancing the income situation of the urban households.

44
Table 6.6: Importance of rural non-farming economic activities (N) N Major income source Additional income source Could not survive without them
4 29 19
In answer to the question what proportion rural non-farming economic activities contributed to the urban household’s income situation, one-fifth of the households engaged in rural non-farming activities said that it contributed at least half of their income. For most of the rest, it added less than half to a small portion.

45
Chapter 7
Urban-rural linkages Migration history of the household heads A summary of the data on the migration history of the household heads is presented in Table 7.1.46 The Kikuyu were by far the dominant ethnic group of the household heads, followed by the Luos. The Luhya, Kalenjin, Kisii and Kamba formed fairly small minorities, amongst many other ethnic groups represented in the sample (Appendix 7, Table A7.1).
Table 7.1: Migration history of the household heads (%; N=344) Ethnic background Migration status Province of origin Year of coming to Nakuru (immigrants only) Main reason to come to Nakuru (immigrants only)
Kikuyu Luo Born outside Nakuru town Central Rift Valley Nyanza Western Before 1980 1980-1989 1990 or later To look for work/to work Came with parents Had relatives in Nakuru Followed spouse
51.2 16.0
79.4
34.8 24.5 18.7 11.7
24.5 29.7 45.8
74.4 8.4 7.0 4.4
About 80% of the household heads were not born in Nakuru municipality. About one-third of those were from Central Province, one-quarter from Rift Valley, one-fifth from Nyanza and one-eighth from Western. Nairobi and Coast Provinces were under-represented. The leading districts of origin being: Nyeri, Nakuru, Muranga, Nyandarua, Kakamega, Kiambu, Kisii, Kericho and Siaya, in that order (Appendix 7, Table A7.2). This somewhat correlates with the location of rural plots, confirming the earlier contention that location of rural plots reflects the province and district of origin of the urban migrants to Nakuru.
46 For more details, see Appendix 7, Tables A7.1, A7.2, A7.3 and A7.4.

46
One-quarter of the immigrant household heads came to Nakuru town more than 20 years ago, i.e. before 1980 while about another one-third between 1980 and 1989. Slightly less than half of them can be regarded as “recent immigrants” as they came to Nakuru town in 1990 or later. In answer to the question as to the main reason for coming to Nakuru municipality, about three-quarters of the household heads mentioned that they came to work or look for work. Coming to Nakuru town to look for work was more prevalent amongst the heads from the very low-income households (48%) compared to the high-income households (31%). Fifty percent of the high-income household heads as opposed to about one-eighth from the very low-income households were already in employment when they came to Nakuru town, i.e. they came on job transfer. Some household heads came to Nakuru town because they followed their spouses, had relatives in the municipality or came with their parents (when they were young). Other less dominant reasons mentioned were: lack of land or work in the area of origin, displacement due to ethnic clashes and schooling (Appendix 7, Table A7.4). Over half of the spouses of the married male household heads mentioned “followed spouse” as the main reason for coming to Nakuru town while one-sixth came to work or look for work there. Visits to the rural plot by household head and/or spouse It is a common phenomenon in Kenya that the household head or the spouse or both to, once in a while, visit the rural plot (home) for various reasons. It was pointed out in Chapter 3 that a large proportion of the rural plots are located at the rural homes of the (male) household heads. To capture the visits to all the plots irrespective of being a “home”, the respondents were asked if the household head and/or spouse visited any of the rural plots in 2001. By the last quarter of 2001,47 the household heads and/or their spouses had visited 71% of the plots (349 plots out of a total of 491). The number and frequency of visits made to the plots differ from household to household depending on many factors (e.g. distance of rural plot from Nakuru town, purpose of visit, who is staying in the rural plot, financial considerations, etc). However, from the data we can say that half of the plots had been visited less than five times while one-quarter had been visited at least 10 times in the last quarter of 2001 (Table 7.2 and Appendix 7, Table A7.5). Due to financial constraints, the low to very low-income household heads and/or their spouses were not able to visit their rural plots as frequently as those from the high-income households. By the last quarter of 2001, 93% of the heads or spouses from the high-income households had visited (at least one of) their rural plots as compared to two-thirds from the very low-income households. During the same period, 84% versus
47 That is, when this survey was carried out.

47
37% of plots accessible to the very-low and high-income households, respectively, had been visited not more than five times.
Table 7.2: Visits to the rural plot in the last quarter of 2001 (%) Number of visitsa Frequency of visita Purpose of visita If the frequency of visit has changed over timeb
Less than 5 visits 5 to 9 visits 10+ visits Monthly Twice a year Every three months Just to see/visit rural family Attend to rural farming activities Attend to cultural ceremonies Holiday Decreased Increased No significant change
54.7 16.0 29.2
21.2 17.2 15.2
71.1 55.9 29.5 24.9
54.4 18.3 27.7
a: By plot (N=349). For purpose of visit, % > 100 due to combined answers. b: By households (N=327).
In most of the plots, the number of days spent per visit was at most one week, a large majority of them spending only one to two days, preferably during weekends and public holidays (see also Appendix 7, Table A7.5). Longer visits are made during annual leave, school holidays or Christmas holidays. Christmas holidays are traditionally the time when people living elsewhere returned home to celebrate with their relatives. There were various reasons for visiting the rural plots. Typical of the kinship ties in most communities of Kenya, many “urbanites” are obliged to “frequently” visit their rural family members at the rural homes. As would be expected, household heads and/or their spouses made visits to the rural plots just to “see/visit” the rural family members. For many migrants, and especially for the urban poor, this is not only part of their social identity but also an important safety net during periods of economic and social insecurity in the cities. The very-low income households tend to maintain links with their rural homes through such “just-to-see-them” visits. Over three-quarters (78%) of the household heads and/or spouses from this income category visited their rural plots “just to see” the rural family members compared to 58% of the high-income households. Apart from just seeing the rural family members, the high-income households are more focussed in their rural visits. For example, 65% of them visited their rural plots to attend to farming activities against 46% from the very low-income households doing the same. However, we have to bear in mind that such visits are also characterised by

48
attending to other activities or commitments and not only to “see” the rural family members. In more than half of the plots visited, one of the reasons mentioned was to attend to (rural) farming activities, emphasizing the importance of rural farming to the households involved. Regardless of the fact that most of the farming activities are actually carried out by the rural family members, both the household head and spouse took a keen interest in rural crop cultivation and livestock keeping in 2001. Once in a while, one of them or both, travelled to the rural plots to supervise and participate in farming activities (see Chapters 4 and 5). Attendance to cultural ceremonies like weddings and funerals was also mentioned as one of the reasons to visit rural plots. One’s absence in a relative’s funeral is never regarded lightly by the kith and kin. Relatives are culturally expected to join the bereaved in mourning and to finally lay “one of them” to his or her final resting place. It is believed that by doing so, you will also be buried by “others”. Such occasions also provide an opportunity for the town dwellers to pass through their own rural homes or to meet their rural relatives who are attending the same function. Lastly, for some, it is a yearly practice to visit the rural plot or home for a holiday, usually during annual leave of the household head or school holidays for the spouse and children or during long weekends and public holidays. For half of the households, the frequency of visiting rural plots – as perceived by the respondent – has decreased with time: that is to say that they visit the rural plots less frequently now than before. For about one-quarter there is no significant change while for another one-sixth the frequency of visiting rural plots has increased (Table 7.2). The decrease might be partly a response to the general increase in the costs of travelling, especially for the urban poor and those whose plots are far away from Nakuru municipality. About two-thirds (65%) of the very low-income households visit their plots less frequently now than before compared to 44% of the high-income households who have experienced the same trend. For another one-eighth and about one-fifth (23%) of the very low and high-income households, respectively, the frequency of visiting rural plots has increased with time. A further analysis by location of plot shows that more than half (57%) of the plots located in the “outer ring” and 46% of those located in “Nakuru district”48 have experienced this decrease. Sometimes the spouse of the male household head and the children stay in the rural home for some period of time. About one-third of the spouses and children had ever stayed in the rural home for a longer period of time than the normal visits. The reasons advanced for this include: lack of income to support them in town, lack of housing in town, cheaper education at home, while others went to tend to the land at home. Other reasons mentioned were: had no job or the husband had no job in town, had business at home, to build a homestead, to get to know the home and parents-in-law, take care of the sick mother and cultural49 reasons. About twice as many spouses 48 See Chapter 3 for the operationalization of the distance variable. 49 One respondent informed me that her community required that she stays at home after her first birth.

49
from the very low-income households had ever stayed at home than the ones from high-income households (50% versus 26%). Two-fifths of the spouses from the very low-income households did so as a coping strategy, i.e. because of lack of income to support them in town. Visits to the Nakuru town household by rural family members The flow of visits is not only from Nakuru town to the rural plots but also the other way round. When asked if rural family members visit them in Nakuru municipality, 86% of the respondents said “yes”. The rural family members do visit their relatives in Nakuru municipality for various reasons ranging from just to “see or visit” (92%), holiday (13%) or to collect inputs or money for farming activities (6%). Other reasons for visiting the urban households were: to attend wedding ceremonies, bring food from the farm, bring money from the sold rural produce, bring school fees for children in Nakuru town, buy goods from the town, get some money from the relatives in Nakuru town, come for pension payment, visit the sick in the hospital, get medical attention and generally “when in a problem” or when passing by to some other destination. Flows between urban and rural households It is common that when the household head and/or spouse visit the rural home or plot, they take with them purchased food items and money or occasionally non-food items. They in turn bring back with them farm produced food items or other food items locally available. Similarly, when the rural family members visit the urban household, they bring with them (farm produced) food items from the rural plots and go back with purchased food items, money or non-food items from Nakuru town. The nature and extent of such flows depends on the season, money for transport and the specific needs of the household. In terms of remittances, about three-quarters of the households mentioned that they contributed financially to the households in the rural plots. The frequency of sending money back home and the amount sent depends on several factors and circumstances. However, there is a tendency for most people to send money back home every month (Appendix 7, Table A7.6). Although people send money back home regardless of their income categories, a larger proportion of the high-income households were able to achieve that and to some extent more frequently than the low to very low-income households. For example, in 2000, the large majority (83%) of the high-income households sent money back home while only one-third of the very low-income households were able to do that. Remittances also occur when the urban households visit their rural plots: 89% of the high-income households and 56% of the very low-income households admitted that they leave money during most of their visits to the rural homes.
50
The reasons for sending money to the rural households were mainly for general upkeep, farming purposes or paying fees: nine out of every ten households sent money home for general upkeep purposes; about three-fifths for farming purposes and one-quarter for paying fees. Besides the common practice of sending money home for general upkeep, 43% and 66% of the very low and high-income households, respectively, sent money home for farming purposes. For others, they also sent money for festivity, funeral expenses and for health care of the ailing relatives at home. As with the rural visits, the frequency of sending money to the rural family members has decreased with time. Half of the households send money back home less frequently now than before. One-quarter did not experience any change while for one-fifth the frequency has increased. Though a relatively larger proportion of the very low-income households are experiencing the decrease in the frequency of sending money back home, the high-income households have not been spared either. Two-thirds of the very low and half of the high-income households indicated that they send money back home less frequently now than before. Despite the fact that urban households send money back home, there are indications that the reverse is also true where urban households also get money from the rural plots: though small, 5% of the household heads and/or spouses who visited the rural plots brought back with them money from the plots while 3% of the rural family members who visited the urban households brought with them money from the rural plots to the urban household head or spouse. Future plan and attachment to the rural plot Even with all the reasons for coming to Nakuru town, 56% of the immigrants indicated that they would like to “retire to our rural home” or to one of the rural plots, when asked about their future plan.50 Two-fifths of them would like to stay in Nakuru permanently. For those born in Nakuru, the figures were 47% and 49%, respectively. Most urban dwellers are migrants from their areas of origin and have inheritance rights to the land “back home.” While the heads from high-income households were optimistic of “setting up a home” outside their rural homes, the heads from the very low-income households were more inclined towards retiring in their rural homes. The attachment to the rural plots/home to the urban households is summarised in Box 1.
50 All the household heads were asked about their “future plan”.

51
Box 1: How important is the rural plot/home to you?* Kamau (Male, 20)
“It is where I will be buried and return to when I am old”
Kimani (Male, 26)
“It provides for my up-keep, gives me a sense of belonging and is the best-fixed asset I cherish most”
Baba Toni (Male, 59)
“Provides an additional means of livelihood to the urban household”
Mwende (Female, 27)
“In case of anything such as the current retrenchment programme or death, at least I will have somewhere to fall back to or to rest in peace [be buried]”
Kinuthia (Male, 50)
“Will serve as a home during my retirement and it provides a means of livelihood to my wife, children and other family members who stay there”
Baba Meshak (Male, 46)
“Provides a home for my wives and children. I could not have survived without this land”
Wanjiku (Female, 22)
“A place you fall back to in times of hardship and you are assured of a livelihood”
Adhiambo (Female, 21)
“It is our future permanent home”
Mama Lucy (Female, 41)
“Important for settlement in future. It gives us a sense of belonging since that is our own home where we can never be harassed by anybody”
Baba Anastancia (Male, 50)
“In case of anything, my children have a home to inherit. It also acts as a security when taking bank loans”
Baba Nico (Male, 44)
“Being an ancestral land, I will be buried there. In case I am jobless, I will turn to my home for food and income”
Baba Rhoda (Male, 52)
“It is something we can depend on in future. It will always remain the best investment for our family”
Anyango (Female, 31)
“According to our culture, one cannot ignore his ancestral land, especially when it has some inheritance value. Furthermore, my sons will inherit it in future”
Mwangi (Male, 41)
“It is an asset, more sentimental, and I am proud to own it”
* The names have been changed to conceal the identity of the respondents.

52
Chapter 8
Multi-spatial and mono-spatial livelihoods: A preliminary comparison
Introduction Multi-spatial livelihoods refer to households with a livelihood foothold in both urban and rural areas without necessarily implying a residential split of the household. In this study, multi-spatial livelihoods refer to the cases in Nakuru town in which the rural plot is a source of food and/or income to the urban household. On the other hand, mono-spatial livelihoods refer to those cases who do not have access to a rural plot or for whom the rural plot is not a food and/or income source to the urban household.51 All those stating that the rural plot is a food source or an income source or both are defined as households with multi-spatial livelihoods, the contrary being households with mono-spatial livelihoods. The majority (84%) of the Nakuru town households can be considered as having a multi-spatial livelihood. This chapter is a first attempt to answer the question “does having a foothold in both urban and rural areas have a positive impact on food and income situation of the urban households?”52 First, however, some selected characteristics of Nakuru town households with multi-spatial livelihoods will be discussed by comparing them with households having mono-spatial livelihoods. Household characteristics A summary of the characteristics of households in Nakuru town with multi-spatial livelihoods on the one hand and mono-spatial livelihoods on the other is presented in Table 8.1. There seem to be no major differences between the two groups in terms of the monthly income situation. As far as household size is concerned, households with multi-spatial livelihoods are generally smaller than those with mono-spatial livelihoods. Two-fifths of them recorded five or more household members, against three-fifths of the households with mono-spatial livelihoods,53 meaning that income per household member is higher in the households with multi-spatial livelihoods.
51 Despite the fact that two-thirds (69%) of the households with mono-spatial livelihoods had access to a rural plot, these plots were neither a food nor an income source to them. 52 This is one of the questions to be worked out during the following stages of this research project. 53 The mean household size for households with multi-spatial livelihoods was 4.2 while that of households with mono-spatial livelihoods was 5.2.

53
Table 8.1: Characteristics of households with multi-spatial and mono-spatial livelihoods (%) Multi-spatial
livelihoods (N=289)
Mono-spatial livelihoods
(N=55) Household income Situation (Kshs/month) Household size
Very low Low Medium High Total 1-4 members 5+ members Total
23.2 30.4 23.2 23.2 100
58.5 41.6 100
30.9 30.9 18.2 20.0 100
38.2 61.8 100
Table 8.2 below presents a summary of the characteristics of the household heads of the two groups (see Appendix 8, Table A8.1 for more details). If the proportions of female-headed households within each group were to be compared, then it is relatively higher amongst households with mono-spatial livelihoods. This may be partly explained by the fact that in most ethnic groups of Kenya, women do not have the right to inherit their ancestral land – and therefore, “lack of access” to a rural plot. Even when widowed, their likelihood to use the rural land is reduced, as some of them may prefer to concentrate more on urban livelihood sources, while maintaining links with both her husband’s and parent’s rural homes.
Table 8.2: Households with multi-spatial and mono-spatial livelihoods: Summary of characteristics of household heads (%)
Multi-spatial livelihoods (N=289)
Mono-spatial livelihoods
(N=55) Sex Age (in years) Marital status
Female Less than 40 40 or more Never married Married Divorced/Widowed/Separated
17.3
64.0 36.0
16.6 74.1 9.0
27.3
38.9 61.2
9.1 67.3 21.8
As for age, heads in households with multi-spatial livelihoods are generally younger than those of households with mono-spatial livelihoods.54 For example, about two-thirds of the former group was aged below 40 years, against about two-fifths of the latter. This is an indication that the younger household heads are more inclined to source for rural livelihoods than the older ones. The younger household heads are in
54 The median age for heads of households with multi-spatial livelihoods was 35 while that of heads of households with mono-spatial livelihoods was 41.

54
an earlier stage of the family life cycle and are therefore more affected by the increasing cost of living. The majority of the household heads in both groups were married, most of them monogamously. However, whereas one would have expected the opposite, there were almost twice as many single (never married) heads in households with multi-spatial livelihoods than in mono-spatial livelihood households. On the other hand, there were almost twice as many divorced, widowed and separated heads in households with mono-spatial livelihoods, explaining the relatively higher proportion of female-headed households in this group. There were no marked differences between the two groups as regards the other characteristics of the household heads. These are type of residence, educational level and occupational status (see Appendix 8, Table A8.1). Table 8.355 presents a summary of the migration history of the household heads. In both groups over three-quarters of them were born outside Nakuru municipality. On the whole, heads from households with multi-spatial livelihoods came to Nakuru more recently while a larger proportion of household heads from mono-spatial livelihood households have stayed in Nakuru for more than twenty years. This is probably related to the age of the household heads: heads in households with multi-spatial livelihoods are relatively younger. The main reason to come to Nakuru does not differ very much between the two groups as over half of the household heads came to work in Nakuru or look for work there.
Table 8.3: Households with multi-spatial and mono-spatial livelihoods: Summary of migration history of the household heads (%)
Multi-spatial livelihoods (N=289)
Mono-spatial livelihoods
(N=55) Migration status Year come to Nakuru (immigrants only) Main reason to come to Nakuru (immigrants only)
Not born in Nakuru Before 1980 1980-1989 1990 or later To look for work/to work Had relatives in Nakuru Followed spouse/parents
80.3
21.9 31.1 47.0
77.2 6.0 11.6
74.5
39.1 22.0 39.0
58.5 12.2 19.6
Household food security In order to have at least an indication whether households with multi-spatial livelihoods were able to reach a higher level of urban food security than those with mono-spatial livelihoods, four questions to the respondents were analysed. Table 8.4 shows that the percentage of households with mono-spatial livelihoods that normally 55 For more details, see Appendix 8, Table A8.2.

55
purchase all their food requirements is almost twice as high as that of households with multi-spatial livelihoods. In other words, households with mono-spatial livelihoods normally spend much more on buying their food requirements. This is confirmed by the fact that the most important food source for the households with mono-spatial livelihoods in 2000 was purchased food, corresponding with their relatively higher average monthly total expenditure as well as expenditure on food (see Table 8.4). Table 8.4: Households with multi-spatial and mono-spatial livelihoods: Summary of general
food security (%) Multi-
spatial livelihoods (N=289)
Mono-spatial
livelihoods (N=55)
Do you buy all your food requirements? Most important food source in 2000 Did you usually have Enough to eat in 2000? Average expenditure (monthly, in Kshs)
Yes No Total Purchased Rural production Rural and urban Rural and purchased Urban production Urban and purchased Donations/gifts Total Yes, always Most of the time Half of the time Now and then Total On food Total
27.7 72.3 100
56.1 8.7 6.6 22.1 2.1 4.5 ---
100
67.1 24.9 2.8 5.2 100
3,000 9,000
54.5 45.5 100
81.8 --- --- ---
1.8 14.5 1.8 100
56.4 29.1 5.5 9.1 100
4,000 11,000
Thirty seven percent of the households with multi-spatial livelihoods benefited from rural production as their main source of food in 2000, for some solely and for others in combination with other sources. Consequently, they depended less on purchased food than households with mono-spatial livelihoods. Furthermore, urban production was also a source of food for one-eighth of them. For one household with mono-spatial livelihood, donations and gifts was the most important food source in 2000. As concerns the question – “Did your household usually have enough to eat in 2000?” – the large majority in both groups had enough to eat most of the time. However, there are indications that though less in their total numbers, there are more households with mono-spatial livelihoods who experience “food problems”. For example, 15% of the households with mono-spatial livelihoods lacked enough to eat about half the time or less in 2000 compared to 8% of the households with multi-spatial livelihoods.

56
Chapter 9
Summary of findings and conclusions Summary of findings The results presented in this report cover the various components of a general survey, carried out between September and December, 2001 on “Rural livelihood sources for urban households: A case study of Nakuru town, Kenya.” A rural livelihood source in this report is described as the engagement by an urban household, in rural farming and/or non-farming economic activities, without necessarily one or more of the urban household members residing in the rural area. Out of the population of Nakuru town, a sample of 344 households was used in this study to investigate the scale and nature of engagement in rural farming and non-farming activities by the urban households in Nakuru, on the one hand, and the importance of these activities to their livelihoods, on the other. The survey revealed that urban households in Nakuru engage in a wide range of multiple activities and livelihood sources that can be broadly categorized into urban farming and non-farming activities and rural farming and non-farming activities. While rural farming by urban households is more common than farming within the municipality, engagement in non-farming economic activities was obviously much more predominant in Nakuru town than in the rural areas. Three-quarters of the households in Nakuru town engage in farming activities in one way or the other. Over half of the households engage in farming activities in the rural areas, while two-fifths do so in Nakuru municipality. Besides the main activity, two-fifths of the households engage in other non-farming economic activities in Nakuru town compared to just about one-eighth doing so in the rural areas. Access to a rural plot Access to a rural plot, be it purchased or inherited, enables urban households to engage in rural farming. Nine out of every ten households have access to a plot outside Nakuru municipality, about two-thirds of them having access to more than one plot. The plot sizes vary greatly, ranging from less than one acre to over 30 acres, with a median plot size of 2 acres and an average plot size of 4.6 acres. The locations of the plots generally reflect the district of origin of the household heads and were concentrated mainly in Rift Valley, Central and Nyanza provinces of Kenya. Two-thirds of the plots were in fact located at the rural home of the household head. Most of the plots were either inherited or privately purchased with a few rented plots located just outside the boundary of the municipality.

57
While the high-income households were able to purchase or claim ownership to most of their plots, the very low-income households acquired most of their plots through inheritance or relied more on their ancestral plots, i.e. family land back home. The closer the plot is located to Nakuru municipality, the higher the chances of it being purchased and used by the owner. The plots further away are mainly inherited with a greater involvement of the rural family members in its usage. Apart from the plots left idle, rented out or used as a homestead only, all others were being used wholly or in part for rural farming purposes by the Nakuru townspeople and/or their rural families back home. Out of this practice, over two-thirds of the plots are a source of food to the urban households, while almost half are at the same time a source of income. The food component is more important as household income is lower; hence, the importance of the rural plot as a source of income increases as household income is higher. Rural crop cultivation Half of the households in Nakuru town who had a rural plot practiced rural crop cultivation themselves. Although a wide range of crops were cultivated in the rural plots in 2000, maize, a staple dish, and beans, a popular substitute for animal protein, were the most common, being cultivated by over two-thirds of the cultivators. Irish potatoes, kale (sukuma wiki), cabbage, bananas, tea, millet, green peas and coffee were each cultivated by about one-third of the cultivators. On average, about two-fifths of the total harvest was self-consumed, another two-fifths sold, and the rest was given away, kept for seedlings or stored for future use. In total, it was estimated that the rural crop cultivators in Nakuru town as a whole produced some 207 million kgs of crops in 2000. Out of this, 45 million kgs was maize, 6 million kgs was beans, 20,000 tons was irish potatoes and 31,000 tons was kale (sukuma wiki). The self-consumed produce from these four crops alone contributed 51% to the Nakuru town households’ energy requirements. This is 10 times higher than self-consumed produce from the same crops cultivated in Nakuru municipality in 1998, if the same is computed using Foeken & Owuor’s (2000) results of a general survey on urban farmers in Nakuru town. Over half of the rural crop cultivators used chemical fertilizers, manure, crop residues and improved seedlings. Local seedlings and chemical insecticides and pesticides were used by less than half of the households. While manure, crop residues and local seeds came largely from own farms, the other inputs were purchased from Nakuru town or at a local town nearer where the plot is located. The use of purchased inputs depends on the ability of the household to purchase them and therefore the low-income households were somewhat disadvantaged. The use of hired labour was common but again with a higher proportion amongst the high-income households who were able to afford to pay for their services.

58
Whereas both the household head and spouse were involved in rural crop cultivation in one-way or the other, directly or indirectly, the spouses played a greater role in terms of the actual participation in the various activities. In general, in those cases where family members and spouses were living in the rural areas, they were directly involved in all the stages of rural crop cultivation. Rural livestock keeping One-third of the Nakuru town households engaged in rural livestock keeping. The most common types of livestock kept in the rural plots were cattle, chicken, goats and sheep. It was estimated that there were about 102,000 cattle, 143,000 chicken, 124,000 goats and 45,000 sheep kept in the rural plots in 2000 by the Nakuru townspeople. Milk and eggs were the most important animal products for the rural livestock keepers with an average production of about 11 litres of milk per day per milk-producing household and 12 eggs per day per eggs-producing households. At least half of the eggs and milk produced were self-consumed. The rest were sold locally to neighbours or nearby hotels or some of it given away. The rural livestock keepers used various types of inputs such as feed supplements, crop residues, veterinary drugs, improved breeds and ethno-veterinary medicine. Feed supplements and improved breeds were used more by the high-income households compared to the very low-income households. Despite being perceived as labour intensive, only two-fifths of the rural livestock keepers hired extra labour, majority of them from the high-income households. This is an indication of the reliance on family labour, especially for the lower income households. Importance of rural farming Urban households in Nakuru engage in rural farming as a way of sourcing for additional food or income or both. For the large majorities of the rural crop cultivators and livestock keepers, the activity was an additional food and/or income source to their urban households. This was by far the most important driving force for them to engage in the activity in 2000. Whereas the need for income was much stronger amongst the high-income households the need for food was more important for the very-low income households. However, the contribution of livestock keeping to the urban household’s food security situation was not as high as that of crop cultivation. For one-third of the crop cultivators, the activity contributed at least half of the food they consumed in 2000. On the other hand, rural livestock keeping supplemented less than half to a small portion of food requirement for half of the households in 2000. In terms of income, over two-thirds of the rural crop cultivators and half of the livestock keepers said that the produce sold contributed to their urban household’s total income situation in 2000. Besides purchased food, rural farming was, in general, a more important source of food for the urban households in 2000 compared to urban farming. When all the

59
households are taken into account, rural production was an important food source to one-third of them against one-seventh who mentioned urban production as well. The importance of rural farming is even stressed further when three-quarters of the cultivators and two-fifths of the livestock keepers indicated that they “could not survive without it.” For eight households, rural farming was their main activity. A further analysis of the importance of rural farming revealed that as much as urban households largely depend on purchased food, this dependence is greatly reduced when they engage in rural farming, solely, or in combination with urban farming. The percentage of entirely depending on purchased food as a major food source dropped by half (from 99% to 50%) if the household practiced rural farming and by about three quarters (to 28%) if the household practiced both rural and urban farming. These results imply that urban households practicing rural farming depend substantially less on purchased food. It also indicates that relying on both rural and urban production can significantly improve the urban households’ food security situation. Rural non-farming activities Despite the fact that engagement in rural non-farming economic activities was not very popular amongst the urban households in Nakuru, the potential of such activities in enhancing the income situation of the households involved should not be underestimated. For most of the households engaged in rural non-farming economic activities in 2001, the activity contributed, with varying proportions, to their total income. Urban-rural linkages Immigrants to Nakuru town continue to maintain links with their rural plots or homes through frequent visitations and exchange of goods. The number and frequency of visits made to the rural plots differ from one household to another depending on several factors, i.e. income level, distance of plot from Nakuru municipality, purpose of visit and who is staying at the rural plot, amongst others. In more than half of the plots visited in 2001, one of the reasons was to attend to rural farming activities, emphasizing the importance attached to rural farming by the urban households involved. Even though the Nakuru townspeople continued to maintain links with their rural plots and homes, half of the households indicated that they visited their rural plots and homes less frequently now than before. For about one-sixth of the households the frequency had increased over time while the rest had not experienced any change at all. The decrease in visiting the rural homes does not necessarily mean an equivalent weakening links, but should be related more to the general increase in the costs of travel over time. In addition, rural family members visit the urban households as well.

60
Flows of goods and money between urban and rural areas take place during such visits. From the urban to rural home, people mainly took with them purchased food items and money while from the rural areas they mainly brought with them farm produced food items or other food items locally available at a cheaper price. Besides the visits, about three-quarters of the Nakuru households regularly sent money back home for various reasons, including farming purposes. The reverse flow, where urban households receive money from the rural areas, was observed in a few of the households. As with the rural visits, half of the household heads sent money home less frequently now than before. One-quarter did not experience any change while for one-fifth the frequency has increased. Multi-spatial and mono-spatial livelihoods Eighty-four percent of the Nakuru households can be considered as having a multi-spatial livelihood, i.e. those households in which the rural plot is a source of food and/or income. On the other hand, mono-spatial livelihoods refer to those cases who do not have access to a rural plot or for whom the rural plot is not a food and/or income source. A preliminary comparison between the two revealed that household heads in households with multi-spatial livelihoods were relatively younger than those of mono-spatial livelihoods. The younger household heads are in an earlier stage of the family life cycle and are therefore more affected by the increasing cost of living, corresponding with the theoretical argument in Chapter one about increasing poverty and the increasing costs of living without an equivalent rise in employment and real wages. In terms of food security, the general picture that emerges is that households with multi-spatial livelihoods were in a more favourable food situation than those with mono-spatial livelihoods. For the households with multi-spatial livelihoods, rural production provided them with at least two-fifths of their food requirements. Consequently, they depended less on purchased food than households with mono-spatial livelihoods. Conclusions Given the present circumstances of urban unemployment, deepening social differentiation, decline in real wages, rises in the cost of living, escalating urban poverty, and urban food insecurity, risk spreading or income diversification through multi-spatial sourcing of food and income is an important coping mechanism in many urban households. The results emanating from this study clearly show that rural farming by urban households does play a major role in enhancing urban food security and income diversification of the households involved. The high-income households turn into rural farming as a way of augmenting their declining salaries within the formal sector while the role of rural farming in enhancing food security in urban households is even greater due to the escalating urban poverty. The results confirm that rural links are vital safety nets and welfare options for urban people who are
61
vulnerable to economic fluctuations (Potts 1997; Tacoli et al 2003) and that rural food production is an important element in the livelihood strategies of urban households in many parts of Africa (Rakodi 1995). There are indications of significant shifts in the nature of transfers of goods and cash between urban and rural households in the sense that remittances from urban to rural areas are declining and transfers of food and even cash from rural to urban areas are increasing. This is contrary to what is perceived that due to spiralling costs of transportation, many low-income urban households that were previously dependant upon direct food remittances from their rural home can no longer afford to bring food from their rural homes. The importance of rural farming and non-farming activities to the urban households depends on several factors, key among them access to land. Access to land is also mediated by a combination of factors, ranging from national policies (land tenure systems), physical conditions of the area (soil types, rainfall, etc), inheritance rights (for women in particular), differences between households (for example, wealthier versus poor), and intra-household dynamics (gender and generational relations). Lastly, the potential role of rural farming in enhancing urban food security in Kenya can be achieved through an organized transportation and marketing system and integrating rural farming in urban food security policies. Poor physical infrastructure has far-reaching consequences not only for producer prices but also for maintaining the urban-rural linkages. In designing policies on enhancing urban food security, rural farming by urban households should be taken into consideration as well. Likewise, since rural-urban interactions are a significant part of livelihood strategies, they should always be taken into account by development policy makers in designing interventions for poverty alleviation and urban or rural development.

62
References ANDRÆ, GUNILLA (1992), Urban workers as farmers: Agro-links of Nigerian textile
workers in the crisis of the 1980s. In Jonathan Baker & Poul Ove Pedersen, eds., The rural-urban interface in Africa: Expansion and adaptation, pp. 200-222. Uppsala: Scandinavian Institute of African Studies.
BAKER, JONATHAN (1996), Rural-urban links and economic differentiation in northwest Tanzania. African Rural and Urban Studies 3(1), 25-48.
BAKER, JONATHAN (1997), Introduction. In Jonathan Baker, ed., Rural-urban dynamics in Francophone Africa, pp. 11-25. Uppsala: Scandinavian Institute of African Studies.
DRAKAKIS-SMITH, DAVID (1992), Strategies for meeting basic food needs in Harare. In Jonathan Baker & Poul Ove Pedersen, eds., The rural-urban interface in Africa: Expansion and adaptation, pp. 258-283. Uppsala: The Scandinavian Institute of African Studies.
FALL, ABDOU SALAM (1998), Migrants' long-distance relationships and social networks in Dakar. Environment and Urbanization 10(1): 135-145.
FOEKEN, DICK (1998), Coping with urban poverty in sub-Saharan Africa, with special emphasis on urban farming. Paper presented at the international symposium on The Development Perspective of Africa toward the 21st Century, Beijing, 21-23 October 1998.
FOEKEN, DICK & ALICE M. MWANGI (1998), Does access to land have a positive impact on the food situation of the urban poor? A case-study in Nairobi. East African Social Science Research Review 14(1): 19-32.
FOEKEN, DICK, SAMUEL O. OWUOR & WIJNAND KLAVER (2002), Crop cultivation in Nakuru town, Kenya: Practice and potential. Leiden: African Studies Centre, ASC Working Paper 50/2002.
FOEKEN, DICK & SAMUEL O. OWUOR (2000a), Urban farmers in an East African town: the case of Nakuru, Kenya. Leiden/Nairobi: African Studies Centre/Centre for Urban Research, ASC Working Paper 45 (also on website www.cityfarmer.org/nakuru.html).
FOEKEN, DICK & SAMUEL O. OWUOR (2000b), Livestock in a middle-sized town: Nakuru. Urban Agriculture Magazine. 1(2): 20-22.
FOEKEN, DICK & SAMUEL O. OWUOR (2001), Multi-spatial livelihoods in sub-Saharan Africa: Rural farming by urban households – The case of Nakuru, Town, Kenya. In Mirjam de Bruijn, Rijk van Dijk & Dick Foeken (eds) Mobile Africa: Changing patterns of movement in Africa and beyond, pp. 125-140. Leiden: Brill.
GEFU, JEROME O. (1992), Part-time farming as an urban survival strategy: A Nigerian case. In Jonathan Baker & Poul Ove Pedersen, eds., The rural-urban interface in Africa: Expansion and adaptation, pp. 295-302. Uppsala: The Scandinavian Institute of African Studies.
GILBERT, A. (1994), Third World cities: Poverty, employment, gender roles and the environment during a time of restructuring. Urban Studies 31: 605-633.
GUGLER, JOSEF (1971), Life in a dual system: Eastern Nigerians in town, 1961. Cahiers d'Etudes Africaines 11(43): 400-421.
GUGLER, JOSEF (1991), Life in a dual system revisited: Urban-rural ties in Enugu, Nigeria, 1961-87. World Development 19(5): 399-409.
ILO/JASPA (1992), African employment report. Addis Ababa: International Labour Office.

63
JAMAL, VALI & JOHN WEEKS (1988), The vanishing rural-urban gap in sub-Saharan Africa. International Labour Review 127(3): 271-292.
KAMETE, AMIN Y. (1998), Interlocking livelihoods: farm and small town in Zimbabwe. Environment and Urbanization 10(1): 23-34.
KANJI, NAZNEEN (1996), Review of urbanization issues affecting children and women in the eastern and southern African region. New York: Unicef.
KENYA, REPUBLIC OF (1970), Kenya population census 1969, Vol. 1. Nairobi: Government Printer.
KENYA, REPUBLIC OF (1997), Nakuru District Development Plan 1997-2001. Nairobi: Government Printer.
KENYA, REPUBLIC OF (2000), Economic Survey 2000. Nairobi: Government Printer. KENYA, REPUBLIC OF (2001), Poverty reduction strategy paper for the period 2001-
2004. Nairobi: Ministry of Finance and Planning. KRÜGER, FRED (1998), Taking advantage of rural assets as a coping strategy for the
urban poor: the case of rural-urban interrelations in Botswana. Environment and Urbanization 10(1): 119-134.
LEE-SMITH, DIANA, MUTSEMBI MANUNDU, DAVINDER LAMBA & P. KURIA GATHURU (1987), Urban food production and the cooking fuel situation in urban Kenya: National report. Nairobi: Mazingira Institute.
LEE-SMITH, DIANA & PYAR ALI MEMON (1994), Urban Agriculture in Kenya. In: A.G. Egziabher et al., Cities feeding people. An examination of urban agriculture in East Africa, pp. 67-84. Ottawa: International Development Research Centre.
MAKWALA MA MAVAMBU YE BEDA (1972), Le réseau urbain du Bas-Zaïre. Contribution à l'étude des relations ville-campagne. Brussels: Free University. Unpublished PhD thesis (3 volumes).
MCN (1999), Strategic Nakuru Structure Plan. Action plan for sustainable urban development of Nakuru town and its environs. Nakuru: Municipal Council of Nakuru.
MUZVIDZIWA, VICTOR NGONIDZASHE (2001), Keeping a foot in the village: Masvingo urban women. Journal of Social Development in Africa 16(1): 85-99.
MWANGI, ALICE M. (1995), The role of urban agriculture for food security in low income areas in Nairobi. Nairobi / Leiden: Ministry of Planning and National Development / African Studies Centre, Food and Nutrition Studies Programme, Report No. 54.
MWANGI, ALICE M. & DICK FOEKEN (1996), Urban agriculture, food security and nutrition in low income areas in Nairobi. African Urban Quarterly 11(2/3): 170-179.
NICOLAÏ, HENRI (1989), Le citadien et son village. Un aspect de la relation ville-campagne au Zaïre. In Singaravelou, ed., Pauvreté et développement dans les pays tropicaux, pp. 499-507. Bordeaux: University of Bordeaux III.
NUGENT, RACHEL (2000), Urban and peri-urban agriculture, household food security and nutrition. Discussion paper for FAO-ETC/RUAF electronic conference "Urban and peri-urban Agriculture on the Policy Agenda", August 21 - September 30, 2000. Internet: www.fao.org/urbanag/paper1-e.htm (17 August 2000).
OBUDHO, R.A. & DICK FOEKEN (1999), Urban agriculture in Africa. A bibliographical survey. Leiden/Nairobi: African Studies Centre/Centre for Urban Research, ASC Research Report 58.

64
O'CONNOR, ANTHONY (1991), Poverty in Africa. A geographical approach. London: Belhaven Press.
OTIENO, ALFRED TITUS AGWANDA (2001), Harmonization of household and family variables in 1999 and 1989 Kenyan censuses. University of Minnesota/Population Studies and Research Institute, University of Nairobi: Unpublished report to IPUMUS International Project.
OUCHO, JOHN (1996), Urban migrants and rural development in Kenya. Nairobi: Nairobi University Press.
PAINTER, THOMAS M. (1996), Space, time, and rural-urban linkages in Africa. African Rural and Urban Studies 3(1): 79-98.
PLATT, B.S. (1962), Tables of representative values of foods commonly eaten in tropical countries. London: Her Majesty’s Stationary, Medical Research Council Special Report Series no. 302.
POTTS, DEBORAH (1997), Urban lives: Adopting new strategies and adapting rural links. In Carole Rakodi, ed., The urban challenge in Africa: Growth and management of the large cities, pp. 447-494. Tokyo/New York: United Nations University Press.
POTTS, DEBORAH & CHRIS MUTAMBIRWA (1990), Rural-urban linkages in contemporary Harare: Why migrants need their land. Journal of Southern African Studies 16(4): 677-698.
RAKODI, CAROLE (1995), The household strategies of the urban poor: Coping with poverty and recession in Gweru, Zimbabwe. Habitat International 19(4): 447-471.
ROGERSON, CHRISTIAN M. (1997), Globalization or informalization? African urban economies in the 1990s. In Carole Rakodi, ed., The urban challenge in Africa: Growth and management of its large cities, pp. 337-370. Tokyo/New York: United Nations University Press.
SMIT, WARREN (1998), The rural linkages of urban households in Durban, South Africa. Environment and Urbanization 10(1): 77-87.
STREN, RICHARD (1992), African urban research since the late 1980s: Responses to poverty and urban growth. Urban Studies 29: 533-555.
TACOLI, CECILIA (1997), The changing scale and nature of rural-urban interactions: Recent developments and new agendas. In UNCHS/Habitat, Regional development planning and management of urbanization. Experiences from developing countries, pp. 150-161. Nairobi: UNCHS/Habitat.
TACOLI, CECILIA (1998), Rural-urban interactions: a guide to the literature. Environment and Urbanization 10(1): 147-166.
TACOLI, CECILIA (2002), Changing rural-urban interactions in sub-Saharan Africa and their impact on livelihoods: a summary. Working Paper Series on Rural-Urban Interactions and Livelihood Strategies: Working Paper 7. London: International Institute for Environment and Development (IIED).
TACOLI, CECILIA, M. BAH, S. CISSE, B. DIYAMETT, G. DIALLO, F. LERISE, D. OKALI, E. OKPARA & J. OLAWOYE (2003), Changing rural-urban linkages in Mali, Nigeria and Tanzania. Environment and Urbanization 15(1): 13-23.
TRIPP, AILI MARI (1996), Urban farming and changing rural-urban interactions in Tanzania. In Marja Liisa Swantz & Aili Mari Tripp, eds., What went right in Tanzania: People's response to directed development, pp. 98-116. Dar es Salaam: Dar es Salaam University Press.

65
UNCHS/HABITAT (1996), An Urbanizing World: Global Report on Human Settlements. London: Oxford University Press (for United Nations Centre for Human Settlements).
UNDP (2002), Kenya Human Development Report 2001: Addressing Social & Economic Disparities. Nairobi: United Nations Development Programme.
VERSLEIJEN, NICOLE (2002), Sukuma! A social analysis of urban agriculture: Case studies from Nakuru Town, Kenya. Wageningen: Wageningen University and Research Centre. Unpublished MSc Thesis.