Embed Size (px)
Citation preview

CYAN MAGENTA YELLOW BLACK
Bekele Shiferaw, Gideon Obare
and Geoffrey Muricho
International Crops Research Institute for the Semi-Arid Tropics
ICRISAT
International Crops Research Institute for the Semi-Arid TropicsPatancheru 502 324, Andhra Pradesh, India
www.icrisat.org
452-2006
Working Paper Series no. 23
Socioeconomics and Policy
Rural Institutions and Producer Organizationsin Imperfect Markets:
Experiences from Producer Marketing Groups inSemi-Arid Eastern Kenya
®
Job452Coverfinal.p65 1/24/2007, 5:10 PM1
CYAN MAGENTA YELLOW BLACK
Citation: Shiferaw B, Obare G and Muricho G. 2006. Rural institutions and producer organizations in imperfectmarkets: Experiences from Producer Marketing Groups in semi-arid eastern Kenya. CAPRi Working Paper 60. Alsojointly released as ICRISAT Socioeconomics and Policy Working Paper Series No. 23. Patancheru, Andhra Pradesh:International Crops Research Institute for the Semi-Arid Tropics. 40 pp. http://www.icrisat.org/gt-mpi/Publications/titlesearch.htm.
Titles in the Working Paper Series aim to disseminate information and stimulate feedback from the scientific community.A large number of simlar and informal publications, derived from ICRISAT’s socioeconomics and policy research,are also being distributed under various titles: Impact Series, Policy Briefs, Progress Reports, Discussion Papers, andOccasional Papers.
Abstract
Many countries in sub-Saharan Africa have liberalized markets to improve efficiency and enhance market linkages forsmallholder farmers. The expected positive response by the private sector in areas with limited market infrastructurehas however been disappointing. The functioning of markets is constrained by high transaction costs and coordinationproblems along the production-to-consumption value chain. New kinds of institutional arrangements are needed toreduce these costs and fill the vacuum left when governments withdrew from markets in the era of structural adjustments.One of these institutional innovations has been the strengthening of producer organizations and formation of collectivemarketing groups as instruments to remedy pervasive market failures in rural economies. The analysis presented herewith a case study from eastern Kenya has shown that while collective action – embodied in Producer MarketingGroups (PMGs) – is feasible and useful, external shocks and structural constraints that limit the volume of trade andaccess to capital and information require investments in complementary institutions and coordination mechanisms toexploit scale economies. The effectiveness of PMGs was determined by the level of collective action in the form ofincreased participatory decision making, member contributions and initial start-up capital. Failure to pay on delivery,resulting from lack of capital credit, is a major constraint that stifles PMG competitiveness relative to other buyers.These findings call for interventions that improve governance and participation; mechanisms for improving access tooperating capital; and effective strategies for risk management and enhancing the business skills of the PMGs.
About ICRISAT
The semi-arid tropics (SAT) encompass parts of 48 developing countries including most of India,parts of Southeast Asia, a swathe across sub-Saharan Africa, much of southern and eastern Africa,and parts of Latin America. Many of these countries are among the poorest in the world.Approximately one sixth of the world’s population lives in the SAT, which is typified byunpredictable weather, limited and erratic rainfall and nutrient-poor soils.
ICRISAT’s mandate crops are sorghum, pearl millet, chickpea, pigeonpea and groundnut – fivecrops vital to life for the ever-increasing populations of the SAT. ICRISAT’s mission is to conductresearch that can lead to enhanced sustainable production of these crops and to improvedmanagement of the limited natural resources of the SAT. ICRISAT communicates information ontechnologies as they are developed through workshops, networks, training, library services andpublishing.
The International Crops Research Institute for the Semi-Arid Tropics (ICRISAT) is a non-profit,non-political organization belonging to the Alliance of Centers supported by the ConsultativeGroup on International Agricultural Research (CGIAR). Established in 1972, ICRISAT generatesand shares cutting edge technologies that support the livelihoods of more than 300 million people -the poorest of the poor in semi-arid areas of the developing world.
©2006 by the International Crops Research Institute for the Semi-Arid Tropics
All rights reserved. Except for quotations of short passages for the purposes of criticism or review, no part of this publication may be reproduced,stored in retrieval systems, or transmitted in any form or by any means, electronic, mechanical, photocopying, recording or otherwise, withoutprior permission from ICRISAT. It is hoped this copyright declaration will not diminish the bona fide use of research findings in agriculturalresearch and development.
Résumé
De nombreux pays de l’Afrique au Sud du Sahara ont libéralisé leur marché dans le but d’améliorer l’efficacité et derenforcer les liens commerciaux entre les petits exploitants agricoles. La réponse positive que le secteur privé attenddans les régions où les infrastructures commerciales sont limitées, n’a cependant pas été celle espérée. Le fonctionnementdu marché est limité par les coûts de transaction élevés et par des problèmes de coordination qui se posent tout au longde la chaîne de valeur production-consommation. Dans cette période d’ajustement structurel, de nouveaux typesd’arrangements institutionnels sont nécessaires pour réduire ces coûts et pour combler le vide laissé par le retrait dugouvernement des marchés. L’une de ces innovations institutionnelles a consisté à renforcer les associations deproducteurs et la formation de coopératives de commercialisation qui serviront d’instruments permettant de pallier leslacunes découlant de l’ouverture du marché, dans les économies de type rural. L’analyse présentée – en l’occurrenceune étude de cas du Kenya oriental – a montré que les chocs externes et les contraintes structurelles qui limitent levolume des échanges commerciaux et l’accès au capital et à l’information, nécessitent des investissements dans desinstitutions complémentaires et des mécanismes de coordination de manière à réaliser les économies de marché, mêmesi l’action collective – incarnée par les coopératives de commercialisation des producteurs (PMG) – est possible etutile. L’efficacité des PMG est déterminée par le niveau d’action collective, qui prend la forme d’une prise de décisionparticipative et accrue, par les cotisations des membres et par le capital initial de démarrage. L’incapacité à payer à lalivraison, du fait du manque de crédits importants, est une contrainte majeure qui entrave la compétitivité des groupesde commercialisation des producteurs par rapport aux autres acheteurs. Ces constats nécessitent : des interventionspermettant d’améliorer la gouvernance et la participation ; des mécanismes visant à faciliter l’accès au fondsd’exploitation ; des stratégies efficaces pour la gestion des risques et le renforcement des compétences des coopérativesdans le domaine de la pratique des affaires.
Job452Coverfinal.p65 1/24/2007, 5:10 PM2
Rural Institutions and ProducerOrganizations in Imperfect Markets:
Experiences from Producer MarketingGroups in Semi-Arid Eastern Kenya
Bekele Shiferaw, Gideon Obareand Geoffrey Muricho
ICRISATInternational Crops Research Institute for the Semi-Arid Tropics
Patancheru 502 324, Andhra Pradesh, India2006
®
Job452Prelimsfinal.p65 1/24/2007, 5:34 PM1
About the authors
Bekele Shiferaw Program Coordinator and Senior Scientist, Resource and Development Economics,International Crops Research Institute for the Semi-Arid Tropics, Nairobi, Kenya.Email: [email protected].
Gideon Obare Associate Professor, Department of Agricultural Economics and BusinessManagement, Egerton University, Njoro, Kenya. Email: [email protected].
Geoffrey Muricho Research Associate, International Crops Research Institute for the Semi-Arid Tropics,Nairobi, Kenya. Email: [email protected]
The views expressed are those of the author and not necessarily those of ICRISAT. The designationsemployed and the presentation of material in this publication do not imply the expression of any opinionwhatsoever on the part of ICRISAT concerning the legal status of any country, territory, city, or area, or of itsauthorities, or concerning the delimitation of its frontiers or boundaries. Where trade names are used, thisdoes not constitute endorsement of or discrimination against any product by the Institute.
AcknowledgmentThe research presented in this publication was undertaken with financial support from the System-wideProgram on Collective Action and Property Rights Institutions (CAPRi) and ICRISAT. We have benefitedfrom review comments and suggestions by Parthasarathy Rao, Esther Mwangi, Heidi Hogset and JuliusOkello.
Job452Prelimsfinal.p65 1/24/2007, 5:34 PM2
Contents
1. Introduction ............................................................................................................................... 1
2. Institutions for improving markets ............................................................................................ 2
2.1. Market imperfection and the role of institutions ............................................................... 2
2.2. Farmer organizations and marketing .................................................................................. 3
2.3. Evolution and development of farmer marketing groups .................................................. 4
3. The case study ........................................................................................................................... 6
4. Results and discussion .............................................................................................................. 8
4.1. Socioeconomic profiles of PMG villages .......................................................................... 8
4.2. Aspirations of PMGs ........................................................................................................ 10
4.3. Governance of PMGs ....................................................................................................... 11
4.4. PMGs, markets and marketing channels .......................................................................... 13
4.5. PMGs and price determination ........................................................................................ 18
4.6. Collective action and PMG performance ......................................................................... 20
4.7. Constraints to collective marketing ................................................................................. 25
5. Legal and policy issues for collective marketing .................................................................... 26
6. Conclusions ............................................................................................................................. 27
References ..................................................................................................................................... 30
Appendix 1 .................................................................................................................................... 33
Appendix 2 .................................................................................................................................... 34
Job452Prelimsfinal.p65 1/24/2007, 5:34 PM3
List of abbreviations and acronymsICRISAT International Crops Research Institute for the Semi-Arid Tropics
Km Kilometer
Ksh Kenya Shillings
KTDA Kenya Tea Development Authority
KYM Kampi Ya Mawe
PMGs Producer Marketing Groups
SHGs Self Help Groups
SSA Sub-Saharan Africa
Job452Prelimsfinal.p65 1/24/2007, 5:34 PM4
1
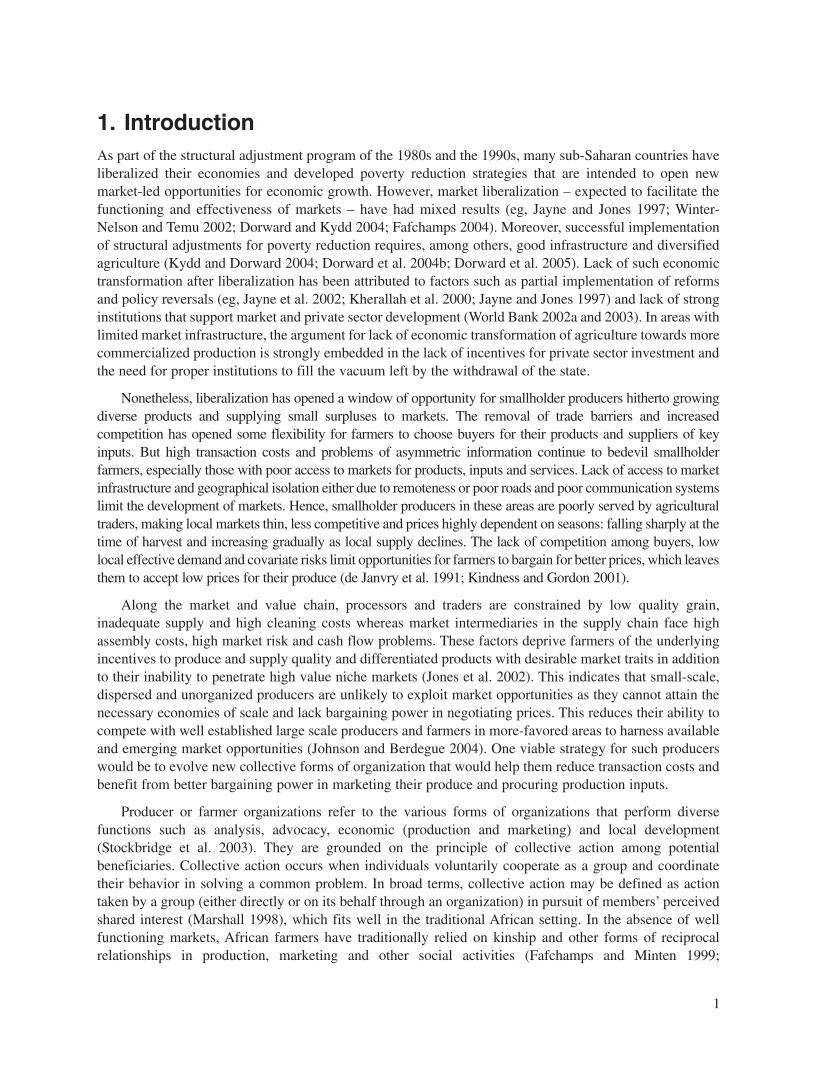
1. IntroductionAs part of the structural adjustment program of the 1980s and the 1990s, many sub-Saharan countries haveliberalized their economies and developed poverty reduction strategies that are intended to open newmarket-led opportunities for economic growth. However, market liberalization – expected to facilitate thefunctioning and effectiveness of markets – have had mixed results (eg, Jayne and Jones 1997; Winter-Nelson and Temu 2002; Dorward and Kydd 2004; Fafchamps 2004). Moreover, successful implementationof structural adjustments for poverty reduction requires, among others, good infrastructure and diversifiedagriculture (Kydd and Dorward 2004; Dorward et al. 2004b; Dorward et al. 2005). Lack of such economictransformation after liberalization has been attributed to factors such as partial implementation of reformsand policy reversals (eg, Jayne et al. 2002; Kherallah et al. 2000; Jayne and Jones 1997) and lack of stronginstitutions that support market and private sector development (World Bank 2002a and 2003). In areas withlimited market infrastructure, the argument for lack of economic transformation of agriculture towards morecommercialized production is strongly embedded in the lack of incentives for private sector investment andthe need for proper institutions to fill the vacuum left by the withdrawal of the state.
Nonetheless, liberalization has opened a window of opportunity for smallholder producers hitherto growingdiverse products and supplying small surpluses to markets. The removal of trade barriers and increasedcompetition has opened some flexibility for farmers to choose buyers for their products and suppliers of keyinputs. But high transaction costs and problems of asymmetric information continue to bedevil smallholderfarmers, especially those with poor access to markets for products, inputs and services. Lack of access to marketinfrastructure and geographical isolation either due to remoteness or poor roads and poor communication systemslimit the development of markets. Hence, smallholder producers in these areas are poorly served by agriculturaltraders, making local markets thin, less competitive and prices highly dependent on seasons: falling sharply at thetime of harvest and increasing gradually as local supply declines. The lack of competition among buyers, lowlocal effective demand and covariate risks limit opportunities for farmers to bargain for better prices, which leavesthem to accept low prices for their produce (de Janvry et al. 1991; Kindness and Gordon 2001).
Along the market and value chain, processors and traders are constrained by low quality grain,inadequate supply and high cleaning costs whereas market intermediaries in the supply chain face highassembly costs, high market risk and cash flow problems. These factors deprive farmers of the underlyingincentives to produce and supply quality and differentiated products with desirable market traits in additionto their inability to penetrate high value niche markets (Jones et al. 2002). This indicates that small-scale,dispersed and unorganized producers are unlikely to exploit market opportunities as they cannot attain thenecessary economies of scale and lack bargaining power in negotiating prices. This reduces their ability tocompete with well established large scale producers and farmers in more-favored areas to harness availableand emerging market opportunities (Johnson and Berdegue 2004). One viable strategy for such producerswould be to evolve new collective forms of organization that would help them reduce transaction costs andbenefit from better bargaining power in marketing their produce and procuring production inputs.
Producer or farmer organizations refer to the various forms of organizations that perform diversefunctions such as analysis, advocacy, economic (production and marketing) and local development(Stockbridge et al. 2003). They are grounded on the principle of collective action among potentialbeneficiaries. Collective action occurs when individuals voluntarily cooperate as a group and coordinatetheir behavior in solving a common problem. In broad terms, collective action may be defined as actiontaken by a group (either directly or on its behalf through an organization) in pursuit of members’ perceivedshared interest (Marshall 1998), which fits well in the traditional African setting. In the absence of wellfunctioning markets, African farmers have traditionally relied on kinship and other forms of reciprocalrelationships in production, marketing and other social activities (Fafchamps and Minten 1999;
Job452Textfinal.p65 1/24/2007, 4:19 PM1
2
Gabre-Madhin 2001). There is a potential that such informal institutions and relationships can form thebasis for enhancing market access and entrepreneurial skills through collective action. However, collectiveaction in marketing requires closer coordination of production and postharvest activities to ensure deliveryof high quality and homogeneous products. Moreover, new forms of organization among small and spatiallydispersed producers involve transaction costs and require good leadership and development of new skills inbusiness and agro-enterprise development. The negative experiences of cooperatives in the past attest to theimportance of these factors in farmer organization, management and resilience (Lele 1981).
If new forms of organization and market institutions are going to help reduce transaction costs andenhance market opportunities for the poor, there is a need to understand how such collective action evolvesand how it is sustained; the determinants of farmer participation; alternative forms of organization that mayenhance performance and effectiveness; and the complementary institutions and the policy support neededfor the effectiveness of collective marketing groups.
This paper aims to review the conceptual issues surrounding imperfect markets in smallholderagriculture and the role that institutional and organizational innovations can play in improving theperformance of rural markets. With a case study of producer marketing groups in eastern Kenya, the paperoffers new insights on the potentials and constraints of rural institutions in providing market services. Theanalysis highlights marketing outcomes and the potential sources of differential success of marketinggroups in relation to marketing and other stated functions. The paper is organized as follows: Section 1introduces the background; and Section 2 reviews market institutions and their emerging roles in remedyingmarket imperfections or failures in rural areas. Section 3 outlines the methodological approach used in thecase study. Section 4 discusses the key results, while Section 5 presents analyses of policy and institutionalissues that affect the development of collective marketing groups. The main lessons and policy conclusionsare found in the concluding section.
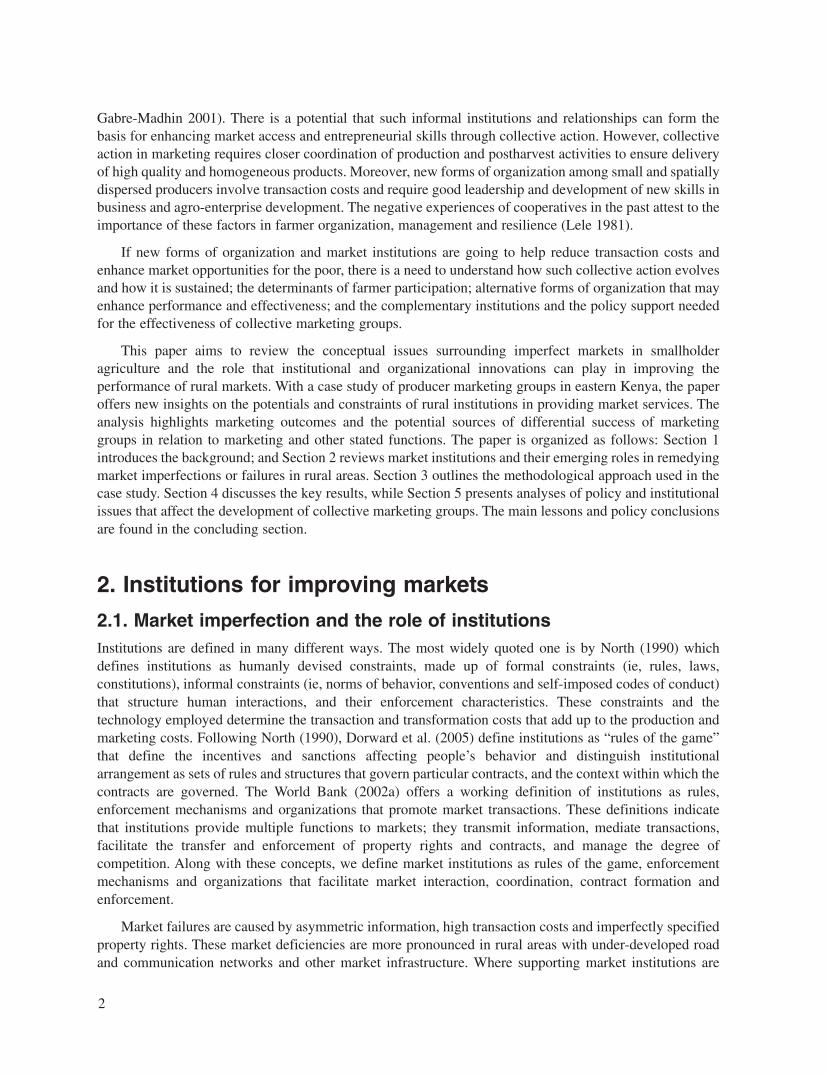
2. Institutions for improving markets
2.1. Market imperfection and the role of institutionsInstitutions are defined in many different ways. The most widely quoted one is by North (1990) whichdefines institutions as humanly devised constraints, made up of formal constraints (ie, rules, laws,constitutions), informal constraints (ie, norms of behavior, conventions and self-imposed codes of conduct)that structure human interactions, and their enforcement characteristics. These constraints and thetechnology employed determine the transaction and transformation costs that add up to the production andmarketing costs. Following North (1990), Dorward et al. (2005) define institutions as “rules of the game”that define the incentives and sanctions affecting people’s behavior and distinguish institutionalarrangement as sets of rules and structures that govern particular contracts, and the context within which thecontracts are governed. The World Bank (2002a) offers a working definition of institutions as rules,enforcement mechanisms and organizations that promote market transactions. These definitions indicatethat institutions provide multiple functions to markets; they transmit information, mediate transactions,facilitate the transfer and enforcement of property rights and contracts, and manage the degree ofcompetition. Along with these concepts, we define market institutions as rules of the game, enforcementmechanisms and organizations that facilitate market interaction, coordination, contract formation andenforcement.
Market failures are caused by asymmetric information, high transaction costs and imperfectly specifiedproperty rights. These market deficiencies are more pronounced in rural areas with under-developed roadand communication networks and other market infrastructure. Where supporting market institutions are
Job452Textfinal.p65 1/24/2007, 4:19 PM2
3
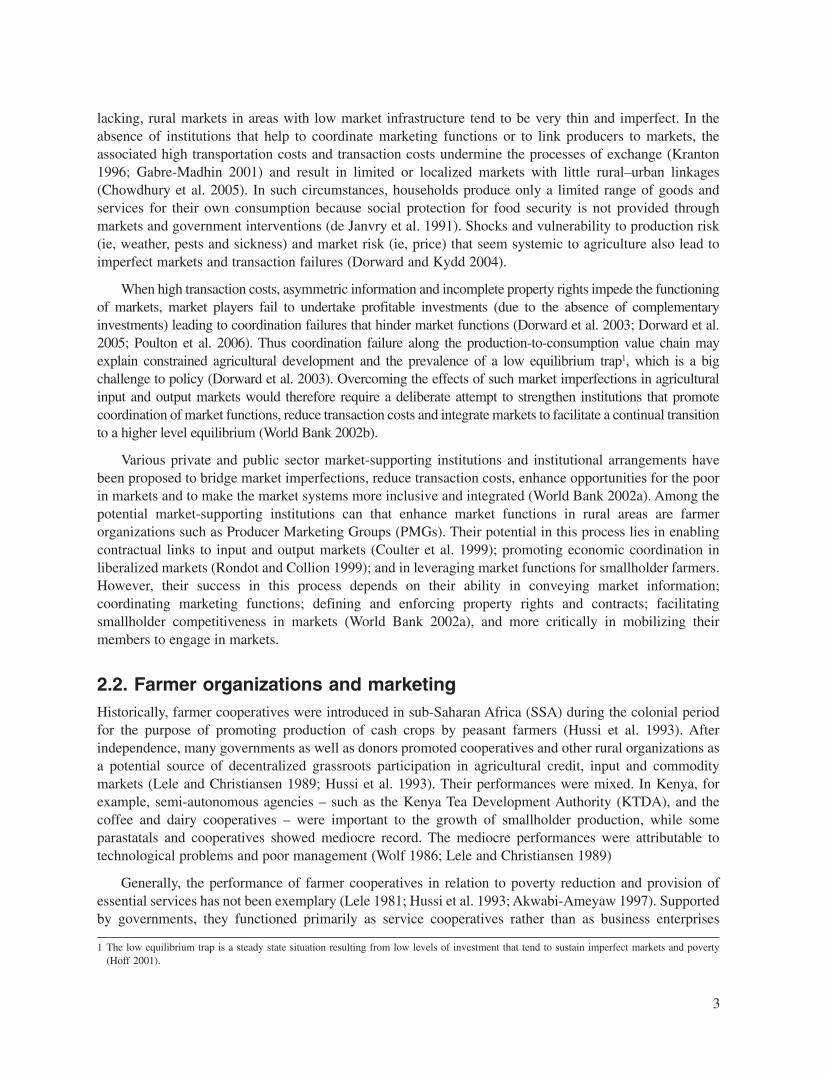
lacking, rural markets in areas with low market infrastructure tend to be very thin and imperfect. In theabsence of institutions that help to coordinate marketing functions or to link producers to markets, theassociated high transportation costs and transaction costs undermine the processes of exchange (Kranton1996; Gabre-Madhin 2001) and result in limited or localized markets with little rural–urban linkages(Chowdhury et al. 2005). In such circumstances, households produce only a limited range of goods andservices for their own consumption because social protection for food security is not provided throughmarkets and government interventions (de Janvry et al. 1991). Shocks and vulnerability to production risk(ie, weather, pests and sickness) and market risk (ie, price) that seem systemic to agriculture also lead toimperfect markets and transaction failures (Dorward and Kydd 2004).
When high transaction costs, asymmetric information and incomplete property rights impede the functioningof markets, market players fail to undertake profitable investments (due to the absence of complementaryinvestments) leading to coordination failures that hinder market functions (Dorward et al. 2003; Dorward et al.2005; Poulton et al. 2006). Thus coordination failure along the production-to-consumption value chain mayexplain constrained agricultural development and the prevalence of a low equilibrium trap1, which is a bigchallenge to policy (Dorward et al. 2003). Overcoming the effects of such market imperfections in agriculturalinput and output markets would therefore require a deliberate attempt to strengthen institutions that promotecoordination of market functions, reduce transaction costs and integrate markets to facilitate a continual transitionto a higher level equilibrium (World Bank 2002b).
Various private and public sector market-supporting institutions and institutional arrangements havebeen proposed to bridge market imperfections, reduce transaction costs, enhance opportunities for the poorin markets and to make the market systems more inclusive and integrated (World Bank 2002a). Among thepotential market-supporting institutions can that enhance market functions in rural areas are farmerorganizations such as Producer Marketing Groups (PMGs). Their potential in this process lies in enablingcontractual links to input and output markets (Coulter et al. 1999); promoting economic coordination inliberalized markets (Rondot and Collion 1999); and in leveraging market functions for smallholder farmers.However, their success in this process depends on their ability in conveying market information;coordinating marketing functions; defining and enforcing property rights and contracts; facilitatingsmallholder competitiveness in markets (World Bank 2002a), and more critically in mobilizing theirmembers to engage in markets.
2.2. Farmer organizations and marketingHistorically, farmer cooperatives were introduced in sub-Saharan Africa (SSA) during the colonial periodfor the purpose of promoting production of cash crops by peasant farmers (Hussi et al. 1993). Afterindependence, many governments as well as donors promoted cooperatives and other rural organizations asa potential source of decentralized grassroots participation in agricultural credit, input and commoditymarkets (Lele and Christiansen 1989; Hussi et al. 1993). Their performances were mixed. In Kenya, forexample, semi-autonomous agencies – such as the Kenya Tea Development Authority (KTDA), and thecoffee and dairy cooperatives – were important to the growth of smallholder production, while someparastatals and cooperatives showed mediocre record. The mediocre performances were attributable totechnological problems and poor management (Wolf 1986; Lele and Christiansen 1989)
Generally, the performance of farmer cooperatives in relation to poverty reduction and provision ofessential services has not been exemplary (Lele 1981; Hussi et al. 1993; Akwabi-Ameyaw 1997). Supportedby governments, they functioned primarily as service cooperatives rather than as business enterprises
1 The low equilibrium trap is a steady state situation resulting from low levels of investment that tend to sustain imperfect markets and poverty(Hoff 2001).
Job452Textfinal.p65 1/24/2007, 4:19 PM3
4
owned and managed by the members. They were not allowed sufficient marketing margins to cover theiroperational expenses and could, therefore, not evolve into commercially viable enterprises. Thiscompromised their inherent character as member-controlled organizations which in turn discouragedmember participation and eroded confidence in the leadership. With structural adjustment and economicreforms, many of the service cooperatives lost their special protection from the state, which further reducedtheir viability in the ensuing competitive environment (Lele 1981).
For cooperatives and rural organizations to be effective in serving a broad set of socio-political andeconomic objectives of small producers, new policies and institutional reforms are needed to facilitate theirtransformation from public sector service providers to private sector enterprises with clear business plans.With hindsight, farmer organizations tend to succeed only when: farmers can manage them autonomouslywith minimal government interference; farmers participate actively in decision making at every stage of theprocess; and their cooperative activities are profitable (World Bank 1995).
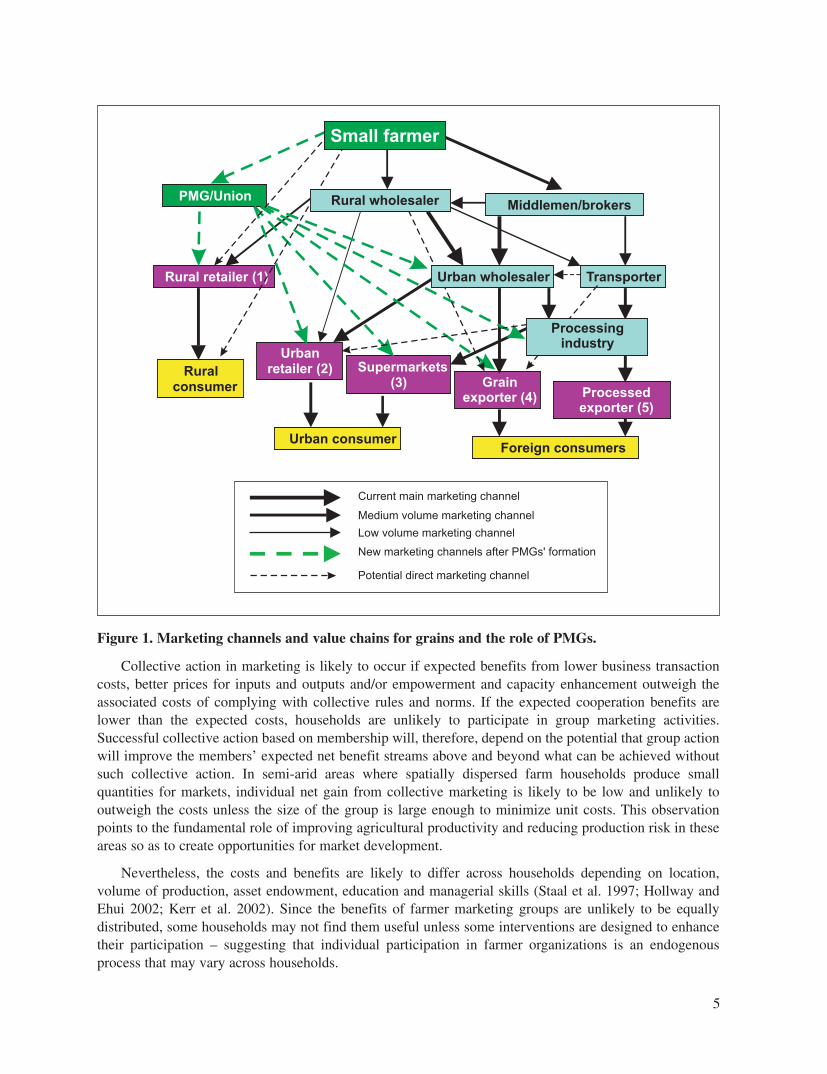
A strong justification for farmer organizations is their potential to play a critical role in both the deliveryand coordination of services to smallholder producers (Dorward et al. 2004b). They can facilitate collectivemarketing of agricultural outputs that will help reduce transaction costs related to the marketing of agriculturalinputs and small marketable surplus emanating from a large number of widely dispersed small producers.Collective marketing allows small-scale farmers to spread the costs of marketing, enhance their ability tonegotiate for better prices, and improve their market power. Furthermore, climatic variability in semi-aridareas increases the variability of supply and prices because effective demand is limited, and small-scalefarmers are often unable to sell to consumers outside of their local markets. Through coordination of marketingactivities, PMGs could facilitate access to better markets, reduce marketing costs, and synchronize buying andselling practices to seasonal price conditions. PMGs can shorten the marketing chains by linking producersmore directly to the upper end of the marketing chain (Figure 1). Well organized farmers will be able to bypassbrokers or assemblers, rural wholesalers and transporters who now procure grain directly from farmers, andconnect directly with the urban high value retailers and processors or exporters. This can be done throughvarious contractual arrangements, including outgrower schemes or postharvest bulk delivery.
In many rural areas, commercial inputs are either unaffordable or smallholder farmers face hightransaction costs, which further undermines their ability to use such inputs. The high input costs for smallquantities resulting from high transaction and transportation costs are likely to make investments incommercial inputs uneconomical to many smallholder farmers. Farmer marketing groups can howeverfacilitate input and output markets access and service delivery, thus promoting commercial activities andtechnological change in agriculture (Kindness and Gordon 2001). However, for these organizations to bebeneficial to farmers, governments need to provide complimentary public goods that would empower smallproducers to participate in markets (Kelly et al. 2003).
2.3. Evolution and development of farmer marketing groupsFarmer marketing groups as an outcome of collective action are unlikely to emerge on their own (Johnson etal. 2002). The need for collective action depends on the resource type, degree of spatial integration and thetime required in achieving the desired outcomes. Controlling for conducive environment and politicalleaderships, White and Runge (1995) have shown that groups will emerge and survive where a “criticalmass” of individuals have practical knowledge of the potential gains from collective action, but that in theshort term emergence can be constrained by landscape factors that affect the potential net gain, and socio-cultural factors that influence the cost of constructing the new institution. It follows therefore that bothmicro and macro factors are important determinants of the evolution and the need for collective action.Additionally, an individual’s choice to participate in collective action will depend on his/her expectation ofother members’ behavior.
Job452Textfinal.p65 1/24/2007, 4:19 PM4
5
Collective action in marketing is likely to occur if expected benefits from lower business transactioncosts, better prices for inputs and outputs and/or empowerment and capacity enhancement outweigh theassociated costs of complying with collective rules and norms. If the expected cooperation benefits arelower than the expected costs, households are unlikely to participate in group marketing activities.Successful collective action based on membership will, therefore, depend on the potential that group actionwill improve the members’ expected net benefit streams above and beyond what can be achieved withoutsuch collective action. In semi-arid areas where spatially dispersed farm households produce smallquantities for markets, individual net gain from collective marketing is likely to be low and unlikely tooutweigh the costs unless the size of the group is large enough to minimize unit costs. This observationpoints to the fundamental role of improving agricultural productivity and reducing production risk in theseareas so as to create opportunities for market development.
Nevertheless, the costs and benefits are likely to differ across households depending on location,volume of production, asset endowment, education and managerial skills (Staal et al. 1997; Hollway andEhui 2002; Kerr et al. 2002). Since the benefits of farmer marketing groups are unlikely to be equallydistributed, some households may not find them useful unless some interventions are designed to enhancetheir participation – suggesting that individual participation in farmer organizations is an endogenousprocess that may vary across households.
Figure 1. Marketing channels and value chains for grains and the role of PMGs.
Job452Textfinal.p65 1/24/2007, 4:19 PM5
6
The potential for accessing essential services to improve agricultural incomes and tapping economicopportunities will act as a strong incentive for anyone contemplating membership. Existing skills/experience of members in relation to what is required to undertake joint activities; internal cohesion andmembership driven agenda; and the ability to effectively integrate into a wider commercial economy willdetermine the effectiveness of collective marketing activities (Stringfellow et al. 1997). This implies thatmeasures designed to enhance farmer marketing group capacities will contribute to the success of producermarketing groups. Therefore programs that are geared towards facilitating groups’ self reliance andenhancing organizational and management skills are likely to equip groups with the capacity to forgeeffective business interactions with the private sector for agricultural development (Bingen et al. 2003).
Despite the potential gains from collective action, individual cooperative behavior may not betranslated into collective action unless other potential beneficiaries agree to cooperate and do likewise. Thepresence and assurance of trust between and among individuals facilitates the potential for reciprocity andemergence of cooperative behavior (Runge 1981; White and Runge 1995). It follows, thus, thatinterventions which enhance trust among members in a group, including laws of engagement andoperational democracy, are likely to contribute to successful collective action. The functional orientation offarmer groups and their internal features are also important determinants of the success of farmerorganizations (Coulter et al. 1999). Larger groups may be less successful than small groups in furtheringtheir interest but only up to a certain level. This is mainly because the transaction and managerial costs ofcooperation increase faster than the gains as group size increases beyond a certain level (Hussi et al. 1993),which means that optimal group size will depend on the type of activity and the features of the group.
3. The case studyIn order to examine the relevance of the above reviewed conceptual issues and assess the constraints andopportunities for farmer organizations to facilitate market access for the poor, a study was conducted in twodistricts of eastern Kenya (Mbeere and Makueni). The two districts are located in part of the larger semi-aridlands where market infrastructure is poor (Appendix 1) and farmers produce limited marketable surplus.They are characterized by low density paved roads and limited access to major marketing centers. Althoughclimatic variability is a typical characteristic of these areas with recurrent droughts, smallholder agricultureis almost entirely dependent on rains.
The study capitalizes on two rounds of data sets collected in the two districts: a baseline and a follow-upsurvey. The baseline survey of 400 households (240 in Mbeere and 160 in Makueni) was undertaken in 2003before the PMGs were formed as part of a research project that aimed to test alternative institutionalarrangements for improving market access for smallholders. The households were randomly sampled from alist of all households in the targeted villages. Farmers were sensitized and assisted2 to form PMGs with theview to test the potential of these groups to improve market access for smallholder farmers. Communitiesmanaged to voluntarily establish five PMGs in each of the two districts. Consequently, the groups wereformally registered and provided with a certificate of legal constitution issued by the Ministry of Culture andSocial Services. After registration some of the households who had expressed interest in joining the groupsdecided not join. From the initial sample of 400 households, the distribution of members and non-memberswas decided later, after the PMGs were established with committed members who paid the registration feesand/or annual contributions to the group (Table 1). Information collected during the baseline survey includedpoverty indicators; production levels of dryland crops; market participation by households; and adoption ofagricultural technologies.
2 The form of assistance provided included bringing the farmers together to discuss production and marketing strategies for dryland legumes; toidentify production and marketing constraints and opportunities; training in quality seed production and marketing; and provision of informationin organizing marketing groups. No direct subsidies or incentives were provided to farmers to join groups.
Job452Textfinal.p65 1/24/2007, 4:19 PM6

7
During the follow-up survey conducted in 2005, data were collected at three levels: the community orvillage, the PMG and the farm household. At the community or village level, a total of 20 communities/villages(two from each PMG) were purposively selected for the survey based on villages that had the highest numberof registered members in their respective PMGs. Thereafter, a group of about nine gender-balanced keyinformants were selected from each village based on peer perception and the village chief’s advice on theirability to provide quality information about the village. A semi-structured questionnaire was administered tothe informants to obtain data on demographic and resource use, socioeconomic conditions, trends and theoverall economic profiles of the PMG villages. At the PMG level, all the ten PMGs were surveyed separately.Based on advice from community elders and the village chief, a group of five to seven respondents comprisingof PMG management and ordinary members were selected from each PMG as key informants. A semi-structured questionnaire was administered to obtain data on the objectives and aspirations of the groups whenthey were formed; general group characteristics (eg, size and composition, frequency of meetings and capital);asset ownership (eg, store, weighing scales and operating capital); credit access; bulking and marketing;governance; major constraints limiting group performance and planned activities.
At the household level, data were collected on socioeconomic and demographic characteristics, cropand livestock production and marketing activities, household assets, credit and savings, access toinformation and participation in collective marketing or awareness of collective marketing groups andperception of anticipated benefits among non-members. A total of 400 randomly selected households in thePMG villages, comprising of 250 members and 150 non PMG members, were surveyed (210 from Mbeeredistrict and 190 from Makueni district). These 400 randomly selected households included 250 householdsfrom the baseline survey3.
The primary data were subjected to qualitative and quantitative analyses. Simple descriptive statisticswere used to analyze the socioeconomic and biophysical profiles of the PMG villages. In particular, theywere used to assess the prevalence and levels of poverty, market participation and resource managementconditions in the PMG villages. The PMG data were analyzed to understand market functions and
Table 1. Household sampling and sample sizes for 2003 and 2005 surveys.
Total# Members Non-members
District PMG 2003 2005 2003# 2005 2003# 2005
Mbeere Kamwiyendeyi 80 50 58 30 22 20Kilia 80 50 45 30 35 20Makima 80 50 31 30 49 20Nthingini* - 30 - 20 - 10Wango* - 30 - 20 - 10
Makueni Thavu 80 50 43 30 37 20Emali 80 50 58 30 22 20Kathonzweni* - 30 - 20 - 10Kampi Ya Mawe* - 30 - 20 - 10Kalamba* - 30 - 20 - 10Total 400 400 235 250 165 150
* A baseline survey was not conducted in these PMG villages in 2003 because they were included in the project only after the survey wasconducted in the initial five target villages.
# The number of PMG members in 2003 is based on later classification of the baseline data into PMG members and non-members after thePMGs were clearly established. The 2005 survey covered all the PMG villages and sampled from members and non-members.
Source: Household survey 2003 & 2005
3 This sub-sample consists of 150 households re-sampled from 235 baseline households that had remained PMG members and 100 householdsre-sampled from 165 households that had remained non-PMG members (see Table 1). The panel data can be used to evaluate potential changeson marketing activities and livelihoods. Due to space limitations, this analysis is not pursued in this study.
Job452Textfinal.p65 1/24/2007, 4:19 PM7
8
performance of PMGs; to determine governance problems and the level of collective action; to identifyindicators of collective action; and the effectiveness of collective action in marketing functions and theassociated factors that affect group performance. Household data were used to examine the marketingchannels and market actors along the value chain, and to establish the market shares, volumes and pricesoffered by different agents to farmers. An econometric model was estimated to determine factors that influenceunit price of point transactions; to establish whether prices offered to smallholder farmers by different marketparticipants and particularly by the PMGs, controlling for other factors, would be significantly different; and totest whether PMGs pay higher mean prices with lower variance than other buyers.
4. Results and discussion
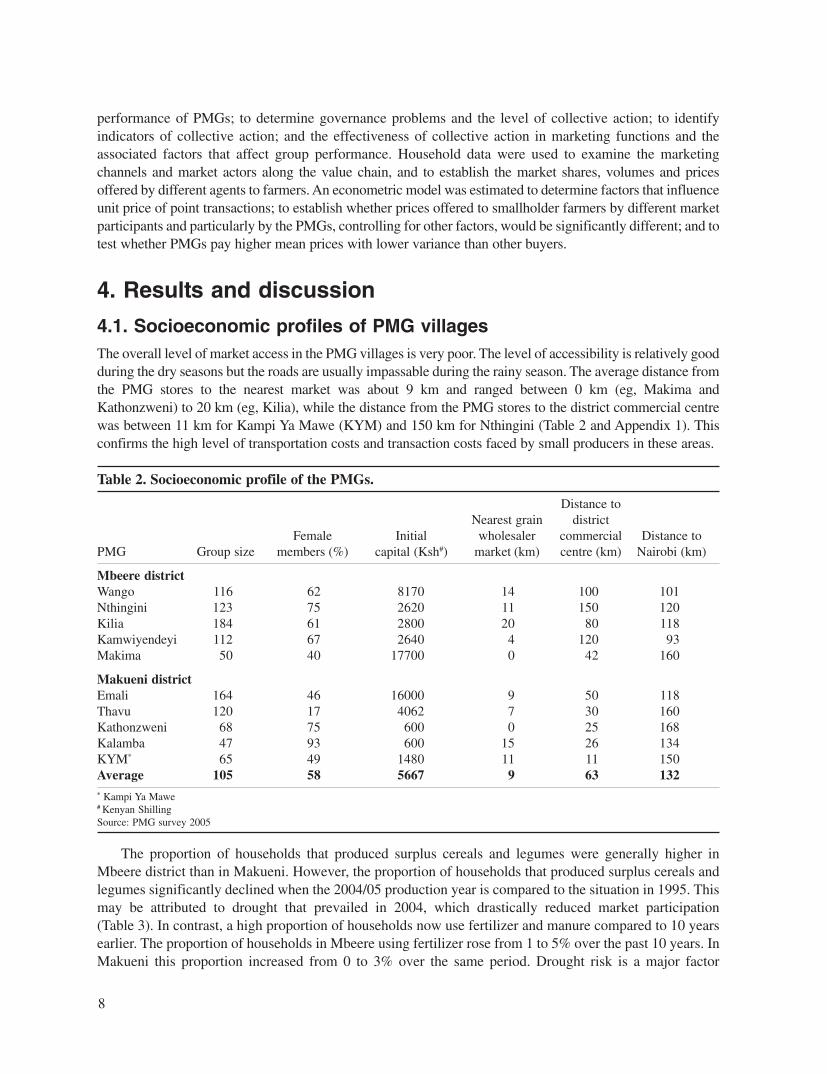
4.1. Socioeconomic profiles of PMG villagesThe overall level of market access in the PMG villages is very poor. The level of accessibility is relatively goodduring the dry seasons but the roads are usually impassable during the rainy season. The average distance fromthe PMG stores to the nearest market was about 9 km and ranged between 0 km (eg, Makima andKathonzweni) to 20 km (eg, Kilia), while the distance from the PMG stores to the district commercial centrewas between 11 km for Kampi Ya Mawe (KYM) and 150 km for Nthingini (Table 2 and Appendix 1). Thisconfirms the high level of transportation costs and transaction costs faced by small producers in these areas.
Table 2. Socioeconomic profile of the PMGs.
Distance toNearest grain district
Female Initial wholesaler commercial Distance toPMG Group size members (%) capital (Ksh#) market (km) centre (km) Nairobi (km)
Mbeere districtWango 116 62 8170 14 100 101Nthingini 123 75 2620 11 150 120Kilia 184 61 2800 20 80 118Kamwiyendeyi 112 67 2640 4 120 93Makima 50 40 17700 0 42 160
Makueni districtEmali 164 46 16000 9 50 118Thavu 120 17 4062 7 30 160Kathonzweni 68 75 600 0 25 168Kalamba 47 93 600 15 26 134KYM* 65 49 1480 11 11 150Average 105 58 5667 9 63 132* Kampi Ya Mawe# Kenyan ShillingSource: PMG survey 2005
The proportion of households that produced surplus cereals and legumes were generally higher inMbeere district than in Makueni. However, the proportion of households that produced surplus cereals andlegumes significantly declined when the 2004/05 production year is compared to the situation in 1995. Thismay be attributed to drought that prevailed in 2004, which drastically reduced market participation(Table 3). In contrast, a high proportion of households now use fertilizer and manure compared to 10 yearsearlier. The proportion of households in Mbeere using fertilizer rose from 1 to 5% over the past 10 years. InMakueni this proportion increased from 0 to 3% over the same period. Drought risk is a major factor
Job452Textfinal.p65 1/24/2007, 4:19 PM8
9
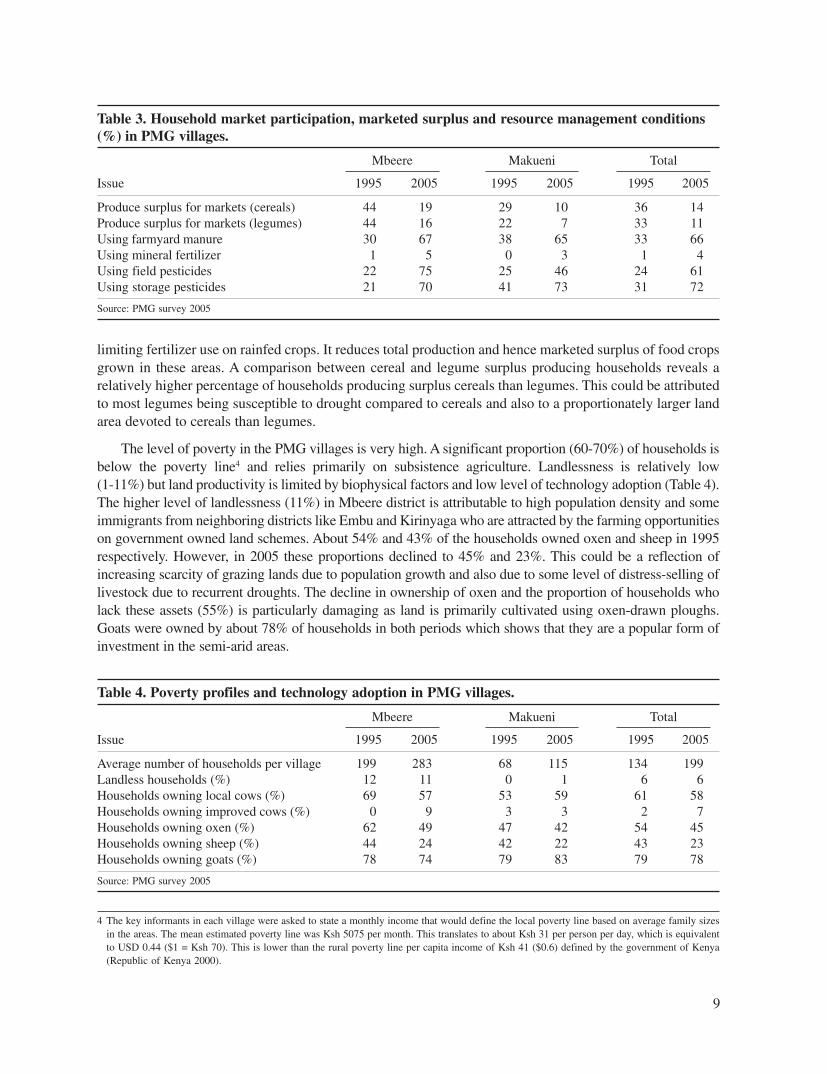
limiting fertilizer use on rainfed crops. It reduces total production and hence marketed surplus of food cropsgrown in these areas. A comparison between cereal and legume surplus producing households reveals arelatively higher percentage of households producing surplus cereals than legumes. This could be attributedto most legumes being susceptible to drought compared to cereals and also to a proportionately larger landarea devoted to cereals than legumes.
The level of poverty in the PMG villages is very high. A significant proportion (60-70%) of households isbelow the poverty line4 and relies primarily on subsistence agriculture. Landlessness is relatively low(1-11%) but land productivity is limited by biophysical factors and low level of technology adoption (Table 4).The higher level of landlessness (11%) in Mbeere district is attributable to high population density and someimmigrants from neighboring districts like Embu and Kirinyaga who are attracted by the farming opportunitieson government owned land schemes. About 54% and 43% of the households owned oxen and sheep in 1995respectively. However, in 2005 these proportions declined to 45% and 23%. This could be a reflection ofincreasing scarcity of grazing lands due to population growth and also due to some level of distress-selling oflivestock due to recurrent droughts. The decline in ownership of oxen and the proportion of households wholack these assets (55%) is particularly damaging as land is primarily cultivated using oxen-drawn ploughs.Goats were owned by about 78% of households in both periods which shows that they are a popular form ofinvestment in the semi-arid areas.
Table 3. Household market participation, marketed surplus and resource management conditions(%) in PMG villages.
Mbeere Makueni Total
Issue 1995 2005 1995 2005 1995 2005
Produce surplus for markets (cereals) 44 19 29 10 36 14Produce surplus for markets (legumes) 44 16 22 7 33 11Using farmyard manure 30 67 38 65 33 66Using mineral fertilizer 1 5 0 3 1 4Using field pesticides 22 75 25 46 24 61Using storage pesticides 21 70 41 73 31 72
Source: PMG survey 2005
Table 4. Poverty profiles and technology adoption in PMG villages.
Mbeere Makueni Total
Issue 1995 2005 1995 2005 1995 2005
Average number of households per village 199 283 68 115 134 199Landless households (%) 12 11 0 1 6 6Households owning local cows (%) 69 57 53 59 61 58Households owning improved cows (%) 0 9 3 3 2 7Households owning oxen (%) 62 49 47 42 54 45Households owning sheep (%) 44 24 42 22 43 23Households owning goats (%) 78 74 79 83 79 78
Source: PMG survey 2005
4 The key informants in each village were asked to state a monthly income that would define the local poverty line based on average family sizesin the areas. The mean estimated poverty line was Ksh 5075 per month. This translates to about Ksh 31 per person per day, which is equivalentto USD 0.44 ($1 = Ksh 70). This is lower than the rural poverty line per capita income of Ksh 41 ($0.6) defined by the government of Kenya(Republic of Kenya 2000).
Job452Textfinal.p65 1/24/2007, 4:19 PM9
10
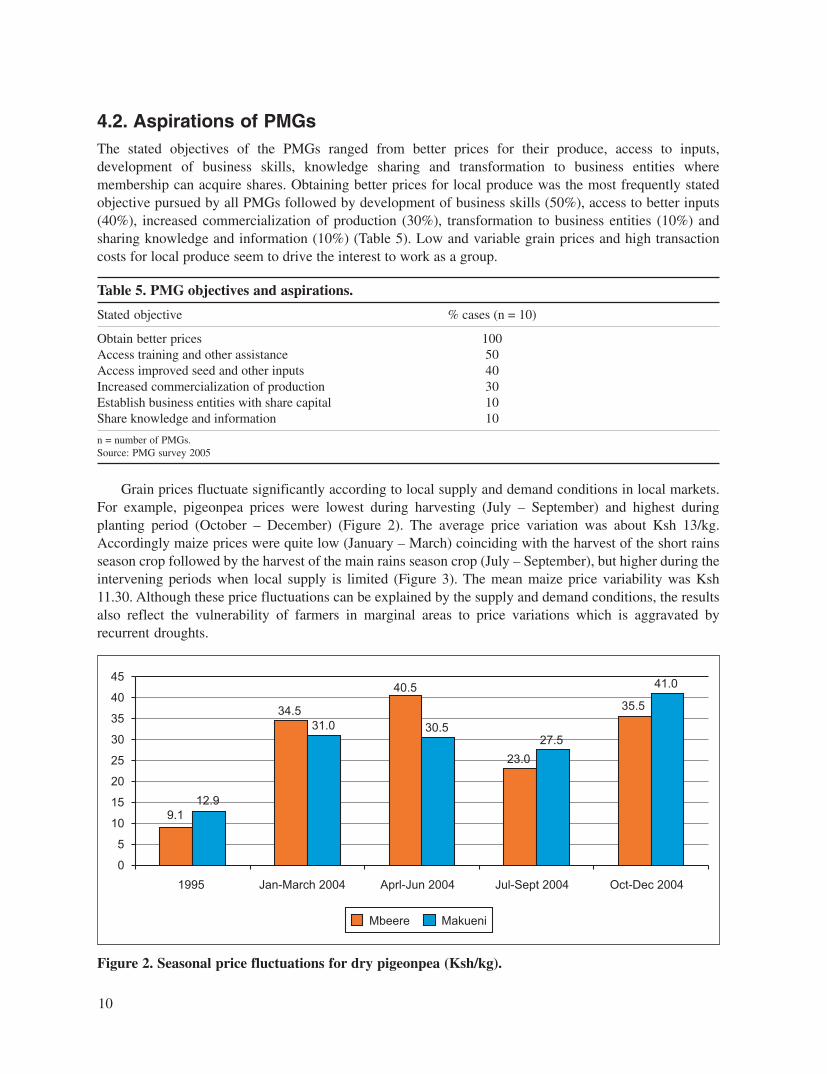
4.2. Aspirations of PMGsThe stated objectives of the PMGs ranged from better prices for their produce, access to inputs,development of business skills, knowledge sharing and transformation to business entities wheremembership can acquire shares. Obtaining better prices for local produce was the most frequently statedobjective pursued by all PMGs followed by development of business skills (50%), access to better inputs(40%), increased commercialization of production (30%), transformation to business entities (10%) andsharing knowledge and information (10%) (Table 5). Low and variable grain prices and high transactioncosts for local produce seem to drive the interest to work as a group.
Table 5. PMG objectives and aspirations.
Stated objective % cases (n = 10)
Obtain better prices 100Access training and other assistance 50Access improved seed and other inputs 40Increased commercialization of production 30Establish business entities with share capital 10Share knowledge and information 10
n = number of PMGs.Source: PMG survey 2005
Grain prices fluctuate significantly according to local supply and demand conditions in local markets.For example, pigeonpea prices were lowest during harvesting (July – September) and highest duringplanting period (October – December) (Figure 2). The average price variation was about Ksh 13/kg.Accordingly maize prices were quite low (January – March) coinciding with the harvest of the short rainsseason crop followed by the harvest of the main rains season crop (July – September), but higher during theintervening periods when local supply is limited (Figure 3). The mean maize price variability was Ksh11.30. Although these price fluctuations can be explained by the supply and demand conditions, the resultsalso reflect the vulnerability of farmers in marginal areas to price variations which is aggravated byrecurrent droughts.
Figure 2. Seasonal price fluctuations for dry pigeonpea (Ksh/kg).
Job452Textfinal.p65 1/24/2007, 4:19 PM10

11
Figure 3. Seasonal price fluctuations for maize (Ksh/kg).
Half the PMGs aspire to access training in business and entrepreneurial skills for agribusiness andenterprise development. This is consistent with the need to manage the PMG business enterprises to enhanceeconomic efficiency and competitiveness. The stated objective of access to commercial inputs andcommercialization of agriculture are correlated and show that smallholders are keen to benefit from marketopportunities. Some of the PMGs plan to establish a business enterprise with share capital, a long term goalthat they may move towards as collective action becomes more effective.
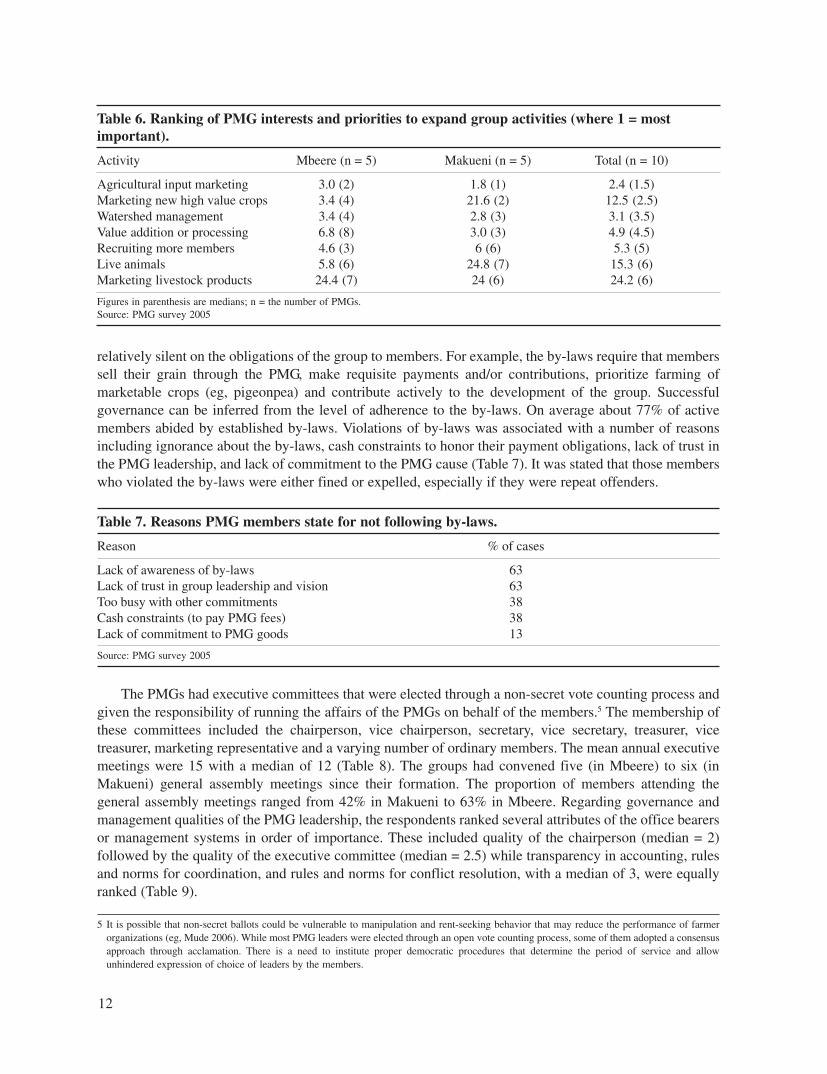
When asked whether they had achieved their stated objectives, a majority of the PMGs reported thatthey had partly achieved them while those that had not achieved any, were working towards those goalsdespite several constraints. The reasons for non-achievement of the objectives included lack of credit, lackof ready markets, drought, poor PMG leadership and conduct of members, lack of capacity to identify andcollect market information, and price fluctuations in that order of descending importance. The groups werefurther asked whether they intended to expand group functions into new directions. Several of themindicated their willingness to broaden operations by expanding into other related activities. In order ofimportance (measured by median rankings), the PMGs aspire to participate in the marketing of agriculturalinputs (1.5), marketing of alternative high value crops (eg, vegetables and groundnuts) (2.5), watershedmanagement (3.5) and value addition (4.5) (Table 6). Although there is variation in the rankings on some ofthe activities across districts, the results suggest that the PMGs intend to diversify more into linked activitieswhere they have gained experience and skills, with limited interest to establish backward linkages along thepre-production to marketing and consumption value chain (eg, collective watershed management).
4.3. Governance of PMGsAn important aspect of governance of PMGs is their constitution (by-laws) that define the norms ofoperations, the roles and responsibilities of various organs and members versus the management thatoversees the running of the PMGs on behalf of members. All the PMGs had written by-laws governing therunning of their groups. The by-laws stressed more on the obligations of the members to the group but were
Job452Textfinal.p65 1/24/2007, 4:19 PM11
12
relatively silent on the obligations of the group to members. For example, the by-laws require that memberssell their grain through the PMG, make requisite payments and/or contributions, prioritize farming ofmarketable crops (eg, pigeonpea) and contribute actively to the development of the group. Successfulgovernance can be inferred from the level of adherence to the by-laws. On average about 77% of activemembers abided by established by-laws. Violations of by-laws was associated with a number of reasonsincluding ignorance about the by-laws, cash constraints to honor their payment obligations, lack of trust inthe PMG leadership, and lack of commitment to the PMG cause (Table 7). It was stated that those memberswho violated the by-laws were either fined or expelled, especially if they were repeat offenders.
Table 6. Ranking of PMG interests and priorities to expand group activities (where 1 = mostimportant).
Activity Mbeere (n = 5) Makueni (n = 5) Total (n = 10)
Agricultural input marketing 3.0 (2) 1.8 (1) 2.4 (1.5)Marketing new high value crops 3.4 (4) 21.6 (2) 12.5 (2.5)Watershed management 3.4 (4) 2.8 (3) 3.1 (3.5)Value addition or processing 6.8 (8) 3.0 (3) 4.9 (4.5)Recruiting more members 4.6 (3) 6 (6) 5.3 (5)Live animals 5.8 (6) 24.8 (7) 15.3 (6)Marketing livestock products 24.4 (7) 24 (6) 24.2 (6)
Figures in parenthesis are medians; n = the number of PMGs.Source: PMG survey 2005
Table 7. Reasons PMG members state for not following by-laws.
Reason % of cases
Lack of awareness of by-laws 63Lack of trust in group leadership and vision 63Too busy with other commitments 38Cash constraints (to pay PMG fees) 38Lack of commitment to PMG goods 13
Source: PMG survey 2005
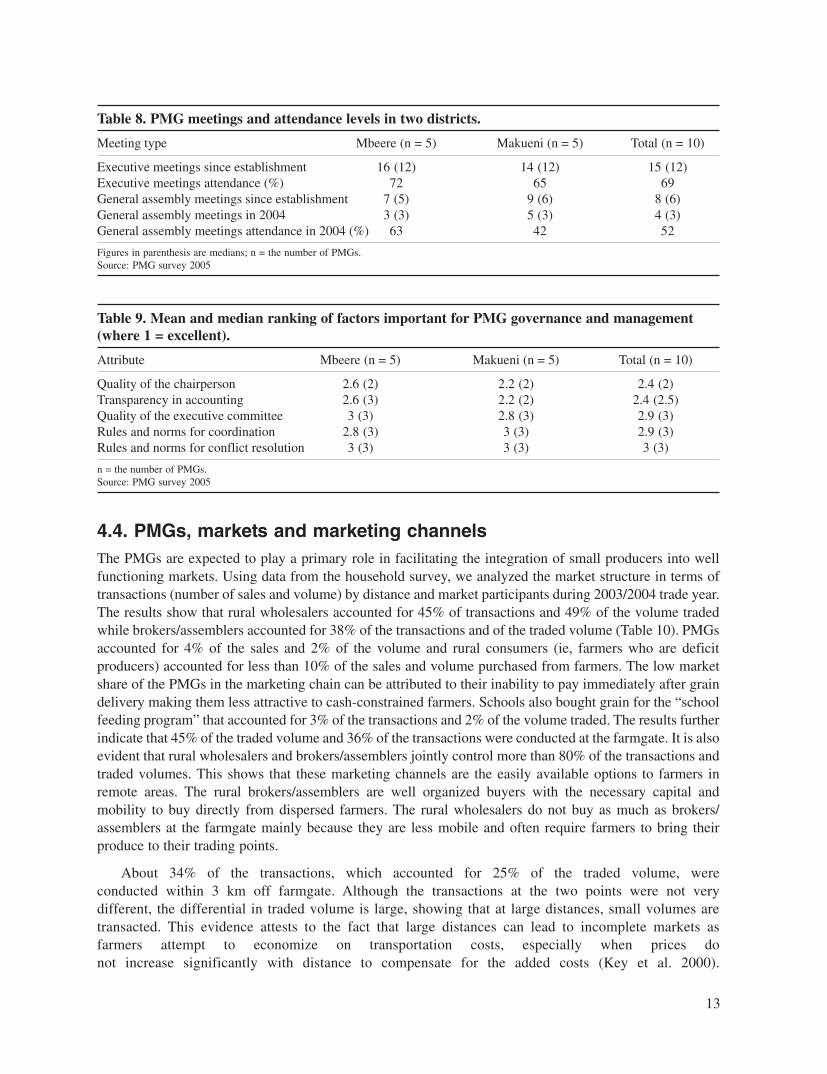
The PMGs had executive committees that were elected through a non-secret vote counting process andgiven the responsibility of running the affairs of the PMGs on behalf of the members.5 The membership ofthese committees included the chairperson, vice chairperson, secretary, vice secretary, treasurer, vicetreasurer, marketing representative and a varying number of ordinary members. The mean annual executivemeetings were 15 with a median of 12 (Table 8). The groups had convened five (in Mbeere) to six (inMakueni) general assembly meetings since their formation. The proportion of members attending thegeneral assembly meetings ranged from 42% in Makueni to 63% in Mbeere. Regarding governance andmanagement qualities of the PMG leadership, the respondents ranked several attributes of the office bearersor management systems in order of importance. These included quality of the chairperson (median = 2)followed by the quality of the executive committee (median = 2.5) while transparency in accounting, rulesand norms for coordination, and rules and norms for conflict resolution, with a median of 3, were equallyranked (Table 9).
5 It is possible that non-secret ballots could be vulnerable to manipulation and rent-seeking behavior that may reduce the performance of farmerorganizations (eg, Mude 2006). While most PMG leaders were elected through an open vote counting process, some of them adopted a consensusapproach through acclamation. There is a need to institute proper democratic procedures that determine the period of service and allowunhindered expression of choice of leaders by the members.
Job452Textfinal.p65 1/24/2007, 4:19 PM12
13
4.4. PMGs, markets and marketing channelsThe PMGs are expected to play a primary role in facilitating the integration of small producers into wellfunctioning markets. Using data from the household survey, we analyzed the market structure in terms oftransactions (number of sales and volume) by distance and market participants during 2003/2004 trade year.The results show that rural wholesalers accounted for 45% of transactions and 49% of the volume tradedwhile brokers/assemblers accounted for 38% of the transactions and of the traded volume (Table 10). PMGsaccounted for 4% of the sales and 2% of the volume and rural consumers (ie, farmers who are deficitproducers) accounted for less than 10% of the sales and volume purchased from farmers. The low marketshare of the PMGs in the marketing chain can be attributed to their inability to pay immediately after graindelivery making them less attractive to cash-constrained farmers. Schools also bought grain for the “schoolfeeding program” that accounted for 3% of the transactions and 2% of the volume traded. The results furtherindicate that 45% of the traded volume and 36% of the transactions were conducted at the farmgate. It is alsoevident that rural wholesalers and brokers/assemblers jointly control more than 80% of the transactions andtraded volumes. This shows that these marketing channels are the easily available options to farmers inremote areas. The rural brokers/assemblers are well organized buyers with the necessary capital andmobility to buy directly from dispersed farmers. The rural wholesalers do not buy as much as brokers/assemblers at the farmgate mainly because they are less mobile and often require farmers to bring theirproduce to their trading points.
About 34% of the transactions, which accounted for 25% of the traded volume, wereconducted within 3 km off farmgate. Although the transactions at the two points were not verydifferent, the differential in traded volume is large, showing that at large distances, small volumes aretransacted. This evidence attests to the fact that large distances can lead to incomplete markets asfarmers attempt to economize on transportation costs, especially when prices donot increase significantly with distance to compensate for the added costs (Key et al. 2000).
Table 8. PMG meetings and attendance levels in two districts.
Meeting type Mbeere (n = 5) Makueni (n = 5) Total (n = 10)
Executive meetings since establishment 16 (12) 14 (12) 15 (12)Executive meetings attendance (%) 72 65 69General assembly meetings since establishment 7 (5) 9 (6) 8 (6)General assembly meetings in 2004 3 (3) 5 (3) 4 (3)General assembly meetings attendance in 2004 (%) 63 42 52
Figures in parenthesis are medians; n = the number of PMGs.Source: PMG survey 2005
Table 9. Mean and median ranking of factors important for PMG governance and management(where 1 = excellent).
Attribute Mbeere (n = 5) Makueni (n = 5) Total (n = 10)
Quality of the chairperson 2.6 (2) 2.2 (2) 2.4 (2)Transparency in accounting 2.6 (3) 2.2 (2) 2.4 (2.5)Quality of the executive committee 3 (3) 2.8 (3) 2.9 (3)Rules and norms for coordination 2.8 (3) 3 (3) 2.9 (3)Rules and norms for conflict resolution 3 (3) 3 (3) 3 (3)
n = the number of PMGs.Source: PMG survey 2005
Job452Textfinal.p65 1/24/2007, 4:19 PM13

14
Tabl
e 11
. Mar
kete
d vo
lum
es a
nd t
rans
acti
ons
of p
igeo
npea
and
the
impa
ct o
f di
stan
ces
on s
ales
.
Tra
ded
volu
me
Vol
ume
shar
eN
umbe
r of
Dis
tanc
e fr
om f
arm
gate
Mea
n pr
ice
Buy
er(t
ons)
(%)
tran
sact
ions
Farm
gate
< 3
km
3 -
5 km
> 5
km
(Ksh
/kg)
2003
2005
2003
2005
2003
2005
2003
2005
2003
2005
2003
2005
2003
2005
2003
2005
Con
sum
er2.
00.
36 5
823
320
02
11
20
022
25P
MG
-0.
35-
7-
7 -
1-
3-
3-
027
Rur
al w
hole
sale
r11
.91.
6524
.635
9322
92
5612
226
62
15.3
23B
roke
r/as
sem
bler
24.6
2.06
6044
110
1576
1014
15
115
318
.625
Urb
an w
hole
sale
r2.
80.
29 7
617
33
03
10
111
124
.824
Tota
l41
.34.
6810
010
024
350
108
1375
1828
1332
618
.125
Shar
e (%
)-
--
--
-44
2631
3612
2613
12
Sour
ce:
Hou
seho
ld s
urve
y 20
03 &
20
05
Tabl
e 10
. Tot
al t
rans
acti
ons
(num
ber
of s
ales
) an
d vo
lum
es (
tons
) in
200
4/05
(al
l cro
ps)
(n =
624
).
Tota
lSh
are
(%)
Farm
gate
< 3
km
3 -
5 km
> 5
km
Buy
erSa
les
Vol
ume
Sale
sV
olum
eSa
les
Vol
ume
Sale
sV
olum
eSa
les
Vol
ume
Sale
sV
olum
e
Con
sum
er33
6.5
53
214.
76
0.7
30.
53
0.7
PM
G27
3.7
42
40.
810
0.7
122.
21
0.1
Rur
al w
hole
sale
r28
310
1.8
4549
2527
.516
743
.382
29.9
91.
0B
roke
r/as
sem
bler
237
77.7
3838
175
60.0
245.
216
2.9
229.
7U
rban
who
lesa
ler
136.
42
31
0.0
30.
23
0.2
66.
1C
otto
n gi
nner
y12
4.7
22
--
20.
49
4.1
10.
2Sc
hool
194.
93
2-
-2
0.7
102.
17
2.0
Tota
l62
420
5.7
100
100
226
93.0
214
51.1
135
41.9
4919
.7Sh
are
(%)
3645
3425
2220
810
n =
the
num
ber
of p
oint
tra
nsac
tions
Sour
ce:
Hou
seho
ld s
urve
y 20
05
Job452Textfinal.p65 1/24/2007, 4:19 PM14

15
It is important to note that with increasing distance from the farmgate, the number of transactions andvolumes traded by market participant decline. This can be attributed to the increasing transportation andtransaction costs for the small quantities marketed and is consistent with the findings by Fafchamps and Hill(2005), which show that selling directly to markets (where farmers can get a higher price but must incur atransport cost) is more likely when the quantity sold is large and the market is close by. This further indicatesa potential business opportunity for PMGs through bulk selling.
To illustrate the market transactions by different market participants in terms of prices, market shares, andalso the effect of drought, we present the case of pigeonpea for 2003 and 2005 (Table 11). The results show thatthe drought situation that prevailed in 2004 had significantly depressed the marketed surplus and the number oftransactions6. While the number of transactions declined from 243 in 2003 to just 50 in 2005, traded volumedeclined from about 41 tons to 4.7 tons. This drastic change in market participation is significant given thatpigeonpea is one of the most drought-tolerant crops grown in these areas. When we look at the prices offeredby the different buyers, the PMG prices (Ksh 27/kg) were higher than all other agents. The prices paid by theother agents seem to be relatively similar (Ksh 23-25/kg). Does this indicate that the PMGs (after havingcovered their marketing and administration costs) indeed pay a statistically higher price with lower variancethan the other buyers?
Statistical and econometric methods were used to test these effects. An F-test using analyses ofvariance methods confirmed that the mean prices offered by different buyers varied significantly acrossbuyers of maize, beans, and greengram whereas a Bartlett test for equal variance (Ho: unit price variancesacross buyers are equal) was rejected (at 5% level) for most crops other than cotton (see Appendix 2). Thegroup variance comparison test was used to check whether the PMGs helped to reduce price instability orvariability. This was done only for pigeonpea and greengram, the two crops that the PMGs bought in2005. The null hypotheses of equal variance in the pigeonpea prices of PMGs and other buyers (ruralassemblers/brokers and rural wholesalers) were not rejected at 5% level. For greengram, the results showthat the PMG prices seemed to have higher variability compared to prices paid by rural wholesalers.However, the null hypothesis of equal variance was not rejected when PMG greengram price wascompared to that of rural assemblers/brokers. This suggests that while PMGs may offer higher meanprices to member farmers, the effect on price stabilization is unlikely to be evident in the cross-sectionaldata used here.
In order to test whether the average prices paid by the PMGs were statistically different after controllingfor other factors, we estimated an econometric model for actual prices received by farmers. The modeldependent variable was the unit price received by farmers for different crops in different markets located atvarying distances from the farm (including the farmgate). The model explanatory variables included: amountsold, amount sold squared, distance to the point of sell, dummy variables for the type of crop sold (bean,pigeonpea, greengram, cowpea, cotton and vegetables), the quality of grain sold, the type of buyer (PMG,consumer, rural wholesaler, urban trader, ginnery, school), season the grain was sold, gender of householdhead, level of education of the household head, access to information and fixed district level effects. A detaileddescription of these variables is given in Table 12.
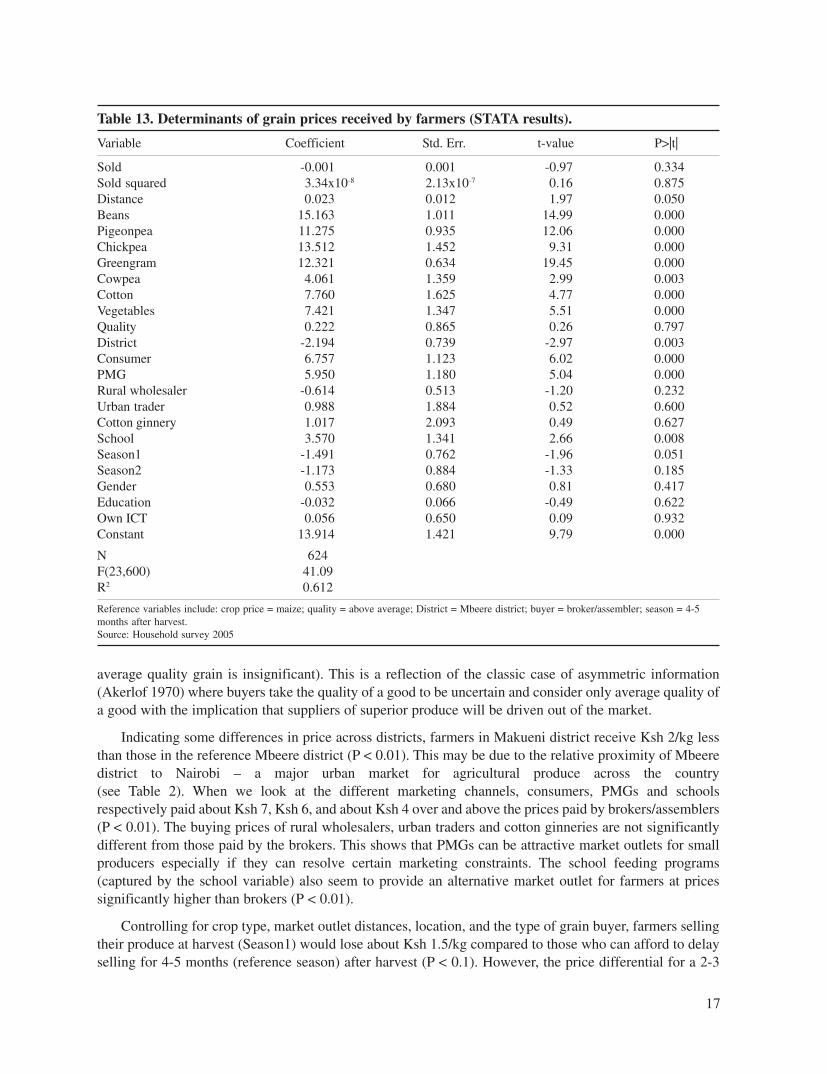
The estimated model was significant (P < 0.001) and explained about 61% of the variation(R2 = 0.612). The model results show that farmer grain prices are significantly determined by the distance tothe point of transaction, the type of crop sold, location by district, buyer type (particularly consumers,PMGs and schools) and the season the grain is sold. Unit prices were positively correlated with distance
6 Meteorological data show that the average annual rainfall for Makueni (2004) was about 468 mm, which is well below the minimum rainfall ofabout 650 mm required for agricultural production in these areas. While farmers also reported drought conditions in Mbeere in 2004, the severityseems to be lower than in Makueni.
Job452Textfinal.p65 1/24/2007, 4:19 PM15
16
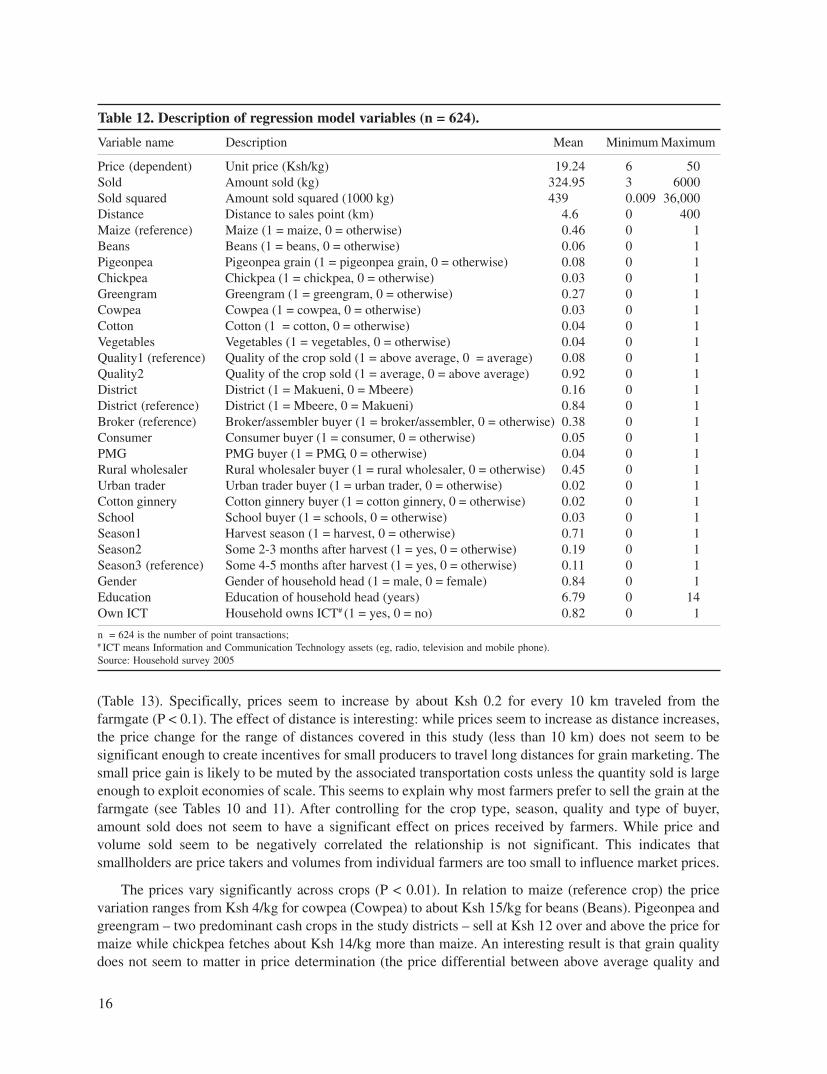
(Table 13). Specifically, prices seem to increase by about Ksh 0.2 for every 10 km traveled from thefarmgate (P < 0.1). The effect of distance is interesting: while prices seem to increase as distance increases,the price change for the range of distances covered in this study (less than 10 km) does not seem to besignificant enough to create incentives for small producers to travel long distances for grain marketing. Thesmall price gain is likely to be muted by the associated transportation costs unless the quantity sold is largeenough to exploit economies of scale. This seems to explain why most farmers prefer to sell the grain at thefarmgate (see Tables 10 and 11). After controlling for the crop type, season, quality and type of buyer,amount sold does not seem to have a significant effect on prices received by farmers. While price andvolume sold seem to be negatively correlated the relationship is not significant. This indicates thatsmallholders are price takers and volumes from individual farmers are too small to influence market prices.
The prices vary significantly across crops (P < 0.01). In relation to maize (reference crop) the pricevariation ranges from Ksh 4/kg for cowpea (Cowpea) to about Ksh 15/kg for beans (Beans). Pigeonpea andgreengram – two predominant cash crops in the study districts – sell at Ksh 12 over and above the price formaize while chickpea fetches about Ksh 14/kg more than maize. An interesting result is that grain qualitydoes not seem to matter in price determination (the price differential between above average quality and
Table 12. Description of regression model variables (n = 624).
Variable name Description Mean Minimum Maximum
Price (dependent) Unit price (Ksh/kg) 19.24 6 50Sold Amount sold (kg) 324.95 3 6000Sold squared Amount sold squared (1000 kg) 439 0.009 36,000Distance Distance to sales point (km) 4.6 0 400Maize (reference) Maize (1 = maize, 0 = otherwise) 0.46 0 1Beans Beans (1 = beans, 0 = otherwise) 0.06 0 1Pigeonpea Pigeonpea grain (1 = pigeonpea grain, 0 = otherwise) 0.08 0 1Chickpea Chickpea (1 = chickpea, 0 = otherwise) 0.03 0 1Greengram Greengram (1 = greengram, 0 = otherwise) 0.27 0 1Cowpea Cowpea (1 = cowpea, 0 = otherwise) 0.03 0 1Cotton Cotton (1 = cotton, 0 = otherwise) 0.04 0 1Vegetables Vegetables (1 = vegetables, 0 = otherwise) 0.04 0 1Quality1 (reference) Quality of the crop sold (1 = above average, 0 = average) 0.08 0 1Quality2 Quality of the crop sold (1 = average, 0 = above average) 0.92 0 1District District (1 = Makueni, 0 = Mbeere) 0.16 0 1District (reference) District (1 = Mbeere, 0 = Makueni) 0.84 0 1Broker (reference) Broker/assembler buyer (1 = broker/assembler, 0 = otherwise) 0.38 0 1Consumer Consumer buyer (1 = consumer, 0 = otherwise) 0.05 0 1PMG PMG buyer (1 = PMG, 0 = otherwise) 0.04 0 1Rural wholesaler Rural wholesaler buyer (1 = rural wholesaler, 0 = otherwise) 0.45 0 1Urban trader Urban trader buyer (1 = urban trader, 0 = otherwise) 0.02 0 1Cotton ginnery Cotton ginnery buyer (1 = cotton ginnery, 0 = otherwise) 0.02 0 1School School buyer (1 = schools, 0 = otherwise) 0.03 0 1Season1 Harvest season (1 = harvest, 0 = otherwise) 0.71 0 1Season2 Some 2-3 months after harvest (1 = yes, 0 = otherwise) 0.19 0 1Season3 (reference) Some 4-5 months after harvest (1 = yes, 0 = otherwise) 0.11 0 1Gender Gender of household head (1 = male, 0 = female) 0.84 0 1Education Education of household head (years) 6.79 0 14Own ICT Household owns ICT# (1 = yes, 0 = no) 0.82 0 1
n = 624 is the number of point transactions;# ICT means Information and Communication Technology assets (eg, radio, television and mobile phone).Source: Household survey 2005
Job452Textfinal.p65 1/24/2007, 4:19 PM16
17
average quality grain is insignificant). This is a reflection of the classic case of asymmetric information(Akerlof 1970) where buyers take the quality of a good to be uncertain and consider only average quality ofa good with the implication that suppliers of superior produce will be driven out of the market.
Indicating some differences in price across districts, farmers in Makueni district receive Ksh 2/kg lessthan those in the reference Mbeere district (P < 0.01). This may be due to the relative proximity of Mbeeredistrict to Nairobi – a major urban market for agricultural produce across the country(see Table 2). When we look at the different marketing channels, consumers, PMGs and schoolsrespectively paid about Ksh 7, Ksh 6, and about Ksh 4 over and above the prices paid by brokers/assemblers(P < 0.01). The buying prices of rural wholesalers, urban traders and cotton ginneries are not significantlydifferent from those paid by the brokers. This shows that PMGs can be attractive market outlets for smallproducers especially if they can resolve certain marketing constraints. The school feeding programs(captured by the school variable) also seem to provide an alternative market outlet for farmers at pricessignificantly higher than brokers (P < 0.01).
Controlling for crop type, market outlet distances, location, and the type of grain buyer, farmers sellingtheir produce at harvest (Season1) would lose about Ksh 1.5/kg compared to those who can afford to delayselling for 4-5 months (reference season) after harvest (P < 0.1). However, the price differential for a 2-3
Table 13. Determinants of grain prices received by farmers (STATA results).
Variable Coefficient Std. Err. t-value P>|t|
Sold -0.001 0.001 -0.97 0.334Sold squared 3.34x10⁻⁸ 2.13x10⁻⁷ 0.16 0.875Distance 0.023 0.012 1.97 0.050Beans 15.163 1.011 14.99 0.000Pigeonpea 11.275 0.935 12.06 0.000Chickpea 13.512 1.452 9.31 0.000Greengram 12.321 0.634 19.45 0.000Cowpea 4.061 1.359 2.99 0.003Cotton 7.760 1.625 4.77 0.000Vegetables 7.421 1.347 5.51 0.000Quality 0.222 0.865 0.26 0.797District -2.194 0.739 -2.97 0.003Consumer 6.757 1.123 6.02 0.000PMG 5.950 1.180 5.04 0.000Rural wholesaler -0.614 0.513 -1.20 0.232Urban trader 0.988 1.884 0.52 0.600Cotton ginnery 1.017 2.093 0.49 0.627School 3.570 1.341 2.66 0.008Season1 -1.491 0.762 -1.96 0.051Season2 -1.173 0.884 -1.33 0.185Gender 0.553 0.680 0.81 0.417Education -0.032 0.066 -0.49 0.622Own ICT 0.056 0.650 0.09 0.932Constant 13.914 1.421 9.79 0.000
N 624F(23,600) 41.09R2 0.612
Reference variables include: crop price = maize; quality = above average; District = Mbeere district; buyer = broker/assembler; season = 4-5months after harvest.Source: Household survey 2005
Job452Textfinal.p65 1/24/2007, 4:19 PM17

18
months delay after harvest (Season2) is not significantly different from a 4-5 months delay. This implies thatstoring grain would be beneficial to the farmers especially if the incremental price would offset the storagecosts including potential weight loss and pest attack. This shows that PMGs can exploit the seasonal pricevariability by facilitating storage and bulk sales (to reduce unit storage costs) so that farmers can benefitfrom better prices later in the season.
4.5. PMGs and price determinationVarious factors may affect the buying and selling prices of a product differently depending on how the buyeror seller ranks the factors on a given scale. With respect to PMGs, the prices they offer will determine theirattractiveness to members as a market outlet for their produce. Using group data, the mean and medianrankings of factors considered in setting buying and selling prices of the PMGs were analyzed.
The results show that prices offered by other traders (rank 2), season (rank 3), prevailing prices inNairobi and other urban centers (3.5), and product quality (rank 4) are the most important factors that thePMGs take into account in determining grain buying prices (Table 14). However, prices in Nairobi and otherurban areas (rank 1), prices offered by other traders (rank 2), product quality (rank 3) and season (rank 4) areimportant in determining the selling prices of PMGs. The importance of urban centers in determining PMGsprices suggests some degree of grain market co-integration between the rural and urban markets.Furthermore, the end users of the products in the marketing chain are generally located in the urban areas.Farmer production costs are not highly ranked in determining PMG buying or selling prices. This means thatPMGs are grain price takers rather than price setters. Interestingly, the ranks seem to indicate that quality ismore important during selling rather than buying the products. The econometric analysis results presentedin Table 13 have confirmed that quality did not affect prices received by farmers.
Table 14. Rankings of determinants of buying and selling prices (where 1 = most important).
Mbeere (n = 5) Makueni (n = 5) Total (n = 10)
Factor Buying Selling Buying Selling Buying Selling
Price in Nairobi and/or other 5.6 (5) 2 (1) 2 (1) 1.4 (1) 3.8 (3.5) 1.7 (1) urban areasPrice offered by traders 4 (2) 2.6 (2) 2 (2) 2.8 (2) 1.8 (2) 3 (2)Product quality 4.8 (4) 3.6 (3) 4.2 (4) 3.4 (3) 4.5 (4) 3.5 (3)Season 6.6 (5) 5.2 (5) 2.2 (3) 2.8 (3) 4.1 (3) 4 (4)Prices asked by farmers 6 (6) 4 (4) 5.4 (5) 4.8 (5) 5.7 (5.5) 4.4 (5)Previous year price 7 (6) 6 (6.5) 5.2 (6) 5.8 (6) 5.7 (6) 5.7 (6)Production cost 5.4 (6) 4.8 (5) 8 (8) 8 (8) 6.7 (8) 6.4 (8)Transport cost 8 (8) 7.8 (8) 8 (8) 8 (8) 8 (8) 7.9 (8)
Figures in parentheses are medians; n = number of PMGs.Source: PMG survey 2005
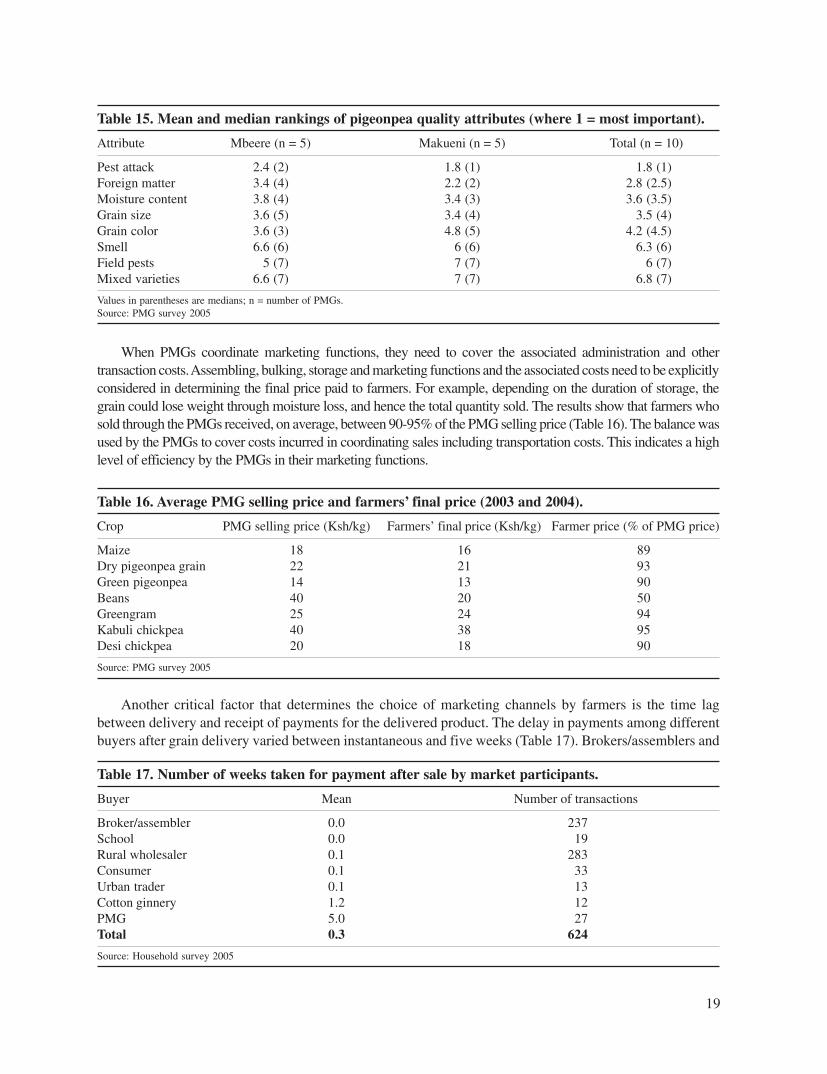
Although there is no price premium for quality, PMGs consider certain grain quality attributes whenbuying from members. These attributes include pest attack, moisture content, foreign matter, grain color,among others. These factors reflect the quality of the produce that is desired by the PMGs. The medianrankings show that pest attack (1), percentage of foreign matter in the grain (2.5), moisture content (3.5), grainsize (3.5), and grain color (4.5) are important attributes (Table 15). This is likely to affect the supply of qualityand differentiated products by small farmers as they lack the incentives in a market where prices reflect fairaverage quality and there is no premium for superior quality products.
Job452Textfinal.p65 1/24/2007, 4:19 PM18
19
When PMGs coordinate marketing functions, they need to cover the associated administration and othertransaction costs. Assembling, bulking, storage and marketing functions and the associated costs need to be explicitlyconsidered in determining the final price paid to farmers. For example, depending on the duration of storage, thegrain could lose weight through moisture loss, and hence the total quantity sold. The results show that farmers whosold through the PMGs received, on average, between 90-95% of the PMG selling price (Table 16). The balance wasused by the PMGs to cover costs incurred in coordinating sales including transportation costs. This indicates a highlevel of efficiency by the PMGs in their marketing functions.
Table 15. Mean and median rankings of pigeonpea quality attributes (where 1 = most important).
Attribute Mbeere (n = 5) Makueni (n = 5) Total (n = 10)
Pest attack 2.4 (2) 1.8 (1) 1.8 (1)Foreign matter 3.4 (4) 2.2 (2) 2.8 (2.5)Moisture content 3.8 (4) 3.4 (3) 3.6 (3.5)Grain size 3.6 (5) 3.4 (4) 3.5 (4)Grain color 3.6 (3) 4.8 (5) 4.2 (4.5)Smell 6.6 (6) 6 (6) 6.3 (6)Field pests 5 (7) 7 (7) 6 (7)Mixed varieties 6.6 (7) 7 (7) 6.8 (7)
Values in parentheses are medians; n = number of PMGs.Source: PMG survey 2005
Table 16. Average PMG selling price and farmers’ final price (2003 and 2004).
Crop PMG selling price (Ksh/kg) Farmers’ final price (Ksh/kg) Farmer price (% of PMG price)
Maize 18 16 89Dry pigeonpea grain 22 21 93Green pigeonpea 14 13 90Beans 40 20 50Greengram 25 24 94Kabuli chickpea 40 38 95Desi chickpea 20 18 90
Source: PMG survey 2005
Another critical factor that determines the choice of marketing channels by farmers is the time lagbetween delivery and receipt of payments for the delivered product. The delay in payments among differentbuyers after grain delivery varied between instantaneous and five weeks (Table 17). Brokers/assemblers and
Table 17. Number of weeks taken for payment after sale by market participants.
Buyer Mean Number of transactions
Broker/assembler 0.0 237School 0.0 19Rural wholesaler 0.1 283Consumer 0.1 33Urban trader 0.1 13Cotton ginnery 1.2 12PMG 5.0 27Total 0.3 624
Source: Household survey 2005
Job452Textfinal.p65 1/24/2007, 4:19 PM19

20
schools paid on delivery, while rural wholesalers, urban traders and the cotton ginnery paid about a day afterdelivery. In contrast, it took the PMGs five weeks to pay farmers after they had delivered their grain. Manycash-constrained farmers who need cash to settle various commitments (eg, loans, schools fees and othernecessities) at the time of delivery often opt to sell their grain through other channels even if this meansrelatively lower prices. One useful strategy for the PMGs to increase their market share would require thatthey pay farmers at least a certain proportion of the grain value at the time of delivery pending full paymentsafter selling the grain at a higher price later.
4.6. Collective action and PMG performanceOne major difficulty in collective action studies is to measure the level of collective action and how suchgroup action contributes to final performance outcomes. Generally there are no standardized measures orindicators that can be used to assess the level, viability and effectiveness (performance) of collective action(eg, Place et al. 2002). However, depending on the problem under investigation, certain indicators may beidentified as proxies for the differential level of collective action (those that capture the level of cooperationor group action) and the degree of effectiveness of such collective action in attaining a group’s statedobjectives. This kind of separation allows us to assess the extent to which collective action can be attributedto good performance in terms of final outcomes. Accordingly we use a qualitative approach based on anin-depth study of the PMG operations to identify some indicators for the levels of collective action and itseffectiveness (performance).
The level of collective action across groups can be inferred by commitment attributes of theindividual members to the group activities and objectives. These may include the extent to whichindividual members relate with other members of the group within the confines of the existinginstitutional mechanisms and governance structures, and commitment or subscription to the group’sideals or the extent to which the individual members share a common vision. Accordingly, six indicatorsof collective action were identified: the number of elections since formation, share of membersrespecting the by-laws, attendance of meetings, annual member contributions to the group, cash capitaland agreed annual subscription fees. In order to facilitate comparison across groups, the indicators werestandardized in per capita or in percentage values.
The results using these indicators show that the level of collective action varied across PMGs(Table 18). Elections are a means through which members can ensure that groups are managed effectively.They are an indication that members are actively participating in group decisions which are monitored andenforced collectively (McCarthy et al. 2002), which is a good measure of the level of collective action. Thegroups conducted an election annually although in two groups (Nthingini and Kamwiyendeyi), electionswere conducted after two years, whereas Makima conducted elections biannually (indicating a higher levelof collective action).
By-laws define the obligation and the mode of interaction between members and the PMG leadershipfor the smooth and effective running of the groups in the process of pursuing the groups’ objectives. Abidingby the laws also reduces governance and coordination costs. The proportion of members who respect groupby-laws ranged between 50 and 100%. Half the PMGs reported that upwards of 75% of the membersadhered to the by-laws. PMGs like Makima, Emali and Thavu had higher values on this indicator. A relatedindicator is the proportion of members attending general assembly meetings where important resolutionsare passed. It shows the level of involvement by individuals in the management and coordination ofcollective action. The proportion of members who attended the general assembly meetings was 46-95%,with 60% of the PMGs reporting less than 65% attendance. The good performers in this indicator includeThavu, Kamwiyendeyi and Kathonzweni.
Job452Textfinal.p65 1/24/2007, 4:19 PM20

21
Tabl
e 18
. Sel
ecte
d in
dica
tors
for
the
leve
l of
colle
ctiv
e ac
tion
by
PM
Gs.
Mem
ber
atte
ndan
ceM
embe
r co
ntri
butio
nA
vera
ge a
nnua
l ele
ctio
ns%
of
mem
bers
of g
ener
al m
eetin
gsin
200
4 (K
sh/a
ctiv
ePe
r ca
pita
cap
ital
Ann
ual s
ubsc
ript
ion
PM
Gsi
nce
form
atio
nre
spec
ting
by-l
aws
in 2
004
(%)
mem
ber
in 2
005
(Ksh
/ mem
ber)
fee
(Ksh
/ mem
ber)
Wan
go1
7565
063
120
Nth
ingi
ni0.
565
5721
3420
Kili
a1
7076
00
0K
amw
iyen
deyi
0.5
8085
00
0M
akim
a2
100
4816
012
318
00E
mal
i1
100
610
4324
0T
havu
190
950
430
Kat
honz
wen
i1
6767
264
265
120
Kal
amba
171
6424
731
936
0K
YM
150
462
180
0
Sour
ce:
PMG
sur
vey
2005
Tabl
e 19
. Ran
king
s of
PM
Gs
base
d on
leve
l of
colle
ctiv
e ac
tion
(C
A)
indi
cato
rs (
whe
re 1
= h
ighe
st C
A)
Ave
rage
ann
ual
Mem
ber
atte
ndan
ceM
embe
r co
ntri
butio
nsel
ectio
ns s
ince
% o
f m
embe
rsof
gen
eral
mee
tings
in 2
004
Per
capi
ta c
apita
lA
nnua
l sub
scri
ptio
nP
MG
form
atio
nre
spec
ting
by-l
aws
in 2
004
(%)
(Ksh
/act
ive
mem
ber
in 2
005
(Ksh
/ mem
ber)
fee
(K
sh/m
embe
r)M
ean
rank
Kal
amba
25
62
12
3.0
Mak
ima
11
93
41
3.2
Kat
honz
wen
i2
74
12
104.
3W
ango
24
510
53
4.8
Tha
vu2
21
106
105.
2N
thin
gini
38
84
74
5.7
Em
ali
21
710
610
6.0
Kam
wiy
ende
yi3
32
1010
106.
3K
YM
29
105
310
6.5
Kili
a2
63
1010
106.
8
Bas
ed o
n da
ta i
n Ta
ble
18
Job452Textfinal.p65 1/24/2007, 4:19 PM21
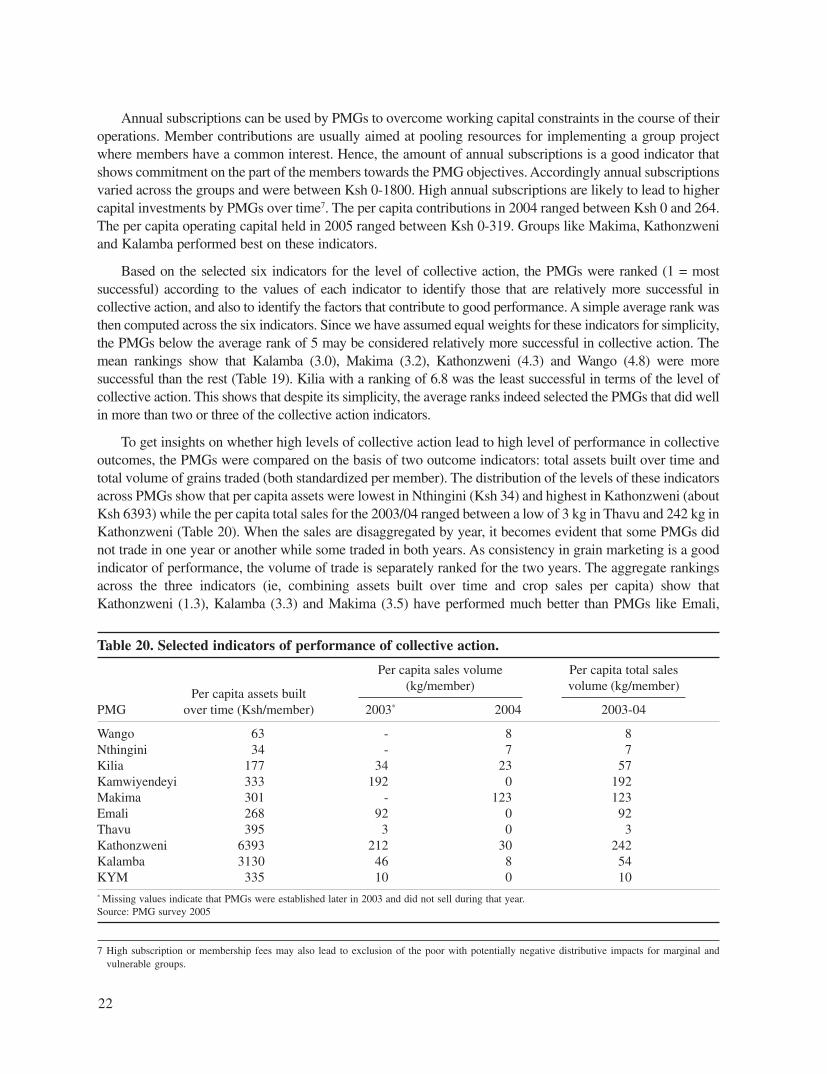
22
Annual subscriptions can be used by PMGs to overcome working capital constraints in the course of theiroperations. Member contributions are usually aimed at pooling resources for implementing a group projectwhere members have a common interest. Hence, the amount of annual subscriptions is a good indicator thatshows commitment on the part of the members towards the PMG objectives. Accordingly annual subscriptionsvaried across the groups and were between Ksh 0-1800. High annual subscriptions are likely to lead to highercapital investments by PMGs over time7. The per capita contributions in 2004 ranged between Ksh 0 and 264.The per capita operating capital held in 2005 ranged between Ksh 0-319. Groups like Makima, Kathonzweniand Kalamba performed best on these indicators.
Based on the selected six indicators for the level of collective action, the PMGs were ranked (1 = mostsuccessful) according to the values of each indicator to identify those that are relatively more successful incollective action, and also to identify the factors that contribute to good performance. A simple average rank wasthen computed across the six indicators. Since we have assumed equal weights for these indicators for simplicity,the PMGs below the average rank of 5 may be considered relatively more successful in collective action. Themean rankings show that Kalamba (3.0), Makima (3.2), Kathonzweni (4.3) and Wango (4.8) were moresuccessful than the rest (Table 19). Kilia with a ranking of 6.8 was the least successful in terms of the level ofcollective action. This shows that despite its simplicity, the average ranks indeed selected the PMGs that did wellin more than two or three of the collective action indicators.
To get insights on whether high levels of collective action lead to high level of performance in collectiveoutcomes, the PMGs were compared on the basis of two outcome indicators: total assets built over time andtotal volume of grains traded (both standardized per member). The distribution of the levels of these indicatorsacross PMGs show that per capita assets were lowest in Nthingini (Ksh 34) and highest in Kathonzweni (aboutKsh 6393) while the per capita total sales for the 2003/04 ranged between a low of 3 kg in Thavu and 242 kg inKathonzweni (Table 20). When the sales are disaggregated by year, it becomes evident that some PMGs didnot trade in one year or another while some traded in both years. As consistency in grain marketing is a goodindicator of performance, the volume of trade is separately ranked for the two years. The aggregate rankingsacross the three indicators (ie, combining assets built over time and crop sales per capita) show thatKathonzweni (1.3), Kalamba (3.3) and Makima (3.5) have performed much better than PMGs like Emali,
Table 20. Selected indicators of performance of collective action.
Per capita sales volume Per capita total sales
Per capita assets built(kg/member) volume (kg/member)
PMG over time (Ksh/member) 2003* 2004 2003-04
Wango 63 - 8 8Nthingini 34 - 7 7Kilia 177 34 23 57Kamwiyendeyi 333 192 0 192Makima 301 - 123 123Emali 268 92 0 92Thavu 395 3 0 3Kathonzweni 6393 212 30 242Kalamba 3130 46 8 54KYM 335 10 0 10* Missing values indicate that PMGs were established later in 2003 and did not sell during that year.Source: PMG survey 2005
7 High subscription or membership fees may also lead to exclusion of the poor with potentially negative distributive impacts for marginal andvulnerable groups.
Job452Textfinal.p65 1/24/2007, 4:19 PM22
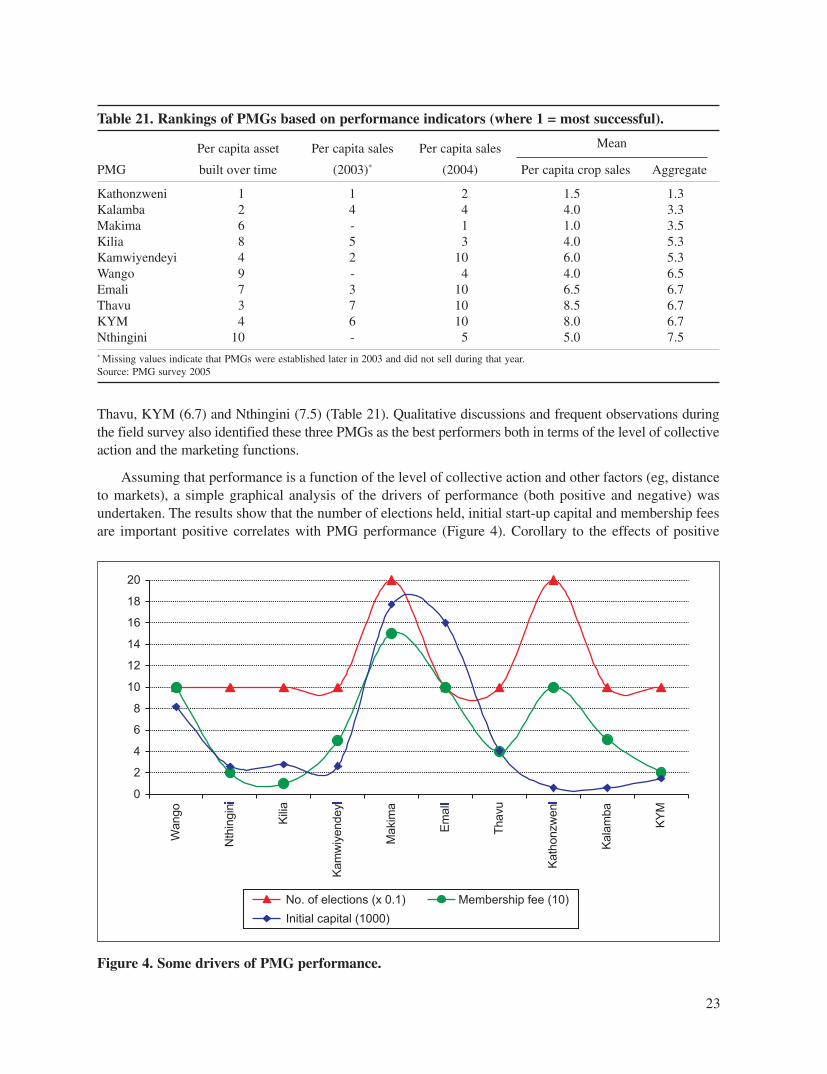
23
Thavu, KYM (6.7) and Nthingini (7.5) (Table 21). Qualitative discussions and frequent observations duringthe field survey also identified these three PMGs as the best performers both in terms of the level of collectiveaction and the marketing functions.
Assuming that performance is a function of the level of collective action and other factors (eg, distanceto markets), a simple graphical analysis of the drivers of performance (both positive and negative) wasundertaken. The results show that the number of elections held, initial start-up capital and membership feesare important positive correlates with PMG performance (Figure 4). Corollary to the effects of positive
Table 21. Rankings of PMGs based on performance indicators (where 1 = most successful).
Per capita asset Per capita sales Per capita sales Mean
PMG built over time (2003)* (2004) Per capita crop sales Aggregate
Kathonzweni 1 1 2 1.5 1.3Kalamba 2 4 4 4.0 3.3Makima 6 - 1 1.0 3.5Kilia 8 5 3 4.0 5.3Kamwiyendeyi 4 2 10 6.0 5.3Wango 9 - 4 4.0 6.5Emali 7 3 10 6.5 6.7Thavu 3 7 10 8.5 6.7KYM 4 6 10 8.0 6.7Nthingini 10 - 5 5.0 7.5* Missing values indicate that PMGs were established later in 2003 and did not sell during that year.Source: PMG survey 2005
Figure 4. Some drivers of PMG performance.
Job452Textfinal.p65 1/24/2007, 4:19 PM23

24
drivers, the number of villages covered by the PMG, distance to markets (grain wholesalers and districtcommercial centers), and group size seem to be negatively associated with the effectiveness of marketingfunctions of the PMGs (Figure 5). The number of villages covered by a PMG is highest for Emali, butrelatively smaller for Makima, Kathonzweni and Kalamba, the more successful PMGs. The distance towholesalers is shortest for Makima and Kathonzweni, located close to rural market centers, but higher forNthingini, Kalamba, Kilia and KYM. The poorly-performing PMGs, Nthingini, Kamwiyendei and Wango,are also located far from the district commercial center. Moreover, the better performing PMGs likeMakima, Kathonzweni, and Kalamba had relatively smaller group sizes compared to poor performers,Kilia, Nthingini and Emali. Consistent with the findings reported by McCarthy et al. (2002), groupperformance seemed to decline with increase in distance to markets. These results indicate that proximity tomarkets is likely to improve marketing functions and competitive behavior through better access to marketinformation that would help PMGs make informed decisions on buying and selling prices, and betteradvertise their stock to wholesalers or other agents. It also shows that shorter distance to service centers andbuyers at the end of the marketing chain is likely to enhance the degree of complementarity between PMGsand private enterprises.
Although group size has been shown to be positively correlated to performance (Place et al. 2002), thequalitative evidence provided here shows that this may not necessarily be the case. Effective group size islikely to vary by the type of collective action. In addition, group size may have a non-linear relationshipwith performance which would suggests that medium sized groups are more likely to succeed than verysmall groups or very large groups (Agrawal and Goyal 2001), depending on transaction, organizationaland managerial costs of cooperation (Hussi et al. 1993). An optimal group size will be one that minimizesthese costs, and improves the coordination of production and marketing functions. The challenge for thePMGs would be how to determine the effective group size that would be big enough to exploit economiesof scale, without leading to coordination failure and prevalence of conflicts. Generally, the negativecorrelates jointly constrain coordination of production and the marketing functions of the PMGs. Longdistance implies geographical isolation, while group size and the number of villages covered by a singlePMG could be associated with higher transaction costs, coordination failure and lack of cohesion orshared goals and values.
Figure 5. Negative correlates with PMG performance.
Job452Textfinal.p65 1/24/2007, 4:19 PM24
25
4.7. Constraints to collective marketingFor the PMGs to be effective and successful in their collective marketing functions, constraints to theiroperations will have to be addressed. The median rank for the three most important constraints to collectivemarketing was given as: lack of credit (1), price variability (3) and low volumes (3)(Table 22). In addition, lack of buyers (4) and low business skills (6) appear to be relatively important. Theprominence of lack of credit as a major constraint to collective marketing is consistent with the widerecognition that this service can play an important role for marketing and enterprise development (eg,Bingen et al. 1993; Kirkpatrick and Maimbo 2002) and for remedying market imperfections associated withrisk and imperfect information (eg, Poulton et al. 1998; Kelly et al. 2003). Nonetheless, there are threeapproaches through which constrained access to credit by PMGs can be addressed, namely: rural micro-credit facilities, contract or outgrower schemes, and inventory credit (see Kindness and Gordon 2001).
Table 22. Rankings of PMG collective marketing constraints (where 1 = most important).
Constraint Mbeere (n = 5) Makueni (n = 5) Total (n = 10)
Lack of credit 1.4 (1) 1.2 (1) 1.3 (1)Price variability 4.6 (5) 2.6 (2) 3.6 (3)Low volumes 4.8 (3) 3.2 (3) 4.0 (3)Lack of buyers 5.4 (4) 4.0 (4) 4.7 (4)Low business skills 4.8 (6) 6.0 (6) 5.4 (6)Low quality 7.2 (7) 6.2 (6) 6.7 (7)Storage pests 7.6 (8) 7.6 (7) 7.6 (7.5)Internal conflicts 8.0 (8) 8.2 (8) 8.1 (8)Poor leadership 7.8 (9) 9.6 (10) 8.7 (9)Lack of storage 11.3 (12) 8.2 (7) 9.4 (10)Theft in storage 10.8 (11) 11.2 (12) 11.0 (11)
Figures in parentheses are medians; and n = number of PMGs.Source: PMG survey 2005
Micro-credit schemes are a response to market failure in conventional banking services for the ruralpoor. They are associated with group lending since individual farmers rarely have bankable assets that canbe used as collateral against formal loans. In addition, individual market transactions are largely informalsuch that formal banks are unable to collect information on prices independently. But peer pressure caneffectively substitute for collateral, as group members are likely to take action to prevent a fellow memberfrom defaulting. With a lead model demonstrated by the Grameen bank in Bangladesh, there are now severalsuccessful examples across Africa (eg, K-Rep Bank in Kenya). The disadvantage of such schemes is thattheir operations are normally subsidized such that the sustainability of their operations is not guaranteed inthe long term. In addition, the size of loans may be small to provide capital required for grain marketing.Selective subsidies may, however, be needed to ‘kick-start’ agricultural markets as they play an importantrole in relieving critical seasonal and cash constraints, and reducing market and input supply uncertainties(Dorward et al. 2004a).
In relation to contract or outgrower schemes, processors or exporters can provide financial resources tofarmers, with the latter undertaking to supply grain under conditions specified in advance (futures) contractsthat often specify volumes, prices and time. Farmer organizations and PMGs can play a vital role infacilitating such contractual arrangements with the private sector in a manner that would be mutuallybeneficial to farmers and contractors: farmers will be able to sell their produce through the PMGs knowingthat they will be paid promptly; the PMGs will be able to access capital from the private sector that wouldimprove the viability of their business; and the processor will be guaranteed timely supply of required
Job452Textfinal.p65 1/24/2007, 4:19 PM25
26
quantity and quality of grain. The viability of such an arrangement would depend on three factors: i) howPMGs operate as a business, ii) the extent to which they would be able to produce quality products in thedesired quantity and time, and iii) the legal and institutional framework for contract formation andenforcement. The latter is critical as many contract farming arrangements suffer from non-binding contractsand lack of arbitration and enforcement mechanisms.
An inventory credit (also called warehouse credit) system is another option for providing credit servicesto PMGs. There are three players involved in this arrangement: the farmer, the PMG and a bank. Thewarehouse, which can also be operated by a PMG or a third party, can be used to store grain supplied byfarmers with a formal bank lending a certain percentage of the grain value at the time of harvest. The PMGcan use the loan to pay the farmers as well as acquire additional stocks with a plan to repay the loan laterafter selling the grain at higher prices during the low supply season. This option could be particularlyattractive as the logistics are relatively simple and it is widely practiced in Africa. However, the success ofsuch an arrangement will depend on the requisite institutional mechanisms which include the willingness ofthe banks to lend against inventories, warehouse systems that can operate within the necessary legalframework, and supportive and enforceable legal institutions.
The challenge of price variability to collective marketing can be explained by supply variations andweak market linkages. Reduced supply in rainfed agriculture is generally occasioned by low rainfall ordrought occurrences. Investment in water harvesting technologies (eg, watershed management) can be asuitable strategy to mitigate supply variations and subsequent price fluctuations. While unpredictable pricefluctuations can be detrimental to collective efforts, seasonal price differences associated with productionand supply patterns may be predictable. The PMGs could turn such seasonal price changes to theiradvantage by storing the grain until the prices are high. This can be effectively done by the PMGs once thebinding credit problem has been addressed through alternative institutional arrangements. The challenge oflow volumes requires a different strategy that would help procure products over a wider catchment area.This requires coordination of marketing functions at a higher level of organization (eg, a union of PMGs)that would also allow spreading of the administrative and logistical costs. Economic viability of PMGsunder changing market conditions will also require improvements in business skills and entrepreneurship.This is particularly important at the initial stages when such capacity is lacking. While private serviceproviders may gradually take this role as the PMGs grow, external support would be critical at initial stagesto PMGs for training in organization, management, entrepreneurship and marketing functions. Theknowledge and skills gained would equip the PMGs with the capacity to initiate and sustain profitablecommercial relationships with the private sector and financial institutions (Bingen et al. 2003).
5. Legal and policy issues for collective marketingGiven the low level of market development and lack of service providers in many rural areas, the PMGs areunlikely to prosper in a “business as usual” policy environment. An appropriate policy environment thatwould spur PMG growth will include an enabling legal framework, support to access market information,support to strengthen business skills, and access to essential finance and credit facilities. As is the standardpractice for rural groups in Kenya, the PMGs were registered as self-help groups (SHGs) as required by theKenyan law. Accordingly, the PMGs lack legal status as business enterprises, which is likely to constraintheir development and competitiveness under the liberalized market structure. Their registration as socialgroups rather than business enterprises restricts access to essential credit from formal financial institutions– a major collective marketing constraint identified by the PMGs. Their lack of legal status as businessenterprises means that they can neither sue nor be sued in case of any liability. This drastically diminishesthe incentive for financial institutions to do business with PMGs in terms of providing essential financial
Job452Textfinal.p65 1/24/2007, 4:19 PM26
27
services (credit, insurance, etc). Hence, legal recognition as business entities is a prerequisite to place themin a better position for accessing complimentary services which are critical for their development.
Moreover, agricultural marketing systems require rules and regulations that facilitate contractformation and exchange. According to the Kenya Cooperative Societies amendment bill, Article 28, 2004, acooperative society is required to have a committee of between five and nine members (Republic of Kenya2004)8. The committee is empowered to enter into contracts and carry out other business functions inaccordance with the established by-laws. Based on this article, the PMGs can transit quickly from self helpgroups into cooperatives. The act empowers the members to be responsible for their own registeredcooperative societies and stress on the need for the cooperatives, through their elected committees, to runtheir societies in accordance with internationally accepted cooperative principles. The relationship betweensocieties and the government is through the commissioner of cooperatives, who is responsible for thecooperative development and growth and provides organization, registration, operation, advancement anddissolution services. Manyara (2003) argues that government controls are justifiable to restore regulatorycontrols for the sector to be sustainable, but Argwings-Kodhek (2004) contends that the amendments seemto be referring more to a typical troubled agricultural marketing cooperative or generally a small rural cropmarketing-based cooperative. Nevertheless, the amended act would appear to provide for a strongerregulatory framework within which cooperative societies can operate but it fails to provide sufficientmechanism for those now registered as welfare groups to transit into cooperative societies. The strongregulatory framework stipulated in the act without proper mechanisms for facilitating and supportingyounger cooperative societies and farmer organizations could also inhibit further development andcompetitiveness.9
A framework that seeks to promote, guide and discipline the operation of markets may also be requiredto enhance PMG operations. Typical examples will include laws dealing with good agricultural practice,environmental and consumer protection to motivate corporate social responsibility and accountability. Sucha framework will need to address constraints to development and sustainability of the PMGs based on theircore function of collective marketing which will be critical to their growth and effectiveness. As discussedearlier, low volumes, low business skills and lack of storage facilities are some of the critical constraints tocollective marketing. The low volume problem is a further justification for the establishment of an umbrellaunion or confederation of PMGs which can horizontally and vertically coordinate the marketing functionsof the member PMGs. This will be an essential strategy for the PMGs to reduce transaction costs while alsoreducing their fixed administration costs through better vertical and horizontal coordination of output andinput marketing functions.
6. ConclusionsMarket liberalization is a necessary but not sufficient condition to increase access to markets by smallholderfarmers in many countries of sub-Saharan Africa. The expected positive response by the private sector inmany areas with limited market infrastructure has however been disappointing, leaving a large number ofsmallholder farmers under subsistence production and, therefore, unable to benefit from liberalizedmarkets. Structural problems of poor infrastructure and lack of market institutions needed to fill the vacuum
8 The supplement contains amendments to the Cooperatives Act No. 12 of 1997, which too was a result of an amendment of the CooperativeSocieties Cap. 490 of 1966. In an effort to enhance the policy and legal framework for the functioning of cooperatives, the Kenyan governmenthas gradually introduced these two amendments. The latest amendments were motivated by the need to enable cooperative societies operate asbusiness entities.
9 The framework requires that societies elect new office bearers annually, maintain financial statements that meet international standards andprepare and submit annual statement of accounts audited by an auditor approved by the government. Failure to meet these requirements or meetstated objectives may lead to dissolution.
Job452Textfinal.p65 1/24/2007, 4:19 PM27

28
left when governments withdrew from markets in the process of liberalization contribute to high transactioncosts, coordination failure and pervasive market imperfections. This realization has necessitated new kindsof institutional arrangements to enhance the uptake of market-oriented and productivity-enhancingtechnologies, link farmers to markets and foster market participation and commercialization of smallholderproduction. One of these institutional innovations has been the strengthening of producer organizations andformation of collective marketing groups as instruments to remedy pervasive market failures in ruraleconomies.
The analysis presented here has shown that while collective action – embodied in PMGs – is feasibleand useful, external shocks and structural constraints in the system require farmer organization andcoordination mechanisms at a higher scale to exploit scale economies. Recurrent droughts in semi-arid areasand low productivity of soils reduce marketable surplus and increase vulnerability and attenuate the benefitsof collective action. The continued existence of PMGs under such circumstances depends on the ability toorganize farmers at a higher level of coordination (eg, district), and their ability to tackle technological andfinancial problems that now limit crop yields and the amount procured in a given season.
It is evident that marketing channels in the study areas are characterized by long and complex marketingchains and high transaction costs which considerably lower the farmers’ share of the consumer price.Producer marketing groups have the potential to simplify and shorten the marketing chain by directlyconnecting small producers to secondary and tertiary markets; better coordinate production and marketingactivities and facilitate farmer access to production inputs at fair prices. Even so, only relatively successfulPMGs will be able to exploit this potential. The effectiveness of this collective action was reflected in thelarger volumes of grain transacted and capital assets held by the group. The effectiveness of collectiveaction in terms of these performance indicators was found to be a function of the level of collective action inthe form of increased participatory decision making, member contributions to the PMG, and initial start-upcapital. Hence, better performing groups in terms of collective marketing, showed evidence of high levels ofcollective action. The higher the levels of collective action, the more successful the PMGs were in terms ofmonetized per capita assets built over time and also the per capita grain volumes traded. The number ofelections held, initial start-up capital and membership fees were all positively associated with groupperformance, while the number of villages covered by the PMGs, distances to markets and group size seemto have the opposite effect on group performance.
The challenge therefore is to sensitize members on the democratic principles of participatory groupgovernance through elections, to provide initial start-up capital to kick-start their operations, and toencourage members to increase their registration fees for membership to raise the necessary minimumcapital. This calls for interventions that will improve governance and democratization of the PMGs; solicitfor external support in establishing a start-up capital base; and encourage increased annual contributions tothe PMGs by the membership. This will need to be coupled with training of managers and possibly membersof the PMGs in business skills to facilitate effectiveness and accountability in running the PMGs as businessenterprises. In addition the PMGs have to be registered as legal business entities and not as self-help groups,which restricts their ability to access essential business services.
Although the PMGs demonstrated that they could fill gaps in the marketing channels and pay betterprices to farmers, their effectiveness was hampered by their lack of cash capital to pay for produce deliveriesby farmers. The brokers and rural wholesalers who can pay cash on delivery were still dominant marketparticipants in rural grain markets. The PMGs on average required some five weeks to pay the farmers aftergrain delivery. Cash constrained farmers find it very difficult to wait for that long, even when the PMGswould eventually be in a position to pay prices significantly higher than other buyers. Hence many smallproducers choose to sell their grain to other traders although this may mean receiving lower prices.Therefore, until the PMGs are able to pay promptly for deliveries made (even if it means a proportion of the
Job452Textfinal.p65 1/24/2007, 4:19 PM28

29
final price) small producers will not be in a position to benefit from market opportunities opened throughcollective action. There is thus a need to enhance the ability of the PMGs to access working capital throughaccess to financial credit. An innovative strategy would be to use the PMG crop inventory before sale ascollateral for financial credit and to subsequently encourage formal financial institutions to extendwarehouse or inventory credit services to PMGs. This is critical to enable PMGs to overcome the bindingliquidity constraints and facilitate effective coordination of the marketing functions for small producers.
In addition to credit, experiences in eastern Kenya show that collective marketing activities areconstrained by low volumes, price variability and low business skills. The formation of an umbrella union ofPMGs may help in addressing the problems of low volumes, price variability and the lack of credit. Lowtransacted volumes are attributed to delivering of small quantities of grain by producers. This may be due todrought conditions, low productivity of traditional agriculture and weak incentives to sell through PMGs.Moreover, the farmers are scattered over a wide area making coordination costly and difficult. This calls forenhanced institutional arrangements for better vertical and horizontal coordination of marketing functionsaccording to manageable spatial units. A union of PMGs (under an umbrella body) may ease the marketcoordination constraint, thus lowering coordination costs. This option would enable PMGs to verticallycoordinate transactions in addition to facilitating access to a broad range of buyers at the upper end of themarketing chain. The seasonal price variability may also be exploited through bulking and storage duringperiods of excess supply and selling when prices improve as the supply diminishes. The alternative optionfor smoothing supply will require investments in drought mitigating and water harvesting techniques thatwould enable farmers in drought-prone areas manage production risk more effectively. External support forstrengthening existing institutions and collective investments in integrated watershed management may alsogenerate significant economic and environmental benefits to the affected communities.
Job452Textfinal.p65 1/24/2007, 4:19 PM29

30
ReferencesAgrawal A and Goyal S. 2001. Group size and collective action: Third-party monitoring in common-poolresources. Comparative Political Studies 34(1): 63-93.
Akerlof GA. 1970. The market for “lemons”: Quality and uncertainty and the market mechanism. QuarterlyJournal of Economics 84(3): 488-500.
Akwabi-Ameyaw K. 1997. Producer cooperatives resettlement projects in Zimbabwe: Lessons from a failedagricultural development strategy. World Development 25(3): 437-456.
Argwings-Kodhek G. 2004. Feast and famine: Financial services for rural Kenya. Tegemeo Rural FinancePaper, Tegemeo Institute of Agricultural Policy and Development, Egerton University. http://www.aec.msu.edu/fs2/kenya/wp12-ruralf.pdf.
Bingen J, Serrano A and Howard J. 2003. Linking farmers to markets: Different approaches to human capitaldevelopment. Food Policy 28: 405-419.
Bingen RJ, Brent S and Adama B. 1993. Analysis of service delivery systems to farmers and villageassociations in the zone of the office de la Haute Vallée du Niger. East Lansing: Dept of Resource Development,Michigan State University.
Chowdhury S, Negessa A and Torero M. 2005. Market institutions: Enhancing the value of rural-urban links. FCNDDiscussion Paper 195/MTID Discussion Paper 89. Washington DC: International Food Policy Research Institute.
Coulter J, Millns J, Tallontire A and Stringfellow R. 1999. Marrying farmer cooperation and contract farmingfor agricultural service provision in liberalizing economies in sub-Saharan Africa. ODI Natural ResourcesPerspectives, No. 48, London: Overseas Development Institute.
de Janvry A, Fafchamps M and Sadoulet E. 1991. Peasant household behavior with missing markets: Someparadoxes explained. Economic Journal 101:1400-1417.
Dorward A and Kydd J. 2004. The Malawi 2002 food crisis: The rural development challenge. Journal ofModern African Studies 42(3): 343-361.
Dorward A, Fan S, Kydd J, Lofgren H, Morrison J, Poulton C, Rao N, Smith L, Tschale H, Thorat S, UreyI and Wobst P. 2004a. Institutions and policies for pro-poor agricultural growth. Development Policy Review22(6): 611-622.
Dorward A, Kydd J, Morrison J and Poulton C. 2005. Institutions, markets and economic development:Linking development policy to theory and praxis. Development and Change 36(1): 1-25.
Dorward A, Kydd J, Morrison J and Uray I. 2004b. A policy agenda for pro-poor agricultural growth. WorldDevelopment 32(1): 73-89.
Dorward A, Poole N, Morrison J, Kydd J and Uray I. 2003. Markets, institutions and technology: Missinglinks in livelihoods analysis. Development Policy Review 21(3): 319-332.
Fafchamps M. 2004. Market institutions in sub-Saharan Africa. Cambridge, MA: MIT Press.
Fafchamps M and Minten B. 1999. Relationships and traders in Madagascar. Journal of Development Studies35(6): 1-35.
Fafchamps M and Hill RV. 2005. Selling at the farmgate or traveling to the market. American Journal ofAgricultural Economics 87(3): 717-734.
Gabre-Madhin EZ. 2001. Market institutions, transaction costs, and social capital in the Ethiopian grainmarket. IFPRI Research Report 124. Washington DC: International Food Policy Research Institute.
Halloway G and Ehui S. 2002. Expanding market participation among smallholder livestock producers. ILRISocioeconomic and Policy Research, Working paper 48. Nairobi, Kenya: International Livestock ResearchInstitute.
Job452Textfinal.p65 1/24/2007, 4:19 PM30
31
Hoff K. 2001. Beyond Rosenstein-Rodan: The modern theory of coordination problems in development inProceedings of the Annual World Bank Conference on Development Economics (Boris P and Stern N, eds.).Washington, DC: The World Bank. http://www.wye.ic.ac.uk/AgEcon/ADU/research/projects/farmorg/fosumjul.doc
Hussi P, Murphy J, Lindberg O and Breneeman L. 1993. The development of cooperatives and other ruralorganizations. Technical Paper No 199. Washington DC: The World Bank.
Jayne TS and Jones S. 1997. Food marketing and pricing policy in Eastern and Southern Africa: A survey.World Development 25(9): 1505-1527.
Jayne TS, Govereh J, Mwavumo A, Nyoro JK and Chapoto A. 2002. False promise or false premise? Theexperience of food and input market reform in Eastern and Southern Africa. World Development 30(11): 1967-1985.
Johnson N and Berdegue JA. 2004. Property rights, collective action and agribusiness. 2020 Focus 11, Brief13. Washington DC: International Food Policy Research Institute (IFPRI).
Johnson N, Ravnborg HM, Westermann O and Probst K. 2002. User participation in watershed managementand research. Water Policy 3(6): 507-520.
Jones R, Freeman HA and Monaco GL. 2002. Improving the access of small farmers in Eastern and SouthernAfrica to global pigeonpea markets. Agricultural Research and Extension Network Paper 120. London:Overseas Development Institute. http:/www.odi.org.uk/agren/.
Kelly V, Adesina AA and Gordon A. 2003. Expanding access to agricultural inputs in Africa: A review of recentmarket development experience. Food Policy 28(4): 379-404.
Kerr J, Pangare G and Lokur V. 2002. Watershed development projects in India. IFPRI Research Report 127.Washington DC: International Food Policy Research Institute.
Key N, Sadoulet E and de Janvry A. 2000. Transaction costs and agricultural household supply response.American Journal of Agricultural Economics 82: 245-259.
Kherallah M, Delgado C, Gabre-Madhin E, Minot N and Johnson M. 2000. The road half traveled:Agricultural market reform in sub-Saharan Africa. Food Policy Report. Washington DC: International FoodPolicy Institute.
Kindness H and Gordon A. 2001. Agricultural marketing in developing countries: The role of NGOs andCBOs. Policy Series No. 13. Social and Economic Development Department, Natural Resources Institute,University of Greenwich.
Kirkpatrick C and Maimbo SM. 2002. The implications of the evolving microfinance agenda for regulatoryand supervisory policy. Development Policy Review 20(3): 293-304.
Kranton RE. 1996. Reciprocal exchange: A self-sustaining system. American Economic Review 86(4): 830-851.
Kydd J and Dorward A. 2004. Implications of market and coordination failures for rural development in leastdeveloped countries. Journal of International Development 16: 951-970.
Lele U. 1981. Cooperatives and the poor: A comparative perspective. World Development 9(1): 55-72.
Lele U and Christiansen RE. 1989. Markets, marketing boards, and cooperatives in Africa: Issues inadjustment policy. Managing Agricultural Development in Africa (MADIA) Discussion Paper II. WashingtonDC: World Bank.
Manyara MK. 2003. The development of cooperative law and policy in Kenya. Nairobi: Oscan Print.
Marshall G. 1998. A dictionary of sociology. New York, NY: Oxford University Press.
McCarthy N, Dutilly-Diané C and Drabo B. 2002. Cooperation, collective action and natural resourcesmanagement in Burkina Faso: A methodological note. CAPRi Working Paper No. 27. Washington DC:International Food Policy Research Institute.
Job452Textfinal.p65 1/24/2007, 4:19 PM31
32
Mude A. 2006. Weaknesses in institutional organization: Explaining the performance of Kenya’s coffeecooperatives. Paper presented at the 26th IAAE conference, 12-18 August, Brisbane, Australia.
North DC. 1990. Institutions, institutional change and economic performance. Cambridge: CambridgeUniversity Press.
Place F, Kariuki G, Wangila J, Kristjanson P, Makauki A and Ndubi J. 2002. Assessing the factorsunderlying differences in group performance: Methodological issues and empirical findings from the highlandsof central Kenya. CAPRi Working Paper No. 25. Washington DC. International Food Policy Research Institute.
Poulton C, Kydd J and Dorward A. 2006. Overcoming market constraints on pro-poor agricultural growth insub-Saharan Africa. Development Policy Review 24(3): 243-277.
Poulton C, Dorward A and Kydd J. 1998. The revival of smallholder cash crop in Africa: public and privateroles in the provision of finance. Journal of International Development 10(1): 85-103.
Republic of Kenya. 2004. Kenya gazette supplement No. 17, Bill no. 5. Nairobi: Government Printer.
Republic of Kenya. 2000. Second report on poverty in Kenya, Vol. ii. Poverty and social indicators. Nairobi:Ministry of Planning and National Development.
Rondot P and Collion M. 1999. Agricultural producer organizations: Their contribution to rural capacitybuilding and poverty reduction. Summary of a workshop, June 28-30, Washington DC. Rural DevelopmentDepartment, World Bank.
Runge CF. 1981. Common property externalities: Isolation, assurance and resource depletion in traditionalgrazing context. American Journal of Agricultural Economics 63(4): 595-606.
Staal S, Delgado C and Nicholson C. 1997. Smallholder dairying under transaction costs in East Africa. WorldDevelopment 25(5): 779-794.
Stockbridge M, Dorward A and Kydd J. 2003. Farmer organizations for market access: Briefing paperpresented at Stakeholders Meeting on Farmer Organizations in Malawi. 18-19 June 2003, Kalikuti Hotel,Lilongwe, Malawi. http://www.cphp.uk.com/uploads/disseminations/R8275%20040516%20Bfg%20Paper%20FO%20for%20market%20access.pdf
Stringfellow R, Coulter J, Lucey T, McKone and Hussain A. 1997. Improving access of smallholders toagricultural services in sub-Saharan Africa: Farmer cooperation and the role of donor community. NaturalResource Perspectives, No 20. London: Overseas Development Institute.
White TA and Runge CF. 1995. The emergence and evolution of collective action: Lessons from watershedmanagement in Haiti. World Development 23(10): 1683-1698.
Winter-Nelson A and Temu A. 2002. Institutional adjustment and transaction costs: Product and input marketsin the Tanzania coffee system. World Development 30(4): 561-574.
Wolf T. 1986. State intervention at the cabbage-roots: A case study from Kenya. IDS Bulletin 17, No. 1: 47-50.
World Bank. 1995. Empowering farmers in sub-Saharan Africa: Best practices. Findings, Africa Region,Number 33. www.worldbank.org/afr/findings/english/find33.htm.
World Bank. 2002a. World development report 2002: Building institutions for markets. New York: OxfordUniversity Press.
World Bank. 2002b. From action to impact: The Africa region’s rural strategy. Washington DC: The WorldBank, Rural Development Operations, the Africa Region. http://www-wds.worldbank.org/servlet/WDSContentServer/WDSP/IB/2002/08/09/000094946-020072604210882/Rendered/PDF/multi0page.pdf.
World Bank. 2003. World development report 2003: Sustainable development in a dynamic world. New York:Oxford University Press.
Job452Textfinal.p65 1/24/2007, 4:19 PM32
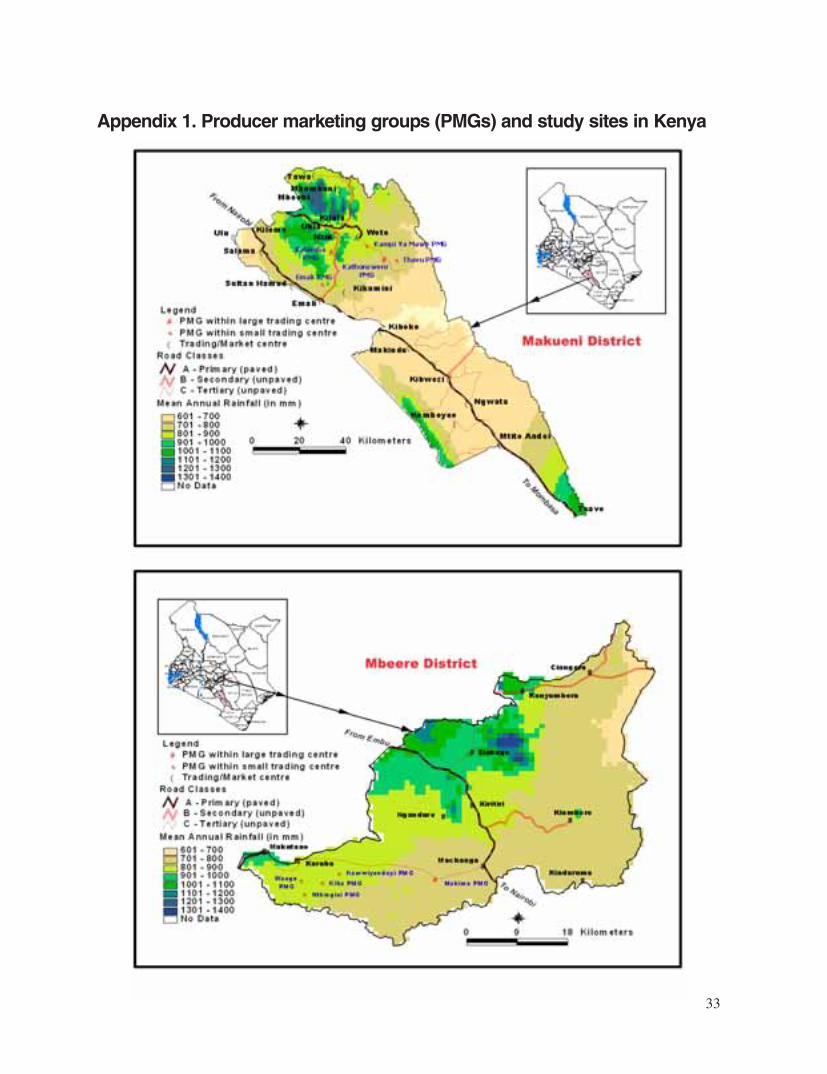
33
Appendix 1. Producer marketing groups (PMGs) and study sites in Kenya
Job452Textfinal.p65 1/24/2007, 4:19 PM33
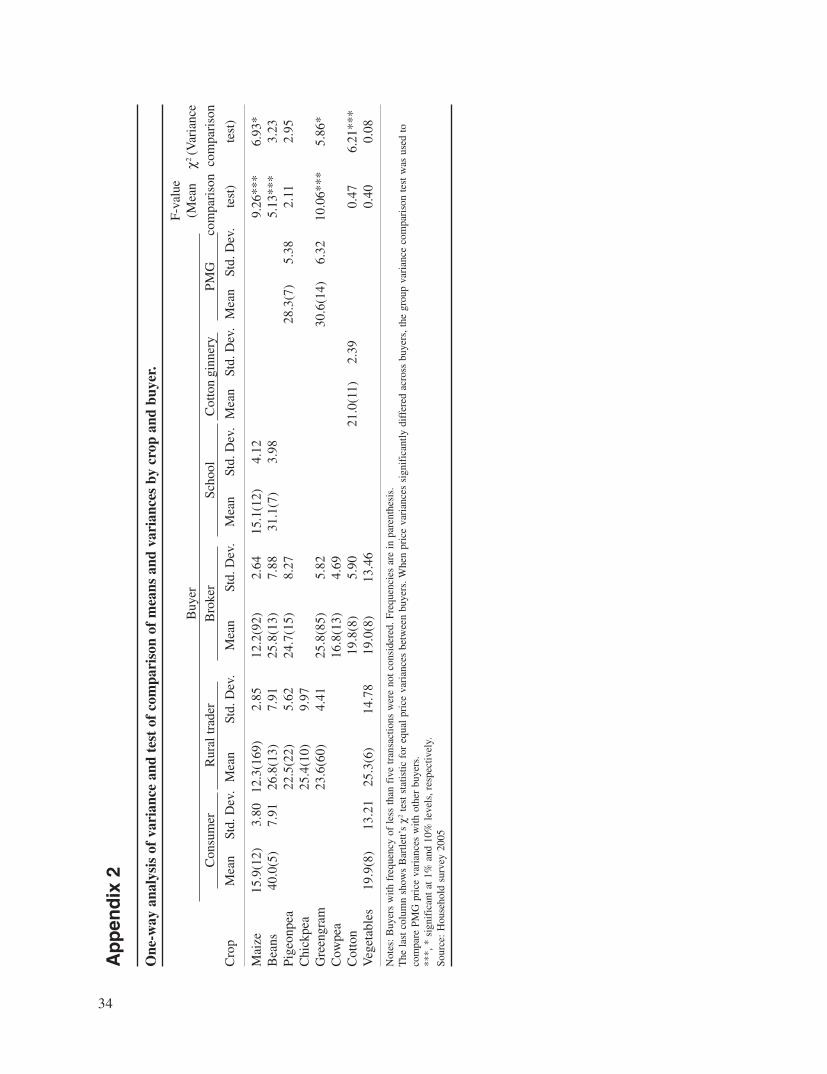
34
One
-way
ana
lysi
s of
var
ianc
e an
d te
st o
f co
mpa
riso
n of
mea
ns a
nd v
aria
nces
by
crop
and
buy
er.
F-va
lue
Buy
er(M
ean
χ2 (V
aria
nce
Con
sum
erR
ural
trad
erB
roke
rSc
hool
Cot
ton
ginn
ery
PM
Gco
mpa
riso
nco
mpa
riso
n
Cro
pM
ean
Std.
Dev
.M
ean
Std.
Dev
.M
ean
Std.
Dev
.M
ean
Std.
Dev
.M
ean
Std.
Dev
.M
ean
Std.
Dev
.te
st)
test
)
Mai
ze15
.9(1
2)3.
8012
.3(1
69)
2.85
12.2
(92)
2.64
15.1
(12)
4.12
9.26
***
6.93
*B
eans
40.0
(5)
7.91
26.8
(13)
7.91
25.8
(13)
7.88
31.1
(7)
3.98
5.13
***
3.23
Pige
onpe
a22
.5(2
2)5.
6224
.7(1
5)8.
2728
.3(7
)5.
382.
112.
95C
hick
pea
25.4
(10)
9.97
Gre
engr
am23
.6(6
0)4.
4125
.8(8
5)5.
8230
.6(1
4)6.
3210
.06*
**5.
86*
Cow
pea
16.8
(13)
4.69
Cot
ton
19.8
(8)
5.90
21.0
(11)
2.39
0.47
6.21
***
Veg
etab
les
19.9
(8)
13.2
125
.3(6
)14
.78
19.0
(8)
13.4
60.
400.
08
Not
es:
Buy
ers
with
fre
quen
cy o
f le
ss t
han
five
tra
nsac
tions
wer
e no
t co
nsid
ered
. Fre
quen
cies
are
in
pare
nthe
sis.
The
las
t co
lum
n sh
ows
Bar
tlett’
s χ2
test
sta
tistic
for
equ
al p
rice
var
ianc
es b
etw
een
buye
rs. W
hen
pric
e va
rian
ces
sign
ific
antly
dif
fere
d ac
ross
buy
ers,
the
gro
up v
aria
nce
com
pari
son
test
was
use
d to
com
pare
PM
G p
rice
var
ianc
es w
ith o
ther
buy
ers.
***,
* s
igni
fica
nt a
t 1%
and
10%
lev
els,
res
pect
ivel
y.So
urce
: H
ouse
hold
sur
vey
2005
Ap
pen
dix
2
Job452Textfinal.p65 1/24/2007, 4:19 PM34

35
Job452Textfinal.p65 1/24/2007, 4:19 PM35

36
Job452Textfinal.p65 1/24/2007, 4:19 PM36

CYAN MAGENTA YELLOW BLACK
Citation: Shiferaw B, Obare G and Muricho G. 2006. Rural institutions and producer organizations in imperfectmarkets: Experiences from Producer Marketing Groups in semi-arid eastern Kenya. CAPRi Working Paper 60. Alsojointly released as ICRISAT Socioeconomics and Policy Working Paper Series No. 23. Patancheru, Andhra Pradesh:International Crops Research Institute for the Semi-Arid Tropics. 40 pp. http://www.icrisat.org/gt-mpi/Publications/titlesearch.htm.
Titles in the Working Paper Series aim to disseminate information and stimulate feedback from the scientific community.A large number of simlar and informal publications, derived from ICRISAT’s socioeconomics and policy research,are also being distributed under various titles: Impact Series, Policy Briefs, Progress Reports, Discussion Papers, andOccasional Papers.
Abstract
Many countries in sub-Saharan Africa have liberalized markets to improve efficiency and enhance market linkages forsmallholder farmers. The expected positive response by the private sector in areas with limited market infrastructurehas however been disappointing. The functioning of markets is constrained by high transaction costs and coordinationproblems along the production-to-consumption value chain. New kinds of institutional arrangements are needed toreduce these costs and fill the vacuum left when governments withdrew from markets in the era of structural adjustments.One of these institutional innovations has been the strengthening of producer organizations and formation of collectivemarketing groups as instruments to remedy pervasive market failures in rural economies. The analysis presented herewith a case study from eastern Kenya has shown that while collective action – embodied in Producer MarketingGroups (PMGs) – is feasible and useful, external shocks and structural constraints that limit the volume of trade andaccess to capital and information require investments in complementary institutions and coordination mechanisms toexploit scale economies. The effectiveness of PMGs was determined by the level of collective action in the form ofincreased participatory decision making, member contributions and initial start-up capital. Failure to pay on delivery,resulting from lack of capital credit, is a major constraint that stifles PMG competitiveness relative to other buyers.These findings call for interventions that improve governance and participation; mechanisms for improving access tooperating capital; and effective strategies for risk management and enhancing the business skills of the PMGs.
About ICRISAT
The semi-arid tropics (SAT) encompass parts of 48 developing countries including most of India,parts of Southeast Asia, a swathe across sub-Saharan Africa, much of southern and eastern Africa,and parts of Latin America. Many of these countries are among the poorest in the world.Approximately one sixth of the world’s population lives in the SAT, which is typified byunpredictable weather, limited and erratic rainfall and nutrient-poor soils.
ICRISAT’s mandate crops are sorghum, pearl millet, chickpea, pigeonpea and groundnut – fivecrops vital to life for the ever-increasing populations of the SAT. ICRISAT’s mission is to conductresearch that can lead to enhanced sustainable production of these crops and to improvedmanagement of the limited natural resources of the SAT. ICRISAT communicates information ontechnologies as they are developed through workshops, networks, training, library services andpublishing.
The International Crops Research Institute for the Semi-Arid Tropics (ICRISAT) is a non-profit,non-political organization belonging to the Alliance of Centers supported by the ConsultativeGroup on International Agricultural Research (CGIAR). Established in 1972, ICRISAT generatesand shares cutting edge technologies that support the livelihoods of more than 300 million people -the poorest of the poor in semi-arid areas of the developing world.
©2006 by the International Crops Research Institute for the Semi-Arid Tropics
All rights reserved. Except for quotations of short passages for the purposes of criticism or review, no part of this publication may be reproduced,stored in retrieval systems, or transmitted in any form or by any means, electronic, mechanical, photocopying, recording or otherwise, withoutprior permission from ICRISAT. It is hoped this copyright declaration will not diminish the bona fide use of research findings in agriculturalresearch and development.
Résumé
De nombreux pays de l’Afrique au Sud du Sahara ont libéralisé leur marché dans le but d’améliorer l’efficacité et derenforcer les liens commerciaux entre les petits exploitants agricoles. La réponse positive que le secteur privé attenddans les régions où les infrastructures commerciales sont limitées, n’a cependant pas été celle espérée. Le fonctionnementdu marché est limité par les coûts de transaction élevés et par des problèmes de coordination qui se posent tout au longde la chaîne de valeur production-consommation. Dans cette période d’ajustement structurel, de nouveaux typesd’arrangements institutionnels sont nécessaires pour réduire ces coûts et pour combler le vide laissé par le retrait dugouvernement des marchés. L’une de ces innovations institutionnelles a consisté à renforcer les associations deproducteurs et la formation de coopératives de commercialisation qui serviront d’instruments permettant de pallier leslacunes découlant de l’ouverture du marché, dans les économies de type rural. L’analyse présentée – en l’occurrenceune étude de cas du Kenya oriental – a montré que les chocs externes et les contraintes structurelles qui limitent levolume des échanges commerciaux et l’accès au capital et à l’information, nécessitent des investissements dans desinstitutions complémentaires et des mécanismes de coordination de manière à réaliser les économies de marché, mêmesi l’action collective – incarnée par les coopératives de commercialisation des producteurs (PMG) – est possible etutile. L’efficacité des PMG est déterminée par le niveau d’action collective, qui prend la forme d’une prise de décisionparticipative et accrue, par les cotisations des membres et par le capital initial de démarrage. L’incapacité à payer à lalivraison, du fait du manque de crédits importants, est une contrainte majeure qui entrave la compétitivité des groupesde commercialisation des producteurs par rapport aux autres acheteurs. Ces constats nécessitent : des interventionspermettant d’améliorer la gouvernance et la participation ; des mécanismes visant à faciliter l’accès au fondsd’exploitation ; des stratégies efficaces pour la gestion des risques et le renforcement des compétences des coopérativesdans le domaine de la pratique des affaires.
Job452Coverfinal.p65 1/24/2007, 5:10 PM2

CYAN MAGENTA YELLOW BLACK
Bekele Shiferaw, Gideon Obare
and Geoffrey Muricho
International Crops Research Institute for the Semi-Arid Tropics
ICRISAT
International Crops Research Institute for the Semi-Arid TropicsPatancheru 502 324, Andhra Pradesh, India
www.icrisat.org
452-2006
Working Paper Series no. 23
Socioeconomics and Policy
Rural Institutions and Producer Organizationsin Imperfect Markets:
Experiences from Producer Marketing Groups inSemi-Arid Eastern Kenya
®
Job452Coverfinal.p65 1/24/2007, 5:10 PM1