Embed Size (px)
Citation preview

WORKING PAPER
NO. 13
ENHANCING THE LIVELIHOODS OF
THE RURAL POOR THROUGH ICT: A KNOWLEDGE MAP
South Africa Country Study
June 2008
WORKING PAPER NO. 13, 2008
About infoDev's working papers series:
These short papers represent work commissioned by infoDev that has not been through infoDev's peer review and formal publication processes. infoDev makes such reports available as informal 'working papers' to share information or ideas about a given topic, in case doing so may be of any interest or utility to practitioners working in related fields.
Information and communication
technologies (ICTs), appropriately
adapted, help improve
the livelihoods of poor individuals,
families and communities in rural
areas and increase their income
opportunities, thereby improving
their chances of escaping from
persistent poverty. This Knowledge
Map helps understand what we
know, both from research and from
experience in the field, and what
do donor staff and their country
counterparts most urgently need
to know about these issues. In
addition, it provides
recommendations on the use and
role of ICT in enhancing
the livelihoods of the rural poor.

WORKING PAPER NO. 13, 2008
ENHANCING THE LIVELIHOODS OF THE
RURAL POOR THROUGH ICT:
A KNOWLEDGE MAP
South Africa Country Report
June 2008
Prepared by:
Louis Fourie
Edited by:
Kerry McNamara
Table of Contents
List of Tables ........................................................................................... Error! Bookmark not defined.
List of Figures ......................................................................................... Error! Bookmark not defined.
Acronyms ................................................................................................ Error! Bookmark not defined.
Executive Summary ................................................................................ Error! Bookmark not defined.
I. Introduction ..................................................................................... Error! Bookmark not defined.
I.1 Research team ...................................................................... Error! Bookmark not defined.
I.2 Research questions and methods ......................................... Error! Bookmark not defined.
I.3 Limitations ............................................................................. Error! Bookmark not defined.
I.4 Data collection method .......................................................... Error! Bookmark not defined.
I.5 Outputs .................................................................................. Error! Bookmark not defined.
II. Background on South Africa .......................................................... Error! Bookmark not defined.
II.1 Population ............................................................................. Error! Bookmark not defined.
II.2 Economy ............................................................................... Error! Bookmark not defined.
II.3 Economic development indicators ......................................... Error! Bookmark not defined.
II.4 ICTs in South Africa ............................................................... Error! Bookmark not defined.
II.5 Universal access through information/telecommunications centresError! Bookmark not
defined.
III. Problem Statement .......................................................................... Error! Bookmark not defined.
IV. Findings: Priority Knowledge Needs of Key Stakeholder GroupsError! Bookmark not defined.
IV.1 Priority needs and role of donors ........................................... Error! Bookmark not defined.
IV.2 Priority needs and roles of national-level policy makers ......... Error! Bookmark not defined.
IV.3 Priority needs and roles of technology providers ................... Error! Bookmark not defined.
IV.4 Priority needs and roles of CSOs and media ......................... Error! Bookmark not defined.
IV.5 Priority needs and roles of end users/beneficiaries ................ Error! Bookmark not defined.
V. General Findings and Priority Knowledge Needs ......................... Error! Bookmark not defined.
V.1 Key themes ........................................................................... Error! Bookmark not defined.
V.2 General findings .................................................................... Error! Bookmark not defined.
VI. Conclusions..................................................................................... Error! Bookmark not defined.
VI.1 Improvement of the livelihoods of the rural poor through ICTs Error! Bookmark not defined.
VI.2 Existing knowledge and lessons learnt from the field ............. Error! Bookmark not defined.

VI.3 Further research and analysis for informed policy and investmentError! Bookmark not
defined.
VI.4 A final word ............................................................................ Error! Bookmark not defined.
VII. Recommendations .......................................................................... Error! Bookmark not defined.
List of sources ........................................................................................ Error! Bookmark not defined.
Annexes
Annex l: Household Survey (ICT Active and Inactive Users) ............... Error! Bookmark not defined.
Annex 2: Semi-structured Questionnaire/Interview Guide 1 ................ Error! Bookmark not defined.
Annex 3: Semi-structured Questionnaire/Interview Guide 2 ................ Error! Bookmark not defined.
Annex 4: List of Interviewees ................................................................. Error! Bookmark not defined.
Annex 5: Country Workshop Report ..................................................... Error! Bookmark not defined.
Annex 6: Sample Frame ......................................................................... Error! Bookmark not defined.
Annex 7: 2006 Mid-year Population Estimates for SA .......................... Error! Bookmark not defined.
Annex 8: South African Tax Revenue Changes in Source ................... Error! Bookmark not defined.
Annex 9: Household Income as Per Capita Income ............................. Error! Bookmark not defined.
Annex 10: Unemployment by Province ................................................. Error! Bookmark not defined.
Annex 11: Summary of Labour Market Outcomes for 1995-2003 ........ Error! Bookmark not defined.
Annex 12: South Africa’s Human Development Index 2004 ................. Error! Bookmark not defined.
Annex 13: Selected Indicators of Human Poverty for South Africa .... Error! Bookmark not defined.
Annex 14: SA Government Holdings in the ICT sector ........................ Error! Bookmark not defined.
Annex 15: Coverage of Cell Phone Providers ....................................... Error! Bookmark not defined.
Annex 16: Private Radio Stations .......................................................... Error! Bookmark not defined.
Annex 17: Community Radio Broadcasting .......................................... Error! Bookmark not defined.
Annex 18: Press Groups and News Agencies ...................................... Error! Bookmark not defined.
Annex 19: Biggest Weekly and Daily Newspapers July-December 2005Error! Bookmark not
defined.
Annex 20: MPCC Stakeholders .............................................................. Error! Bookmark not defined.
Annex 21: MPCC Numbers and Estimated Population Served ............ Error! Bookmark not defined.
Annex 22: Telecentres by Province ....................................................... Error! Bookmark not defined.
Annex 23: Cyberlabs in South Africa .................................................... Error! Bookmark not defined.
Annex 24: PITs by Province and Coverage ........................................... Error! Bookmark not defined.
Annex 26: Public Libraries ..................................................................... Error! Bookmark not defined.
Annex 27: Socioeconomic Impact/Benefits of Mobile Phones ............ Error! Bookmark not defined.
Annex 28: Findings of Field Visit 1: Kannaland .................................... Error! Bookmark not defined.

Annex 29: Findings of Field Visit 2: Kopanong .................................... Error! Bookmark not defined.
Annex 30: Case Study: Thusong Service Centres (MPCCs) ................ Error! Bookmark not defined.
Annex 31: Case Study: PITs ................................................................... Error! Bookmark not defined.

List of Tables
Table 1: Population and land area by province .................................... Error! Bookmark not defined.
Table 2: Social grants for 2006 .............................................................. Error! Bookmark not defined.
Table 3: Licensees according to Telecommunications Amendment Act of 2001Error! Bookmark
not defined.
Table 4: South African newspaper market (2006) ................................. Error! Bookmark not defined.
Table 5: International donor organisations ........................................... Error! Bookmark not defined.
Table 6: International donors' needs ..................................................... Error! Bookmark not defined.
Table 7: Local donors' needs ................................................................. Error! Bookmark not defined.
Table 8: Needs of national, provincial and local-level policymakers .. Error! Bookmark not defined.
Table 9: Needs of technology providers ............................................... Error! Bookmark not defined.
Table 10: Needs of beneficiaries ............................................................ Error! Bookmark not defined.
Table 11: Key themes ............................................................................. Error! Bookmark not defined.
List of Figures
Figure 1: Population by race .................................................................. Error! Bookmark not defined.
Figure 2: HDI figures for SA for period 1975 to 2004 ............................ Error! Bookmark not defined.
Figure 3: Comparison of household access to telephone communicationsError! Bookmark not
defined.
Figure 4: Market share by mobile communication network operator . Error! Bookmark not defined.
Figure 5: Provision of CSTs by cellular telephone service provider (2005)Error! Bookmark not
defined.
Figure 6: Household access to computers and internet ...................... Error! Bookmark not defined.
Acronyms
ADB Asian Development Bank ASGISA Accelerated and Shared Growth Initiative of South Africa CBO Community-based organization CIDA Canadian International Development Agency CPO Citizens' Post Office CSO Civil society organization CST Community service telephone DFID UK Department for International Development DM District municipality DoCWILs Department of Communication Web Internet Laboratories FGD Focus group discussion GDP Gross domestic product GCIS Government Communication and Information Services GNI Gross national income GTZ German Technical Cooperation HDI Human Development Index HPI Human Poverty Index HIV/AIDS Acquired Human Immuno-Deficiency Virus/Syndrome ICASA Independent Communication Authority of South Africa ICT Information and communication technology IDRC International Development Research Centre ISP Internet service provider LED Local economic development LM Local municipality MPCC Multi-purpose Community Centre NEMISA National Electronic Media Institute of South Africa NGO Non-governmental organization PIT Public Information Terminal PSTN Public switched telephone network SABC South African Broadcasting Corporation SALGA South African Local Government Association SAPA South African Press Association SAPO South Africa Post Office SMME Small, medium and micro enterprise UNCTAD UN Conference on Trade and Development UNDP UN Development Program USAASA Universal Service and Access Agency of South Africa USAID US Agency for International Development USAL Under-serviced area licences VANS Value-added network services VoIP Voice over Internet Protocol VSAT Very small aperture terminal

Executive Summary
The biggest challenge faced by South Africa for the new millennium, as for any other developing nation, is successfully resolving poverty and human development problems. Although different opinions exist as to the extent of the role of Information and Communication Technologies (ICTs) in achieving these objectives, they form an integral component of any socio-economic development strategy. ICTs include a range of technologies, and facilitate communication, processing and transmission of information by electronic means. Both traditional ICTs, such as conventional radio, landline telephones, newspapers, TV and libraries, and new ICTs such as mobile phones, landline computers, the Internet and fax, are included in this report. As ICTs are by definition a means of communication and information sourcing and manipulation, it is important to include traditional information source institutions, such as libraries and post offices, in areas where the general level of access to ICT is still growing. Libraries are often well placed and accessible for members of the community, forming logical deployment points for ICT facilities. Both types of ICTs need to be promoted in order to narrow the digital divide between urban and rural societies.
This report contains the main findings of research performed on the impact of ICTs in enhancing the livelihoods of the rural poor in South Africa. After a brief introduction to the research team, the research questions, and methodology, the report looks at the background of South Africa in general, focusing on population, economy, economic development indicators and rural ICTs. In particular, the problems that South Africa faces with regard to ICTs in rural areas are highlighted. The report presents the research findings according to the various stakeholders: (i) donors; (ii) national policymakers; (iii) technology providers (iv) civil society organizations (CSOs); (v) the media; and (vi) beneficiaries or end-users. In each case, the report focuses on stakeholders' needs, priorities and roles. The last part of the main report describes the general findings of the research, and contains some conclusions and recommendations. The annexes include the main findings of a national workshop organized in Cape Town on March 29, 2007. Two separate reports present two different case studies.
Based on the above inputs, the main findings of the research are that all stakeholders acknowledge the positive impact that ICTs can have on the livelihoods of the rural poor. ICTs help them in their daily lives, specifically when it comes to practical matters like telecommunications and access to information. They also increase empowerment and giving voice to rural communities. The key lessons to be learned are that ICT projects need to be sustainable, self-managed and able to be appropriated by local communities. This can only be achieved by implementing community-generated initiatives with the assistance of other stakeholders. The field surveys among end–users/beneficiaries shed some light on the purpose, usage, ownership, availability, access points and frequency of use of ICTs among the rural poor in South Africa. Interviews with end-user/beneficiaries also focused on methods used for communication with and by government. Local government’s role as facilitator – along with the accessibility, affordability and availability of ICTs – is a factor influencing the success rate of a sustainable project. A lack of local capacity, ability and infrastructure causes major problems in rural projects. Community participation is crucial for sustainable ICT initiatives. Similarly, the successful coordination and involvement of different stakeholders is crucial in order to have an impact on the livelihoods of the rural poor of South Africa. The unique needs and character of each community make it difficult to multiply these initiatives.

Technology is not the real challenge. The human factor remains the greatest barrier to development and the major reason for project failures. ICTs need to be available, affordable and accessible to the rural poor. ICTs can assist by helping the rural poor in their daily life, by giving them a voice and by increasing their empowerment – but this needs to be carefully planned, implemented and managed. Recommendations are made for further research, both qualitative and quantitative, regarding the role of ICT for the South African population, whether urban poor or rural poor. This information is needed by all players. A central repository and portal is necessary, where all relevant information and research can be made available to the different players. The alignment of existing policies among the different levels of government and other stakeholders are a main concern and should be addressed. Policies need to be renewed much faster, and duplication and 'silo' thinking has to be eliminated. Training and transfer of ICT skills to the rural poor of South Africa and an awareness campaign with regard to the benefits and potential of ICT to improve their livelihoods, is essential. Case study examples must be made available to the rural poor, and training should be provided in the application of ICT as a tool to improve socio-economic conditions. At a project level, the need exists for professional trained project mangers to oversee ICT and poverty reduction projects. Best practices must be shared among the different organizations. An independent central coordinating body for socio-economic projects needs to be established, to coordinate resources on a national basis. ICTs are a driver and an enabler, enhancing livelihoods for the rural poor, enabling socio-economic development and empowering the rural poor with a voice to say:
I Conquer Tomorrow!

I. Introduction
I.1 Research team
The research was undertaken by Louis Fourie Consultants, using a team made up of the following people: Prof Louis C H Fourie Research team leader Ms Trunel van der Westhuizen Field consultant Ms Elmarie Maree Field consultant Mr Nico Elema Sampling and GIS consultant
I.2 Research questions and methods
It is widely accepted that ICTs play an important role in the enhancement of social economic conditions. However, the role of ICTs in enhancing the livelihoods of the rural poor needs more research in order to determine real successes and failures. This study endeavors to answer the following questions:
i. How can the implementation of ICTs improve the livelihoods of the rural poor – individuals, families and communities – to increase income opportunities and escape persistent poverty?
ii. What is the existing knowledge and what lessons can donors and their country counterparts learn, both from research and from experience in the field, with regard to previous ICT experiences on livelihoods in rural areas?
iii. Which elements most urgently require further research and analysis in order to lay the basis for informed policy and investment by donors, governments and other players?
Research approach
The research started with a literature review in order to become familiar with studies carried out on similar or related subjects. This allowed the team to become well informed on the research area and enabled members of the research team to understand the existing body of knowledge. The empirical research used both quantitative and qualitative methods in order to establish which policies, institutional arrangements and intervention processes provide ICT access in rural areas. It also determined success stories – and failures – that best enhanced the livelihoods of the rural poor.
Population and Sample
The target population for this research project was the rural poor of South Africa’s nine provinces. Owing to time limitations and distances, a purposive sample of two municipal districts was drawn from this population: (i) Eden District Municipality (DM) in the Western Cape; and (ii) Xhariep DM in the Free State Province. The Human Development Index (HDI) and Human Poverty Index (HPI) for provinces, districts and municipalities, as well as the list of priority areas for economic development, were used as sampling frames for the selection of municipal districts. Refer to Annex 6 for the relevant detailed information. The local municipalities (LM) of Kannaland (Eden DM) and Kopanong (Xhariep DM) were identified by using: (i) HDI figures; (ii) the Project Consolidate campaign – a central government initiative to assist the poorest municipal areas; and (iii) the recommendations of directors of housing and local economic development officers from the respective municipalities. Two towns – Zoar (Kannaland LM Ward 1) and Springfontein (Kopanong LM Ward 5) – were selected using the same methodology. Households were selected by using systematic random sampling to ensure geographical spread and an equal chance of selection, thus avoiding sampling bias.

Two national projects – a the Multipurpose Community Center (MPCC) and the Personal Information Terminals (PIT) projects – were studied in all nine provinces (see case studies, Annexes 30 and 31).
I.3 Limitations
Due to time and funding limitations, a detailed investigation of ICT-active and ICT-inactive people within South Africa was not conducted. Efforts were concentrated on the sampled districts/towns from the Western Cape and the Free State only. The findings were not compared with the other seven provinces, except for the two case studies carried out across all nine provinces. Time constraints meant that interviews were conducted over a relatively short period of time. Therefore, the time horizon is cross-sectional rather than longitudinal.
I.4 Data collection method
Two field visits were made to the rural areas of: i. Kannaland LM (WC041) in Eden DM (DC4), situated in the Western Cape; and ii. Kopanong LM (FS162) in Xhariep DM (DC16), situated in the Free State.
Data were collected by means of personal interviews and focus groups, as defined below. Data for the two case studies and data with regard to role player needs was collected by telephone.
Structured questionnaire (quantitative survey)
A structured questionnaire, based on the questions stipulated in the terms of reference, was used to collect the quantitative data. The questionnaire was administered to households during 30 interviews per sampled town/ward in the Western Cape and the Free State, respectively. This instrument has the main goal of providing quantitative data. The questionnaire (Annex 1) covered the following themes:
i. Economic status of interviewees; ii. Access, use and ownership of ICTs (phone, TV, radio, mobile phone, the Internet, email); iii. Available ICT services; iv. Available infrastructure; v. Impact of ICTs on social and economic development; vi. Purpose for which ICTs are usually used.
Semi-structured questionnaire/Interview Guide 1
The purpose of this instrument was to collect qualitative information focusing on the predetermined research areas. An interview guide, or semi-structured questionnaire, was developed and was administered to key informants in the sampled districts. The key informants included: (i) the municipality, ward executives; (ii) village/town executives; and (iii) community organizations operating in villages or towns. Interviews with key informants were conducted on an individual basis and/or by means of a focus group discussion (FGD). The FGDs included a maximum of 20 selected key informants from the town/district, and a minimum of 15. Interview Guide 1 (Annex 2) had the main goal of providing qualitative data and touched on the following themes:
i. Living standards of the people in the village/ward/district; ii. ICT knowledge and literacy of FGD participants; iii. Usage of ICTs by the people in the village/ward/district; iv. Obstacles to accessing ICTs; v. Segmentation of the population accessing ICTs; vi. Benefits of ICTs; vii. Negative impact of ICTs; viii. Link between ICTs and livelihoods; ix. Suggestions for improved implementation of ICTs.

Semi-structured questionnaire/Interview Guide 2
A semi-structured questionnaire or Interview Guide 2 (Annex 3) was used to collect the second set of qualitative information. This instrument differs from Interview Guide 1 in that it gathers greater detail. Relevant stakeholders were interviewed by telephone. As noted earlier, Interview Guide 2 was developed to help with telephonic discussions. The research questions were drawn from the main work plan. Non-probability sampling techniques – purposive sampling – were used to select people/institutions for these interviews. The selection of institutions/organizations and government departments for the interviews was based on their level of activity and expertise in ICT usage and rural development. The list included representatives from government ministries and agencies, the donor community, academic institutions, the media, the private sector and CSOs. This instrument had the main goal of providing qualitative data about implementation, management and operational issues. The interviews dealt with the following areas:
i Management of projects; ii Stakeholders involved; iii Services provided; iv Sourcing of technology, content; v Project principles; vi Project impact; vii Policy issues addressed; viii Transfer of knowledge.
I.5 Outputs
The purpose of the interviews was to elicit descriptive examples of successes or failures from already implemented projects, which may reflect one of the three different categories of ICTs: (i) ITs; (ii) telecommunications technologies; and (iii) networking technologies. The data collected produced the outputs discussed in the following section.
Country report on South Africa’s ICT experience in rural areas
A country report and Power Point presentation were made on South African experiences from: (i) the empirical study in two districts; (ii) the quantitative end-user interviews; (iii) qualitative interviews with key stakeholders such as donors, policymakers, civil society, service providers, technology providers, academics, researchers and media; and (iv) the two national case studies. The report concludes with possible improvements for the rural poor by means of ICT.
Case studies
Two national ICT projects, the MPCC and PIT projects, were studied in all nine provinces and are presented as case studies in Annexes 30 and 31. In addition, case studies were made based on field trips to Kannaland and Kopanong.
National workshop
A national workshop with 31 participants was held in Cape Town to present the draft country report and main findings. Group discussions were held to discuss ICT challenges for rural livelihoods in South Africa. Three major facets were covered: (i) what we do know; (ii) what we don’t know; and (iii) what work is needed, or where donors can make a difference. See Annex 5 for the full report and input of the participants.

II. Background on South Africa
South Africa is two economies in one country. The first is advanced and skilled and is becoming more globally competitive; the second is mainly informal, marginalized, and unskilled. The benefits of the first economy have yet to reach the second economy. The latter could fall even further behind without decisive government intervention. The shape of the economy is changing, with the relative emphasis moving away from the primary and manufacturing sectors toward services or the tertiary sector. Political negotiations, leading to the first democratic elections in April 1994, marked a monumental political transformation (Horowitz, 1997), and radical restructuring of political, social, educational, cultural and economical sectors (Butcher, 1998). Previous policies were replaced with a set of policy positions addressing inequalities in every aspect of South African life.
II.1 Population
The 'rainbow' nation is estimated to hold over 47.4 million people with diverse origins, cultures, languages and beliefs. According to the mid-2006 estimates of statistics for South Africa, the population had increased to 47.4 million from the 44.8 million recorded in the 2001 census. More than 50% of the population lives in urban areas – there are a few major urban centers. Rural people migrate to towns in search of jobs, because rural areas are dry and arid and lack infrastructure. In 2001, 42% of the population could be classified as rural (SACN, 2004). Table 1 presents population figures, total population percentage and land area percentage by province:
Table 1: Population and land area by province
Total population, mid-2006 estimate (millions)
Percentage of total population
Percentage of total land area
KwaZulu-Natal 9.9 20.9 7.6
Gauteng 7.5 20.1 1.4
Eastern Cape 6.9 14.6 13.9
Limpopo 5.6 11.3 10.2
Western Cape 4.7 10 10.6
Mpumalanga 3.5 7.4 6.5
North West 3.4 7.1 9.5
Free State 2.9 6.2 10.6
Northern Cape 1 2.3 29.7
Source: Statistics South Africa (2006).
The population can be classified by population group as follows (Figure 1): African 37.7 million, white 4.4 million, colored 4.2 million, and Indian/Asian 1.2 million. Refer also to Annex 7 for a detailed breakdown of the population by gender and population group.
Figure 1: Population by race
9%
9% 3%
79%
Africans
White
Colored
Indian/Asian

Source: Statistics South Africa (2006).
II.2 Economy
South Africa’s economy, by far the largest in Africa, has a per capita GNI of US$3.63, which makes it part of the upper middle-income group of semi-industrialized economies of sub-Saharan Africa as classified by the World Bank. There are five million registered taxpayers and in the past four to six years the tax burden percentage has been at a stable 26% per capita (refer to Annex 8 for changes in tax revenues). Debt by household as a percentage of household income is 55%, with savings as low as 0.6% (SARB, 2006). Since 1994, South Africa has had an average positive economic growth rate of 3.2%. However, GDP per capita is not higher than it was 30 years ago. The government is spending around 27% of GDP and has an accumulated budget deficit of R508 billion,
of which 12.5% is international and 87.5% domestic (SARB, 2006). Government spending has changed
in the past few years, focusing more on socio-economic spending (www.sars.gov.za). Income support
to vulnerable households through social security and social assistance grants has been the fastest
growing category of government expenditure since 2001. It was R70 billion in 2005, representing 3.4% of
the GDP. Table 2 provides detail on beneficiaries by social grant for 2006:
Table 2: Social grants for 2006
Type of grant Number of beneficiaries 2001 2004
Child support grant More than 7 million (May 2006) 516,000 households 2,875,000 households
Foster care grant 330,000 (May 2006)
Disability grant 1.3 million 432,000 households 894,000 households
Old age grant More than 2 million 2,071,000 households 2,174,000 households
Source: South Africa Yearbook 2006/7and Statistics South Africa (2004: Labor Force Survey 2001 and 2004).
Statistics South Africa estimated that in 1995 about 28% of the households and 48% of the population were living below the estimated poverty line. This was calculated on the basis of expenditure, thus excluding access to services and assets This figure increased to 33% in 1999. According to SAARF (2005), 6.3 million or 60% of households are poor. These households contain roughly 28 million persons, or 62% of the 2005 population. Refer to Annex 9 for monthly per capita income information. The poorest 20% of the population showed an increase of 30% in real income terms between1994 and 2004. Social grants make up more than half of the income of the poorest 20% of households, doubling in real terms between 2000 and 2005. South Africa's economically active population is estimated at 16.8 million. Since 1995, the population has grown by an average of 2% annually, but the economically active population grew by an average of more than 4% annually. After accounting for job loss, the number of jobs has grown by 20% since 1995, but the economically active population has grown by 40% (South Africa Yearbook, 2006/7). The labor supply outperforms the demand – most of the labor force is unskilled. South Africa has an unemployment figure of over 26%, one of the highest rates of unemployment in the world (Statistics South Africa, 2006). Youths make up 70% of all unemployed persons, 46% of the working population, and 33% of the self-
employed (www.nyc.gov.za). Annex 10 presents provincial unemployment figures. Annex 11 presents a
summary of labor market outcomes between 1995 and 2003.

II.3 Economic development indicators
Economic development indicators clearly indicate that South Africa performs below average in almost all social indicators. It ranks 121 among 171 countries – it has a Human Development Index (HDI) of 0.653, which places it in a group of countries categorized as achieving 'medium human development' (UNDP, 2004). Figure 2 shows South Africa’s HDI figures for the period of 1975-2004. Despite the growing government socio-economic investment, the country has experienced a disquietingly sharp decrease in HDI since the transformation in 1994. Refer to Annex 12 for the detailed human development ranking and for the aspects of life expectancy, adult education and living standards that are included in this HDI figure.
Figure 2: HDI figures for South Africa for the period from 1975 to 2004
Source: UNDP (2004).
The country’s adult literacy (15 years and older) is 82.4%, GDP per capita is R23,403 (2006), and the combined gross enrolment ratio for primary, secondary and tertiary schools is 77%. South Africa has a life expectancy of 47 years, one of the lowest among upper middle-income countries. It has an HIV/AIDS infection rate of 20.1% among adults, with 4.9 million currently infected. South Africa is ranked 53 among 102 countries with a calculated Human Poverty Index (HPI) of 30.9. Refer to Annex 13 for a comparison of South Africa with other countries and the values of the variables. Despite numerous efforts by the government, South Africa is experiencing a widening development gap, which has led to even further increases in unemployment. A direct consequence of this growing unemployment is increased poverty at all levels of South African society. This has numerous socio-economic implications, such as loss of self-esteem, increase in suicide statistics, and increase in crime and violence.
II.4 ICTs in South Africa
A significant proportion of the population, due to historical factors and monopolistic policies, does not have equitable access to ICTs. In 2006, the government launched the Accelerated and Shared Growth Initiative of South Africa (ASGISA). A group of key factors affecting South Africa’s drive to achieve 6% economic growth were identified. The aim was set to halve unemployment and poverty by 2014. One of the factors identified was the cost of telecommunications, which in turn, determines accessibility to ICTs and economic growth.

Ownership of the ICT industry includes state-owned, para-statal and private, in the form of cooperatives, closed corporations and sole proprietors. The South African government’s role is not only as national-level policymaker, but also as a donor, technology provider and beneficiary. The government has partial ownership of the ICT sector through the following departments: (i) Department of Communication; (ii) Department of Public Service and Administration; and (iii) Department of Public Enterprise. The South African Post Office (SAPO) also plays a major role in providing access points for ICTs in rural areas. The Department of Science and Technology is involved in the research and development of ICTs. The Department of Trade and Industry is involved in trade and business development. The Departments of Labor and Education are involved in skill development. The Department of Communication oversees Telkom, SAPO, Sentech, the South African Broadcasting Corporation (SABC), the National Electronic Media Institute of South Africa (NEMISA), and the regulator – the Independent Communications Authority of South Africa (ICASA). Promotion of universal service and universal access – usually defined in terms of specific targets such as access to a phone within a certain traveling distance – is the underlying principle for the mobilization of South African telecommunications. This principle should ensure that the benefits of the information society do not flow only to particular sections of society. Therefore, the first objective of the Telecommunications Act 103 of 1996, as amended in 2001, was to facilitate a universal and affordable vision of telecommunication services (Benjamin, 2003). This act also mandates Universal Service – it authorizes the Access Agency of South Africa (USAASA) to roll out ICTs in South African under-serviced areas such as rural, peri-urban and underdeveloped townships.
Telecommunications
The South African government’s ownership in the telecommunications sector is huge, as can be seen in Annex 14. Table 3 shows a list of licensees around which the South African market is structured, according to the Telecommunications Amendment Act of 2001.
Table 3: Licensees according to Telecommunications Amendment Act of 2001
Public switched telephone network (PSTN) Telkom (currently only provider of public switched communications services)
Neotel (officially launched August 31, 2006) but not operational
Mobile communication network operators Vodacom MTN Cell C
Multimedia and international carrier-of-carriers Sentech
Under-serviced area licences (USAL) Provide for telecommunications services including (VoIP), fixed mobile services, public pay telephones and long-distance calls to be transported through trunk networks of any operator licensed to carry international traffic
Ilizwe Telecommunications (OR Tambo District) Amatole Telecommunications Services (Eastern
Cape) Bokone Telecoms (Capricorn District) Kingdom Communications (Kwazulu-Natal) Thinta Thinta Telecoms (Ugu District, Kwazulu-
Natal) Karabo Telecoms (North West) Bokamoso Consortium (Free State)
Value-added network services (VANS) 344 operational including 250 ISPs
Source: Lisa Thornton Inc (2006).
Telephone and cell phone A massive increase in household access to a landline telephone and/or a cell phone was recorded between 1996 and 2001. Whereas 2,562,345 households (28.64%) had access to a landline telephone
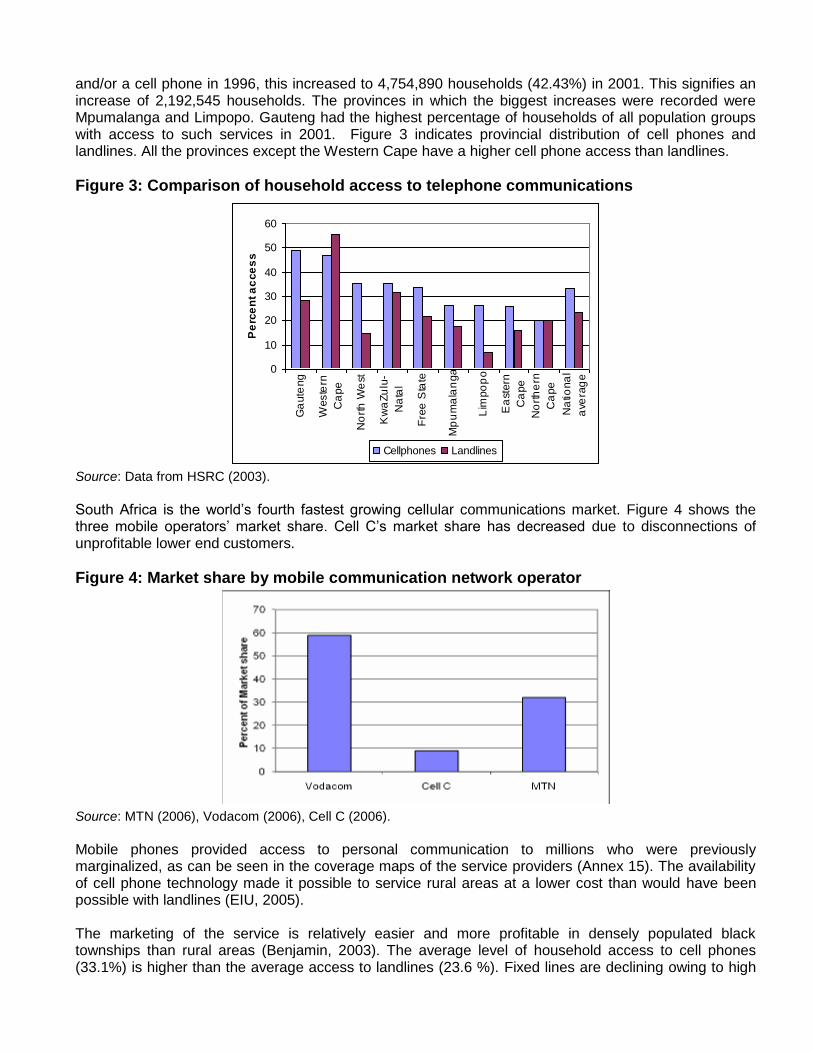
and/or a cell phone in 1996, this increased to 4,754,890 households (42.43%) in 2001. This signifies an increase of 2,192,545 households. The provinces in which the biggest increases were recorded were Mpumalanga and Limpopo. Gauteng had the highest percentage of households of all population groups with access to such services in 2001. Figure 3 indicates provincial distribution of cell phones and landlines. All the provinces except the Western Cape have a higher cell phone access than landlines.
Figure 3: Comparison of household access to telephone communications
0
10
20
30
40
50
60
Ga
ute
ng
Weste
rn
Ca
pe
No
rth
We
st
Kw
aZu
lu-
Na
tal
Fre
e S
tate
Mp
um
ala
nga
Lim
po
po
Ea
stern
Ca
pe
No
rth
ern
Ca
pe
Na
tiona
l
ave
rag
e
Pe
rce
nt a
cce
ss
Cellphones Landlines
Source: Data from HSRC (2003).
South Africa is the world’s fourth fastest growing cellular communications market. Figure 4 shows the three mobile operators’ market share. Cell C’s market share has decreased due to disconnections of unprofitable lower end customers.
Figure 4: Market share by mobile communication network operator
Source: MTN (2006), Vodacom (2006), Cell C (2006).
Mobile phones provided access to personal communication to millions who were previously marginalized, as can be seen in the coverage maps of the service providers (Annex 15). The availability of cell phone technology made it possible to service rural areas at a lower cost than would have been possible with landlines (EIU, 2005). The marketing of the service is relatively easier and more profitable in densely populated black townships than rural areas (Benjamin, 2003). The average level of household access to cell phones (33.1%) is higher than the average access to landlines (23.6 %). Fixed lines are declining owing to high

unit prices. According to the 74% global standard, Telkom’s 52% residential line proportion is very small (ITU, 2005). In accordance with license obligations, telecommunications service providers are required to provide community service telephones (CSTs) at low community service tariffs. Access is provided through phone shops, kiosks and portable phones. In total, 74,010 CSTs were rolled out by cellular telephone service providers in 2005. Refer to Figure 5 for roll-out by province. Roll-out of CSTs by service providers for the period of May 1997 to May 2002 was: Telkom 120,000; MTN 7,500; and Vodacom 22,000.
Figure 5: Provision of CSTs by cellular telephone service providers (2005)
0
5000
10000
15000
20000
25000
Ga
ute
ng
Weste
rn
Ca
pe
No
rth
We
st
Kw
aZu
lu-
Na
tal
Fre
e S
tate
Mp
um
ala
nga
Lim
po
po
Ea
stern
Ca
pe
No
rth
ern
Ca
pe
`
Source: MTN, Vodacom, Cell C (2006).
In 2005, Vodacom provided 48%, Cell C 39%, and MTN 13% of CSTs (Cell C Business Report, 2005). Placements were not effectively controlled and did not result in optimal service extension (Hodge, 2004).
Computer and Internet In 2003, only 13.6% of households had computer access and only 9.1% of all households had Internet access. The Internet was used in 1992 by one in 778 people; by 2002, the figure had risen to one in 10 (WorldWatch Institute, 2004). In 2005, 3.6 million people had access to the internet (World Wild Worx, 2005a), and in 2006, the number was 3.65 million. The price of PCs remains a barrier to private access to this type of ICT for the majority of the population. Affordability is the main issue for those who are still not connected to the Internet (World Wild Worx, 2005b). Therefore, most citizens – both rural and urban – will not be able to participate optimally in the information economy. According to Levin (2005), approximately 75% of South Africans have never used the Internet. Figure 6 indicates that the Western Cape has the highest access, which might be explained by the 2001 Cape Town City and Uunet South Africa joint development of the Bandwidth Barn, an incubator for small and medium ICT businesses.
Figure 6: Household access to computers and the Internet

0
5
10
15
20
25
30
35
40
Gau
teng
West
ern
Cape
Nort
h W
est
Kw
aZulu
-
Nata
l
Fre
e S
tate
Mpu
mal
ang
a
Lim
pop
o
Easte
rn
Cape
Nort
her
n
Cape
Nation
al
ave
rage
Perc
en
t A
cce
ss
PC Internet
Source: Data from HSRC (2003).
Broadcasting
The main broadcasting ICT media utilized in South Africa are television and radio. The South African government is the dominant owner in the broadcasting sector, through its ownership of SABC. In the past 10 years, 10 commercial licenses and 94 community radio broadcasting licenses have been awarded. According to Statistics South Africa (2001), 88% of the rural population listens to the radio in a seven-day period, compared with 79% in 1994.
Television South Africa has more than four million licensed television households, which is 32.3% of households. However, based on TV sales the number of households is much higher, with more than 18 million adults, or 64.4% of the adult population, watching the three free-to-air television channels. The broadcasting sector consists of three public television stations, two commercial categorized stations and one four-year community television station. SABC’s national television network (www.sabc.co.za) is comprised of three full-spectrum free-to-air channels and one satellite pay-TV channel. ETv, South Africa’s first privately owned free-to-air television channel, started operating in October 1998. The first private subscription television service, M-Net, was launched in 1986, and now has over 1.2 million subscribers in 49 countries across Africa. MultiChoice Africa, the first African company offering digital satellite broadcasting, was formed in 1995. Its 24-hours-a-day services include 55 video and 48 audio channels (www.southafrica.co.za).
Radio SABC's national radio network has a daily audience of 20 million, which is 42.2% of the population. It is comprised of 18 radio stations, of which 15 are dedicated specifically to public service broadcasting, and includes 11 full spectrum stations, one in each of the official languages of South Africa. There is a cultural service for the Indian community, broadcast in English, and a regional community station broadcasting in isiXhosa and English, and a community station broadcasting in the !Xu and Khwe languages of the Khoisan people of the Northern Cape (www.sabc.co.za).
SABC boasts three stations in its commercial portfolio: 5fm, Metro FM and Good Hope FM. In addition to SABC, ICASA has 13 private radio stations (Annex 16) licensed.
Community radio Community radio broadcasters are four-year licensed community radio stations localizing issues in the community’s own languages. The Department of Communications installed broadcasting equipment in 38.9% of these community radio stations as part of its initiative to fund broadcasting services in disadvantaged communities. Refer to Annex 17 for detail, regarding the provincial distribution and government assistance.
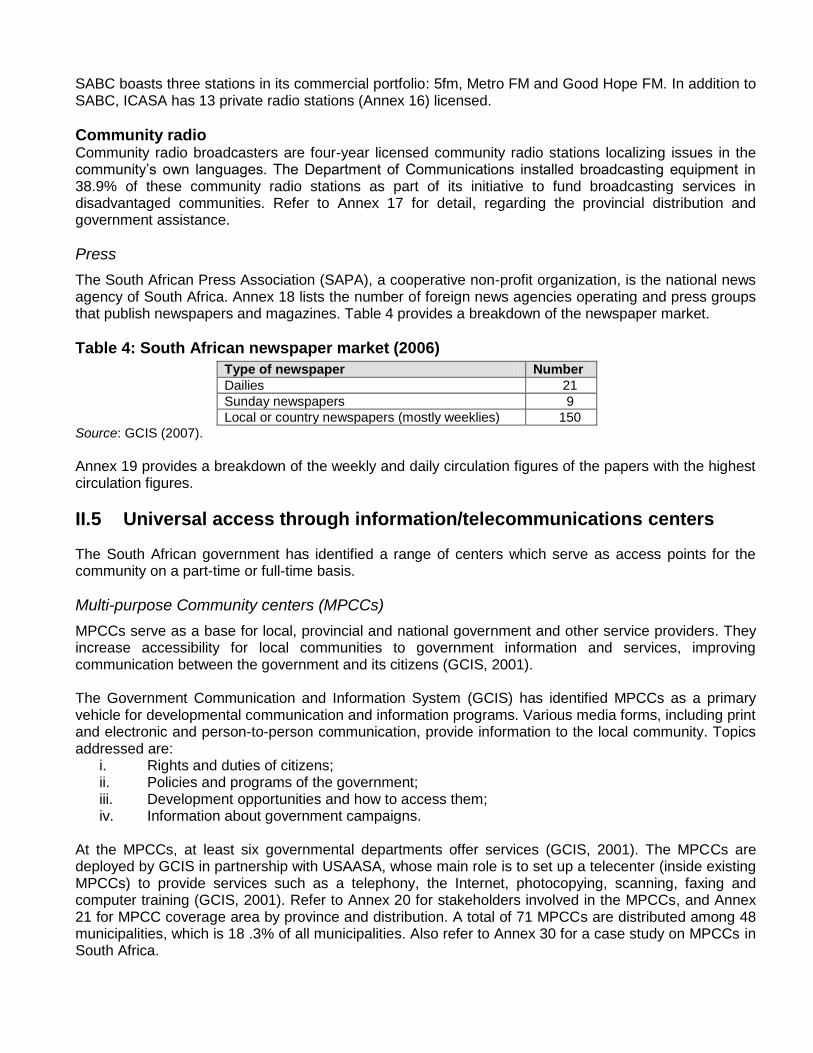
Press
The South African Press Association (SAPA), a cooperative non-profit organization, is the national news agency of South Africa. Annex 18 lists the number of foreign news agencies operating and press groups that publish newspapers and magazines. Table 4 provides a breakdown of the newspaper market.
Table 4: South African newspaper market (2006)
Type of newspaper Number
Dailies 21
Sunday newspapers 9
Local or country newspapers (mostly weeklies) 150
Source: GCIS (2007).
Annex 19 provides a breakdown of the weekly and daily circulation figures of the papers with the highest circulation figures.
II.5 Universal access through information/telecommunications centers
The South African government has identified a range of centers which serve as access points for the community on a part-time or full-time basis.
Multi-purpose Community centers (MPCCs)
MPCCs serve as a base for local, provincial and national government and other service providers. They increase accessibility for local communities to government information and services, improving communication between the government and its citizens (GCIS, 2001). The Government Communication and Information System (GCIS) has identified MPCCs as a primary vehicle for developmental communication and information programs. Various media forms, including print and electronic and person-to-person communication, provide information to the local community. Topics addressed are:
i. Rights and duties of citizens; ii. Policies and programs of the government; iii. Development opportunities and how to access them; iv. Information about government campaigns.
At the MPCCs, at least six governmental departments offer services (GCIS, 2001). The MPCCs are deployed by GCIS in partnership with USAASA, whose main role is to set up a telecenter (inside existing MPCCs) to provide services such as a telephony, the Internet, photocopying, scanning, faxing and computer training (GCIS, 2001). Refer to Annex 20 for stakeholders involved in the MPCCs, and Annex 21 for MPCC coverage area by province and distribution. A total of 71 MPCCs are distributed among 48 municipalities, which is 18 .3% of all municipalities. Also refer to Annex 30 for a case study on MPCCs in South Africa.

Telecenters
Telecenters are an initiative of the Department of Communications and USAASA. Each one contains 10 computers networked to a server, with Internet connectivity and other communication tools. Ownership structures include: (i) individuals; (ii) NGOs; (iii) community-based organizations (CBOs); and (iv) small, medium and micro-enterprises (SMMEs ). Services offered are: (i) computer services; (ii) voice (telephone); (iii) data (Internet and email); (iv) video (DVD and CD-ROM); (v) typing; (vi) fax; (vii) printing; (viii) photocopying facilities; and (ix) computer literacy skills training (USAAA, 2004). A total of 103 telecenters are distributed among 73 municipalities (27.9% of all municipalities). Refer to Annex 22 for the number of telecenters and coverage.
Cyber-labs
USAASA deploys e-school cyber-labs in under-serviced areas, particularly rural, peri-urban and underdeveloped townships. It is responsible for the installation of network points, air conditioners and security of the facilities. USAASA, in partnership with Digital Partnership, is rolling out refurbished computers to schools in disadvantaged areas, with a specific focus on rural areas (USAASA, 2004). Annex 23 provides provincial details and coverage of these cyber-labs. Each school owns its cyber-lab, and is responsible for all maintenance costs, except Internet connectivity. For a 12-month period, USAASA covers Internet costs. Thereafter, the schools are fully responsible for the cyber-labs. These school-based facilities, where science teachers are trained in basic computing, are limited to the school community only. ICT services and computer literacy training are provided. The program focuses on the following four areas:
i. Promoting human resources development in ICT software; ii. Providing a managed facility that enables students to understand and learn to utilize the
Internet and related network and software technology; iii. Educating students in the use of opportunities presented by the Internet; iv. Providing universal access for students under controlled circumstances, and in a regulated
environment. A total of 186 cyber-labs are distributed among101 municipalities, which is 38.6% of all municipalities.
Personal Information Terminals (PITs)
The Department of Communication and SPO launched a joint project to make available PITs for the community in order to bridge the digital divide. These customized computer touch screen Internet kiosks (698 in total) provide cost-effective access to email and Internet services. They are located in post offices and other access sites, such as MPCCs. Refer to Annex 24 for the coverage area and distribution of these PITs, and Annex 31 for a case study on PITs in South Africa. The following services can be accessed via the PITS (www.pit.co.za):
i. Government services for government info (government forms, new jobs); ii. Internet to give users access to create their own email accounts; iii. Business services, for the opportunity to select goods and services from advertized businesses;
iv. Educational services, for information on various courses from different institutions and the opportunity to apply online.
Department of Communication Web Internet Laboratories (DoCWILs)
DoCWILs provide Internet facilities for colleges and universities in a confined group/community approach. The laboratories are an initiative of the Department of Communication and Telkom. Each laboratory has between 20 and 27 networked computers and Internet connections. A total of 10 DoCWILs are distributed over six provinces. Annex 25 provides provincial distribution figures.

Citizens' Post Offices (CPOs)
CPOs have interactive terminals installed to provide Internet access, including email facilities. This is an initiative of the Department of Communications and SAPO. Each of the 14 CPOs contains eight to 12 computers, a scanner, printer and photocopier, TV and VCR. They function as 'one stop' centers for communication services for end-users such as students, teachers and SMMEs.
Public Libraries
Libraries are seen as logical places for ICT facilities, due to their accessibility for community members. They offer access to digital resources such as online catalogues and general information via the Internet. South Africa has a total of 1,242 libraries in 198 municipalities across the country. Annex 25 provides the provincial distribution of these libraries.

III. Problem Statement
Information cannot magically cure poverty and hunger. Nevertheless, information does form the indispensable fuel for any development engine, and can be transformed into knowledge, which in turn can empower communities in their efforts to take charge of their socio-economic needs. The right information at the right time can assist in finding a solution. Poverty goes beyond a lack of income. It refers to the denial of choices and opportunities for a tolerable life, and often encompasses a lack of basics for survival – such as food, clothing, shelter, medical care, education and employment. Human poverty is a multidimensional concept and refers to: Disadvantages in access to land, credit and services, such as health and education; Vulnerability to violence, external economic shocks and disaster; Powerlessness; Social exclusion; Economic exclusion.
Rural communities refer to non-urbanized and peri-urban areas. These areas are often poor – the lifestyle of the community often depends mainly on agriculture and livestock farming. Infrastructural development and service provision are poor, and poverty and unemployment levels are often very high (UNDP, 2000). The South African rate of poverty is 45%, but in rural areas this figure rises to more than 50%. Digital technologies are at the core of the present technological revolution, forming the heart of productive systems in contemporary society and changing main production processes and service delivery. It is not just about information and communication. According to Carr (2004), digital technologies are 'infrastructural technologies' – their impact has been as strong and widespread as electricity and transportation. They are no longer merely 'nice to have' but are fundamental to integration and inclusion. New ICTs lead to a digital divide, not only between rich and poor countries, but also within nations. As in other developing countries, poverty in South Africa is clearly differentiated along racial, gender and urban/non-urban or rural divides. The people in many rural areas exist on incomes below the subsistence level, and remain impoverished due to a lack of access to basic infrastructure enabling economical growth and development. Rural areas lag behind in terms of ICT access. Factors contributing to this include illiteracy, lack of computer skills, and lower household incomes (Conradie et al., 2003). The major factors preventing rural regions from benefiting from ICTs are quality and cost, as well as low penetration of landline telecommunication services. Geographic location should not place limitations on access to information and use of the Internet, which are considered vital to the promotion of learning, training and business development in developing communities (Costelllo, 2000). South Africa faces the challenge of reducing and removing access differences between social groups, in order to extend the benefits of this technology to all sectors of society. The digital divide concept distinguishes only between 'have' and 'have not. However, this approach oversimplifies the more complicated reality of South Africa – that numerous degrees of access to the use of ICTs exist, and many alternative impacting variables apply.
The issue regarding ICT access is broader than spatial and infrastructural aspects. It includes a variety of factors influencing usage patterns, such as: education; mobility of individuals, families
and communities; user friendliness; and cost of offered technologies by private enterprise, government and NGOs.
Users utilize one or more technologies for their purposes. According to Gillwald et al. (2004:139), various forms of telephone access – landlines, cell phone or public phones – are used by consumers 'as part of a strategic combination of maximizing their tele-expenditure and tele-usage'.
The fact that a consumer has access to ICTs does not imply or guarantee that the quality of the service is adequate.
Most ICTs have an urban bias due to connectedness, including factors such as roads, power and telephone requirements. Weak road networks, non-availability of electric power or a lack of fixed telephone lines directly cause discrimination against rural areas regarding access to ICTs.
Location inequalities: larger versus smaller town mentality. Smaller towns have less access to basic residential services and business-related services, and have fewer qualified public sector service staff.
The rural poor who are in need of the benefits of ICT applications, are mostly unskilled and illiterate.
Poverty has social and political roots. Simply using a new ICT will not reduce poverty. ICTs must be applied within a given context. Often, social and political change is also needed for poverty reduction.
Poverty levels differ within the rural areas. People struggling to survive have little benefit of ICTs, due to travel time and costs.
Positive attitudes and perceptions regarding ICTs are more prevalent in middle and upper class culture, particularly in the culture of the intellectually gifted.
Poverty reduction is part of a broader development process and takes time. Empowerment requires social transformation and a learning process/curve for the powerless and the powerful within society. This does not take place overnight.
Most training initiatives focus on providing computer literacy skills in schools, which means that they are mostly used by scholars, rather than a broader range of the population; the older generation has few opportunities to obtain these computer skills.
Other issues to consider include: future requirements and changing needs of society; the change of economic focus in the information era; and the speed of change of technology.
The poor may become more marginalized, due to the fact that basic computer skills are increasingly becoming essential for success and personal advancement: entry into a good career; educational opportunities; full access to social networks; and opportunities for engagement.

IV. Findings: Priority Knowledge Needs of Key Stakeholder Groups
The surveys in this report involved several ICT stakeholders, such as community papers and telephone corporations, and their activities, such as Internet connectivity and mobile telephony. Most of these projects have been funded using national or private resources. Infrastructure had to be supplied for these projects. This entailed the participation of many different stakeholders, with different combinations of civil society players with government and/or private sector players. The aim of this section is to present a focused review of best practices and lessons learned that could be applied to future ICT projects.
IV.1 Priority needs and the role of donors
South Africa has a very powerful state that is only 1% dependent on international donor funding, whereas civil society is almost entirely dependent on international donor funds. The donor community includes both international and national donors.
International donors
International donors functioning in South Africa include the World Bank, USAID, DFID, ADB, CIDA/IDRC, Sida, UNDP, GTZ, UNCTAD, and others such as the Ford Foundation, which has 188 projects in South Africa. Table 5 shows the principal focus areas of some relevant donor organizations, and also provides a few South African examples. The absence of a focus on ICT is immediately apparent. Table 6 shows the needs identified by these organizations.
Table 5: International donor organizations
Donor Project(s) description Principal focus areas
USAID Takalani Sesame, TV and radio program Primary healthcare in Eastern Cape – 689
clinics reaching 6.4 million Employment creation program – 3,000
jobs, US$279 million in sales in SMMEs and agricultural sector
Education, economic growth and employment, HIV/AIDS and health, democracy and governance, housing and municipal services
DFID Funding DPLG in support of IDPs, communication and information, e.g. Northern Cape departments of housing
HIV/AIDS, basic service delivery, IDP, LED, capacity development and institutional integration
CIDA/IDRC HIV/AIDS Rapid Response Fund
HIV/AIDS, governance, rural development, regional cooperation
Sida Community support centers, youth advisory centers, low-cost housing developments in Duncan village
Create condition conducive to change and to social and economic development
Table 6: International donors' needs
Needs area Need
Connectivity and partnerships
organization must have strong grassroots connectivity, and must be low risk Strong partnerships among stakeholders and players Cross-border projects: national strategies to be aligned with regional initiatives Good coordination among organizations, to prevent duplication
Focus of the project
Beyond charity/aid to economic empowerment, skills transfer and people Must relate to broader environmental context
Leadership Need strong leadership Adequate succession planning for the projects
Governance Good governance within beneficiary organization, including independent Board

Peer review mechanisms to promote practices and good governance Good accountability Excellent documentation of whole project and process Must meet/promote certain standards of democracy or liberal economic policies
Staffing Good employment practices Trained community-based workers People with passion for the work
Local donors
Most local ICT donors – financial institutions, MTN, Telkom, Vodacom, Cell C – are getting involved in rural ICT issues through their social responsibility initiatives. These companies have contributed to projects for the department of education by making donations through the provision of computer infrastructure – such as computers, printers and Internet connectivity – to schools. An example is Vodacom’s Mashifunde Sonke School Library project, which provides basic computer training programs for teachers/educators. Most of the projects focus on providing access to ICTs and empowering the rural poor to improve livelihoods in the community. Some are even more specific, and focus on growing entrepreneurship among women in rural areas, and promoting equitable access to the benefits of ICTs. There is also a recent trend in which private organizations are looking at the bottom of the pyramid as a business in itself. The telephone industry, for example, is starting projects that offer services at lower costs to SMMEs such as MTN’s Y’ello Zone community payphones shops or MTN’s ICT entrepreneurship pilot centers. Banks are also providing cell phone banking products at lower costs (FNB). All local donors recognized sustainability as a key priority when considering funding projects. They do not want to fund projects that act as a charity (top-down approach) to the community. The emphasis changed from identifying projects to adopting an end-to-end solution. Donors prefer to get involved with projects where the community is engaged in the identification of real needs, and in the implementation of the project or activity. An example is Letsema Village in rural Limpopo, where five schools received computer centers with Internet access powered by VSAT satellite technology, as well as vegetable gardens. The priority needs indicated by local donors are:
Table 7: Local donors' needs
Needs area Need
Community needs identification
Initiatives generated from/for the community and not top-down imposed projects Identification of community’s real local needs Ensuring equitable access to ICT
Networking and coordination
Better/more fluent coordination with national/regional government departments Better/more fluent coordination with local government (i.e. municipalities) Better/more fluent coordination with other local stakeholders including MPCC
managers, traditional authorities, NGOs and local entrepreneurs Networking with other corporations, national, provincial and local stakeholders
Assessment Evaluation indicators to assess the impact of their investment
Publicity Publicity for involvement
IV.2 Priority needs and the roles of national-level policymakers
The government has responded to the exclusion of rural areas from the changing economy by taking the initiative and launching a range of policy and programmatic interventions, mostly attempting to increase access to ICTs in rural areas. These interventions were discussed in Section II.5. The government’s interventions are not only to provide infrastructure, but also to include elements of: (i) computer training – Hewlett Packard Compaq’s I-community in Mogalakwena district in Limpopo: education – Schoolnet South Africa project: and (iii) information provision – Cape Gateway and Gauteng Online.

Many of these initiatives have not produced the desired results, due to lack of long-term economic sustainability. The deep rural communities that still experience problems with basic services and electricity, have very low priority for ICTs. Current initiatives to provide accessibility for the rural poor to ICTs are very limited. Prior to 1994, poverty alleviation programs followed a top-down approach in terms of design and implementation. Since 1994, there has been a willingness on the government side to include citizens in the conception and implementation of policies and programs. Many officials in all three tiers of government recognize the importance of following this participatory development approach, in which the communities actively participate in development interventions. However, the main challenge has always been the means to the end. Many programs and interventions are still conceived exclusively by policymakers and top government officials at the national level, and then filtered down to the provincial level to be implemented. A trend is starting to develop where the national government assumes the role of a think-tank and supervisor to the provinces. This limits input opportunities in the design and planning of initiatives for local communities. Furthermore, there are templates within which rural development takes place, namely the Integrated Rural Development Strategy. Although these strategies have poverty eradication as the objective, most do not take proper account of peoples’ livelihoods. With the establishment of the new municipalities – and in line with the legislative qualification that local economies and development need to be driven locally – provinces have started to take on the role of middleman in terms of development. Provinces have involved NGOs in implementing projects and programs. Table 8 shows the needs of national, provincial and local-level policymakers.
Table 8: Needs of national, provincial and local-level policymakers
Needs area Need
Stakeholder coordination and
cooperation
Better coordination and collaboration between various levels of government Stronger partnership between NGOs and government Better cooperation among government departments on implementation Eradication of duplication of roles among government departments, development
agencies and NGOs Clear lines of function and role, for example functions of the Independent
Development Trust, Development Bank South Africa and the National Development Agency (currently overlapping)
Better program coordination/intergovernmental synergy among departments Avoidance of internal political fighting at expense of the project
Resources
Resources, namely offices, staff and equipment Accessibility of funding Promotion of cost sharing among departments Additional funding for launch of events to attract large community gatherings
Financial control Better control of funding, e.g. depositing funds in a separate development account
rather than one municipality account Better control to ensure budget is spent in beneficial manner
Leadership Need top-level support for projects Need champion to steer and lead project Proper accountability of ward councilors to constituencies and local authority
Community involvement
Need buy-in from community Avoidance of unilateral project design by government officials Overcoming apathy of some communities to get involved Focus on needs of beneficiary and not tools and sector Follow-up on feasibility of service provision after requests by communities
Project management
Attendance of meetings from different departments during planning phase Adequate project management skills Sufficient project members training

Follow through by officials Knowledge sharing among different government officials Implementation and operational guides for future roll-out processes Representatives to report back to official structures to ensure that efforts to
promote joined government service provision are not stifled Effective feedback mechanisms from project member to policymaker
Communication Better internal communication processes Improved horizontal communication Sufficient information sharing across functions
Staffing
Clear job descriptions and accountability Ensuring that job functions are not too diverse Relevant work experience Passion and commitment Adequate ICT skills
Assessment Use of monitoring systems and evaluation of impact of initiatives
Service delivery
Consistency of service delivery from departments Departments to provide full range of services within access points like MPCCs Government officials and development facilitators should function as big providers
and not be held accountable or responsible for effective/ineffective service delivery by community
IV.3 Priority needs and roles of technology providers
Most technology providers have focused on initiatives to ensure universal access for the majority of citizens. The telecommunications industry, including mobile service providers such as MTN, Cell C, Vodacom, and landline service provider Telkom, adapted their products. For instance, the mobile industry introduced pre-paid mobile phone packages and lowered CST call rates. The important role of the main mobile technology providers interviewed seems to have been the continuous rolling out of CSTs. USAASA’s role seems to be as the provider of telecenters. Needs voiced by technology providers are as follows:
Table 9: Needs of technology providers
Needs area Need
Government and legislation
Flexible legislation and regulation owing to continuous and dramatic shift in technology development
Universal service and access to be redefined (currently only includes telephony and does not take into account growth of mobile industry)
Addressing quasi-statal monopoly of Telkom Better support from local and provincial government
Finance
Focus on maintenance and not just continued investment in rolling out CSTs Better handling of funds, for example getting a portion back which can be spent on
maintenance or other technological roll-outs Address issues of affordability, e.g. current exorbitant rates
Stakeholder cooperation
Better coordination among service providers, for instance where to cooperate on CSTs
Local community involvement
Ensure that needs of local communities are taken into account by doing an area-specific needs analysis
Consider infrastructure in rural areas
Assessment Effective measurement
Infrastructure Better infrastructure, for example electricity in deep rural areas
IV.4 Priority needs and the roles of CSOs and the media
CSOs play an important role in the provision of ICT services to the rural poor. Some projects are geared toward reducing the digital gap currently affecting the rural poor. Others focus on information sharing,

socio-economic development, welfare, training and/or civil rights. Each CSO is unique in its objectives, funding and service. CSOs emphasized most strongly the need for implementation of integral bottom-up initiatives, to improve the chances of producing a sustainable project. Most of these organizations focus specifically either on youth or the elderly. Priority needs indicated by CSOs are as follows:
i. The need for more funding in order to get past the pre-implementing stage; ii. Improved infrastructure, for example electricity; iii. Information on other projects in the area; iv. Cooperation and learning network; v. More exposure among policymakers and donors; vi. Knowledge sharing of best practices.
IV.5 Priority needs and the roles of end users/beneficiaries
This section is based mainly on the findings of the fieldtrips and the case studies, but the identified needs are also applicable to most rural areas where projects are implemented. For more details see Annex 28 and Annex 29. The fieldtrips revealed that there was a general lack of knowledge about local government and CSO initiatives. Most beneficiaries are unaware of projects like MPCCs and PITs. Access to information in rural communities is vital. It can form the basis for a radical shift from a helpless poverty-stricken status to social, educational and economic know-how that could lead to development. Most beneficiaries still have to travel huge distances on foot in order to access the closest ICTs, because there is either no public transport available or it is too expensive to use. Beneficiaries are poor, do not own land or any other property, and feel powerless about the situation. They have limited information on economic opportunities and credit facilities. Most are computer illiterate. Most beneficiaries use either the radio or the TV on a daily basis for social and information purposes. Telephones are mostly used for personal and emergency matters, such as making or receiving calls. Practical information like clinic days and pension payments are communicated and accessed via posters displayed on notice boards at local municipalities, or by word of mouth. Civil meetings are announced by driving through the area with a pick-up vehicle and using megaphones. Beneficiaries recognize the potential impact that new ICTs can have on their livelihoods, but at this stage are marginalized due to cost, time, lack of training and transport. Priority needs as indicated by the beneficiaries are listed in Table 10.
Table 10: Needs of beneficiaries
Needs area Need
Infrastructure
Sufficient telecommunication services in rural areas Sufficient Internet connectivity Better energy provision infrastructure More accessible road infrastructure Secured buildings and facilities where donated ICTs can be used ICTs such as computers and fax machines Adequate technical infrastructure in small towns and rural areas Excellent signal distribution, TV services and network service for mobiles
Awareness of benefits
Excellent knowledge about benefits of ICT among different age groups Increased awareness and understanding of the potential of the Internet to improve
personal and economic well-being Awareness programs about ICT skills training options and access points
Training, skills development and
knowledge transfer
Projects to increase low literacy rate of rural population Sufficient training and professional development in ICT skills for education
professionals and community advisers Necessary skills to use ICTs Enough free time to develop individual capacity Education on how ICT could be used to generate markets for goods and services,
and which ICTs would enable them to do so

Cost and affordability
Affordability of costs of access to equipment and network Affordable and high-quality ICTs
Maintenance and repairs
Technical maintenance of ICTs in rural areas. Currently, beneficiaries have to travel far for repair work, resulting in costs not being viable
Sustainability New product development in communities according to needs Eradicating dependency syndrome (letting someone else do it on your behalf)
The rural poor will not be able to reap benefits and enjoy positive impacts on their livelihoods if ICTs are not available, accessible and affordable. Training and instruction are crucial requirements in order to benefit from ICTs.

V. General Findings and Priority Knowledge Needs
V.1 Key themes
The following key themes have emerged from the interviews and the case studies, and were also to a large extent validated in the national workshop.
Table 11: Key themes
Key theme Description
Scalability Possibility of duplicating successful aspects of a project or total project or
initiative elsewhere in South Africa
Management Overall management of project, including planning, implementing, evaluating
and knowledge sharing
Funding Continuous process of acquiring of local and/or international funding,
controlling of funds and budgeting
Technology and local appropriation
Technology must be simple and usable for local community and meet their needs and requirements
Impact of key institutions and intermediaries
Each role player impacts success of project during its course
Empowerment and giving voice to the rural poor
People should be at the center of the project or initiative Community should not only be beneficiary but also act as role player Focus to be on the needs of community, which should be well assessed Buy-in of community is prerequisite for success
V.2 General Findings
There was a general agreement and recognition of the importance of the digital inclusion of all communities, both urban and rural. In order to break the inter-generational transmission of poverty, it is crucial to introduce technologies, so that citizens can use them to overcome socio-economic limitations they have inherited from their families and communities. New generations must be provided with access to ICTs in situations and environments that are conducive to productivity, personal meaning, and freedom.
Development approach
Development interventions depend upon the sphere of government that has legal status over the specific sector. Poor peoples’ livelihoods revolve around livelihoods outcomes rather than sector outcomes. Therefore, the starting point for all sector programs should be the community rather than the resource or the sector per se. The problems of rural persons cannot be solved at a local level only. A sector-wide approach enables a program to work at the local, provincial and national levels. These national poverty reduction strategies (sector-specific strategies) on, for example, health or good governance, allow for a more targeted use of ICTs. Attempts to use ICTs for poverty reduction are more effective when embedded and synchronized with other policies and resources.
Needs assessment
ICT skills development and knowledge transfer need to be synchronized with access to the particular technology. Poverty cannot be cured by simply linking a rural poor person to a computer network, without the necessary training and knowledge transfer (Annexes 28, 29 and 30). The beneficiary needs to be at the core of the design and implementation process of any poverty reduction effort.

Projects must be inclusive and involve all community stakeholders. The needs of the targeted community need to be assessed prior to planning and implementing (Annex 30). Each community has specific needs and these needs change constantly. Therefore, an initiative must be able to adapt to the changing needs of the community. A 'one size fits all' approach has proven to be ineffective. The project team must be sensitive to the diversity of community needs, and to the peoples’ priorities and opinions regarding which services are needed in their area.
Ownership by local community and partnerships
Donors should not look for implementers of their vision, but rather encourage and support their partners in implementing their own vision. The more involved the community, the greater the sense of ownership and the more likely that the project will be sustainable. However, partners are required at the local and national levels, specialized institutions in particular.
Champion at the national government level
Someone with passion and commitment to the cause is needed within the higher levels of government to act as champion. Sustained investment is needed and cost effectiveness should not be mistaken to mean lower cost. Cutting back on key human development components can ultimately be quite costly, in terms of time and money.
Coordination among different stakeholders
Almost all stakeholders expressed concern regarding coordination among the different actors and players, and duplication of services (see above and Annex 30). These coordination problems can be prevented if prior knowledge regarding the community and the local authority is collected. The primary role of local government seems to be the facilitation of the cooperation of different stakeholders and assistance with the management of funding aspects.
Conducive environment
An environment that is conducive includes freedom of expression and competitive markets. Independent regulators play an important role in making the environment favorable.
Appropriateness of technology
In order to use the technology to its fullest potential, the technology utilized must match the skills of the poor, or the poor need to be instructed on how to use the technology (Annex 30). The technology applied must be appropriate for the needs of the specific community. In order to make the technology more accessible to the people, all support instructions must be in the local language.
Content
Content needs to get as much attention as connectivity and must be people-centered, demand-driven, value-adding, and in the local language. The focus should be on the information and the communication services, rather than on the ICT itself. The information must be user-friendly and relevant to peoples’ day-to-day existence. Information should come from different sources. Collaboration with other providers of relevant information, such as local health clinics, research institutes and self-help organizations, is needed in order to establish effective linkages. In order to make use of information provided by ICTs, other resources must be made available, such as job opportunities and access to credit and health services.

Capacity-building, strengths and sustainability
The sustainability of any development project depends largely on the capabilities of the project members. Development interventions must take into account the strengths and capital assets of the targeted communities, to ensure sustainability of the project. The poor in South Africa are often illiterate and have few productive skills, and little land or livestock. Many survive on uncertain wages. Capacity and asset building for the poor should be a major goal of any poverty alleviation effort.
Skills training
Poverty reduction is about developing people – their minds, experiences and potential. It is about learning skills and attaining a technology competency and fluency that will assist people in becoming more productive citizens. Projects must make provision for life and ICT skills training, for both workers and beneficiaries (Annex 30).
Voice of the community
Communities must be able to participate and give feedback at any stage of the project (see Annex 30 for examples).
Measurable outcomes and timeframes
The project must have achievable, measurable goals that are linked to achievable timeframes (see Annex 30).
Evaluation process
An evaluation process must be in place to assess progress on an ongoing basis (see Annex 30).
Accountability
Project facilitators must be held accountable by the community, and not only report to their reporting structures.
Documented lessons
Significant lessons learned have to be documented – implementation and operational guides for future roll-out processes should be developed.
Maintenance and upkeep
Maintenance should be included in the planning of a project. It is difficult to sustain technology in rural areas due to maintenance and roll-out costs. Creative mechanisms need to be in place to provide communities with access to technology.
Communication strategy
People need to know about the project. Communication must be both internal and external. Constant and open communication is needed.

VI. Conclusions
The following conclusions can be drawn according to the initial three research questions.
VI.1 Improvement of the livelihoods of the rural poor through ICTs
Most of the policies and projects reviewed did assist – at least to some extent – in improving the livelihoods of the rural poor. ICTs do assist the rural poor in their daily lives, specifically when it comes to practical matters like communicating during a crisis, keeping in contact with family, retrieving information, and doing business. ICTs also increase empowerment and give voice to rural communities. However, there is no doubt that the rural poor do not have equal access to the state, to health information, to online education, to various livelihood opportunities, to private institutions such as banks and financial institutions, and to family members who live in urban areas.
VI.2 Existing knowledge and lessons learned from the field
The key lessons learned regarding ICT experiences and livelihoods in rural areas, indicate: i. A lack of sufficient income to acquire ICT access; ii. An absence of the necessary minimum skills to use ICTs; iii. A lack of awareness regarding the uses of ICTs to enhance livelihoods; iv. The absence of a perceived need – the service considered not useful or desired by the
community; and v. A perception among service providers that it is not profitable enough to extend the ICT
infrastructure. From the research it also became evident that projects need to be sustainable, self-managed and able to be appropriated by local communities. This can only be achieved by implementing community-generated initiatives with the assistance of trained local technical support, and a network of participating local, national and international stakeholders. Local government’s role as facilitator, as well as the accessibility, affordability and availability of ICTs, are factors influencing the success rate of a project. A lack of local capacity, ability and infrastructure causes major problems in rural projects. Community participation is crucial for sustainable ICT initiatives. Similarly, the successful coordination and involvement of different stakeholders is crucial in order to have an impact on the livelihoods of the rural poor. The measurement of successful projects can be carried out according to different criteria, including:
i. Replicability; ii. Sustainability; iii. Community participation; iv. Increase of resources to support the ICT; v. Change in attitude of the community; vi. Request for more and better information.
VI.3 Further research and analysis for informed policy and investment
Given the variance in the experiences collected, it is sometimes difficult to infer general conclusions. Much more in-depth research over a longer time period and with a much larger sample representing all nine provinces of South Africa is needed.

The unique needs and character of each community make it difficult to multiply initiatives. At this point, few projects can boast countrywide success. More research can determine underlying factors contributing to differences and build a framework for multiplying successful projects. Participants in the national workshop repeatedly emphasized that investments and projects should take community needs and priorities into consideration. More research is needed to establish the real needs and priorities of communities, as well as the most suitable ICTs for their particular situations. A major hindering factor in rural areas is the monopolistic nature of telecommunications and the resultant high costs of most ICTs. Research and analysis is needed to determine the role of government as shareholder, in terms of these costs, and to develop alternative solutions. Further research on the dimensions of 'digital poverty' in South Africa is needed.
VI.4 A final word
Technology is not the challenge or the barrier. The human factor remains the greatest barrier to development. Many unsuccessful projects can be attributed to the human factor rather than to ineffective technology. ICTs can certainly assist in improving the livelihoods of the rural poor by helping them in their daily life, giving them voice and increasing their empowerment. However, ICTs need to be available, affordable and accessible. These are currently some of the major stumbling blocks to rural development in South Africa. Three underlying drivers are critical to enhancing the livelihoods of the rural poor:
i. Provision of telecommunications access and services to under-serviced communities in order to deliver on the developmental objectives of South Africa;
ii. Mandatory service obligations, such as CSTs for all major ICT license holders; and iii. Evaluation of the efficacy and the need for further intervention if necessary.

VII. Recommendations
There exists a strong need for more, better and updated information among the different players regarding the needs of the rural poor. Further qualitative and quantitative research is needed. A central repository or portal would be useful, where all relevant information and research can be made available to the different players. The lack of alignment of existing policies among the different levels of government is a major concern. Thus, duplication and 'silo' thinking among stakeholders will have to be eliminated, and an overarching government policy needs to be established. Much greater intra-governmental coordination is needed. Policies also need to be updated much faster, since the rapid development of technology means that policymakers are permanently playing catch up. Currently, little provision is made for structured participation by the private sector. Public-private partnerships should receive much more attention, and a formal structure for participation should be created. The private and NGO sectors need to be encouraged to contribute more meaningfully to ICT development for the rural poor, either through corporate social responsibility or coalition formation. Existing ICT laws in South Africa are a barrier to ICT development in rural and other areas, and have led to a sector dominated by quasi-public enterprises and monopolistic practices. A review of current restrictive legislation and a subsequent liberalization of the ICT sector will have to receive urgent attention in order to make ICT affordable for the poor. There is a dire need for training and transfer of ICT skills to the rural poor. This should start with an awareness campaign of the benefits and potential of ICT in terms of improving livelihoods. Case study examples must be made available to the rural poor, and training in the application of ICTs as a tool to improve socio-economic conditions should be provided. At the project level, the need exists for professional trained project mangers to oversee poverty reduction projects. During the research, it became apparent that many of the stories of failure could be attributed to poor project management and a lack of project management skills. Future projects will have to select project managers and project members much more carefully. Best practices need to be shared among the different organizations. An independent central coordinating body – not related to government – for socio-economic projects needs to be established to coordinate resources on a national basis.

List of sources
Acacia. 2000. Information and communication technologies (ICTs) for improved service delivery in the new South Africa. http://www.citizens.csir.co.za.
Benjamin, P. 2003. The Universal Service and Access Agency of South Africa’s Tele Centers program: 1998-2000. Cape Town: HSRC.
Butcher, N. 1998. The Possibilities and Pitfalls of Harnessing ICTs to Accelerate Social Development: A South African Perspective. The South African Institute for Distance Education.
Carr, N.G. 2004. Does IT Matter? Information Technology and the Corrosion of Competitive Advantage, Boston, MA: Harvard Business School Press.
Cell C. 2006. Media Results Presentation. August. www.cellc.co.za/images/Mediaresults082206, accessed February 2007.
Conradie, D.P., Morris, C. and Jacobs, S.J. 2003. Using Information and Communication Technologies (ICTs) for Deep Rural Development in South Africa. In Communication 29(1&2):199-217.
Costello, J.B. 2000. Education: The Fuel for Tech’s Golden Age. Electronic Business. http://www.e-insite.net/eb-mag/index.asp?layout=article&articleId=CA53574&stt=001.
EIU. 2005. South Africa Telecoms and Technology Background. http://www.ebusiness forum.com/index.asp?layout=newdebi$country_id=ZA&chan.
GCIS. 2001. Multi-purpose Community Centre. http://www.gcis.gov.za.
GSM World. 2006. GSM Operators, Coverage Maps and Roaming Information.
www.gsmworld.com/roaming/gsminfo/index.shtml, accessed February 2007.
Gillwald, A. et al. 2004. Towards an e-Index for South Africa: Measuring Household and Individual Access and Usage of ICT. Johannesburg: LINK centre, University of the Witwatersrand.
Hodge, J. 2004. Universal service through Toll-out Targets and license Conditions: Lessons from Telecommunications in South Africa. In Development Southern Africa 21(1): 205-25.
Horwitz, R.B. 1997. Telecommunications Policy in the New South Africa: Participatory Politics and Sectoral Reform. In Communication 23(2): 63-78.
HSRC. 2003. South African Social Attitude Survey 2003. Pretoria: HSRC. ITU. 2005. World Telecommunications Indicators Database. Geneva: ITU.
Levin, A. 2005. Internet Society (South Africa) Internet Fiesta. http://www.ipsa.org.za/iweek/ 2005.presentation.shtm.
Lisa Thornton Inc. 2006. Recommendations on How the USA and Other Stakeholders Might Assist USALs to Ensure Sustainability, 4 May. www.usa.org.za/docs/gen/Lisa%20Thornton%20Final% 20Report.pdf, accessed February 2007.
Mbeki, T. 2006. State of the Nation Address, 3 February. www.dfa.gov.za/docs/speeches/2006/ mbek0203.htm, accessed February 2007.
MTN. 2005. Annual Report. MTN. 2006a. Annual Report. MTN. 2006b. Interim Results, March. www.mtn.co.za, accessed March 2007. MTN. 2006c. Interim Results Presentation. www.mtn.co.za, accessed March 2007. Republic of South Africa. 1996. Telecommunications Act. Republic of South Africa. 2001. Telecommunications Amendment Act. South Africa Yearbook. 2006/7 SAARF. 2005. All Media Products Survey (AMPS) 2005. SACN. 2004. State of the Cities. Cape Town: SACN. SARB. 2006. Annual Report.
Statistics South Africa. 2001. Census 2001. www.statssa.gov.za.
Statistics South Africa. 2004. Labor Force Survey 2004. www.statssa.gov.za.
Statistics South Africa. 2004. General Household Survey 2004. www.statssa.gov.za.
Statistics South Africa. 2006. Mid-year Population Estimates, South Africa. www.statssa.gov.za.

Telkom. 2006a. Annual Report. Telkom. 2006b. Interim Results Presentation. www.telkom.co.za. Tlabela, K. et al. 2006. Mapping ICT Access in South Africa. Pretoria: HSRC Press. UNDP. 2000. Human Development Report. New York: UNDP. UNDP. 2004. Human Development Index. New York: UNDP
USA. 2004 and 2005. All reports can be found at http://www.usa.org.za/ Vodacom. 2004. White Paper on Telecommunications. Vodacom. 2006. Annual Report. Vodacom. 2006a. Interim Results, September. World Economic Forum. 2006. The Global Competitiveness Report. www.weforum.org/en/
initiatives/gcp/Global%20Competitiveness%20Report/index.htm, accessed February 2007.
WorldWatch Institute. 2004. More Mobile & Telecoms Stats, http://www.celluler.co.za/news_2004/ Jan/030304-cell phones_bridge_global_difital.htm.
World Wild Worx. 2005a. The Goldstuck Report: Internet Access in South Africa. World Wild Worx. 2005b. Razor’s Edge Business Intelligence & Trigrammic. Map of the IT and Telecoms
Sector (MITTS). http:www.theworx.biz/mitts05.htm.

Annex l: Household Survey (ICT Active and Inactive Users)
Enhancing the Livelihoods of the Rural Poor: the Role of Information and Communication Technologies; A Knowledge Needs Assessment, Knowledge Map and Framework. A. General Information
1. Date of Interview: ___________________________ 2. Questionnaire No.: ___________________________ 3. Name of the Interviewer: ___________________________ 4. Village/town: ___________________________ 5. Ward: ___________________________ 6. District: ___________________________
B. Demographic Data 1. Name of the interviewee: (Optional) ___________________________ 2. Gender: ___________________________ 3. Age: ___________________________ 4. Occupation: ___________________________ 5. Level of education: ___________________________ 6. Number of dependants/children: ___________________________
C. Survey Data 1. ECONOMIC STATUS 1.1. What is your Principal source of income? (Ranking 1 – 5, where 1 = main source)
1. Tourism 2. Agriculture 3. Livestock 4. Pension 5. Business 6. Employed 7. Others Details: ________________________________
1.2. What is your average income per month? (South African Rand) 1. Less than 500 2. 501 – 1,000 3. 1,001 – 1,500 4. 1,501 – 2,000 5. 2,001 – 2,500 6. 2,501 – 3,000 7. Above 3,001
2. ACCESSES, USE AND OWNERSHIP OF ICTs (PHONE, TV, RADIO, MOBILE PHONE, EMAIL) 2.1 Which of the following do you or any other member of your family own?
You Family member 1. Radio 2. Mobile phone 3. Telephone landline 4. TV 5. Computer 6. Fax machine 7. Others Details: _____________________________ 8. None

Question 1. Radio
2. Mobile phone
3. Telepho
ne landline
4. TV
5. Computer
6. Email
7. Internet
8. Fax
9. Others
10. None
2.2 Which of the following do you use? Tick appropriate box
2.3 How often do you use this ICT tool? 1. Daily 2. Once a week 3. Monthly 4. N/A
2.4 If these tools are not used on a daily basis, what are the reasons? 1. Too expensive to access or own 2. Lack of capacity/ education 3. Infrastructure not available 4. Do not see the need to 5. Didn’t know it existed 6. Other reasons
2.5 How much do you spend, approximately, to access the above services per month in South African Rand? 1. 1 – 50 2. 51 – 100 3. 101 – 150 4. 151 – 200 5. 201 – 250 6. 251 – -300 7. 301 – 350 8. 351 and above 9. Nil
2.6a Is the cost of these services subsidized? 1. Yes 2. No
2.6B Mention the source of the subsidy
2.7. What is your main means of communication and access to information? (Multiple responses accepted) FREQUENCY
1. Radio 2. Mobile phone 3. Telephone landline 4. TV 5. Internet 6. Email 7. Newspaper 8. Fax 9. Post office 10. Other Detail: __________________________________________
2.8. What type of Internet services do you access? TYPE FREQUENCY
1. Email 2. Website surfing

3. Both (email and website surfing) 4. Not applicable
2.9. (For interviewees with access to mobile phones. Multiple responses accepted) In what ways do you use your mobile phone?
1. Short message service (SMS) 2. Receive calls 3. Make calls 4. Access email 5. Internet surfing 6. Mobile banking 7. All the above
3. AVAILABLE SERVICES 3.1. Where do you access these ICT tools from?
(Radio, TV, computer, email, Internet, mobile phone, telephone landline) 1. Community centre 2. Internet cafe’s 3. Call centre 4. University 5. School 6. College 7. Post office 8. Home 9. Place of work 10. Neighbors 11. Others Details: ______________________________
3.2. Do you receive or access any online government services? (Market information/prices, pension services, health alerts, weather)
1. Yes 2. No 3.3 If yes, how often do you receive or access these services?
1. Regularly 2. Seldom 3. Not applicable 3.4 Which tools do you use to receive or access government information? (Birth certificates, health alerts, financial services
etc.) 1. Email 2. Telephone landline 3. Mobile phone 4. TV 5. Radio 6. Newspaper 7. Postal office 8. Word of mouth 9. Internet 10. Physical visit to office 11. Have not accessed any
4. AVAILABLE INFRASTRUCTURE 4.1 Do you have access to electricity?
1. Yes 2. No 4.2 Which company is your mobile phone service provider? (For mobile phone owners. Multiple answers accepted).
1. MTN 2. Vodacom 3. Cell C 4. Virgin

5. Other Detail:_________________________ 4.3. Is a landline service available in your area?
1. Yes 2. No 4.4. Are there wireless networks, such as satellite and microwave links available?
1. Yes 2. No 3. Don’t know
Question 4.5. 4.6.
How long do you have to travel to access the services?
1. 0 km 2. Less than 1km 3. 1 – 5km 4. 5 – 10km 5. More than 10km
How do you travel to access the services? 1. On foot 2. On bicycle 3. Motorcycle 4. Personal car 5. Public transport (bus) 6. Public transport (taxi) 7. Public transport (train) 8. Available from home
1. Radio
2. Mobile phone
3. Telephone landline
4. Fax
5. TV
6. Computer
7. Internet
8. Others __________
9. None
5. THE IMPACT OF ICTS ON YOUR SOCIAL AND ECONOMIC DEVELOPMENT (Cut Cost, Increase Efficiency,
Increase Economies of Scale, Increase Productivity, Marketing, Prestige, Social Status, Symbol of Wealth, Social Communication, Social Contact Ability (police and doctors), Security, Knowledge Sharing)
5.1 Do you think access to the above ICTs enhances your livelihood?
1. Yes 2. No 3. Not sure 5.2 (a) How have ICTs mostly contributed to improving your living standards? (Select best option)
1. Improved business 2. Increased access to education 3. Eased communication 4. Increased access to key information 5. Others Detail:______________________ (b) How and why? Please explain. ________________________________________________________________________________________________________________________________________________________________________________________________________________________
5.3. Are ICT tools used to increase empowerment and voice of your community in decisions that affect their lives and in holding government accountable?
1. Yes 2. No
Question 5.4. 5.5. 5.6. 5.7.

Which tools play a major role in increasing the empowerment and voice of your community in decisions that affect their lives and in holding government accountable?
Which tools below are the best sources of local information? (Please select best 3 options, 1 being the best option) Please explain why.
Which tools are used to communicate information to members of the community? (Please select best 3 options, 1 being the best option) Please explain why.
Which tools most successfully fit with your traditional ways of communicating and sharing information? (Please select best 3 options, 1 being the best option) Please explain why.
1. Radio
2. Mobile phone
3. Telephone landline
4. TV
5. Internet
6. Email
7. Newspaper
8. Fax
9. Post office
10. Word of mouth
11. Community meetings
12. Others ________
13. Explanation
5.8 How would you view the impact brought about by ICTs?
1. Positive 2. Negative 3. In-between 4. None 5.9. Please explain your answer in question 5.8.
6. FOR WHAT PURPOSE DO YOU USUALLY USE THESE ICTs MENTIONED ABOVE? (Limit to top 3)
1. Market information e.g. market prices, new markets 2. Availability of credit and subsidies 3. Information on new products e.g. pesticides, seeds 4. Information on clients and debtors 5. Job opportunities 6. Information about friends and family members 7. Crises e.g. emergencies, deaths, police, fire brigade 8. News about sick relatives 9. Banking services 10. Social and religious events e.g. marriages, dating 11. Entertainment 12. Education opportunities (schools and further education) 13. Access to Information and Knowledge 14. Others: ___________________________________________________________

Annex 2: Semi-structured Questionnaire/Interview
Guide 1
A qualitative survey with focus groups comprising of municipality/ward executives, village/town executives and community organizations operating in the respective villages/towns.
Enhancing the Livelihood of the Rural Poor: The Role of Information and Communication Technologies1
Interview Guide 1 (for the Focus Group Discussion of Key Informants) 1 First we would like to know a little about each one of you. So please tell us your name and something about yourself. 2 Please tell us something about the economic and social status (performance) in this village/ward/district? – Economic
situation and life (living standards of the people in the area) 3 What is your view on ICT? – (just to be sure on the extent of ICT knowledge). In other words, check whether or not the FGD
members are ICT literate. 4 Is ICT commonly used in this area? When did people of this area start to use it and how did it emerge? 5 How is ICT used by the people in this village/ward/district? 6 In which of the following sectors can ICT play a key role? (Ranking 1 – 3: 1 = Top most; 2 = Average; 3 = least)
1. Health 2. Agriculture 3. Business 4. Education 5. Government information services 6. Social/ Entertainment 7. Environment 8. Others Detail: __________________
7 What are the obstacles towards accessing ICT and how can they be removed? 8. Which segment of the population can access ICT? What are the gender proportions? 9 What do you consider to be the benefits to those who access ICT here? 10 What do you consider to be the negative impacts to those who access ICT and to the rest of the society? 11 Do you see any link of ICT to livelihoods in terms of e.g. livelihood sources, livelihood strategies? Please give examples. 12 If you were to give advice to the government, private sector or donors about what they could do to help the ICT facilities in
this community work better, what advice would you give them? 13 Is there anything else (ideas) you would like to say? Any success stories or failures?
1 Obviously, these questions and/or discussion start after an introduction of the team, the project etc. Thus a few paragraphs of the introduction must be prepared at a later stage.

4
5
�
Annex 3: Semi-structured Questionnaire/Interview Guide 2
Telephone interviews/discussions: representatives from government ministries and agencies, donor community, academic institutions, media, private sector and CSOs
Questions Possible answers
Project management 1. Please briefly describe the project (five minutes)
2. What aspects of livelihoods are being supported? 3. What information opportunity/desire is being addressed? 4. What previous alternatives existed before the project implementation? 5, How was that opportunity/desire identified? 6. How is the project organized and administered? 7. Who is monitoring and evaluating the progress of the project? 8. What was the role for local actors in the project administration and evaluation? 9. Is the project based on an already existing community project or association?
1. Reducing vulnerability through access to appropriate information; 2. Enhancing assets; 3. Influencing institutional and policy processes/holding government accountable 4. Making institutions more accessible (public and private)/enhancing service delivery 5. Opening new livelihood opportunities 6. Knowledge sharing
Stakeholders 10. Which types of actors are involved and how (benefiting, delivering, intermediaries, partnering)? 11. What kinds of partnerships are being built, if any? 12. Are costs shared, and if so, how? 13. Is local capacity being developed? 14. What are the cooperation challenges among actors?
1. Householders 2. Producer organizations 3. Local NGO 4. Local government 5. Public service providers 6. Private sector organizations 7. Private sector organizations 8. National NGOs 9. National government 10.International donors
Provided services 15. Which services are provided? 16. What is the scale of the initiative? 17. Are these micro, meso, or macro-level efforts? 18. Is the service scalable? Where? How? 19. What type of technology is being employed? 20. How was the technology decided upon?
1. Information technologies 2. Telecommunications technologies 3. Networking technologies 4. Other
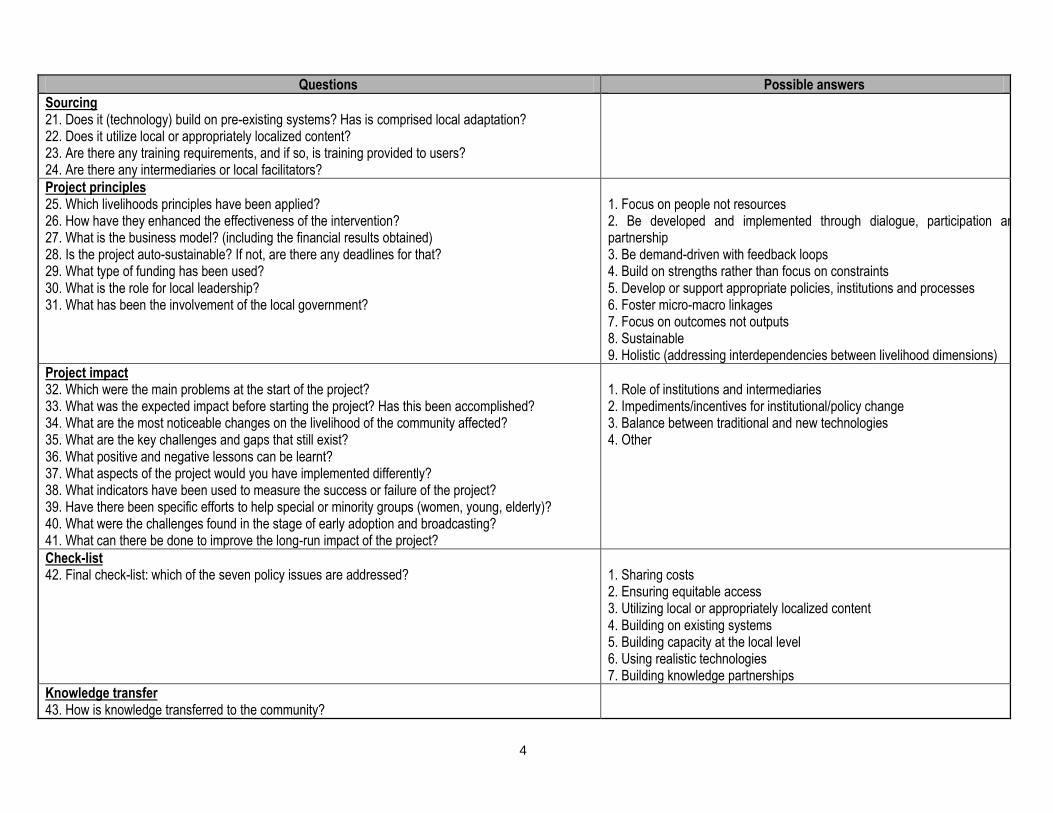
4
6
�
Questions Possible answers
Sourcing 21. Does it (technology) build on pre-existing systems? Has is comprised local adaptation? 22. Does it utilize local or appropriately localized content? 23. Are there any training requirements, and if so, is training provided to users? 24. Are there any intermediaries or local facilitators?
Project principles 25. Which livelihoods principles have been applied? 26. How have they enhanced the effectiveness of the intervention? 27. What is the business model? (including the financial results obtained) 28. Is the project auto-sustainable? If not, are there any deadlines for that? 29. What type of funding has been used? 30. What is the role for local leadership? 31. What has been the involvement of the local government?
1. Focus on people not resources 2. Be developed and implemented through dialogue, participation and partnership 3. Be demand-driven with feedback loops 4. Build on strengths rather than focus on constraints 5. Develop or support appropriate policies, institutions and processes 6. Foster micro-macro linkages 7. Focus on outcomes not outputs 8. Sustainable 9. Holistic (addressing interdependencies between livelihood dimensions)
Project impact 32. Which were the main problems at the start of the project? 33. What was the expected impact before starting the project? Has this been accomplished? 34. What are the most noticeable changes on the livelihood of the community affected? 35. What are the key challenges and gaps that still exist? 36. What positive and negative lessons can be learnt? 37. What aspects of the project would you have implemented differently? 38. What indicators have been used to measure the success or failure of the project? 39. Have there been specific efforts to help special or minority groups (women, young, elderly)? 40. What were the challenges found in the stage of early adoption and broadcasting? 41. What can there be done to improve the long-run impact of the project?
1. Role of institutions and intermediaries 2. Impediments/incentives for institutional/policy change 3. Balance between traditional and new technologies 4. Other
Check-list 42. Final check-list: which of the seven policy issues are addressed?
1. Sharing costs 2. Ensuring equitable access 3. Utilizing local or appropriately localized content 4. Building on existing systems 5. Building capacity at the local level 6. Using realistic technologies 7. Building knowledge partnerships
Knowledge transfer 43. How is knowledge transferred to the community?

4
7
�
Annex 4: List of Interviewees
Kannaland Interview Questionnaire 1 (all March 5, 2007) 1. Maria Pretorius, beneficiary/occupant of Zoar 2. Glenda Barry, beneficiary/occupant of Zoar 3. Melanie Rittels, beneficiary/occupant of Zoar 4. Mrs Johannes, beneficiary/occupant of Zoar 5. Maria Daniels, beneficiary/occupant of Zoar 6. Yvonnes Hess, beneficiary/occupant of Zoar 7. Maria Kiewietz, beneficiary/occupant of Zoar 8. Karican Jansen, beneficiary/occupant of Zoar 9. Frances Hill, beneficiary/occupant of Zoar 10. Magdalene Claassen, beneficiary/occupant of Zoar 11. Rodney Claassen, beneficiary/occupant of Zoar 12. Floors Gertse, beneficiary/occupant of Zoar 13. Naomi Willemse, beneficiary/occupant of Zoar 14. Coenraad Frans, beneficiary/occupant of Zoar 15. Josephine Steven, beneficiary/occupant of Zoar 16. Condre Claassen, beneficiary/occupant of Zoar 17. Canna Stuurman, beneficiary/occupant of Zoar 18. Reone Rooi, beneficiary/occupant of Zoar 19. Elmarie Levies, beneficiary/occupant of Zoar 20. Catrina Claassen, beneficiary/occupant of Zoar 21. Jaco Buffel, beneficiary/occupant of Zoar 22. Marisa Joon, beneficiary/occupant of Zoar 23. Eloise Frans, beneficiary/occupant of Zoar 24. Michael Pikaan, beneficiary/occupant of Zoar 25. Hilda Stuurmand, beneficiary/occupant of Zoar 26. Colin Adendorff, beneficiary/occupant of Zoar 27. Hester Faroa, beneficiary/occupant of Zoar 28. Maria Ludick, beneficiary/occupant of Zoar 29. Lukas Swartbooi, beneficiary/occupant of Zoar 30. Jeffrey February, beneficiary/occupant of Zoar Interview Questionnaire 2 1. Magdalena Barry, Municipal Ward Councilor and Previous Mayor of Kannaland Municipality, March 6, 2007 2. Ronnie Claassen, Secretary and Member of the Health and Welfare Forum, Kannaland (also community worker),
March 6, 2007 3. Cindy Bezuidenhout, Editor of local newspaper in Kannaland called Towersig, March 6, 2007 4. Jaenette Heraldien, Principal of Zoar RP Botha VGK Primary School, Project Leader of the Khanya project and also
organized local mobile library for the district, March 6, 2007 5. Dendalene McKenna, Umsobomvu Youth Fund, Kannaland Youth Advisory Center, March 6, 2007 6. Letisha Fortuin, GO Manager, Amalienstein, Casidra (computer accesspoints), March 6, 2007 7. SIB Alan Ellis, Head of Administration Alan Blythe Hospital, Ladismith (Zoar Clinic falls under this hospital), March 6,
2007 8. Sister Galant, Zoar Clinic, March 6, 2007 9. Marianna Bouwer, CEO of BFT Communications, regional telecommunications and Internet service provider, March
6, 2007 10. Herman Bouwer, Project Manager, BFT Communications, regional telecommunications and Internet service provider,
March 7, 2007 11. Johan Bronkhorst, Regional Manager Casidra, development project management organization, March 8, 2007 12. John Smith, Local Economic Development Manager, Municipality of Kannaland, March 6, 7, and 23, 2007 13. Riaan Oosthuizen, Proprietor of Internet service delivery initiative in Kannaland, March 7, 2007

4
8
�
14. Julia van Tonder, Head of Agricultural Development Services, Department of Agriculture, Kannaland, March 7, 2007 15. Hettie Weymar, Manager of the Tourism Bureau, Kannaland, March 8, 2007 16. Max Randall, Oudtshoorn Experimental Farm, Department of Agriculture, March 7, 2007 17. Hendrik Barnard, Human Resource Manager, Kannaland Municipality, March 6, 2007 18. Pastor Jerome Kannemeyer, Luther Church and Project Leader and Facilitator of local socio-economic up-liftment
projects, March 7, 2007 19. Koos Niewoudt, Systems and Information Manager, Eden District Municipality, March 9, 2007 20. Rhyn Alberts, Head of Projects: IT Department of Eden District Municipality, March 20, 2007 21. Erina de Villiers, Administration Officer of Eden District, March 9, 2007 Kopanong Interview Questionnaire 1 1. Michael Carelse, beneficiary/occupant of Springfontein, March 12, 2007 2. Abraham Oliphant, beneficiary/occupant of Springfontein, March 12, 2007 3. Ivan Mkafu, beneficiary/occupant of Springfontein, March 12, 2007 4. Willem Mohapi, beneficiary/occupant of Springfontein, March 12, 2007 5. Maria Taiwe, beneficiary/occupant of Springfontein, March 12, 2007 6. Mina Oerson, beneficiary/occupant of Springfontein, March 12, 2007 7. Docter Hanong, beneficiary/occupant of Springfontein, March 12, 2007 8. Roelf Oersenn, beneficiary/occupant of Springfontein, March 12, 2007 9. Sereiso Tt, beneficiary/occupant of Springfontein, March 12, 2007 10. Grace Tana, beneficiary/occupant of Springfontein, March 12, 2007 11. Pieter Magwar, beneficiary/occupant of Springfontein, March 13, 2007 12. David Rulufu, beneficiary/occupant of Springfontein, March 13, 2007 13. Joseph Mohale, beneficiary/occupant of Springfontein, March 13, 2007 14. Angeline Bushula, beneficiary/occupant of Springfontein, March 13, 2007 15 Nodabephi Gongheka, beneficiary/occupant of Springfontein, March 13, 2007 16. Elsie Maneli, beneficiary/occupant of Springfontein, March 13, 2007 17. Thys Dewee, beneficiary/occupant of Springfontein, March 13, 2007 18. John Deketa, beneficiary/occupant of Springfontein, March 13, 2007 19. Piet Dipa, beneficiary/occupant of Springfontein, March 13, 2007 20. Constance Dinaka, beneficiary/occupant of Springfontein, March 13, 2007 21. Selina Kutyunga, beneficiary/occupant of Springfontein, March 13, 2007 22. Mrs Maviskuputsa , beneficiary/occupant of Springfontein, March 13, 2007 23. Emmeenlia Oersa, beneficiary/occupant of Springfontein, March 13, 2007 24. Susarran Melatu, beneficiary/occupant of Springfontein, March 13, 2007 25. Xolani Ngcambe, beneficiary/occupant of Springfontein, March 13, 2007 26. Monges Lufata, beneficiary/occupant of Springfontein, March 13, 2007 27. Jonas Mfunda, beneficiary/occupant of Springfontein, March 13, 2007 28. Julia Ntembi, beneficiary/occupant of Springfontein, March 13, 2007 29. Joshua Skhosana, beneficiary/occupant of Springfontein, March 13, 2007 30 Mavis Tsenou, beneficiary/occupant of Springfontein, March 13, 2007 Interview Questionnaire 2 1. Mr S.A. Ntaitsane, Mayor of Kopanong Municipality, March 12, 2007 2. Gladis Mogaliso, Springfontein Ward Councilor, March 24, 2007 3. Dr DP Van Huyssteen, Editor of local newspaper in Xhariep called Xhariepdam Times, March 14, 2007 4. Rina Simes, Editor of local newspaper in Bethuli called Bethuli Post, March 12, 2007 5. Eric Maphalane, Local Economical Development Manager, Kopanong Municipality, March 13, 2007 6. Ndzelani Smock, MPCC Manager in Tromsburg, Kopanong, March 12, 2007 7. Mr A Topking, Member of District Communications Forum, Kopanong 8. Mr Roanne Harding, Proprietor of local Internet service provider (Bethuli.com), March 20, 2007 9. Mr Mopedo Mohale , Local Economical Development Manager, Xhariep District Municipality, March 24, 2007 10. Christiaan Eikstedt, Principal of Springfontein Secondary School and Project Manager of the media center project at his
school, March 12, 2007 11. Neels, Head of Administration, Springfontein Offices, Kopanong Municipality, March 14, 2007 12. Mrs Post Master, Springfontein Post Office, March 12, 2007

4
9
�
13. Mr Nico Kruger, Project Manager of NAVO, March 11, 2007 14 Christo van Staden, Editor, Volksblad group community newspapers, March 22, 2007. 15 Ted Hope, Chairperson, Chamber of Business Bethule, March 19, 2007 Questionnaire 3 1. Mr Dumisani Sondlo, Manager of Administration and Media, ISSA, March 23, 2007 2. Ingrid Bruwnse, Head of Training and Development, NEMISA, March 22, 2007 3. Joyce Molwele, Project Manager of PITs project, March 20, and 23, 2007 4. Neels du Toit, Government Communications (GCIS), Limpopo, March 26, 2007 5. Elaine Coetsee, Vodacom Foundation Manager, Project Coordination 6. Nobuahlu Tsonka, Vodacom Foundation Project Coordinator 7. Mashibaba Matobo, MTN Foundation, Project Manager 8. Abigale Mndebeba, Telkom, Project Manager 9. Gert Combrinck, CEO Casidra, 10. Samy Louis Mannak, Regional Coordinator of Community Development Services, Department of Housing and Local
Government, March 15, 2007 11. Clinton Walker, Khanya Project, March 17, 2007 12. Toni Eliasz, CEO, Ungana-Afrika 13. Gugu Mjadu, National Manager , Umsobomvu Youth Fund 14. Letisha Volmer, Manager Social Investments and Public Relations, Sentech 15. Jason Hunt, Shuttleworth Foundation, Project Manager. 16. Siswe Dyasi, Centre Manager MPCC Colesburg, Northern Cape, March 26, 2007 17. Ivo Kole, GIC Manager for Tshedimosetso MPCC, North West, March 26, 2007 18. Steven Skippers, Centre Manager, Laingsberg MPCC, Western Cape, March 24, 2007 19. Marlene Hendricks, CGIS Central Karoo, Western Cape, March 24, 2007 20. Russel Maritz, GIC Manager, Beaufort West MPCC, Western Cape, March 24, 2007 21. Hina Patel, Competence Manager, Information Society Applications, Meraka Institute (AAIICT), CSIR, March 26,
2007 22. Mlindela Sunduza,GIC Manager, Centre Manager Sterkspruit MPCC, March 23, 2007 23. Mr M. Bam, Center Manager Thembalethu MPCC, George, Western Cape, March 26, 2007 24. Ishmael Dithebe, Center Manager, Namahadi MPCC, Phuthaditshaba, Free State, March 26, 2007 25. William Raosi, GIC Manager, ATOK MPCC, Atok, Limpopo, March 24, 2007 26. Clara Mainga, Center Manager, Kgolomomodumo MPCC, Mouste West, Mpumalanga, March 26, 2007 27. Richard Mathevula, Center Manager, Makhuva MPCC, Phangweni, Limpopo, March 26, 2007

5
0
�
Annex 5: Country Workshop Report
A national workshop with 312 participants was held in Cape Town to present the draft country report and the main findings. Group discussions were held to discuss the ICT challenges for rural livelihoods in South Africa. Three major questions were covered: What we do know? What don’t we know? What work is needed or where can donors make a difference? 1. Workshop Program Time Activity 8:30 Registration and coffee 9:00 Welcome 9:05 Round robin introduction 9:15 Introduction and presentation of project
10:00 Report back on the South African research 11:00 Tea/coffee 11:30 Group discussion 13:00 Report back from group discussions 13:40 Concluding comments 13:45 Lunch
2. List of Participants 1. Ms. Tania Abrahams (SITA) 2. Ms. Carmenita Adonis-Dudley (Telkom) 3. Ms. Beatrice Aliba (PLAAS) 4. Mr. Michael Arendse (CoCT) 5. Mr. Paul de Beer (The Village Consultants) 6. Mr. Nico Elema (GIS GlobalImage) 7. Mr. Gabila Fohtung (UWC IS) 8. Prof. Louis Fourie (UWC IS) 9. Mr. Issa Habimana (UWC IS) 10. Mr Johan Kistner (University of Stellenbosch) 11. Mr. Ferdi Lochner (CoCT) 12. Dr. Glen Mansfield (The Strategy Institute) 13. Mr. Paul Matthews (ODI) 14. Dr. Joelien Pretorius (UWC Political Studies) 15. Ms Trunel van der Westhuizen (Consultant) 16. Ms Marcelle Lodewyk (UWC IS) 17. Ms Elmarie Maree (Integridata) 18. Dr Keith Gottschalk (UWC Political Studies) Post graduate students 19. Mr. Eugene Beyers (UWC IS); 20. Ms. Nuraan Davids (UWC IS); 21. Mr. Cedric Harvey (UWC IS); 22. Ms. Sadeeqa Johnson (UWC IS); 23. Ms. Lerato Lichaba (UWC IS); 24. Mr. Mcebisi Litile (UWC IS); 25. Ms Palesa Machacha (UWC IS); 26. Ms Bella Maja (UWC IS); 27. Ms. Nomasoka Mbilini (UWC IS); 28. Mr. Alfred Mbwembwe (UWC IS); 29. Ms. Albertine Mujawamaliya 30. Ms Lavinia Pillay (UWC IS); 31. Ms. Tswahanelo Mathabathe (UWC IS);
2 A total of 246 were invited. Many tendered their apologies owing to their hectic schedule at financial year end and the Easter school break that would start the next day.

5
1
�
3. Brief summary of the key points that emerged from the general discussion Why concentrate only on the rural poor and not urban poor, as the rural poor are very few in numbers? The report will show that rural poor are actually not that small in number. Rural areas are very underdeveloped in comparison with other parts of South Africa and the rest of the world. There is a need to look at maximizing improvements with regard to the livelihoods of the poor. Need to be careful when talking about loans/credit for small farmers. Question about the timeframe of the final world report – mid May. Primary and secondary benefits of ICT in areas. People do not have PCs in homes (primary benefit). Consider using secondary ICT benefits for critical mass e.g. banks,
delivery service, transport. This will make the rural areas more efficient on a large scale. There has to be some paradigm shift with regard to ICT as a basic human right like electricity and water. People still
have to pay R1.60 to use a public telephone, and we’re talking about the poor, who do not have money. Communication costs in South Africa are enormously high in comparison with other developing countries.
The reason for the above may be that South Africa is too capitalistic as a country or society. The approach to ICT as a 'cash cow' is short-sighted since access to affordable ICT can enhance the economy. It is important to soften the impact of the technology-driven knowledge-based society. Often people do not have a
choice and just need to conform, e.g. need to have bank account to get a salary. Government should realize that their policies are often functioning in silos and that departments do not communicate
with one another. PCs should be connected to the Internet and geographically well distributed, e.g. it became evident from the empirical
study that quite often the nearest PC was 1km away and it was not even connected. Web connection was 5km away. We should be careful about taking successful factors from other countries and applying them to South Africa. The
infrastructure, culture and economical situation generally are different in each country. Micro-credit for development was initiated in South Africa. However, there aren’t many success stories. As a result of our developed world infrastructure we are at a good level in developing and introducing communication
infrastructure to 'rural areas'. Building knowledge in rural areas is important for constant growth. Banks will have to give support, like micro-credit) to
entrepreneurs and farmers in rural areas. The government has regulated micro-finance in South Africa. 4. Group discussions 4.1 Group 1 4.1.1 What we know i. Cape Town City Council’s SmartCape concept was exported with success to the rural areas of Bitterfontein and
Oudtshoorn. PCs are made available in libraries for people to use after purchasing a 45-minute voucher. ii. Marocco project of 'hole in the wall' computers. iii. Schools in Lynedoch (near Stellenbosch) were equipped with computers. The project was not very successful
owing to lack of commitment of teachers. iv. In Atlantis, people managed to get jobs overseas by publishing their CVs on the web by using public ICT facilities. v. Cell phones are becoming an important Internet access device.
4.1.2 Contributing factors to success i. Reliability of computer equipment ii. Open source applications iii. Commitment of teachers and all parties involved iv. Entrepreneurial spirit v. Electronic searches vi. Exposure to and training on a PC vii. Simplicity of the project and ICT item viii. Peer skills transfer ix. Execution of good policy
4.1.3 What we do not know i. Extensive information on what the real needs are of the rural poor ii. Coordinated research information about ICTs and livelihoods of the poor iii. Coordinated information regarding players, like donors
5
2
�
iv. Information regarding success stories and lessons to be learnt v. Skills and lacking skills of the project workers and project managers vi. Communication problems and language barriers vii. Knowledge needs for secondary ICT problems of rural people, for example withdrawing money from bank 4.1.4 Work that needs to be done i. Need more qualitative research on human resource issues ii. Need central location for funding of resource projects iii. Confusion between roles of local government and central government iv. Harmonization of policies v. Policies need to be reviewed more often as situations, needs and technology changes vi. Donors must have a long-term perspective vii. Shorten the chain of supply viii. Central register missing ix. Application forms for funding too complex x. Keep e-website of government up to date xi. Only a single source of data
4.2 Group 2 4.2.1 What we know Rural communities are disconnected and isolated. Success stories exist where local government takes over responsibilities, like Knysna’s VANS. The responsibility was disseminated to local authorities in distributing the services. Other examples exist where the telephone industry offers lower rates for communities, e.g. electronic banking where access is available at lower rates (15 cents withdrawal charge at Capitec Bank). 4.2.2 Contributing factors to success i. Access to information ii. Utilizing cellular technology – SITA, CSIR, health, tele-medicine iii. Dissemination of critical information iv. People must have a voice (Gateway project for translation of important information into the nine official languages) v. Technology must benefit the rural poor
4.2.3 What we do not know i. Clarification of MPCCs ii. Clarification on the standardization of services iii. Involvement of local people (e.g. the Intergovernmental Relations (IGR) Framework Act, No:13 of 2005) 4.2.4 Work that needs to be done i. Government forming public-private partnerships with local people ii. Independent regulator (private body) iii. Elimination of bureaucracy which prevents uplifting of local community iv. Alignment of e-government and poverty reduction strategy v. Training and better awareness of the media (TV and radio, the so-called traditional media) vi. Government to promote the relocation of citizens to rural areas vii. Policy re-amendment viii. Deregulation of licenses
4.3 Group 3 4.3.1 What we know Nothing much that shows visible improvement with regard to the rural poor has been done over the past few years, since telephone, TV and radio have been available for quite some time. ATMs have not really empowered people, except for the younger generation (the problem of the generation gap). Computers were installed but are not fully utilized owing to a lack of training as well as teachers. Young people leave rural areas to improve their education, but the livelihoods of the people staying behind stays the same. There is a considerable difference between age groups and the various geographical areas (e.g. rural and urban) with regard to the necessary skills for using ICTs.
4.3.2 What we do not know

5
3
�
i. We do not know why rural people are not motivated or what their needs are; ii. We do not know how we can use technology to make their lives better or improve their livelihoods because we do not
know how their lives are governed or operated and what is important to them; iii. We do not know how technology changes or a change in environment can either advance or complicate their lives and we
do not know how they will approach this. 4.3.3 Work that needs to be done i. We need to understand the way that people operate in rural areas before we step in and presume what their needs are.
A clear assessment is needed of what technologies the communities need and how technology can improve their lives; ii. We need to change the mindset of the community, mobilize and motivate them to be open to change and accept
technology; Iii People are tired of waiting for government to do things and are not motivated; iv. Training for teachers and facilities are needed; v. Incentives need to be in place for intellectual and qualified people who want to return to rural areas; vi. Government and donors need to: Assess and fully understand people’s lives in rural areas Change people’s mindset and attitudes Training and incentives for intellectuals and qualified people to go back home and plough back into the community Assess how technology can improve their lives in a micro sense Do experiments to show people how simple technology can improve their lives or offer them an opportunity which did
not exist before

5
4
�
Annex 6: Sample Frame
Municipality HDI
Beaufort West 0.64
Berg River 0.66
Breede River/Winelands 0.65
Breede Valley 0.68
Cape Agulhas 0.69
Cape Town (Central) 0.69
Cedarberg 0.67
Drakenstein 0.70
George 0.69
Kannaland 0.66
Knysna 0.69
Laingsburg 0.68
Langeberg 0.71
Matzikama 0.71
Mossel Bay 0.70
Oudtshoorn 0.69
Overstrand 0.73
Plettenberg Bay 0.71
Saldanha Bay 0.71
Stellenbosch 0.74
Swartland 0.74
Swellendam 0.72
Theewaterskloof 0.71
Witzenberg 0.72

5
5
�
Annex 7: 2006 Mid-year Population Estimates for South Africa
Population group Male number Male % of total population
Female Number
Female % of total
population
Total Number % of total population
Colored 2,060,000 8.8 2,138,800 8.9 4,198,800 8.9
Indian/Asian 570,200 2.4 593,700 2.5 1,163,900 2.5
White 2,138,900 9.2 2,226,400 9.3 4,365,300 9.2
Total 23,327,600 100 24,063,300 100 47390900 100
Source: Statistics South Africa (2006).

5
6
�
Annex 8: South African Tax Revenue Changes in Source
Taxes 1979/80 2005/06
Direct tax paid by % %
Individual 19.9 32
Company 33.5 19
Indirect tax for
GST/VAT 12.8 28
Customs and excise 13.2 7
Fuel levy 0 6
Source: www.sars.gov.za.

5
7
�
Annex 9: Household Income as Per Capita Income
11%
19%
19%18%
10%
23%
R0-R149 R150-R299 R300-R599 R600-R1199 R1200-R1999 R2000+
Source: compiled from data from SAARF's AMPS 2005 RA Eighty20 analysis. 30% of South Africa households, 40% of the population, have a per capita income of less than R10 per day, less than R300 per month) A further 195 of South Africa households have a per capita income of R10-20 per day, R300 to R599 per month.
National monthly income profile of the employed population between the ages of 15 and 65 in 1996 and 2001
1996 2001
Income category
Percentage
Income category
Percentage
Male Female Male Female
Cum Cum Cum Cum
None 1.00 1.00 1.47 1.47 None 1.98 1.98 2.60 2.60
R1 – R200 5.92 6.92 12.26 13.73 R1– R400 10.83 12.81 17.88 20.48
R201 – R500 13.25 20.17 21.72 35.44 R401– R800 15.17 27.98 19.46 39.94
R501 – R1,000 19.31 39.48 17.74 53.18 R801– R1,600 23.88 51.87 19.36 59.30
R1,001 – R1,500 19.87 59.35 13.78 66.97 R1,601– R3,200 20.76 72.63 16.55 75.85
R1,501 – R2,500 14.34 73.68 12.24 79.21 R3,201– R6,400 13.16 85.78 15.07 90.92
R2,501 – R3,500 7.74 81.42 8.58 87.78 R6,401– R12,800 8.21 93.99 6.47 97.40
R3,501 – R4,500 5.22 86.64 5.47 93.25 R12,801– R25,600 3.89 97.88 1.66 99.05
R4,501 – R6,000 5.00 91.64 3.81 97.06 R25,601– R51,200 1.32 99.20 0.50 99.55
R6,001 – R8,000 3.24 94.88 1.52 98.58 R51,201–R102,400) 0.43 99.63 0.28 99.83
R8,001 – R11,000 2.39 97.27 0.78 99.35 R102,401– R204,800 0.22 99.86 0.12 99.95
R11,001 – R16,000 1.47 98.74 0.38 99.73 R204,801 and more 0.14 100.00 0.05 100.00
R16,001 – R 30,000 0.90 99.64 0.19 99.92
Cum = cumulative percentage
R30,001 or more 0.36 100.00 0.08 100.00

5
8
�
Annex 10: Unemployment by Province
Provincial employment/unemployment statistics (% unemployed)
0
500000
1000000
1500000
2000000
2500000
3000000
3500000
Easte
rn
Cape
Fre
e S
tate
Gau
teng
Kw
aZulu
-
Nata
l
Lim
pop
o
Mpu
mal
ang
a
Nort
her
n
Cape
Nort
h W
est
West
ern
Cape
Employed Unemployed
Source: Statistics South Africa (2001).

5
9
�
Annex 11: Summary of Labor Market Outcomes for 1995-2003
Summary of labor market outcomes, 1995-2003
Source: Statistics South Africa (2005).
The overall trends in the dimension of unemployment in the period 1995-2003 can be summarized as follows:
Overall broad unemployment rose by 13.3% points from 29.4% to 42.7%.
The overall duration of unemployment (narrow) increased 4.6 percentage points, from 32.5% to 37.1%.
The working poor are increasing in number.
There are important changes in unemployment distribution across worker groups.
Dimension Particularly high unemployment for
Race Africans
Gender Males
Age Youth, between 16 and 25 years of age
Education level Persons with junior and secondary education
Provinces Gauteng, Free State, North West and Limpopo

6
0
�
Annex 12: South Africa’s Human Development Index 2004
HDI value Life expectancy at birth (years)
Adult literacy rate (% ages 15 and older)
Combined primary, secondary and tertiary
gross enrolment ratio (%)
GDP per capita (PPP US$)
1. Norway (0.965) 1. Japan (82.2) 1. Georgia (100.0) 1. Australia (113.2) 1. Luxembourg (69,961)
119. Vanuatu (0.670) 154. Kenya (47.5) 74. Mauritius (84.4 64. Slovakia (76.7) 53. Mauritius (12,027)
120. Equatorial Guinea (0.653)
155. Namibia (47.2) 75. São Tomé and Principe (83.1)
65. Hong Kong, China (SAR) (76.7)
54. Latvia (11,653)
121. South Africa (0.653)
156. South Africa (47.0)
76. South Africa (82.4)
66. South Africa (76.6)
55. South Africa (11,192)
122. Tajikistan (0.652) 157. Tanzania, U. Rep. of (45.9)
77. Lesotho (82.2) 67. Guyana (76.5) 56. Chile (10,874)
123. Morocco (0.640) 158. Côte d'Ivoire (45.9) 78. Oman (81.4) 68. Qatar (76.3) 57. Malaysia (10,276)
177. Niger (0.311 177. Swaziland (31.3) 128. Mali (19.0) 172. Niger (21.5) 172. Sierra Leone (561)
Source: UNDP (2004).

6
1
�
Annex 13: Selected Indicators of Human Poverty for South Africa
Human Poverty Index (HPI-
1) 2004 Probability of not
surviving past age 40 (%) 2004
Adult illiteracy rate (% ages 15 and older) 2004
People without access to an improved water source
(%) 2004
Children underweight for age
(% ages 0-5) 2004
1. Uruguay (3.3) 1. Hong Kong, China (SAR) (1.5)
1. Cuba (0.2) 1. Bulgaria (1) 1. Chile (1)
51. Congo (27.9) 150. Côte d'Ivoire (42.3) 68. Namibia (15.0) 44. Samoa (Western) (12 56. Iran, Islamic Rep. of (11)
52. Djibouti (30.0) 151. Guinea-Bissau (42.9) 69. Mauritius (15.6) 45. Seychelles (12) 57. Malaysia (11)
53. South Africa (30.9) 152. South Africa (43.3) 70. South Africa (17.6) 46. South Africa (12) 58. South Africa (12)
54. Sudan (31.3) 153. Cameroon (43.9) 71. Lesotho (17.8) 47. Namibia (13) 59. Turkmenistan (12)
55. India (31.3 154. Tanzania, U. Rep. of (44.4)
72. Oman (18.6) 48. Honduras (13 60. Ecuador (12)
102. Mali (60.2) 172. Swaziland (74.3) 117. Mali (81.0) 125. Ethiopia (78) 134. Nepal (48)
Source: UNDP (2004).
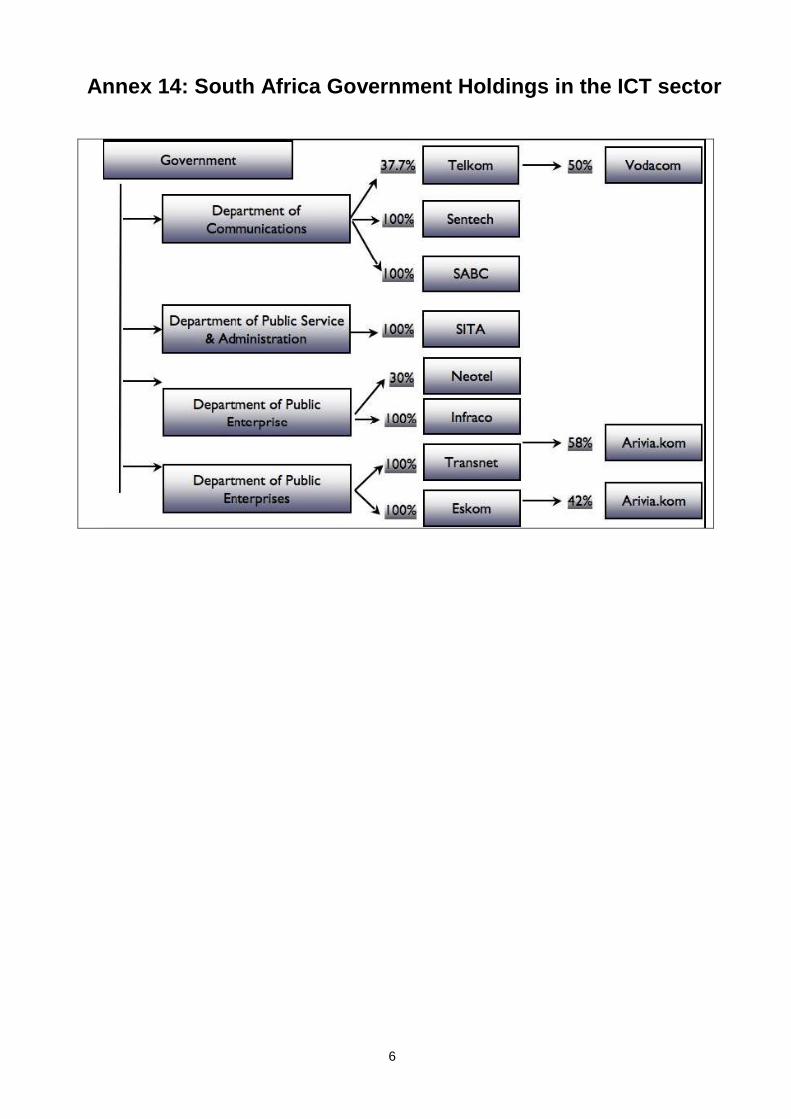
6
2
�
Annex 14: South Africa Government Holdings in the ICT sector

6
3
�
Annex 15: Coverage of Cell Phone Providers
MTN coverage
Vodacom coverage
Cell C coverage
Source: GSM World (2006).

6
4
�
Annex 16: Private Radio Stations
i. Classic FM in Gauteng ii. Cape Talk MW in the Western Cape iii. P4, a jazz station in Cape Town iv. Kaya FM, a multilingual youth radio station in Gauteng v. Y-FM, broadcasting in Johannesburg in isiZulu, Sesotho and English vi. Radio KFM vii. Radio Algoa viii. Radio Oranje ix. Highveld Stereo x. Radio 702 in Gauteng xi. East Coast Radio xii. Radio Jacaranda
Source: www.southafrica.co.za.

6
5
�
Annex 17: Community Radio Broadcasting
Community radio Government installed % where government installed
Gauteng 19 3 16
Western Cape 15 3 20
North West 4 3 75
KwaZulu-Natal 11 7 64
Free State 9 5 56
Mpumalanga 10 3 30
Limpopo 8 5 63
Eastern Cape 11 4 36
Northern Cape 3 2 67
Total 90 35 39
Source: Department of Communication (2006).

6
6
�
Annex 18: Press Groups and News Agencies
The main foreign news paper agencies that operate in South Africa are: i. Reuters ii. Agence France-Presse iii. Associated Press iv. Deutsche Presse-Agentur v. United Press International The South Africa press groups that publish the newspapers and magazines are: i. Independent Newspapers (Pty) Limited; ii. Johnnic Communications; iii. Independent News and Media iv. Media 24 Limited v. Caxton Publishers and Printers Limited
Other media players include Primedia Publishing, M&G Media, Natal Witness Printing and Publishing Company, Ramsay Son & Parker (Pty) Limited and Kagiso Media. Source: South Africa Yearbook (2006/7).

6
7
�
Annex 19: Biggest Weekly and Daily Newspapers July-December 2005
Weekly papers Circulation Daily papers Circulation
Sunday Times 504,424 Daily Sun 178,788
Rapport 315,836 The Star 166,597
Soccer-Laduma 288,822 Sowetan 131,714
City Press 178,788 Beeld 102,425
Die Son 186,107 The Citizen 73,800
Source: Audit Bureau of Circulation.

6
8
�
Annex 20: MPCC Stakeholders
Sector Number Nature of involvement
Government spheres: provincial and local government
20,920+ Service provision (salaries, office equipment, rentals, telephone, information, services ) Management of centers Infrastructure building Infrastructure renovations Renovation of site Training
Parastatals 8 Service provision (salaries, office equipment, rentals, telephone, information, service) Technical advice and expertise
NGOs 3 Technical advice and expertise
Tertiary institutions 3 Research technical advice and expertise Service and first level support
Business sector 24 Technical advice and expertise Nature of involvement will differ from company to company Potential for funding
International agencies 1 Technical advice and expertise Research

6
9
�
Annex 21: MPCC Numbers and Estimated Population Served
A total of 71 MPCCs are distributed among48 municipalities (18.3% of all municipalities).
Province MPCC Total estimated population served
Average estimated population served
Gauteng 18 3,153,700 175,216
Western Cape 13 2,111,690 162,438
North West 4 98,732 24,683
KwaZulu-Natal 6 71,284 11,881
Free State 4 158,550 39,638
Mpumalanga 5 124,958 24,992
Limpopo 10 133,416 13,342
Eastern Cape 7 53,393 7,628
Northern Cape 4 227,045 56,761
Total 71 6,132,768 86,377
Source: GCIS (2007). MPCC distribution by province
0
10
20
30
40
50
60
Gau
teng
West
ern
Cape
Nort
h W
est
Kw
aZulu
-
Nata
l
Fre
e S
tate
Mpu
mal
anga
Lim
pop
o
Easte
rn
Cape
Nort
her
n
Cape
nr of municipalities nr of municipalities with MPCC
Source: GCIS (2007).

7
0
�
Annex 22: Telecenters by Province
Province Telecenters Coverage Average coverage
Gauteng 13 2,509,636 193,049
Western Cape 6 927,313 154,552
North West 7 186,882 26,697
KwaZulu-Natal 19 827,952 43,576
Free State 7 156,309 22,330
Mpumalanga 6 82,446 13,741
Limpopo 30 476,155 15,872
Eastern Cape 12 277,769 23,147
Northern Cape 3 13,611 4,537
Total 103 5,458,073 52,991
Source: USAASA (2005). Distribution of telecenters by province
0
10
20
30
40
50
60
Ga
ute
ng
Weste
rn
Ca
pe
No
rth
We
st
Kw
aZu
lu-
Na
tal
Fre
e S
tate
Mp
um
ala
nga
Lim
po
po
Ea
stern
Ca
pe
No
rth
ern
Ca
pe
nr of municipalities nr of municipalities w ith Telecentre
Source: USAASA (2005).

7
1
�
Annex 23: Cyber-labs in South Africa
Province Cyber-labs Coverage Average coverage
Gauteng 7 74294 10613
Western Cape 4 86457 28819
North West 10 17680 1768
KwaZulu-Natal 38 217848 5733
Free State 14 24516 1751
Mpumalanga 24 59086 2462
Limpopo 30 107727 3591
Eastern Cape 34 105179 3094
Northern Cape 26 48165 1853
Total 186 740952 3984
Source: Tlabela et al. (2006). Distribution of cyber-labs by province
0
10
20
30
40
50
60
Ga
ute
ng
Weste
rn
Ca
pe
No
rth
We
st
Kw
aZu
lu-
Na
tal
Fre
e S
tate
Mp
um
ala
nga
Lim
po
po
Ea
stern
Cap
e
No
rth
ern
Ca
pe
nr of municipalities nr of municipalities w ith Cyberlabs
Source: USAASA (2005).

7
2
�
Annex 24: PITs by Province and Coverage
Province PITs Coverage Average coverage
Gauteng 78 6,534,262 142,049
Western Cape 70 5,250,910 119,339
North West 84 1,522,354 35,404
KwaZulu-Natal 80 4,476,379 82,896
Free State 74 1,563,696 35,539
Mpumalanga 75 655,548 19,281
Limpopo 91 651,844 19,172
Eastern Cape 94 1,918,024 61,872
Northern Cape 52 866,449 39,384
Total 698 23,439,466 66,401
Source: SAPO.
At this stage, 35% of PITS are not connected to the Internet, due to lack of infrastructure. The Eastern Cape, Mpumalanga, Limpopo and Northern Cape have the highest rate. PITs online and not online by province
0
10
20
30
40
50
60
70
Gau
teng
West
ern
Cape
Nort
h W
est
Kw
aZulu
-
Nata
l
Fre
e S
tate
Mpu
mal
ang
a
Lim
pop
o
Easte
rn
Cape
Nort
her
n
Cape
no not online no online
Blue = number not online Red = number online

7
3
�
Annex 25: DoCWILS in South Africa
0
1
2
3
4
Gau
teng
West
ern
Cape
Nort
h W
est
Kw
aZulu
-
Nata
l
Fre
e S
tate
Mpu
mal
ang
a
Lim
pop
o
Easte
rn
Cape
Nort
her
n
Cape
Source: Department of Communication (2006).

7
4
�
Annex 26: Public Libraries
Number of libraries in South Africa by province
0
50
100
150
200
250
Ga
ute
ng
Weste
rn
Ca
pe
No
rth
We
st
Kw
aZu
lu-
Na
tal
Fre
e S
tate
Mp
um
ala
nga
Lim
po
po
Ea
stern
Ca
pe
No
rth
ern
Ca
pe
Source: National Library of South Africa (2005).

7
5
�
Annex 27: Socio-economic Impact/Benefits of Mobile Phones
Impact/benefit to rural community Percentage
Prompted responses
Improved relationships 78.7
Call rather than travel to family and friends 77.4
Unprompted responses
Easier communication with family and friends 72.2
Useful in emergencies 25.8
Assist in job search 15.5
Avoids problems with public fixed-line phones 8.8
Easy to organize meetings 8.2
Saves money 5.7
Easy to contact school/university 4.6
Contact employer/client on road 3.6
Can send cheap messages using SMS 2.6
Status symbol 2.1
Improved access to telecommunications 1.5
Place an order for groceries or other items 1
Feel safe 1
Make money from lending out phone 1
Health concerns 0.5
Expensive – cost money 0
Source: Vodafone Policy Paper series (2005).

7
6
�
Annex 28: Findings of Field Visit 1: Kannaland
Background and demographics Interviews were conducted in Ward 1 (Zoar) for Kannaland Local Municipality (KM), which falls under the jurisdiction of Eden District Municipality. Eden DM (dark blue area in map below) falls within the Western Cape (dark grey and blue area) and accommodates 9.8% or 445,900 of the population of the Western Cape (4,550,000).
Map of Eden DM Map of Kannaland LM
The table below indicates that Kannaland has the second highest rural coverage percentage of the local municipalities within Eden.
Eden DM area
Local municipality No. of farms Area in km2 % Coverage
George 1,998 1,070 4.6
Mossel Bay 2,547 2,010 8.6
Hessequa 3,543 5,740 24.6
Knysna 1,030 1,060 4.5
Bitou 1,335 9,900 4.2
Kannaland 3,196 4,800 20.5
Oudtshoorn 3,580 3,550 15.2
District Management area 1,539 4,150 17.8
Total 18,768 2,3370 100
Source: Eden DM (2006) and Surveyor General (2005). Kannaland has an area of approximately 4750km2. The total population is estimated at 29,270 and the main town is Ladismith (IRD, 2006). The figure below provides an estimated population distribution among the five different towns. According to the estimated figures, the total rural population constitutes 31.3% of the population and the colored community constitutes 80% (IRD, 2006). Interviews were conducted in the town of Zoar, which forms Ward 1. Zoar originated as a Rhenish mission station and its population consists of colored people only. The population of Zoar constitutes 29% of the total population and 25.6% of the colored population.

7
7
�
Population of KM for 2001 Source: IDP (2006). The below figure shows that of the 6,072 households in KM, Zoar’s households represent 21.5%. Zoar is also the second largest ward within the municipality. Number of households by ward The below figure 5 indicates the population split by group and gender. Zoar’s population is predominantly colored. KM population by gender/race Kannaland’s population can be classified by age as follows: Under 20 years 48% Under 30 years 55% Under 40 years 70 % Under 50 years 81% Under 60 years 90% Under 70 years 96% Social and economic development of Kannaland The HDI is a valuable indicator of people's quality of life of people and takes into account life expectancy, education levels, income and basic services and healthcare. The figure below indicates the HDI values for KM. Zoar has an HDI of 0.371, nearly half the HDI figure of South Africa as a whole. According to the 2001 census, the unemployment figure for Kannaland was 13.85% of the economically active population and 7% of the total population (Statistics South Africa, 2001).
0
1000
2000
3000
4000
5000
6000
7000
8000
LadismithCalitzdorp Zoar Van
Wyksdorp
Hoeko
13081113
879
1686
1086
0
500
1000
1500
2000
W1 W2 W3 W4 W5
0
2000
4000
6000
8000
10000
12000
Africans Coloureds Indian/Asian White
Male Female

7
8
�
Kannaland HDI figures for 2002
0
0.1
0.2
0.3
0.4
0.5
Calit
zdor
p
rura
l
Lad
ism
ith
rura
l Zoar
Calit
zdor
p
Van
Wyks
dor
p
Lad
ism
ith
HD
I
Source: Development of Social Services Oudtshoorn (2003). The table below compares education level data for the total population and the colored population of Kannaland in 2001 (Statistics South Africa, 2001) with interviewees in Zoar in 2007. As the interviewees were all colored, we can observe that there has been a huge improvement in educational level.
Table 28.2: Kannaland comparison of education levels
Educational level Kannaland
2001 Kannaland
coloreds 2001 Zoar interviewees
2007
No schooling 11.9 13.6 0.0
Some primary 31.39 37.4 16.67
Complete primary 22.72 13.9 20.0
Some secondary 27.43 26.7 36.67
Std10/Grade12 12.07 6.4 20.0
Higher 5.49 2.0 6.67
Source: Statistics South Africa (2001) and interview data. After inflation adjustments, the income levels for all Kannaland employed persons between the ages of 15 and 65 years as reflected in the table below (from Statistics South Africa) correlate with Zoar interviewees’ details of the corresponding figure (from interview data). It is clear that there has been no real change in income levels in recent years.
Kannaland average monthly income Zoar interviewees' average monthly income Source: Statistics South Africa (2001). 20%
64%
3%13%0%
0%0%
Less than R500 R501-R1000
R1001-R1500 R1501-R2000
R2001-R2500 R2501-R3000
Above R3001
,
Under R400 21.38%
R401-R800 41.76%
R801-R1,600 10.39%
R1,601-R3,200 12.76%
R3,201-R6,400 7.11%
R6,401-R12,800 3.46%
R12,801-R25,600 0.52%
R25,601-R51,200 0.38%
R51,202-R102,400 0.13%
R102,401-R204,800 0.08%
R204,801 + 0.00%

7
9
�
Kannaland is rated the highest poverty area in the Western Cape and is one of the two poorest municipalities. Agriculture is the backbone of Kannaland’s economy. Fruit (apricots and grapes) and diary farming are the biggest contributors to the area’s agricultural output. Drying of fruit is becoming very promising and the Seweweekspoort Trust, a Section 21 company, employs 130 workers in its fruit-processing venture at Amalienstein farm. Amalienstein farm, held in trust for the Zoar residents and managed by Casidra, seated in Paarl, also employs workers from Zoar for its dairy and fruit activities. The census of 2001 indicated that the main occupational sector for the total population and the colored population of Kannaland was agriculture (Statistics South Africa, 2001). Interviewee data below show that this situation has not changed much. Contract workers, 60% of interviewees, who work on neighboring farms and are employed for only six months of the year, still constitute the largest percentage. Community services again were one of the higher sectoral employment categories. Occupation classification of interviewees
Occupational distribution of Interviewees
02468
101214161820
UnemployedCommunity
services
Municipality Pensionar Contract
w orker
Occupation
Nu
mb
er
of
inte
rvie
wees
Care of the elderly is being largely neglected in Kannaland, especially among poorer communities. The most serious social problem in the region is alcohol abuse, to which social problems such as child neglect and family violence are linked. There are 19 schools located in the KM area, with 131 educators and 5,125 learners (Department of Education Oudtshoorn, 2003). Zoar has two schools, Zoar EK Primary and Zoar RP Botha Primary (part of the Khanya project). The figure below shows household sizes of interviewees. 97% had access to electricity; 30% were male. Household size of interviewees
17%
10%
26%27%
20%
1 person 2 people 3 people 4 people 5 people
ICT and livelihoods 90% of interviewees felt that ICTs had enhanced their livelihoods. 7% disagreed and 3% were unsure. The figure below indicates the identified impacts of ICT on the livelihoods of the rural poor. Impact areas of ICTs on interviewees' lives

8
0
�
8%
31%
28%
5%
28%
Increased access to education Eased communication
Increased access to key infomration Jobs
Entertainment
93% of interviewees felt that ICTs empowered them and gave them a voice. The tools that empowered them most and were identified by more than 70% of interviewees were community meetings, posters/pamphlets and word of mouth. The ICTs identified as tools that empowered the community and people are presented in the table below. ICTs identified as empowerment tools
Identified ICT % interviewees
TV 40.0
Radio 33.33
Mobile phone 26.67
Internet 13.33
Telephone 10.0
Fax 10.0
80% of interviewees were of the opinion that ICTs had a positive impact on their life, whereas 13% felt that they did not have any impact at all. As can be seen from the figure below, 76% of the interviewees identified that the greatest purpose and impact of ICTs was in the event of an emergency. 60% felt its purpose is to provide access to information. Purpose of ICTs as classified by interviewees
0
5
10
15
20
25
Mar
ket info
rmatio
n
Cre
dit a
nd sub
sidies
av...
Info
rmat
ion
on n
ew p
ro...
Info
rmat
ion
on clie
nts ...
Job
oppo
rtunitie
s
Info
rmat
ion
abou
t frie
n..
Cris
es
New
s ab
out s
ick re
lativ
es
Ban
king
ser
vice
s
Soc
ial a
nd re
ligious
ev...
Ent
erta
inm
ent
Edu
catio
n op
portu
nitie
s
Acc
ess
to in
form
ation
...
The best sources of local information are community meetings, word of mouth, information pamphlets and local megaphone announcements. This also matches the traditional method of communication and information sharing. The ownership percentages of ICTs by Zoar’s interviewees were as follows: television (70%); radio (60%); mobile phone (47%); landline (23%); and none (13%). No interviewees or their family members owned a computer or fax machine. Ownership of ICTs by type

8
1
�
0
5
10
15
20
25
30
35
Ra
dio
Mo
bile
Ph
on
e
Tele
ph
one
lan
d li
ne
TV
Co
mp
ute
r
Fax
ma
chin
e
Oth
ers
No
ne
interviewee owned family member owned interviewee used
The newer ICT types, such as computers, Internet, email and fax, are not utilized by the interviewees. The proportion of interviewees by ICT type not used is listed in the table below. Percentage of interviewees not using a specific ICT type
ICT type % of interviewees not using
Radio 30
Mobile phone 30
Telephone landline 50
TV 3.3
Computer 90
Internet 96.7
Fax 86.7
The table below displays the frequency of usage of the different ICT types. Frequency of ICT type usage (%)
ICT type Daily Once a week Monthly basis Do not use
Radio 50.0 16.67 3.33 30.0
Mobile phone 30.0 6.67 13.33 50.0
Telephone landline 16.67 10.0 23.33 50.0
TV 83.33 10.0 3.33 3.33
Computer 10.0 0.0 0.0 90.0
Internet 0.0 0.0 3.33 96.67
Fax 10.0 0.0 3.33 86.67
The ICT type used the most on a daily basis is the television (83%). Interviewees who did not use it on a daily basis indicated that it was too expensive to use owing to the cost of electricity. Mobile phones are less frequently used on a daily and weekly basis. The extremely high cost of air time was provided as explanation by the interviewees for this. Frequency of usage of ICTs
05
101520253035
Rad
io
Mob
ile P
hone
Telep
hone
land
line
TV
Com
puter
Intern
etFax
Daily Once a w eek Monthly basis Do not use

8
2
�
The figure below provides explanations of interviewees regarding why they do not use the radio on a daily basis. Reasons for radio not being used on a daily basis The main reason was that interviewees did not see the need to use it. Telephone landlines are used on a monthly basis rather than a daily or weekly basis. The reason provided by 78.6% of the interviewees was the high costs involved; 21.4% indicated that they do not see the need to use it more frequently. The reasons for not using computers, email, Internet and fax on a daily basis are indicated in the figure below. The cost was the main reason provided for infrequent use. The main reason provided for not using a computer more frequently was lack of capacity and education. The other reason cited for not using fax was that interviewees did not know where to find such a facility. Reasons for not using computer, email, Internet and fax on a daily basis No money is spent on fax or using computers. Only 3% of interviewees spend between R1 and R50 for email and Internet. Only 20% spend between R1 and R50 on mobile phones. The figure below indicates that most of the interviewees do not incur any expenses using mobile phone, landlines or TV. Only 3% spend more than R351 per month on cell phones. Only 3% of cell phone air time is subsidized by an employer (provincial government). Monthly expenses by ICT
Radio
18%
6%
64%
12%
Too expensive Infrastructure not available
Do not see the need to Don't like
0.00%
10.00%
20.00%
30.00%
40.00%
50.00%
60.00%
Too e
xpensiv
e
Lack o
f
capacity/e
ducatio
n
Infr
astr
uctu
re n
ot
availa
ble
Do n
ot
see t
he
need t
o
Did
n't k
now
it
exis
ted
Oth
er
reasons
Computer E-mail Internet Fax
0.00%
10.00%
20.00%
30.00%
40.00%
50.00%
60.00%
Too e
xpensiv
e
Lack o
f
capacity/e
ducatio
n
Infr
astr
uctu
re n
ot
availa
ble
Do n
ot
see t
he
need t
o
Did
n't k
now
it
exis
ted
Oth
er
reasons
Computer E-mail Internet Fax

8
3
�
MTN takes 57.2% of the subscribers and Vodacom 42.8%. None of the interviewees use their mobile phones to surf the Internet or access email. The figure below indicates the functions used on mobile phones. Services used on mobile phones
28%
35%
33%
2%0%2%0%
SMS Receive calls Make calls
Access e-mail Internet surfing Mobile Banking
camera
The table below indicates access points used. Access points of ICTs
Access point Percentage of interviewees using this access point
Home 37
Post office 18
Neighbors 13
Public phones 7
Schools 7
Place of work 6
Church 3
Municipality 3
Internet cafe 1
Only 3% of interviewees access government services on the Internet. They also indicate that this seldom occurred (once in two months). The below figure indicates which methods and ICT tools are used to access government information. Tools used to access government information

8
4
�
2%
23%
20%9%5%
13%
0%
21%
5% 0%2%
Telephone landline
Mobile phone
TV
Radio
Newspaper
Postal office
Word of mouth
Internet
Physical visit to office
Have not accessed any
The tools most frequently used by interviewees for accessing government information were the TV (23%), physical visits to offices (21%) and radio (20%). The Internet is not used to access government information at all. Most of the interviewees indicated that they had to travel less than 1km to access radio, TV and mobile phones. However, when they want to use landline facilities, 67% need to travel less than 1km and 33% 1-5km. To use a fax, they need to travel 1-5km, and more than 10km to access to computer, email and Internet. See the below figure for traveling distances. Traveling distances to ICTs
0
5
10
15
20
25
30
35
Radio
Mob
ile
pho
ne
Tele
pho
ne
landlin
e Fax
TV
Com
pute
r
E-m
ail
Inte
rnet
0km Less than 1 km 1-5km 5-10km More than 10 km
Only 30% of the people in the case of radio and 33% in the case of TV need to travel for access. They travel mostly on foot. 43% of the interviewees need to travel on foot to access a mobile phone. 96% of the interviewees who need to travel to access a landline also travel on foot; the remaining 4% travel by public transportation (taxi). 97% of the interviewees need to travel by using public transport (e.g. a taxi) to access the Internet and email. The remaining 3% travel using a private vehicle. 97% of the interviewees travel on foot, 3% use a private car and 7% use public transport (taxi) to access a fax machine. 57% of the interviewees use public transport (taxi), 40% travel on foot and 3% use a private car to access a computer.

8
5
�
Annex 29: Findings of Field Visit 2: Kopanong
Background Kopanong Municipality falls under Xhariep DM in the Free State province. There are 17 towns in Xhariep, nine under Kopanong, five under Letsemeng and three under Mohokare. Kopanong is the largest of the three municipalities, covering an area of 15,191 km2, with 41% of the Xhariep district population residing there. Although Xhariep covers the largest area (34,132 km2), it has the smallest population in the Free State (approximately 135,000), which makes it the most sparsely populated district in the province (Reviewed IDP, 2003). Xhariep DM (light blue area on map) falls within the southern Free State and accommodates 138,650 (4.7%) people of the total provincial population of 2.95 million. Map of Xhariep DM and Kopanong LM The Free State has an HDI of 0.55 (2002) and 54.7% of its population is living in poverty. The Free State had a population growth rate of 0.72% for the period 2001-6, an economically active population of 1.09 million, a child mortality rate of 24%, and a functional literacy rate of 69.2%. The table below provides more information regarding the district economies. District economics of the Free State
District Population
% GDP
% Unemployed
% People living in poverty %
Growth p.a. 1990-2002 %
Motheo 26 30.9 41.1 61 1.3
Lejweleputswa 26.9 26.5 36.6 66 -2.3
Thabo Mafutsanyane 26.3 14 34.1 72 0.3
Northern Free State 16.3 25.5 38.3 62 0.4
Xhariep 4.5 3.1 38.3 57 0.9
Total/average 100 100 38.9 64 -0.1
Source: PEAC Report (2004).

8
6
�
Kopanong, situated in the southern Free State, consists of a conglomeration of nine former transitional local councils. Kopanong includes the towns of Springfontein, Fauresmith, Phillipolis, Gariep Dam, Trompsburg, Edenburg, Reddersburg, Jagersfontein, Bethuli and part of the former Southern Free State Rural Council (see the map above). The municipality covers 15,248 km2 and its administrative headquarters are situated in Trompsburg. The total population of Kopanong was 55,945 in 2001, with 17,360 households, of which 40% are in the rural areas within the municipality. Interviews were conducted in the town of Springfontein, which forms Ward 5 of Kopanong LM. The main languages spoken are isiXhosa and Sesotho. The figure below indicates that Springfontein's population constitutes 12% of the total Kopanong population and 8% of the total African population of Kopanong LM. Kopanong LM population 2001
0
2000
4000
6000
8000
10000
12000
14000
Trom
psbu
rg
Edenbu
rg
Red
ders
burg
/Mat
ropan
g
Bethul
i
Jage
rsfo
ntei
n
Faure
smith
Philip
polis
Gar
iep
Dam
Sprin
gfon
tein
Source: IDP (2006). The figure below indicates the population split by group and ward. 50% of Springfontein's population is African and 52% female. Population by group
0
2000
4000
6000
8000
10000
Ward
1
Ward
2
Ward
3
Ward
4
Ward
5
Ward
6
Ward
7
African Coloured Indian White
Source: Statistics South Africa (2001). According to the 2001 census, the Kopanong population can be classified by age as: under 20 (42.4%); 65 years and older (6.8%); and under 70 years old (95.5%). Social and economic development and demographics of Kopanong The economy of Kopanong is dominated by agricultural activity and Kopanong contributes 45% to Xhariep’s GDP (XDM, 2006). The second biggest contributor to GDP is general government, followed by financial services (MDB, 2003). The figure below indicates that 49% (almost half) of the employed population is employed in the agricultural sector. According to the 2001 census, the unemployment figure for Kopanong was 37.8% of the economically active population and 21.1% of the total population. Employment sectors for Kopanong

8
7
�
49%
28%
23%
Agricultural Households Social
Source: Statistics South Africa (2001).
The table below compares the education level data for the total population of Kopanong in 2001 and with interviewees of in 2006. It will be noted that there has been a remarkable improvement in primary and secondary education levels. Comparison of education levels for Kopanong
Kopanong 2001
% Springfontein 2001 %
Springfontein interviewees 2006 %
No schooling 20.9 29.0 6.67
Some primary 25.13 21.0 13.33
Complete primary 8.52 7.0 36.67
Some secondary 27.75 23.0 20.0
Std10/Grade12 13.02 16.0 23.33
Higher 4.66 4.0 0.0
Source: Statistics South Africa (2001) and interview data. After inflation adjustments, income levels of Kopanong are as reflected in the table below and correlate with the details of the corresponding figure, which represents data from interviewees. It is clear that there has been no real improvement in income levels for Kopanong in recent years.
Kopanong average monthly income Springfontein's monthly household income
Source: Statistics South Africa (2001).
0%
10%
23%
54%
0%10%
3%
Less than R500 R501-R1000R1001-R1500 R1501-R2000R2001-R2500 R2501-R3000Above R3001
Kopanong’s economy is dominated by the agricultural sector. The extremely narrow economic base increases the risk of the area being vulnerable to adverse agricultural conditions. Meat production (sheep as well as cattle) and wool form the basis of the agricultural industry. The Gariep Dam Craft Centre, a Section 21 company, employs 130 workers in its poverty alleviation projects (Hydro Weavers and Hydro Crafts). The census of 2001 indicated that the main occupational sector for
No income 15%
Under R400 25%
R401-R800 27%
R801-R1600 14%
R1601-R3200 8%
R3201-R6400 4%
R6401-R12800 4%
R12801-R25600 2%
R25601-R51200 1%
R51202-R102400 1%
R102401-R204800 0%
R204801 + 0%

8
8
�
the total population of Kopanong was agriculture. The main occupation was elementary work, followed by agriculture and service work (Statistics South Africa, 2001). The figure below shows that 10% of interviewees were elementary workers; 30% agricultural contract workers on neighboring farms; and 23% community workers. Interviewees' occupations
0123456789
10
Unem
plo
yed
Com
munity
ser
vic
es
Mun
icip
ality
Agricu
ltur
e
Ele
mente
ry
Pensi
one
r
House
eho
ld
nu
mb
er
The figure below indicates the household sizes of interviewees. 90% had access to electricity and 56% were male. The corresponding table provides census 2001 data on Springfontein household sizes.
Household size in Springfontein Household size (interviewees)
Source: Statistics South Africa (2001).
7%
17%
26%27%
13%
7% 3%
1 pers on 2 pers ons 3 pers ons 4 pers ons
5 pers ons 6 pers ons 9 pers ons
ICT survey findings 83% of interviewees were of the opinion that ICTs enhanced their livelihoods. 13% disagreed and 3% were not sure. The figure below indicates the identified impacts of ICT on the livelihoods of the interviewees. Impact areas on interviewees' lives
83% of the interviewees felt that ICT empowered them and gave them a voice. The most frequently identified empowerment methods or tools are indicated in the table below. Tool/method of empowerment
ICT tool Percentage of interviewees
1 person 20%
2 persons 26%
3 persons 18%
4 persons 13%
5 persons 8%
6 persons 6%
7 persons 4%
8 persons 2%
9 persons 1%
10 and over 1%
5%
37%
53%
5%
Increased access to education Eased communication
Increased access to key information No impact

8
9
�
Radio 23
Pamphlets/posters 23
Community meetings 22
Word of mouth 22
TV 21
Post office 16
Newspapers 16
Mobile phone 6
Telephone 5
None of the interviewees identified the Internet or email as tools of empowerment, indicating that interconnectivity and its potential benefits are not realized. 87% of the interviewees were of the opinion that ICTs had a positive impact; 7% felt that they did not have any impact at all. 3% felt that they had a negative impact as they now spend more money and 3% felt they had an in-between impact. As can be seen from the figure below, the main purpose identified for ICTs was access to information and knowledge, followed by crises and entertainment. Purpose of ICTs as classified by interviewees
0
5
10
15
20
25
30
35
Job
opp
ort
unitie
s
Info
rmatio
n
abo
ut
frie
nds
and
fam
ily
mem
ber
s
Crises
Acces
s t
o
info
rmat
ion
and
kno
wle
dge
Banki
ng
ser
vic
es
Educa
tion
opp
ort
unitie
s
Ente
rtai
nm
ent
Interviewees felt that the best sources of local information were community meetings, word of mouth, information pamphlets/posters and the radio. This also matches the traditional method of communication and information sharing and is used effectively by government. ICT ownership and usage is depicted in the below figure. Ownership according to ICT type was as follows: radio 86.7%; mobile phone 66.7%; television 63.3%; landline 10.0%; none 3.33%. None of the interviewees or their family members owned a computer or fax machine. ICT ownership and usage
The newer ICTs such as computers, Internet, email and fax are being utilized by the interviewees. However, the proportion of usage is very low, as can be seen from the figure below. The Internet is only used to access websites and email.
0
5
10
15
20
25
30
35
Radio
Mobile
Phone
Tele
phoni
land lin
e TV
Com
pute
r
Fax m
achin
e
Tele
x
None
Interviewee owned Family member owned Interviewee used

9
0
�
Usage of new ICTs by interviewees
0
5
10
15
20
25
30
Com
pute
rs
Inte
rnet
E-mai
l
Fax
Telex
Perc
en
tag
e u
se
The proportion of interviewees not using particular ICT types is listed in the table below. Percentage of interviewees not using a specific ICT type
ICT type % of interviewees not using ICT type
Mobile phone 14.33
Telephone landline 20.0
Television 3.33
Computer 86.67
Internet 93.33
Fax 73.33
Telex 96.6
The table and figure show display the frequency of use of various ICTs and number of interviewees using each type. Frequency of ICT usage (%)
Daily Once a week Monthly basis Do not use
Radio 86.67 10.0 33.33 0.0
Mobile phone 46.67 20.0 16.67 16.7
Telephone landline 23.33 20.0 33.33 23.3
TV 63.33 26.67 6.67 3.3
Computer 6.67 0.0 3.33 90.0
Internet 0.0 3.33 0.0 97.67
Fax 3.33 10.0 13.33 73.3
The ICT type used the most by all interviewees on a daily basis is the radio (86.7%). Only 3% of interviewees did not use it on a daily basis, indicating that it was too expensive to use owing to the cost of electricity. 14% indicated that they did not have the radio with them. Television and mobile phones are also more frequently used on a daily basis than a weekly basis. The high cost of air time was provided as an explanation by interviewees for not using mobile phones on a daily basis. Of the interviewees who did not use the television on a daily basis, 20% indicated that it was too expensive and 26% indicated that they did not have access to a TV on a daily basis. Landlines are used on a monthly basis rather than a daily or weekly basis. ICT usage

9
1
�
0
5
10
15
20
25
30
35
Radio
Mobile
phone
Tele
phone la
ndlin
e
TV
Com
pute
r
E-m
ail
Inte
rnet
Fax
Daily Once a w eek Monthly basis Do not use
The reason provided by 53.3% of the interviewees for not using it on a daily or weekly basis was that it is too expensive to use more frequently. A total of 23.3% indicated that they do not see the need to use it more frequently and 3.33% indicated that use was down to job requirements. The reasons for not using computers, email, Internet and fax on a daily basis are indicated in the below figure. The cost was the main reason provided. The main reason provided for not using a computer more frequently was lack of capacity and education. The other reason cited for fax was that interviewees did not know where to find such a facility. Reasons provided for not using computer, email, Internet and fax on a daily basis 93% of interviewees spend between R1 and R50 on electricity for their radio and 7% have no expenses. No money is spent on the use of computer, Internet and email by 97% of the interviewees. Only 3% spend between R1 and R50 on this. 93% of interviewees have no expense for faxes and 3% spent between R1 and R50. The figure below indicates that most of the interviewees spend between R1 and R50 using mobile phone, telephone landlines or TV. Monthly expenses for mobile phones, telephone and TV
0%
10%
20%
30%
40%
50%
60%
70%
Too e
xpensiv
e
Lack o
f
capacity/e
ducation
Do n
ot see the
need to
Due to w
ork
Computer E-mail Internet Fax

9
2
�
0%
10%
20%
30%
40%
50%
60%
70%
80%
90%
Nil R1-R50 R51-R100 R101-150
Mobile phone Telephone landline TV
Of the interviewees, 72% subscribe to MTN; 24% to Vodacom; and 4% to Cell C. None of the interviewees use their mobile phones to surf the Internet or to access email. The figure below shows the functions used on mobile phones. Mobile phone services used by interviewees
25%
38%
32%
5%
SMS Receive calls Make calls Mobile Banking
The table below indicates access points for ICTs. Access points for ICTs
Access point Percentage of interviewees using this access point
Home 97
Place of work 57
Post office 53
Neighbors 53
Community centers 23
School 3
Public phones 3
The figure below indicates the tools used by interviewees to access government information. None of the interviewees access government websites on the Internet. Tools used to access government information

9
3
�
1%2%16%
20%
3%15%
17%
1%
25%
E-mail Mobile phone TV
Radio New spaper Postal off ice
Word of mouth Internet Physical visit to off ice
Most of the interviewees do not have to travel to access a radio; 10% have to travel less than 1km. 33% have to travel less than 1km and 3% 1-5km to access a TV. The table below shows the distances traveled to access ICTs. Traveling distances to access ICTs
ICT 0km Less than 1km 1-5km 5-10km More than 10 km
Fax 0 27 50 13 10
Computer 0 20 57 20 3
Internet 0 10 63 23 3
TV 64 33 3 0 0
Radio 90 10 0 0 0
Mobile phone 76 17 7 0 0
Telephone landline 17 57 16 7 3
6% of people travel on foot to access the radio and 3% use a private car. 90% travel on foot and 3% by bicycle to use the computer, Internet and email. 33% of travel on foot to access a TV and 3% use a bicycle. 83% travel on foot to use a fax machine and 3% use a bicycle. 77% travel on foot to access a telephone and 3% by bicycle. Only 23% of the people have to travel to access a mobile phone, mostly on foot.
The cumulative results of the Kannaland (Annex 29) and Kopanong (Annex
30) municipalities are available in the Power Point presentation presented
at the national workshop.

9
4
�
Annex 30: Case Study: Thusong Service Centers (MPCCs)
Background The World Bank and others have highlighted that the most effective way to alleviate poverty is through effective acquisition and dissemination of knowledge. Information and development services thus form a critical factor for the improvement of the lives of the majority of South Africa’s population which are classified as being poor. The capacity to use information and new ICTs effectively is a deciding factor in South Africa's progress and prosperity in the new global knowledge-based economy. The objective of the government is to ensure active participation of citizens in changing their lives for the better by providing development communication and information to the public. This task was allocated among others to the Government’s Communication and Information Systems (GCIS), which must use all appropriate media forms to provide the information and produce two-way communication services (Comtask Report, Clause 65). MPCCs provide government information, products and services right on the doorstep of the community, but also train and add ICT skills, for instance in using the Internet and other technologies which can be useful in local development programs
(www.gcis.gov.za/mpcc/index/html). The focus of this case study is the current situational challenges/needs and priorities of the MPCCs. The emphasis is on identifying best practices/challenges which can be useful in designing future ICT projects. Both quantitative and qualitative approaches were used. Statistical information in the form of the monthly statistical report, forwarded by the MPCC manager to the regional offices, was obtained and studied to get an idea of the usage and services offered. A field visit to the Trompsburg MPCC was also carried out during the end user ICT surveys (as discussed in Annex 29) in Springfontein, 22km away from Trompsburg. In the field interviews in Springfontein, none of the 30 interviewees made use of the MPCC in Trompsburg, although it is the closest town and transport is available at fair rates on long-distance trucks. 20 telephone interviews across eight of the nine provinces were conducted to obtain qualitative data. A random sampling technique was used to ensure an even geographical spread of the sample. The table below provides a breakdown of the interviews with Thusong Service centers by province. Telephone interviewees by province with MPCC managers
Province No. of MPCC managers interviewed
Limpopo 4
North West 2
Western Cape 4
Northern Cape 2
Eastern Cape 2
Mpumalanga 2
Free State 2
KwaZulu-Natal 2
Scope and limitations of the case study This study does not claim to have exhausted all the best practices/challenges and needs that can be identified with regard to the MPCCs. Gauteng was excluded from this study, as only rural areas form part of this report. The access data of each provincial MPCC are not compared in this report owing to incomplete information received from the centers. The information requested from GCIS national office by MPCCs and province in terms of service providers and usage was not forwarded in time. The comparison of information among the different regions will only be carried out where the received information from the regional level permits it, as different formats of information were received. The case study focuses on Limpopo as one of the poorest provinces, and also the most northern province of South Africa. Limpopo Limpopo had an HDI of 0.49 in 2003 (Global Insight Southern Africa, 2004). It consists of six districts. 60% of the population is living in poverty. The table below shows that 49.3% are unemployed.

9
5
�
Unemployment by district
0
10
20
30
40
50
60
70
80
Ca
pri
corn
Bo
hla
be
la
Mo
pan
i
Se
khukhu
ne
Vh
em
be
Wate
rbe
rg
Source: Development Index Framework, Limpopo (2004). Number of people in poverty: 1998 and 2003
District 1998 % 2003 %
Capricorn 588 345 60.9 680 216 65.3
Bohlabela 490 526 66.5 448 503 56.5
Mopani 554 706 61.4 537 757 55.5
Sekhukhune 534 206 70.4 545 362 67.2
Vhembe 720 434 60.9 786 842 62.0
Waterberg 380 348 55.4 373 800 50.8
Province total 3 268 566 62.4 3 372 479 60.0
Source: Global Insight Southern Africa (2004). The following donor organizations were actively involved in the funding of the MPCCs of Limpopo: i. World Bank ii. SAFMARINE iii. De Beers Fund iv. Development Bank of South Africa (DBSA) v. ESKOM vi. Old Mutual vii. Uniting Reformed Church viii. Embassy of Japan ix. Phalaborwa Foundation x. CSIR xi. NDA xii. USA xiii. World Library Partnership xiv. Itereleng Educational Project Usage of services/visitors to MPCC Limpopo provided a complete set of information of all the MPCCs in their area for the months of August 2006 till November 2007 and this dataset has been analyzed. It should be mentioned that all the statistical information is collected manually at all the MPCCs. Everyone has to sign a visitor’s book and this is checked with the different service providers’ records. As one visitor can use more than one service during his/her stay at the centre, the service delivery data will be interpreted as number of visitors. The table below provides the four-monthly totals for the different MPCCs in Limpopo and a calculated monthly average service rendered or number of visitors. Number of visitors: four-monthly total and monthly average
Limpopo MPCC Total Monthly average

9
6
�
Madimbo MPCC 2,178 726
Makuya MPCC 11,467 3,822
Zava Thusong 127 42
Mokwakwaila Thusong 5,689 1,422
Bulamahlo Thusong 5,040 1,260
Mapela MPCC 15,899 3,975
Babirwa MPCC 6,159 1,540
Mabatlane MPCC 29,461 7,365
Botlokwa MPCC 136,122 34,031
Festus Sengaka Mothudi 51,900 12,975
Sekhukhune District 3,246 1,623
Eldorado MPCC 6,363 2,121
Leboeng MPCC 48,323 12,081
Kgautswana MPCC 19,345 4,836
Makhuva MPCC 4,135 1,378
Atok MPCC 235 118
Botlokwa MPCC has the most visitors, followed by Festus Sengaka Mothudi and Leboeng. These three MPCCs handle 82% of the total visits made at all the MPCCs over the four-month period. The services offered at Botlokwa are: Home Affairs, Post Office, Tribal Office, Eskom, Village Bank, Community Radio, telecenter and Nkgakgarihla Legal Solutions. The Eskom prepaid electricity, averaging R1,904 per month, has the most visitors. It is the only MPCC in Limpopo that includes a tribal office. The MPCC managers indicated during the interviews that the services offered matched the requests of the communities they served. They also make provision for new suggestions by offering a suggestion box facility and regular meetings with the community. The figure below provides information on monthly access by MPCC per month for the period of August 2006 to November 2006.
Monthly total of visitors at the MPCCs of Limpopo
05000
1000015000200002500030000350004000045000
Mad
imbo M
PC
C
Mak
uya
MP
CC
Zava
Thus
ong
Mok
wakw
aila
Thu
son
g
Bula
mahl
o T
huson
g
Map
ela
MP
CC
Babirw
a M
PC
C
Mab
atla
ne
MP
CC
Botlok
wa M
PC
C
Fest
us S
eng
aka
Mot
hudi
Sekhu
khu
ne
Dis
tric
t
Eld
orado
MP
CC
Leb
oen
g M
PC
C
Kgaut
sw
ana
MP
CC
Mak
huv
a M
PC
C
Ato
k
Aug Sep Oct Nov
11 of the 16 MPCCs, 69% of the total number of MPCCs in Limpopo, with statistical information available have telecenters. The services offered in telecenters differ from center to center. Botlokwa MPCC, which has the most visitors or services

9
7
�
offered, also has a community radio. The figure below provides details on community radio services offered. According to MPPC managers' reports, listeners increased from 40,000 in August 2006 to 100,000 in September and October 2006. This figure dropped to 70,000 in November 2006. Community radio services offered (August to November 2006)
0
100
200
300
400
Aug Sep Oct Nov
Adverts Enquiries Announcements Lost/found
The figure below shows the total monthly usage of ICTs in each of the 11 MPCCs with a telecenter. The services included under telecenters are: i. Printing ii. Photocopying iii. Faxing iv. Lamination v. Stationery vi. Telephones (cell or public) vii. Computer training viii. Typing ix. Referrals x. Adult Basic Education and Training (ABET) xi. Early Childhood Development (ECD) xii. Life skills training for youth xiii. Internet
Some of these MPCC are also part of the Council for Scientific and Industrial Research (CSIR) Digital Doorway project, where computer and electronic games are played and/or PITs provided.
Reported ICT usage figures per month
0
500
1000
1500
2000
2500
3000
3500
4000
4500
Ma
ku
ya
MP
CC
Bu
lam
ah
lo
Th
uso
ng
Ma
pe
la
MP
CC
Ba
bir
wa
MP
CC
Ma
ba
tla
ne
MP
CC
Bo
tlo
kw
a
MP
CC
Fe
stu
s
Se
ng
aka
Mo
thu
di
Se
kh
ukh
un
e
Dis
tric
t
Le
bo
en
g
Kg
au
tsw
an
a
MP
CC
Ma
kh
uva
MP
CC
August September October November
The average number of visits where ICTs are used is very small, as can be seen in the figure. However, included in the Bulamahlo Thuson ICT section or telecenter data are the ABET training figures, which make up a huge percentage.

9
8
�
Percentage of monthly visits where ICTs are used
0
10
20
30
40
50
60
70
80
90
Ma
kuya
MP
CC
Bu
lam
ah
lo
Thu
son
g
Ma
pela
MP
CC
Ba
bir
wa
MP
CC
Ma
batlan
e
MP
CC
Bo
tlokw
a
MP
CC
Festu
s
Se
ng
aka
Se
khukhu
ne
Dis
tric
t
Leb
oen
g
Kg
au
tsw
ana
MP
CC
Ma
khu
va
MP
CC
Most visitor activities include photocopying (33% of the total of all Limpopo’s telecenter activities), telephone (28%), faxing (11%) and printing (10%). The number of visitors for computer training, PITs, the Internet and digital games are presented below. Computer training is not conducted at all the MPCCs owing to lack of funding and trained staff. Of the total ICT services in the past four months in Limpopo, computer training constituted only 1%. PITs are only used at two MPCCs. Only two MPCCs reported that Internet browsing took place on telecenter computers. Some MPCC managers indicated that telecenter computers have difficulties connecting to the Internet and that they still await a Sentech digital dish. Only three MPCCs form part of the Digital Doorway Project. User figures seem to be dropping. Reports issued by managers indicate the need for serious supervision, causing doubts as to whether a service is really being offered.
Computer training PITs Internet browsing Digital doorway project
010203040506070
Ma
kuya
MP
CC
Bu
lam
ah
lo
Thu
son
gM
ap
ela
MP
CC
Ba
bir
wa
MP
CC
Ma
batlan
e
MP
CC
Bo
tlokw
a
MP
CC
Festu
s
Se
ng
aka
Se
khukhu
ne
Dis
tric
t
Leb
oen
g
Kg
au
tsw
ana
MP
CC
Ma
khu
va
MP
CC
August September October November
050
100150200250300350400
Ma
kuya
MP
CC
Bu
lam
ah
lo
Thu
son
gM
ap
ela
MP
CC
Ba
bir
wa
MP
CC
Ma
batlan
e
MP
CC
Bo
tlokw
a
MP
CC
Festu
s
Se
ng
aka
Se
khukhu
ne
Dis
tric
t
Leb
oen
g
Kg
au
tsw
ana
MP
CC
Ma
khu
va
MP
CC
August September October November
(Data from qualitative interviews.) Needs of MPCC managers in Limpopo Telephone interviews, conducted with randomly selected MPCC managers, offered the following comments regarding challenges and needs. MPCC needs in Limpopo
Needs area Need
ICT Telkom is not assisting with telephone and data lines Computer cables needed to access information on municipal systems Telkom reception not good, must use cell phone
Staffing Service providers (government employees) are not committed: arrive late and close up early When interns’ contracts are completed there is nobody to offer the service Need for hired security to watch over agricultural workshops
Agriculture Need more plants and vegetables for planting and selling Funds for vegetable production and farming needed

9
9
�
More poultry projects needed
Infrastructure Air conditioning needed owing to heat in buildings Toilets needed on premises Delays in office space allocation Limited office space available at MPCC
Social development Hospital too far, lack of social workers and too long waiting at hospital Lack of transport for social development department to service the areas
Training Irregular attendance at computer training classes Computer training not done for the community
Management Not all the departments forward statistical data to the center manager
Needs of MPCC managers from other provinces Comments received from MPCC managers from other provinces are presented in the table below. MPCC needs in the other provinces
Needs area Need
ICT Service-level agreement with service providers not yet in place telecenter not up and running Computers not connected to the Internet Have no computer equipment More than a year of operations for telecenter, but the computers are not working Still waiting for USAID to provide Internet server Telephone facilities not yet in place No equipment for telecenter; no feedback given when applying for equipment and assistance Office services, i.e. fax, Internet and postal services, are clustered
Staffing Need to appoint the right people: those who really want to assist other people Government officials first have to report at town offices, arrive at 11.00 and close at 16h00; people are
shown away after they have had to travel far and have waited a long time Service delivery is not what it is supposed to be because the officials are often late
Infrastructure Renovation is never finished because the local municipality has not bought into the MPCC idea The building is not well planned, cold in winter and hot in summer No privacy because the offices are open at the top Not enough space in the MPCC for the community
Training No training yet provided on computers Waiting on funding/donations for computer training Computer assisted learning not operational owing to financial constraints
Management Want to brand our MPCC We are still without a center manager Payment of rental space by service providers is not always on time Center manager does not have authority over officials of other departments
Access Too large area to cover: people still need to travel more than 30km to reach MPCC Transport to and from MPCC is a problem for users and workers
A similarity can be found between comments made by Limpopo province and those from other provinces. In the Western Cape, we found a few centers without ICT equipment and telecenters which were not operational. Most challenges identified can broadly be classified under the following concepts: i. Management: lack of skills to manage the project (planning, implementation, evaluation) and knowledge share; ii. Impact of key institutions and intermediaries like ICASA, Sentech and Telkom (to name a few); iii. Empowerment and voice of rural poor: officials, center or project managers are not accountable for service levels; iv. Coordination among stakeholders: includes frustrations of reporting structures and lack of commitment of officials; v. Skills training: training programs are urgently needed for the community, officials and project workers; vi. Funding and sustainability: the continuous need for funding and the matter of project sustainability; vii. Mindset and lack of follow through.
Lessons to be learnt and concluding remarks Projects must be rooted in the community as their sustainability depends on the perceptions of the community they serve and their sense of project ownership. The MPCCs are mostly externally driven owing to a lack of resources in the communities they serve. Funding aspects range from donations to infrastructural assistance. This combined with the

1
0
0
�
uniqueness of each community‘s changing needs makes exact duplications nearly impossible. For any MPCC to be sustainable, other methods of income generation are needed. This skill was found to be lacking in most of the managers, except for a few in Limpopo where the community vegetable garden and chicken/pig farming are used to make a small contribution to the sustainability of the community and the center. The needs of the community must be assessed to find out which services must be offered, prior to the planning and implementation phase and also throughout the lifespan of the project. The community must be able to voice needs and give and receive feedback. In most MPCCs, a suggestion box is available and frequent community meetings are held. The services of stakeholders need to be coordinated to prevent duplication and confusion. Providers in MPCCs have been providing services in the same communities in an uncoordinated manner, leading to reporting structure problems, frustration and lack of adaptability, as experienced by center managers. It seems as if these coordination skills are currently either lacking among center managers or that they have the perception that the accountability lies elsewhere. The project must have measurable outcomes and time frames and evaluation procedures must be in place. Time frames need to be monitored and followed up on in order to ensure service delivery. Statistical information on access and usage of services are compiled in a manager’s report, which is forwarded to the regional GCIS offices. However, it seems as If all the information is not added into the report. The service-providing departments either do not forward the information or the information is incomplete. It seems as if the completion of this report is the only evaluation activity. No measurable standards (benchmarking) are set for the center managers’ reports. Maintenance and upkeep of equipment and infrastructure should be included in the planning process. Functional equipment is needed in telecenters and MPCCs in order to be able to provide a service. Accountability for the operational section of the center needs to be clarified. The community must be able to hold all officials accountable, including project managers, center managers and the national manager. Accountability not only lies in the hierarchical reporting structures, but also with the beneficiaries of the projects, the community. A good communications strategy is needed to ensure that stakeholders are aware of the project and its activities. Currently, MPCCs are using regular community meetings and word of mouth to get the message out. It seems that a lot of money is spent on the initial roll-out and afterwards very little, if any, to make the community aware of the center. Any technology can only be used to the fullest potential if either the skills of the beneficiaries are matched or the beneficiaries are trained/instructed in its use. Skills transfer is a crucial success factor for such a project. Training is provided in telecenters, but it seems as if the necessary focus and commitment are currently lacking. Accessibility, affordability and availability of ICTs will not ensure use or benefit of ICTs by the community. Passion, skill and commitment of center managers and others can and will entice the community to visit the center and learn valuable skills in order to survive in the knowledge-based economy. Awareness of benefits and skills in terms of computer literacy and ICTs needs to be transferred to the community in order for them to use this valuable tool in a sustainable manner.. Handing a paper to someone to make a photocopy is not really bridging the digital divide. Thusong service centers have yet to unleash the African Renaissance!

1
0
1
�
Annex 31: Case Study: PITs
The PIT service represents a radical new step in bringing the benefits of IT, e-government and e-commerce within everyone's reach. This project was launched in 1998 as a joint project between the Department of Communications and SAPO. The issues addressed by this project are capacity building at the local level and building knowledge partnerships. On-line information is made accessible to communities and, to a large extent, cyber-phobia is being curbed. PIT is a computer system offered in the form of a kiosk. Its main purpose is to provide the public with access to online information, government, educational services, communication via email, goods and services, and the Internet. Minimal computer literacy is needed to interact with a PIT but the rewards are great. A PIT in Springfontein post office
To date, 825 machines have been purchased. Over 700 are installed in post offices with the infrastructure, online facilities, and the capacity. A few machines have also been installed in MPCCs. Aspects of livelihoods supported are to: i. Provide a social benefit to all citizens, making information and technology accessible and within everyone’s reach; ii. Reduce vulnerability though access to appropriate information; iii. Make institutions more accessible (public and private); iv. Provide a platform for e-commerce; v. Enhance service delivery; and vi. Share knowledge. Previously, people had to take long trips to access information in different government departments and schools. Some information was not accessible for disadvantaged and rural poor communities. The Department of Communication conducted research and identified these gaps and decided to bridge the digital divide by providing access to online information for needy communities. Money was made available from the Department of Communications (sponsorship) to SAPO to purchase machines and install power/network points in online post offices. The post office then installs the machines and provides the actual support and maintenance. Shell technology was developed to run a kiosk on the post office network. Revised models of hardware are being deployed to curb environmental challenges. Training is provided to branch staff and staff who assist users who may need help. PIT screen display

1
0
2
�
Government in partnership with SAPO is currently appointing ICT officers to assist in offices where the services are installed. These people are computer literate and are provided with further customized training on the technology.
Costs are shared between SAPO and the Department of Communications. All the services are free except for Internet access. Vouchers can be bought for R5 for an hour or R20 for three hours. The full value of the voucher does not have to be used in one session as the credit will remain available on the user’s secured sign-in. This is not a profit-driven initiative and the money received from the vouchers is used for the maintenance of the machines. The following factors influenced the decision on the specific hardware to use for the project: climate; average computer literacy of the communities; and type of information that is availed. Local or appropriately localized content is made available on the PITs, such as government information, forms, jobs, schools, email and Internet access.
The players in this project are local NGOs, local government, public service providers, private sector organizations, national NGOs, and national government. Local businesses are encouraged to advertise their business to the local community on PITs. Municipalities are also asked to make a link available to their systems, which might assist local communities. The project manager is also currently trying to involve local government in installing these machines in clinics and schools. This would require the ability to connect up computer networks and officers to man the machines, from a security point of view. This could also create jobs.
The biggest problem at the beginning of the project was the balance between the traditional and the new technology. Other initial challenges faced with this project were: i. Infrastructural, in terms of network and power stability; ii. Stability of the hardware, as this is the first of its kind in South Africa: a major contributing factor is the climate; iii. Lack of familiarity with technology: a bit of human guidance is needed for first time users; iv. Users with malicious intentions trying to hack the system in order to bypass voucher usage for Internet access.
Current challenges are power/network stability, climate, computer literacy and vandalism. SAPO executives and the Department of Communications receive statistical data on a regular basis on usage regarding voucher sales and statistical hits. Users are provided with a support number for if they experience any technical problems. There is an email address available on the application for queries. Surveys are also conducted from time to time to evaluate user satisfaction with the machines, problems they might encounter and suggestions regarding service improvements. From the surveys, it is clear that these PITs add a huge value to many people’s lives. Numerous requests have been received to install more PITs and also to improve the technology in certain ways. The livelihoods principles that have been applied in this project are: i. Focus on the people and not the resources; ii. Sustainability; iii. Build on strengths rather than focus on constraints; and iv. Scalability of the project.
Positive lessons to be learnt from the PITs project: i. People are keen to learn; ii. Information goes a long way in the development of societies; iii. ICT plays a crucial role; iv. Our country has a long way to bridge the ICT gap in rural communities; v. Training and assistance is needed if it is a new technology which people must use; vi. Content of information must be local; vii. Content of information must meet the needs of the community; viii. Information must be accessible and affordable; ix. We could have used a local supplier for the hardware; x. Sustainability of this project is important; xi. Constant evaluation and surveys is necessary on what the needs and expectations of the users are; xii. Give regard to technology appropriateness (a combination of PC and touch screen technology with visual
symbols); xiii. Where money (whether vouchers or access time) is involved, secured premises and security are needed; and
xiv. The project should use existing venues visited by the community, such as post offices.