Embed Size (px)
Citation preview

Rural Educator Preparation Partnerships: Partnering to Success
2002/2003
Evaluation Report
Prepared for: Rural Educator Preparation Partnership
University of Alaska Fairbanks
Prepared by: G. Williamson McDiarmid University of Washington
Alexandra Hill Institute of Social and Economic Research,
University of Alaska Anchorage
December 2003

TABLE OF CONTENTS
Table of Contents............................................................................................................................. i
Section 1. Introduction................................................................................................................... 1
Section 2. REPP Program Administration ..................................................................................... 2
Objective – Professional Development Schools ......................................................................... 2
Objective: To support timely completion of ILPs .................................................................... 13
Objective: To create a supportive group of learners among REPP interns............................... 16
Section 3. Observations of REPP Graduates ............................................................................... 18
Methods..................................................................................................................................... 18
Analysis..................................................................................................................................... 20
Findings..................................................................................................................................... 21
Summary and Discussion of Findings ...................................................................................... 56
Appendix A. Frequency Counts of REPP PDS Survey: PDS School Respondents ................... 63
Appendix B. Observation Protocol For REPP Graduate Observations Spring, 2003 ................. 69
Appendix C. REPP Graduate Survey Results, 2003..................................................................... 77

REPP Evaluation Report Dec 2003
SECTION 1. INTRODUCTION Alaska, like other states, faces a teacher shortage. Like other states, the shortage is geographically specific. That is, shortages occur only in some schools and some communities. In Alaska, the majority of the schools facing shortages are in rural communities off the road system. These schools, year in and year out, have difficulty attracting and retaining teachers. In fact, the 18 school districts with the highest turnover rates in the state—that is, rates averaging 20 percent annually over the period 1996-2000—are all, with one exception, remote rural districts (McDiarmid, 2002). Averaging turnover rates and using district rather than school data mask the fact that, each year, some remote rural schools experience 100 percent turnover.
These hard-to-staff schools share certain characteristics with hard-to-staff schools elsewhere. They tend to be located in communities where unemployment is high and many families have incomes below the poverty line (McDiarmid, 2002). In Alaska, the population of these communities tends to be predominantly Alaska Native. In addition, the teachers in these hard-to-staff schools tend to be younger and have less experience than their counterparts in low-turnover schools (McDiarmid, 2002). Most pertinently, these schools are staffed almost entirely by teachers born, reared, and trained outside of Alaska. Among rural districts with an annual turnover between 15 percent and 30 percent, only 14 percent of the teachers are Alaska Natives. In those districts where the annual turnover rate has historically exceeded 30 percent, only 12 percent of the certified staff is Alaska Native (McDiarmid, 2002).
High teacher turnover is a concern for several reasons, the most important of which may be that low levels of teacher turnover are associated with continuously improving student learning, as measured by standardized achievement tests (Grissmer et al., 2000). In Alaska, the constant turnover of teachers in hard-to-staff schools constitutes an ongoing disruption in the students’ school experiences. Little wonder that the lowest scores on the state’s High School Graduation Qualifying Examination are found in the communities with the highest rates of teacher turnover (McDiarmid, 2002).
The primary goal of Rural Education Preparation Partnerships (REPP) is to increase the number of teachers in rural school districts who are either Alaska Native or who have lived in rural Alaska for an extended period. Within this goal, the program has five objectives:
1) To implement five new Professional Development Schools (PDS) Sites
2) To support timely completion of Individual Learning Plans (ILPs)
3) To increase the number and quality of mentors
4) To create a supportive group of learners among REPP interns
5) To evaluate REPP’s success in training teachers by observing graduates in classrooms
The first four objectives relate to moving REPP teacher candidates smoothly through the program to their teaching certificates. Section 2 of this report evaluates the program’s success in meeting objectives one through four. The fifth objective—to evaluate REPP graduates in the classroom—calls for more directly assessing whether REPP has succeeded in putting well-qualified teachers into rural Alaskan classrooms. Section 3 discusses our methodology for and findings from those observations.
1

REPP Evaluation Report Dec 2003
SECTION 2. REPP PROGRAM ADMINISTRATION Objective – Professional Development Schools
In addition to the teacher preparation component, REPP also established professional development schools in rural districts to try to improve the quality of professional development available to rural teachers. The proposal states that:
By the end of the grant cycle, five PDS sites will be in place…Each PDS will be coordinated by a PDS specialist and will accommodate an average of three REPP intern-mentor pairs every year.
Implementation of Professional Development Schools The REPP program implemented five PDS schools in the 2001/02 and 2002/03 school years:
• Mikelnguut Elitnaurviat School, grades K-2 in Bethel, • Johnnie John School, grades K-12 in Crooked Creek, • Koliganek School, grades K-12 • Glennallen Elementary, grades K-6 • Unalakleet School, grades K-12
The Table 2-1 below summarizes each site’s PDS activities. The difficulties these schools encountered in implementing their PDS plans typically centered on (a) high turnover and (b) lack of time on the part of the teachers, principals, staff and the PDS specialists to follow through on plans. Despite these difficulties, there were successes. By the 2001/02 school year, all five schools did have a PDS specialist, although that specialist changed in three of the five schools for the 2002/03 SY. Three of the five PD schools also changed principals between those two years. Only one school had the same principal and PDS specialist both years.
The schools also did not achieve the hoped-for number of REPP interns on site. This is largely because the REPP program recruits candidates who already live in rural communities and want to stay in their communities. So, REPP staff doesn’t typically assign candidates to schools outside of their home communities. During the time of this grant, candidates, in general, came from schools and communities other than those designated as PDSs.
2

REPP Evaluation Report Dec 2003
Table 2-1. Professional Development School Activities, 2001 to 2003
School PDS Specialist?
REPP Interns, Fall 00 -Spr 03
Area of Focus PD Activities 01/02 PD Activities, 02/03
Koliganek Yes 1 K-12Literacy
Attended NWRL 1-day workshop for teaching reading comprehension; drafted literacy plan; started Future Teachers Club (FTC).
Three 1-day workshops with classroom follow-ups: Kagan Cooperative Learning; Writing Workshop; Literacy Workshop
Crooked Creek
Yes 0 K-12Standards-based Instruction
On-site training in standards-based instruction and scheduling from Chugach staff; two students attended April Job Fair as FTC members; acquired teacher training resources
Continued on-site training by Chugach staff; two staff attended off-site standards-based workshops; FTC members again attended April job fair
Mikelgnuut Elitnarviat
Yes 1 K-2Literacy
PDS specialist and one teacher attended literacy education conference; purchased resources for literacy teacher training; wrote Literacy Plan
Staff development on guided reading including advanced sessions/techniques, and on oral language development
Glennallen Yes 1 Literacy,Writing, Assessment
K-12 involvement: Pudewa three-day on site training; acquired Pudewa training videos and other teacher training resources; workshop on inquiry in teaching secondary reading; half-day workshop on implementing writing program; FTC members attended April job fair
K-6 involvement: additional Pudewa and other training on teaching writing; PDS specialist attended Step-Up Writing Conference in order to be able to train staff; FTC members attended April job fair
Unalakleet Yes 2 K-12Literacy
Established literacy team; drafted literacy plan. Established FTC, which sent students to April job fair, held Teacher Appreciation Day
On-site training in May on teaching reading and writing
3

REPP Evaluation Report Dec 2003
Assessment of Student Learning REPP’s PDS coordinator, who worked with all five schools for two years, collected and evaluated assessment information from each school related to that school’s area of focus. Two schools didn’t provide the requested assessment information. In Crooked Creek, 27 of the 49 students (55 percent) enrolled in the 2002/03 school year took both pre (spring 2001) and post (spring 2003) reading assessments. Of those, 86 percent (23 students) demonstrated reading growth. Mikelgnuut Elitnarviat in Bethel is a K-2 school, and so doesn’t use any of the statewide assessments that begin at grade 3; they use Running Records. That assessment showed that the percent of students performing below grade level in Kindergarten dropped from 55 percent in the Spring of 2001 to 48 percent in the Spring of 2003. For first graders, the percent below grade level dropped from 62 percent to 53 percent. No comparable scores were available for second graders, whose assessment changed in 2003. Glennallen Elementary used the third and sixth grade writing benchmark test; third graders testing below proficient or not proficient dropped from 36 percent in spring 2001 to 25 percent in spring 2003. Sixth graders dropped from 16 percent below/not proficient to 9 percent. For both grade levels, the number of students testing “Not proficient” (the lowest level) dropped to zero.
In all cases, the numbers of students tested are small. Only Crooked Creek used pre and post tests that showed individual student growth. The other two schools relied on improving group averages of the students in a given grade in a given year. The schools that provided assessment information were those that were more successful overall in implementing their PDS plans, and held more professional development activities earlier in the project that those that did not. Nevertheless, the results from those three schools are generally positive. At the same time, we need to be cautious about attributing improvements in standardized text scores to these schools designation as professional development schools. Many other factors influence such assessment results.
Teacher Attitudes about the PDS Experience We surveyed teachers in the five PDS schools and in five non-PDS schools matched for region and size, to look at differences between PDS and non-PDS sites. We based our questionnaire on one developed as part of an NPEAT project funded by a USDOE grant called Professional Development Schools and Experienced Teacher Learning 2.3.1. We shortened the questionnaire to focus on the areas most relevant to our professional development schools. Our shortened questionnaire included 80 items grouped into three areas:
Your School as a Workplace (29 questions) Your Instructional Practices (8 questions) Your Professional Development (43 questions)
We also asked about the teachers’ backgrounds–years of experience teaching, years in their current school, level of education, race, gender, and what grade and subject they currently taught. The questionnaire with frequency counts for REPP PDS respondents is included as Appendix A.
Of the 71 faculty in the five PD schools, 32, or 45 percent, returned surveys. Of the 63 faculty in comparison schools, 22 returned surveys (35 percent). Although these response rates are low, they are typical for surveys that are not administered in person (ether face-to-face or over the telephone). We don’t have background data on these schools to determine if teachers who responded might be a biased group. The results should be interpreted with caution.
4

REPP Evaluation Report Dec 2003
We analyzed survey responses first by looking at responses of those in REPP PD schools to see what areas they identified as problematic or as working well, and second by comparing the responses of teachers in REPP and non-REPP schools to see if they differed systematically.
Responses of PDS teachers Appendix A provides frequency counts of all REPP PDS responses for all questions; only selected questions are in the tables below.
Demographics: The 32 teachers in REPP PD schools who responded averaged 10.6 years of experience with a median of 10 years. They had been teaching at their current schools, on average, for 5.3 years (median 4 years). While only two were in their first or second year of teaching, ten were in their first or second year of teaching at their current school.
Most (71 percent) had only a Bachelor’s degree. Most were white (79 percent) and female (76 percent). Four–13.8 percent of those who responded to this question– identified themselves as Alaska Natives. This is close to the rural Alaska average of about 11 percent1.
School as a Workplace: Almost 60 percent of respondents felt they had sufficient resources to work with, but two-thirds felt there was not enough time to do “what is important to do” (Table 2-2) Only a few regularly received meaningful feedback on their teaching, visited other teachers’ classrooms, or invited someone to help teach their class (Table 2-3). Ninety percent never talked with college or university faculty, or talked with them only once or twice (Table 2-4).
Table 2-2. Attitudes about School
Indicate the extent to which you agree or disagree with each of the following statements about this school.
Strongly disagree/ Disagree
Strongly agree/ Agree
Total
21 10 31 Sufficient time is available to do what is important to do 68% 32% 100%
12 17 29 Sufficient resources are available to do what is important to do 41% 59% 100%
Table 2-3. Interactions with Colleagues
This school year, how often have you: Never Once/ Twice
Regularly Total
7 17 7 31 Received meaningful feedback on your performance from colleagues? 23% 54% 23% 100%
12 11 8 31 Visited other teachers’ classrooms? 39% 35% 26% 100% 11 16 4 31 Invited someone in to help teach your class?
35% 52% 13% 100%
1 Alaska Natives comprise about 5 percent of public school teachers statewide in the 2000/01 school year. Rural districts range from 0 to 35 percent Alaska Native teachers and average about 10 percent .
5

REPP Evaluation Report Dec 2003
Table 2-4. Interactions with University Faculty
How often do you talk about teaching practices with: Never Once or Twice Occasionally Regularly Total
17 10 3 0 30 College/university faculty
57% 33% 10% 0% 100% We asked about nine ways the schools might have changed during the partnership (Table 2-5). On five of those measures, two-thirds or more of respondents chose “no change”–most notably the quality of interaction with college/university faculty. However, the majority of respondents felt there had been improvement in four measures–quality of curriculum and instruction, teachers learning from one another, professional growth opportunities, and their own teaching effectiveness.
Table 2-5. Changes During the PDS Partnership
Rate the extent to which the following have changed during your school’s partnership with your college/university
Worse No Change Better Total
2 22 6 30 How the school relates to the community
7% 73% 20% 100% 0 21 9 30
How teachers get along with each other 0% 70% 30% 100% 0 20 10 30
Sense of community in the school 0% 67% 33% 100% 0 10 20 30
Quality of curriculum and instruction 0% 33% 67% 100% 0 22 8 30
My commitment to the school 0% 73% 27% 100% 0 13 17 30
Teachers learning from one another 0% 43% 57% 100% 0 9 21 30
Professional growth opportunities 0% 30% 70% 100% 0 8 21 29
My teaching effectiveness 0% 28% 72% 100% 0 22 6 28
Quality of interaction with college/university faculty 0% 79% 21% 100%
6

REPP Evaluation Report Dec 2003
Instructional Practices: Two thirds of respondents agreed with the statement “Once we start a new program, we follow up to make sure that it’s working”, but two thirds also agreed that “Many special programs come and go at this school.” Two-thirds disagreed that “Supplemental programs like Chapter I are carefully designed to complement my classroom teaching.” (Table 2-6)
Table2-6. New Programs in the Schools
Indicate the extent to which you agree or disagree with each of the following statements:
Strongly disagree/ Disagree
Strongly agree/ Agree
Total
11 21 32 Once we start a new program, we follow-up to make sure that it’s working. 34% 66% 100%
10 20 30 Many special programs come and go at this school 33% 67% 100%
20 10 30 Supplemental programs like Chapter I are carefully designed to complement my classroom teaching. 67% 33% 100%
Professional Development: In keeping with their attitudes about aspects of the school that had changed for the better, respondents reported substantial time spent in professional development on all the topics we asked about. As Table 2-7 shows, the majority reported at least some professional development in all five topics, and most reported 2 or more days devoted to learning goals and standards and assessment and evaluation.
Table 2-7. Time spent in Professional Development
During the past twelve months, about how much time have you spent in professional development activities devoted to each of the following topics?
N/A or 0 hrs
3 hrs or
less
4 to 6 hrs
7 to 15 hrs
16 to 30 hrs
> 30 hrs
Total
3 4 1 5 2 16 31 Learning goals and standards
10% 13% 3% 16% 6% 52% 100% 2 3 4 6 6 10 31
Student assessment and evaluation 6% 10% 13% 19% 19% 32% 100% 8 12 2 1 2 6 31
Multicultural diversity issues 26% 39% 6% 3% 6% 19% 100%
5 6 6 3 6 5 31 Student social skills and personal development
16% 19% 19% 10% 19% 16% 100% 7 10 4 4 3 3 31
Parent involvement and/or community relations 23% 32% 13% 13% 10% 10% 100%
Most respondents felt positive about the quality of their professional development, as table 2-8 shows. Only two areas were somewhat weaker. About 40 percent of the respondents felt their professional development hadn’t included enough time to think carefully about, try and evaluate
7

REPP Evaluation Report Dec 2003
new ideas. About 60 percent felt their professional development hadn’t included opportunities to work productively with teachers from other schools–a challenge, given the remote locations of some of these schools.
Table 2-8. Opinions about Professional Development Experiences
Overall, my professional development experiences over the past year have:
Strongly disagree Disagree Agree Strongly
agree Total
2 6 16 6 30 Been sustained and coherently focused, rather than short-term and unrelated. 7% 20% 53% 20% 100%
2 11 14 4 31 Included enough time to think carefully about, try, and evaluate new ideas. 6% 35% 45% 13% 100%
2 3 20 6 31 Been closely connected to my school's improvement plan. 6% 10% 65% 19% 100%
0 10 18 3 31 Included opportunities to work productively with colleagues in my school. 0% 32% 58% 10% 100%
3 16 9 3 31 Included opportunities to work productively with teachers from other schools. 10% 52% 29% 10% 100%
0 7 20 4 31 Helped me understand my students better
0% 23% 65% 13% 100% 1 6 18 6 31 Deepened my understanding of subject
matter 3% 19% 58% 19% 100% 0 5 18 8 31
Led me to make changes in my teaching 0% 16% 58% 26% 100% 1 7 20 3 31 Helped my school's staff work together
better 3% 23% 65% 10% 100% 1 10 17 2 30 Changed the way teachers talk about
students 3% 33% 57% 7% 100% 0 9 15 6 30
Shifted my approaches to teaching 0% 30% 50% 20% 100%
Not surprisingly, when we asked to whom respondents turned for help in improving their teaching, the most common answer (30 responses) was other teachers at their school, followed by their principal (20) and other teachers (16). No one chose university faculty in partnership with the school.
8

REPP Evaluation Report Dec 2003
Most respondents felt the professional development school had accomplished some good things (Table 2-9). Sixty percent or more reported that it had helped them to understand their students better, deepened their understanding of subject matter, led them to make changes in their teaching and better assess student work.
Table 2-9. Opinions about Professional Development School Outcomes
To what extent do you agree or disagree with the following statements about what the professional development school has done?
Strongly Disagree
Disagree Agree Strongly
agree Total
3 9 17 1 30 Helped me understand my students better
10% 30% 57% 3% 100% 3 5 20 2 30
Deepened my understanding of subject matter 10% 17% 67% 7% 100%
9 17 4 0 30 Advocated practices I do not believe in
30% 57% 13% 0% 100% 2 7 17 4 30
Led me to make changes in my teaching 7% 23% 57% 13% 100% 2 10 14 4 30
Helped me better assess student work 7% 33% 47% 13% 100% 2 13 13 1 29
Changed the way teachers talk about students 7% 45% 45% 3% 100% 3 11 11 4 29 Shifted approaches to teaching with school
faculty 10% 38% 38% 14% 100%
Contrasting PDS and comparison school responses Demographics: Comparison school teachers had, on average, about one year longer teaching experience and about a year and a half longer in their schools. However, those differences were not statistically significant. Nor were there significant differences in race, gender, or level of education.
Of the 80 questions, PDS teachers’ responses differed significantly from those in comparison schools on 17 items at the five percent significance level. Seven of those items asked specifically about things that happened as a result of the PDS partnership; we would expect those without partnerships to answer those questions differently. Also, because we don’t have any data about PDS or comparison schools before the partnership began, the differences we see could have existed before the partnership, rather than as a result of it. However, the most striking cluster of differences was in the time spent on professional development activities over the previous 12 months. PD school teachers reported spending more time in all five topical areas than comparison school teachers (Table 2-10). While it could be that schools with more professional development activities were more likely to become professional development
9

REPP Evaluation Report Dec 2003
schools, it’s also reasonable that REPP’s focus on and funding of professional development activities at the PDS’s led to more professional development activities at those schools.
PD school respondents were more likely to have attended professional development activities led by another teacher, and they spent more time in a variety of activities. They were more than twice as likely to report spending 30 or more hours devoted to learning goals and standards, three times as likely to have spent 30 or more hours on student assessment and evaluation, and five times as likely to have spent 30 or more hours on multicultural diversity issues. They were almost twice as likely to have spent at least some time learning about student social skills and parent involvement or community relations (Table 2-10).
Table 2-10. Time Spent on Professional Development Topics
During the past twelve months, about how much time have you spent in professional development activities devoted to each of the following topics?
None 30 hours or less
More than 30 hours Total
3 12 16 31 PDs
10% 39% 52% 100% 6 11 5 22
Learning goals and standards Chi-squared=0.02
Comp 27% 50% 23% 100%
2 19 10 31 PDs
6% 61% 32% 100% 4 16 2 22
Student assessment and evaluation Chi-squared=0.01
Comp 18% 73% 9% 100%
8 17 6 31 PDs
26% 55% 19% 100% 13 8 1 22
Multicultural diversity issues Chi-squared=0.03
Comp 59% 36% 5% 100%
5 21 5 31 PDs
16% 68% 16% 100% 12 10 0 22
Student social skills and personal development Chi-squared=0.0001
Comp 55% 45% 0% 100%
7 21 3 31 PDs
23% 68% 10% 100% 12 10 0 22
Parent involvement and/or community relations Chi-squared=not significant
Comp 55% 45% 0% 100%
10

REPP Evaluation Report Dec 2003
PD school teachers reported talking more often with interns or teacher education students; they reported more influence over the content of in-service programs. They were more likely to agree that “You can see real continuity from one program to another at this school.” Despite generally low reports of interaction with university faculty by both groups, PD school teachers were more likely to report working at least once with university faculty (Tables 2-11 to 2-14).
Table 2-11. How often do you talk about teaching practices with Intern/teacher education students?
Never/
Once or Twice Occasionally
Regularly Total
22 9 31 PD Schools
71% 29% 100% 20 2 22 Comparison
Schools 91% 9% 100% Chi-squared=0.03
Table 2-12. Indicate how much influence you have over determining the content of in-service programs
None/
A Little Some/
A Great Deal Total 15 16 31
PD Schools 48% 52% 100% 19 3 22
Comparison Schools 86% 14% 100%
Chi-squared=0.0005
Table 2-13. Indicate the extent to which you agree or disagree that “You can see real continuity from one program to another at this school”
Agree Disagree Total 18 12 30
PD Schools 60% 40% 100%
7 15 22 Comparison Schools
32% 68% 100% Chi-squared=0.03
Table 2-14. How often have you had the opportunity to work directly with college/university faculty in college classrooms?
At Least Once Never Total 9 22 31
PD Schools 29% 71% 100%
2 20 22 Comparison Schools
9% 91% 100% Chi-squared=0.03
11

REPP Evaluation Report Dec 2003
Summary REPP’s Professional Development School efforts had mixed results. High staff turnover and busy schedules meant that some schools did only a small part of what they planned, while others accomplished much of what they hoped. Teacher candidates were not part of this professional development school program because of logistical difficulties. There was little collaboration between K-12 teachers and university faculty. However, teachers were generally positive about their professional development opportunities under the partnership, and available student achievement results showed gains over the two-year period of PDS implementation.
12
REPP Evaluation Report Dec 2003
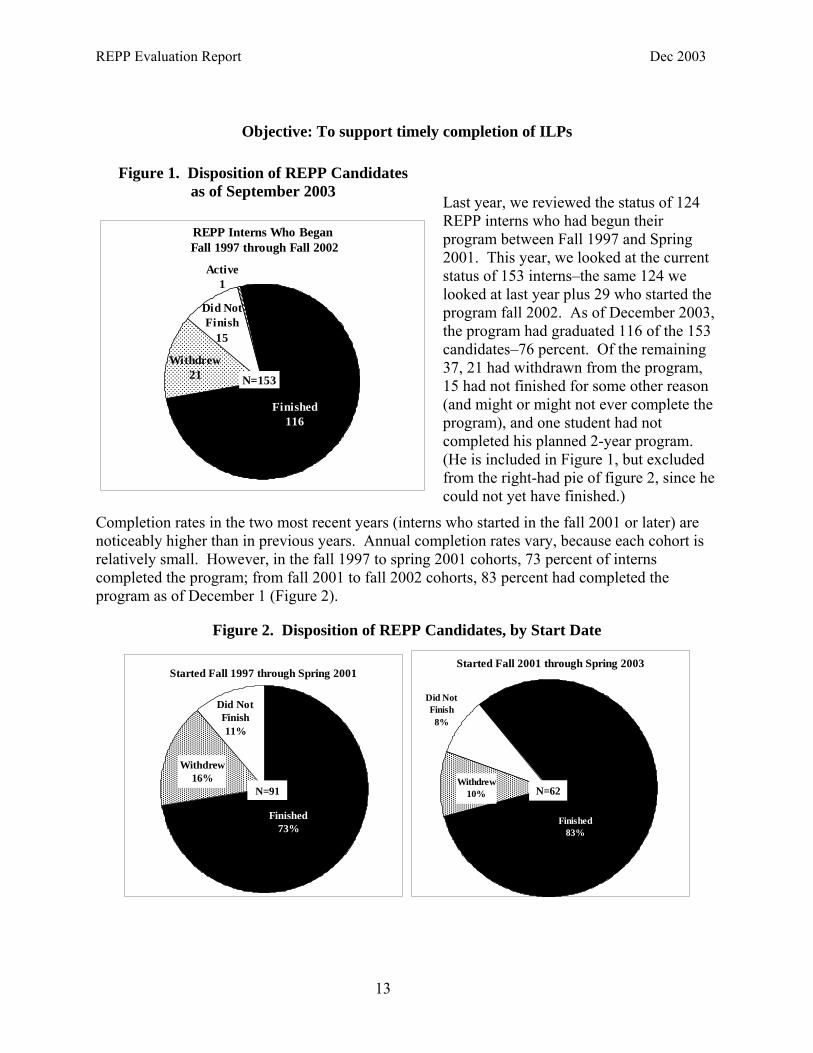
Objective: To support timely completion of ILPs
Figure 1. Disposition of REPP Candidates as of September 2003
REPP Interns Who Began Fall 1997 through Fall 2002
Active1
Finished116
Withdrew21
Did Not Finish
15
N=153
Last year, we reviewed the status of 124 REPP interns who had begun their program between Fall 1997 and Spring 2001. This year, we looked at the current status of 153 interns–the same 124 we looked at last year plus 29 who started the program fall 2002. As of December 2003, the program had graduated 116 of the 153 candidates–76 percent. Of the remaining 37, 21 had withdrawn from the program, 15 had not finished for some other reason (and might or might not ever complete the program), and one student had not completed his planned 2-year program. (He is included in Figure 1, but excluded from the right-had pie of figure 2, since he could not yet have finished.)
Completion rates in the two most recent years (interns who started in the fall 2001 or later) are noticeably higher than in previous years. Annual completion rates vary, because each cohort is relatively small. However, in the fall 1997 to spring 2001 cohorts, 73 percent of interns completed the program; from fall 2001 to fall 2002 cohorts, 83 percent had completed the program as of December 1 (Figure 2).
Figure 2. Disposition of REPP Candidates, by Start Date
Finished73%
Did Not Finish11%
Withdrew16%
Started Fall 1997 through Spring 2001
N=91
Did Not Finish8%
Finished83%
Withdrew10%
Started Fall 2001 through Spring 2003
N=62
13

REPP Evaluation Report Dec 2003
The non-completion rate (incomplete plus withdrew) has dropped by more than one-third, even though the more recent cohorts have had less time to finish. Based on their current progress, between two and five of currently incomplete students will finish by the end of spring 2004, dropping the non-completion rate to between 10 and 14 percent–just one-third to one-half of the rate for interns who started in the early years of the program.
The improved completion rate is likely the result of several factors. The program has continually expanded and improved its use of distance-learning technology and arranged periodic meetings for mentors and interns. Faculty partners have gained expertise at working effectively with interns. We reported last year that intern-intern and intern-faculty communication through the Blackboard system had increased markedly in 2001/02, and it increased again in 2002/03. The way in which the portfolio assignments are structured and interns supported in producing their portfolio continues to change in response to interns’ concerns. All these factors likely contributed to increased student retention and on-time program completion.
REPP Graduates Entering Classrooms
A major concern for teacher educators is that the yield of classroom teachers from the prospective teachers who enter traditional four-year programs is often less than desirable. Of those who complete preservice programs, about 60 percent will enter the classroom. Of these, as many as 30 percent to 50 percent leave teaching within the first five years (Darling-Hammond, L., & Sclan, E. M. 1996). Consequently, of 100 graduates from traditional university-based, four-year programs, as few as 30 to 40 may be in the classroom five years out. Alternate-route preparation programs—which vary considerably in content, design, and length—do not appear to do better than traditional programs in producing teachers who enter and stay in the classroom and, in some cases, may do worse (Darling-Hammond,L. & Sclan,E., 1996).
Some schools of education have attempted to increase the rigor of their teacher preparation programs by offering either a five-year program that awards both a bachelor’s degree and a teaching certificate or a fifth-year program that requires a bachelor’s degree for entry. Both programs emphasize completion of an academic major in addition to education courses. Some evidence suggests that graduates of these five-year and fifth-year programs are both more likely to enter the classroom and to stay there longer (Andrew, M. D., 1990). Why this is the case is unclear. It may well be that those who enter five-year and fifth-year programs differ in significant ways from those students who matriculate in traditional four-year programs. They tend to be older and, therefore, may have experience in other jobs. When they decide to become teachers, they may do so with a surer sense that this is the profession for them. Their prior work experiences may also have better prepared them for the rigors and demands of teaching. In short, although advocates of five-year and fifth-year programs are eager to claim credit for better yields, we do not currently have data to support or counter these claims. Differences in yield may have as much to do with differences in the demographics of those who choose each type of program as with the program content or design.
In collecting data on the graduates of the REPP program, we worked closely with the program administration to track participants. Also, the Alaska Department of Education and Early Development was able to tell us which graduates were teaching in Alaska public school districts in the 2002-2003 school year. However, there were still a few graduates whose status we couldn’t determine–the “unknown” category in Table 2-15 below. Some of these REPP
14

REPP Evaluation Report Dec 2003
graduates may have left teaching or left the state; some recent graduates may still be looking for their first teaching job.
In Table 2-15, we have attempted to account for the 113 program graduates from 1997 to the spring of 20032. We were particularly interested in the percentage of graduates who actually entered the classroom. We were able to identify the teaching status of 86 of the 113 graduates.
Alaska public schools employed 60; 9 were in “other teaching” positions, which included teaching outside of Alaska, teaching in private schools, substituting, or administrative positions. Seventeen were not teaching, and we don’t know the status of 27.
Table 2-15. Fall 2003 Teaching Status of 113 REPP Graduates who Finished the Program from Spring 1997 through Spring 2003
School Year Completed REPP
Teaching, Rural
Teaching, Urban
Other Teaching
Not Teaching Unknown Total
1997/98 10 1 1 3 15 1998/99 3 1 2 4 10 1999/00 7 1 1 5 2 16 2000/01 7 5 4 5 21 2001/02 8 1 7 16 2002/03 12 4 6 3 10 35
Total 47 13 9 17 27 113
The yield is high–80 percent of those whose status we could identify were teaching. Just over half were teaching in Alaska rural public schools. Even if we include assume that none of those in the unknown group are teaching, those figures are 60 percent of graduates teaching and 41 percent teaching in Alaska rural public schools.
While producing seven teachers each year for rural schools will not fill all rural Alaska’s teacher needs, it still represents a significant contribution. High turnover rates are a problem for most rural Alaska districts. Many schools are very small–the average teaching staff in the highest turnover rural districts is 32; in rural districts with historical turnover rates between 15 percent and 30 percent, the average district staff size is 80 (McDiarmid, 2002). Some very small schools may experience 50 percent turnover from one year to the next. Even a few teachers committed to their communities (as REPP teachers are more likely to be) can reduce those high turnover rates.
2 Of the 116 graduates, three did not complete until fall 2003 and could not have been hired at the beginning of the current school year.
15

REPP Evaluation Report Dec 2003
Objective: To create a supportive group of learners among REPP interns REPP interns and their faculty are scattered across Alaska, and may see each other only a few times during their program. This can lead to interns feeling isolated and unsupported as they try to balance the academic demands of the program with those of being in the classroom each day. REPP attempts to address this problem by holding meetings for interns periodically and by using technology to support continuing communication, even when participants are geographically separated. For many, their internship year begins with the fall meeting with other interns as well as mentors and REPP personnel. This gives interns an opportunity to initiate personal relationships that can be continued at a distance. During the year, they communicate periodically via teleconference and in threaded discussion groups in their distance-education class. This class is delivered via Blackboard—a system instructors can use to set up Internet classes—and REPP staff has persevered in finding ways to take advantage of Blackboard’s capabilities.
In 2000/01, the threaded discussions were sparse; few interns participated and those who did posted only a few times. In 2001/02, interns were required to participate, at least occasionally. This requirement provided the critical mass of communication necessary to make the discussions useful to the interns. Many posted far more than was required. For some interns, the discussion board became a primary tool in soliciting and providing feedback on a wide variety of topics. In 2002/03, this trend continued, and the use of Blackboard again rose. Figure 3 shows how the two years compare.
Figure 3. REPP Intern’s Communications, 2001/02 and 2002/03
more than twice a week
2%
once or twice a week12%
Zero12%
less than once/month
50%
several times per month
24%
How Frequently Did REPP Interns Access Blackboard Communications Areas? 2001/2002 School Year
more than twice a week
7%
Zero4%
less than once/month
29%
several times per month
40%
once or twice a week20%
How Frequently Did REPP Interns Access Blackboard Communications Areas?
2002/2003 School Year
In 2001/02, about 60 percent of interns appear to have posted the minimum required (or, in a few cases, did not post at all). The remaining 40 percent went well beyond the minimum. By contrast, in 2002/03, only about one-third of interns were posting the minimum or less; the majority were posting more than required. In addition, the program held weekly teleconference calls that took the place of Blackboard’s “live chat” feature which had not proved successful in previous years. Faculty posted topics or assignments (as appropriate) for these calls in advance on Blackboard, and reported that participation was high.
REPP program structure has changed for 2003/04, and this appears to be affecting interns’ use of threaded discussion groups. Although some interns or faculty accessed the communications area
16

REPP Evaluation Report Dec 2003
on 219 of 241 possible days in 2002/03, use in the fall, 2003, has greatly declined. Only 35 messages on 3 topics were posted in threaded discussion groups as of December 1, 2003, about 10 messages per month. In 2002/03, program participants and faculty posted 350 messages on eleven different topics, or about 35 per month. In the new program structure, interns will take their portfolio preparation class in the spring semester (rather than throughout the year), and that is the class that has generated the most discussion on Blackboard. We will again track threaded discussions during the spring of 2004 to see if use increases.
17

REPP Evaluation Report Dec 2003
SECTION 3. OBSERVATIONS OF REPP GRADUATES REPP was established to help reduce the turnover rate in high-need, hard-to-staff rural schools and to increase the number of teachers who are either Alaska Native or are rural residents who know Alaska Native culture. Historically, nearly 70 percent of teachers in Alaska schools have been trained outside the state. And, as noted, many teach in rural Alaska for a year or two and then move either to urban Alaska or to the Lower 48. REPP was designed to provide student teachers who already live in rural Alaska with a rural-based teaching experience that would help them develop the skills and knowledge to be successful in Alaska’s small rural schools.
This evaluation was designed to answer several questions. The first is, has REPP done its job in graduating teachers who take jobs in Alaska’s rural schools? The goal of the program was not merely to graduate teachers, however. Another goal was that these teachers would be well prepared by state standards. Thus, another question was, how well prepared are REPP graduates for teaching in rural Alaska classrooms, compared with Alaska teachers prepared in traditional preservice programs and now teaching in rural schools?
Methods Design and Implementation Our primary method of collecting data was conducting interviews and observing REPP graduates and non-REPP graduates teaching in their classrooms. We chose such a comparative observational design because a key question for the evaluation was whether REPP graduates were as well prepared as those trained in traditional preservice programs. To answer this question, we identified schools in which REPP graduates were employed. Then, we identified the non-REPP teachers who were in at least their second year of teaching—ideally, teachers who were comparable in experience to the REPP graduates. Because of the small school size, sometimes the only available comparison teachers were far more experienced than the REPP graduates we observed. We used the same interview and observation protocols for both groups. We carried out all observations during the 2002/2003 school year.
Selection of observers: We identified three veteran Alaska educators as observers. Two had over 20 years’ experience teaching, administrating, and providing technical assistance to rural schools, mostly in the northern and western parts of the state. The third had similar levels and types of experience in southeast Alaska. All had had prior experience supervising teachers who had just graduated.
Observation protocol: Using the Alaska State Standards for Teachers,3 we developed an observation protocol (attached). This is consistent with the goals of REPP that include preparing teachers who meet the state standards. Observers began with about two hours in the classroom. During this time, they filled out an observation instrument for each lesson; the instrument was designed to record information needed to complete, subsequently, the standards-based assessment. They then interviewed the teacher, to put the classes observed in context and to add information about some areas that were unlikely to be observed in any single half-day period. Finally, observers completed a standards-based assessment that related the classroom behaviors they had seen to the Alaska state standards. For each of the teacher standards, the observers
3 http://www.eed.state.ak.us/qschools/standards.html
18

REPP Evaluation Report Dec 2003
rated the teacher as proficient, developing, novice, or absent, using a set of criteria developed for the protocol. Observers also provided a written justification for each rating.
Training of observers: To ensure that the observations were as consistent as possible across different observers, the three observers met with ISER staff for a day-long training session in 2001. The session began with a detailed review of the observation protocols. Next, everyone viewed a 45-minute digital video of a teacher in a classroom and completed the observation instrument and standards-based assessment. The group discussed their entries, to determine where and how they might have rated the teacher differently. With that discussion in mind, they then observed and rated a second video and again discussed results to resolve any remaining inconsistencies. The group met again before commencing the 2002/03 observations, to discuss what they’d encountered in 2002 and to review the instrument and procedures.
Sample: As noted above, we selected our sample from REPP graduates who were currently teaching. Research and experience both suggest that the first year of teaching is, for most novice teachers, about survival—so we excluded first-year teachers from our sample. Teachers in our comparison sample were non-REPP teachers who were in at least their second year of teaching and teaching at the same schools as the REPP graduates. As Table 3-1 shows, we observed 22 REPP graduates and 21 non-REPP teachers. Of the 22 REPP graduates, 15 were teaching at the elementary level and 7 at the secondary. Of the 21 non-REPP graduates, 16 were teaching at the elementary level and 5 at the secondary. While verifying information on REPP graduates’ whereabouts and attempting to schedule observations, we extended and refined the information program personnel had provided on the current activities of REPP graduates. We used these data for our analysis of REPP’s success at putting more teachers into rural classrooms—the first section of our findings.
Table 3-1. Teaching Levels of REPP and Non-REPP Observed Teachers
Elementary Secondary Totals REPP 15 7 22 Non-REPP 16 5 21 Total 31 12 43 Observation procedures: We observed teachers for between one and six lesson periods; lessons were between 30 and 90 minutes long. On average, observers were in each classroom for between three and four lessons totaling just over two hours. Observers interviewed the teachers as soon after observation as was practical; sometimes this was immediately and sometimes several hours later. In addition, REPP teachers received a survey about their REPP experiencewhich they completed, along with a human subjects consent form, in advance of the observations.
Limitations of Data: These data, while helpful for assessing REPP graduates and the REPP program, should not be viewed as definitive. First, we were not able to observe all the REPP graduates who had been teaching two or more years. For some, logistics prevented us from visiting their schools; a few we could not contact or schedule observation times. Potential observees needed to have completed REPP by spring, 2001, in order to be in at least their second year of teaching in the 2002/03 school year. Of the 62 such REPP graduates, we identified 13 as not teaching in an Alaska classroom, leaving at most 49 to observe. Of these we located 34
19

REPP Evaluation Report Dec 2003
teaching in Alaska and observed 22, or about 65 percent. There may be some self-selection bias in this group; more important, we observed only a short period of each teacher’s practice. Although we did not choose observation times systematically, neither were they random in any sampling sense. Rather, times and durations of observations were a function of the convenience of the teacher and the travel logistics of the observers. Finally, the comparison teachers were also chosen by happenstance rather than randomly. Observers asked at each REPP school for a non-REPP teacher willing to be observed. Again, self-selection bias is likely in the non-REPP sample.
Thus, while our conclusions may be informative, they are not definitive, and should not be extended to all REPP graduates, or, especially, to all non-REPP rural teachers. Although we have tried to be conservative in our assessment of statistical significance, the small sample sizes (22 and 21) mean that our conclusions about differences between the groups should be interpreted as preliminary. Adding a few additional observations could significantly affect the level of statistical significance.
Analysis We recorded observations, interview answers, and assessments on the instruments in hard copy or entered them into Excel and Word files on a laptop computer. REPP graduate surveys were completed on survey forms. All these data were transferred to Access files for analysis.
For qualitative analysis, we grouped the comments justifying the proficient-developing-novice-absent (PDNA) ratings for REPP and non-REPP teachers, and by the rating level within each broad area (Planning, Content, Assessment, and others). We could not look at comments for each sub-category (e.g., “Planning 1: Is lesson well-focused?”) because often a single comment referred to several of the sub-categories.
To assess statistical significance, we created cross-tabulations of REPP and non-REPP teachers by PDNA level for each sub-category. Since almost all the assessments were at the proficient or developing level, we reduced the cross-tabs to 2x2 tables of REPP/non-REPP by proficient/less than proficient. We calculated the chi-squared statistic for these tables and used it to assess statistical significance of the differences. Thus, the null hypothesis was that REPP graduates were no more or less likely than other teachers to be rated as proficient on any given measure.
The chi-squared significance level shown with each table is the probability that the differences observed between the REPP and non-REPP groups might have arisen by chance, if in fact the two groups do not differ in the proportion that are proficient. Thus, a significance level of 0.81 means that there’s an 81 percent chance that the differences in the table reflect only random variation and not any real difference in proficiency between the two groups–that is, they’re likely the same. A chi-squared significance level of 0.002 means that there’s only a 0.2 percent likelihood (2 in 1,000) that the difference observed is just chance—that is, the groups almost certainly differ on that measure.
In this analysis, we rate the differences as not statistically significant if the significance level is higher than 0.10, and we consider levels between 0.05 and 0.10 as only marginally significant.
20
REPP Evaluation Report Dec 2003
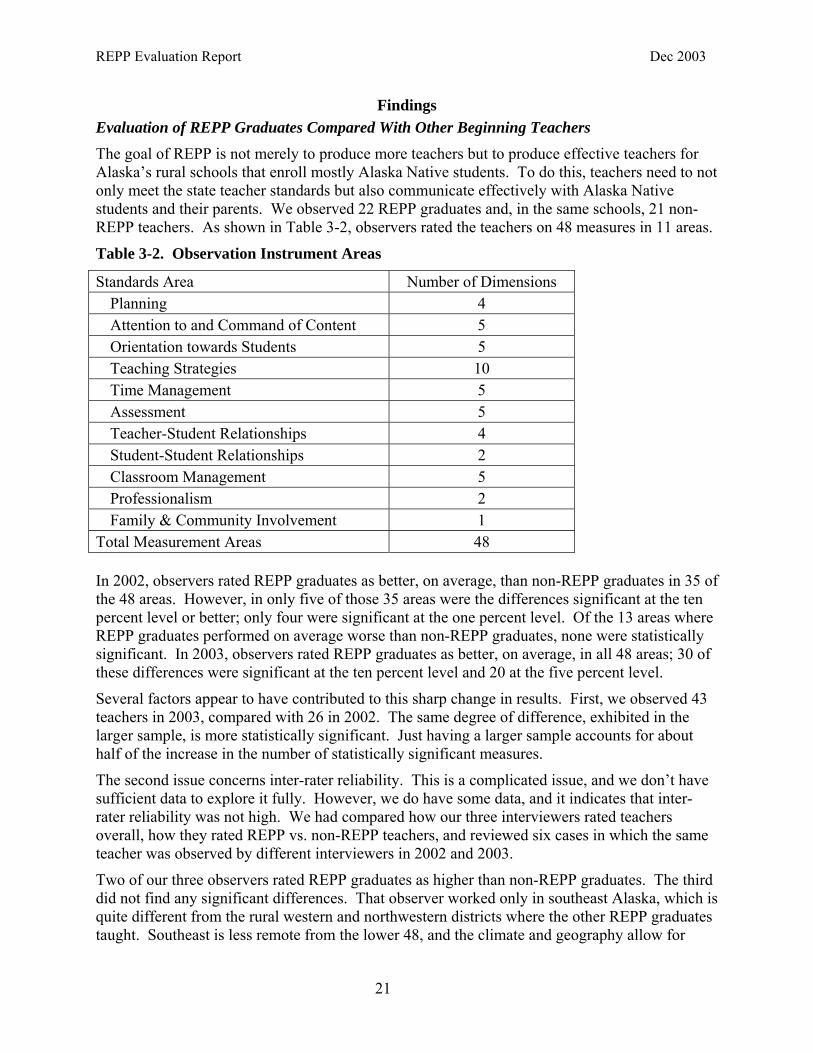
Findings Evaluation of REPP Graduates Compared With Other Beginning Teachers The goal of REPP is not merely to produce more teachers but to produce effective teachers for Alaska’s rural schools that enroll mostly Alaska Native students. To do this, teachers need to not only meet the state teacher standards but also communicate effectively with Alaska Native students and their parents. We observed 22 REPP graduates and, in the same schools, 21 non-REPP teachers. As shown in Table 3-2, observers rated the teachers on 48 measures in 11 areas.
Table 3-2. Observation Instrument Areas
Standards Area Number of Dimensions Planning 4 Attention to and Command of Content 5 Orientation towards Students 5 Teaching Strategies 10 Time Management 5 Assessment 5 Teacher-Student Relationships 4 Student-Student Relationships 2 Classroom Management 5 Professionalism 2 Family & Community Involvement 1
Total Measurement Areas 48 In 2002, observers rated REPP graduates as better, on average, than non-REPP graduates in 35 of the 48 areas. However, in only five of those 35 areas were the differences significant at the ten percent level or better; only four were significant at the one percent level. Of the 13 areas where REPP graduates performed on average worse than non-REPP graduates, none were statistically significant. In 2003, observers rated REPP graduates as better, on average, in all 48 areas; 30 of these differences were significant at the ten percent level and 20 at the five percent level.
Several factors appear to have contributed to this sharp change in results. First, we observed 43 teachers in 2003, compared with 26 in 2002. The same degree of difference, exhibited in the larger sample, is more statistically significant. Just having a larger sample accounts for about half of the increase in the number of statistically significant measures.
The second issue concerns inter-rater reliability. This is a complicated issue, and we don’t have sufficient data to explore it fully. However, we do have some data, and it indicates that inter-rater reliability was not high. We had compared how our three interviewers rated teachers overall, how they rated REPP vs. non-REPP teachers, and reviewed six cases in which the same teacher was observed by different interviewers in 2002 and 2003.
Two of our three observers rated REPP graduates as higher than non-REPP graduates. The third did not find any significant differences. That observer worked only in southeast Alaska, which is quite different from the rural western and northwestern districts where the other REPP graduates taught. Southeast is less remote from the lower 48, and the climate and geography allow for
21

REPP Evaluation Report Dec 2003
better teacher housing, as standard water and sewer engineering work well there. Also, the University of Alaska Southeast hosts another teacher preparation program aimed at preparing Native teachers for rural school districts–the Preparation of Indigenous Teachers for Alaska Schools program. All these factors may mean that more of the non-REPP graduates in Southeast are committed to staying in their communities, and that more were born and raised there, than non-REPP graduates in other rural areas.
When we looked at a summary score calculated for each teacher (percent of measures on which the teacher was judged proficient) by interviewer, we identified another factor that contributed to the 2002–2003 change. One of our interviewers observed only in 2002; another only in 2003. Although both rated REPP graduates higher than non-REPP graduates, the 2003 observer tended to rate more dichotomously than the 2002 observer – this is, high ratings were higher and low ratings, lower (regardless of whether the teacher being rated was REPP or non-REPP). This means that the same level of actual difference would appear to be a greater –and thus more significant – difference in 2003 than in 2002.
We knew when designing the observations that inter-rater reliability could be an issue and attempted to control for this by structuring the observations as pairs. The REPP and non-REPP teacher in each school were observed on the same or adjacent days by the same observer. Even if the observers differed greatly in their assessments of the same teaching level, we could check if there were significant differences in the paired observations. Rather than calculating the observed difference for each of the 48 measures, we summarized each observation as the percent of measures on which the teacher was rated as proficient or above.
Using a paired T-test, we determined whether the average difference in each pair was positive (REPP graduates on average were rated proficient on significantly more measures than non-REPP graduates) neutral (no significant difference) or negative (REPP graduates were judged proficient on significantly fewer measures than non-REPP graduates). In 2002, the difference was positive and significant at the ten percent level; in 2003 it was again positive, this time significant at the one percent level. The higher significance level is what we would expect from the change in interviewers. However, the results in the two years are consistent with each other, which indicates the differences we measured in 2003 may be real. We would need larger numbers of observations to be more certain.
Although these issues should make the reader skeptical of the apparent change from 2002 to 2003, they don’t negate the basic direction of the data. In every way that we could analyze these data, REPP graduates performed as well as, or better than, their non-REPP counterparts. We can be confident from the results that the REPP program is doing at least as good a job as other programs sending teachers to rural Alaska, and it’s likely that REPP graduates are better prepared, as measured against Alaska standards.
However, we caution readers not to infer systematic differences from chance variations. Only where differences are statistically significant (less than 0.1) are there likely to be real differences between the groups. Further, inter-rater reliability issues mean that differences between 2002 and 2003 could reflect changing interviewers rather than changing teachers. Thus, while we point out differences between the two years, we don’t assess them for statistical significance. Even comparing REPP and non-REPP teachers within each year, our sample sizes are small. The combined sample from 2002 and 2003 is only 56 different teachers. These preliminary results are promising, but not definitive.
22

REPP Evaluation Report Dec 2003
Planning
Observers rated sample teachers on four dimensions of planning: (1) lesson focus; (2) assessment; (3) developmental appropriateness; and (4) accommodations for special needs students.
Lesson Focus: Table 3-3 shows that while a majority of both groups of teachers were rated as proficient in lesson focus, the proportion of REPP graduates judged proficient was significantly greater than non-REPP graduates.
Table 3-3. Proficiency Level of REPP and Non-REPP Teachers on Lesson Focus
Planning: Is lesson well focused? Non-REPP REPP Total Freq. % Freq. % Freq. % Non-Proficient 6 29% 1 5% 7 16% Proficient 15 71% 21 95% 36 84% Total 21 100% 22 100% 43 100%
Chi-Squared significance level=0.03
Written comments seemed to bear out the generally positive ratings, although comments on several non-REPP graduates were clearly negative:
Ss who could not keep up [with the project], had been absent or could not understand oral directions had to wait for the teacher or the helper to work with them. Many of them got frustrated and started getting off task while they waited for help.
Two students who wandered around the room were allowed to do so. The T told me that she did not know what to do with them. The T told me that they are best left alone because they become extremely upset and "Want her to try and force them to do what they are supposed to do," which will make them go into a rage.
Teacher was not able to get the lesson going and get the students focused. Ss did not understand the questions the T was asking them from the manual. The T did not restate the manual questions and told the Ss what the manual gave as the correct answers. The teacher had the students read the worksheet directions out loud, but that did not mean that the Ss knew what they were to do. The Ss did not understand the worksheet directions and had to ask the T to explain what was needed to do for each worksheet question.
Of course, because we were limited to observing just one day of classes, we may have caught the teacher or students on an off day. This serves to point up the limitations of observational evaluations of this type where the number of observations, their duration and timing are sharply limited by the resources available. In addition, these quotations from the observers’ comments also illustrate the difficult of parsing teaching into “planning,” “assessment,” “classroom management,” and so on. In reality, these various dimensions are conflated and separating them out is artificial, driven by the need to dissect and evaluate what is, in practice, an integrated activity.
Unlike last year, we cannot say, from the observational data, that one group of teachers or the other was more likely to focus on the Alaska content standards, in part because a number of
23
REPP Evaluation Report Dec 2003
those observed taught classes outside the application of the standards (e.g., Native languages, Spanish, PE, etc.).
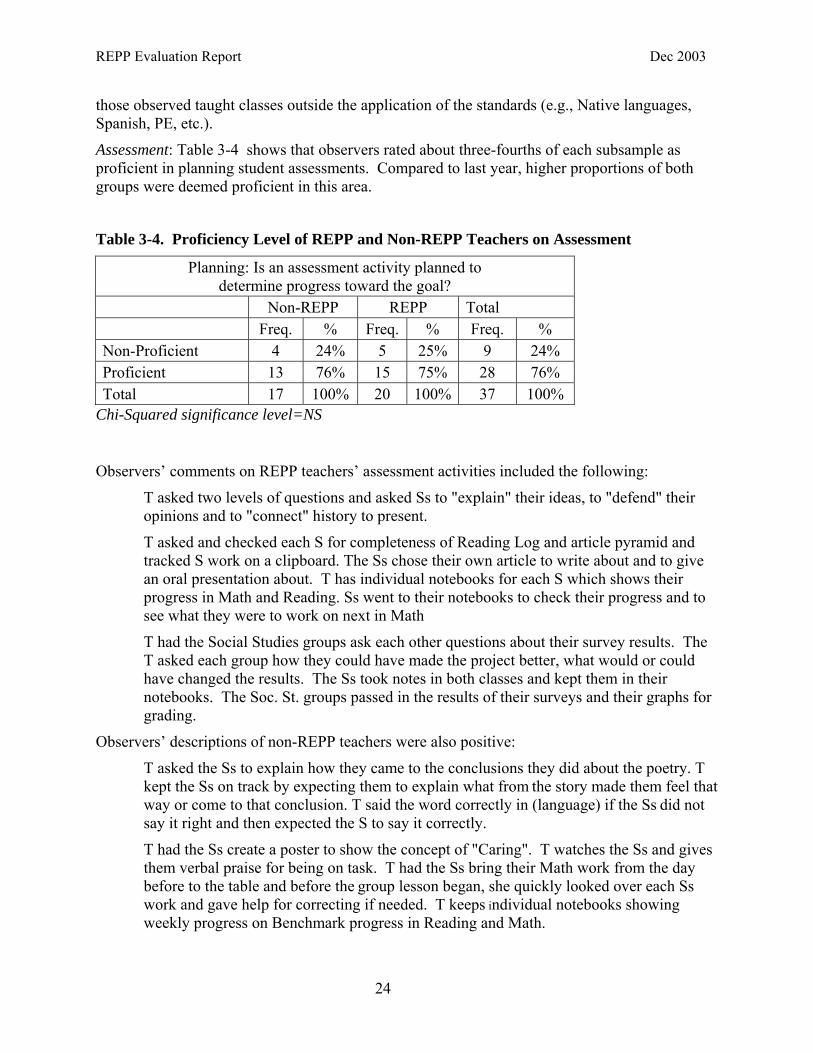
Assessment: Table 3-4 shows that observers rated about three-fourths of each subsample as proficient in planning student assessments. Compared to last year, higher proportions of both groups were deemed proficient in this area.
Table 3-4. Proficiency Level of REPP and Non-REPP Teachers on Assessment
Planning: Is an assessment activity planned to determine progress toward the goal?
Non-REPP REPP Total Freq. % Freq. % Freq. % Non-Proficient 4 24% 5 25% 9 24% Proficient 13 76% 15 75% 28 76% Total 17 100% 20 100% 37 100%
Chi-Squared significance level=NS
Observers’ comments on REPP teachers’ assessment activities included the following:
T asked two levels of questions and asked Ss to "explain" their ideas, to "defend" their opinions and to "connect" history to present.
T asked and checked each S for completeness of Reading Log and article pyramid and tracked S work on a clipboard. The Ss chose their own article to write about and to give an oral presentation about. T has individual notebooks for each S which shows their progress in Math and Reading. Ss went to their notebooks to check their progress and to see what they were to work on next in Math
T had the Social Studies groups ask each other questions about their survey results. The T asked each group how they could have made the project better, what would or could have changed the results. The Ss took notes in both classes and kept them in their notebooks. The Soc. St. groups passed in the results of their surveys and their graphs for grading.
Observers’ descriptions of non-REPP teachers were also positive:
T asked the Ss to explain how they came to the conclusions they did about the poetry. T kept the Ss on track by expecting them to explain what from the story made them feel that way or come to that conclusion. T said the word correctly in (language) if the Ss did not say it right and then expected the S to say it correctly.
T had the Ss create a poster to show the concept of "Caring". T watches the Ss and gives them verbal praise for being on task. T had the Ss bring their Math work from the day before to the table and before the group lesson began, she quickly looked over each Ss work and gave help for correcting if needed. T keeps individual notebooks showing weekly progress on Benchmark progress in Reading and Math.
24

REPP Evaluation Report Dec 2003
For both subsamples, observers reported several less positive examples such as this:
(Non-REPP teacher) The Ss demonstrated understanding on paper only. They did get a chance to use geo blocks, but many wanted some time to just "manipulate the blocks" before being told what to do with them. The T did not give one oral praise but did tell many Ss what they were doing wrong. "Stop messing around with the markers!" "Stop playing with the geo blocks!" The Ss did have individual sticker sheets on the backs of their chairs, but I did not see what they were being used for nor did I see a S get a sticker during these lessons, when the Ss who were listening could have been given a sticker and the rest given a chance to earn one also.
This observation again demonstrates the difficulty of separating assessment from classroom management. Yet, clearly in this case, assessment was limited to conventional paper-and-pencil tests.
Developmental appropriateness: We also looked for evidence that the teachers’ instructional goals and activities were appropriate for the range of student developmental levels in their classrooms. The difference between the subsamples was significant with all but one of the 21 REPP graduates rated as “proficient” compared to 15 of 21 non-REPP graduates ( Table 3-5). In 2002, only about half of each subsample was judged proficient in this area.
Table 3-5. Proficiency Level of REPP and Non-REPP Teachers on Developmental Appropriateness of Planned Goals and Activities
Planning: Are goals appropriate for the range of development levels in the class?
Non-REPP REPP Total Freq. % Freq. % Freq. % Non-Proficient 6 29% 1 5% 7 17% Proficient 15 71% 20 95% 35 83% Total 21 100% 21 100% 42 100%
Chi-Squared significance level = .04
Accommodations for special-needs students: The final dimension of planning concerned arrangements or accommodations for special-needs students. For some forms of disabilities this is difficult to determine because they are not obvious. Thus, our ratings apply only to students with visible disabilities.
Last year’s evaluation revealed this to be an area in which teachers in both subsamples needed additional support. Only a third of the non-REPP teachers and 41 percent of the REPP teachers demonstrated proficiency in this dimension of planning in 2002. More teachers from both groups were rated either developing or novice in this area than in any other area in planning.
As Table 3-6 shows, the situation appears to have improved only marginally in 2003. Only 27% of non-REPP teachers were judged proficient. A greater proportion of REPP graduates (60%) were judged proficient than were non-REPP but the difference was not statistically significant.
Again, the limited duration of our observations means that not all the teachers observed had a chance to demonstrate proficiency in this critical area. Hence, our already small samples were
25

REPP Evaluation Report Dec 2003
reduced further by the number of instances in which the observers determined the target behavior could not be documented.
Table 3-6. Proficiency Level of REPP and Non-REPP Teachers in Planning Accommodations for Special Needs Students
Planning: Are accommodations for students with special needs identified and addressed?
Non-REPP REPP Total Freq. % Freq. % Freq. % Non-Proficient 10 63% 6 40% 16 52% Proficient 6 27% 9 60% 15 48% Total 16 100% 15 100% 31 100%
Chi-Squared significance level = NS
Summary for Planning: The two subsamples differed on two of the four dimensions of planning. Significantly more REPP graduates were judged proficient in lesson focus and developmentally appropriate lessons than were non-REPP graduates. On the latter, all but one of the REPP graduates was judged proficient. Majorities of both subsamples were judged proficient in planning appropriate assessments. But on planning to accommodate special needs students, less than a third of non-REPP teachers were rated proficient. Showing improvement from last year’s results, 60% of the REPP teachers were deemed proficient in planning for special needs students.
26

REPP Evaluation Report Dec 2003
Content
We also rated teachers on their attention to and command of the content they taught. Specifically, we rated them in the following areas: (1) attention to Alaska content standards; (2) clear identification of concept, idea, procedure being taught; (3) importance of the content being taught; (4) focus on deep understanding of content; (5) attempt to connect content to students’ experience.
Attention to Alaska content standards: Alaska’s content standards are linked to the state Benchmark tests and to the High School Graduation Qualifying Exam (HSGQE). For this and other reasons, the standards need to be the addressed directly if students are to have the opportunities to learn required to succeed on these high-stakes exams. Last year, we found that 47 percent of the non-REPP teachers and 59 percent of the REPP teachers had achieved proficiency in this vital area. In 2003, however, only 2 of the entire sample of 40 teachers were judged non-proficient in this vital area compared to roughly half last year. All 22 of the REPP graduates were judged proficient while 16 of the 18 non-REPP graduates were deemed proficient.
Table 3-7. Proficiency Level of REPP and Non-REPP Teachers in Attention to Alaska Content Standards
Content: Are the Alaska standards that the lesson will address evident? Non-REPP REPP Total Freq. % Freq. % Freq. % Non-Proficient 2 11% 0 0% 2 5% Proficient 16 89% 22 100% 38 95% Total 18 100% 22 100% 40 100%
Chi-Squared significance level = NS
Clear identification of concept, idea, and procedure being taught: Research suggests that making students aware of the concept, idea, and procedure being taught assists their learning. We wanted to know whether the teachers we observed clearly identified the content they expected their students to master. As Table 3-8 shows, although a slightly larger proportion of REPP teachers (95 percent) than non-REPP teachers (81 percent) were rated proficient in this area, the difference is insignificant. The overwhelming majority in each subsample demonstrated their capacity to make the learning goals clear to students.
Table 3-8. Identification of Learning Goals
Content: Are the concepts, ideas, or procedures to be learned clearly identified? Non-REPP REPP Total Freq. % Freq. % Freq. % Non-Proficient 4 19% 1 5% 2 5% Proficient 17 81% 21 95% 38 95% Total 21 100% 22 100% 40 100%
Chi-Squared significance level = NS
27

REPP Evaluation Report Dec 2003
This is an area in which 2003 REPP teachers demonstrated an unmistakable improvement over the 2002 data. In 2002, less than one-third of REPP graduates were judged proficient in this area.
These are examples of observers’ comments on REPP teachers:
The T gave lesson goals and objectives before the activity began. The Ss were allowed to create their own poetry using (language) vocabulary. The poems had to be written about themselves…
The T announced the goal of each different activity before she began….
The lesson objective was given at the start of each lesson…
The goals were very clear for each lesson and discussed at the start of each lesson….
The T showed the Ss how they need to know about history so they will not repeat it and how the ideas and situations from the past can be connected to present day happenings….
Observers made similar comments on most of the non-REPP teachers as well:
The T had the goals on the board and the T told the Ss the expected behavior and actions for the written and oral presentations…
The T worked with each math group on the groups lessons aligned with the state Benchmarks in math. Each S had a notebook in which this alignment was mapped out and a weekly reporting section that is copied and sent home to the parents….
Not all the teachers observed made clear to students what the learning goals and objective were, however:
(Non-REPP teacher) I was able to determine the goal of the lesson and the standard addressed, but the T did not let the Ss know what the goal of the lesson was nor did the T connect any of the concepts to their backgrounds.
Importance of the content being taught: In addition to being explicit about the ideas, concepts and procedures being taught, teachers also need to focus on the most important content in each area. This seems obvious but depends on teachers knowing enough about the subjects they teach to identify the most important content.
Again, a higher proportion of REPP (95%) than non-REPP teachers (76%) demonstrated proficiency in this area (Table 3-9). The difference is only marginally statistically significant. The proportion of teachers judged proficient in this area is greater for both subsamples than in 2002 when 67% of non-REPP and 76% of REPP teachers were rated as proficient.
28

REPP Evaluation Report Dec 2003
Table 3-9. Proficiency Level of REPP and Non-REPP Teachers in Teaching Important Content
Content: Are the concepts, ideas, or procedures to be learned clearly important?
Non-REPP REPP Total Freq. % Freq. % Freq. % Non-Proficient 5 24 1 5% 6 14% Proficient 16 76% 21 95% 37 86% Total 21 100% 22 100% 43 100%
Chi-Squared significance level = 0.07
Focus on deep understanding of content: A great deal of attention has been paid over the past couple of decades to students’ opportunities to develop deep understandings of the content they encounter in schools. Thus we attempted to measure teachers’ efforts to help their students develop such deep understanding, by looking for examples where students were working on analysis, evaluation, and synthesis of content (the upper end of Bloom’s taxonomy).
In the 2002 evaluation, neither group rated particularly well on this dimension of teaching content. Only 33 percent of non-REPP and 47 percent of REPP teachers were rated as proficient—a non-significant difference.
In 2003, the proportion rated proficient increased for both subsamples (Table 3-10). Observers rated 43 percent of non-REPP teachers and 77 percent of REPP teachers as proficient in this area. In this case, the difference between the samples was significant (.02 level).
Table 3-10. Proficiency Level of REPP and Non-REPP Teachers in Teaching for Deep Understanding
Content: Is the lesson aimed at deep understanding or clearly a foundation for such understanding?
Non-REPP REPP Total Freq. % Freq. % Freq. % Non-Proficient 12 57% 5 23% 17 40% Proficient 9 43% 17 77% 26 60% Total 21 100% 22 100% 43 100%
Chi-Squared significance level = .02
Example of observer comments on REPP graduates include:
.. The Ss were asked to explain as well as show their math problems. T asked Ss "Who can tell me how you got your answer; what steps did you do and why?"….
The Social Studies class is dealing with the constitution and the T has chosen court cases that involve the schools or present day issues for the Ss to do surveys and reports on….
Observers made similar comments on non-REPP teachers:
The Ss not only discussed verb forms, but also translated verbs and other words in poetry into (language) and then were able to discuss the meanings of the words. The Ss had been
29
REPP Evaluation Report Dec 2003
asked in past lessons to illustrate the poetry and defend the illustration with words or phrases from the poem.
Not all observations of teachers’ attempts to teach for deep understanding were positive:
(Non-REPP teacher) The T read the comprehension questions from and manual and used reading series prepared worksheets. The T acted like she was oblivious of the Ss she was teaching the lesson to, including their needs and how to adjust the lesson to their understanding. Although this lesson was to check and build comprehension from a story, the T used material that the Ss could not understand. The S did not gain any better understanding of the story after the lesson, nor did they have a chance to talk about the story in their own words. If their answer was not exactly what the manual said, then the T read the answer from the manual to the group.
Connection with students’ cultural background: A difficulty many rural students face is seeing the connection between their lives and community and the world presented in the standard school curriculum that tends to be dominated by materials produced for California, Texas, New York, and Florida. The question that often puzzles students everywhere on encountering the school curriculum—“What’s this got to do with me?”—is an even greater puzzle for students in rural Alaska, many of whom are Alaska Natives.
Thus, the burden on rural Alaska teachers to help students understand how the content applies to them is even greater than for many urban and suburban teachers. They must be able to help their students understand the connection between their own experiences and the often apparently arcane knowledge in the school curriculum. In fact, this capacity is at the heart of the REPP mission.
In this area, the 2002 evaluation revealed that REPP graduates were clearly better prepared than their non-REPP colleagues. Whereas a majority (59 percent) of REPP graduates were judged proficient in this area, only 7 percent of non-REPP graduates were deemed proficient.
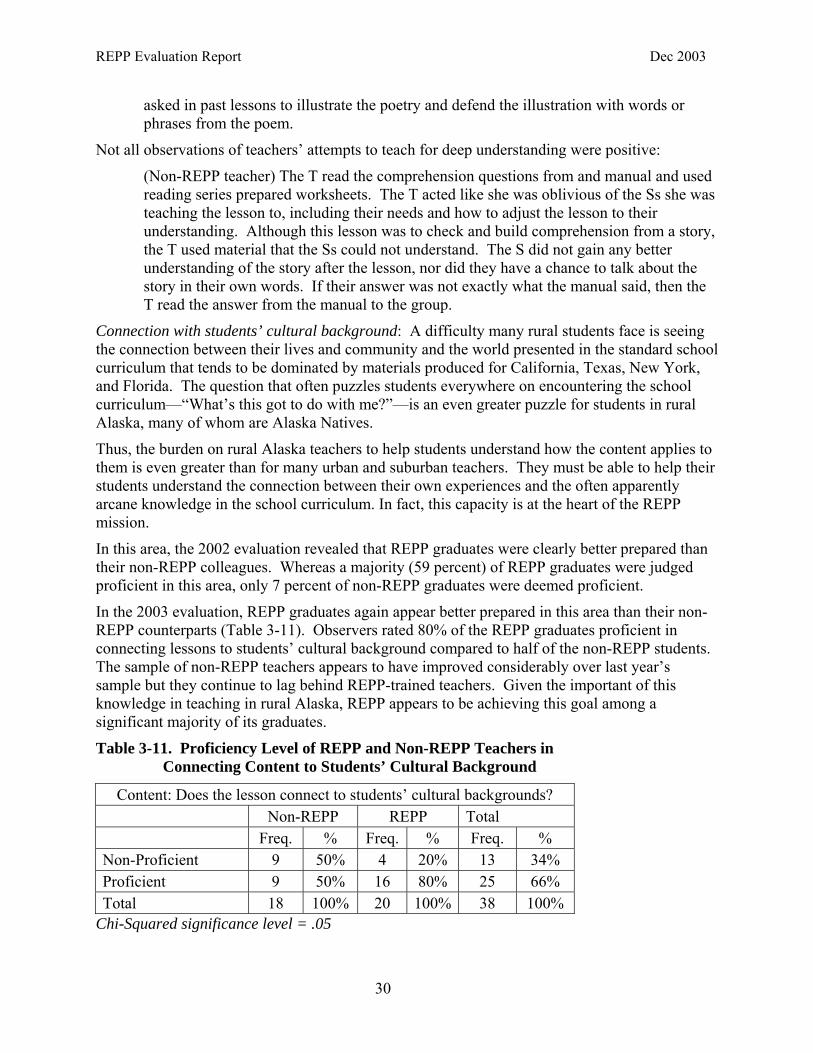
In the 2003 evaluation, REPP graduates again appear better prepared in this area than their non-REPP counterparts (Table 3-11). Observers rated 80% of the REPP graduates proficient in connecting lessons to students’ cultural background compared to half of the non-REPP students. The sample of non-REPP teachers appears to have improved considerably over last year’s sample but they continue to lag behind REPP-trained teachers. Given the important of this knowledge in teaching in rural Alaska, REPP appears to be achieving this goal among a significant majority of its graduates.
Table 3-11. Proficiency Level of REPP and Non-REPP Teachers in Connecting Content to Students’ Cultural Background
Content: Does the lesson connect to students’ cultural backgrounds? Non-REPP REPP Total Freq. % Freq. % Freq. % Non-Proficient 9 50% 4 20% 13 34% Proficient 9 50% 16 80% 25 66% Total 18 100% 20 100% 38 100%
Chi-Squared significance level = .05
30

REPP Evaluation Report Dec 2003
Comments on REPP teachers included:
T used a local grocery store add to show the usefulness, and local usage of this math skill as part of the lesson and as a basis for a two group game….
The Ss were asked questions during their reading discussion that connected to their lives and similar problems in their community….
The T brought the idea of air pollution from a world problem to a village problem and discussed the causes of the air pollution….
Teacher ties in cultural aspect in social studies with Tlingit [culture]…
Observers also noted similar efforts to link to local culture and issues in the classrooms of non-REPP teachers
During the Social Studies lesson, T made references to local geographic areas like those on the worksheet that are part of European countries. T asked Ss for native words used to describe these formations.
The T spoke to the Ss about the need to do the best [at traditional dance] they could because of the celebration at which that they would be performing. The Ss followed along with the T movements and when she stopped the movements and watched them, they continued showing knowledge of the dance movements without the T showing them.
But, apparently, not all the teachers made such connections. The following is an observation from a non-REPP teacher:
The reading trade books are ones the reading partners choose together and when finished they will write a summary about the story. The T told me that the books are at the Ss independent reading levels. The T asked only one or two Level-One questions of each partnered group and then moved on. The T missed the opportunity to relate the basic concepts/ideas of the story to the Ss world/cultural background.
Summary of Content Proficiency: Compared to observations last year, the REPP teachers appear to be better prepared in all dimensions of content. In addition, on two of the most critical dimensions – teaching for deep understanding and connecting the content to students’ cultural backgrounds – REPP-prepared teachers were significantly more likely to be proficient than their non-REPP counterparts. In the area of addressing Alaska academic standards, all the REPP teachers in the sample were judged “proficient” and all but one was rated “proficient” in identifying concepts and focusing on important concepts, ideas, and procedures. Although observers judged a smaller proportion of non-REPP teachers proficient in these areas, relatively few were rated not proficient.
31

REPP Evaluation Report Dec 2003
Orientation Toward Students
As important as teachers’ command of the content they teach is their orientation to students. We rated our sample of teachers on the following dimensions of orientation to students: (1) expectations for student learning; (2) connection of lessons to students’ interest, experiences, and needs; (3) opportunities for students to create their own meaning; (4) appropriate classroom management techniques; and (5) student engagement.
Expectations for student learning: The importance of teachers’ expectations for students has been well documented in the research literature since Rosenthal’s breakthrough study in the 1960s (Rosenthal, R. and Jacobsen, L., 1968). Such expectations are particularly critical for students in high-need schools, where teachers appear more likely to hold low expectations than teachers in more affluent communities (Reyhner, J., 1992).
Last year, a significantly larger proportion of REPP graduates demonstrated high expectations for students than did non-REPP teachers. This was also true in 2003 (Table 3-12): All but 1 of 22 REPP graduates demonstrated proficiency compared to 62% of non-REPP teachers
Table 3-12. Proficiency Level of REPP and Non-REPP Teachers in Demonstrating High Expectations for All Students
Orientation: Teacher demonstrates high expectations for all students? Non-REPP REPP Total Freq. % Freq. % Freq. % Non-Proficient 8 38% 1 5% 9 21% Proficient 13 62% 21 95% 34 79% Total 21 100% 21 100% 43 100%
Chi-Squared significance level = .007
Typical of observers’ comments on REPP graduates were the following:
T expected all Ss to take part in the discussions. The T called on those who did not volunteer ideas or opinions. The T showed the Ss that he valued their ideas and that ideas that could be defended were all valuable to the discussion. T asked two levels of questions that lead Ss to relate past opinions, feelings and ideas to the present.
Classroom expectations are high and clearly stated. Ss were given time to express themselves in Tlingit writing and drawing class. T is firm but fair. Ss were engaged had lots of resources and aides to help (very busy place).
The T had classroom rules and consequences posted on the wall. T told the Ss what behaviors were expected at the start of both lessons. 2nd grade Ss chose a book of their interest that they could read out loud to the 3rd graders. The 2nd graders were able to ask their own questions about the story. The 3rd graders were good listeners and liked listening to another S read a story to them and ask them questions.
Observers made similar comments on the expectations they saw in non-REPP classrooms:
T expected and all Ss participated. Ss were allowed to explain the ideas in their own words. T spoke to group and individual Ss telling them what behavior she expected. T turned the coverage/review of this chapter over to the class as individual S presentations.
32

REPP Evaluation Report Dec 2003
Ss maintain good classroom environment. Ss are all engaged in writing assignment. Ss are revising, editing, and working with peers to upgrade their works. Ss and T show positive respect toward each other, very evident.
Several observations reveal, again, how issues of expectations are intertwined with classroom management, planning, and content knowledge:
(Non-REPP teacher) Ss did not show comprehension of the story that they had read the day before. The Ss were not allowed to discuss the story in their own words. T made no attempt to connect the story to the Ss lives. The Ss were not able to answer many of the teacher's questions and since the T was not looking at them, but at the manual, the Ss stopped looking at her. T read the answers from the manual to the Ss instead of restating the question for understanding. When the Ss were assigned the worksheet, the T was swamped with Ss asking what they were to do for each question. The T spoke to each S separately which took up the rest of the lesson time.
REPP graduates were not immune to these types of problems as the following description reveals:
T did not make any comments to Ss that did not show the correct card. T told the class what the correct Math sign was and put the sign in its correct place between the numbers on the board. When Ss finished their math sign worksheet they brought it up to her to have her check it. They had to wait in line by her desk, hand her the paper, go back to their seat, work on their Math packet and wait for her to tell them if they had an error. If Ss had an error, she shouted out their name, they came to T desk and T told the S the problem that was incorrect. She offered no comments or help to the S who returned to their seat
Connection of lessons to students’ interest, experiences, and needs: This is similar to teachers’ ability to “connect to students’ cultural background,” discussed earlier. The focus here is on students’ individual interests, which may or may not reflect the culture from which they come.
As with the high expectations dimension, REPP graduates appear to perform better than their non-REPP counterparts (Table 3-13). Observers rated 95 percent of REPP teachers as proficient while 57 percent of non-REPP teachers received a comparable rating. In 2002, only 47 percent of REPP teacher had been rated proficient – a proportion that was not significantly different from that of non-REPP teachers.
Table 3-13. Proficiency Level of REPP and Non-REPP Teachers in Connecting with Individual Student Interests, Experiences, and Needs
Orientation: Lesson connects to student interests, experiences, needs? Non-REPP REPP Total Freq. % Freq. % Freq. % Non-Proficient 9 43% 1 5% 10 23% Proficient 12 57% 21 95% 33 77% Total 21 100% 21 100% 43 100%
Chi-Squared significance level = .003
33
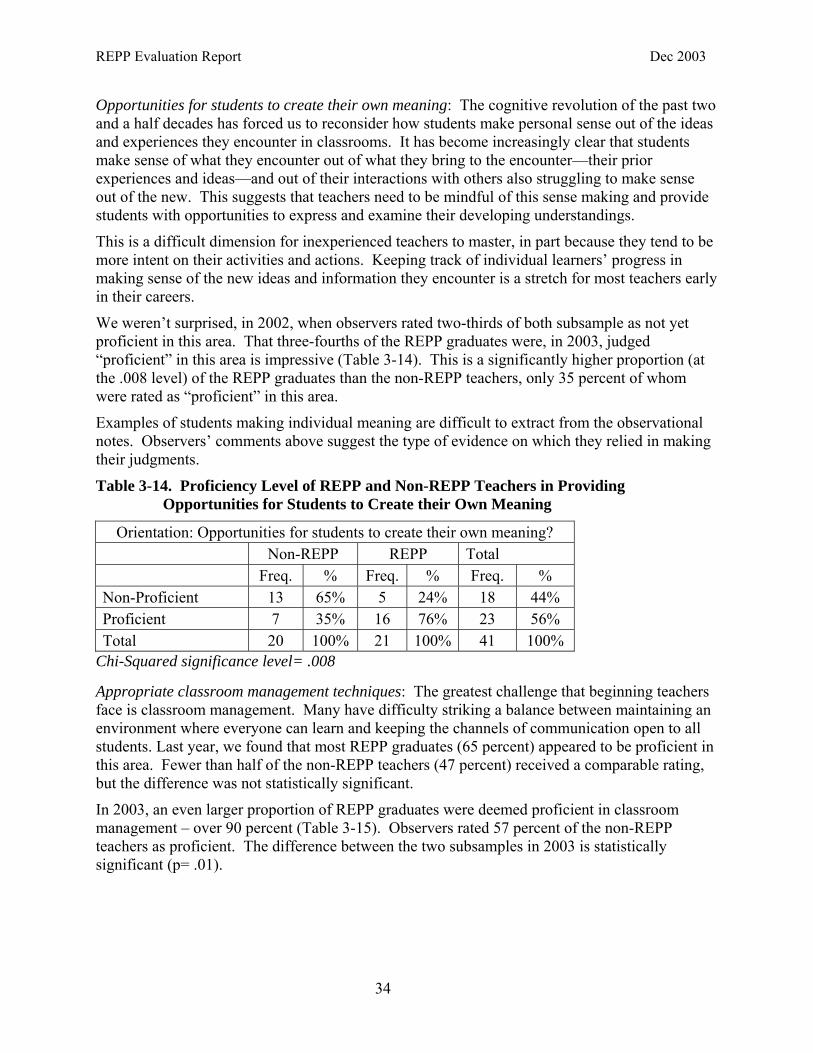
REPP Evaluation Report Dec 2003
Opportunities for students to create their own meaning: The cognitive revolution of the past two and a half decades has forced us to reconsider how students make personal sense out of the ideas and experiences they encounter in classrooms. It has become increasingly clear that students make sense of what they encounter out of what they bring to the encounter—their prior experiences and ideas—and out of their interactions with others also struggling to make sense out of the new. This suggests that teachers need to be mindful of this sense making and provide students with opportunities to express and examine their developing understandings.
This is a difficult dimension for inexperienced teachers to master, in part because they tend to be more intent on their activities and actions. Keeping track of individual learners’ progress in making sense of the new ideas and information they encounter is a stretch for most teachers early in their careers.
We weren’t surprised, in 2002, when observers rated two-thirds of both subsample as not yet proficient in this area. That three-fourths of the REPP graduates were, in 2003, judged “proficient” in this area is impressive (Table 3-14). This is a significantly higher proportion (at the .008 level) of the REPP graduates than the non-REPP teachers, only 35 percent of whom were rated as “proficient” in this area.
Examples of students making individual meaning are difficult to extract from the observational notes. Observers’ comments above suggest the type of evidence on which they relied in making their judgments.
Table 3-14. Proficiency Level of REPP and Non-REPP Teachers in Providing Opportunities for Students to Create their Own Meaning
Orientation: Opportunities for students to create their own meaning? Non-REPP REPP Total Freq. % Freq. % Freq. % Non-Proficient 13 65% 5 24% 18 44% Proficient 7 35% 16 76% 23 56% Total 20 100% 21 100% 41 100%
Chi-Squared significance level= .008
Appropriate classroom management techniques: The greatest challenge that beginning teachers face is classroom management. Many have difficulty striking a balance between maintaining an environment where everyone can learn and keeping the channels of communication open to all students. Last year, we found that most REPP graduates (65 percent) appeared to be proficient in this area. Fewer than half of the non-REPP teachers (47 percent) received a comparable rating, but the difference was not statistically significant.
In 2003, an even larger proportion of REPP graduates were deemed proficient in classroom management – over 90 percent (Table 3-15). Observers rated 57 percent of the non-REPP teachers as proficient. The difference between the two subsamples in 2003 is statistically significant (p= .01).
34

REPP Evaluation Report Dec 2003
Table 3-15. Proficiency Level of REPP and Non-REPP Teachers in Appropriate Classroom Management Techniques
Orientation: Are classroom management techniques appropriate for students & context?
Non-REPP REPP Total Freq. % Freq. % Freq. % Non-Proficient 9 43% 2 9% 11 26% Proficient 12 57% 20 91% 32 74% Total 21 100% 22 100% 43 100%
Chi-Squared significance level= .01
Observers noted numerous instances of REPP teachers successfully managing students’ classroom behavior, including the following:
T has classroom rules posted. T moves in on Ss who are not doing as requested or needed. T tells the S or Ss what she expects them to do and monitors their actions to make sure they understand and are in compliance. T asked a S who was disruptive to step out of the classroom, thus defusing the behavior. S returned after a few minutes and was back in compliance of activity behavior needs. T moves around the classroom during the lessons and visits each seating group while they are working on individual or group activities…
The T used a jar and marbles to reward good behavior. T spoke about the behavior she saw that was appropriate when trying to get a student back on task. She then spoke to the S if needed, telling the S what she wanted the S to do, not telling the S what they were doing wrong. T used a variety of inflection in her voice and kept the Ss attention when speaking by moving around the room when speaking. The classroom is set up so that the T, even when working with a reading group at a front table, the T can see what the rest of the class is doing and the group has their back to the other students….
T has "Classroom Rules" along with "Consequences" posted above the side chalkboard. T moved around the room and helped students who were needing help and spoke to those who were off task. The T told the off-task Ss what they were supposed to be doing, and then monitored them to make sure they got back on track. T has space between the desks, which allows his Ss to have their own space. T never was at her desk, and was constantly moving among and with the students. T had a smile on her face and seemed to enjoy interacting with the Ss during the lessons. T he Ss showed that they felt free to express themselves with worry of T or other Ss making fun of their ideas or answers….
T set expectations and used a very soft voice when dealing with those who were choosing not to follow the directions. T showed the Ss that they were making the incorrect choices and what the next consequence they would be choosing if they continued to not listen or continue their behavior. T used a marble in a can to show full classroom positive behavior….
The T did not have to discipline any of the Ss. He did ask one S to get back on task. T moved around the room, checked on S progress and talked to the Ss in (language) about their work. Tables have 4 Ss in a line facing the front of the room, which means they
35

REPP Evaluation Report Dec 2003
only have a S on each side of them to bother. Ss were all on task and worked from one activity to the other with ease….
T works to make sure each S feels important by visiting them and checking their progress. T makes the Ss feel that she does not want them to fail, but to do their best. T uses humor and hugs the Ss to show them how proud she is of them. T uses a clapping activity when the whole class needs to be listening and the noise level is too high. Ss respond by taking part in the clapping and then stop the talking to listen to what the T has to say. T told a S who could not work with a group of S, what she expected him to do. When S still did not get to the task, T gave him a warning and told him the consequence, (to go back to his seat at the table). S then started cooperating with his group and writing in his journal.
We quoted from the observations at length because these REPP graduates seem to have mastered classroom management to an unusual degree. We could have included numerous other examples.
Observations from non-REPP classrooms also revealed inexperienced teachers who seemed adapt at managing their classrooms:
T has "Classroom Expectations" posted on a wall chart in the front of the classroom. T has a "How Am I Doing Today?" chart in the front of the room with colored cards that in a pocket with each Ss name on it. S behavior contracts are posted by the chart. T spoke in a calm voice to each S as she did the Reading Assessment and gave verbal praise as each finished.
T uses words, "I am looking for the group that is ready." T used "3 Strikes and You Are Out" management when doing music 3 Strikes means you have to give up the recorder and return to your seat. T has classroom rules and consequences posted at the front of the room. T had a very calm voice, but the T also made the Ss follow the rules set for the activity.
Not surprisingly, observers noted examples of teachers from both subsamples whose management techniques were less than proficient:
(REPP) T started the Math class by asking the Ss "What's for lunch?" and then had a hard time getting them settled down to begin the Math lesson. T did not acknowledge whether the Ss were showing the correct Math sign. T wrote the correct sign on the board so after two problems, some of the Ss did not bother to change their flash card if they were in error and the T did not seem to notice. T told me that one very disruptive student was not at school and could not come back until they had a Parent wit with them. The disruptive S was seated by the only girl, a very shy S, in the classroom.
(Non-REPP) T asked S to join her, but had no strategies to get them up front and focused other than speaking to each one individually or small groups and repeating the directions. T had a very monotone voice and did not move from the front stool. One of the Ss that kept wandering around the room went out into the commons area, T acted like she did not see him, did not go after him, nor asked him where he had been when he returned 5 min. later. T stayed seated at the front C shaped Table 3-while S worked on their rhyming and math worksheets. She did not speak to those Ss off task.
36

REPP Evaluation Report Dec 2003
The T knew how she wanted the Ss to act, but did not seem to know what exactly to do when they did not do it. The T had classroom rules posted but not consequences. The T had colored cards by each Ss name. These colored cards could be changed to show behavior. The T told one Ss that she would change the card color if he did not start listening. He listened for a few seconds then began playing with the geo blocks again, but she did nothing. The lessons were not paced fast enough, as most all of the Ss that were on task completed the lesson while the T had to help those Ss that had decided to do other things and/or not listen to the directions. While she was getting these Ss to do as told, the Ss who had finished with the lesson began to act up.
Student engagement: A key to both student learning and to a classroom conducive to learning for all is student engagement. This is of course a complex phenomenon and demands much knowledge and many skills from teachers, including knowing the students and what will engage them, as a group and individually, as well as knowing what in the subject matter is engaging and germane.
In 2002, observers rated a majority of both groups of teachers proficient in this vital area and the small differences in the two groups were insignificant. This year, observers rated a significantly higher proportion of REPP graduates as proficient in this area. From 63 percent proficient in 2002, the proportion of REPP teachers judged proficient rose to 91 percent (Table 3-16). The proportion of non-REPP teachers deemed proficient rose as well – from 53 to 67 percent. But the difference between REPP and non-REPP teachers in 2003, unlike last year, was statistically significant (at the .05 level).
Table 3-16. Proficiency Level of REPP and Non-REPP Teachers in Engaging Students in Learning
Orientation: Does teaching engage students? Non-REPP REPP Total Freq. % Freq. % Freq. % Non-Proficient 7 33% 2 9% 9 21% Proficient 14 67% 20 91% 34 79% Total 21 100% 22 100% 43 100%
Chi-Squared significance level= .05
Separating out comments on student engagement from general comments on classroom management is a challenge. Here are a few observations from REPP teachers’ classrooms:
Well-structured and good classroom learning environment. Ss were engaged and on task during the lesson. Ss enjoyed creating their own product using the materials that were given to them….
Classroom expectations are high and clearly stated. Ss were given time to express themselves in Tlingit writing and drawing class. T is firm but fair. Ss were engaged had lots of resources and aides to help (very busy place)….
Ss were very involved in the lessons. They were able to use their own words in the journal/paragraph writing. All Ss were on task and T told the Ss what she expected them to do and the expected behavior for each lesson….
37

REPP Evaluation Report Dec 2003
Ss practiced the Math skill in a variety of ways including the use of a local grocery store add. Ss were able to be part of the learning as they told the T how to do an example she had put on the board. They told her verbally what each step was and she did it. This was a whole class activity with Ss being able to speak out and tell T what to do for each step of the math…
Summary of Orientation to Students: In contrast to last year, we found significant differences between REPP and non-REPP teachers on every dimension of orientation to students. In every case, a significantly greater proportion of REPP graduates were found to have achieved the proficient level. In fact, on five of the six dimensions – connecting to student cultural background, demonstrating high expectations, connecting to student interests, classroom management, and engaging students – over 90 percent of the REPP graduates demonstrated proficient. This is a remarkable achievement for teachers in the first two years of their career. On most measures, more non-REPP teachers were also rated proficient than in 2002, although the differences weren’t consistently significant
Creating opportunities for students to create their own meaning remains a difficult area to master for both groups but especially for the non-REPP teachers.
38

REPP Evaluation Report Dec 2003
Teaching Strategies
We were also interested in the repertoire of teaching strategies that teachers in our samples demonstrated. We focused on 10 dimensions of teaching strategies: (1) variety; (2) student grouping; (3) attention to learning preferences; (4) opportunities for students to explain and show; (5) high-level tasks; (6) appropriate materials; (7) technology; (8) communication of goals; (9) communication of directions or instructions; and (10) communication of standards for student behavior.
Variety of teaching strategies: Because of the difference in how students learn, teachers need to know a range of approaches to teaching. Although majorities of both samples demonstrated proficiency in using a variety of teaching strategies, more of the REPP (86 percent) than non-REPP teachers (66%) were deemed proficient (Table 3-17). The difference falls just short of statistical significance (p = 0.12).
In 2002, observers judged smaller proportions of both samples proficient on this dimension. Only 27 percent of non-REPP teachers and 47% of REPP graduates were rated proficient The difference between the 2002 and 2003 samples of REPP graduates is dramatic – roughly double the number of teachers were rated proficient.
Table 3-17. Proficiency Level of REPP and Non-REPP Teachers in Using a Variety of Teaching Strategies
Strategies: Teacher uses a variety of strategies? Non-REPP REPP Total Freq. % Freq. % Freq. % Non-Proficient 7 33% 3 14% 10 23% Proficient 14 66% 19 86% 33 67% Total 21 100% 22 100% 43 100%
Chi-Squared significance level=NS
On the flexibility of student grouping, in 2002, few teachers (23 percent) from either group were rated as proficient, although a number of the teachers taught in classrooms where this concept may not have been applicable. This was probably due to the small size or multi-grade composition of their classrooms.
In 2003, again, less than a majority of either subsample demonstrated proficiency in flexible grouping of students (Table 3-18), although the proportions of both subsamples were higher than in 2002. Thirty-nine percent of non-REPP and 43 percent of REPP teachers demonstrated proficiency, a difference that was not statistically significant.
39

REPP Evaluation Report Dec 2003
Table 3-18. Proficiency Level of REPP and Non-REPP Teachers in Using a Flexible Group Membership
Strategies: Does group membership appear flexible? Non-REPP REPP Total Freq. % Freq. % Freq. % Non-Proficient 11 61% 10 53% 21 57% Proficient 7 39% 9 47% 16 43% Total 18 100% 19 100% 37 100%
Chi-Squared significance level = NS
Teaching strategies that covered a range of learning preferences Observers also attempted to sample teachers’ efforts to address the range of learning preferences that are present in classrooms. In 2002, just over a third of both samples demonstrated proficiency in this area.
In 2003, larger proportions of both subsamples were rated as proficient (Table 3-19). Observers rated as proficient 57 percent of the non-REPP and 81 percent of the REPP teachers. Unlike last year, a significantly higher proportion (at the 0.10 level) of REPP than non-REPP teachers was judged proficient.
Table 3-19. Proficiency Level of REPP and Non-REPP Teachers in Using Teaching Strategies to Fit a Range of Learning Preferences
Strategies: Teaching strategies fit a range of learning preferences? Non-REPP REPP Total Freq. % Freq. % Freq. % Non-Proficient 9 43% 4 19% 13 31% Proficient 12 57% 17 81% 29 69% Total 21 100% 21 100% 42 100%
Chi-Squared significance level = 0.10
Examples of observers’ comments–which also speak to variety of strategies–on REPP teachers included:
T used auditory, visual, kinesthetic approaches to teach the forms of the Cup'ik words. Ss used vowel patterns of the base words to decide on how to spell the forms of the base words….
T has the Ss who like going "beyond" the curriculum and the T has the Social Studies students working on projects that require their cooperation, and technical skills to create graphs and charts. The Math, geometry, students use the computer to take tests on line and to stay in contact with their correspondence teacher. The T had Ss make group presentations of their surveys and debate their results with the other group….
T had the Ss writing numbers in order, saying numbers in order and looking at daily uses of them when telling time and using the calendar. T makes sure the lessons included a chance for Ss to show, tell and explain the lesson goals….
40

REPP Evaluation Report Dec 2003
T told the Ss what the goals of the lesson were and what the expected behaviors were. T used an overhead and video plus expecting Ss to take notes and take part in group discussions….
T used all modes of teaching the (language) language. The T used visuals, oral, aural and kinesthetic activities. The Ss were expected to speak, write and explain themselves in (language). The Ss liked the slide show made by the T while he was in Cuba. The Ss asked the T questions in (language) about what they saw and about his trip. The T gave directions in (language)…
Not all comments on strategies were positive. The following is a description of a non-REPP beginning teacher:
The T is a 1st year teacher and perhaps is unaware that most of the Ss learning style is visual. The T gave oral directions without showing anything, T tried to help those who were confused on what to do by talking to them again instead of showing them. The volunteer, an elderly woman from the village who was to teach the Ss how to use the sewing machine, was showing them how to get thread on the bobbin, how to thread the machine and how to use the foot peddle. She used very few words and the Ss watched. The T could have asked other Ss who were caught up to help those who needed help. They could have worked in teams or groups to help each other and then all move to the next step together. This approach could also have stopped the off task behavior.
As this observation (of a non-REPP teacher) demonstrates, merely using a variety of strategies may be insufficient to reach all students:
T used a variety of strategies but students did not do much of the discussion or have very much of the time to talk about items they were aware of in the rhyming activity. The T reached the visual and kinesthetic learners, but the auditory learners needed to speak the words not just hear them from the T.
Created opportunities for students to explain or show their work: Last year, only roughly half of each subsample demonstrated proficiency in this area. The small difference between the two was not significant and half the teachers were still at the developing level.
This year, however, all but 2 of the 22 REPP teachers (91 percent) demonstrated proficiency while a majority (63 percent) of non-REPP teachers did so (Table 3-20). The difference was statistically significant at the 0.03 level.
Table 3-20. Proficiency Level of REPP and Non-REPP Teachers in Providing Opportunities for Students to Explain and Show their Work
Strategies: Opportunities for students to explain and show? Non-REPP REPP Total Freq. % Freq. % Freq. % Non-Proficient 7 37% 2 9% 9 22% Proficient 12 63% 20 91% 32 78% Total 19 100% 22 100% 41 100%
Chi-Squared significance level=0.03
41

REPP Evaluation Report Dec 2003
The observational notes on REPP graduates are replete with examples of teachers’ requiring their students to explain or show their work:
The T had Ss make group presentations of their surveys and debate their results with the other group….
T makes sure the lessons included a chance for Ss to show, tell and explain the lesson goals….
The Ss were expected to speak, write and explain themselves in (language)….
Ss entered into discussion of the book the T read to them. T asked two levels of questions and Ss were happy to respond….
Comments on non-REPP classrooms also included examples of students explaining or showing:
The T was doing a follow-up to the measurement unit that both she and the morning Yup’ik Immersion teacher were doing. The T asked the Ss to explain what the different cooking items were called and what they were used for.
T set up the lesson so that students were reading, hearing, speaking and writing down the major ideas/concepts in the chapter. Ss were allowed to explain the ideas/concepts in their own words.
Small group, large group, math games, manipulation "hands on math" observed. Lots of hands-on learning. Quick responses, well facilitated by the T. Ss were provided time to share and explain how they came to find the answer.
T allowed Ss to go on line in the computer lab and choose a news article for the day's reading class and print it out. Ss had to write a summary and give an oral presentation of the article.
Students working at the upper end of Bloom’s taxonomy: Last year, only a third of the teachers in our sample had students doing work that involved analysis, evaluation, and synthesis. Most (60 percent) remained at the developing or novice level. There was no statistical difference between the two subsamples.
This year, the picture was quite different (Table 3-21). Majorities of both subsamples demonstrated proficiency – 53% of non-REPP and 73% of REPP teachers. Once again, however, the difference between the two subsample is not statistically significant (p = 0.18).
Table 3-21. Proficiency Level of REPP and Non-REPP Teachers in Creating Questions or Tasks that Require Analysis, Evaluation, or Synthesis
Strategies: Questions or tasks that require analysis, evaluation, or synthesis?
Non-REPP REPP Total Freq. % Freq. % Freq. % Non-Proficient 9 47% 6 27% 15 37% Proficient 10 53% 16 73% 26 63% Total 19 100% 22 100% 41 100%
Chi-Squared significance level=NS
42

REPP Evaluation Report Dec 2003
Use of curriculum materials that fit the learning goal: In 2002, most teachers (69 percent) demonstrated proficiency on this dimension. This year, the proportion of teachers at the proficiency level was even higher – 85% for non-REPP teachers and 91% for REPP teachers (Table 3-22).
Table 3-22. Proficiency Level of REPP and Non-REPP Teachers in Using Materials and Resources Suitable for Learning Goals
Strategies: Materials/resources are suitable for learning goals? Non-REPP REPP Total Freq. % Freq. % Freq. % Non-Proficient 3 15% 2 9% 5 12% Proficient 17 85% 20 91% 37 88% Total 20 100% 22 100% 42 100%
Chi-Squared significance level =NS
Technology: This remains an area in which few teachers in our sample demonstrate proficiency. Last year, fewer than 1 in 5 teachers in our sample demonstrated proficiency in the use of technology. This may also be an area that is particularly affected by the fact that we only visit the classrooms once. Whether teachers are using computer technology the day we are observing or not is largely a matter of happenstance.
This year, as Table 3-23 shows, observers saw only 5 non-REPP teachers and 11 REPP teachers using technology. Of these, most demonstrated proficiency.
Table 3-23. Proficiency Level of REPP and Non-REPP Teachers in Using Technology Appropriately
Strategies: Use of technology is appropriate? Non-REPP REPP Total Freq. % Freq. % Freq. % Non-Proficient 2 40% 3 27% 5 31% Proficient 3 60% 8 73% 11 69% Total 5 100% 11 100% 16 100%
Chi-Squared significance level =NS
Observers’ field notes – all of these are from REPP teachers’ classrooms – reveal the ways in which teachers used computer technology:
I did not observe Ss using any technology, but the T did tell me that he had put the computer pod (5 computers and stands grouped around an electrical outlet dropped from the ceiling) together in the center of his classroom and that he had lobbied the other teachers to keep the school computers in their classroom for daily use instead of setting up a computer lab.
The Math, geometry, students use the computer to take tests on line and to stay in contact with their correspondence teacher. These math computer programs are part of the Math curriculum and text series. They evaluate the S's skills and start the S where they need to start, monitor and record progress.
43

REPP Evaluation Report Dec 2003
This computer lead drill and practice is a once a week activity, with the rest of the classes being regular T lead instruction.
T used an overhead but the two classroom computers were not used at all. They could have had maps loaded on them for the geography lesson along with atlases.
The Ss get computer skills during their once a week pull out for computer lab time. I did not observe the classroom computer, one on the T's desk, being used by the Ss.
T allowed Ss to go on line in the computer lab and choose a news article for the day's reading class and print it out.
T used word lists, Math curriculum worksheets and computer testing to assess learning.
The observers’ notes were notably devoid of examples of teachers using computer technology as anything other than as a substitute for conventional classroom activities (e.g., drill and practice, test taking) – the exception being the use of the computer to download and print news stories.
Communicating instructional goals to students: This was another area of weakness for both subsamples of teachers last year. Less that a quarter of REPP graduates and 47 percent of non-REPP teachers were rated proficient in communicating to students the goals of their teaching.
Both subsamples demonstrated considerable improvement in this area during the 2003 observations (Table 3-24). Three-quarters of non-REPP and 86% of REPP teachers were rated proficient in communicating their instructional goals. The difference between the subsamples was not significant (p = 0.39).
Table 3-24. Proficiency Level of REPP and Non-REPP Teachers in Communicating Instructional Goals
Strategies: Communicates goals? Non-REPP REPP Total Freq. % Freq. % Freq. % Non-Proficient 5 25% 3 14% 8 20% Proficient 15 75% 18 86% 33 80% Total 20 100% 21 100% 41 100%
Chi-Squared significance level = NS
44
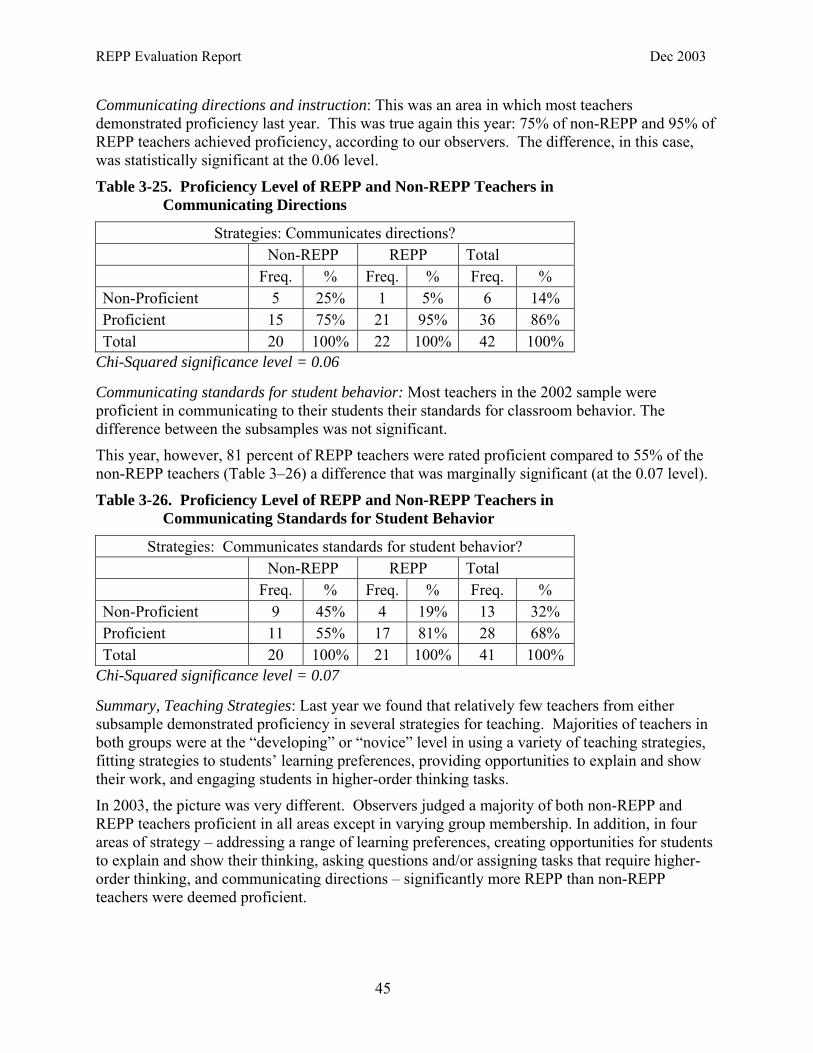
REPP Evaluation Report Dec 2003
Communicating directions and instruction: This was an area in which most teachers demonstrated proficiency last year. This was true again this year: 75% of non-REPP and 95% of REPP teachers achieved proficiency, according to our observers. The difference, in this case, was statistically significant at the 0.06 level.
Table 3-25. Proficiency Level of REPP and Non-REPP Teachers in Communicating Directions
Strategies: Communicates directions? Non-REPP REPP Total Freq. % Freq. % Freq. % Non-Proficient 5 25% 1 5% 6 14% Proficient 15 75% 21 95% 36 86% Total 20 100% 22 100% 42 100%
Chi-Squared significance level = 0.06
Communicating standards for student behavior: Most teachers in the 2002 sample were proficient in communicating to their students their standards for classroom behavior. The difference between the subsamples was not significant.
This year, however, 81 percent of REPP teachers were rated proficient compared to 55% of the non-REPP teachers (Table 3–26) a difference that was marginally significant (at the 0.07 level).
Table 3-26. Proficiency Level of REPP and Non-REPP Teachers in Communicating Standards for Student Behavior
Strategies: Communicates standards for student behavior? Non-REPP REPP Total Freq. % Freq. % Freq. % Non-Proficient 9 45% 4 19% 13 32% Proficient 11 55% 17 81% 28 68% Total 20 100% 21 100% 41 100%
Chi-Squared significance level = 0.07
Summary, Teaching Strategies: Last year we found that relatively few teachers from either subsample demonstrated proficiency in several strategies for teaching. Majorities of teachers in both groups were at the “developing” or “novice” level in using a variety of teaching strategies, fitting strategies to students’ learning preferences, providing opportunities to explain and show their work, and engaging students in higher-order thinking tasks.
In 2003, the picture was very different. Observers judged a majority of both non-REPP and REPP teachers proficient in all areas except in varying group membership. In addition, in four areas of strategy – addressing a range of learning preferences, creating opportunities for students to explain and show their thinking, asking questions and/or assigning tasks that require higher-order thinking, and communicating directions – significantly more REPP than non-REPP teachers were deemed proficient.
45

REPP Evaluation Report Dec 2003
Time Management
A great deal of the process-product research in the 1970s and 1980s focused on teachers’ effective use of classroom time (Good, T. and Brophy, J. 1978). The strong correlations established in that research between “time on task” and student learning are unchallenged. Consequently, we focused some of our observation on how teachers used and managed time. Specifically, we examined the following dimensions: (1) starting class on time; (2) engaging students in task immediately; (3) pacing instruction; (4) facilitating transition; (5) ending class.
In 2002, the majority of teachers in our both subsamples demonstrated proficiency on all the dimensions of time use and management. None of the differences we found last year between the two groups were statistically significant. In 2003, the differences were significant in four of the five measures.
Starting class on time: Similar to what we found last year, large majorities of both groups were rated as proficient in (Table 3-27).
Table 3-27. Proficiency Level of REPP and Non-REPP Teachers in Starting Class on Time
Time: Starts class on time? Non-REPP REPP Total Freq. % Freq. % Freq. % Non-Proficient 3 14% 1 5% 4 9% Proficient 18 86% 21 95% 39 91% Total 21 100% 22 100% 43 100%
Chi-Squared significance level = NS
Engaging in learning tasks immediately: Last year, most teachers in both subsamples were rated proficient. This year, while the proportion (74 percent) proficient among the non-REPP teachers remained about the same, all but one of the 22 REPP teachers were judged proficient (Table 3-28). The difference is statistically significant at the .07 level.
Table 3-28. Proficiency Level of REPP and Non-REPP Teachers in Engaging Students in Learning Tasks Immediately
Time: Gets immediately into learning tasks? Non-REPP REPP Total Freq. % Freq. % Freq. % Non-Proficient 5 24% 1 5% 6 14% Proficient 16 74% 21 95% 37 86% Total 21 100% 22 100% 43 100%
Chi-Squared significance level = 0.07
46
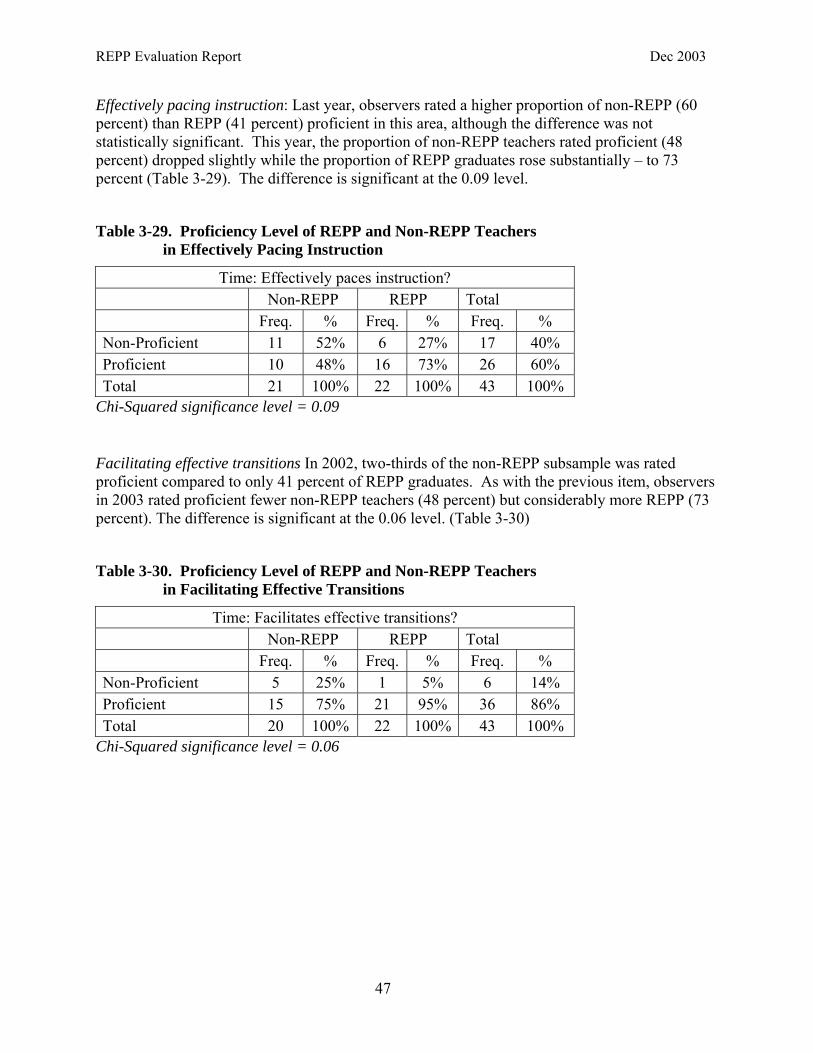
REPP Evaluation Report Dec 2003
Effectively pacing instruction: Last year, observers rated a higher proportion of non-REPP (60 percent) than REPP (41 percent) proficient in this area, although the difference was not statistically significant. This year, the proportion of non-REPP teachers rated proficient (48 percent) dropped slightly while the proportion of REPP graduates rose substantially – to 73 percent (Table 3-29). The difference is significant at the 0.09 level.
Table 3-29. Proficiency Level of REPP and Non-REPP Teachers in Effectively Pacing Instruction
Time: Effectively paces instruction? Non-REPP REPP Total Freq. % Freq. % Freq. % Non-Proficient 11 52% 6 27% 17 40% Proficient 10 48% 16 73% 26 60% Total 21 100% 22 100% 43 100%
Chi-Squared significance level = 0.09
Facilitating effective transitions In 2002, two-thirds of the non-REPP subsample was rated proficient compared to only 41 percent of REPP graduates. As with the previous item, observers in 2003 rated proficient fewer non-REPP teachers (48 percent) but considerably more REPP (73 percent). The difference is significant at the 0.06 level. (Table 3-30)
Table 3-30. Proficiency Level of REPP and Non-REPP Teachers in Facilitating Effective Transitions
Time: Facilitates effective transitions? Non-REPP REPP Total Freq. % Freq. % Freq. % Non-Proficient 5 25% 1 5% 6 14% Proficient 15 75% 21 95% 36 86% Total 20 100% 22 100% 43 100%
Chi-Squared significance level = 0.06
47

REPP Evaluation Report Dec 2003
Ends class effectively Majorities of both groups were rated proficient in ending class effectively in 2002. This was also true in 2003 (Table 3-31). Whereas the proportion of non-REPP teachers remained about the same (70 percent, that of the REPP teachers increased substantially (95%). Once again, the difference was statistically significant (0.03 level).
Table 3-31. Proficiency Level of REPP and Non-REPP Teachers in Ending Class Effectively
Time: Ends class effectively? Non-REPP REPP Total Freq. % Freq. % Freq. % Non-Proficient 6 30% 1 5% 7 17% Proficient 14 70% 21 95% 35 83% Total 20 100% 22 100% 42 100%
Chi-Squared significance level = 0.03
Observational Notes on Use of Time: Below are some of the notes from observers on REPP teachers’ use of time:
T started class within minutes of when they Ss came into the room. Ss moved from one task to another independently and when T asked S groups to come to the table. Ss went back to the morning tasks after their reading groups were finished….
All lessons were started on time with Ss ready to learn. Each lesson was ended with the T giving the Ss a warning that they only had about 5 min. to go. This allowed Ss to come to a comfortable conclusion….
The T had beak times posted on the board and gave the Ss a heads up 5 min before breaks so that they could finish the activity. Ss were in the classroom for the entire afternoon. The T paced the instruction so that the Ss stayed on task the entire afternoon….
T started the lessons on time and had articles and publications ready for those who did not have time to go to the computer lab before school. T gave a 5 min. warning that the lesson would need to be done and to finish what they had been working on….
Class starts on time. Ss got right into the learning. Pacing and transitions were used often and very well during class time. Lesson ended at designated time period….
Not all classes observed ran smoothly. The following are form observations of non-REPP teachers:
T spent the first 20 min of the class calling out answers to the Ss homework while they corrected. Many Ss stopped listening and correcting, which made them, ask the T to repeat an answer or row of answers. The Ss were late leaving their classroom to go to their Reading teacher and group. The T's reading group was in the classroom before the T got her Ss out to the room and on their way to their reading …
T was talking and giving directions before all the Ss came into the room. The T started on time but many of the Ss were late to class. The T tried to get many Ss on task, but many were not sure what the next step was nor how to do it. So the Ss had to wait while the T worked with one S at a time. The T told the Ss that the class would end in 5 min
48

REPP Evaluation Report Dec 2003
and to start putting their materials away. Some Ss did, but many waited right up to the bell and the T had to go and get their project….
Summary, Time Use and Management: In 2002, we found no significant differences between the two subsamples on any of the dimensions of time in the classroom. Less than a majority of REPP teachers was rated proficient in both pacing instruction and facilitating effective transitions between activities.
Observations from 2003 present a dramatically different picture of the REPP graduates. Not only did observers rate a majority, often substantial, of REPP teachers proficient on all five dimensions of time use but the differences with the non-REPP teachers were statistically significant in four of the five cases.
49

REPP Evaluation Report Dec 2003
Assessment
Continuous classroom assessment that is woven into the fabric of instruction has been shown to be an important factor in student learning (Black, P. and Wiliam, D. 1998). Yet, this often receives little attention in teacher preparation programs. We looked for the following dimensions of assessment in our observations: (1) opportunities for students to demonstrate their understanding; (2) monitoring students’ understanding to adjust instruction accordingly; (3) provision of information back to students on their learning; (4) opportunities for students to learn self-assessment; (5) record system to track learning.
Creating opportunities for students to demonstrate their understanding Majorities of both groups of teachers failed to demonstrate proficiency in this area during 2002 observations. Two-thirds of non-REPP teachers and more than half of REPP graduates were rated at the developing level or lower.
Yet, in 2003, we found that substantial majorities of both subsamples were at the proficient level (Table 3-32). Observers rated as proficient 71 percent of non-REPP and 86 percent of REPP teachers – an insignificant difference.
Table 3-32. Proficiency Level of REPP and Non-REPP Teachers in Creating Opportunities for Students to Demonstrate their Understanding
Assess: Creates opportunities for students to demonstrate their understanding?
Non-REPP REPP Total Freq. % Freq. % Freq. % Non-Proficient 6 29% 3 14% 9 21% Proficient 15 71% 19 86% 34 79% Total 21 100% 22 100% 43 100%
Chi-Squared significance level = NS
50
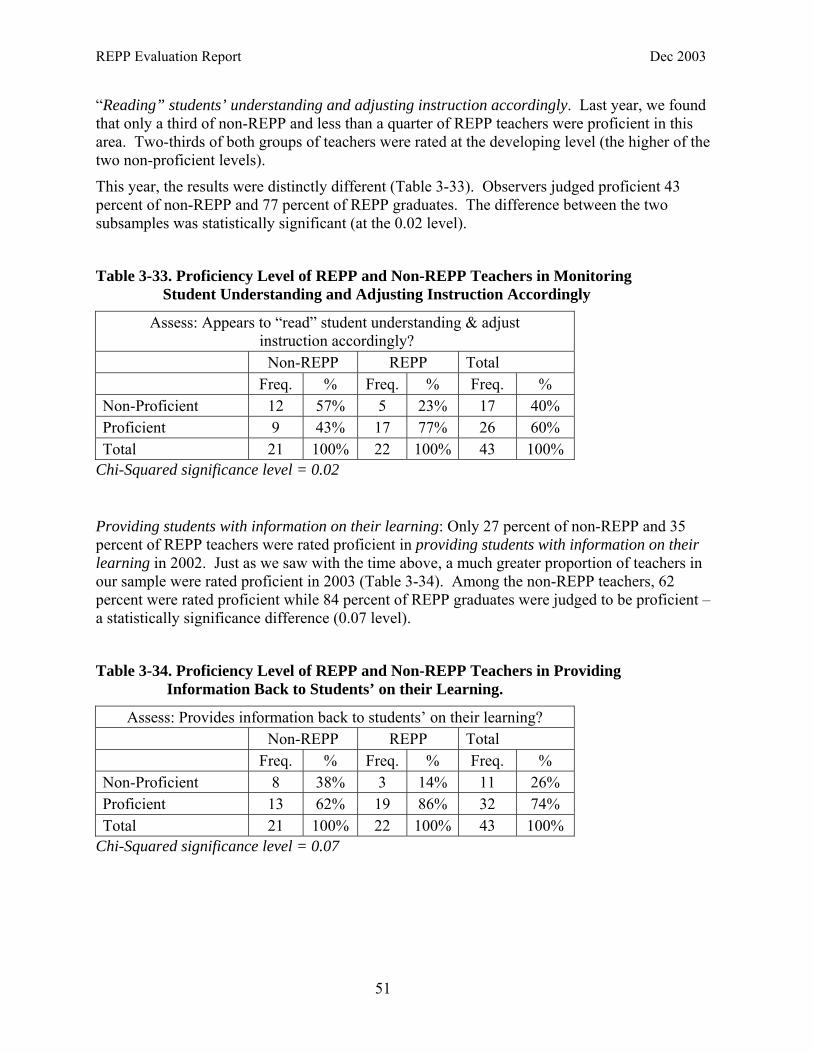
REPP Evaluation Report Dec 2003
“Reading” students’ understanding and adjusting instruction accordingly. Last year, we found that only a third of non-REPP and less than a quarter of REPP teachers were proficient in this area. Two-thirds of both groups of teachers were rated at the developing level (the higher of the two non-proficient levels).
This year, the results were distinctly different (Table 3-33). Observers judged proficient 43 percent of non-REPP and 77 percent of REPP graduates. The difference between the two subsamples was statistically significant (at the 0.02 level).
Table 3-33. Proficiency Level of REPP and Non-REPP Teachers in Monitoring Student Understanding and Adjusting Instruction Accordingly
Assess: Appears to “read” student understanding & adjust instruction accordingly?
Non-REPP REPP Total Freq. % Freq. % Freq. % Non-Proficient 12 57% 5 23% 17 40% Proficient 9 43% 17 77% 26 60% Total 21 100% 22 100% 43 100%
Chi-Squared significance level = 0.02
Providing students with information on their learning: Only 27 percent of non-REPP and 35 percent of REPP teachers were rated proficient in providing students with information on their learning in 2002. Just as we saw with the time above, a much greater proportion of teachers in our sample were rated proficient in 2003 (Table 3-34). Among the non-REPP teachers, 62 percent were rated proficient while 84 percent of REPP graduates were judged to be proficient – a statistically significance difference (0.07 level).
Table 3-34. Proficiency Level of REPP and Non-REPP Teachers in Providing Information Back to Students’ on their Learning.
Assess: Provides information back to students’ on their learning? Non-REPP REPP Total Freq. % Freq. % Freq. % Non-Proficient 8 38% 3 14% 11 26% Proficient 13 62% 19 86% 32 74% Total 21 100% 22 100% 43 100%
Chi-Squared significance level = 0.07
51
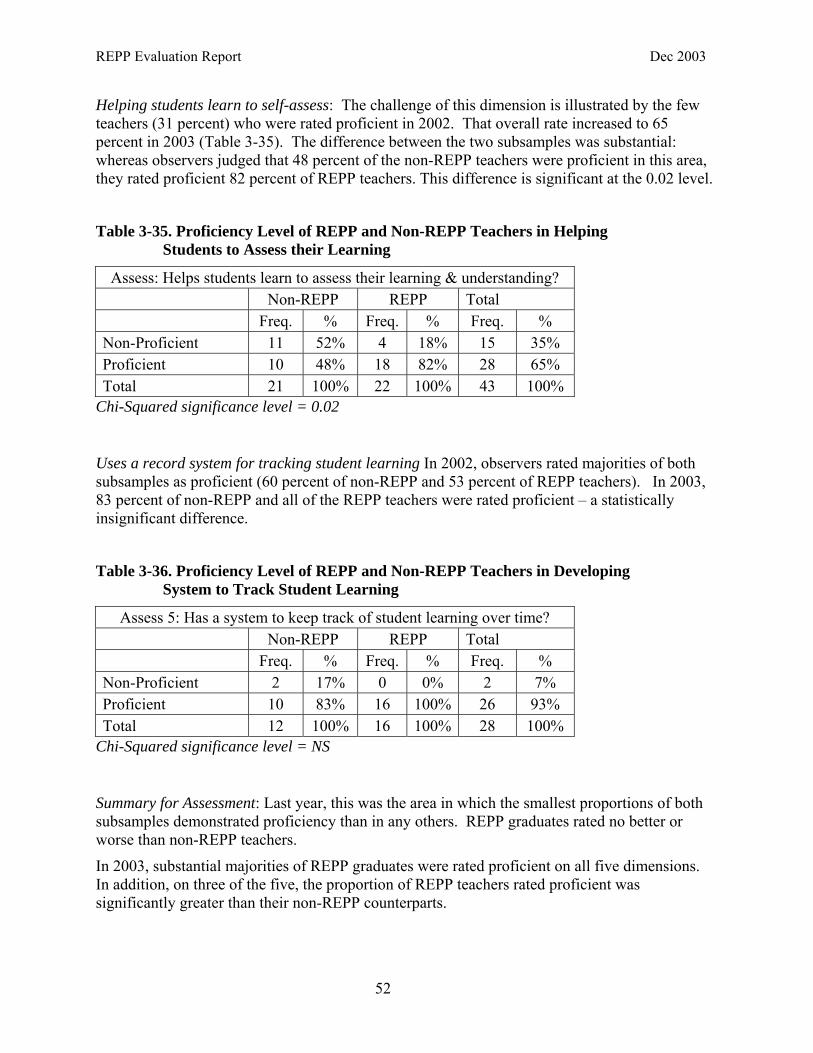
REPP Evaluation Report Dec 2003
Helping students learn to self-assess: The challenge of this dimension is illustrated by the few teachers (31 percent) who were rated proficient in 2002. That overall rate increased to 65 percent in 2003 (Table 3-35). The difference between the two subsamples was substantial: whereas observers judged that 48 percent of the non-REPP teachers were proficient in this area, they rated proficient 82 percent of REPP teachers. This difference is significant at the 0.02 level.
Table 3-35. Proficiency Level of REPP and Non-REPP Teachers in Helping Students to Assess their Learning
Assess: Helps students learn to assess their learning & understanding? Non-REPP REPP Total Freq. % Freq. % Freq. % Non-Proficient 11 52% 4 18% 15 35% Proficient 10 48% 18 82% 28 65% Total 21 100% 22 100% 43 100%
Chi-Squared significance level = 0.02
Uses a record system for tracking student learning In 2002, observers rated majorities of both subsamples as proficient (60 percent of non-REPP and 53 percent of REPP teachers). In 2003, 83 percent of non-REPP and all of the REPP teachers were rated proficient – a statistically insignificant difference.
Table 3-36. Proficiency Level of REPP and Non-REPP Teachers in Developing System to Track Student Learning
Assess 5: Has a system to keep track of student learning over time? Non-REPP REPP Total Freq. % Freq. % Freq. % Non-Proficient 2 17% 0 0% 2 7% Proficient 10 83% 16 100% 26 93% Total 12 100% 16 100% 28 100%
Chi-Squared significance level = NS
Summary for Assessment: Last year, this was the area in which the smallest proportions of both subsamples demonstrated proficiency than in any others. REPP graduates rated no better or worse than non-REPP teachers.
In 2003, substantial majorities of REPP graduates were rated proficient on all five dimensions. In addition, on three of the five, the proportion of REPP teachers rated proficient was significantly greater than their non-REPP counterparts.
52

REPP Evaluation Report Dec 2003
Teacher-Student Relations
A key to academic success for many students is the relationship they have with their teacher. Although this is generally the case, it is particularly salient in rural Alaska. As a consequence, observers rated our sample of teachers on several dimensions of teacher student relations including: (1) a classroom climate that invites students to learn; (2) demonstrates genuine caring for students; (3) appears fair and even-handed; and (4) uses humor appropriately and effectively.
As Table 3-37 demonstrates, significantly higher proportions of the REPP graduates were rated proficient on three of the four dimensions of teacher-student relations. In fact, all but one of the REPP graduates was rated proficient on these three dimensions. On the fourth dimension – using humor appropriately and effectively – a majority of REPP graduates were rated proficient while less than half of the non-REPP teachers received such a rating.
Table 3-37. Frequency and Proportion of Non-REPP and REPP Teachers Proficient in Dimensions of Teacher-Student Relations.
Item Non-REPP REPP Signif.Diff.
Freq % Freq % Classroom climate conducive to student learning. 13 62% 21 95% .007 Teacher demonstrates genuine caring for students. 13 62% 20 95% .008 Teacher appears fair and even-handed. 14 67% 21 95% .015 Teacher uses humor appropriately and effectively. 9 45% 15 68% NS
Student-Student Relations
Another dimension of classroom climate that is critical to student learning is the kind of community that the teacher creates in the classroom. Our observers rated sample teachers on two dimensions: (1) creates opportunities for social interactions among students; and (2) teaches students to work cooperatively. Table 3-38 shows the observers rating of the sample teachers.
Table 3-38. Frequency and Proportion of Non-REPP and REPP Teachers Proficient in Dimensions of Student-Student Relations
Item Non-REPP REPP Signif.Diff.
Freq % Freq % Creates opportunities for social interactions among students 11 55% 15 71% NS
Teaches student to work cooperatively 10 50% 15 71% NS
Majorities of both subsamples demonstrated proficiency in both dimensions of student-student relations. Differences between the two subsamples were not statistically significant. The proportion of REPP teachers who demonstrated proficiency – 71 percent – is robust but overshadowed by stronger showings in other areas of teaching competence.
53

REPP Evaluation Report Dec 2003
Classroom Management
Because it is an area in which many inexperienced teachers often struggle, our observers rated samples teachers on several dimensions of classroom management. These included: (1) establishing and enforcing high expectations; (2) using a variety of effective management techniques; (3) effectively using voice, facial expressions, movement, and body language; (4) effectively using the physical environment; and (5) establishing and maintaining a safe and inclusive classroom atmosphere. Table 3-39 shows the proportion of each subsample that was rated proficient on each of these dimensions.
Table 3-39. Frequency and Proportion of Non-REPP and REPP Teachers Proficient in Classroom Management
Item Non-REPP REPP Signif.Diff.
Freq % Freq % Establishing and enforcing high expectations for behavior 11 52% 20 91% .005
Using a variety of effective management techniques 7 33% 10 50% NS Effectively using voice, facial expressions, movement, and body language 11 52% 18 86% .019
Effectively using the physical environment 11 52% 17 85% .025 Establishing and maintaining a safe and inclusive classroom atmosphere 13 62% 21 95% .007
Significantly larger proportions of the REPP teachers were rated proficient on four of the five dimensions. On two – establishing and enforcing high behavioral expectations and establishing and maintaining a safe, inclusive classroom atmosphere – over 90 percent of the REPP graduates were judged proficient. On two others – effectively using voice, facial expressions, movement, and body language and effectively using the physical environment to manage student behavior – 85 percent or more of the REPP graduates were rated proficient. Only in using a variety of effective management techniques was there no significant difference between the two subsamples: Half of the REPP teachers and a third of the non-REPP teachers were rated proficient.
54

REPP Evaluation Report Dec 2003
Professionalism
We included two dimensions of professionalism: (1) maintains high professional ethics; and (2) maintains a positive attitude. Here, observers relied on more than watching the teachers in their classroom; they also observed them in the wider school and community surround.
As Table 3-40 reveals, observers rated significantly larger proportions of REPP than non-REPP teachers proficient in both dimensions of professionalism. While roughly two-thirds of the non-REPP teachers were rated proficient, 95 percent of REPP teachers were judged proficient.
Table 3-40. Frequency and Proportion of Non-REPP and REPP Teachers Proficient in Professional Ethics
Item Non-REPP REPP Signif. Diff.
Freq % Freq % Maintains high professional ethics 12 67% 21 95% .017 Maintains a positive attitude 13 62% 21 95% .007
Family & Community Involvement
The final teaching standard was family and community involvement. This was encompassed by one item: attempt to involve families or the community in lessons at any stage – planning, instruction, and assessment. As Table 3-41 shows, a higher proportion of REPP than non-REPP teachers was rated proficient on this standard. At the same time, observers did not always have the opportunity to see this dimension of sample teachers’ practice. As a consequence, not all teachers were rated on this standard. This, in part, accounts for the lack of significance in the difference between the two subsamples.
Table 3-41. Frequency and Proportion of Non-REPP and REPP Teachers Proficient in Family and Community Involvement
Item Non-REPP REPP Signif. Diff.
Freq % Freq % Attempts to involve families or the community in lessons at any stage – planning, instruction, assessment
11 73% 13 93% NS
55

REPP Evaluation Report Dec 2003
Summary and Discussion of Findings The results from this year’s evaluation contrast markedly with those from the 2002 evaluation. Based on our observations last year, we found few significant differences between the two subsamples. We concluded that “[b]y and large, REPP graduates are similar to those of graduates from other, presumably more traditional, preservice programs.” We did note that in two key areas, more REPP than non-REPP teachers appeared to be proficient: making connections between the content and their students’ cultural background and holding high expectations for student learning. We further noted that these were critical standards for rural Alaskan schools that have been plagued by curricula that are not connected to the experience of most students and by low expectations of students’ academic capabilities.
The contrast of these results with this year’s findings could scarcely be more dramatic. As we have seen, on most of the teaching standards, significant differences were found between the proportion of REPP and non-REPP teachers judged proficient. These results are summarized in Table 3-42.
In every instance where we found significant differences, more REPP than non-REPP teachers were judged proficient. On only two categories of standards – student-student relations and family and community involvement – did we find no significant difference. In one category – orientation toward students – significantly more REPP than non-REPP teachers were rated proficient on every dimension of the standard.
Leaving aside the differences, substantial majorities of REPP teachers were rated proficient on nearly every standard. In fact, on only one dimension – flexible grouping – did less than half of the REPP graduates receive a rating of proficient. On more than half of the 47 dimensions on which sample teachers were rated, 90 percent or more of REPP graduates were judged proficient. In contrast, the highest proportion of non-REPP teachers on any of the 47 dimensions was 89%.
Interpreting these results is difficult. Can such a dramatic improvement between last year and this be due to changes in the REPP program? Although changes did take place, they seem inadequate to explain the improvements in the results. Did the quality of the REPP graduates themselves improve dramatically from one year to the next? Again, a positive “cohort effect” seems inadequate, particularly given that a number of REPP teachers observed this year were also part of last year’s evaluation. Finally, did changes in the observers result in dramatic differences? As noted above in the methods section, all observers trained together in 2002 and in 2003. One observer worked only in 2002 and one only in 2003, and this likely had some effect; however, it seems an inadequate explanation for the scope of the change.
In all probability, what we are seeing is a combination of the factors – program improvements and a strong cohort effect, combined with some effects of observer change, and probably some random variation as well.
Such positive results create another problem for evaluators: We are left with little to recommend to improve the program. The results certainly suggest that REPP has done an outstanding job of preparing teachers for Alaska’s rural schools. They further suggest that REPP or a program that maintains the content and format of REPP should be continued into the indefinite future.
56

REPP Evaluation Report Dec 2003
Table 3-42. Percentages of Non-REPP and REPP Teachers Rated Proficient on Alaska Teaching Standards, 2003
(Bold typeface indicates significant difference)
Teaching Standards Non-REPP REPP Signif.
Diff. Planning Lesson focus 71% 95% 0.03 Assessment part of plan 76% 75% NS Lesson developmentally appropriate 71% 95% 0.04 Special needs students accommodated 27% 60% NS Content Attention to Alaska content standards 89% 100% NS Concept, idea, or procedure clearly identified 81% 95% NS Concept, idea, or procedure clearly important 76% 95% 0.07 Focus on deep understanding of content 43% 77% 0.02 Content connected to students’ experience 50% 80% 0.05 Orientation Toward Students High expectations for student learning 62% 95% 0.007 Lessons connect to students’ interest, experiences, and needs 57% 95% 0.003 Opportunities for students to create their own meaning 35% 76% 0.008 Appropriate classroom management techniques 57% 91% 0.01 Student engaged 67% 91% 0.05 Teaching Strategies Uses a variety of strategies 66% 86% NS Student grouping is flexible 39% 43% NS Attends to learning preferences 57% 81% 0.10 Creates opportunities for students to explain & show their thinking 63% 91% 0.03
Learning tasks are at high cognitive levels 53% 73% NS Materials are appropriate for learning goals 85% 91% NS Uses technology appropriately 60% 62% NS Clearly communicates instructional goals 75% 86% NS Clearly communicates directions or instructions 75% 95% 0.06 Clearly communicates standards for student behavior 55% 81% 0.07
57

REPP Evaluation Report Dec 2003
Table 3-42. continued
Teaching Standards Non-REPP REPP Signif.
Diff. Time Management Starts class on time 86% 95% NS Engages students in learning task immediately 74% 95% 0.07 Paces instruction appropriately 48% 73% 0.09 Facilitates smooth transitions 75% 95% 0.06 Ends class smoothly & on time 70% 95% 0.03 Assessment Creates opportunities for students to demonstrate their understanding 71% 86% NS
Monitors students’ understanding to adjust instruction accordingly 43% 77% 0.02
Provides information back to students on their learning 62% 84% 0.07 Creates opportunities for students to learn self-assessment 48% 82% 0.02 Uses record system to track learning 83% 100% NS Teacher-Student Relations Maintains a classroom climate that invites students to learn 62% 95% .007 Demonstrates genuine caring for students 62% 95% .008 Appears fair and even-handed 67% 95% .015 Uses humor appropriately and effectively 45% 68% NS Student-Student Relations Creates opportunities for social interactions among students 55% 71% NS Teaches students to work cooperatively 50% 71% NS Classroom Management Establishes & enforces high expectations for student behavior 52% 91% .005
Uses a variety of effective management techniques 33% 50% NS Uses voice, facial expressions, movement, & body language effectively in management 52% 86% .019
Uses the physical environment effectively 52% 85% .025 Establishes & maintains a safe & inclusive classroom atmosphere 62% 95% .007
58
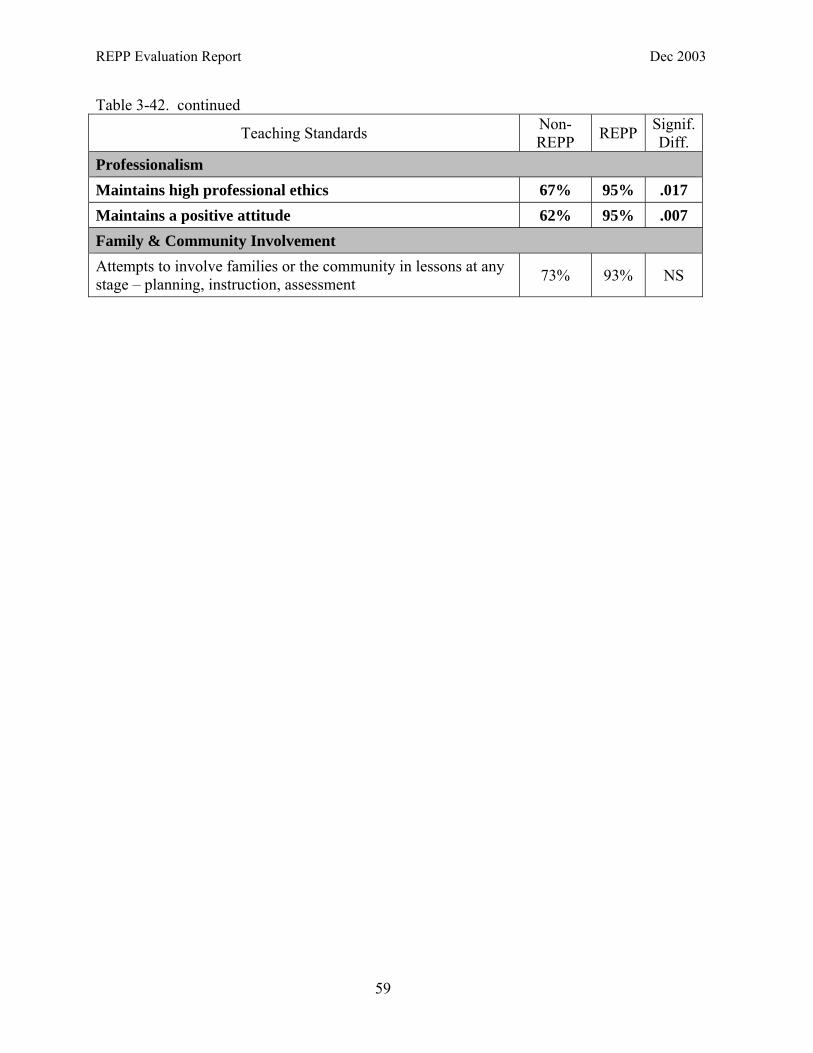
REPP Evaluation Report Dec 2003
Table 3-42. continued
Teaching Standards Non-REPP REPP Signif.
Diff. Professionalism Maintains high professional ethics 67% 95% .017 Maintains a positive attitude 62% 95% .007 Family & Community Involvement Attempts to involve families or the community in lessons at any stage – planning, instruction, assessment 73% 93% NS
59

REPP Evaluation Report Dec 2003
60
REPP Evaluation Report Dec 2003
References
Andrew, M. D. (1990). Differences Between Graduates of 4-Year and 5-Year Teacher Preparation Programs. Journal of Teacher Education 41(2), 45-51.
Black, P. and William, D. (1998, October) Inside the Black Box: Raising Standards Through Classroom Assessment. Phi Delta Kappan 80 (2), 139-148.
Darling-Hammond, L., and Sclan, E. M. (1996). Who Teaches and Why: Dilemmas of Building a Profession for Twenty-First Century Schools. In J. Sikula (Ed.), Handbook of Research on Teacher Education, (2nd ed.), pp. 67- 101. New York: Macmillan
Good, T. and Brophy, J. (1978). Looking in Classrooms. New York: Harper and Row
Grissmer, D., Flanagan, A., Kawata, J., Williamson, S. (2000). Improving Student Achievement: What State NAEP Scores Tell Us. Santa Monica, CA: Rand.
McDiarmid, G.W., Larson, E., and Hill, A. (2002, December). Retaining Quality Teachers for Alaska. Anchorage: Institute of Social and Economic Research, University of Alaska Anchorage. Online at www.iser.uaa.alaska.edu.
Reyhner, J. (1992). American Indians Out of School: A Review of School-Based Causes and Solutions. Journal of American Indian Education, 31(3), 37-56.
Rosenthal, R. and Jacobsen, L. (1968). Pygmalion in the Classroom: Teacher Expectation and Pupils’ Intellectual Development. New York: Holt, Reinhart, and Winston.
61


REPP Evaluation Report Dec 2003
APPENDIX A. FREQUENCY COUNTS OF REPP PDS SURVEY: PDS SCHOOL RESPONDENTS
YOUR SCHOOL AS A WORKPLACE
A. Indicate the extent to which you agree or disagree with each of the following statements
about this school. Strongly
disagree Disagree Agree Strongly
agree 4. Sufficient time is available to do what is
important to do 2 19 9 1
5. Sufficient resources are available to do what is important to do
3 9 15 2
17. Teachers discuss their own beliefs about teaching and learning with each other
1 3 21 6
19. Teachers share student work with other teachers
2 6 20 2
B. This school year, how often have you had conversations with colleagues about: Never Once or
Twice Regularly
1. What helps students learn best? 0 5 26 2. Development of new curriculum? 3 12 16 3. The goals of this school? 0 16 15 4. Managing classroom behavior 0 13 17 C. This school year, how often have you: Never Once/Twice Regularly 1. Received meaningful feedback on your
performance from colleagues? 7 17 7
2. Visited other teachers’ classrooms? 12 11 8 5. Invited someone in to help teach your class? 11 16 4
E. How often do you talk about teaching practices with: Never Once or
Twice Occasionally Regularly
2. Teachers who teach at a different grade level
0 6 14 11
6. Intern/teacher education students 12 10 3 6 7. College/university faculty 17 10 3 0
63

REPP Evaluation Report Dec 2003
J. Indicate the extent to which you agree or disagree with each of the following: Strongly
DisagreeDisagree Agree Strongly
Agree 14. We receive adequate professional
development support for the changes we introduce at our school
3 11 11 6
17. In this school, teachers are continually learning and seeking new ideas
0 6 18 7
K5. Changes introduced at this school involve only a few teachers; rarely does the whole faculty become involved.
12 11 8 0
L. Indicate how much influence you have over each of the following: None A Little Some A Great
Deal LR8. Establishing the PDS goal for school
improvement 8 7 5 10
9. Determining the content of in-service programs
8 7 9 7
N. Rate the extent to which the following have changed during your school’s partnership
with your college/university Worse No Change Better 4. How the school relates to the community 2 22 6 7. How teachers get along with each other 0 21 9 8. Sense of community in the school 0 20 10 9. Quality of curriculum and instruction 0 10 20 12. My commitment to the school 0 22 8 13. Teachers learning from one another 0 13 17 14. Professional growth opportunities 0 9 21 15. My teaching effectiveness 0 8 21 17. Quality of interaction with college/university
faculty 0 22 6
N18. To what extent do you believe the partnership has helped promote these changes? _7_ Not at All _16_ Somewhat _7_ A Great Deal
64

REPP Evaluation Report Dec 2003
YOUR INSTRUCTIONAL PRACTICES V1. What proportion of the students in your classes do you expect to graduate from high
school? (Circle your choice below)
Can’t predict
6
None
0
1 to 25 percent
2
26 to 50 percent
7
51 to 75 percent
4
76 to 100 percent
13
V2. What proportion of the students in your classes do you expect to attend a two-year or four-year college or university? (Circle your choice below)
Can’t predict
6
None
0
1 to 25 percent
10
26 to 50 percent
10
51 to 75 percent
5
76 to 100 percent
1
X. Indicate the extent to which you agree or disagree with each of the following statements: Strongly
disagree Disagree Agree Strongly
agree 1. Once we start a new program, we follow-up to
make sure that it’s working. 3 8 19 2
3. Many special programs come and go at this school
1 9 15 5
4. You can see real continuity from one program to another at this school.
2 10 17 1
7. Supplemental programs like Chapter I are carefully designed to complement my classroom teaching.
3 17 9 1
8. I have a classroom library which is central to my instruction.
3 8 17 4
13. I have access to current technology (hardware and software).
3 8 14 7
65

REPP Evaluation Report Dec 2003
YOUR PROFESSIONAL DEVELOPMENT BB. During the past twelve months, about how much time have you spent in professional
development activities devoted to each of the following topics? N/A
or 0 hrs
3 hrs or
less
4 to 6 hrs
7 to 15 hrs
16 to 30 hrs
> 30 hrs
3. Learning goals and standards Wt avg 24.25 3 4 1 5 2 16 4. Student assessment and evaluation 20.25 2 3 4 6 6 10 13. Multicultural diversity issues 10.5 8 12 2 1 2 6 16. Student social skills and personal
development 13.2 5 6 6 3 6 5
18. Parent involvement and/or community relations 8.65
7 10 4 4 3 3
CCRepp. In the past year, how often have you: Never Once or
Twice Occasionally Frequently
7. Attended professional development activities led by another teacher?
0 15 13 4
8R. Attended professional development activities led by District personnel?
1 9 18 4
9R. Attended professional development activities led by outside professionals?
2 13 7 10
DD. When you seek help for improving your teaching and student learning, to whom do you
turn? Please mark below the three sources you are most likely to use. __20__ My principal
__30__ Teachers at my school
__8__ Teacher(s) with whom I interact in a formal network or professional development program
__12__ Teacher(s) at another school
__8__ A school-level curriculum coordinator or other non-teaching professional staff member
__5__ An outside consultant
__0__ Teachers’ union staff
__9__ Central office staff (Superintendent, Curriculum Coordinator, etc. )
__0__ College/university faculty in partnership with the school
__0__ State/regional office staff (coordinators, professional development staff, etc. )
66

REPP Evaluation Report Dec 2003
EE. Indicate the extent to which you agree or disagree with each of the following statements:Overall, my professional development experiences over the past year have:
Strongly disagree
Disagree Agree Strongly agree
1. Been sustained and coherently focused, rather than short-term and unrelated.
2 6 16 6
2. Included enough time to think carefully about, try, and evaluate new ideas.
2 11 14 4
3. Been closely connected to my school's improvement plan.
2 3 20 6
4. Included opportunities to work productively with colleagues in my school.
0 10 18 3
5. Included opportunities to work productively with teachers from other schools.
3 16 9 3
6. Helped me understand my students better 0 7 20 4 7. Deepened my understanding of subject matter 1 6 18 6 8. Led me to make changes in my teaching 0 5 18 8 9. Helped my school's staff work together better 1 7 20 3 10. Changed the way teachers talk about students 1 10 17 2 11. Shifted my approaches to teaching 0 9 15 6 FF. How often over the life of the partnership with the college/university have you had the
opportunity for each of the following? Never Once or
Twice Frequently
1. Visiting teachers in other partnership schools 25 6 0 3. Conducting inquiry/action research with
school colleagues 18 9 2
4. Conducting inquiry/action research with college/university colleagues
27 3 0
8. Developing curriculum with college/university colleagues
29 2 0
9. Mentoring interns/teacher education students 17 9 5 10. Working directly with college/university
faculty in P-12 classrooms 28 2 1
11. Working directly with college/university faculty in college classrooms
22 8 1
67

REPP Evaluation Report Dec 2003
JJ. To what extent do you agree or disagree with the following statements about what the
professional development school has done? Strongly
disagree Disagree Agree Strongly
agree 1. Helped me understand my students better 3 9 17 1 2. Deepened my understanding of subject matter 3 5 20 2 3. Advocated practices I do not believe in 9 17 4 0 4. Led me to make changes in my teaching 2 7 17 4 5. Helped me better assess student work 2 10 14 4 6. Changed the way teachers talk about students 2 13 13 1 7. Shifted approaches to teaching with school faculty 3 11 11 4
DEMOGRAPHICS 1) How many years have you been a teacher? 1-2 yrs 2 3-5 yrs: 7 6-10 yrs: 9 11-15 yrs: 4 16-20 yrs: 5 21-30 yrs: 4 Over 30 years 0 2) How many years have you taught at this
school? 1-2 yrs: 1 0 16-20 yrs: 1 3-5 yrs: 11 21-30 yrs: 0 6-10 yrs: 5 Over 30 yrs: 0 11-15 yrs: 3 3) What grade(s) and subjects (if appropriate)
are you currently teaching? Elementary (K-6) 20 Middle School (7-8) 2 High School 5 Special Education 3 4) What are your current certification areas? Elementary Ed 23 Early Childhood Ed. 3 Special EducationEd 7 Secondary Science 3 Secondary Math 2 Secondary Language Arts 2 Secondary Social Science 2 Administration Credential 1
5) Do you have any assignments other than teaching?
_18_ no __13_yes (list below) 6) What is the highest level of formal education you
have completed?
_22__bachelor’s degree
_1___master’s degree
_2___master’s degree+15 hours
_2___master’s degree + 30 hours
_3___master’s degree + 45 hours
_0___doctorate 7) What is your gender?
_7_ male _22_female 8) What best describes your ethnic background? (check as many as apply)
_4___ Alaska Native
_23___ White,
_2___ Other
68

REPP Evaluation Report Dec 2003
69
APPENDIX B. OBSERVATION PROTOCOL FOR REPP GRADUATE OBSERVATIONS SPRING, 2003
Notes to Observers Observe – Interview – Complete standards-based assessment This manual includes several documents: an observation protocol to be completed during the actual observation; an interview guide to discuss the observation with the teacher, and a standards-based assessment form to be completed after the observation and interview. In addition, there is a survey (very similar to the one we ask REPP interns to complete at the end of their program) that we would like the teachers who are ex-REPP interns to fill out.

REPP Evaluation Report Dec 2003
70
OBSERVATION PROTOCOL You may use one or several observation forms over the course of you observation, depending on how many separate lessons the teacher conducts during the time you have available for observation.
Description of Activity, including (1) organization for learning; (2) teacher’s actions (3) students’ actions (4) materials/tools and how used; and (5) apparent learning goal(s) for each activity.
Here you describe each separate activity that you observe. For instance, having students introduce themselves and identify a problem in teaching their subject matters is one activity. Having students then discuss in small group a particular math problem is another activity.
1. Organization for learning: You should include a description of how students are organized for an activity e.g., “Students are organized into groups around tables. Ss are allowed to sit wherever they wish.. Teacher gave no specific instructions on where students should sit.’ How students are organized to deal with the subject matter says a lot about how the subject matter is conceived. For instance, if students work on math problems alone, this suggests that math is not a subject that lends itself to group or communal work. How, if at all, is technology integrated into the organization for learning? If technology is part of the activity, is it accessible or is movement to another facility required? If computers are involved in collaborative activity is there adequate space for multiple users or are they uncomfortably shoe-horned around one computer – if multimedia is used are headsets available or is it an audio tower of babel etc.
2. Teachers’ actions: You should describe what the teacher does. For example, “The teacher outlined the activity, assigned Ss to groups, monitored Ps activity, circulating around the room, stopping to listen to conversations and occasionally contributing to group discussions. Then, she stopped the activity & invited a spokesperson from each group to report out. As the groups reported out, she wrote truncated summaries of their points on butcher paper. Then she draw connections among the points each group made.” If technology is used, are teachers comfortable and knowledgeable integrating its use or does the teacher’s actions “stop” while the computer boots etc. Does the teacher turn all technology use “over to a tech person?”
3. Students’ actions: You should describe what students do. For example, ”Ss listened to teacher, met with other group members, identified a recorder and spokesperson, discussed the topic. All members participated but the conversation was dominated by one male and one female S. Others seemed to acquiesce to their predominance. Then, the female reported out. Other Ss sat quietly during presentations.” Gender configurations are particularly important in computer related activities...
4. Materials/tools and how used: You should identify any tools or materials students use. For ex.: “Ss were asked to use computers to find Web-based documents and information on Reconstruction.”
5. Apparent learning goal(s): You should also identify the learning goals for the activity, being as specific as possible about the content . The teacher may do this, either orally or in materials that are distributed. If not, you may have to infer the goal from the activity. For example, “Students were asked to solve the following math problem: What is 1 3/4 divided by 1/2? And were asked to provide an example that would illustrate the problem. The teacher did not mention an explicit goal but it seems to be to make Ss aware of the relationship between algorithmic knowledge and conceptual knowledge.” Or: “Students were asked to identify the governmental activities in the local community as a means to distinguish the roles of different levels of government, their functions, and sometimes overlapping jurisdiction.” Is the use of technology a specifically identified goal in itself?
6. Duration: Record the length of time the activity takes in minutes, including duration of “subactivities.” For example, an activity may be “learning to represent factions” while subactivities include brief lecture and demonstration, small group discussions, synthesis of group ideas.

REPP Evaluation Report Dec 2003
71
Observation Protocol—REPP Graduates
Teacher __________________________ Observer___________________________
School ___________________________ Date _____/______/2002
Grade _________ Time _________ to _________
Subject ________________ # of Students _________
Description of topic(s) addressed:
Description of Activity #1 1. Organization
for learning
2. Teachers’ actions
3. Students’ actions
4. Materials/tools & how used
5. Apparent learning goal(s)
6. Duration

REPP Evaluation Report Dec 2003
72
Interview Guide
The purpose of the interview is two-fold: It allows you to ask about areas of teaching practice that weren’t evident in your observations. It gives you an opportunity to find out the observee’s assessment of the REPP program. How typical were the lessons that I observed? If not, tell me about a typical lesson. If you could change anything that happened in the lessons I observed, what would that be? Why? Could you describe your philosophy of education and how it has affected your practice? Describe your experience with the REPP program. Where did it work well for you; what were the problems? In which areas of teaching do you feel the REPP program prepared you well? In which areas of teaching do you feel the REPP program failed to prepare you well? How did the REPP program prepare you to base your teaching on the Alaska Teacher Standards? Do you use computer technology in teaching? If not, why not? If yes, tell me how you use it. What do you see as your strengths as a teacher? What areas do you most want to improve? Are opportunities available for you to make the improvements you would like to make? If so, what are these? How successful have you been in developing relationships with your principal, the school's faculty and staff, and your students? Do you have a formal mentor? Tell me about your work with this person. How often do you talk with your mentor? What specific support has he/she provided? Are there areas in which you feel you need more support? Do you have any informal mentors? Tell me about your work with this person/these people. What specific support have they provided? Are there areas in which you feel you need more support? How successful have you been in developing relationships with your students’ parents and the community? How likely is it that you’ll return to your school next year? Why/why not? If not, is it likely that you will continue to teach next year? If not, why not?

REPP Evaluation Report Dec 2003
73
Guide to Standards-Based Assessment
Notes & Evidence: Please include (in cryptic form, if you like) what you saw or heard that is the basis for your rating. For instance, for planning:
Wasn’t clear what the focus was; he didn’t plan to tell the students and since the students did 4 different activities that appeared unrelated, hard to deduce. Other than asking a few low-level questions, (“Who was John Jay? When were the Federalist Papers written? Who were the Anti-Federalists?”) I saw no evidence of assessing student learning, beyond his mention of the “chapter test” in 3 days. Because the goals were unclear, don’t know if appropriate. No visible special needs students.
Proficient= Teachers reflexively and consistently demonstrates skill, knowledge, or disposition. These are seamlessly incorporated into the teacher’s practice.
Example: “Planning was clearly evident: the goal, description, & assessment of the activities were on an overhead and a handout (“You’ll know whether you are meeting the goal if you can summarize, in your own words, at least one of the Anti-Federalists’ objections to the idea of representative democracy as outlined in the Constitution. If you aren’t sure, give it to your neighbor to read & comment.”) Because a broad range of reading levels in the class, she prepared a reading guide for each passage from the Federalist Papers to ensure everyone in each group understood as well as rubric to help the groups assess their level of understanding. She had gotten the FPs on tape for the one visually impaired student in the class who was also a part of a group.
Developing= Most of the time, teacher demonstrates the skill, knowledge or disposition. Teacher is still consciously incorporating these into his/her practice.
Example: “She identified the goal on the standards chart and seemed to have thought out the connection to the activities. How students were to understand this connection wasn’t clear. Planned a fastwrite to end the class but its point seemed vague (“If you had been alive in 1788, would you have been a Federalists or Anti-Federalists?). 10th grade kids might lack contextual knowledge to make this a useful learning/assessment device. Passed out a vocabulary list with words she thought students would find difficult. Hadn’t worked with students to identify these but had guessed. Didn’t allow enough time for closing activity.”
Novice= Teacher may demonstrate awareness of skill, knowledge, or disposition. Teacher is at a beginning stage of incorporating these into practice.
Example: “Focus was there but pretty general: To understand not everybody agreed on Constitution. Planned to divide students in half for a Federalist-Anti-Federalist debate on the Constitution. Had students read excerpts from FPs & Anti at home. As an assessment activity, planned to have student vote for or against Constitution and explain why in writing for homework. No apparent attention to wide range of reading levels and background knowledge. No accommodation for bi-lingual Asian girl who was obviously lost. Teacher 3 times asked if she understood & accepted her head nod at face value.”
Absent= Teacher demonstrates no awareness of the skill, knowledge, or disposition. Example: “Only goals appeared to be to learn what was in textbook section on the Constitution. No focus within this. Asked students to answer 3 of the lower-level questions at end of chapter as assessment. No apparent attention to developmental, cultural, linguistic, or other differences. No real planning beyond read the chapter & answer the questions.”
NA= Does not apply in this case. No visible special needs students. When asked, teacher reported no identified special needs students at all in class.

REPP Evaluation Report Dec 2003
74
Standards II, III, IV, V: Instruction and Assessment; Learning Theory & Practice; Diversity; Content Skill, Knowledge, or Disposition Notes & Evidence
P D N A N/a Planning Is lesson well focused? Is an assessment activity planned to determine
progress toward the goal? Are goals appropriate for the range of
development levels in the class? Are accommodations for students with special
needs identified & addressed?
P D N A N/a Content Is the Alaska standard that the lesson will
address evident? Are the concepts, ideas, or procedures to be
learned clearly identified? Are the concepts, ideas, or procedures to be
learned clearly important? Is the lesson aimed at deep understanding or
clearly a foundation for such understanding? Does the lesson connect to students’ cultural
backgrounds?
P D N A N/a Student-orientation Teacher demonstrates high expectations for
all students? Lesson connects to student interests,
experiences, needs? Opportunities for students to create their own
meaning? Are classroom management techniques
appropriate for students & context? Does teaching engage students?

REPP Evaluation Report Dec 2003
75
Standards II, III, IV, V: Instruction and Assessment; Learning Theory & Practice; Diversity; Content P D N A N/a Strategies
Teacher uses a variety of strategies? Does group membership appear flexible? Teaching strategies fit a range of learning preferences? Opportunities for students to explain & show? Questions or tasks that require analysis, evaluation, or
synthesis? Materials/resources are suitable for learning goals? Use of technology is appropriate? Communicates goals? Communicates directions? Communicates standards for student behavior?
P D N A N/a Use of Time Starts class on time? Gets immediately into learning tasks? Effectively paces instruction? Facilitates effective transitions? Ends class effectively?
P D N A N/a Assessment Creates opportunities for students to demonstrate their
understanding? Appears to “read” student understanding & adjust
instruction accordingly? Provides information back to students’ on their
learning? Helps students learn to assess their learning &
understanding? Has a system to keep track of student learning over
time?

REPP Evaluation Report Dec 2003
76
Standard VI: Learning Environment
Skill, Knowledge, or Disposition Notes & Evidence
P D N A N/a Teacher-Student Relationship Classroom climate invites students to learn? Demonstrates genuine caring about students? Appear fair & even-handed in dealing with students? Uses humor appropriately & effectively?
P D N A N/a Student-Student Relationships Teacher creates opportunities for social interaction among
students? Teaches students to work cooperatively?
P D N A N/a Classroom Management High expectations for student t behavior are set & enforced? Uses a variety of strategies to address student off-task behavior?
Effectively uses voice, facial expressions, movement, and body language to cue student appropriate behavior?
Arranges physical environment to minimize inappropriate behavior?
Atmosphere of class is inclusive & safe?
Standard VIII: Professionalism Maintains high professional ethics?
Maintains positive attitude toward students, colleagues, community?
Standard VII: Family & Community Involvement Attempts to involve family or community in lesson at any stage –
planning, instruction, assessment?
.

REPP Evaluation Report Dec 2003
77
APPENDIX C. REPP GRADUATE SURVEY RESULTS, 2003 The Institute of Social and Economic Research at the University of Alaska Anchorage is working with the REPP program to help evaluate how well the program is working and to recommend improvements for future years. We would like to ask you a few questions about your experiences with REPP, and how well you feel that it prepared you for your current teaching job.
Your participation is critical but, of course, entirely voluntary. You may refuse to answer any or all questions. Data from these interviews will be kept at ISER and will be destroyed at the conclusion of the project. No information that would identify you will be included in any reports.
School-University Connections SU1. How well coordinated was what you were learning in your readings and other instruction from the
University with your experience teaching in your school? (Check one.)
3 Very well coordinated – methods course supported my teaching 15 Somewhat coordinated – methods course somewhat supportive of my teaching 3 Not well coordinated – methods course provided little support for my teaching 1 Uncoordinated – no relation between methods course and my teaching
SU2. What proportion of the time did you feel like your university FIR and mentor teacher were sending you the same message about what is good teaching practice? (Check one.)
11 100% of the time – my university instructors and supervising teacher(s) consistently shared a vision of good teaching
9 75% of the time – most of the time my university instructors and supervising teacher(s) shared a vision of good teaching
3 50% of the time – about half the time my university instructors and supervising teacher(s) shared a vision of good teaching
0 25% of the time – rarely did my university instructors and supervising teacher(s) share a vision of good teaching
0 0% of the time – my university instructors and supervising teacher(s) never shared a vision of good teaching

REPP Evaluation Report Dec 2003
78
Topic Evaluation Below is a list of 22 topics that were covered over the course of your teacher preparation program. Please rate how much you feel that you learned about each of these topics from the program as a whole. For each item, please tell me whether you feel the program taught you a lot, some, not much, or nothing about it. A Not Lot Some Much Nothing
OPa. Planning instruction/lesson planning ..............................14 8 1 1
OPb. Developing curriculum ....................................................5 9 8 2
OPc. Incorporating local knowledge in the curriculum.............12 8 4 0
OPd. Managing the classroom.................................................8 11 5 0
OPe. Meeting the individual learning needs of students .........12 10 2 0
OPf. Teaching specific curriculum content ..............................9 10 5 0
OPg. Grading student work......................................................7 12 4 1
OPh. Assessing or evaluating student learning.......................8 10 6 0
OPi. Using multiple teaching strategies ...................................11 10 2 0
OPj. Non-teaching responsibilities at the school .....................6 9 5 4
OPk. Assisting students with problems....................................4 13 6 1
OPl. Working with parents .......................................................7 8 9 0
OPm. Working with other teachers ..........................................5 12 7 0
OPn. Working with the principal...............................................6 9 8 1
OPo. Using computer technology to plan instruction...............4 8 11 1
OPp. Using computer technology during instruction ...............1 9 13 1
OPq. Using computer technology to find information
& resources for instruction .................................................2 10 10 2
OPr. Teaching bilingual or language minority students ..........4 11 8 1
OPs. Teaching special needs students ...................................5 9 8 2
OPt. Teaching reading .............................................................6 9 7 2
OPu. Teaching writing..............................................................5 11 7 1
OPv. Teaching students from diverse cultural backgrounds 10 12 2 0

REPP Evaluation Report Dec 2003
79
Alaska Standards Below are the Alaska Standards for Teachers. For each, please circle the number that best indicates how well you feel the teacher education program has prepared you to meet the standard.
Alaska Standards for Teachers How well did the program prepare you?
Circle one for each row Very
Well Pretty Well
Not Well Poorly
AS1. A teacher can describe the teacher’s philosophy of education and demonstrate its relationship to practice. 13 11 0 0
AS2. A teacher understands how students learn and develop, and applies that knowledge in the teacher’s practice.
11 11 2 0
AS3. A teacher teaches students with respect for their individual and cultural characteristics. 17 6 1 0
AS4. A teacher knows the teacher’s content area and how to teach it. 9 12 2 1
AS5. A teacher facilitates, monitors, and assesses student learning. 11 10 3 0
AS6. A teacher creates and maintains a learning environment in which all students are actively engaged and contributing members.
11 11 2 0
AS7. A teacher works as a partner with parents, families, and with the community. 7 14 3 0
AS8. A teacher participates in and contributes to the teaching profession. 8 13 3 0

REPP Evaluation Report Dec 2003
80
General Comments We’d like to get your view of the program: what do you think we need to know? What works, what doesn’t, how could we make the program better? F7. Where do you see yourself in five years?
I would like to be either a principal or a special education administrator. principal Either being a principal or teacher in the classroom. I see myself working at my current school and should be actively seeking administrative credentials if I do not already
have them. Teaching in my hometown. Working towards a Masters degree or a second degree. Teaching in an elementary or middle school classroom. Hopefully starting or in the process of getting my Master's degree. I'm thinking of getting my masters in counseling and trying to become a school counselor. In the meantime, I'm very
happy and challenged doing what I am doing. Still teaching. Working towards a master's degree Teaching K-8, with a reading endorsement - probably a practicing reading specialist and working on a masters in
curriculum development. Still teaching teaching part time with 2 kids, hopefully Hopefully teaching full time Teaching grades 4-5 in rural AK. I see myself still as a bilingual or immersion teacher of Cupik Teaching elementary level in (current) school Teaching Finishing a career where I always tried to do right by kids. Either teaching or volunteering with the school I would like to be teaching high school L.A. in a school whose curriculum I feel is progressive. Teaching (language) in an immersion school Moving to Europe and teaching in charter schools. I want to continue teaching but in a place where the students are closer
to grade level. Probably moving to the road system to teach high school science. That is our family's plan. I see myself either exiting the teaching field due to lack of benefits and non-competitive salaries, or receiving a master's
degree and moving to college program I don't know; my hearing is diminishing, also my vision.

REPP Evaluation Report Dec 2003
81
F8 Where do you see yourself in 20 years?
superintendent I wish to be an administrator at my current school. Eventually I would like to work in the area of curriculum development for rural AK schools. still in education. Classroom teaching, possibly teaching secondary math. teaching, most likely, but not sure it I'll remain in my specialty of Gifted Education or go to standards management or
classroom. We'll see. Teaching in a specific field, either in middle school or other area. Hopefully a master teacher with tons of experience and
a great classroom. Teaching in a classroom. Special education background. Either still teaching or retired, but still contributing my knowledge or skills in the bilingual or immersion classroom Having received my PhD from Harvard - my dissertation on imbedded racism gets raving reveiws and I am famous. In (current community). Retired, probably having written a book, spending time with my family hunting and fishing. Retired. My goal is to work hard and retire to a house built in rural Washington state. If I am involved in the education
process it will be limited to a consultant type role. The other possibility is moving into higher education and teach teachers how to teach.
Looking forward to retirement. In Mexico and retired! Enjoying traveling and grandchildren. Living in (current community), volunteering and being a Mom, maybe grandmother! Close to retiring. Getting ready to retire. Retired… possibly still working because I will not receive medical insurance after retirement. Retired, I'm 60 years old. Gone, maybe. Retired, I may teach in a full-time classroom another 8 years maybe retire at 65 if my energy level and health is
maintained. Retired Retired Retired No idea
G4. Is there anything you would like to add that would help us understand your experience in learning to teach?
I strongly believe that REPP better prepared me to teach in our state and its unique conditions far better than the university could have. I have since served as a REPP mentor and encouraged our district to accept two REPP interns in the past two years. Not only did the program prepare me to teach, but it helped lay the groundwork for being a good school leader and led to my role as head teacher and participation in the ed leadership program.
My participation in the REPP program was a positive learning experience. That experience prepared me to be successful in my own classroom. I feel I wouldn't hae been ready to teach with only one semester of student teaching. Having a mentor teacher is an invaluable asset and wealth of information to guide me in the right path.
I found the entire experience very rewarding and helpful. I learned so much by being in the classroom every day all day. More than I would think I could learn by taking classes only. By the end of the year in REPP, I was excited and I felt prepared to have my own classroom. Since then I have never felt that I was lacking skills or experience in my training. I thought it was a wonderful program.
This is a great and valuable program. Teaching is a very difficult and under respected profession. I feel this program gave me the greates chance to succeed in a profession where most quit after the first couple of years. You may think you know how to teach coming out of college. It is a whole different story once in the classroom. This program allows you to go into the classroom with others you can go to with questions and concerns. I would suggest lowering the paperwork and increasing the interactions between REPP student and mentor and University rep. This allows for the REPP person to talk about and ask questions related directly to their experience.
I thoroughly enjoyed my student teaching experience. My mentor teacher was open, supportive, and I believe that makes a difference. What I wish I had received was more instruction on how to teach reading. More exposure to different types of rubrics and assessment techniques would have been good as well.

REPP Evaluation Report Dec 2003
82
The only thing that I realized I lacked experience in was assessing and issuing grades for individual assignments and report cards. I particularly appreciate having the benefit of three mentor teachers. Each one was different, but effective and I see my own teaching style reflecting all three mentor teachers.
One particular element I felt was not addressed well in the program was teaching strategies that help students learn equitably. Like teacher wait time, proximity to students, gender equality, etc. I took a course called TESA, teacher expectations student achievement that addressed many of these issues.
Record keeping of student attendance and grades. End of year inventory, paperwork, etc. Work with parents and community.
I have been assigned as a mentor teacher for a current REPP enrollee. Because of this I have seen an incredible positive restructuring of the program (just in the last few years) to better meet the needs of these teachers to be. The REPP people took the concerns and suggestions for improvement from "my" class and have incorporated those ideas to make an even better program than I attended. Since this evaluation is yearly, the program will soon be one of the best teacher prep programs available.
I am very glad about the REPP program. The REPP program allowed me to show my teacher education that I have gained is going to college getting my BS and Master's degree in special education. I was able to finish the one-year course in five months with and through the REPP program. Thank you very much.
My recommendation would be the course offering be a whole year instead of a semester. It seems one just gets their feet wet in a semester.
It is a never ending process. Teacher education programs can shove us in the right direction, but so much is learned on the job. Teaching is hard, challenging, and sometimes depressing. Preparation programs should be more realistic and prepare teachers for the realities of the profession.
Learning to teach paves the way for every teacher's first year of teaching. The experience of a teacher's first year probably is the main reason for a successful, long teaching career.
I feel I learned from the different parts of my entire experience, which include my background at UAF, the REPP program and working with my mentor.
We need to ensure that teachers in this program will remain qualified under NCLB - ie have specialties and abilities to pass Praxis exam re high quality. Keep the no-summer aspect of this program so we can continue getting rural Alaskans.
I've been lucky to have great mentor teachers and friends. Parents and student reactions have helped. Having a biologist husband in the background to explain things, these and people have given my best education.
I have been developing over the years in my field. I teach best when I am comfortable in my space and what I teach, I.e., teaching what I went to college for, Cupik/Yupik Eskimo - that was my degree in college. Keeping up on what is going on in other places, by going to conferences or keeping in contact w/ people who are in the same field. Always look for ways to improve the learning of students by involving them.
That a lot of the theories taught in textbooks really do not apply because they cycle through. Every five years new buzz words just cycle through. Authentic assessment, integrated curriculum and standards are too idealistic. Funding and dealing with shrinking budgets, larger classes and high stakes exit exams are the reality.
I think that the most important part of my success was that I had an excellent and very supportive mentor teacher. I still have a working relationship with him and continue to receive positive advice and enjoy the professional relationship with him.
As I have stated before, I believe it was enough for a beginning teacher as long as you have the University professor partnership. Learning to teach like anything in life is a life long process. Process such as this enhances the evaluation of REPP program candidates and compares with other teacher ed programs.
"I have not failed. I've only discovered 10,000 ways that do not work." -Thomas Edison I used the REPP program as a means to attain a secondary endorsement in (language). It helped me jump through some
hoops without formally going back to school for 4 years. I would like to work on assessments with emphasis on mastery. I would like to understand theme building and integrating
curriculum core areas. I need to study more of the sheltered instruction observation protocol - model for developing lesson plans for ELL students. I would like to study more children's literature and teaching a literature-based program - developing a whole language-learning center-writing, reading workshop.
Thank you again for taking the time to answer this evaluation!!