Embed Size (px)
Citation preview
Rural and Small Town Canada Analysis Bulletin, Vol. 1, No. 1 Catalogue no. 21-006-XIE
RURAL AND SMALL TOWN POPULATION IS GROWING IN THE 1990s
Robert Mendelson and Ray D. Bollman
HIGHLIGHTS
♦ Overall, Canada’s rural and small town population has grown in each intercensal period since 1976.
♦ Rural and small town growth rates vary widely among the provinces.
♦ Much of the growth within rural and small town areas is in the small towns.
♦ Sub-provincial data show wide regional differences within each province.
♦ However, population growth has been higher in ‘larger urban centres’.
♦ Thus, the share of Canada’s population living in rural and small town areas has declined from 34 percent in 1976 to 22 percent in 1996.
♦ Newfoundland is the only province with over 50 percent of its population living in rural andsmall town areas.
Welcome to the first Rural and Small Town Canada Analysis Bulletin
Statistics Canada is launching an occasional bulletin series to document the structure and trends in rural Canada.The objective is to provide baseline information for national and provincial discussions of rural issues and toprovide a baseline with which local communities can compare their situation.
Future bulletin topics will include an analysis of employment and unemployment trends, an overview of ruralyouth, the nature of businesses in smaller communities and the rate of migration to and from rural and small townCanada.
Please complete the enclosed postcard evaluation or directly contact the editor at the address listed on page 2.
2 Statistics Canada - Catalogue no. 21-006-XPB
Rural and Small Town Canada Analysis Bulletin, Vol. 1, No. 1
Rural and Small Town CanadaAnalysis Bulletin
ISSN 148-0956
Editor:Ray D. Bollman([email protected])Tel.: (613) 951-3747Fax: (613) 951-3868
Published in collaboration with TheRural Secretariat, Agriculture andAgri-Food Canada. The Rural andSmall Town Canada Analysis Bulletinis an occasional publication of theAgriculture Division of StatisticsCanada. It is available without chargeat www.statcan.ca.
Special thanks to: Heather Clemenson,Cindy Heffernan, Roland Beshiri,Michael Brancati and Lucie Pilon.
Published by authority of the Ministerresponsible for Statistics Canada.© Minister of Industry, 1998.
All rights reserved. No part of thispublication may be reproduced, storedin a retrieval system or transmitted inany form or by means, electronic, me-chanical, photocopying, recording orotherwise without prior written permis-sion from:Pricing and Licensing Section, Marke-ting Division, Statistics Canada,Ottawa, Ontario, Canada, K1A 0T6
Note of Appreciation
Canada owes the success of its statisti-cal system to a long-standing partner-ship between Statistics Canada, thecitizens of Canada, its businesses,governments and other institutions.Accurate and timely statistical infor-mation could not be produced withouttheir continued cooperation and good-will.
Definition of “Rural and Small Town” Canada
In this bulletin, “Rural and Small Town” (RST) Canada refers tothe population living outside the commuting zones of largerurban centres—specifically, outside Census Metropolitan Areas(CMAs) and Census Agglomerations (CAs). A CMA has anurban core of 100,000 or over and includes all neighbouringmunicipalities where 50 percent or more of the work forcecommutes into the urban core. A CA has an urban core of10,000 to 99,999 and includes all neighbouring municipalitieswhere 50 percent or more of the work force commutes into theurban core. Thus, RST Canada represents the non-CMA andnon-CA population. It includes all the residents outside thecommuting zones of larger urban centres. Only a small shareof these residents live on farms.
Introduction
Rural development discussions typically start with thefollowing demographic questions:
1. How many people live in rural and small townareas?
2. Is this population growing or declining?
The objective of this bulletin is to provide anoverview of the structure and trends of Canada’s ruraland small town population.
Rural and small town Canada continuesto grow
In Canada, rural and small town (RST) areas experi-enced a growing population from 1976 to 1996.When viewed within constant boundaries, there was a3 percent increase from 1986 to 1991, followed by a4 percent increase from 1991 to 1996 (Figure 1). Notethat each line segment in Figure 1 has a positive slope.
However, when the reclassification of boundaries istaken into account (i.e., when areas and people arereclassified from RST to larger urban centres),Canada’s RST population was 18 percent smaller in1996 compared with 1976. (In Figure 1, the 1996result is lower than the initial value for 1976.)

Statistics Canada - Catalogue no. 21-006-XPB 3
Rural and Small Town Canada Analysis Bulletin, Vol. 1, No. 1
A wide variation in rural and small town growth rates amongthe provinces
From 1976 to 1996, three patterns appeared evident (Table 1):
1. Alberta, Ontario and Manitoba reported positive (although sometimes negligible) ruraland small town population growth in each of the past four intercensal periods.
2. Four provinces (New Brunswick, Prince Edward Island, Nova Scotia and Manitoba) weregenerally stable, with either small increases or small decreases.
How to read Figure 1
The Census of Population in 1976 counted 7.7 million people living in rural and small townCanada. The boundaries for Census Metropolitan Areas (CMAs) and Census Agglomerations(CAs) were redrawn for the 1981 Census of Population. According to the 1981 boundaries, therewere only 6.8 million people living in rural and small town Canada in 1976. The line segmentjoining 1976 and 1981 shows the change in rural and small town population according to the(constant) 1981 boundaries. Similar boundary changes were made in each subsequent census.Each line segment has a positive slope indicating that, for Canada as a whole, the rural and smalltown population is growing. However, we end up with fewer rural and small town Canadiansbecause of the classification of some municipalities into CMAs and CAs over time.
0
1
2
3
4
5
6
7
8
9
1976 1981 1986 1991 1996
Figure 1Population is growing in rural and small town Canada1
1 Rural and small town Canada refers to the population outside Census Metropolitan Areas (CMAs) and Census Agglomerations (CAs).Source: Statistics Canada. Census of Population, 1976 to 1996.
Population (millions)

4 Statistics Canada - Catalogue no. 21-006-XPB
Rural and Small Town Canada Analysis Bulletin, Vol. 1, No. 1
3. Newfoundland and Saskatchewan reported a declining rural and small town population ineach intercensal period since 1981. Their growth ranked at the bottom in the high growthperiod of 1976 to 1981.
In the 1991 to 1996 period, British Columbia and Alberta reported rural and small towngrowth rates that were over double the Canadian average.
Table 1
Between 1991 and 1996, the largest growth in rural and small town populationwas in British Columbia
Small towns are generally growing at the expense of the rural countryside
A shift in the population towards the small towns is evident in most rural and small townareas. Between 1991 and 1996, small towns (with a population of 1,000 to 9,999) in the RSTareas increased at a rate of 7 percent. This increase was 6 percentage points greater than therest of the RST area population (i.e., the population in the countryside outside centres of1,000 or more).
1976-1981 1981-1986 1986-1991 1991-1996
percent change in population in rural and small town1 areas
Newfoundland 0.5 Newfoundland -0.3 Newfoundland -3.0 Newfoundland -5.1
Prince Edward Island 1.9 Prince Edward Island 1.2 Prince Edward Island -0.2 Prince Edward Island 2.4
Nova Scotia 1.9 Nova Scotia 2.7 Nova Scotia 0.5 Nova Scotia -0.6
New Brunswick 3.5 New Brunswick 1.7 New Brunswick -0.2 New Brunswick 1.3
Quebec 5.9 Quebec -0.7 Quebec 1.6 Quebec 3.5
Ontario 3.0 Ontario 0.9 Ontario 9.3 Ontario 4.7
Manitoba 0.2 Manitoba 0.4 Manitoba 0.5 Manitoba 4.4
Saskatchewan 1.3 Saskatchewan -1.0 Saskatchewan -6.9 Saskatchewan -2.0
Alberta 22.0 Alberta 2.5 Alberta 3.1 Alberta 7.8
British Columbia 17.0 British Columbia -0.4 British Columbia 7.2 British Columbia 12.8
Canada 6.7 Canada 0. 5 Canada 2.9 Canada 3.8
1 Rural and small town refers to the population outside Census Metropolitan Areas (CMAs) and outside Census Agglomerations (CAs).Source: Statistics Canada. Census of Population, 1976 to 1996.
Statistics Canada - Catalogue no. 21-006-XPB 5
Rural and Small Town Canada Analysis Bulletin, Vol. 1, No. 1
Provincial differences in terms of RST population patterns fall into three categories:
1. RST population increase—in Prince Edward Island, New Brunswick, Quebec, Albertaand British Columbia, there was an increase in both the small towns and rural areas.
2. Small town increase and a rural area population decrease—in Newfoundland, Ontario andManitoba.
3. RST population decrease—in Nova Scotia and Saskatchewan, population decreased inboth the small towns and rural areas.
The first two categories represent increases in small town population. British Columbia hadthe greatest increase (+23 percent) in small town population.
Sub-provincial data show wide regional differences
The sub-provincial data for 1991-1996 showed contrasts in the Atlantic provinces. Withinevery census division (CD) in Newfoundland, the RST population declined (Table 2). Thiscontrasts with Prince Edward Island where the RST population increased in every CD.New Brunswick saw 64 percent of its CDs gain RST population, while 36 percent lost RSTpopulation. Nova Scotia had almost the opposite with 71 percent of its CDs losing RSTpopulation and 29 percent gaining RST population.
Quebec and Ontario experienced similar trends. In Ontario, 91 percent of the CDs had RSTpopulation gains, whereas, Quebec was less notable with only 62 percent.
In the West, a high share of CDs in both Alberta and British Columbia experienced gains intheir RST population: Alberta with 95 percent, and British Columbia with 92 percent.Manitoba’s CDs also had RST population gains, but it was a more moderate 73 percent. OnlySaskatchewan had a decline in RST population in a majority of its CDs—72 percent of theCDs lost RST people.

6 Statistics Canada - Catalogue no. 21-006-XPB
Rural and Small Town Canada Analysis Bulletin, Vol. 1, No. 1
Table 2
In British Columbia, Alberta, Ontario and Prince Edward Island, over90 percent of census divisions reported increases in
rural and small town population, 1991 to 1996
Census divisions where the rural andsmall town component:
Declined Grew Total1
number of census divisions2
Newfoundland 10 0 10
Prince Edward Island 0 3 3
Nova Scotia 12 5 17
New Brunswick 5 9 14
Quebec 33 53 86
Ontario 4 39 43
Manitoba 6 16 22
Saskatchewan 13 5 18
Alberta 1 18 19
British Columbia 2 23 25
Canada3 86 171 257
percent distribution of census divisions2
Newfoundland 100 0 100
Prince Edward Island 0 100 100
Nova Scotia 71 29 100
New Brunswick 36 64 100
Quebec 38 62 100
Ontario 9 91 100
Manitoba 27 73 100
Saskatchewan 72 28 100
Alberta 5 95 100
British Columbia 8 92 100
Canada3 33 67 100
1 Total census divisions with some rural and small town population in 1996.2 Census division (CD) is the general term applied to areas established by provincial law that are intermediate geographic areas between the municipality and the province. CDs represent counties, regional districts and regional municipalities. In Newfoundland, Manitoba, Saskatchewan and Alberta, provincial law does not provide for these administrative geographic regions. Therefore, CDs have been created by Statistics Canada in co-operation with these provinces for the dissemination of statistical data.3 Does not include the Yukon or Northwest Territories.Source: Statistics Canada. Census of Population, 1991 and 1996.

Statistics Canada - Catalogue no. 21-006-XPB 7
Rural and Small Town Canada Analysis Bulletin, Vol. 1, No. 1
Map illustrates wide variation within each provinces
The Yukon and Northwest Territories are not discussed in the tables. However, an analysis ofthe map (at the end of this bulletin) shows strong growth across the North in the RSTcomponent of the total population.
The map shows considerable variability in RST population growth within each province. Forexample, in British Columbia, the heaviest RST population growth took place on lowerVancouver Island, the lower Fraser Valley, in south-central and central British Columbia andin the Okanagan Valley. On the other hand, the RST population declined near Williams Lakeand Quesnel.
In Alberta, the largest RST population increase took place around the Calgary CMA. InManitoba, the heaviest RST growth was around the Winnipeg CMA. In Saskatchewan, thelargest RST declines were in eastern and south-central Saskatchewan.
In Ontario, the largest RST population growth was outside the Windsor CMA, north of theToronto CMA, outside the Ottawa CMA and outside the Kingston CA. RST growth inQuebec was greatest in the census divisions north of the Montréal CMA. Many censusdivisions in the Gaspé region and some census divisions between Québec City and Montréalrecorded declining RST populations.
Declining share of rural and small town population in Canada
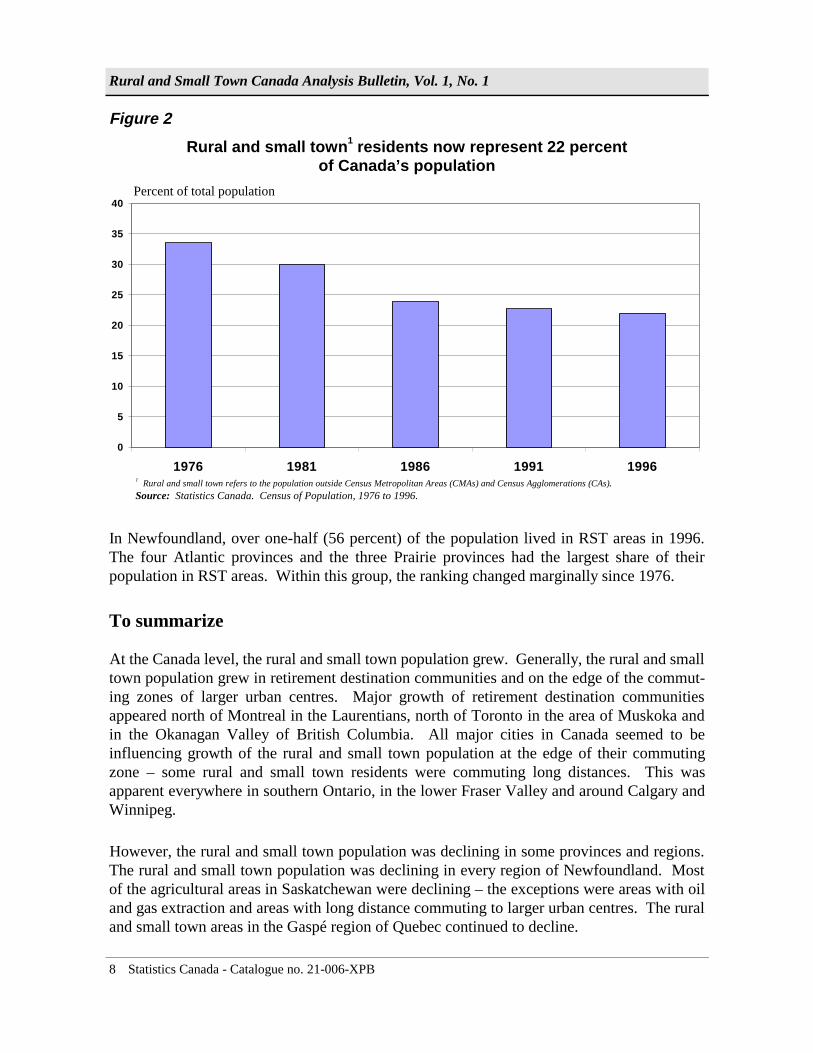
Despite a growing population in RST in every intercensal period since 1976, reclassificationcombined with a higher growth in larger urban centres means that the share of Canada’spopulation living in RST areas continues to decline. The share of Canada’s population livingin RST areas declined to 22 percent in 1996 from 34 percent in 1976 (Figure 2).
This decrease of RST population share was most pronounced in British Columbia andPrince Edward Island—both provinces dropped by -21 percentage points. British Columbiadropped from 37 percent to 16 percent and Prince Edward Island dropped from 67 percent to46 percent. In Saskatchewan, the drop was -20 percentage points, from 63 percent to43 percent. Alberta dropped -16 percentage points, from 42 percent to 26 percent.
8 Statistics Canada - Catalogue no. 21-006-XPB
Rural and Small Town Canada Analysis Bulletin, Vol. 1, No. 1
In Newfoundland, over one-half (56 percent) of the population lived in RST areas in 1996.The four Atlantic provinces and the three Prairie provinces had the largest share of theirpopulation in RST areas. Within this group, the ranking changed marginally since 1976.
To summarize
At the Canada level, the rural and small town population grew. Generally, the rural and smalltown population grew in retirement destination communities and on the edge of the commut-ing zones of larger urban centres. Major growth of retirement destination communitiesappeared north of Montreal in the Laurentians, north of Toronto in the area of Muskoka andin the Okanagan Valley of British Columbia. All major cities in Canada seemed to beinfluencing growth of the rural and small town population at the edge of their commutingzone – some rural and small town residents were commuting long distances. This wasapparent everywhere in southern Ontario, in the lower Fraser Valley and around Calgary andWinnipeg.
However, the rural and small town population was declining in some provinces and regions.The rural and small town population was declining in every region of Newfoundland. Mostof the agricultural areas in Saskatchewan were declining – the exceptions were areas with oiland gas extraction and areas with long distance commuting to larger urban centres. The ruraland small town areas in the Gaspé region of Quebec continued to decline.
0
5
10
15
20
25
30
35
40
1976 1981 1986 1991 1996
Figure 2
Rural and small town1 residents now represent 22 percentof Canada’s population
1 Rural and small town refers to the population outside Census Metropolitan Areas (CMAs) and Census Agglomerations (CAs).Source: Statistics Canada. Census of Population, 1976 to 1996.
Percent of total population
Statistics Canada - Catalogue no. 21-006-XPB 9
Rural and Small Town Canada Analysis Bulletin, Vol. 1, No. 1
How to read the map.
This map only considers the rural and small town (RST) population in a census division (CD). Theshading in each CD indicates the size of the change in the RST population component only. In afew cases, the RST population increased between 1991 and 1996, but the CMA/CA population inthe same CD decreased more, leaving a net decrease in the overall population. Two examples areSaskatchewan census division number 12 and Gloucester County in New Brunswick where thelarger urban centre (North Battleford and Bathurst, respectively) in the census division declined bymore than the RST population increased. For a map of the change in the total population withineach census division, refer to page 12 of A National Overview: Population and DwellingCounts (Ottawa: Statistics Canada Cat. No. 93-357). Thus, we present here the change in onlythe RST population within each CD.
Although there was an overall increase in the number of people, the share of Canada’spopulation living in rural and small town areas was declining. The two main reasons were:
1. The population of larger urban centres was growing faster.
2. Over time, some rural and small town areas were reclassified into the commuting zone oflarger urban centres.
Thus, Canada’s rural and small town population now represents only 22 percent of the totalpopulation.
However, the rural and small town population represented a significant share of the popula-tion in six provinces. Newfoundland was the only province with more than 50 percent of itspopulation living in rural and small town areas. Each of the other Atlantic provinces plusSaskatchewan and Manitoba had over one-third of their population residing in rural and smalltown areas.
This paper presents a broad summary of rural and small town population trends. Within eachprovince and within each sub-provincial region, there was a wide diversity of patterns ofpopulation growth and decline. Small towns such as St. Brieux, Saskatchewan or Winkler,Manitoba or St. Clement and Coaticook in Quebec were examples of growth in places wheremany neighbouring places were declining.
For background details, refer to the working paper: Rural and Small Town Population isGrowing in the 1990s (Ottawa, Statistics Canada, Agriculture and Rural Working Paper No. 36,Cat. No. 21-601-MPE98036). To order, phone the Agriculture Division of Statistics Canada at1 800 465-1991 or the Regional Reference Centre at 1 800 263-1136. Robert Mendelson maybe contacted at (613) 951-5385 ([email protected]) and Ray Bollman at (613) 951-3747([email protected]).
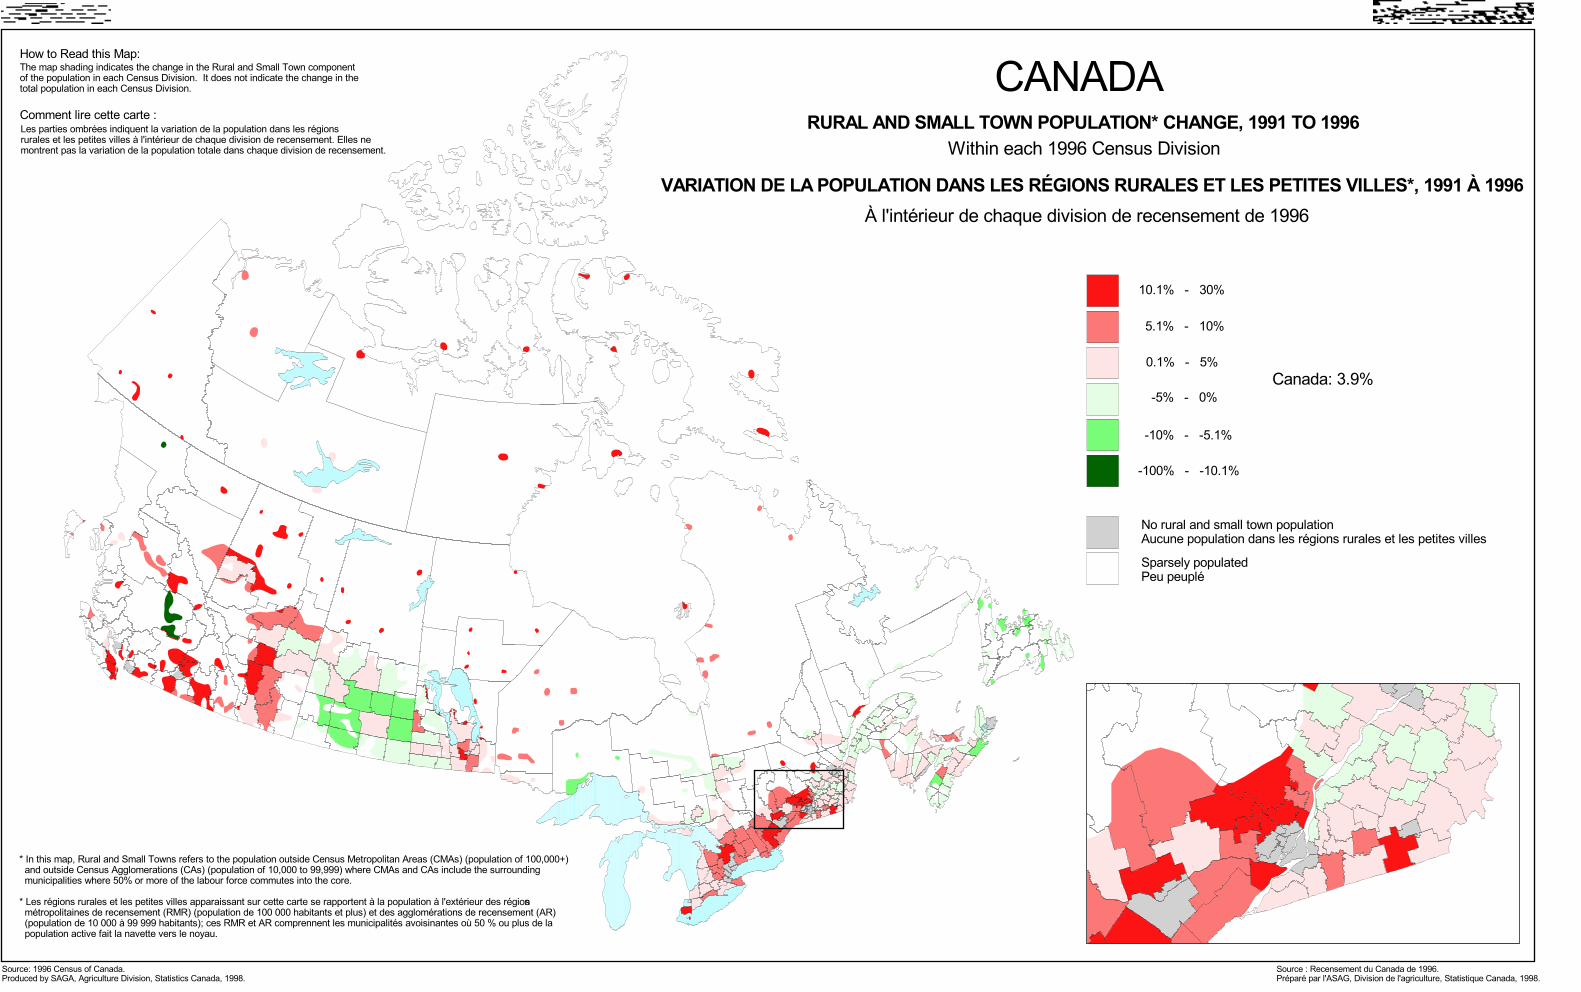
Within each 1996 Census DivisionRURAL AND SMALL TOWN POPULATION* CHANGE, 1991 TO 1996
CANADA
VARIATION DE LA POPULATION DANS LES RÉGIONS RURALES ET LES PETITES VILLES*, 1991 À 1996À l'intérieur de chaque division de recensement de 1996
* In this map, Rural and Small Towns refers to the population outside Census Metropolitan Areas (CMAs) (population of 100,000+) and outside Census Agglomerations (CAs) (population of 10,000 to 99,999) where CMAs and CAs include the surrounding municipalities where 50% or more of the labour force commutes into the core.
* Les régions rurales et les petites villes apparaissant sur cette carte se rapportent à la population à l'extérieur des régions métropolitaines de recensement (RMR) (population de 100 000 habitants et plus) et des agglomérations de recensement (AR) (population de 10 000 à 99 999 habitants); ces RMR et AR comprennent les municipalités avoisinantes où 50 % ou plus de la population active fait la navette vers le noyau.
Source: 1996 Census of Canada.Produced by SAGA, Agriculture Division, Statistics Canada, 1998.
Source : Recensement du Canada de 1996.Préparé par l'ASAG, Division de l'agriculture, Statistique Canada, 1998.
No rural and small town populationAucune population dans les régions rurales et les petites villes
Canada: 3.9%
10.1% - 30%
0.1% - 5%
-5% - 0%
-10% - -5.1%
-100% - -10.1%
5.1% - 10%
Sparsely populatedPeu peuplé
The map shading indicates the change in the Rural and Small Town componentof the population in each Census Division. It does not indicate the change in thetotal population in each Census Division.
How to Read this Map:
Comment lire cette carte :Les parties ombrées indiquent la variation de la population dans les régionsrurales et les petites villes à l'intérieur de chaque division de recensement. Elles nemontrent pas la variation de la population totale dans chaque division de recensement.

Source: 1996 Census of Canada.Produced by SAGA, Agriculture Division, Statistics Canada, 1998.
Source: Recensement du Canada de 1996.Préparé par l'ASAG, Division de l'agriculture, Statistique Canada, 1998.
Variation de la Population dans les Régions Rurales et les Petites Villes*, 1991 à 1996À l'intérieur de chaque division de recensement de 1996
CANADARural and Small Town Population* Change, 1991 to 1996
Within each 1996 Census Division
* In this map, Rural and Small Towns refers to the population outside Census Metropolitan Areas (CMAs) (population of 100,000+) and outside Census Agglomerations (CAs) (population of 10,000 to 99,999) where CMAs and CAs include the surrounding municipalities where 50% or more of the labour force commutes into the core.
* Les régions rurales et les petites villes apparaissant sur cette carte se rapportent à la population à l'extérieur des régions métropolitaines de recensement (RMR) (population de 100 000 habitants et plus) et des agglomérations de recensement (AR) (population de 10 000 à 99 999 habitants); ces RMR et AR comprennent les municipalités avoisinantes où 50 % ou plus de la population active fait la navette vers le noyau.
No rural and small town populationAucune population dans les régions rurales et les petites villes
Canada: 3.9%
10.1% - 30%
0.1% - 5%
-5 % - 0%
-10 % - -5.1%
-100 % - -10.1%
5.1% - 10%
The map shading indicates the change in the Rural and Small Towncomponent of the population in each Census Division. It does not indicatethe change in the total population in each Census Division.
How to Read this Map:
Comment lire cette carte :Les parties ombrées indiquent la variation de la population dans les régionsrurales et les petites villes à l'intérieur de chaque division de recensement.Elles ne montrent pas la variation de la population totale dans chaquedivision de recensement.

Source: 1996 Census of CanadaSource: Recensement du Canada de 1996
Produced by the Geography Division, Statistics Canada, 1997Préparé par la division de la géographie, Statistique Canada, 1997.
.
+30%
+20%
+5%
0%
-5%
-10%
-40%
Canada: 5.7%
Sparsely populatedPeu peuplé
CANADAPopulation Change, 1991 and 1996 Censuses
By 1996 Census Division
Variation de la population, recensement de 1991 et 1996Par division de recensement de 1996