Embed Size (px)
Citation preview
1
1. Background The profound development challenges in Papua and West Papua are well documented. The Human Development Indices rankings for Tanah Papua are amongst the lowest in Indonesia and poverty rates are considerably higher than the national average. Within the two provinces there are inequities between socio-economic groups, urban and rural dwellers as well as indigenous and nonindigenous groups. Inequity is concentrated in the highlands where the population is predominantly indigenous. Indigenous children in rural and remote areas remain severely disadvantaged and almost 50 percent of over 5 year olds in rural areas of Papua province have never attended school, compared with 5 percent in urban areas (IDHS, 2012).1 Education opportunities have only modestly expanded in Papua and West Papua in recent years. Data from the 2011 Multiple Indicator Cluster Survey (MICS)2 and the 2012 Indonesian Demographic and Health Survey (IDHS) indicate that there remain significant equity gaps across Papua and West Papua based on geographic distribution, wealth, urban vs. rural, and indigenous vs. non-indigenous divisions. In general, children in rural areas face significant obstacles to accessing effective education services. Although data is enduringly difficult to collect and validate, the low level of student enrolments is likely linked to the weak pedagogical knowledge of teachers, poor quality of teaching and presence of corporal punishment, and the associated low value attached to schooling by students and parents. The baseline findings drew attention to high illiteracy rates in Papua and West Papua (UNICEF, 2014).3 While West Papua illiteracy rate at 12 percent is less than Papua at 37 percent both are far above the Indonesian figure of 8 percent4. Disparities in literacy rates are marked between urban and rural Papuans with illiteracy in rural areas (49 percent) much higher than in urban areas (5 percent). The literacy disparities become more pronounced the further away the population is from urban centres and from education service delivery. Disparities are most pronounced in the highland districts where rates of illiteracy range from 48 percent to 92 percent (ibid). Governments in the two provinces have been implementing the Special Autonomy Law and have launched various programmes5 in education, health and economy with particular emphasis on minimising the gap in rural and remote areas where most indigenous Papuans live. These endeavours have exposed the limited capacity within Government to bring about lasting change but also increased receptivity to technical assistance. The Ministry of Education and Culture, which has launched the School Literacy Programme to improve the reading skills of Indonesian children, is now showing increased interest in the pilot initiative being implemented in Papua and West Papua.
1 Indonesia Demographic and Health Survey, Badan Pusat Statistik, 2012. 2 Multiple Indicator Cluster Survey in Selected Districts of Papua and Papua Barat, UNICEF 2011. 3 Baseline study report for Rural and Remote Education Initiative for Papuan Provinces, UNICEF, 2014. 4 BPS, 2010 5 The Government in Papua has been more active in this regard.
2
More than 70 percent of the Papuan and West Papuan population lives in 3600 villages and 90 percent of these villages are in remote areas (ACDP, 2014).6 Only 77 percent of village students enrol in primary school (ibid). Schools are perceived as rigid when dealing with problems that parents face, and there is limited communication between parents and teachers. For the most part teachers do not to appear to build close relationships with their students and children have reported being afraid of their teachers and the punishment methods. Parents and communities are rarely involved in school management or children’s learning processes either in school or at home. For poor indigenous rural families, education is not yet a social norm. For families for whom livelihood is the most immediate concern, education is not seen as providing any benefit in the short to medium term. The scarcity of jobs for educated people also reinforces the low value of education, as parents believe there is no benefit to be gained by educating their children. To address this context, the programme has been structured around two pillars implemented in a coordinated way. Local partners have been engaged to manage school based activities (pillar 1) and to engage government officials and parliamentarians to progress activities implemented in schools (pillar 2). Together, through school visits and training workshops, the programme provides opportunities for school staff, the community and government officials to engage on issues facing schools and the delivery of literacy programmes. Within this context, UNICEF, with support from the Department of Foreign Affairs and Trade (DFAT), of the Government of Australia, is implementing the Rural and Remote Education Initiative for Papuan Provinces under the Government of Indonesia (GoI) – UNICEF Country Programme of Cooperation 2016-2020. In the context of the new Country Programme Action Plan (CPAP) 2016 -2020, agreed between GoI and UNICEF in December 2015, this initiative will help achieve the outcome aimed at realising rights for all children.
2. PROGRAM OVERVIEW
2.1 Objective and intended outcomes
The overall objective (goal) of the program is to test effective and sustainable approaches for improvement of literacy outcomes in early grades in rural and remote areas of Papua and West Papua provinces. The intended impact is improved learning outcomes in reading and comprehension in early grades in rural and remote areas of Papua and West Papua. The intended end of program outcomes are:
1. Changes in female and male teachers’ behaviour and classroom practices (regular/adequate use of instructional materials in target grades)
2. Gains in grade 2 and 3 female and male students reading and comprehension skills in targeted schools
6 Rural and Remote Area Education Strategic Planning for Tanah Papua, ACDP 2014
3
3. Governments in targeted districts use program evidence and implement strategies to improve early grade literacy
The program is structured around two pillars:
4. Piloting models of delivering teacher development The strength of the design is a highly focused schedule of activities using two different models
i. Model 1 combines cluster training with school-based support and supervision provided by mobile training teams (4 trainers per cluster)
ii. Model 2 provides on-the-job training at school level provided by an experienced mentor (1 mentor per 1/2 schools)
5. Promoting evidence-based decision making i. exposing parliamentarians to challenges and opportunities for improving
learning ii. Provide technical advice for district education officials on equitable planning
and budgeting The two pillars are implemented in a coordinated way with local partners who manage school based elements (pillar 1) also engaging government officials and parliamentarians on progress of activities implemented in schools (pillar 2). The program provides opportunities through school visits (involving government officials) and training workshops for the school staff, community and government to come together and engage on issues facing the school in delivery of literacy learning.
2.2 Alignment with DFAT, GoI, UNICEF and global policies and strategies
The program is consistent with Australian and Indonesian government policy as well as UNICEF policy. It addresses Sustainable Development Goal (SDG) 4: Ensure inclusive and equitable quality education and promote life-long learning opportunities for all.
UNICEF is providing upstream support to implementation of the SDGs for children in Indonesia arguing that investments in children are the key to economic growth. UNICEF is one of the key advisors to the Government’s newly formed SDG Secretariat working with the Ministry of Planning and have supported the Government in developing monitoring framework for measuring progress to achieve the SDGs for children by 2030. DFAT’s Aid Investment Plan for Indonesia seeks to promote sustainable and inclusive economic growth and stability. One of the causes of longstanding tensions in Papua and West Papua is that the region lags behind the rest of Indonesia on the most important human development indicators. This program specifically seeks to reduce gross inequalities in education attainment by targeting rural and remote districts where there are high proportions of indigenous Papuans who have been excluded from wider development gains. Government of Indonesia policy seeks to address inequality through Presidential Instruction 5/2007 for the Acceleration of the Development of Papua and West Papua; Law on the Acceleration of Education for Indigenous Children, and Presidential Decree (no. 65, 2011) on rural, remote and isolated regions of Papua and West Papua. The program directly supports capacity for strategic planning feeding into local Renstra/Renja (meaning ‘strategy/ workplan’ in Indonesian) development in target districts and coordinates closely with BAPPEDA. For example, analysis of program evidence has provided information to the local Renstra in Papua and West Papua, reflecting issues of teacher absenteeism, distribution and teacher capacity, education financial analysis and budget allocation for quality education at district level. UNICEF Indonesia works closely with government partners in the implementation of this proposal for national ownership and sustainability. For example, all activities related to this
4
proposal are reflected in the Annual Workplans and Project Documents (“Prodocs”) reviewed and agreed by the Ministry of Planning and Ministry of Education together with UNICEF. Joint monitoring visits are regularly undertaken by the Government at national, provincial and district levels in collaboration with UNICEF to monitor progress against stated objectives and to address bottlenecks in implementation. Progress to achieve results and financial implementation are reported at national coordination forums chaired by the Government, for example the UNICEF-Government working group on education (“Education Pokja”) which meets quarterly. Interventions in this proposal are aligned to the Government’s overarching Medium Term Strategic Plan (“RPJMN”) 2015-2019, which reflects a commitment to quality education for all children aligned to the SDG targets. At province level, activities under Pillar 2 support equity-oriented budget allocation. The program has so far received strong support at local government level. The program supports two of DFAT’s aid investment objectives for Indonesia and aligns with two of Australia’s priorities for investment in education. These are shown in the table below:
DFAT Objective How the program supports the objective
Aid investment Objective 2: Human development for a productive and healthy society Global Education Objective 2: Learning for all
• The main focus of the program is improving teacher quality
• Improves learning outcomes for early grade students in basic literacy
• Addresses gender and inclusion in teacher training, learning materials and disaggregated M&E7
Aid investment Objective 3: An inclusive society through effective governance Global Education Objective 3: Universal participation
• Develops district level capacity to address inequities in service delivery
• Provides evidence for policy development to increase participation of the most marginalised children through gender-disaggregated analysis
• Aims to leverage districts own substantial resources
Child Protection UNICEF’s mandate in Indonesia to promote the rights of all children, including protection from violence, exploitation and abuse, is drawn from the Convention on the Rights of the Child (CRC), ratified by the Government of Indonesia in 1990.This means that all UNICEF staff and contractors are bound by the highest standards of ethics and integrity in carrying out their work. Managers have a particular responsibility to maintain a working and program environment free of any form of abuse, exploitation or violence. Specifically, all UNICEF staff (including consultants and contractors) are bound by the 2016 UNICEF policy on child safeguarding (“Executive Directive on Child Safeguarding”), Policy onthe Secretary General’s Bulletin on Protection from Sexual Exploitation and Abuse and the UN Code of Conduct for International Civil Servants which aim to protect all children, women and vulnerable communities from any risk of harm in program implementation. The 2016 Directive is closely aligned to DFAT’s own child safeguarding policy and obliges staff to adhere to the highest standards of professional conduct at all times. Noting the endemic violence against women and children in Papua and the particular risks that women and children face of violence and abuse in this context, UNICEF Indonesia will take additional steps to promote child safeguarding in its operations. With the implementation of this proposal, UNICEF will train all UNICEF staff on gender and child
7 Inclusive education is central to UNICEF’s equity agenda and promotes meaningful learning opportunities to all children, including those with disabilities, within regular schools.
5
safeguarding and will work closely with implementation partners (local civil society partners in particular) to develop localized Codes of Conduct specific to each organisation’s needs and structures, but with reference to global guidelines and minimum standards. This will include developing and delivering an improved package for partner organisations and staff which is aligned to global standards but adapted specifically to the Papua context. In this way, UNICEF Indonesia and DFAT have the opportunity to role model a program that promotes the highest standards of care and support in its operational work, which can potentially be replicated in other contexts. Gender In line with DFAT and UNICEF’s equity principles, the program seeks to achieve gender
quality and promote women and girl’s rights throughout implementation.
DFAT’s Gender Equality and Women’s Empowerment Strategy commits Australia to integrating gender equality more effectively in all its work, no matter what the sector or focus. The strategy focuses on three priority areas: Enhancing women’s voice in decision-making, leadership and peace-building; Promoting women’s economic empowerment; and Ending violence against women and girls. In alignment with UNICEF’s Gender Action Plan 2014 – 20178, this initiative fosters gender-equitable outcomes, by promoting inclusiveness, equality and sustainability. The key principles driving mainstreaming in education are a focus on quality learning, and the importance of education as an important foundation for more equitable gender approach. This program supports all strategic priorities through ensuring both boys and girls benefit from the program; that women and girls’ empowerment messages are included in teacher training and that female teachers gain better skills and are empowered to improve their leadership skills and take on leadership roles in the education system. Learning materials include specific messages on girls’ empowerment and the equal roles of men and women in society, for example short stories which feature girls continuing their education, mothers in paid professions. Further, the M&E system tracks gender disaggregated progress and will include robust gender analysis of results to ensure the impact of the program on boys and girls, men and women is effectively monitored.
3.Monitoring and evaluation plan
3.1 Introduction
This monitoring and evaluation plan (MEP) has been updated based on 12 months of
implementation and it reflects the updated theory of change and associated indictors.
Data collection and analysis uses combined quantitative and qualitative approaches. In line with UNICEF’s commitment to gender equity, data is sex-disaggregated wherever it is possible and useful. This applies to almost all data in Pillar 1 as activities and outcomes relate to teachers and students. Primary and secondary data is collected regularly by the implementing partners in target schools, communities and district education offices (DEOs) over the entire period of program implementation. It uses monitoring tools which have been designed and prepared by UNICEF in consultation with the relevant key stakeholders.
The baseline and subsequent surveys contain predominantly quantitative data. This is supplemented by qualitative enquiry to triangulate and to better understand the issues linked
8 UNICEF’s global gender policy approved by the UNICEF Executive Board (including representatives from the Government of Australia, is available online at: http://www.unicef.org/esaro/UNICEF_Gender_Action_Plan_2014-2017.pdf
6
to literacy teaching-learning in early years as well as the contextual variables determining and/or mediating children’s educational outcomes.
As a result of reviewing the intended outcomes, to ensure that they are within the scope of the program to influence, a case study method has been added to gain deeper insight into the factors affecting whether and how the evidence produced by the program is used in the process of decision-making.
3.2 Program Logic and theory of change
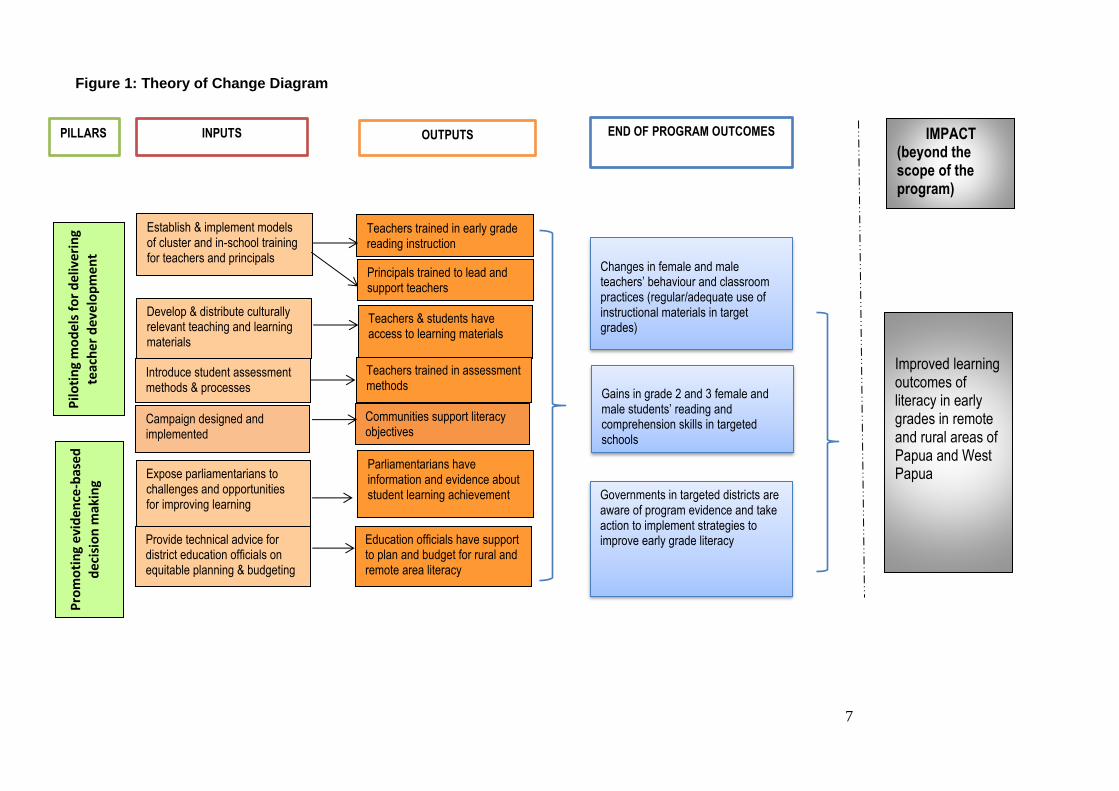
The program objective is to test effective and sustainable approaches for improvement of literacy outcomes in early grades in rural and remote areas of Papua and West Papua provinces. This objective is expressed at the level of impact as improved literacy outcomes in grade 2 and 3 reading and comprehension. Causal logic The proposed design of the program is based on a key causal logic that improved training and mentoring of teachers (along with supportive materials and environment), will lead to improved teaching practices, which over time, will result in improved learning outcomes, namely attainment of basic literacy skills in rural and remote schools. The causal logic reflects the way change is envisaged to happen in two target groups:
1. Teachers 2. Parliamentarians (decision makers) and government officials (planners)
Teachers
If teachers have quality in-service training and mentoring and they have supportive, culturally relevant materials and they understand how student assessment helps them and they are motivated to teach more effectively then they demonstrate better teaching practice
THEN (in the longer term) there is potential to improve literacy outcomes in early grade reading and comprehension
Decision makers and planners
If parliamentarians are exposed to challenges and opportunities and government officials gain skills in planning and budgeting and both groups have evidence that informs and motivates them then they take action to improve education services
This is further translated into a theory of change (TOC) diagram as shown in Figure 1. Assumptions Several assumptions that reflect aspects of the contexts have been considered at input and output level. These reflect aspects of the context that are known to be challenging. If these assumptions are proved false they represent risk to achievement:
• input to output: teachers are present in the classroom; models of training are appropriate; trainers and mentors deliver quality training; and communities support learning and parliamentarians receive greater evidence about education in rural and remote areas
• output to outcome: teachers are motivated to apply their skills; teachers apply their skills; trained personnel are not moved; children improve their literacy; officials use the evidence provided by the program to contribute to improved education services
• outcome to impact: teacher application of new teaching skills can be sustained; learning materials continue to be available; the environment is enabling; children continue to improve their literacy
7
Figure 1: Theory of Change Diagram
M
Teachers & students have access to learning materials
Introduce student assessment methods & processes
Expose parliamentarians to challenges and opportunities for improving learning
Provide technical advice for district education officials on equitable planning & budgeting
Campaign designed and implemented
Establish & implement models of cluster and in-school training for teachers and principals
Parliamentarians have information and evidence about student learning achievement
OUTPUTS
Pro
mo
tin
g e
vid
ence
-bas
ed
d
ecis
ion
mak
ing
PILLARS
Teachers trained in early grade reading instruction
Communities support literacy objectives
Education officials have support to plan and budget for rural and remote area literacy
Develop & distribute culturally relevant teaching and learning materials
INPUTS
Teachers trained in assessment methods P
iloti
ng
mo
de
ls f
or
del
ive
rin
g te
ach
er
dev
elo
pm
en
t
Principals trained to lead and support teachers
END OF PROGRAM OUTCOMES
IMPACT (beyond the scope of the program)
Improved learning outcomes of literacy in early grades in remote and rural areas of Papua and West Papua
Changes in female and male teachers’ behaviour and classroom practices (regular/adequate use of instructional materials in target grades)
Gains in grade 2 and 3 female and male students’ reading and comprehension skills in targeted schools
Governments in targeted districts are aware of program evidence and take action to implement strategies to improve early grade literacy
8
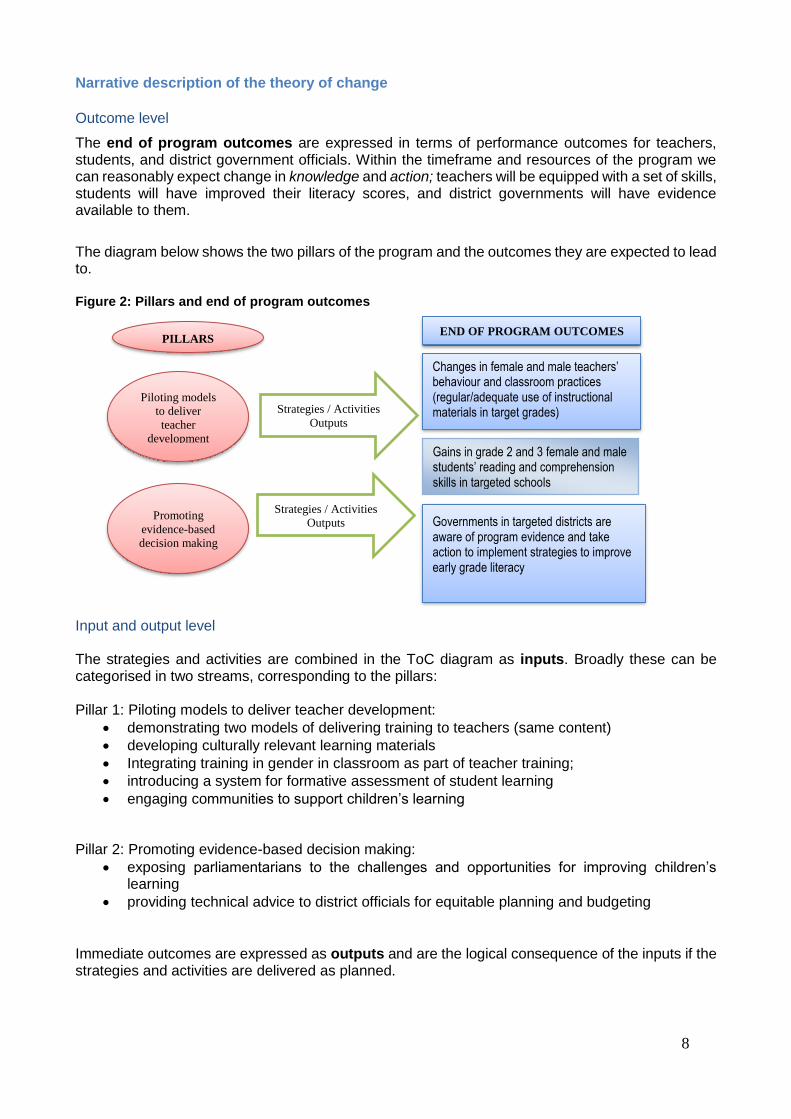
Narrative description of the theory of change
Outcome level
The end of program outcomes are expressed in terms of performance outcomes for teachers, students, and district government officials. Within the timeframe and resources of the program we can reasonably expect change in knowledge and action; teachers will be equipped with a set of skills, students will have improved their literacy scores, and district governments will have evidence available to them.
The diagram below shows the two pillars of the program and the outcomes they are expected to lead to. Figure 2: Pillars and end of program outcomes
Input and output level The strategies and activities are combined in the ToC diagram as inputs. Broadly these can be categorised in two streams, corresponding to the pillars: Pillar 1: Piloting models to deliver teacher development:
• demonstrating two models of delivering training to teachers (same content)
• developing culturally relevant learning materials
• Integrating training in gender in classroom as part of teacher training;
• introducing a system for formative assessment of student learning
• engaging communities to support children’s learning Pillar 2: Promoting evidence-based decision making:
• exposing parliamentarians to the challenges and opportunities for improving children’s learning
• providing technical advice to district officials for equitable planning and budgeting
Immediate outcomes are expressed as outputs and are the logical consequence of the inputs if the strategies and activities are delivered as planned.
Changes in female and male teachers’ behaviour and classroom practices (regular/adequate use of instructional materials in target grades)
Governments in targeted districts are aware of program evidence and take action to implement strategies to improve early grade literacy
Promoting
evidence-based
decision making
Piloting models
to deliver
teacher
development
END OF PROGRAM OUTCOMES PILLARS
Strategies / Activities
Outputs
Strategies / Activities
Outputs
Gains in grade 2 and 3 female and male students’ reading and comprehension skills in targeted schools
It is important to note that activities aimed at engaging communities to support the program are crucial to success and these are monitored at input and output level. They do not track through to outcome level because, in the 2014 design revision, community engagement was dropped as a third pillar in recognition of the fact that it was over ambitious and costly within the scope of the program. In other words, it is anticipated that community support for literacy will increase to some extent as a result of program activities but there is no expectation of being able to measure significant change in community attitudes. Although the program works directly with school principals from the target schools improving their capacity in school management, the main focus at outcome level is on early grade teachers. The activities with principals focus on enhancing knowledge about school management and transparency issues, collaboration with community and general support to teachers. The program assumes that changing teacher’s behavior is necessary for improvement of student’s performance, and that improved school management supports this outcome. Support for school principals is therefore not a focus at the outcome level.
3.3 Monitoring
Monitoring focuses at the level of input to output. It tracks progress on activities and provides
information about how effectively and efficiently inputs are translating into the intended outputs (short
term results). It provides information about performance that can be used for program improvement.
It has been taken into consideration how to better illustrate the achievement by complementing
performance indicators with qualitative evidence, such as observation
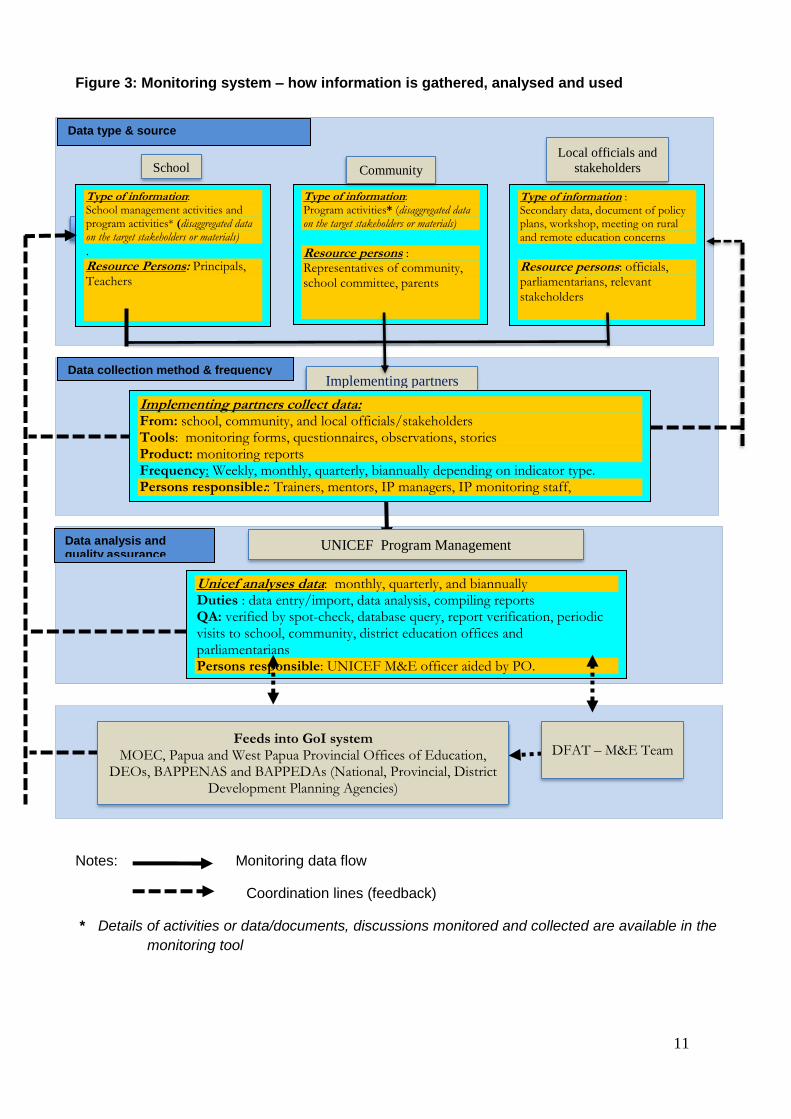
Figure 3 shows the overall monitoring system.
Data source
Data is collected from three sources:
• School level – activities with teachers and principals
• Local government – secondary data such as policies and plans, activities with officials
• Communities – awareness campaigns, education activities
Data is collected by implementing partners. How often it is collected depends on the frequency of activities, which varies in intensity, and the schedule of routine monitoring visits. It can be weekly, monthly, quarterly or biannually.
A set of tools has been developed which aims to ensure consistency of monitoring. The main tool is the Management Information System (MIS) form which is based on the indicators derived from the theory of change. It was developed jointly by UNICEF and partners during inception. These are modified as needed to ensure that they are recording the right information in a usable form. Information is then entered into separate Excel worksheets or an SPSS database. MIS forms mainly record quantitative information. This is supplemented by qualitative data derived from field trip reports or field notes from UNICEF staff monitoring visits. Data analysis
Not later than the last day of each month the data sheets are sent to the M&E officer in UNICEF Jayapura office, via e-mail, who then compiles and copies them into the program data base. The data management software is then programed to sort information on the key indicators as required by program managers and partners. Where gender-disaggregated data has been collected (where it is relevant) the database is set up to organise it so that differences between men and women, girls and boys, can be captured as well as emerging trends. Data coming from the formative assessment of children conducted by the teachers is analysed to identify any difference in the learning achievement of boys and girls.
Other key equity indicators include location or ethnicity, status, professional background, the presence of learning materials, the quantity and quality of teachers, or the quality of the curriculum. Other relevant information, recorded in descriptive or narrative ways, is analysed using the NVivo software. Data on disability is not available for the target schools. Government policy is to set up special schools in urban areas for disabled children rather than to mainstream inclusive education. The M&E officer maintains and manages the database overall and is responsible for quality control. This is done by verifying information supplied, querying the database and acting on feedback from the team and partners responsible for planning of activities and reporting. Data use
The information is used primarily for internal program planning, review and management purposes to ensure that the activities are proceeding according to plans, and are effective. In cases where activities are not achieving the plans, the problems are identified, so that appropriate management decisions can be made.
At activity level, data is used to guide the continuous review of program activities so that all expected outcomes related to improved quality and quantity of reading instructions are achieved as planned. Reporting The mechanism for reporting is:
• Weekly plans and reports: IPs collaborate with the superintendent from the District Education Office; complete weekly plan and reports, and plan activities.
• Monthly reports and meetings: IPs meet regularly with the District Education Officials to plan and coordinate activities. The IPs collaborate with the superintendent from the District Education Office prepare a monthly report summarizing the conducted activities at district and sub-district level. This report is important to monitor progress and allows identification of issues, problems and lessons learnt. These reports also compare activities that occurred against the quarterly planned activities.
• Coordination and planning meeting: Coordination meetings are organised with the IPs and representatives from the provincial and district education offices.
• Quarterly review and planning meetings with key stakeholders: the objective of this meetings is to track progress against Annual Work Plan (AWP), the program targets and indicators. It also allows opportunity for reporting on other activities, which have occurred. Lessons learnt will be discussed, as well as factors that have influenced the success and the progress.
Quality assurance
The UNICEF team ensures that the performance data meets the DFAT Monitoring and Evaluation Standards (DFAT). An internal review of data quality was carried out in October 2015 shortly after obtaining the first sets of activity monitoring data.
11
Figure 3: Monitoring system – how information is gathered, analysed and used
Notes: Monitoring data flow
Coordination lines (feedback)
* Details of activities or data/documents, discussions monitored and collected are available in the
monitoring tool
Data analysis and quality assurance
Data collection method & frequency
Data type & source
Unicef analyses data: monthly, quarterly, and biannually Duties : data entry/import, data analysis, compiling reports QA: verified by spot-check, database query, report verification, periodic visits to school, community, district education offices and parliamentarians Persons responsible: UNICEF M&E officer aided by PO.
Type of information: Program activities* (disaggregated data on the target stakeholders or materials)
Resource persons : Representatives of community, school committee, parents
Type of information: School management activities and program activities* (disaggregated data on the target stakeholders or materials)
. Resource Persons: Principals, Teachers
Feeds into GoI system MOEC, Papua and West Papua Provincial Offices of Education,
DEOs, BAPPENAS and BAPPEDAs (National, Provincial, District Development Planning Agencies)
Implementing partners
School Community
Type of information : Secondary data, document of policy plans, workshop, meeting on rural and remote education concerns
Resource persons: officials, parliamentarians, relevant stakeholders
UNICEF Program Management
Local officials and
stakeholders
DFAT – M&E Team
Implementing partners collect data: From: school, community, and local officials/stakeholders Tools: monitoring forms, questionnaires, observations, stories Product: monitoring reports Frequency: Weekly, monthly, quarterly, biannually depending on indicator type. Persons responsible:: Trainers, mentors, IP managers, IP monitoring staff, Duties : Recapitulation and entering data into excel sheet by IP staff
12
4. Evaluation
What is being evaluated
In addition to monitoring progress towards output (short term results) the program has an evaluation component oriented to measuring outcomes and, to some extent, impact.
At the level of intended outcomes (within program control) evaluation aims to measure:
1. To what extent do female and male teachers demonstrate improved teaching practices to improve early grade literacy? i. To what extent teachers use new teaching skills?
ii. What are the critical success factors in developing teacher skills? iii. Is there evidence of improvement in children’s learning outcomes? iv. How effective are the models in addressing the particular challenges teachers face in
remote and rural schools?
v. What factors affect sustainability?
6. To what extent has children’s learning improved?
i. Is there any difference between the sample and the control groups ii. Is there any difference between girls and boys?
7. To what extent is there evidence to support local government decision making?
i. What quality of evidence has the program produced? ii. Which elements are of most interest to parliamentarians? iii. Which elements are most useful to planners? iv. What are the cost implications? v. What factors limit the usefulness of evidence?
At the level of impact (outside program control but worthwhile attempting to measure):
8. To what extent has evidence been used in policy development, planning and decision making? o If used, what are the success factors? o If not used, what are the reasons?
4.1 Method of evaluation
Studies: baseline and midline The current means of evaluation is the survey method of baseline and midline. The two studies are an integral part of the overall M&E framework and they aim to measure early grade reading skills (modified EGRA) of sample students in grade 2 and 3 and to a snapshot of school management effectiveness (using SMA – School Management Assessment).
13
Baseline Study
The baseline study was conducted in February/March 2015 and the results disseminated in April 2015. The contracted local consulting company produced good quality data and will be contracted again to conduct the midline study in April/May 2017.
The baseline study collected data on all six districts from all the target sites. It represents all the target groups (school children and concerned communities, the government at district and provincial level) so that changes in retention and learning outcomes can be tracked. It is done in a way that supports attribution.
The program targets 120 primary schools in rural and remote areas. Additionally 60 schools with similar characteristics were selected as control schools (no intervention applied). The sample was calculated with margin of error 5% at 95% confidence level resulting in 2400 samples of students from intervention schools and 1200 students from control schools. The students were randomly selected among second and third grade students9.
Additionally data was collected from 3600 parents of sampled students, 540 teachers and principals, 162 local leaders, and local education offices at district and province levels. The data was also enriched with 52 video recordings of teaching and learning process in some of the schools.
Overall the study revealed that almost half of the early grade students (48.47%) in the sample were categorised as non-readers (those who cannot read at all), while 38.55% of students can read with limited comprehension. In total 87.2% of early grade students in rural and remote areas of Papuan provinces are nonreaders or readers with limited comprehension. Less than 15% of children sampled were categorized as readers, either reading with comprehension (5.35%) or reading fluently with comprehension (7.63%).
This information has been used to design the MEP, provide preliminary information for school selection and guide program management, partners, and key stakeholders in the process of achieving the program’s stated objectives. Also the baseline is the basis for comparison for and the evidence on which the key outcome indicators are measured.
Data collection has been tailored to the two models (Model 1 and Model 2) and includes available data at provincial, district, sub-district, community and school level that is relevant to program objectives and activities. Survey respondents included principals, teachers, community members, and policy-makers/duty-bearers. A gender balance was sought where feasible. These inputs were used as the primary data source. Information was also derived from secondary sources such as datasets from the BPS 2010 National Census and Education Office data for Papua and West Papua. These were captured through mixed methods, with questions within the household survey as well as separate, well-structured qualitative research such as in-depth interviews and household observation. The sample includes control and treatment areas at sub-district and district level. Full details can be found in the Study itself.
In terms of impact, the assessment instrument was designed to measure basic reading skills. The parents survey captured several measurement such as children’s reading habit at home, parent and family support, and socio economic conditions. The School Management Assessment also provides snapshots of school management effectiveness through interviews with teachers and principals and observations on school and classroom facilities. The Midline study was initially intended to be conducted in May 2016 towards the end of the first academic year of the implementation in the target schools and the target communities using the same
9 In the case where number of second grade students was less than 20, then students from third grade were assessed.
14
qualitative and quantitative methods and tools so that they can be used for comparison. However, as the process for extending the program commenced, it was decided to delay the midline study until May 2017.
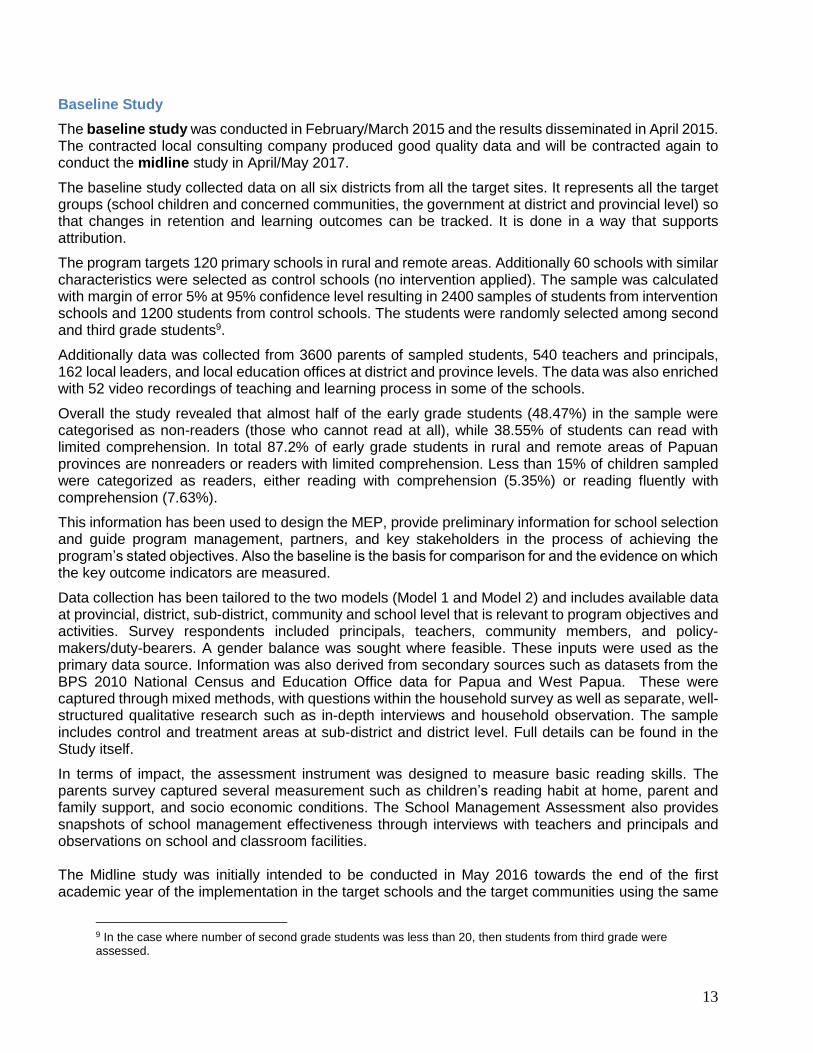
Adequacy of data The table below shows what data is already being collected at the levels of outcome and impact, and assesses what additional data will be required to draw conclusions. All data, where appropriate, is gender disaggregated.
Existing data Additional data required
Outcome level
Teachers have skills
Baseline and subsequent studies.
Study questions can be adapted and supplemented with
• Targeted observations on the three skill areas
• Teacher perceptions – collection of systematic anecdotal information about how teachers assess their own skill development
District governments have evidence
“ “
Study questions can be adapted and supplemented as required with:
• Interviews conducted by partners
Impact level
Student reading / comprehension improves
EGRA None
Governments use data None Case study evidence
In terms of measuring outcomes related to teacher skills, the existing survey data will be collected through
1. Observations - These are currently defined in a general way and will be redefined so that there is data on each of the skill areas; teaching literacy, using materials effectively, and assessing students. This is important in order to understand whether teachers acquire all skills at the same rate and quality or whether some are fundamentally more challenging. Experience to date suggests that teachers struggle particularly with assessment – both conceptually and practically
In terms of measuring outcomes related to governments having evidence, the survey data is less useful and needs to be supplemented to a greater extent. The components of ‘having evidence’ are somewhat different and more difficult to measure:
✓ Understand the reasons for low learning achievement - this can be measured qualitatively through in depth interviews conducted by partners, linked to program activities oriented to raising awareness of the challenges and opportunities
✓ Understand what models work in what contexts - the program objective concerns comparison between models. This is complicated to assess because the main emphasis is on the content of what is delivered to teachers and this is the same in both models. The reasons for use of different models is strongly related to logistics and the implications of using the two models are likely to relate to cost more than any other factor. For this reason the evaluation questions need to specifically cover cost-effectiveness
15
✓ Support decision-making to improve equity - this can be assessed to some extent using partner-conducted interviews. However, it is closely related to the intended impact that, when evidence is made available, it will actually be used.
Case study
The only feasible method of getting qualitative inputs from parliamentarians at district level is through specially convened consultative sessions. These would be used to facilitate analysis of evidence and examine how they can (or cannot) use data to develop policy and regulation. Similar workshops can be held with DEOs to examine their potential to support decision making.
The aim of the case study is to illuminate the complexity of factors that determine impact. In particular it will investigate the specific evaluation questions:
• What quality of evidence has the program produced?
• Which elements are of most interest to parliamentarians?
• Which elements are most useful to planners?
• What are the cost implications of the two models?
• What factors limit the usefulness of evidence?