Embed Size (px)
Citation preview

Glasgow Theses Service http://theses.gla.ac.uk/
Rupp, Angelika Frances (2012) Harnessing in and ex vivo imaging to investigate motor nerve terminal injury and recovery in a mouse model of Guillain-Barré syndrome. PhD thesis. http://theses.gla.ac.uk/3364/ Copyright and moral rights for this thesis are retained by the author A copy can be downloaded for personal non-commercial research or study, without prior permission or charge This thesis cannot be reproduced or quoted extensively from without first obtaining permission in writing from the Author The content must not be changed in any way or sold commercially in any format or medium without the formal permission of the Author When referring to this work, full bibliographic details including the author, title, awarding institution and date of the thesis must be given

Harnessing in and ex vivo imaging to investigate motor nerve terminal injury
and recovery in a mouse model of Guillain-Barré syndrome
Angelika Frances Rupp, Dr. med. vet.
A thesis submitted in fulfilment of the requirements of the University of Glasgow for the degree of Doctor of
Philosophy
Institute of Infection, Immunity and Inflammation
College of Medical, Veterinary and Life Sciences
University of Glasgow
October 2011

ii
ABSTRACT
The peripheral nerve disorder Guillain-Barré syndrome (GBS) accounts for the most
common cause of acute acquired paralysis in the Western World. Circulating anti-
ganglioside antibodies (Abs) are considered important mediators of this disease.
Research conducted in a mouse model of GBS has the revealed the neuromuscular
junction (NMJ) as a potential site of anti-ganglioside Ab-binding, due to this structure
lying outside the blood-nerve-barrier. The ganglioside composition of the neural and
glial components of the NMJ determines which of these structures are bound and in
the following subjected to complement-mediated injury.
Some patients suffering from the acute motor axonal neuropathy (AMAN) forms of
GBS recovery very rapidly from paralysis; it has been proposed that in these
patients the injury was restricted to the distal motor axons and nerve terminals
(NTs), which are able to regenerate over a short time-frame. To test this hypothesis,
the mouse model of GBS was combined with in and ex vivo imaging of the NMJ in
the ventral neck muscles of mice expressing cytosolic fluorescent proteins in their
axons (cyan fluorescent protein: CFP) and Schwann cells (green fluorescent protein:
GFP).
Following confirmation of the stability of NMJs in these mice over time, optimisation
of in vivo imaging procedures and determination of the most advantageous Abs for
these kinds of investigations, 45 mice were subjected to a single in vivo topical
application of anti-ganglioside Ab followed by a source of complement. Group A
(n=15) received Ab that selectively bound to the NTs, group B (n=15) received Abs
that bound both to the NTs and the perisynaptic Schwann cells (pSCs) and group C
(control animals; n=15) only received complement. Evolution of the injury was
documented by in vivo imaging, and following euthanasia the muscles were
reimaged ex vivo both quantitatively and qualitatively, either immediately, or after 1,
2, 3 or 5 days of regeneration (each n=3 per group).
Within 15 minutes of complement application, a rapid loss of CFP overlying the NMJ
could be seen; in group A, the GFP signal remained unchanged, whereas in group B
the GFP signal was also lost. In group C no changes to either CFP or GFP were
observed. At 24h, 6% of the superficial NMJs in group A and 12% of the NMJs in
group B exhibited CFP; the CFP-loss extended proximally until the axons formed
little bundles. In both groups, CFP returned within the next five days (group A:
93.5%, group B: 94%; p=0.739), with the recovery of CFP being preceded by a
return of GFP-positive cells overlying the NMJ in group B. Both in groups A and B,

iii
the pSCs exhibited processes which extended beyond the normal NMJ boundaries
and very occasionally accompanied by axonal sprouts. This behavior was similar to
that of pSCs challenged by traumatic denervation of their NMJ, albeit the changes
observed in the Ab-mediated injury were lower in frequency and less dramatic when
compared to those observed following traumatic denervation. The rate of motor NT-
regeneration corresponds well to rates observed following the application of spider
or snake toxins, which mediate selective injury to the NTs.
Auxiliary investigations revealed that the loss of CFP at the NMJ correlated with a
loss of axonal architectural proteins (neurofilament (NF) heavy and light) and a
return of CFP at the NMJ was accompanied by a return of NF heavy.
Ultrastructurally, the injured NTs resembled NTs undergoing degeneration following
a traumatic denervation of the endplate and following five days of regeneration, the
NMJs exhibited a physiological morphology.
The results described above indicate that following a single anti-ganglioside Ab-
mediated and complement-mediated attack, independent of whether there are
healthy and mature pSCs overlying the NMJ, the murine NT is capable of recovering
its architectural, axolemmal and ultrastructural integrity very rapidly. This data
supports the notion that an equivalent mechanism may account for the rapid
recovery seen in some clinical cases of AMAN.

iv
TABLE OF CONTENTS
1. INTRODUCTION 1
1.1 Guillain-Barré syndrome 1
1.1.1 Epidemiology 1
1.1 2 Aetiology and anti-ganglioside antibodies 1
1.1.3 Subtypes 5
1.1.3.1 Acute motor axonal neuropathy 5
1.1.3.2 Acute motor and sensory neuropathy 7
1.1.3.3 Acute inflammatory demyelinating polyradiculoneuropathy 8
1.1.3.4 Miller-Fisher syndrome 9
1.1.4 Models 9
1.1.4.1 Spontaneous models 9
1.1.4.2 Experimental allergic neuritis 9
1.1.4.3 Models based on anti-ganglioside antibodies 12
1.1.5 Anti-ganglioside Ab-mediated pathophysiology 15
1.1.6 Anti-ganglioside Ab-mediated pathology 18
1.1.7 Anti-ganglioside Ab-mediated clinical and electrophysiological changes 18
1.2 The neuromuscular junction 19
1.2.1 Research carried out on the NMJ: tools, techniques and sites 19
1.2.2 Formation and maturation of the NMJ 21
1.2.3 Anatomy of the NMJ 23
1.3 Schwann cells 26
1.3.1 Origin 26
1.3.2 Differentiation and maturation 26
1.3.3 Perisynaptic Schwann cells 28
1.3.3.1 Distribution 28
1.3.3.2 Function 28
1.3.3.3 Perisynaptic Schwann cells and NMJ denervation 29
1.3.3.4 Markers 30
1.3.4 Schwann cells as targets in pathological processes 32
1.4 In vivo imaging 33
1.4.1 Sternomastoid muscle 33
1.4.2 Gastrocnemius muscle 34
1.4.3 Soleus muscle 34
1.4.4 Gluteus muscle 35

v
1.5 Aims 36
2. GENERAL MATERIALS AND METHODS 39
2.1 Experimental animals 39
2.1.1 Wildtype fluorescent mice 39
2.1.2 Knock-out fluorescent mice 40
2.1.3 Knock-in-knock-out fluorescent mice 41
2.1.4 Age and sex 41
2.1.5 Procedures 41
2.2 In vivo exposure and imaging of the sternomastoid and ster nohyoid
muscles 42
2.2.1 Preparation of the mouse, surgical approach and intubation 42
2.2.2 In vivo imaging 45
2.2.3 Recovery 45
2.2.4 Sacrifice 46
2.2.5 Reconstruction of images acquired in vivo 46
2.3 Fixation, processing and imaging (quantitative and qualitative) of SM and
SH 49
2.3.1 In situ fixation 49
2.3.2 Perfusion 49
2.3.3 Secondary staining 50
2.3.4 Wholemount imaging 50
2.3.5 Quantitative imaging 50
2.3.6 Electronmicroscopic investigations 51
2.4 Preparation of the triangularis sterni muscle 52
2.5 Fixation, processing and imaging of the TS 54
2.5.1 Fixation and processing of TS 54
2.5.2 Qualitative imaging of TS 54
2.5.3 Semi-quantitative imaging of TS (and SM/SH sections) 55
2.6 Permeabilisation of wholemount tissue 56
2.6.1 Permeabilisation only at the level of the NMJ 56
2.6.2 Permeabilisation of the NMJ and proximal efferents 56
2.7 Anti-ganglioside Abs and α-BTx 57
2.8 Tissue manipulation and staining 58
2.9 Manufacturers for reagents used 59
2.10. Recipes for commonly used solution 59
2.10.1 Ringer’s solution 59
vi
2.10.2 Phophate buffered saline 60
2.10.3 Saline solution 60
2.10.4 Paraformaldehyde 4% 60
2.10.5 Strongfix 60
2.10.6 Blocking sera 61
2.11 Normal human serum 61
2.12 Statistics and Imaging 62
3. RESULTS 63
3.1 Stability of NMJs regarding their pSC numbers 63
3.1.1 Introduction 63
3.1.2 Specific Materials and Methods 64
3.1.2.1 Mice and procedures 64
3.1.2.2 Statistics 64
3.1.3 Results 65
3.1.4 Discussion 68
3.1.5 Conclusion 69
3.2 In vivo imaging of the NMJ 70
3.2.1 Introduction 70
3.2.2 Specific Materials and Methods 71
3.2.2.1 Groups and procedures 71
3.2.2.2 Scoring 74
3.2.2.3 Comparison of SH and SM-NMJs regarding size and pSC number 74
3.2.2.4 Statistics 75
3.2.3 Results 75
3.2.3.1 Survival of mice 75
3.2.3.2 Stability of the muscle under investigation 75
3.2.3.3 Primary imaging sessions 76
3.2.3.4 Secundary imaging sessions 77
3.2.3.5 α-BTx-controls 78
3.2.3.6 Scores for groups I, III and IV and SM versus SH 79
3.2.3.7 Comparison of SH and SM-NMJs 80
3.2.3.8 Group V 80
3.2.4 Discussion 81
3.2.5 Conclusion 83
3.3 Anti-ganglioside antibody trials 85
3.3.1 Introduction 85

vii
3.3.2 Specific Materials and Methods 86
3.2.2.1 Animals and general protocol 86
3.2.2.2 Antibodies 86
3.2.2.3 Determination of injury to neural/glial structures of the NMJ 87
3.2.2.4 Additional illustration of a loss of the pSC membrane integrity 87
3.2.2.5 Auxiliary investigations regarding the TBG3 binding profile 87
3.3.3 Results 89
3.3.3.1 Binding profiles 89
3.3.3.2 Loss of fluorescent proteins 89
3.3.3.3 Summary of results 94
3.3.4 Discussion 95
3.3.5 Conclusion 98
3.4 Comparison of SM and SH regarding Ab-binding, N T sprouting and pSC
process extension 99
3.4.1 Introduction 99
3.4.2 Specific Materials and Methods 100
3.4.2.1 Antibody-binding capacity 100
3.4.2.2. Nerve terminal sprouting and pSC process extensition capacity 100
3.4.3 Results 101
3.4.3.1 Antibody-binding capacity 101
3.4.3.2 Nerve terminal sprouting and pSC process extension in SM and SH
following traumatic denervation 105
3.4.4 Discussion and Conclusion 108
3.4.4.1 Antibody-binding capacity 108
3.4.4.2 Nerve terminal sprouting and pSC process extension 108
3.5 Antibody internalisation at the motor NT and pr otection from complement-
mediated injury 111
3.5.1 Introduction 111
3.5.2 Specific Materials and Methods 111
3.5.2.1 Antibody-binding and –uptake 111
3.5.5.2 Ex vivo assessment of complement deposition and NT injury 112
3.5.2.3 In vivo assessment of NT injury 113
3.5.3 Results 115
3.5.3.1 Antibody-binding and –uptake 115
3.5.3.2 Complement deposition and ex vivo NT injury 116
3.5.3.3 In vivo NT injury 118

viii
3.5.4 Discussion 121
3.5.5 Conclusion 122
3.6 Auxiliary investigations associated with the lo ss of CFP at the NT 123
3.6.1 Introduction 123
3.6.2 Specific Materials and Methods 124
3.6.2.1 Ex vivo preparations 124
3.6.2.2 In vivo preparations 125
3.6.2.3 Electronmicroscopic investigations 126
3.6.3 Results 126
3.6.3.1 Ex vivo preparations 126
3.6.3.1.1 Antibody-deposition 126
3.6.3.1.2 Neurofilament immunoreactivity at the NMJ 128
3.6.3.1.3 Application of calpain-inhibitors 129
3.6.3.2 In vivo preparations 131
3.6.3.3 Electronmicroscopy of representative tissue 133
3.6.4 Discussion 135
3.6.4.1 CFP loss – mode and extent 135
3.6.4.2 Events in the proximal efferents following the acute NT-injury 137
3.6.4.3 Ultrastructural changes to the NT following anti-ganglioside Ab and
complement-mediated injury 138
3.6.5 Conclusion 140
3.7 Rate of motor NT regeneration following a singl e anti-ganglioside Ab and
complement-mediated injury 141
3.7.1 Introduction 141
3.7.2 Specific Materials and Methods 142
3.7.2.1 Groups and study set-up 142
3.7.2.2 In vivo procedures 143
3.7.2.3 Ex vivo procedures 144
3.7.2.4 Additional investigations associated with the return of CFP 144
3.7.3 Results 144
3.7.3.1 In vivo investigations 144
3.7.3.2 Ex vivo investigations 148
3.7.3.2.1 Group A 148
3.7.3.2.2 Group B 150
3.7.3.2.3 Group C 155
3.7.3.3 Auxiliary investigations 156

ix
3.7.4 Discussion 158
3.7.4.1 Regeneration of motor nerve terminals 158
3.7.4.2 Role of the perisynaptic Schwann cells 159
3.7.5 Conclusion 161
4. CONCLUSIONS 162
4.1 Stability of NMJs in double fluorescent mice 162
4.2 Mimimalising the illumination facilitates in vivo imaging of the SH (and SM) 163
4.3 Specificity of the anti-ganglioside Ab applied determines whether neural or glial
components of the NMJ are injured 164
4.4 Ab-binding levels in SM, SH and TS of homozygous and heterozygous double-
fluorescent mice correspond well with eachother 165
4.5 Both SH-and SM-NMJs react to traumatic denervation with the extension of pSC
processes and axonal sprouts 165
4.6 Anti-ganglioside Ab is rapidly internalised at the NT; this mechanism protects the
NT from complement-mediated injury 166
4.7 Loss of CFP at the NT corresponds with a loss of physiological axonal
architectural and ultrastructural properties 167
4.8 Rapid motor NT regeneration following anti-ganglioside Ab-and complement-
mediated injury; the rate of NT regeneration is not affected by a concomitant injury
to the pSCs 168
5. SUMMARY and OUTLOOK 169
6. REFERENCES 172
7. APPENDIX 194

x
LIST OF TABLES
Table 1: Anaesthesia protocol 43
Table 2: Filter sets for Leica DMI4000B (in vivo imaging) 45
Table 3: Filter sets for Zeiss AxioImager (ex vivo imaging) 50
Table 4: Application of anti-ganglioside Abs and α-BTx 57
Table 5: Tissue manipulation and staining 58
Table 6: Manufacturers for reagents used 59
Table 7: Statistical tests and packages 62
Table 8: Microscopes, imaging and image processing software 62
Table 9: Results for pSC counts 65
Table 10: Experimental groups for in vivo imaging trials 72
Table 11: Scoring criteria for in vivo imaging trials 74
Table 12: Scores for groups I, III and IV and comparison of SM versus SH 79
Table 13: Anti-ganglioside Abs applied in the Ab-trials 86
Table 14: Results for anti-ganglioside Ab-binding and -injury trials 94
Table 15: Occurrence and absence of NF heavy and light at the NMJ following the
application of TBG3 and complement 129
Table 16: Experimental groups for the NT-regeneration study 142

xi
LIST OF FIGURES
Fig.1: Schematic overview of the synthesis and composition of gangliosides 2
Fig.2: Examples for the homology between Campylobacter jejuni oligosaccharide
side-chains and gangliosides 4
Fig.3 : Schematic overview of the two main forms of GBS 6
Fig.4: Activation of the complement system following the binding of anti-ganglioside
Abs on target structures 17
Fig.5: The neuromuscular junction 24
Fig.6: In vivo imaging 44
Fig.7: Effects of the image processing steps 47
Fig.8: Workflow for the reconstruction of images acquired in vivo 48
Fig.9 : Ex vivo imaging 52
Fig.10: Results for pSC counts per NMJ 66
Fig.11: NMJs in mice of different ages 67
Fig.12: Sternohyoid and sternomastoid muscles 71
Fig.13: In vivo imaging trials: techniques 73
Fig.14: In vivo imaging trials: in vivo imaging results 77
Fig.15: In vivo imaging trials: in and ex vivo imaging results 78
Fig.16: Alpha-bungarotoxin controls 79
Fig.17: Anti-ganglioside Ab-binding patterns at the NMJ 88
Fig.18: Binding pattern for TBG3 at the NMJ 90
Fig.19: Nerve terminal injury following the application of TBG3 and complement 91
Fig.20: Perisynaptic SC injury following the application of EG1 and complement 92
Fig.21: Examination of myelinating SCs and dose-dependant injury of the NTs
following the application of EG1 and complement 93
Fig.22: Control muscles 93
Fig.23: Application of MOG16 in PLP-Tg mice 94
Fig.24: TBG3-binding at SH-, SM- and TS-NMJs of female and male double-
fluorescent mice 102
Fig.25: Comparison of TBG3-binding capacity between the female and male
individuals of each strain 103
Fig.26: Comparison of the TBG3-binding capacity between heterozygous and
homozygous double-fluorescent mice 104
Fig.27: Sternohyoid and sternomastoid muscles four days after crush of the
innervating nerve 105

xii
Fig.28: Sternohyoid and sternomastoid muscles seven and 14 days after crush of
the innervating nerve 107
Fig.29: GAP-43-stain at regenerating NMJs 106
Fig.30: Assessment of NTs 114
Fig.31: Antibody-binding and –uptake 116
Fig.32: Complement deposition and ex vivo NT injury 117
Fig.33: Ex vivo NT-injury 119
Fig.34: In vivo NT-injury 120
Fig.35: Ex vivo TBG3 and complement application 127
Fig.36: Neurofilament immunoreactivity at the NMJ 128
Fig.37: Application of the calpain-inhibitor AK295 together with complement
following the TBG3-incubation 130
Fig.38: MAC-deposition at NMJs following the in vivo application of TBG3 and
complement 131
Fig.39: Absence of NF at NTs exhibiting no CFP at 24h after the application of
TBG3 and complement 132
Fig.40: Electronmicroscopic images of injured NTs 133
Fig.41: Electronmicroscopic images of control NMJs 133
Fig.42: Flowchart for the in and ex vivo NT-regeneration study 142
Fig.43: In vivo images of the acute anti-ganglioside Ab and complement-mediated
injury 145
Fig.44: In vivo images of control tissue and evolution of the NT injury 146
Fig.45: Ex vivo images of the extent of injury acutely and after 24h 147
Fig.46: Recovery of CFP overlying the NMJ 149
Fig.47: Regeneration of individual NMJs in group A 149
Fig.48: Features of regeneration in group A 150
Fig.49: Incidence of CFP and GFP overlying the NMJ in group B 151
Fig.50: Regeneration of individual NMJs in group B 152
Fig.51: Features of regeneration in group B 153
Fig.52: Regeneration of individual NMJs in group B – investigation of pSCs 154
Fig.53: Overviews for group C 155
Fig.54: Revisiting individual NMJs over time in group C 156
Fig.55: Recovery of CFP and NF heavy following 5 days of regeneration 156
Fig.56: Electronmicroscopic images of NMJs 5 days after induction of the injury 157

xiii
ACCOMPANYING MATERIAL
Appendix: Commands for macros generated in-house

xiv
ACKNOWLEDGEMENTS
Many people have helped me in all sorts of ways to complete my PhD.
First and foremost, I would like to thank Professor Hugh Willison for supervising my
project, giving me the opportunity to explore this very exciting field of neuroscience
and locating the necessary financial support for me. I especially value his patience
in our innumerable discussions and his subtle ability to steer me in the right direction
without telling me what I should do, but letting me discover what I needed to do.
Next, I would like to express my gratitude to the Willison team for both their technical
and their moral support on this long and winding road of science. This includes
current comrades-in-arms Cesc Galban, Denggao Yao, Jennifer Barrie, Kay
Greenshields and Simon Fewou, and also those colleagues whose ways have
already parted with mine. Of these I would especially like to mention Simon Rinaldi
and Sue Halstead.
Additionally, I would like to express a special “thank you” to Maddy Cunningham for
her infectious enthusiasm and for reminding me all over again what it is like to come
new to the exciting field of scientific research.
The staff at the Biological Services have been brilliant. Without their dedicated care
of my mice all these investigations would not have been possible. I would especially
like to mention Stuart Lannigan, Joanne Battersby and Tony McDermott. Thank you
very much for your technical and moral support over the last four years (amazing
how some easy chat takes the pressure out of the intubation process!).
The end-office of Level 3 (basically my brain hub) has been a very positive and
fruitful environment for me over the last few years, mainly due to the Goodyear-
group generating so much energy, laughter, goodwill and cakes in this area. It has
been a pleasure to be surrounded by so many friendly and scientifically-minded
people who never pass up any opportunity for some good chat (celebrities and
science in equal measure), cake, birthday celebrations, more cake and the
occasional night out. A few individuals spontaneously spring to mind here: Felix
Herrington, Fujimi Sugiyama and Alistair Easton. Thank you for extending your
friendship beyond the (double-doors of the) GBRC.

xv
Last, but emphatically not least, I would like to express my gratitude to my parents
and my brother for their unfailing support despite the geographical gap that divides
us all. Luckily, modern technology has made it easier to keep in touch no matter the
time-zone, but I really appreciate the fact that you were always available for me
when I needed your help and advice.

xvi
DECLARATION OF AUTHORSHIP
All experiments are the work of the author unless specifically stated otherwise.
Angelika Frances Rupp, Dr. med. vet.
University of Glasgow, October 2011

xvii
ABBREVIATIONS
Ab – antibody
ACh – acetylcholine
AIDP – acute inflammatory demyelinating polyneuropathy
AMAN – acute motor axonal neuropathy
AMSAN – acute motor and sensory axonal neuropathy
BTx – α-bungarotoxin
BNB – blood-nerve barrier
CFP – cyan fluorescent protein
C. jejuni – Campylobacter jejuni
CN – cranial nerve
CNS – central nervous system
E – embryonic day
EAN – experimental allergic neuritis
EM – electronmicroscopy
EthD-2 – Ethidium-Homodimer2
FITC – fluorescein isothiocyanate
GalC – galactocerebroside
GAP – growth-associated-protein
GBS – Guillain-Barré syndrome
GD3KO – GD3-Synthase-Knock-out
GFP – green fluorescent protein
GM2KO – GalNac-Transferase-Knock-out
Ig – immunoglobulin
KO – knock-out
LP – long pass
MAC – membrane attack complex
MFS – Miller-Fisher syndrome
NA – numerical aperture
nAChR – nicotinic acetylcholine receptor
NF – neurofilament
NGS – normal goat serum
NHS – normal human serum
NMJ – neuromuscular junction
NoR – node of Ranvier

xviii
NT – nerve terminal
OS – oligosaccharide
PBS – phosphate buffered saline
PFA – paraformaldehyde
PLP – proteolipid protein
PLP-Tg – proteolipid protein transgenic mouse
PNS – peripheral nervous system
pSC – perisynaptic Schwann cell
RT – room temperature
SC – Schwann cell
SD – standard deviation
SH – sternohyoid muscle
SM – sternomastoid muscle
Tg – transgene
TRITC – tetramethyl rhodamine iso-thiocyanate
TS – triangularis sterni muscle
WT – wildtype

1
1. INTRODUCTION
1.1 Guillain-Barré syndrome (GBS)
1.1.1 Epidemiology
Guillain-Barré syndrome (GBS) stands for a group of acute peripheral neuropathies,
which together account for the most common cause of acute acquired paralyis in the
Western World since the eradication of polio (Hafer-Macko et al., 1996a; Hahn,
1998). The incidence for acquiring GBS, which can occur at any age (Hahn, 1998),
but affects more males than females (Hughes et al., 1999; Sejvar et al., 2011), lies
at one to four cases per 100 000 (Hughes et al., 1999; Yu et al., 2006) with the
lifetime likelihood for an individual to acquire the disease resting at 1:1000 (Willison,
2007). Roughly 20% of patients affected die or remain disabled within one year of
disease onset (Willison, 2007). In 2/3 of the patients, the onset of GBS is anteceded
by an acute infectious illness of the either the gastrointestional or respiratory system
(Hahn, 1998). The most common microorganisms linked to GBS include
Campylobacter (C.) jejuni (13% to 66% of cases), Cytomegalovirus (5% to 22%),
Mycoplasma pneumoniae (5%) and Epstein-Barr virus (1% to 3%) (Hughes et al.,
1999; Ogawara et al., 2000; Yu et al., 2006).
1.1.2 Aetiology and anti-ganglioside antibodies
GBS and its variant forms are considered an auto-immune mediated neuropathy
with both humoral and cell-mediated immune factors contributing to the disease
process (Ariga & Yu, 2005). The antibodies (Abs) observed in high titres in GBS-
patients are anti-ganglioside Abs (Yu et al., 2006) and were first demonstrated in the
late 1980s (Ilyas et al., 1988). Gangliosides are complex glycosphingolipids found
within cells and on cell membranes throughout the body but in a higher
concentration on neural and glial tissue (Hamberger & Svennerholm, 1971). There
are a number of different gangliosides which are distinguished from one another by
the number and location of sialic acid residues attached to a neutral sugar backbone
(Fig.1) (Svennerholm, 1963).

1. Introduction 2
Fig.1: Schematic overview of the synthesis and comp osition of gangliosides (adapted from (Plomp & Willison, 2009)). Mice lacking GD3-Synthase do not express and b- and c-series gangliosides (orange box), whereas mice lacking GalNAc-Transferase do not express any complex gangliosides (green box) at all.

1. Introduction 3
Gangliosides are not distributed evenly throughout the organism and their
composition varies depending which structures they are located on. Investigations
conducted in human, mouse and rat peripheral nerves, nerve roots and dorsal root
ganglia revealed a preferential staining of anti-GD1a Abs for myelinated motor
nerves (compared to myelinated sensory nerves) in cross- and transverse sections
of nerve roots and sciatic nerves (De Angelis et al., 2001; Gong et al., 2002). In
contrast to this, anti-GM1 Abs bind both myelinated motor and sensory nerves
(Gong et al., 2002) with ultrastructural studies confirming binding sites both on the
nodal axolemma and the paranodal areas of Schwann cells (SCs) (Sheikh et al.,
1999a). The extraocular nerves (cranial nerves (CNs) III, IV and VI) and the optical
nerve contain high levels of GQ1b (Chiba et al., 1997). The function of gangliosides
is diverse and is hypothesized to range from cell development, signal transduction
and receptor function to cell-cell interactions (Plomp & Willison, 2009; Zeller &
Marchase, 1992).
Depending on the screening method and the patient groups/ ratio of GBS-subtypes
under investigation (see below), the incidence of anti-ganglioside Abs found in GBS-
patients ranges from 38% to 60% (Alaedini et al., 2002; Caudie et al., 2002; Matà et
al., 2006; Meena et al., 2010; Yu et al., 2006). The patterns for the Ab-binding
specificities vary between the different subtypes of GBS assessed (Caudie et al.,
2000). Good correlations are observed between anti-GQ1b Abs and the GBS-
subtype Miller-Fisher syndrome and anti-GM1/GD1a Abs and motor axonal forms of
GBS, in the latter especially after preceding C. jejuni infections (Ariga & Yu, 2005;
Caudie et al., 2002; Ogawara et al., 2000; also see 1.1.3) Nevertheless, controversy
surrounds the importance of these Abs for two reasons: firstly, depending on the
detection assay anti-ganglioside Abs are detected (Matà et al., 2006), are not
detected in relevant titres (Vincent, 1998) or are not detected at all in control sera or
sera of patients suffering from other neurological diseases (Ilyas et al., 1988;
Alaedini et al., 2002). Secondly, despite high Ab-titres being frequently observed at
onset of the disease and a reduction or even loss of titres observed during
progression of the disease (Ariga & Yu, 2006), it is not quite clear whether the Abs
themselves are responsible for induction of the disease or merely should be
considered as generated secondarily to nerve damage (Hughes et al., 1999).
However, considering plasmapheresis and the application of intravenous
immunoglobulin improve the symptoms of GBS-patients (van Doorn et al., 2010;
Walgaard et al., 2011), it can be surmised that anti-ganglioside Abs are directly

1. Introduction 4
involved in the pathogenesis of GBS (Ariga & Yu, 2005). Furthermore, patients
suffering from GBS-forms associated with a C. jejuni-infection often exhibit Abs
against GM1 or GQ1b (Willison & Yuki, 2002; Yuki et al., 1993; Yuki et al., 1994),
which - in addition to GT1a, GD3, GM2, GM3, GD1a and GD1b - share a structural
homology with oligosaccharide side chains of C. jejuni surface lipopolysaccharides
(Ang et al., 2002; Aspinall et al., 1994; Gilbert et al., 2000; Guerry et al., 2002;
Prendergast et al., 1998) (Fig.2). Thus, an Ab-mediated attack of the pathogens also
leads to production of Abs against the body’s own structures, rendering this situation
one of molecular mimicry (Yu et al., 2006). This principle has also been proven in
mice following an immunisation with C. jejuni preparations (Goodyear et al., 1999)
and further indicates that the anti-ganglioside Abs are not produced secondary to
nerve injury, but bear a more striking role in this group of peripheral nerve disorders.
At the same time, however, only about one in a thousand cases of symptomatic C.
jejuni-enteritis is followed by GBS, indicating that other factors, such as host factors,
must contribute to the disease susceptibility (Hahn, 1998; Hughes et al., 1999; Yu et
al., 2006).
Fig.2: Examples for the homology between Campylobacter jejuni oligosaccharide (OS) side-chains and gangliosides.

1. Introduction 5
1.1.3 Subtypes (Fig.3)
There are a number of subtypes for GBS. These comprise the axonal forms, acute
motor axonal neuropathy and acute motor and sensory axonal neuropathy, which
are more common in central America, China, Japan and India, and the
demyelinating form, acute inflammatory demyelinating polyradiculoneuropathy,
which is the predominant form in North America and Europe (Hughes et al., 1999).
The demyelinating type of GBS was considered the only form of GBS up until the
late 1980s when the axonal variants were “discovered” (Feasby et al., 1986).
In addition to these two major types, there also are regional variants of GBS, such
as Miller-Fisher syndrome, and forms frustes, like acute oropharyngeal palsy; these
can remain localised or develop into full-blown GBS at a later time-point (Hughes et
al., 1999; Willison, 2005).
1.1.3.1 Acute motor axonal neuropathy (AMAN)
AMAN-patients exhibit paralysis, which may be that widespread that they are
required to be ventilated artificially (McKhann et al., 1993). In electrophysiological
investigations, reduced or absent distally evoked compound muscle action
potentials are noted, whilst the nerve conduction velocities and the action potentials
of the sensory nerves remain normal (Hahn, 1998; McKhann et al., 1991). These
findings indicate a selective axonal injury to the peripheral motor nerve fibres.
The convalescence of AMAN-patients seems to occur in two subgroups: one which
exhibits a rapid improvement within the first two to four weeks after onset of disease,
and another, in which recovery is prolonged and the patients are unable to walk
independently at six months after disease onset (Hiraga et al., 2005; Kuwabara et
al., 1998a; Ogawara et al., 2000).
Necropsies of AMAN-patients reveal minimally inflammatory Wallerian-like
degeneration of the motor nerve fibres more pronounced in the ventral roots than
the peripheral nerves, indicating that the initial lesion is to be found in the spinal
roots. Demyelination of the axons remains an exception (Griffin et al., 1995).

1. Introduction 6
Fig.3: Schematic overview of the two main forms of GBS, the axonal and the demyelinating form. In both forms the Abs bind very proximal or distal areas of the PNS, areas where there is no blood-nerve barrier. In the axonal form, anti-ganglioside Abs bind directly to the axolemma of the nerve roots and NTs, whereas in the demyelinating form it is surmised that the Abs bind the outer surface of the myelinating SCs. Following activation of the complement system, this in turn leads to degeneration of proximal and distal axons with minimal demyelination and cell infiltrates in the axonal form, whereas in the demyelinating form extensive demyelination with a mononuclear infiltrate of cells is observed. In severe cases the demyelinating form is accompanied by secondary axonal degeneration.

1. Introduction 7
Ultrastructural investigations of the nodes of Ranvier (NoR) at early stages of AMAN
reveal a lengthening of the node with a local accumulation of neurofilaments in the
axon and macrophages overlying the node. In more advanced stages the
macrophages had moved into the paranodes and the internodal space, distorting
both axon and myelin sheath and leading to shrinking of the axon (Griffin et al.,
1996b). At nodes not yet undergoing degeneration, complement products are
visualised at the nodal axolemma, whilst immunoglobulin-deposits can be seen on
the internodal axolemma (Hafer-Macko et al., 1996a).
In some necropsies, the pathological changes to the nerve roots and proximal
peripheral nerves are not sufficient to be commensurate with the degree of paralysis
observed (Griffin et al., 1995; McKhann et al., 1993). At the same time, the very
extensive motor fibre degeneration observed in many necropsies is not compatible
with the rapid recovery described above (Griffin et al., 1995; Ho et al. 1997b).
Potential explanations for a rapid recovery include a) distal demyelination, b) a
reversible conduction-block along motor axons and c) degeneration restricted to the
very distal motor nerve (Griffin et al., 1995; Ho et al., 1997b; Kuwabara et al.,
1998a) with the investigation of muscle-nerve biopsies obtained from a rapidly
recovering AMAN-patient providing evidence for the third hypothesis (Ho et al.,
1997a).
Anti-GM1 and anti-GD1a are the circulating Abs predominantly found in AMAN-
patients (Kaida et al., 2000; Press et al., 2001; Willison, 2005).
1.1.3.2 Acute motor and sensory neuropathy (AMSAN)
AMSAN-patients exhibit paralysis, paresthesia and sensory loss with the occasional
involvement of CNs. Both the compound motor and sensory action potentials are
reduced, whilst conduction velocities remain preserved (Feasby et al., 1986; Griffin
et al., 1996a), indicating an axonal injury to both motor and sensory fibres. Recovery
is slow and often incomplete (Feasby et al., 1986; Griffin et al., 1996a).
In necropsies of AMSAN-patients an additional involvement of the sensory fibres
equal to the changes observed in the motor fibres in AMAN-patients is evident. In

1. Introduction 8
both dorsal and ventral nerve roots, minimal inflammatory Wallerian-like
degeneration of the axons is observed. Additionally (and equivalent to AMAN),
macrophages are present within the periaxonal space of many myelinated fibres and
only very rarely demyelination is seen (Griffin et al., 1995, 1996a).
In AMSAN-patients, the predominant Abs found also are anti-GM1 Abs (Kuwabara
et al., 1998b), indicating that these Abs might play a pivotal role in axonal damage
(Hughes et al., 1999).
1.1.3.3 Acute inflammatory demyelinating polyradiculoneuropathy (AIDP)
AIDP is the most common form of GBS in the western countries (85-90%; Hahn,
1998). Clinically, AIDP-patients exhibit weakness, which progresses to paralysis and
can require artificial ventilation. Paresthesia also is a common complaint (Asbury et
al., 1969). In electrophysiological investigations, decreased conduction velocities
and conduction blocks are noted (Hughes et al., 1999), indicating that this disorder
is based on demyelination of the axons. The lesions can occur at any site of the
nerve, i.e. predominantly proximal or distal or both, and can involve both motor and
sensory nerves, also including autonomic nerves (Asbury et al., 1969; Hughes et al.,
1999).
AIDP is considered a self-limiting disease. Once the immune-reaction has come to a
halt, the nerves remyelinate promptly, which leads to a complete recovery.
Additional axonal injury, however, complicates recovery and can lead to lasting
deficits (Hahn, 1998).
Histologically, a mononuclear inflammatory infiltration is observed. This is
predominantly lymphocytic in character, however, a macrophage component is also
noted. The myelin sheaths form ovoids and are phagocytosed. In the severe cases,
the axonal continuity is interrupted and Wallerian degeneration can be seen (Asbury
et al., 1969). Detailed investigations conducted on tissues of three subjects suffering
from the early stages of AIDP revealed complement products on the outer surface of
SCs and vesicular changes of the myelin, starting from the outer layer. At later time-
points, macrophages and extensive lymphocytic infiltrates were observed (Hafer-
Macko et al., 1996b). These findings lead to the hypothesis, that in (at least some
cases) of AIDP the abaxonal SC plasmalemma serves as a target for circulating
1. Introduction 9
Abs, which then leads to the formation of a complement on these structures and
vesicular changes to myelin beginning at the outer surface (Hafer-Macko et al.,
1996b; Willison & Yuki, 2002).
A common Ab found in AIDP-patients remains to be discovered (Hughes et al.,
1999); in these patients often a variety of anti-ganglioside Abs, such as anti-GM1, -
GM2, -GM3, -GD1a, -GD1b, -GT1b and -GQ1b Abs, are detected (Alaedini et al.,
2002; Matà, 2006; Meena et al., 2010).
1.1.3.4 Miller-Fisher syndrome (MFS)
MFS accounts for roughly 5-10% of GBS cases observed (Willison & Yuki, 2002).
Clinically, MFS-patients exhibit a characteristic triad of ophthalmoplegia, ataxia and
areflexia and serologically, anti-GQ1b Abs can be found in 96% of MFS-cases
(Hahn, 1998), rendering these Abs a reliable serologic marker. As described above,
GQ1b is strongly expressed on the extraocular nerves, which accounts for the
ophthalmoplegia observed. Additionally, serum obtained from MFS-patients binds to
cells in the molecular layer of the cerebellum (Kornberg et al., 1996), which could
account for the ataxia observed.
In general, MFS is benign. Therefore, histological investigations have only been
carried out in the cases which graduated to full-blown GBS. In these, pathological
investigations have revealed a multifocal inflammatory process in the line with AIDP
(Hughes et al., 1999).
1.1.4 Models
1.1.4.1 Spontaneous models
There are a number of naturally occurring animal diseases, which are considered
spontaneous models for GBS. These include acute canine polyradiculoneuritis
(ACP, also known as Coonhound paralysis), Marek’s disease in chicken (Stevens et

1. Introduction 10
al., 1981) and an acute paretic syndrome in juvenile White leghorn chicken (Bader
et al., 2010). Whilst ACP most accurately replicates the various features found in in
the different types of GBS, i.e. axonal (motor and sensory) and demyelinating forms
with varying cellulary infiltrates (Cummings & Haas, 1967; Northington & Brown,
1982), both avian peripheral nerve disorders seem to resemble the demyelinating
form of GBS more closely.
1.1.4.2 Experimental allergic neuritis (EAN)
Early artificially induced models for GBS were based on the observations made in
AIDP and therefore primarily focussed on the immune-mediated demyelination of
peripheral nerves. A widely applied model was (and still is) experimental allergic
neuritis (EAN), which was first described by Waksman and Adams in 1955.
Experimental allergic neuritis is primarily carried out in Lewis rats or other
susceptible rat strains.
Rats are actively immunised with purified myelin or myelin components, such as P0
protein, P2 protein, myelin basic protein or myelin-associated glycoprotein. The
immune-reaction is orchestrated by activated T-cells, which cross the blood-nerve
barrier (BNB) and induce a generized invasion of T-cell and macrophages into the
peripheral nervous system (PNS) (Maurer & Gold, 2002). Clinically and
electrophysiologically, the rats closely resemble AIDP-patients. Histological
investigations carried out in acute EAN reveal an infiltration of the nerve roots and
peripheral nerves with macrophages and lymphocytes, which closely resemble the
changes seen in AIDP. Furthermore, primary demyelination of the nerves is
observed, which can be associated with axonal damage (Maurer et al., 2002). In
addition to an induction by active immunisations, EAN can also be induced by
adoptive transfer of T-cells specific for P2 peptides, P0 or P2 peptides (Maurer et
al., 2002). It could be shown that following the induction of EAN by adoptive transfer
of specific T-cells the BNB is compromised. The systemic application of unspecific
immunoglobulin (Ig) leads to local accumulations of Igs in nerve roots (Hadden et
al., 2002).
Similar to EAN in rats, murine EAN can reliably be reproduced by actively
immunising susceptible mouse strains (SJL/L mice) with purified peripheral nerve
myelin (Xia et al., 2010).
1. Introduction 11
Interestingly, in rabbits EAN can also be induced by active immunisation with
galactocerebroside (GalC), which is a glycosphingolipid with a galactose unit, thus
very similar to a ganglioside. Galactocerebroside is a major component of central
nervous system (CNS) and PNS myelin (Linington & Rumsby, 1980; Ranscht et al.,
1987). During development of the PNS and CNS and before myelin is formed, GalC
is expressed on the surface of myelin-forming cells; the application of anti-GalC Abs
during this time inhibits the formation of peripheral myelin (Ranscht et al., 1987).
Later in life, GalC is expressed on the surface of oligodendrocytes and both
myelinating and non-myelinating SCs (Jessen et al., 1985). In GalC-EAN, quite a
length of time after the GalC-immunisations have taken place, the rabbits exhibit
paralysis, ataxia and decreased responses to pinpricks (Saida et al., 1981).
Histologically, demyelinative lesions of the PNS are observed. These are more
frequent in proximal sites when compared to distal sites and are accompanied by an
infiltration of phagocytic mononuclear cells, which are mainly macrophages. Only
very few lymphocytic infiltrates are noted, and no changes to the CNS are observed
(Saida et al., 1981). Weeks before clinical and electrophysiological changes are
noted, circulating anti-GalC Abs and deposits of anti-GalC Abs at the PNS-
predilection sites are detected (Maurer & Gold, 2002). Systemic transfer of rabbit
anti-galactocerebroside serum with high Ab-titres into rats does not induce any
clinical or histological changes (Hahn et al., 1993), whereas the intraneural
application of anti-GalC serum into rat sciatic nerves produces focal demyelination
in the rats, which is accompanied by an invasion of phagocytic mononuclear cells.
However, SC damage and disruption of myelin occur prior to the invasion of
macrophages, and following additional investigations which were associated with
heat-treatment of the serum and pretreatment of nerves with complement-activating
factors, it was surmised that demyelination and SC-injury are Ab- and complement-
mediated (Saida et al., 1979; see also 1.1.5). Additionally, the application of rabbit
anti-GalC serum into EAN-rats induced by adoptive transfer of sensitised T-cells
very much exacerbates the demyelinating changes observed in mild EAN and the
application of anti-GalC-serum into rats where the BNB has been openend
unspecifically, results in mild demyelination; however, no clinical changes are
observed (Hahn et al., 1993). Thus, the investigations conducted in EAN (especially
with the combination of rat and rabbit EAN) have revealed the potentially synergistic
roles of T-cells and Abs in demyelinating GBS.

1. Introduction 12
1.1.4.3 Models based on anti-ganglioside antibodies
Following the detection of anti-ganglioside Abs in GBS-patients (Ilyas et al., 1988),
models for GBS were expanded to include the immunisation with gangliosides.
Interestingly, here the results vary widely between the species immunised and Ab-
responses are not necessary accompanied by clinical and histological changes.
Rabbits have repeatedly been actively immunised with gangliosides, which in some
cases has also lead to GBS-like clinical, serological and histological changes
(Kusunoki et al., 1996; Moyano et al., 2008; Nagai et al., 1976; Susuki et al., 2007;
Thomas et al., 1991; Yuki et al., 2001). Depending on the gangliosides applied, the
rabbits exhibit ataxia (Kusunoki et al., 1996), reduced compound muscle action
potentials (Thomas et al., 1991) and weakness (Moyano et al., 2008) leading to
respiratory paralysis (Yuki et al., 2001). Histologically, Wallerian-like degeneration of
axons is observed in the PNS. Demyelinative lesions are minimal and no invasions
of mononuclear cells are seen (Kusunoki et al., 1996; Thomas et al., 1991; Yuki et
al., 2001). In summary, these results correspond most accurately with the clinical
and histological observations made in the axonal forms of GBS.
In mice and rats, active immunisation with the ganglioside GM1 readily leads to T-
cell independent anti-GM1 Ab titres (Freimer et al., 1993; Ilyas & Chen, 2007).
Interestingly, however, the animals do not exhibit any clinical or pathological
changes (Ilyas & Chen, 2007). Whether this is due to immunisation protocols or
differences in species and strain susceptibility, remains to be elucidated (Willison &
Yuki, 2002). Additionally, the degree to which the BNB is permeable seems to play a
role in the development of Ab-mediated neuropathy (Sheikh et al., 2004) which
makes sense considering the conclusing reached in EAN-experiments regarding a
potentially synergistic role for T-cells and Abs in demyelinating GBS. Research
conducted on endothelial cells of endoneurial origin, however, has shown that these
cells express GM3, GM1, GD1a, GD1b and GT1b (Kanda et al., 1997) and the
examination of nerve samples from patients suffering from autoimmune
demyelinative neuropathy and exhibiting antiglycosphingolipid Abs reveals a loss of
tight junctions between endothelial cells. Thus, it is surmised that circulating anti-
ganglioside Abs of the required specificity can mediate a loss of BNB-integrity,
which might in turn permit the Igs to enter the endoneurial space (Kanda et al.,
2000).

1. Introduction 13
Passive immunisations of mice with gangliosides have been fruitful and have yielded
a plethora of information regarding possible pathophysiological events in GBS and
potential treatments. Most of these investigations have been conducted on the
neuromuscular junction (NMJ) or the distal motor nerves as these sites lie outside
the BNB (Olsson, 1968) and therefore clearly provide an excellent target for anti-
ganglioside Abs, both under clinical and experimental circumstances (Ho et al.,
1997a; Plomp & Willison, 2009). The application of mouse monoclonal anti-
ganglioside Abs has been carried out both in in vivo (application of Abs to living
animals) and ex vivo systems (application of Abs to muscle-nerve preparations)
(Bullens et al., 2002; Goodfellow et al., 2005; Halstead et al., 2004, 2005a, 2005b,
2008b; McGonigal et al., 2010; O'Hanlon et al., 2001; 2003; Paparounas et al.,
1999). The advantages of the in vivo system are that the whole organism is involved
and, potentially, regenerative processes can also be observed. However, the
systemic in vivo application of anti-ganglioside Abs is relatively difficult to regulate
and maintain, due to the foreign Ab being degraded and cleared from the system.
Thus, the obvious advantages of an ex vivo application of Abs include the ease in
regulating the dose and reproducibility of investigations. However, here a limited
“life”-span of the tissue preparations provides a time barrier for extended
investigations and, obviously, no insights can be gathered on regenerative
processes.
Similar to the conclusions reached in EAN regarding the pathomechanisms of GalC-
Abs, the actions of anti-ganglioside Abs are also complement-dependent (see
1.1.5). Following the in or ex vivo application of murine anti-ganglioside Abs in mice
or mouse tissue, clear Ab-deposits are observed at the site of interest, the NMJ.
However, only very sparse deposits of mouse complement can be detected and no
pathophysiological changes are observed in the structures bound by Abs or in the
behaviour of the mice (Willison et al., 2008; see also 3.3.2). Considering it could be
demonstrated in additional investigations that the mouse monoclonal anti-
ganglioside Abs are able to activate mouse complement, it was surmised that
complement-inhibitory factors, such as protectin (CD59a), decay accelerating factor
(DAF1) or Factor H are present at the area of interest. Protectin is easily
demonstrated at the NMJ and factor H can be stained for at the NMJ when activated
complement is present. Following experiments with CD59a/DAF1 double knock-out
mice, it is hypothesised that the endogenous mouse complement fails to generate
pathological changes at the Ab-binding site due to an inability of the mouse

1. Introduction 14
complement to follow thought the entire complement cascade and produce MAC
(see 1.1.5).
One final caveat must be noted regarding the use of any artifical models, especially
those concerned with the induction of specific Abs and based on antigen/Ab
interactions. The expression (amount and localisation) of the Ab-targets, i.e. the
antigens, might vary between the species the experiments are conducted in and
when comparing species under investigation and humans. Interestingly enough, in
many studies conducted with anti-ganglioside Abs, good correlations were achieved
between the experimental subjects and humans. Anti-GD1b Abs, for example, are
associated both in rabbits (Kusunoki et al., 1996) and humans (Caudie et al., 2002;
Wicklein et al., 1997) with pure ataxic sensory neuropathies, whilst anti-GM1 Abs
are linked with weakness and a loss of compound muscle action potentials both in
rabbits (Yuki et al., 2001) and in humans (Caudie et al., 2002; Willison, 2005). In
contrast to this, the extent of the expression of sulphated glucuronyl glycolipids
(components of peripheral nerves), however, varies between animal species (Ilyas
et al., 1986) and this is surmised to be the reason why following an active
immunisation with these glycolipids an ataxic sensory neuronopathy can be elicited
in cats, but not in rabbits and rats (Ilyas et al., 2008). Following the immunisation,
the rabbits exhibit mild clinical changes but not pathology, whereas rats exhibit large
Ab-titres but no clinical or pathological abnormalities. Interestingly, the pathological
changes observed in the cats do not quite correlate with changes observed in
humans suffering from the same Abs and clinical symptoms (Ilyas et al., 2008). This
stresses the fact that all animal models remain to be a model and do not necessarily
replicate all the events taking place in the “original disease”, but only can give
potential explanations for disease pathophysiology and progress. Regarding the use
of anti-ganglioside Abs it needs to be stressed that characterisation of ganglioside
distribution profiles and antiganglioside Ab-binding patterns is essential before the
interpretation of results.
1. Introduction 15
1.1.5 Anti-ganglioside Ab-mediated pathophysiology
Investigations conducted in mice following the application of anti-ganglioside Abs
and an external source of complement have shown that following the binding of the
anti-ganglioside Abs to neural (motor nerve terminal; NT) and glial (perisynaptic
SCs; pSC) structures at the NMJ, the complement system is activated (Fig.4), which
then leads to a formation of the membrane attack complex (MAC) and injury of the
structures bound (Halstead et al., 2004, 2005b). The application of anti-GT1a Abs
combined with a source of complement leads to a selective injury of the NTs,
whereas the application of anti-GD3-Abs combined with a source of complement
preferencially induces pSC injury (Halstead et al., 2005b; for more detailed
information see chapter 3.3.1). Membrane attack complexes are a the complement
factors C5b, C6, C7, C8 and C9 combined (see Fig.4) of which the C5b-7 complex
mediates the binding to the cell membrane bound by Ab. Association of C8 to the
C5b-7 complex leads only to unstable pore formation on the membrane, whereas
the binding of one C9 to a C5b-8 complex rapidly leads to a transformation of C9
and an incorporation of up to 16 molecules of C9 into the final complex. C9
polymers consisting of more than 6 C9 molecules form a tubular structure with an
external diameter of 20 nm, an internal diameter of 5 nm and a height of 15 nm. The
functional size of a MAC-pore is between 1 and 11 nm; the more C9 molecules are
incorporated into the complex, the bigger the pore (Tegla et al., 2011).
The presence of C1q and C4 indicates that the classical complement activation
pathway is in operation in the murine model of GBS, while the alternative pathway
can be ruled out as a primary source of MAC due a Ca2+-dependency of the
process. The lectin pathway cannot be excluded (Halstead et al., 2004). In the
absence of C6 (which prevents the formation of MAC), only further upstream
components of the complement cascade such as C3c can be detected; there are no
MAC-deposits and neither functional nor morphological changes to the NTs are
observed (Halstead et al., 2004). Similar observations are made in the absence of
C7 and regarding an injury to the pSCs (Halstead et al., 2004). The addition of
Eculizumab or rEV576, which both bind to C5, thus preventing the formation of C5a
and C5b and effectively stopping the complement cascade at this level, completely
prevent the deposition of MAC and the occurrence of morphological and functional
changes to the neural and glial structures of the NMJ, while once again further
upstream complement components (C3c) are still readily detected (Halstead et al.,

1. Introduction 16
2008a, 2008b). The application of the complement inhibitor APT070 leads to the
same results (Halstead et al., 2005a).
Investigations conducted at the NoR confirm the observations made at the NT.
Following the application of anti-ganglioside Abs, IgG- and complement-deposits are
observed (McGonigal et al., 2010; Paparounas et al., 1999). Here, the application of
the complement-inhibitor Eculizumab together with the source of complement, leads
to a protection of the nodal proteins, including the sodium channel Nav1.6, and a
preservation of the sodium current upon perineural recordings (McGonigal et al.,
2010). The finding that MAC plays a major effector role in this model for anti-
ganglioside Ab-mediated injury correlates well with the localised IgG and
complement activation products demonstrated at the NoR and also on the
axolemmal surface in AMAN patients (see 1.1.3.1) (Hafer-Macko et al., 1996a).
The deposition of MAC (pores) on the axonal and glial surface leads to an
uncontrolled influx of ions, small molecules and water into the NT and pSCs along
the diffusion gradient (Acosta et al., 1996; Morgan et al., 1986). This includes all
ions, however, especially the passive influx of Ca2+, possibly exacerbated by a
breakdown or reversal of the Na/Ca exchanger (LoPachin & Lehning, 1997), which
has been shown to be specifically concentrated at the presynaptic NT (Luther et al.,
1992), leads to a massive increase in intraaxonal Ca2+. This in turn has many
effects, such as the overload and disruption of mitochondria, metabolic depletion
due to an increased expenditure of energy to maintain the ionic gradients, and the
activation of a number of Ca2+-dependant proteases (Morgan et al, 1986). Recent
research has attributed the mitochondria a pivotal role in the process of nerve
degeneration (Barrientos et al., 2011). One of the Ca2+-dependant proteases is
calpain, and neurofilament (NF), which stabilises the axonal cytoskeleton and
determines its caliber (Schlaepfer, 1987), acts as a substrate for calpain (Chan &
Mattson, 1999).

1. Introduction 17
Fig.4: Activation of the complement system followin g the binding of anti-ganglioside Abs on target structures.

1. Introduction 18
1.1.6 Anti-ganglioside Ab-mediated pathology
Following the application of anti-ganglioside Abs and a source of complement, a
loss of NF (both phosphorylated and un-phosphorylated) (O'Hanlon et al., 2001,
2003) and β-tubulin, swollen mitochondria (with abnormal or absent cristae) and
decreased amounts of vesicles located to the pre-synaptic active zone are seen
(Goodfellow et al., 2005; Halstead et al., 2005b; O'Hanlon et al., 2001). Additionally,
the presence of pSC processes invading the synaptic cleft or even “wrapping” the
NT can be observed (Halstead et al., 2005b; O'Hanlon et al., 2001, 2003).
Application of the calpain-inhibitor AK295 (or other calpain-inhibitors) leads to a
preservation of NF-heavy (McGonigal et al., 2010; O'Hanlon et al., 2003)
Perisynaptic SCs, when targeted by anti-ganglioside Ab and complement-mediated
injury, exhibit a nuclear uptake of Ethidium, swollen and electron-lucent cytoplasm,
damaged organelles, fragmented processes and perinuclear cell bodies (Halstead et
al., 2004, 2005b). Ethidium is a nuclear marker whose cellular ingress und
subsequent nuclear binding indicates a loss of the cell membrane integrity.
1.1.7 Anti-ganglioside Ab-mediated clinical and electrophysiological changes
Mice supplied systemically with anti-ganglioside Abs and a source of complement
exhibit acute respiratory problems with a decrease in tidal volumes and respiratory
rate. This is accompanied by a decrease in grip strength (Halstead et al., 2008b).
Electrophysiological investigations conducted at the NMJ reveal an initial massive
increase of miniature endplate potentials, followed by a block of synaptic
transmission due to an inability to release acetylcholine (Goodfellow et al., 2005;
Halstead et al., 2008b; Plomp & Willison, 2009); these changes have been attributed
to dysfunction of the motor NTs, as acute injury to the pSCs alone does not seem to
affect the electrophysiologic properties of the NMJ (Halstead et al., 2005b). At more
proximal sites, a complete loss of the perineural K+ and Na+ flow is observed
(McGonigal et al., 2010).

1. Introduction 19
1.2 The neuromuscular junction
Over the last century, the vertebrate NMJ has been closely examined in many of its
aspects including structure, function, development, maintenance and plasticity,
which renders the NMJ the most thoroughly investigated synaptic structure (Balice-
Gordon, 1997a; Sanes & Lichtman, 1999). The reasons for these rigorous efforts lie
in the fact that the NMJ was and still is considered a fairly simple, large, and easily
accessible model system for synapses (Astrow et al., 1994, 1998; Lampa et al.,
2004; Patton, 2003; Ribchester, 2009; Rochon et al., 2001; Sanes & Lichtman,
1999; Wigston, 1990) especially when compared to those located in the central
nervous system (Balice-Gordon, 1997b; Lu & Lichtman, 2007). However, in recent
years, research on the NMJ in its own right has been driven forward, after it was
shown that the architecture and composition of the NMJ is compromised in various
congenital myasthenic syndromes (Hughes et al., 2006). Furthermore, the motor
NTs are the first areas to degenerate in dying-back neuropathies (Luo & O’Leary,
2005; Saxena & Caroni, 2007) such as amyotrophic lateral sclerosis (Dadon-
Nachum et al., 2011) and acrylamide intoxication (Jennekens et al., 1979), and are
targeted by a number of bacterial, spider and snake toxins (Cull-Candy et al., 1976;
Dixon & Harris, 1999; Duchen et al., 1981; Duchen & Strich, 1968; Duchen & Tonge,
1973; Gopalakrishnakone & Hawgood, 1984; Hucho, 1995). In addition to this, the
different structures of the NMJ also pose as targets for auto-antibody-mediated
attacks in Lambert-Eaton myasthenic syndrome, myasthenia gravis and possibly
also acquired neuromytonia (Hughes et al., 2006; Vincent, 2008).
1.2.1 Research carried out on the NMJ: tools, techniques and sites
Progress in research on the NMJ has largely been determined by the tools available
(Hughes et al., 2006; Sanes & Lichtman, 1999). The first descriptions of “nerve
endings” date back to 1836, however, it was only Doyere, in 1840, who first
described that the nerve terminates on the muscle (and does not form an arc which
runs back to the CNS as a sensory fibre as surmised in the earlier descriptions) (Lu
& Lichtman, 2007). These investigations triggered numerous studies of motor NTs in
varies species, one of the most complete being published by Kuehne in 1887, who
together with Ranvier mainly used a gold impregnation method to stain the terminal

1. Introduction 20
axonal branches (Lu & Lichtman, 2007). Subsequent development of the silver-
staining technique was employed by researchers such as Retzius, Cajal and Tello.
However, it was Paul Ehrlich, who already in 1886 introduced the vital dye
methylene blue (Lu & Lichtman, 2007). Development of the electron microscope in
the 1950s made it possible to examine the structures involved more closely (Lu &
Lichtman, 2007; Ribchester, 2009), whereas advances in modern biological
technologies at the end of the 20th century facilitated the isolation of individual
molecules involved in signaling (Sanes & Lichtman, 1999). In recent years, strong
progress was made both in imaging techniques and fluorescent probes binding to
various components of the NMJ. These include the NT-stains 4-(4-
diethylaminostyryl)-N-methylpyridium iodide, RH 795, tetanus toxin and FM1-43,
calcein blue acetoxymethyl ester which labes the pSCs, various lectins such as
peanut agglutin, which label the synaptic basal lamina, and α-bungarotoxin (BTx)
which selectively binds to the nicotic acetylcholine receptors (nAChRs), the
muscular component of the NMJ (also see 1.2.3) (Astrow et al., 1998; Balice-
Gordon, 1997b; Betz et al., 1992; Magrassi et al., 1987; O'Malley et al., 1999).
Especially the “construction” of transgenic animals, which express fluorescent
proteins in neurons/axons and various glial cells, such as SCs (Feng et al., 2000;
Livet et al., 2007; Zuo et al., 2004) has proven extremely helpful in this kind of
research (Hayashi et al., 2008; Lichtman & Sanes, 2003; Magill et al., 2007, 2008).
Investigations of the NMJ have been conducted in various different sites and
animals. The most popular sites include the sartorius (Herrera et al., 1990) and
cutaneous pectoris muscle (Georgiou & Charlton, 1999) in the frog, the
sternocostalis (Kemplay & Stolkin, 1980), bulbocavernosus (Lubischer & Bebinger,
1999), soleus (Lubischer & Thompson, 1999), gastrocnemius (Ma et al., 2002;
Mehta et al., 1993) and extensor digitorum longus muscle (Love & Thompson, 1998)
in the rat, and the levator auris longus (Rochon et al., 2001), gluteus (Balice-
Gordon, 1997b), soleus (Fahim et al., 1983; Wigston, 1989), gastrocnemius
(Wigston, 1990), extensor digitorum longus (Fahim et al., 1983), flexor digitorum
brevis (Halstead et al., 2004), bulbocavernosus (Balice-Gordon, 1997b), triangularis
sterni (Bishop et al., 2004; Goodfellow et al., 2005; Kerschensteiner et al., 2008),
diaphragm (Bullens et al., 2002; Halstead et al., 2004; O'Hanlon et al., 2001) and
sternomastoid muscle in the mouse (Balice-Gordon, 1997b; de Paiva et al., 1999;
Lichtman et al., 1987; O'Malley et al., 1999; Rich & Lichtman, 1989b).
Developmental stages examined reach from embryos, over neonates to adult or

1. Introduction 21
senile individuals (Balice-Gordon, 1997b; Fahim et al., 1983; Love & Thompson,
1998; Trachtenberg & Thompson, 1996).
All mammalian muscles listed above share two traits, namely that their muscle
fibres, physiologically, are singly innervated by only one axon and that their NMJs
exhibit an en plaque morphology. These features are the norm in the mammalian
muscle, however, amphibian, reptile, avian and some mammalian muscles also
have muscles fibres, which are multiply innervated and exhibit en grappe synapses
(Morgan & Proske, 1984; Hughes et al., 2006). En plaque endplates, which are
found mostly on mammalian twitch muscle fibres, are about 50 µm in diameter
(Hughes et al., 2006) and physiologically are clustered in a central endplate band
across the muscle (Sanes & Lichtman, 1999). In contrast to this, en grappe endings
are found on tonic or intermediate muscle fibres, exhibit a smaller diameter of only
10 to 16 µm and usually are dispersed along the entire length of individual muscle
fibres (Hughes et al., 2006). The latter fibres, unlike twitch muscle fibres, do not
respond to a single neural input with a single action potential, but rather are
activated by a passive spread of depolarisation from multiple nerve endings, which
results in continuous contractions lasting over time (Hughes et al., 2006). In
mammals, muscle fibres of the extraocular, laryngeal, intrinsic ear and tongue
muscles as well as the intrafusal fibres found in muscle spindles contain multi-
innervated fibres with both en plaque and en grappe endings (Matthews, 1981;
Morgan & Proske, 1984; Subramani et al., 1986; Hughes et al., 2006). In the
following all information is related to en plaque NMJs.
1.2.2 Formation and maturation of the NMJ
During the first postnatal weeks all mammalian en plaque NMJs share a elliptical
plaque-like appearance and are multiply innervated (Ma et al., 1999). Their shape,
however, becomes more distinguished over the next few weeks due to changes in
input, so that mature NMJs have been likened to the form of pretzels, with each
NMJ exhibiting a distinct and individual appearance and supplied by a single axon
(Bishop et al., 2004; Sanes & Lichtman, 1999). During further growth of the
organism the NMJs have been described not to change anymore in their geometry
and shape, only in size (Balice-Gordon, 1997a, 1997b; Kang et al., 2007; Lichtman

1. Introduction 22
et al., 1987; Lubischer & Bebinger, 1999; Powell et al. 1982; Son et al., 1996;
Wigston, 1990). A mature NMJ physiologically persists for life, remodeling of small
areas, however, can be observed and attributed to changes in input or activity
(Wigston, 1990). In general, the extent of NMJ remodeling seems to rely on the age,
species and muscle observed.
Frog NMJs seem to undergo a lot more changes when compared to NMJs of young
adult (three to six-month old) mice (Herrera et al., 1990; Wigston, 1990). The
sternomastoid muscle in such mice exhibits hardly any changes when examined
over a period of three to six months (Lichtman et al., 1987; Sanes & Lichtman,
1999), whereas approximately one seventh of NMJs in the gastrocnemius muscle
(Wigston, 1990) and close to half of the NMJs in the soleus muscle in mice undergo
significant remodelling in the same period of time (Wigston, 1989). The reason for
these discrepancies in observations might lie in the different approaches applied for
these studies, i.e. the application of presynaptic (Lichtman et al., 1987) or
postsynaptic dyes (Wigston, 1989) or both (Wigston, 1990). Alternatively, the
amount of fast- and slow-twitch muscle fibres per muscle has been proposed to play
a role, too (Wigston, 1990). Muscles containing mostly fast-twitch fibres, like the
sternomastoid, the bulbocavernosus and gastrocnemius muscles in the mouse,
exhibit less plasticity (changes) when compared to those consisting to a greater
degree of slow-twitch fibres, like the soleus muscle (Wigston, 1990). In embryonic
and young adult mice up to 3 months of age, NMJs can further be divided into “fast
synapsing” and “delayed synapsing” NMJs, which is independent from which kind of
muscle fibres these are located on, but nevertheless has an impact on the stability
of the different neuromuscular components during synaptogenesis and following
toxin- and denervation-induced paralysis (Pun et al., 2002; Santos et al., 2003). A
drastic increase of instability of synapses has been reported once mice have
reached the age of one year. This instability becomes quite marked at an age of 18
to 20 months, so that 24- to 36-month-old mice exhibit significant losses both in pre-
and postsynaptic components of the NMJ even in the otherwise relatively stable
sternomastoid muscle (Balice-Gordon, 1997a, 1997b). Other researchers report an
increase in the number of intrasynaptic nerve branches in association with an
increased number of primary clefts on the postsynaptic sites in 29-month-old mice,
rendering the pre-and postsynaptic apparatus observed a lot more complex than
compared to those in seven-month-old mice (Fahim et al., 1983).

1. Introduction 23
1.2.3 Anatomy of the NMJ (Fig.5)
The NMJ is a tripartite synapse consisting of a) a presynaptic component, the motor
NT, b) a postsynaptic component, the nAChRs, and c) glia, the pSCs (Balice-
Gordon, 1997b; Feng & Ko, 2007; Hughes et al., 2006; Ribchester, 2009; Sanes &
Lichtman, 1999). Recent research has provided mounting evidence of a fourth
component of the NMJ, a fibroblast-like cell, which lies outside the synaptic basal
lamina, caps the NMJ in total and thus has been named ‘kranocyte’ (Court et al.,
2008; Ribchester, 2009; Fig. 5C).
The motor NT is polarised (Patton, 2003), with most of the synaptic vesicles
clustered in that half of the terminal which faces the muscle. The ab-junctional half
mostly incorporates mitochondria, which provide the energy for neurotransmitter
synthesis and release (Sanes & Lichtman, 1999), and also buffer intracellular Ca2+
(Hughes et al., 2006). The synaptic vesicles, which have an approximate diameter
of 30-50 nm and are filled with the neurotransmitter acetylcholine (ACh), are once
again concentrated in so-called active zones (Patton, 2003) and are associated with
voltage-dependant K- and Ca2+-channels (Hughes et al., 2006; Sanes & Lichtman,
1999). Following the arrival of an action potential at the NT, Ca2+ enters the NT and
leads to a marked increase of the local Ca2+-concentration. This triggers the fusion
of the synaptic vesicles with the preterminal axonal membrane, thus resulting in the
release of ACh into the synaptic cleft. Additionally, to being Ca2+ -dependent, this
process also relies on various SNARE (soluble NSF (N-Ethylmaleimide-Sensitive
Factor) Attachment Protein receptor) -proteins associated with both the presynaptic
NT membrane and the vesicle membranes (Hughes et al., 2006). Other molecular
structures on the NT surface feature the α-latrotoxin receptor (Lelyanova et al.,
2009), which mediates the binding of the black widow spider venom, A2A adenosine
receptors (Baxter et al., 2005) and gangliosides, which act as receptors for the
neurotoxins tetanus toxin and botolinum toxin (van Heyningen, 1974; see also 3.5.4)
Once released, the ACh transverses the short synaptic cleft, which is roughly 50 to
80 nm wide (Hughes et al., 2006; Yamagata et al., 2003), thus about two to three
times wider than the average interneuronal synaptic cleft (Patton, 2003), and is
taken up by the nAChRs. These nAChRs are ligand-gated ion channels (Hughes et
al., 2006) and are located on the postsynaptic membrane. The postsynaptic
membrane of the muscle fibre has the shape of a shallow indent opposite the NT

1. Introduction 24
and is organised in about 1 to 2 µm deep junctional folds, the secondary synaptic
folds. The nAChRs are located at a concentration of more than 10,000 per µm2
(Hughes et al., 2006; Sanes & Lichtman, 1999) in direct apposition with the
presynaptic active zones at the crest and partly down the sides of the secondary
folds, whereas Na-channels are located in the depths of these folds (Sanes &
Lichtman, 1999).
Fig.5: The neuromuscular junction . A schematic overview; B NMJ in a mouse expressing cyan fluorescent protein (CFP; blue in composite image) in its axons and green fluorescent protein (GFP; green in composite image) in its SCs. Additionally, the nicotinic acetylcholine receptors are stained with rhodamine-conjugated bungarotoxin (BTx; orange in composite image). C Location of the kranocyte (stained with anti-GM1 Ab; orange in composite image) in relation to the nerve terminals (CFP; blue in the composite image) and pSCs (GFP; green in the composite image). Scale bars: 20 µm.

1. Introduction 25
Located within the synaptic cleft, and extending into the junctional folds, is the basal
lamina which ensheaths every muscle fibre. The composition of this is similar to
other basal laminae in the body, namely collagen IV, laminin, entactin, perlecan and
fibronectin (Patton, 2003). In addition to these, however, further molecules like
acetylcholinesterase (Hughes et al., 2006; Sanes, 1995) for the clearance of
neurotransmitter (Patton, 2003) and agrin and neuregulin, two molecules important
for postsynaptic differentiation and the clustering of nAChRs (Martin, 2003;Sanes &
Lichtman, 1999), can be found. Generally, it is assumed that the synaptic basal
lamina in its unique composition of molecules organises and maintains the
architectural specialisation of the pre- and postsynaptic components of the NMJ
(Patton, 2003).
On top of the NT the pSCs are situated, isolating the NMJ from the environment
(Sanes & Lichtman, 1999). Physiologically, each NMJ (both in mammalian and
amphibian organisms) is associated with between three and five pSCs (Auld &
Robitaille, 2003; Hughes et al., 2006; O'Malley et al., 1999). This number seems to
be relatively tightly regulated and depends on the endplate size (Love & Thompson,
1998; Lubischer & Bebinger, 1999; Zuo et al., 2004) Unlike the preterminal SCs,
which wrap themselves around to the motor axons and produce myelin, the pSCs do
not produce any myelin and only cap the NT with their cell bodies and processes
(Balice-Gordon, 1996).
The apposition between pSCs and NTs is estimated to approximately 10-20 nm and
no basal lamina intervenes (Griffin & Thompson, 2008). In the amphibian NMJ, the
processes of pSCs invade the synaptic clefts (Auld & Robitaille, 2003; Griffin &
Thompson, 2008), whereas in mammalian NMJs the synaptic basal lamina inhibits
the pSCs from doing so (Sanes & Lichtman, 1999). Invading processes can only be
seen at mammalian NMJs under pathological conditions, such as following NT
degeneration (Manolov, 1974; Miledi & Slater, 1970; Winlow & Usherwood, 1975),
and habitually are observed in the mouse model of GBS described above (Halstead
et al., 2004; O'Hanlon et al., 2001). In the event of a genetic deficiency for synaptic
acetylcholinesterase or after chronic administration of anti-acetylcholinesterase, the
pSCs also extend processes into cleft; this is seen as compensatory mechanism to
reduce the amount and duration of ACh in the cleft during synaptic activity (Hughes
et al., 2006). In general, pSC processes have been described as very dynamic
(Kang et al., 2007).

1. Introduction 26
1.3 Schwann cells
1.3.1 Origin
Both myelinating and non-myelinating SCs arise from the neural crest, together with
a variety of other neural and non-neural cells, such as neurons (for sensory,
sympathetic and enteric ganglia), melanocytes, satellite cells, endoneurial
fibroblasts (Joseph et al., 2004) and endocrine cells. Neural crest cells of the
cephalic domain of the neural crest even give rise to mesenchymal cells, which
eventually will form cartilage, bone, dermis, connective tissue in muscles and
glands, meningeal cells and adipocytes (Dupin et al., 2007; Le Douarin et al., 2008).
The differentiation of multipotent neural crest cells seems to be strongly determined
by the environment into which these cells migrate (Dupin et al., 2007) and once
these cells have reached post-migratory stages, they are fairly restricted in their
developmental potential. Various experiments, however, in which neural crest
derived cells were removed from their differentiated tissues and subjected to a new
environment, have exhibited a reversal of differentiation programmes and recovery
of multipotential properties in these cells. In addition to this, pluripotent progenitors
for glia, autonomic neurones and myofibroblasts and also a distinct line of bipotent
cells, yielding myofibroblasts and glia, have been shown to be capable of self-
renewal (Dupin et al., 2007; Stemple & Anderson, 1992).
1.3.2 Differentiation and maturation
Differentiation of the neural crest stem cells to SCs occurs in two steps during
embryonic development. In mice, SC precursors have been formed from neural
crest stem cells around embryonic day (E) 12/13 (Jessen & Mirsky, 2005). These
then develop into immature SCs, which are present around E15/16 until the time of
birth (Jessen & Mirsky, 1999; Woodhoo & Sommer, 2008). Schwann cell
proliferation rates are their highest during the immature SC stage (Woodhoo &
Sommer, 2008).

1. Introduction 27
Both SC precursors and peripheral axons traverse the body together on their way to
connect the periphery with the central nervous system, with the axons leading the
way (Koirala et al., 2003). At this stage of development, the SC precursors are likely
to provide trophic support for the sensory and motor neurons, in addition to being
essential for the development of the normal nerve fasciculation (Jessen & Mirsky,
2005). At the same time the SC precursors are dependant on neuregulin which is
produced by the axons (Birchmeier & Nave, 2008; Jessen & Mirsky, 1999) and
binds to ErbB receptors on the SCs (Hayworth et al., 2006). Differentiation of the
immature SCs into myelinating and non-myelinating forms seems to depend on
which axons they randomly have been associated with; SCs associated with single
large diameter (> 1 µm) axons turn into myelinating SCs (Jessen & Mirsky, 2005)
and this, in addition to the thickness of myelin produced by the SC, once again is
mediated by neuregulin (Birchmeier & Nave, 2008). Following nerve injury, both
mature myelinating and non-myelinating SCs revert to a phenotype similar to that of
immature SCs. Schwann cells precursors can (in vitro) be persuaded to form other
neural crest derivatives. Only the transition from SC precursor to immature SC
seems to be irreversible (Jessen & Mirsky, 2005). This then means that once the
neural crest cell has differentiated into a SC precursor, it will become a (myelinating
or non-myelinating) SC. There is not clear evidence for the persistence of a
precursor population in mature nerves (Jessen & Mirsky, 1999)
Denervation of the NMJ in the first two weeks of life results in the pSCs undergoing
apoptosis and this loss extends along the efferent axon into the myelinating SC
population. Application of glial growth factor, a member of the neuregulin family,
prevents the apoptosis in vivo (Trachtenberg & Thompson, 1996), further indicating
the dependency of SC to axons in this stage of development. During the maturation
of SCs in the early postnatal life, however, the SCs establish an autocrine survival
mechanism which renders them independent from axonal neuregulin-production
(Jessen & Mirsky, 1999).

1. Introduction 28
1.3.3 Perisynaptic Schwann cells
1.3.3.1 Distribution
At birth, no or only one pSC body can be found on most rat NMJs (Love &
Thompson, 1998). This one pSC forms a loose cap over multiple axonal bulbs
(Hirata et al., 1997), whereas in the adult only one pSC is responsible for one
terminal bouton (Sanes & Lichtman, 1999). Neuromuscular junctions with no visible
pSC body are covered by processes extending down from cells located on the
preterminal axon (Love & Thompson, 1998).
The most dramatic increase of pSCs occurs during the first two weeks of life in rats
(Love & Thompson, 1998). The increase in pSC number is attributed to migration (at
least for the first pSC), followed by a considerable rate of mitosis. Two- to four-
month-old rats exhibit two to four pSC bodies at each NMJ (Hirata et al., 1997; Love
& Thompson, 1998) and over the next year only one or two pSCs are added to each
NMJ (Love & Thompson, 1998). Reportedly, up to nine pSC bodies per NMJ can be
counted in young adult rats and mice (O'Malley et al., 1999; Reynolds & Woolf,
1992). Mitosis of pSCs, however, is not seen under physiological circumstances
(Love & Thompson, 1998) and the number of pSCs in adult NMJs is remarkably
stable (O'Malley et al., 1999).
In general, large NMJs are associated with more pSCs than small NMJs (Love &
Thompson, 1998; Lubischer & Bebinger, 1999) and shrinkage of endplates due to
muscle fibre atrophy or gradual decrease of nAChRs in old individuals is associated
with loss of pSCs (Lubischer & Bebinger, 1999; Sanes & Lichtman, 1999).
1.3.3.2 Function
Despite numerous studies trying to elucidate the role of the pSCs at the NMJ, not
much is know regarding their regular function, especially in mammals (Griffin &
Thompson, 2008).

1. Introduction 29
It has been shown, however, that, like glial cells at central nervous system
synapses, pSCs can detect neuronal activity at the NMJ. They respond to release of
neurotransmitter from the motor NT with a rise in intracellular Ca2+ derived from
internal stores (Georgiou et al., 1994; Jahromi et al., 1992; Rochon et al., 2001),
which in the frog in turn potentiates the release of neurotransmitter probably via
second messager-cascades (Castonguay & Robitaille, 2001). Additionally, it has
been shown that frog pSCs can influence synaptic efficacy via G-protein signaling,
which are linked downstream to purinergic, adenosine and peptidergic receptors
(Robitaille, 1998). In mice, the increase of intracellular pSC Ca2+ levels is mediated
both by muscarinic AChR and adenosine A1 receptors (Rochon et al., 2001).
Extracellular Ca2+ negatively affects the pSCs to respond to the release of
neurotransmitters (Rochon et al., 2001). Following denervation of NMJ or electrical
stimulation of pSCs, frog pSCs also seem to be able to release ACh (Bevan et al.,
1973; Dennis & Miledi, 1974). The ACh-release following stimulation of the pSCs is
Ca2+-independent, relatively “explosive” and accompanied by an extensive changes
of the pSC-morphology (Dennis & Miledi, 1974).
Selective ablation of frog pSCs from the NMJ acutely does not seem to affect NMJ
structure and function, whereas loss of pSCs for one week or more, results in the
NTs retracting from the NMJ and a reduction in synaptic transmission (Reddy et al.,
2003).
In addition to the functions described above, a role for the pSCs in “pruning” of
neonatal multiple innervation of NMJs (Hirata et al., 1997; Love & Thompson, 1998),
clustering of nAChRs (Koirala et al., 2003) and phagocytosis of cell debris
(Reynolds & Woolf, 1992) have been described.
1.3.3.3 Perisynaptic Schwann cells and NMJ denervation
As indicated above, denervation of motor endplates in neonatal rats results in the
pSCs undergoing apoptosis, as at that stage these cells are still trophically
dependant on axons (Lubischer & Thompson, 1999; Trachtenberg & Thompson,
1996).

1. Introduction 30
Denervation of mammalian NMJs after that age, however, induces pSCs to change
from a steady into a reactive form. These changes are mediated by an autocrine
neuregulin signaling pathway (Hayworth et al., 2006) and result in the pSCs
extending processes towards neighbouring NMJs (Reynolds & Woolf, 1992), which
then form an extensive interconnecting network (Son et al., 1996). This process is
preceded by proliferation and spreading of the kranozytes capping the NMJ (Court
et al., 2008). The reactive forms of pSCs themselves display characteristics of
earlier developmental stages (Son et al., 1996) and once reinnervation is complete,
the pSC processes are withdrawn (Reynolds & Woolf, 1992).
In completely denervated muscles, regenerating axons extend towards the
periphery along the bands of Büngner until they reach an endplate. Due to the
network of pSC processes between the endplates, however, the axons often do not
stop there, but continue growing along the intercalating pSC processes to other
NMJs (Son & Thompson, 1995b). This is the basis for (muscle) fibre type clustering
after reinnervation and also often leads to multiple innervation of individual muscle
fibres (Son & Thompson, 1995b; Son et al., 1996). Only once the endplates have
regained innervation, some pSCs can undergo mitosis (Love & Thompson, 1998).
In partly denervated muscles, the pSC processes extending from denervated
endplates preferentially contact still innervated endplates (Love & Thompson, 1999),
induce the intact NTs there to grow and then guide the motor sprouts towards “their”
denervated motor endplate, so that these motor axons end up providing innervation
to another NMJ in addition to their original endplate (Son & Thompson, 1995a). In
addition to inducing axonal growth, processes extending from denervated endplates
also induce pSC mitosis on innervated NMJs (Love & Thompson, 1998; Lubischer &
Thompson, 1999).
The event of mitosis in adult pSCs, therefore, seems to require two prerequisites.
Firstly, a preceding denervation at the same or a different site, and secondly, axon-
pSC contact. The latter further implies that a nerve-derived factor probably is
necessary to induce mitosis. Several signaling molecules, including neuregulin,
platelet-derived growth factor, fibroblast growth factor and calcitonin gene-related
peptide have been proposed to be responsible for this (Love & Thompson, 1998). In
addition to this, reactive pSCs might also be responsible for providing the stimulus,
which potentially could be TGF-β or neuregulin (Love & Thompson, 1998). Recent

1. Introduction 31
experiments indicated a role for neuregulin signaling in inducing pSC mitosis (and
migration (Trachtenberg & Thompson, 1997)) at NMJs; the source of this, however,
remains to be determined (Hayworth et al., 2006).
1.3.3.4 Markers
The most commonly used SC probe is S100, which labels both myelinating and non-
myelinating SCs (Koirala et al., 2003); in mouse SC precursors low levels of S100
might be detected with increasing sensitivity of the assay (Jessen & Mirsky, 2005).
In general, S100 proteins are Ca2+ binding proteins and act primarily as intracellular
Ca2+ receptors, some, however, also extracellularly. There are roughly 16 different
S100 proteins (Zimmer et al., 1995), of which S100B is commonly used as a marker
for glial cells (Zuo et al., 2004). S100B has been described to play a role in cell-cell
communication, cell structure, growth, metabolism and intracellular signal
transduction (Zimmer et al., 1995). Interestingly, in frogs, myelin associated proteins
P0 and myelin-associated glycoprotein also label both myelinating SCs and pSCs
(Georgiou & Charlton, 1999). All non-myelinating SCs can be labelled with Abs to
glial fibrillary acidic protein (Jessen & Mirsky, 2005) and the cell-surface glycoprotein
CD44 (Gorlewicz et al., 2009); peanut agglutin and mAb 2A12 specifically label the
external surface of frog (and in the case of mAB 2A12 also avian) pSCs (Astrow et
al., 1998), but unfortunately not mammalian pSCs (Koirala et al., 2003). However,
Calcein blue, a cell permanent dye has recently been used to label mammalian
pSCs in vivo (O'Malley et al., 1999).
LNX1 is an ubiquitin kinase which is specifically localised to mouse pSCs (compared
to myelinating SCs). The expression of this protein is at its maximum roughly at
postnatal week two to three and then persists in adults. Following denervation, it
cannot be stained for anymore (Young et al., 2005). In direct contrast to this,
semaphorin 3A is predominantly expressed in the pSCs of postnatal developing
(until day 21) and denervated muscles and here selectively in pSCs of type IIb/x
(fast-fatigable) muscle fibres (De Winter et al., 2006). The monoclonal Ab 4E2,
which recognises a truncated nestin protein (Kang et al., 2007), weakly stains rat
myelinating SCs, whereas pSCs do not exhibit any levels of immunoreactivity at all.
Following denervation of the NMJ (or blockade of neurotransmitter release), pSCs

1. Introduction 32
become strongly nestin immuno-positive until reinnervation of the NMJ has occurred
(Astrow et al., 1994; Kang et al., 2007). Similarly, the blockade of nerve activity (or
nerve transection of the efferent) results in the up-regulation both of glial fibrillary
acidic protein (Georgiou et al., 1994), which might be important in inducing process
extension (Love & Thompson 1998), growth-associated-protein (GAP) -43, which
coincides with the onset of process extension (Woolf et al., 1992) and the low-
affinity nerve growth factor receptor p75 (Reynolds & Woolf, 1992).
Thus, the markers for semaphorin 3A, nestin, glial fibrillary acidic protein
(upregulated), p75 and GAP-43 indicate the reactive state of pSCs.
1.3.4 Schwann cells as targets in pathological processes
Myelinating SCs are affected by a number of hereditary demyelinating disorders.
These include Charcot-Marie-Tooth disease and the lysosomal storage diseases,
globoid cell and metachromatic leukodystrophy (Scherer & Wrabetz, 2008; Suzuki,
2003). Additionally, these cells can suffer from metabolic disturbances, such as
oxidative stress after ischemia-reperfusion injury to the peripheral nerve in both
normal (Iida et al., 2004) and diabetic peripheral nerves (Wang et al., 2005).
Intoxications with lead (Powell et al., 1982), galactose (Mizisin & Powell, 1993),
bortezomib (Shin et al., 2010) and disulfiram (Filosto et al., 2008) also result in
changes observed in myelinating SCs.
Additionally, myelinating SCs are presumed to be directly targeted by
Mycobacterium leprae in the peripheral neuropathy leprosy (Spierings et al., 2000)
and diphtheria toxin following the infection with Corynebacterium diphteriae
(Morgan-Hughes, 1968). Immune-mediated attacks on myelinating SCs are
observed in paraproteinaemic neuropathies, lymphomatous neuropathies (Kelly &
Karcher, 2005) and the demyelinating form of GBS, CIPD (Glass & Cornblath,
1994).
However, regarding pSCs posing as specific (and sole) targets in disease, the anti-
ganglioside Ab-mediated injury described above seems to account for the only
incident observed so far.

1. Introduction 33
1.4 In vivo imaging
In vivo imaging of synapses was pioneered in the 1980s, with the report of Purves
and colleagues of imaging dendrites of sympathetic neuron in the cranial cervical
ganglion probably being the first of its kind (Purves & Hadley, 1985). Following the
development of dyes suitable to stain NTs reliably (see 1.2.1), this technique was
subsequently applied to image NMJs in living mice (Kasthuri & Lichtman, 2004). In
addition to single in vivo investigations, it now has become possible to monitor the
same NMJ repeatedly over a period of time (Lichtman et al., 1987; Lichtman &
Sanes, 2003), which has yielded invaluable information on development, stability
and plasticity of synapses (Balice-Gordon, 1997b; Balice-Gordon & Lichtman, 1993;
Lichtman & Sanes, 2003; Magrassi et al., 1987; Walsh & Lichtman, 2003).
The prerequisites for the sites used for in vivo imaging include ease of access,
location of endplate band and flatness. Thus, the muscles preferentially used in
mice comprise the sternomastoid, lateral gastrocnemius, soleus and gluteus
muscles (Balice-Gordon, 1997a, 1997b; Lichtman et al. 1987; O'Malley et al., 1999;
Rich & Lichtman, 1989b; Wigston, 1989, 1990).
1.4.1 Sternomastoid muscle
The sternomastoid muscle (SM) acquires its motor innervation by the spinal part of
CN XI, whose combined motor pool for SM, cleidomastoid muscle and trapezius
muscle lies in the caudal medulla and C1 to C3. Sensory innervation is provided
from the cervical plexus (C1 to C6) (Fitzgerald et al., 1982; Gottschall et al., 1980). It
has, however, very recently been reported, that additional motor innervation to the
SM might be supplied by ventral roots of the first few spinal nerves (Ullah et al.,
2007).
Both medullary and spinal cervical components of CN XI exit the skull via the jugular
foramen and run caudal under the digastric muscle, medial to the SM and lateral to
the truncus vagosympathicus together with CN XII. Cranial nerve XI then turns
towards lateral, passing under the cleidomastoid muscle. On the lateral side of this
muscle the innervation for the trapezius muscle branches off and the rest of the

1. Introduction 34
nerve is divided up into a branch for the cleidomastoid muscle and a branch for the
SM. The latter enters the SM from underneath in the middle of the muscle and is
distributed throughout the middle of the muscle belly in a single endplate band. This
endplate band lies in the mid-region of the muscle (Lichtman et al., 1987) and runs
from caudomedial to craniolateral (when the mouse lies in dorsal recumbency). All
muscle fibres of the SM pass the entire length of the muscle without interruption
(Zenker et al., 1990). The SM itself consists of two parts, but predominantly is a fast-
twitch muscle in rats and mice (d'Albis et al., 1988; Kemp et al., 2009). On the
lateral side, there is a main white component with fibre types IIa (intermediate) and
IIb (fast), whereas on the medial side a smaller red component with fibre types I
(slow twitch) and II (fast) can be found (Gottschall et al., 1980). The fibre types do
not seem to exert any influence on the size of the individual NMJs (Zenker et al.,
1990).
1.4.2 Gastrocnemius muscle
The gastrocnemius muscle is innervated by tibial nerve which enters the muscle
from dorsal (Popesko et al., 1992). On the lateral gastrocnemius muscle (used for in
vivo investigations (Wigston, 1990)) a short endplate band runs obliquely on the
distal half of the lateral head close its border with the tibia.
The mouse and rat lateral gastrocnemius muscle is predominantly a fast-twitch
muscle (90%) with the surface area containing only fast-twitch fibres (Gillespie et al.,
1987; Wigston, 1990), whereas in human subjects this muscle seems to be
predominantly slow-twitch (Shorey & Cleland, 1988).
1.4.3 Soleus muscle
Innervation to the soleus muscle is provided by a branch of the tibial nerve, which
enters the soleus muscle in its proximal third from dorsal (Popesko et al., 1992).

1. Introduction 35
The endplate band of the soleus muscle extends diagonally on its caudal aspect
from proximo-lateral to distal-medial. In rats, mice and humans, the predominant
fibre types in the soleus muscle are slow (I) and intermediate types (IIa) (d'Albis et
al., 1988; Gillespie et al., 1987; Jaweed et al., 1975; Kemp et al., 2009; Shorey &
Cleland, 1988).
1.4.4 Gluteus muscle
The gluteus muscle is innervated by two branches of the sciatic nerve, the rostal
and caudal gluteal nerves, and its endplate band runs in a craniocaudal direction
(Lampa et al., 2004).
Both in rat and mouse, the gluteus muscle is a predominantly fast-twitch muscle
(Armstrong & Phelps, 1984; Lampa et al., 2004).

1. Introduction 36
1.5 Aims
The aim of my doctoral research project was to combine the already well-
established mouse model of GBS with an in and ex vivo imaging system of the
murine NMJ and exploit this paradigm to investigate acute injury and regeneration of
neural and glial structures targeted in GBS.
The successful establishment of an in vivo imaging system not only allows to
monitor and document acute dynamic changes to the neural and glial components
of the NMJ following anti-ganglioside Ab and complement-mediated injury in real
time, but also to highlight the progress and recovery of individual NMJs over time.
This system then can also be used to investigate potential therapies for GBS, in
addition to exploring basic neurobiological questions on the relationship of the
neural and glial components of the NMJ with one another. Due to the possibility of
multiple reimaging sessions, the number of experimental subjects required to obtain
the information desired can be greatly decreased.
Within this investigatory paradigm, my investigations sought to address the following
hypotheses:
1. Following an in / ex vivo application of anti-ganglioside Ab and complement,
differential (neural and or glial) patterns of injury can be observed depending
on the binding specificity of the anti-ganglioside Ab applied.
2. Injury restricted to the distal motor nerves and NTs can be observed
following the application of anti-ganglioside Abs which specifically bind to the
NTs, and a source of complement.
3. Following a single anti-ganglioside Ab and complement-mediated injury, the
distal motor nerves and NTs can rapidly recover their physiological
morphology.
4. The rate of NT recovery/regeneration is decreased in the event of a
concomitant injury to the pSCs.

1. Introduction 37
5. Similar to amphibian NTs, mammalian NTs are also dependant on pSCs.
Thus, morphological changes to the NTs can be observed following a
prolonged (one week or more) loss of pSCs.
To ensure reliability and reproducibility of the investigations and to eliminate any
artificial changes in this system, my experiments were conducted in a hierarchical
fashion and included a number of control and supplementary investigations.
These included to
• confirm stability of the NMJ over time in the mice aspired to use for the
imaging investigations (chapter 3.1)
• optimise in vivo imaging technique to eliminate any manipulation and
imaging-induced changes (chapter 3.2)
• determine most advantageous anti-ganglioside Abs for in vivo investigations
(chapter 3.3)
• ensure that results acquired from the different muscles can be extrapolated
to one another and that muscles used for investigations are able to exhibit
the properties required (chapter 3.4)
Once these prerequisites were established, the in and ex vivo regeneration studies
were to be conducted.
In these investigations, the focus lay on the rate of distal motor nerve and NT
regeneration following anti-ganglioside Ab and complement-mediated injury (chapter
3.7). To examine the role of the pSCs in NT recovery/regeneration, a concomitant
injury of the pSCs was carried out (also chapter 3.7).
In addition to the in vivo experiments, a number of ex vivo auxiliary investigations
were carried out to elucidate the meaning of the loss of intracytosolic axonal
fluorescent proteins in the injury paradigms applied and to facilitate the interpretation
of the results achieved (chapter 3.6).

1. Introduction 38
Out of line with the rest of the investigations, a result achieved in the primary
investigations, namely the physiological and rapid uptake of anti-ganglioside Ab into
the NT, was further explored in a side-study (chapter 3.5).

39
2. GENERAL MATERIALS AND METHODS
2.1 Experimental animals
2.1.1 Wildtype (WT) fluorescent mice
All experiments were conducted in fluorescent B6.Cg-Tg(Thy1-CFP/S100B-GFP)
mice, which express intracytosolic cyan fluorescent protein (CFP) in their peripheral
motor and sensory axons (Feng et al., 2000) and intracytosolic green fluorescent
protein (GFP) in their Schwann cells (Zuo et al., 2004). These double-fluorescent
mice were generously supplied to us by Dr W. Thompson (Austin, TX, USA),
however now are also commercially available as individual lines through Jackson
(Bar Harbor, ME, USA). The description of these lines on the “The Jackson
laboratory site” (http://jaxmice.jax.org/) indicates that the double-fluorescent mice
are on a mixed B6/DBA background and are - at least for the expression of GFP -
supplied as homozygous mice. To increase the number of experimental subjects
available, male double-fluorescent mice were also outbred with conventional DBA
females. All F1-offspring of these matings where also double-fluorescent, indicating
that the founder line must be homozygous for the expression of both GFP and CFP.
Heterozygous F1 mice were crossed to acquire single-fluorescent (GFP or CFP)
mice.
All offspring (both homozygous and heterozygous) were investigated for the
inheritance of transgenes by phenotyping ear-punches from 21 day-old mice. For
this, the skin of the two sides of the ear was gently pulled apart and coverslipped
with Citifluor antifade (Citifluor Products, Canterbury, UK) with the inner side
upwards. The samples were then examined under a fluorescence compound
microscope (see 2.3.4 for details) for the occurrence of GFP in adipocytes and CFP
in axons/neurons.
In our particular strain of mice, the expression of CFP is observed in all peripheral
motor axons; this lies in contrast to other strains of these mice, where only a subset
of motor axons exhibit fluorescent proteins (Beirowski et al., 2004; Feng et al.,
2000).

2. General Materials and Methods 40
The GFP signal intensity is proportional to the activity of the S100B-promotor,
however, GFP can also persist in these cells over some time even when the S100B-
promotor is inactive. Myelinating SCs exhibit a lower level of GFP intensity when
compared to pSCs (Magill et al., 2007).
Both homozygous or heterozygous mice were used for experiments; occasionally
only single-fluorescent (only CFP or GFP) mice were required.
2.1.2 Knock-out (KO) fluorescent mice (see Fig.1)
GalNac-Transferase knock-out (GM2KO) mice do not express any complex
gangliosides, whilst at the same time expressing higher levels of the simple
gangliosides GM3, GD3 and GT3 (Takamiya et al., 1996).
GD3-Synthase KO-mice (GD3KO) do not express any gangliosides of the b- and c-
series, but express gangliosides of the a-series at higher levels when compared to
WT mice (Kawai et al., 2001; Okada et al., 2002).
Both of these strains are viable and do not appear to have any very obvious
morphological, behavioural and electrophysiological changes (Bullens et al., 2002;
Kawai et al., 2001; Okada et al., 2002; Takamiya et al., 1996). The homozygous
male GM2KO-mice, however, are sterile and other investigators report subtle
changes to the myelination of axons and increased axonal degeneration both in the
CNS and PNS of these mice (Sheikh et al., 1999b).
Both strains of KO-mice were crossed with fluorescent mice to obtain both single-
and double-fluorescent KO-mice. Inheritance of the transgenes was confirmed by
PCR (kindly carried out by Dr Denggao Yao) and phenotyping of earsamples (see
2.1.1).

2. General Materials and Methods 41
2.1.3 Knock-in-knock-out fluorescent mice (PLP-transgenic (Tg-) mice)
In GM2KO-mice, GalNac-Transferase was reintroduced by linking this enzyme to a
proteolipid protein (PLP)-promotor. PLP and its smaller isoform DM20 are
expressed in oligodendrocytes, SC precursors, olfactory ensheathing cells and also
some non-glial cells (cardiomyocytes and cells of the thymus) (Griffiths et al., 1998).
This means that in these mice only the cells listed above should be able to
synthesise and thus exhibit complex gangliosides.
To obtain (single- and double-) fluorescent PLP-Tg-mice, fluorescent GM2KO-mice
were crossed with non-fluorescent PLP-Tg mice. Due to sterility of the homozygous
male GM2KO-mice (see 2.1.2), no backcrossing was carried out. Inheritance of the
required transgenes was confirmed by PCR (kindly carried out by Dr Denggao Yao)
and phenotyping of earsamples (see 2.1.1).
2.1.4 Age and sex
All experiments were carried out in male and female ten- to 14-week-old mice
unless stated otherwise.
2.1.5 Procedures
All procedures described were carried out in accordance with UK home office and
local (University of Glasgow) guidelines.

2. General Materials and Methods 42
2.2 In vivo exposure and imaging of the sternomastoid (SM) and
sternohyoid (SH) muscles
2.2.1 Preparation of the mouse, surgical approach and intubation
All mice were induced in an anaesthetic box (Fig.6A), which was flooded with 4%
isoflurane (IsoFlo®, Abbot, Kent, UK). Following tolerance, the mice were supplied
with buprenorphine (Vetergesic®, Reckitt Benckiser, Hull, UK; 0.05 mg/kg s.c) and
0.5 ml Glucose-saline (Baxter, Thetford, UK; s.c.) before being transferred to a
padded metal plate, positioned in dorsal recumbency and maintained on 2%
isoflurane with a mouse mask. Body temperature was kept physiological by placing
the mice in a bubble-wrap “sleeping-bag” and supplying them with heated hot water
bottles (tied-off glove-fingers filled with warm water). All surgical procedures were
monitored with the help of an anaesthesia protocol (Table 1).
As a next step, the ventral neck area from the area of the chin to the rostral area of
the sternum were depilated (Fig.6B; Veet ®, Renckitt Benckiser, Hull, UK) and
cleaned with 70% alcohol. Following a midline incision, the bilateral submandibular
salivary glands were separated and retracted carefully, and the SM and SH exposed
(Fig.6C).
The surgical area was covered in sterile Ringer’s solution (Vetivex 9, Dechra,
Shrewsbury, UK; approximate ionic content: 147 mM Na, 4 mM K, 2.25 mM Ca,
155.5 mM Cl) and the mice were intubated with a 18G (green) or 20G (pink) ventflon
(Vasofix®, Braun, Melsungen, Germany) under visual guidance and connected to a
rodent ventilator (Harvard Apparatus, Edenbridge, Kent, UK). All mice were
ventilated at 110 breaths per minute and 0.1 ml volume per 10g (i.e. 0.3 ml for a 30g
mouse).

2. General Materials and Methods 43
Table 1: Anaesthesia protocol

2. General Materials and Methods 44
Fig.6: In vivo imaging. A mouse being induced in an anaesthesia box flooded with isoflurane; B mouse maintained under anaesthesia with an isoflurane mask and being depilated for surgery; C SM and SH following a midline incision in the ventral neck area and retraction of skin and salivary glands; D, E mouse placed under the microscope for in vivo imaging; F: map to depict location of NMJs imaged; G: mouse sutured up following imaging and ready for recovery.

2. General Materials and Methods 45
2.2.2 In vivo imaging
Prior to imaging the skin surrounding the surgical area was retracted in four points
(caudal-left and -right and rostral-left and -right) to create a trough. Then the SH and
SM were covered with 0.4 ml of sterile Ringer’s solution containing rhodamine- or
Cy5-conjugated BTx (Molecular Probes, Eugene, OR, USA) for 10 minutes.
Following a wash with Ringer’s solution, the trough was filled with Ringer’s solution
and the mice transferred to the imaging microscope (Fig.6D, E), which was an
epifluorescence microscope (Leica DMI4000B, Leica, Wetzlar, Germany) fitted with
the appropriate filters to detect cyan, green, red and purple fluorescence (see Table
2) and connected to a computer via camera (Leica DFC 350 Fx, Leica Wetzlar,
Germany). Images were acquired with the help of Leica Application Suite (Version
2.5.0 RI, Leica Microsystems CMS GmbH, Switzerland).
Following orientation at a total magnification of x100 (numerical aperture (NA) 0.3),
superficial NMJs of the SH/SM were imaged at x400 (NA 0.8), taking care to
minimise the exposure of the tissue to light. The localisation of the NMJs imaged
was depicted by maps drawn which highlighted the main structures of the muscle
(Fig.6F). Individual NMJs were identified by their distinct BTx-signal.
Fluorochrome TRITC GFP CFP Cy5
Excitation range Green Blue Violet / blue Red
Excitation filter BP 546/12 BP 470/40 BP 436/20 BP 620/60
Dichromatic mirror 565 nm 500 nm 455 nm 660 nm
Suppression filter BP 600/40 BP 525/50 BP 480/40 BP 700/75
Table 2: Filter sets for Leica DMI4000B (in vivo imaging). All values for bandpasses (BP) are given in nm.
2.2.3 Recovery
All mice recovered received a skin suture (single sutures Fig.6G, 6-0 Vicryl,
Ethicon®, Johnson & Johnson, Livingston, UK), a single dose of carprofen
(Rimadyl®, Pfizer, Kent, UK; 5 mg/kg s.c.) and another dose of Glucose-saline (0.5

2. General Materials and Methods 46
ml, s.c.). They were then transferred to a padded cage in an incubator (27ºC) for 24
hours and fed with soft mouse chow and babyfood (egg custard with rice, Heinz,
Hayes, UK). Over the next five days (or until sacrificed), the mice were monitored
regarding abnormalities in weight, appearance of the suture, general mentation,
appetite, grooming, urination and defecation.
2.2.4 Sacrifice
In the event of a terminal anaesthesia, mice received an intraperitonaeal dose of
pentobarbital (Euthatal®, Merial Animal Health Ltd, Harlow, UK; pentobarbital
sodium 200 mg/ml; 0.3 ml per mouse). The muscles were then processed and
imaged as described in 2.3.
2.2.5 Reconstruction of images acquired in vivo (Figs.7, 8)
For reconstructing the images a combination of ImageJ (Version 1.38, NIH,
Bethesda, MD, USA; http://rsb.info.nih.gov/ij/) and Adobe Photoshop CS (Version
8.0, Adobe Systems Europe Limited, Edinburgh, UK) were used. Some macros
used in ImageJ (“MinMax” and “deblurrr single stack”) were generated in-house by
Mr Peter Humphreys; the commands for these are included in the Appendix.
As a first step, all clear images showing a part of or the entire the NMJ (regardless
of filter) were selected and optimised regarding their contrast (command “MinMax” in
ImageJ).
All images depicting the BTx -stain were then combined to a stack in ImageJ,
deblurred and registered in the correct z-location within their stack with “deblurrr
single stack”- and “stackreg” (with “scaled rotation”) -macros. The z-stacks were
then combined to one single image (command “ZProject”) by summarising the
intensities and the background subtracted (rolling ball radius: 50) once the files had
been converted to an 8-bit file.

2. General Materials and Methods 47
Fig.7: Effects of the image-processing steps. Two images depicting the BTx-signal are selected and optimised regarding their contrast (step 1), then deblurred (step 2). Following registering in the stack, the stacks are combined to a single image (step 3) and the background subtracted (step 4). (For illustratory purposes, the images are deblurred individually; this step usually is conducted once the optimised images are combined to a stack. Scale bars: 20 µm.) The images acquired of the GFP and CFP were first optimised regarding their
contrast (command “MinMax” in ImageJ) and then copied to Photoshop. Here the
corresponding BTx-signal for the NMJ was used as a matrix for correct positioning
of the GFP/CFP-filled structures. The GFP/CFP-image with the largest amount of
neuromuscular structures in focus was selected, superimposed on the BTx-image
and shifted to the correct position. In the following, layers were added onto the first
GFP/CFP-image and the in-focus areas cloned from the respective images and
pasted onto new layers to acquire a full GFP/CFP-image with clear and distinct
features for the whole NMJ. As a final step, the opacity of all layers was adjusted to
100%, the BTx-stencil was deleted and all layers were merged (command “flatten
image”). If necessary the background of the CFP/GFP-images was subtracted in
ImageJ (rolling ball radius: 50) once the files had been converted to an 8-bit file.
The scale bars for images acquired in vivo were extrapolated from scale bars
acquired from the NMJs imaged in rapid succession (within an hour) in and ex vivo.
These “sample” scale bars where then applied to the in vivo images according to
their rate of magnification.

2. General Materials and Methods 48
Fig.8: Workflow for the reconstruction of images ac quired in vivo. For images depicting the BTx-stain (orange) all steps were conducted with ImageJ, whereas for GFP/CFP images (green/blue) a combination of ImageJ and Photoshop was used.

2. General Materials and Methods 49
2.3 Fixation, processing and imaging (qualitative a nd quantitive) of the
SM and SH
2.3.1 In situ fixation
Following sacrifice of mice by CO2/pentobarbital-exposure, the SM and SH were
exposed in the same manner as for in vivo imaging and covered with 4%
paraformaldehyde (PFA; see 2.10.4) for 1 hour. The muscles then were extracted,
pinned into Sylgard-coated imaging dishes (diameter: 34 mm) and post-fixed at 4ºC
in 4% PFA for 1 hour (SH)/ 2 hours (SM).
2.3.2 Perfusion
In order to gain better resolution in SH/SM-wholemount imaging, to facilitate the
application of additional stains to SM/SH and to acquire SH/SM for
electronmicroscopic investigations (EM), mice were perfused intracardially following
C02-exposure. Mice were pinned out in dorsal recumbency and the heart was
exposed following an abdominal incision and reflection of the sternum towards
rostal. Next, the left cardiac ventricle was expanded by the flushing agents, the
portal vein transected and the agents applied with moderate pressure.
For wholemount imaging of the SH/SM, the mice were flushed with 3 ml of Ringer’s
solution and then fixed with 10 ml of warmed 4% PFA. Following perfusion, the SM
and SH were extracted and post-fixed at 4ºC in 4% PFA for 1 hour (SH)/ 2 hours
(SM).
For the acquisition of tissue processed for EM, the mice were flushed with 10 ml of
saline and then fixed with 20 ml of “Strongfix” (see 2.10.5). Following perfusion, SH
and SM were exposed and post-fixed in situ for 1 hour in “Strongfix”, extracted and
transferred into “Strongfix” at 4ºC for storage until processing.
2. General Materials and Methods 50
2.3.3 Secondary staining
For the optional application of primary and/or secondary Abs, the SH/SM following
their fixation were thoroughly rinsed in phosphate-buffered-saline (PBS; see
2.10.12) for 10 minutes, incubated in 0.1M Glycine for 10 minutes and rinsed again
in PBS for 10 minutes. Primary/secondary Abs were applied as described in the
relevant chapters and 2.8.
2.3.4 Wholemount imaging (Fig.9A)
Pinned-out fixed muscles were thoroughly rinsed in cold PBS before transferral to a
Zeiss AxioImager with optional Apotome function (Zeiss, Goettingen, Germany) and
adequate filters for the detection of blue, green, red and purple fluorescence (see
Table 3). Imaging was conducted wholemount in PBS with water-immersion
objectives and a total magnification of x200 (NA 0.5) and x400 (NA 0.8). All images
acquired were reconstructed semi-automatically and processed with Zeiss
Axiovision 4.7.2 imaging software (© Carl Zeiss Imaging Solutions GmbH,
Germany).
Fluorochrome TRITC FITC / GFP CFP Cy5
Excitation range BP 546/12 BP 485/20 BP 436/20 BP 640/30
Dichromatic mirror 560 nm 510 nm 455 nm 660 nm
Emission range BP 575-640 BP 515-565 BP 480/40 BP690/50
Table 3: Filter sets for Zeiss AxioImager (ex vivo imaging). All values for bandpasses (BP) are given in nm. 2.3.5 Quantitative imaging
In quantitative assessments, superficial NMJs of the SM/SH were assessed for
GFP/CFP overlying the BTx-signal with the Zeiss AxioImager. CFP was scored as
“present” if any CFP extending from the efferent axon was seen overlying the BTx-

2. General Materials and Methods 51
signal, regardless of its morphology, intensity and extent. GFP was scored as
“present” if any GFP-positive cell bodies were overlying the NMJ, regardless of their
fluorescence intensity. The percentage of NMJs exhibiting CFP or GFP was then
calculated for each muscle assessed and pooled for each group and time-point. Chi-
square tests (Excel spreadsheet; Microsoft ® Office Excel 2003) were applied to the
mean percentages of counts for each time-point and group to determine statistical
significances between groups (personal communications Dr. Carl Goodyear).
In SM these investigations were conducted in pinned-out muscles, whereas in SH
these investigations were conducted in coverslipped muscles (Fig.9B). In SM as
many superficial NMJs were assessed as possible (minimum: 51; maximum: 95),
whereas in SH roughly 100 superficial NMJs per muscle were assessed.
2.3.6 Electronmicroscopic investigations
All stages of these investigations, including the processing, cutting and staining of
tissue followed by the imaging of sections, was very kindly carried out by Mrs
Jennifer Barrie.
Briefly, the tissue blocks prepared for resin embedding were processed using a Lynx
Tissue Processor for Microscopy (Leica, Wetzlar, Germany). The tissues were post-
fixed in 1% osmium tetraoxide, subjected to alcohols of increasing grades followed
by propylene oxide and then infiltrated with araldite resin. In resin-filled silicone
moulds, the tissue blocks were then orientated and left for 24 hours at 60ºC to
polymerise. One µm-thick sections were cut with an Ultracut-E ultratome (Reichert-
Jung, Vienna, Austria). These sections were mounted on cleaned glass microscopic
slides (Menzel, Braunschweig, Germany), stained with 1% methylene blue and 1%
azur II in 1% borax and used for orientation in light microscopy. For EM, 70 nm
sections were cut with a diamond knife and mounted on 300-mesh copper grid with
a diameter of 3.05 mm. Sections were stained with uranyl acetate and lead citrate
and imaged with a CX100 electron microscope (JEOL, Watchmead, Herts, UK).

2. General Materials and Methods 52
Fig.9: Ex vivo imaging. A wholemount SM and SH; B coverslipped SH; C ribcage and sternum pinned out with outer side upwards and connective tissue and superficial muscles removed; D exposure of the left and right TS following removal of the ribs and intercostal muscles; E single TS-prep pinned out for Ab- and complement-incubation; F coverslipped TS.
2.4 Preparation of the triangularis sterni muscle ( TS)
The TS (also M. transversarius thoracis or M. sternocostalis) is a very thin muscle,
which consists of only two to three layers of muscle fibres and lies within the rib
cage. Its thinness (maximum thickness 60 to 120 µm (McArdle et al., 1981)) allows

2. General Materials and Methods 53
for very good Ab-penetration whilst also facilitating imaging by allowing this muscle
to be coverslipped. Additionally, a large number of NMJs can be examined with a
good spatial resolution (Kerschensteiner et al., 2008).
In the mouse, the TS has a trapezoidal shape, originates at the sternum and inserts
on the ribs. Cranially, the TS extends to the second intercostal space, whilst the
seventh intercostal space provides its caudal limit (Kempley & Stolkin, 1980;
McArdle et al., 1981). Innervation to the TS is provided by the third, fourth and fifth
intercostal nerves (Nickel et al., 1992).
The gain access to the TS, the entire ribcage of the mouse is extracted following
removal of skin, overlying muscle and contents of the thoracic cavity. The ribs are
cut as close to the vertebral column as possible and the ribcage then pinned into a
Sylgard-lined petridish containing freshly prepared Ringer’s solution (see 2.10.1)
with the outermost side up (Fig.9C).
Next, the intercostal muscles are carefully dissected away in the second to fourth or
third to fifth intercostal space. The TS can be identified by its fibres running rosto-
lateral to caudo-medial, which is the opposite when compared with the intercostal
muscles (rostro-medial to caudo-lateral). Following clearance of the intercostal
spaces, the ribs are carefully lifted and cut, first close to the sternum and then
laterally (Fig.9D). Connective tissue usually is removed together with the ribs.
Severing of blood vessels, especially the paired internal thoracic arteries, leads to
“blood-staining” of the TS. This can easily be rectified by gently squirting the
affected area with a micro-fine syringe (BD Medical-Diabetes Care, Oxford, UK)
filled with Ringer’s solution.
Cutting the sternum along the midline results in the preparation being separated into
two individual TS, and following trimming of excess tissue (ribs, muscle and
connective tissue), these can then be pinned into Sylgard-containing wells (Fig.9E).
Careful pinning maintains the physiological tautness of the muscle, whilst limiting the
pins to bony structures and tissue outside the ribs ensures that the TS are not
subjected to artificial changes.

2. General Materials and Methods 54
2.5 Fixation, processing and imaging of the TS
2.5.1 Fixation and processing of TS
Following incubations, TS were rinsed with Ringer’s solution and fixed with 4% PFA
for 20 minutes at 4ºC. Following a thorough rinse with PBS, the TS was then
dissected away from the surrounding bony structures of the ribcage.
In the event of further staining, TS was thoroughly rinsed in PBS for 10 minutes,
incubated in 0.1M Glycine for 10 minutes and rinsed again in PBS for 10 minutes
before incubation with secondary Abs as described in 2.8. This was followed by
another thorough PBS rinse.
For imaging, the TS were mounted on conventional glass slides (Menzel,
Braunschweig, Germany) in Citifluor antifading agent (Citifluor products, Canterbury,
UK), coverslipped and sealed (Fig.9F). These muscles were stored at -20ºC until
required for imaging.
2.5.2 Qualitative imaging of TS
Qualitative imaging of the TS was conducted with a Zeiss AxioImager with optional
Apotome function (Zeiss, Goettingen, Germany; also see Table 3). Imaging was
conducted with water-immersion objectives (total magnification x200 (NA 0.5) and
x400 (NA 0.8)) or with an oil-immersion objective (total magnification x630, NA
1.25). All images acquired were reconstructed semi-automatically and processed
with Zeiss Axiovision 4.7.2 imaging software (© Carl Zeiss Imaging Solutions GmbH,
Germany).
For the assessment of NT injury, 100 superficial TS-NMJs were assessed for the
incidence of CFP overlying the BTx-signal. CFP was scored as absent, changed or
healthy, and data (percentages) between groups was compared with the chi-square
test.

2. General Materials and Methods 55
2.5.3 Semi-quantitative imaging of TS and SM/SH sections
For quantitative assessments of IgG/complement deposition, TS/SM sections/SH
sections were imaged with a Zeiss LSM 5 Pascal confocal microscope (Zeiss,
Oberkochen, Germany) at a magnification of x400 (NA 1.3; oil-immersion objective)
and using constant acquisition settings both for fluorescein isothiocyanate (FITC)
and tetramethyl rhodamine iso-thiocyanate (TRITC). Orientation within the samples
was carried out with fluorescent light (FITC filter-set: excitation BP 450-490 nm,
dichromatic mirror 510 nm, emission long pass filter (LP) 515 nm; TRITC filter-set:
excitation BP 546 nm/12, dichromatic mirror 580 nm, LP 590 nm), whereas for
imaging the samples were excited with an Argon laser (488/514nm, 25 mW) and a
Helium Neon laser (543nm, 1 mW) and emission detected with two photomultiplier
tubes. Imaging was conducted semi-automatically with LSM 5 Pascal software
(Version 2.5, © Carl Zeiss 1986-1999, Portions © Copyright 1996. Microsoft
Corporation.)
At least 150 NMJs per muscle were imaged and these images were then semi-
quantified using a macro (“FITC/TRITC-Intensity”) generated in-house by Mr Peter
Humphreys for the ImageJ software (see Appendix for macro). In short, this macro
identified NMJs on the basis of the conjugated (FITC- or TRITC-) BTx-staining and
measured the intensity of FITC/TRITC-conjuated IgG/complement covering the
NMJ-area. The maximum value obtainable for read-outs amounted to 255. Data
then was analysed with Minitab statistical software (Version 16.1, Minitab LTd.,
Coventry, UK) and for comparison of time-points and groups the Mann-Whitney test
(2 groups) or the Kruskal Wallace test (> 2 groups) for non-parametrical data were
applied. The measurements themselves are illustrated by boxplots generated in
Minitab (Version 16.1, Minitab LTd., Coventry, UK). In these illustrations, the box
depicts the values for the second and third quartile, whilst the lower whisker extends
to the lowest value within the lower limit (Q1-1.5(Q3-Q1)) and the upper whisker
extends to the highest value within the upper limit (Q3+1.5(Q3-Q1)). All outlier
points represent one individual value.

2. General Materials and Methods 56
2.6. Permeabilisation of wholemount muscles
Following fixation all muscles were thoroughly rinsed in PBS for 10 minutes, then
incubated in 0.1M Glycine for a further 10 minutes and then rinsed in PBS again.
Depending on the level of permabilisation required and the muscle used different
permeabilisation protocols were applied:
2.6.1 Permeabilisation only at the level of the NMJ
Triangularis sterni muscles were incubated in blocking serum II (see 2.10.6) for 30
minutes at 4ºC. Secondary Abs was applied in blocking serum II for 16 hours at 4ºC.
2.6.2 Permeabilisation of the NMJ and proximal efferents
TS were incubated in frozen acetone for 30 minutes at -20ºC, whereas SH/SM were
incubated in frozen acetone for 1 hour at -20ºC. Following a thorough rinse in PBS,
TS and SH/SM were further incubated for 1 hour in blocking serum III (see 2.10.6) at
4ºC. Both primary and secondary Abs were applied in blocking serum III for 20
hours at 4ºC.

2. General Materials and Methods 57
2.7 Anti-ganglioside Abs and α-BTx (Table 4)
In vivo (SM/SH) Ex vivo (TS) Sections
Concen-tration
Quantity Time Concen-tration
Quantity Time Concen-tration
Quantity Time
α-BTx 2.5 µg/ml 0.4 ml 10
min 2 µg/ml 1.33 µg/ml
6h or 16h @
4ºC
TBG3 200 µg/ml 0.6 ml 200
µg/ml 50 µg/ml
300 µl per
slide 2h @ 4ºC
EG1 1 mg/ml 120 µl
All other Abs
100 µg/ml
100 µg/ml
NHS 40%
0.6 ml
30 min
40%
0.5 ml 30 min
n.a.
Table 4: Application of anti-ganglioside Abs and α-BTx (n.a. not applicable)
In in vivo experiments all agents were applied diluted in sterile Ringer’s solution.
In ex vivo experiments (TS and sections) all agents were applied diluted in Ringer’s
solution made up according to 2.10.

2. General Materials and Methods 58
2.8 Tissue manipulation and staining (Table 5 )
Wholemount SH/SM Wholemount TS Sections
Concentration Application Concentration Application Concentration Application
Fixation with PFA
4% 1h SH, 2h SM @ 4ºC 4% 20 min @
4ºC
1% Triton x100
1h @ 4ºC 0.5% or 1% Triton x100
30 min or 1h @ 4ºC Permea-
bilisation Frozen acetone
1h @ -20 ºC
Frozen acetone
30 min @ -20 ºC
NF 1:100
Anti-rabbit 1:200 20h @ 4ºC 1:200 20h @ 4ºC
C5b-C9 (MAC)
1:40 1h in vivo
plus 16h @ 4ºC
1:40
1h @ RT, 3h @ 4ºC, plus 16h @
4ºC
n.a.
Anti-mouse
1:200
1h in vivo plus 16h @ 4ºC or 4h
@ RT (GAP-43)
1:200 16h @ 4ºC 1:300 6h or 16h @ 4ºC
EthD-2 1:500 30 min 1:500 30 min
Anti-GAP-43
1:500 to 1:125
3d @ 4ºC n.a. n.a.
Table 5: Tissue manipulation and staining (n.a. not applicable; RT room termperature)
All primary Abs were applied diluted in Ringer’s solution for unfixed tissue and
diluted in PBS for fixed tissue .
All secondary Abs were applied to fixed tissues in blocking solution I for
unpermeabilised tissue and blocking solution II or III for permeabilised tissue .
Blocking solution II was applied if only the NMJ needed to be permeabilised and
blocking solution III was applied if the permeabilisation extended to the proximal
efferents.
Between application of primary and secondary Abs all unfixed tissues were rinsed
in Ringer’s solution and all fixed tissues were rinsed in PBS.

2. General Materials and Methods 59
2.9 Manufacturers for reagents used (Table 6)
Agent Manufacturer Localisation
All forms of conjugated α-BTx Molecular Probes Eugene, OR, USA
All forms of conjugated α-mouse Abs
Southern Biotech Birmingham, AL, USA
All forms of conjugated α-rabbit Abs Southern Biotech Birmingham, AL, USA
α-GAP-43 Sigma-Aldrich St Louis, MO, USA
α-human C5b-9 (MAC) Dako Glostrup, Denmark
Bright cryo-m-bed Bright Instrument Company Limited
Huntingdon, UK
Citifluor antifading agent Citifluor Products Canterbury, UK
EthidiumD2 Molecular Probes Eugene, OR, USA
Glutaraldehyde (25%, EM grade) Agar Scientific Ltd. Stansted, Essex, UK
NF-heavy (200 kDa) Affiniti, Enzo Life Sciences Exeter, UK
NF-light (60 kDa) Abcam Cambridge, UK
Normal goat serum (NGS) Sigma-Aldrich St Louis, MO, USA
Ringer’s solution (Vetivex 9) Dechra Shrewsbury, UK
Triton x100 Sigma-Aldrich St Louis, MO, USA
VWR International Haasrode, Belgium All chemicals Fisher Scientific Loughborough,
Leicestershire, UK
Table 6: Manufacturers for reagents used
2.10 Recipes for commonly used solutions
2.10.1 Ringer’s solution
A 10x Ringer’s solution stock (NaCl 67.79g, KCl 3.35g, NaHCO3 19.32g,
NaH2PO4x2H2O 1.56g, Glucose 19.82g, 1M MgCl2 10ml added to distilled water to
make up a total volume of 1l) was made up and stored at 4ºC.
For use, Ringer’s solution stock was diluted in distilled water and bubbled for 5-10
minutes with oxygen (minimum 99.5%). Two ml of 1M CaCl2 were added per 1l of
solution and the solution brought to a pH of 7.4; the final concentration of the

2. General Materials and Methods 60
Ringer’s solution came to 116 mM NaCl, 4.5 mM KCl, 1 mM MgCl2, 2 mM CaCl2, 1
mM NaH2PO4, 23 mM NaHCO3 and 11 mM glucose.
2.10.2 Phosphate buffered saline (PBS)
A 10x PBS stock (NaCl 80g, KCl 2g, KH2PO4 2g, Na2HPO4x12H2O 29g in 1l of
distilled water) was made up and brought to a pH of 7.4.
For use, the stock was diluted with distilled water.
2.10.3 Saline solution
Distilled water was supplemented with 0.75% of NaCl.
2.10.4 Paraformaldehyde (PFA) 4%
Distilled water equal to slightly less than 2/3 of the desired final volume was heated
to 60ºC in a fume hood. The quantity of PFA, that will make a 4%-solution was
weighed out and added to the water with a stir bar. The solution was maintained at
60ºC and one drop of 2N NaOH added, which leads to clearance of the solution.
One tenth of the volume of 10x PBS was added and the solution brought to a pH of
7.2. Following the addition of more water to reach the final volume, the solution was
filtered, cooled to room temperature (RT) and stored in aliquots at -20 ºC.
2.10.5 “Strongfix”
For 500 ml of “Strongfix”, 250 ml of 8% PFA (see above) were made up and mixed
with 100 ml of 25% Glutaraldehyde and 250 mg of CaCl2 in a glass bottle on a heat-

2. General Materials and Methods 61
proof surface. The solution was then made up to 500 ml by adding 0.08M Na-
cacodylate buffer and stored at 4ºC.
2.10.6 Blocking sera
Blocking serum I: PBS + 1% NGS
Blocking serum II: PBS + 1% NGS + 0.5% Triton x100
Blocking serum III: PBS + 1% NGS + 1% Triton x100
2.11 Normal human serum (NHS)
NHS, acting as a source of complement, was taken from a single donor stock and
stored immediately after acquisition in aliquots at -70ºC to preserve complement
activity.

2. General Materials and Methods 62
2.12 Statistics and Imaging
The following statistical (Table 7) and imaging packages (Table 8) were applied:
Comparison of Statistical test Software Description Application
Percentages Chi-square Excel Chapter 2.3.5, 2.5.2
Chapter 3.1, 3.2, 3.5, 3.7
Fluorescence intensity
Mann-Whitney (2 groups), Kruskal-Wallis (>2 groups)
Chapter 2.5.3
Chapter 3.4, 3.5
Scores, whole number counts, measurements
2-sample t-test
Minitab statistical software
Chapter 3.2 Chapter 3.2
Table 7: Statistical tests and packages
Microscope Software for Details
Image acquisition Image processing
Leica DMI4000B (in vivo imaging)
Leica Application Suite ImageJ and Adobe Photoshop
Chapter 2.2.2 and 2.2.5
Zeiss AxioImager (ex vivo imaging)
Zeiss Axiovision 4.7.2 Chapter 2.3.4
Zeiss LSM 5 Pascal (ex vivo imaging)
LSM 5 Pascal software ImageJ Chapter 2.5.3
Table 8: Microscopes, imaging and image processing software

63
3. RESULTS
3.1 Stability of NMJs regarding their pSC number in double fluorescent
mice
3.1.1 Introduction
Murine NMJs have been described as remarkably stable over longer periods of time
(Sanes & Lichtman, 1999). Apart from the NMJs expanding in size in accordance
with muscle fibre growth (Balice-Gordon & Lichtman, 1990), only minor changes to
the NT arborisations and nAChR-patterns have been noted in in vivo imaging
studies conducted both in the SM and gastrocnemius muscles in mice aged three to
18 months (Balice-Gordon & Lichtman, 1990; Lichtman, Magrassi, & Purves, 1987;
Wigston, 1990). Interestingly, similar investigations conducted in the soleus muscle
yielded different results, with more frequent changes to the nAChRs of NMJs
observed (Wigston, 1989).
Specifically regarding the number of pSCs per NMJ, a short-term in vivo study in
two- to three-month-old-mice with a maximum of one month between assessments,
revealed no changes to the pSCs number per NMJ (O'Malley et al., 1999). Similarly,
an in vivo study conducted in mice expressing fluorescent proteins solely in their
SCs, revealed only minor changes to numbers and positions of SCs, with 20% of
NMJs exhibiting an extra pSC and 10% of NMJs losing one pSCs over 30 days (Zuo
et al., 2004). Over the time-course of more than a year (rats aged two months and
15 months) only one or two pSCs are added to the average number of pSCs per
NMJ (Love & Thompson, 1998).
Since none of the studies described above, however, was conducted in mice
expressing fluorescent proteins both in the motor axons and SCs of their PNS and
most investigations were limited to one month, the stability of NMJs regarding their
pSC number was assessed in double-fluorescent mice aged one to twelve months,
with a special focus on three-month-old mice as it was aspired to use these in in and
ex vivo investigations.

3. Results Stability of NMJs 64
3.1.2 Specific Materials and Methods
3.1.2.1 Mice and procedures
In 28 double-fluorescent WT mice (see 2.1.1) aged 1, 3, 5, 7, 9 and 12 months
(each n=4; except 3 months, n=8), the SM were exposed for ex vivo imaging (see
2.3.1) and incubated with rhodamine-conjugated BTx for 1 hour. Following rinsing
with Ringer’s solution, the muscles were fixed and processed for imaging (see 2.3.1
and 2.3.4).
Both left and right SM-NMJs (each mouse n=2) were assessed for numbers of bright
GFP-positive cell bodies overlying the BTx-signal.
3.1.2.2 Statistics
In each age-group the counts were combined to calculate the average number of
pSCs overlying the NMJ. Additionally, the mice were grouped into a young group
(1, 3 and 5 months) and an old group (7, 9 and 12 months) and the NMJs were
grouped into NMJs with one or two pSCs, NMJs with three pSCs and NMJs with
four or more pSCs.
To compare percentages, chi-square tests were applied to determine statistical
signicant differences between groups.
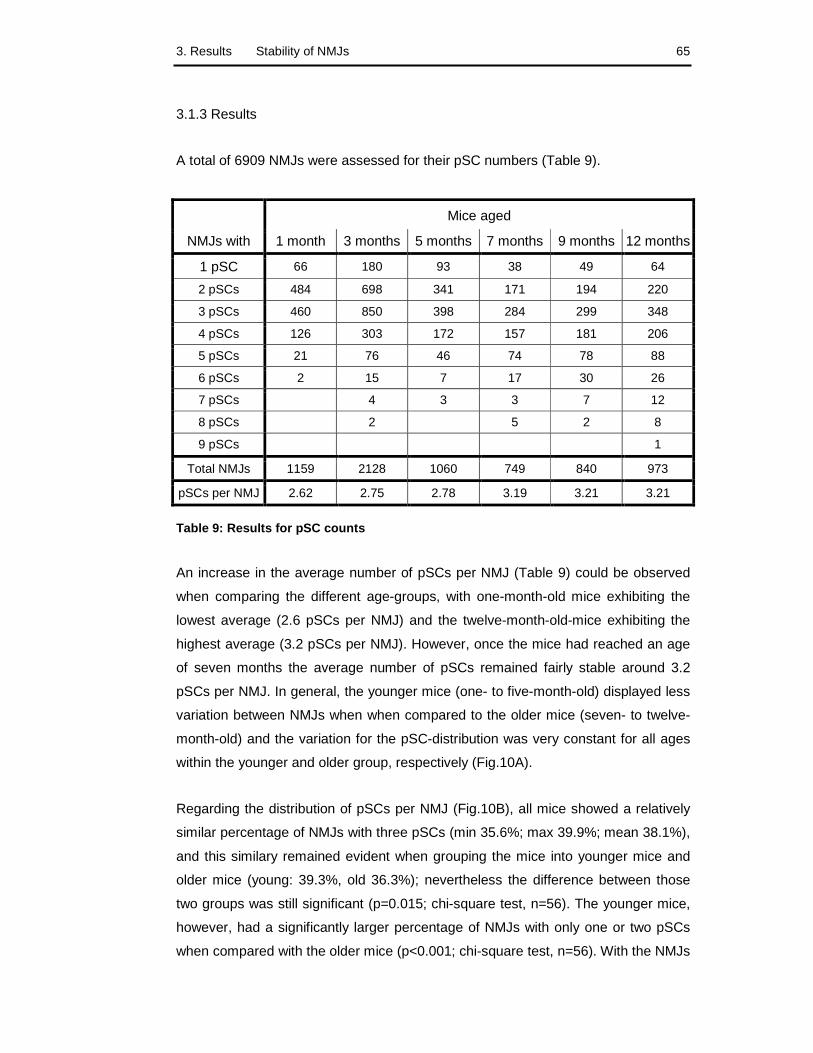
3. Results Stability of NMJs 65
3.1.3 Results
A total of 6909 NMJs were assessed for their pSC numbers (Table 9).
Mice aged
NMJs with 1 month 3 months 5 months 7 months 9 months 12 months
1 pSC 66 180 93 38 49 64
2 pSCs 484 698 341 171 194 220
3 pSCs 460 850 398 284 299 348
4 pSCs 126 303 172 157 181 206
5 pSCs 21 76 46 74 78 88
6 pSCs 2 15 7 17 30 26
7 pSCs 4 3 3 7 12
8 pSCs 2 5 2 8
9 pSCs 1
Total NMJs 1159 2128 1060 749 840 973
pSCs per NMJ 2.62 2.75 2.78 3.19 3.21 3.21
Table 9: Results for pSC counts
An increase in the average number of pSCs per NMJ (Table 9) could be observed
when comparing the different age-groups, with one-month-old mice exhibiting the
lowest average (2.6 pSCs per NMJ) and the twelve-month-old-mice exhibiting the
highest average (3.2 pSCs per NMJ). However, once the mice had reached an age
of seven months the average number of pSCs remained fairly stable around 3.2
pSCs per NMJ. In general, the younger mice (one- to five-month-old) displayed less
variation between NMJs when when compared to the older mice (seven- to twelve-
month-old) and the variation for the pSC-distribution was very constant for all ages
within the younger and older group, respectively (Fig.10A).
Regarding the distribution of pSCs per NMJ (Fig.10B), all mice showed a relatively
similar percentage of NMJs with three pSCs (min 35.6%; max 39.9%; mean 38.1%),
and this similary remained evident when grouping the mice into younger mice and
older mice (young: 39.3%, old 36.3%); nevertheless the difference between those
two groups was still significant (p=0.015; chi-square test, n=56). The younger mice,
however, had a significantly larger percentage of NMJs with only one or two pSCs
when compared with the older mice (p<0.001; chi-square test, n=56). With the NMJs

3. Results Stability of NMJs 66
comprising four or more pSCs, the reverse situation could be observed (p<0.001;
chi-square test, n=56).
Fig.10: Results for pSCs counts per NMJ. A Boxplot for pSCs per NMJ in each age group; the box depicts the values for the second and third quartile, whilst the lower whisker extends to the lowest value within the lower limit (Q1-1.5(Q3-Q1)) and the upper whisker extends to the highest value within the upper limit (Q3+1.5(Q3-Q1)). All outlier points represent one individual value. B distribution of NMJs in relation to their number of pSCs.

3. Results Stability of NMJs 67
Fig.11: NMJs in mice of different ages. Ages in months are depicted in the left column. Note the increased fragmentation of the BTx-signal (circles), which is mirrored by “knobbly” NTs. BTx (orange in composite images) depicts the nAChRs, CFP (blue in composite images), the axons and GFP (green in composite images) the SCs. Scale bars: 20 µm.
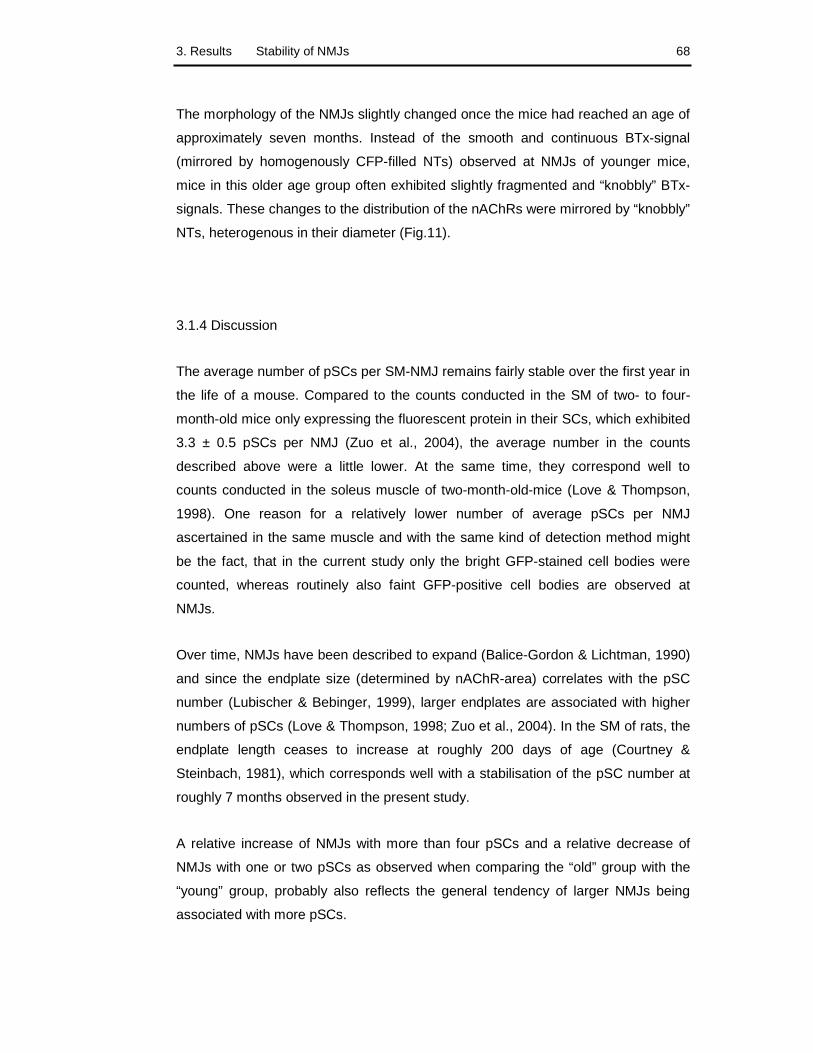
3. Results Stability of NMJs 68
The morphology of the NMJs slightly changed once the mice had reached an age of
approximately seven months. Instead of the smooth and continuous BTx-signal
(mirrored by homogenously CFP-filled NTs) observed at NMJs of younger mice,
mice in this older age group often exhibited slightly fragmented and “knobbly” BTx-
signals. These changes to the distribution of the nAChRs were mirrored by “knobbly”
NTs, heterogenous in their diameter (Fig.11).
3.1.4 Discussion
The average number of pSCs per SM-NMJ remains fairly stable over the first year in
the life of a mouse. Compared to the counts conducted in the SM of two- to four-
month-old mice only expressing the fluorescent protein in their SCs, which exhibited
3.3 ± 0.5 pSCs per NMJ (Zuo et al., 2004), the average number in the counts
described above were a little lower. At the same time, they correspond well to
counts conducted in the soleus muscle of two-month-old-mice (Love & Thompson,
1998). One reason for a relatively lower number of average pSCs per NMJ
ascertained in the same muscle and with the same kind of detection method might
be the fact, that in the current study only the bright GFP-stained cell bodies were
counted, whereas routinely also faint GFP-positive cell bodies are observed at
NMJs.
Over time, NMJs have been described to expand (Balice-Gordon & Lichtman, 1990)
and since the endplate size (determined by nAChR-area) correlates with the pSC
number (Lubischer & Bebinger, 1999), larger endplates are associated with higher
numbers of pSCs (Love & Thompson, 1998; Zuo et al., 2004). In the SM of rats, the
endplate length ceases to increase at roughly 200 days of age (Courtney &
Steinbach, 1981), which corresponds well with a stabilisation of the pSC number at
roughly 7 months observed in the present study.
A relative increase of NMJs with more than four pSCs and a relative decrease of
NMJs with one or two pSCs as observed when comparing the “old” group with the
“young” group, probably also reflects the general tendency of larger NMJs being
associated with more pSCs.

3. Results Stability of NMJs 69
The morphological changes to the NMJs observed in the “old” group are consistent
with those observed previously by other authors (Balice-Gordon, 1997a; Chai et al.,
2011; Courtney & Steinbach, 1981; Li et al., 2011; Smith & Rosenheimer, 1982),
albeit here the very subtle changes were observed many months earlier than
described previously (Balice-Gordon, 1997a; Li et al., 2011). Fragmentation of
nAChRs and the formation of NT-varicosities also occur following insults which lead
to necrosis/degeneration and regeneration of the postsynaptic muscle fibre, thus
these age-related alterations to the NMJs-morphology are surmised to be initiated
by changes to the postsynaptic apparatus (Li et al., 2011; also see chapter 3.2).
3.1.5 Conclusion
The average number of pSCs per NMJ in the SM of double-fluorescent mice
remains very stable over the first year of life of the mouse, indicating that any shift in
pSC numbers must be induced by pathological events.

70
3.2 In vivo imaging of the NMJ
3.2.1 Introduction
In vivo imaging of the NMJ was pioneered in the middle of the 1980s (Lichtman et
al., 1987). One of the muscles most commonly used for these investigations is the
SM (Balice-Gordon, 1997b; Zuo et al., 2004), which lies obliquely in the ventral neck
area and flanks the sternohyoid muscle (SH) (Fig.12). For imaging, the SM is
generally lifted by a small wire loop and flattened with a small circular coverslip. This
set-up improves the optics, whilst stabilising the muscle and also bringing most of
the endplate region into the same focal plane (Balice-Gordon, 1997b; de Paiva et
al., 1999; Lichtman et al., 1987; Zuo et al., 2004).
The application of fluorescent conjugates of α-BTx, which selectively binds the
nAChRs allows for the detection of the junctional area (Lu & Lichtman, 2007).
Additionally, every NMJ has its own very distinct nAChR pattern which means that
this staining helps to discriminate one NMJ from another. Keeping the concentration
of α-BTx around 2-10 µg/ml ensures that only 10-20% of all nAChR are labelled and
synaptic transmission is not influenced (Balice-Gordon, 1997b). Saturation of the
nAChRs has been described following an incubation of 20 minutes at a
concentration of 5 µg/ml (Turney et al., 1996) or 20 µg/ml (van Mier & Lichtman,
1994), whilst other authors claim that incubation of (frog) endplates with α-BTx at a
concentration of 1 µg/ml for more than 30 minutes results in a reduction of the
miniature endplate potentials to more than one tenth (Katz & Miledi, 1973). Most in
vivo imaging paradigms are carried out following an incubation of the muscles with
fluorescently-labelled α-BTx at a concentration of 4-5 µg/ml for 3-5 minutes (Balice-
Gordon & Lichtman, 1993; Rich & Lichtman, 1989b, 1989c; Wigston, 1990; Zuo et
al., 2004), which labels approximately 50% of the nAChR (Rich & Lichtman, 1989b).
Alternatively, the application of 10 µg/ml α-BTx for 1-3 minutes labels 10% of the
nAChRs (O'Malley et al., 1999).

3. Results In vivo imaging 71
Fig.12: Sternohyoid (SH) and sternomastoid (SM) mus cles. A anatomical overview of the left half of the ventral neck area. B following a midline incision with the mouse is lying in dorsal recumbency and gentle retraction of the mandibular glands, the SH (1) and SM (2) become visible.
3.2.2 Specific Materials and Methods
3.2.2.1 Groups and procedures (Table 10)
Fifty-six adult (three months to one year) male and female double-fluorescent mice
in five groups were subjected to in vivo imaging of the ventral neck muscles.

3. Results In vivo imaging 72
Anaesthesia, general approach to the muscles under investigation (approach A) and
the set-up for the in and ex vivo imaging were as described in 2.2 and 2.3.
Table 10: Experimental groups for in vivo imaging trials

3. Results In vivo imaging 73
In groups I, II, and IV, NMJs of the SM were imaged, whereas in groups III and V,
NMJs of the sternohyoid muscle (SH) were imaged. In groups I and II various
different devises were used to stabilise the SM for imaging (Fig.13A). These
included two “lever”-like constructions (lever 1 and 2), rubber tubing positioned
under the SM and a suture thread looped under the SM and attached to the skin
either side. In group IV the approach to the SM was modified in that way, that the
neck/head of the mouse was gently turned so that the SM imaged lay uppermost
(approach B, Fig.13B). In group V, the light intensity the muscles were exposed to
were decreased consecutively both for the orientation and imaging step.
Fig.13: In vivo imaging trials. A different stabilising devices: lever 1 (1), lever 2 (2), suture thread (3), rubber tubing (4); B two different approaches to the muscles imaged: approach A with the mouse lying flat in dorsal recumbency, approach B with the head of the mouse slightly twisted so that the SM imaged lies uppermost.

3. Results In vivo imaging 74
One mouse in group II and two mice each in groups III and IV served as α-BTx-
controls, i.e. in these mice the muscles of interest were only exposed and incubated
with α-BTx, but not imaged or stabilised.
A second imaging session - either in or ex vivo- was conducted between 3 days and
5 weeks later with the aim to revisit the previously imaged NMJs.
3.2.2.2 Scoring
Groups I to IV were assessed regarding the stability of the muscle imaged, the
images acquired in the 1st and 2nd imaging session and the feasibility to reimage
individual NMJs. The images were scored with the following criteria (Table 11):
Imaging session
Criteria Minimum score
Maximum score
Overall detail of images 1 3
Detail of pSCs 1 4
1st
Overall score 2 7
Percentage of NMJs revisited due to location 0 100
Percentage of NMJs revisited due to BTx signal 0 100
Percentage of NMJs with unchanged NTs 0 100
2nd
Percentage of NMJs with unchanged pSCs 0 100
Table 11: Scoring criteria for the in vivo imaging trials
Additionally the scores for groups I and IV were combined in order to be able to
compare the SH and SM muscle.
3.2.2.3 Comparison of SH- and SM- NMJs regarding size and pSC number
In three 14-week-old mice the left and right SH and SM (each mouse n=2 per
muscle) were assessed regarding their number of pSCs per NMJ in the same way
as described in 3.1.2.1.

3. Results In vivo imaging 75
Additionally, the diameter of 15 randomly selected NMJs per muscle was measured
and the average NMJ-diameter for both SH and SM calculated.
3.2.2.4 Statistics
To compare scores, pSCs-counts and NMJ-diameters between muscles 2-sample t-
tests were applied, whereas to compare percentages between muscles chi-square
tests were applied.
3.2.3 Results
3.2.3.1 Survival of mice
Three mice in group II and two mice in group IV died due to anaesthetic or
intubation-related complications.
3.2.3.2 Stability of muscle under investigation
Stabilisation of the SM with either of two levers resulted in the muscle being
reasonably stable and flat for imaging. However, the positioning or rubber tubing
beneath the SM still resulted in the SM being very wobbly; thus no good images
could be acquired or the imaging had to be terminated early. Group II, therefore,
was omitted from the scoring.
Stabilisation of the SH was due to its location not possible (or even necessary).

3. Results In vivo imaging 76
3.2.3.3 Primary imaging sessions
In both SH and SM, reasonably flat NMJs could be imaged. Subjectively, the NMJs
of the SM appeared to be a little bit bigger and more complex than NMJs of the SH,
thus requiring more images to be taken to acquire sufficient detail of the NMJ. With
SH-NMJs, it was often possible to acquire a detailed and in-focus of the entire NMJ
with one image.
3.2.3.4 Secondary imaging sessions
In general, the tissue in follow-up imaging sessions appeared to be not as clear as
in primary imaging sessions. This was especially the case when the time-course
between 1st and 2nd session was less than seven days. Macroscopically, the muscle
subjected to (more) imaging often appeared to less pink and smaller when
compared to the not (or less) imaged contralateral muscle.
“Murkiness” of the tissue thus contributed to the failing of reimaging individual NMJs.
Additionally, in very many cases the morphology of the different components of the
original NMJs had changed. The changes could be seen within a few days and
seemed to persist, as ex vivo reimaging at a later time-point still revealed
morphologically altered NMJs (Figs.14, 15). Changes to the NMJ included a
fragmentation of the α-BTx-signal with loss of the smooth appearance of this signal.
This was often accompanied by a decrease of the NMJ in size. The fragmentation of
the α-BTx-signal was mirrored by “knobbly” CFP-signal in the NT which also lost its
smooth appearance and homogenous diameter. The pSCs exhibited increased
numbers overlying the NMJ and frequently extended long processes towards the
periphery, which could be accompanied by axonal sprouts. In general, the area
imaged appeared to be populated by a surplus of GFP-positive cells.

3. Results In vivo imaging 77
Fig.14: In vivo imaging trials: in vivo imaging results. Four NMJs (two each for A and B) are imaged (1st) and reimaged (2nd) in vivo. Note the general shrinkage of the NMJs (all images have the same magnification), fragmentation of the BTx-signals, which is mirrored by irregular and “knobbly” NTs (CFP) and increased numbers of pSCs (GFP in 2nd) overlying the NMJ. Scale bars: 20 µm.

3. Results In vivo imaging 78
Fig.15: In vivo imaging trials: in and ex vivo imaging results. A first imaging in vivo, B reimaging of the same NMJ two weeks later in vivo, C reimaging of the same NMJ four months later ex vivo. BTx depicts the nACHRs (orange in composite image), CFP the axons (blue in composite image) and GFP the SCs (green in composite image).
Note the fragmentation of the nAchRs, the muscular part of the NMJ, which is mirrored by irregular and “knobbly” NTs (CFP in B and C). Scale bars: 20 µm.
3.2.3.5 α-BTx-controls (Fig.16)
Incubation of the muscles with rhodamine-conjugated α-BTx at a concentration of 2
µg/ml for 10 minutes did not lead to any changes of the neural, glial or postsynaptic
structures of the NMJ both of the SH and SM in a time-course of four days to two
weeks.

3. Results In vivo imaging 79
Fig.16: α-BTx-controls. A overview; B close-up of NMJs. There are no changes observed to the BTx-signal (which depicts the nAChRs and is orange in the composite image), the pSCs (GFP, green in the composite image) and the NTs (CFP, blue in the composite image). Scale bars: A 100 µm, B 20 µm.
3.2.3.6 Scores for groups I, III and IV and SM versus SH (Table 12)
Criteria Groups Muscle
I III IV SM SH p
Imaging session
n=10 n=10 n=10 n=20 n=10
Overall detail of images 2.4 1.7 2.5 2.4 1.7 0.005
Detail of pSCs 2.9 3.4 3.0 2.95 3.4 0.115
1st
Overall score 5.3 5.1 5.5 5.35 5.1 0.599
NMJs revisited 31.1% 71.9% 44.8% 38.2% 71.9% < 0.001
NMJs with unchanged BTx-signal 6.8% 36.8% 2.6% 4.6% 36.8% < 0.001
NMJs with unchanged NTs 0.0% 21.1% 5.1% 2.6% 21.1% < 0.001
2nd
NMJs with unchanged pSCs 1.4% 29.8% 6.4% 3.9% 29.8% < 0.001
Table 12: Scores for groups I, III and IV and compa rison of SM versus SH (scores: 2-sample t-test, n=30; percentages: chi square test, n=30)

3. Results In vivo imaging 80
3.2.3.7 Comparison of SH- and SM-NMJs
In each SH, 100 NMJs were assessed for the number of bright GFP-positive cell
bodies overlying the BTx –signal, whereas in the SM between 64 and 82 NMJs were
assessed. In the SH, an average of 1.9 pSCs per NMJ was observed, whilst in the
SM the average lay at 2.6 pSCs per NMJ (p<0.001, 2-sample t-test, n=12). The
NMJ-diameters measured in the SH ranged from 26.42 µm to 63.64 µm with an
average of 45.83 µm. In the SM the minimum diameter was 48.38 µm, the maximum
diameter was 70.41 µm and the average diameter was 60.38 µm (p<0.001, 2-
sample t-test, n=30).
3.2.3.8 Group V
Decreasing of the fluorescent light intensity omitted from the bulb to 17% whilst
orientating in the sample and to 25% during the acquisition of images still allowed
for sufficient illumination of the SH; it was surmised that these values could be
decreased even further. Additionally, the field diaphragm (diameter of light beam) of
the microscope and the exposure time of the camera were decreased (field
diaphragm: 3; exposure time: 120 ms), whilst the optical gain was doubled. Thus the
general exposure of the muscle to light was even more limited, whilst optimising the
camera input.
In this group 60.1% of the originally imaged NMJs could be revisited and more than
half of these (31.3%) had retained their original α-BTx, NT and pSC morphology.
No changes to the NMJs of the adjacent SMs were noted.

3. Results In vivo imaging 81
3.2.4 Discussion
Like any in vivo procedure, in vivo imaging of NMJs is an invasive procedure and,
therefore, can lead to changes or inhibit processes which normally occur (Balice-
Gordon, 1997b; Lichtman & Fraser, 2001). Investigator-induced changes can be due
to surgical trauma, infection, labelling and phototoxicity (Lichtman & Fraser, 2001),
thus adequate control groups are necessary (Balice-Gordon, 1997b).
Overillumination of the NMJs under investigation induces NT sprouting and
proliferation of pSCs within three to seven days. Additionally, the loss of nAChR-
areas can be observed (O'Malley et al., 1999). Traumatic injury to the innervating
nerve leads to denervation of the endplates. The pSCs react to this by extending
processes, which, following regeneration, are accompanied by NT sprouts;
alternatively, these can also arise from still innervated NMJs (Brown & Ironton,
1978; O'Malley et al., 1999; Son & Thompson, 1995a). A loss of nAChRs (Rich &
Lichtman, 1989b) and increase of pSC numbers can be observed (Love &
Thompson, 1998). Application of paralyzing agents to the endplates, such as
botolinum toxin, high doses of α-BTx (Love & Thompson, 1999), β-BTx or tetanus
toxin also lead to a loss of nAChRs (Balice-Gordon & Lichtman, 1994), a reactive
growth of pSC processes (Kang et al., 2007) and NT sprouts (de Paiva et al., 1999;
Dixon & Harris, 1999; Duchen & Tonge, 1973), albeit in a lower magnitude when
compared to traumatic denervation (Son & Thompson, 1995a). Following muscle
fibre injury , also a loss of nAChRs (Rich & Lichtman, 1989a) with fragmentation of
the nAChRs following regeneration of muscle fibres (Rich & Lichtman, 1989c; Li &
Thompson, 2011; Li et al., 2011) and reactive sprouting of NTs both on the injured
and neighbouring healthy muscle fibres is observed (van Mier & Lichtman, 1994).
Also, the morphologic changes to the cholinesterase pattern of the NMJs of
regenerating muscle fibres following muscle fibre necrosis induced by the snake
toxin cardiotoxin, closely resemble the fragmented nAChR- and NT- patterns
observed in my mice (Duchen et al., 1974). Thus, in summary, overillumination,
traumatic denervation, inactivation of the NMJs following the application of
paralyzing agents and both traumatic and toxic muscle fibre injury result in similar
changes to the different components of the NMJ, namely reactive growing of pSC
processes, increase of pSC numbers, extension of NT sprouts and loss of nAChR-
area, all of which were observed in the present study. Interestingly, the changes to
the BTx- and NT-pattern also resemble those seen in previously not-imaged mice

3. Results In vivo imaging 82
older than nine months, described in the previous chapter (3.1), further supporting
the notion of a limited repertoire for components of the NMJ to react to associated
degenerative changes.
The first attempts of imaging the NMJs were carried out following descriptions on in
vivo imaging of SM-NMJs (group I). However, due to the microscope being
equipped with water-immersion objectives, a coverslipping of the muscle – as
described by other groups conducting in vivo imaging procedures in the SM (see
3.2.1) – had to be omitted. The extensive changes observed in this group lead to the
trial of a different device (rubber tubing or lever B) to stabilise the muscle and a
different approach (approach B) in the hope of being able to omit a stabilising
device. At the same time the application of BTx was validated to investigate whether
the application of this potentially paralyzing agent was the source of the changes
observed. Application of rhodamine-conjugated α-BTx at a concentration of 2 µg/ml
for 10 minutes did not lead to any changes of the different components of the NMJ
at any time-point (four days to two weeks) observed and also was well within the
recommended limits. As the imaged NMJs in these groups, however, remained to
exhibit extensive changes, it was clear that stabilisation and/or imaging of the
muscles must be causing these degenerative changes; thus phototoxity and
traumatic injury to innervating nerve or muscle imaged remained potential
explanations for the changes observed.
The aptitude of the SH for in vivo imaging of NMJs was discovered more
accidentally than intentionally. The SH is a flat paired muscle in the ventral neck
area, which in the mouse originates at the sternum and inserts on the hyoid bone. It
is innervated from dorsolateral by the ventral branch of the first cervical nerve
(Nickel et al., 1992). Similar to the SM, the SH is described to be a fast-twitch
muscle (van Lunteren & Moyer, 2003) composed entirely of type IIb and IIx myosin
heavy chain isoforms (Attal et al., 2000). Other investigators observed close to equal
amounts of type IIa and IIb fibres (Yoshii et al., 2008). One of the functions of the
SH is to contribute to dilation of the pharynx, therefore this muscle contributes to
breathing actions (Attal et al., 2000). All SH-NMJs are confined to a single endplate
band which arches across the middle of the muscle (Must, 1987). Location of the SH
directly on top of the trachea and in the midline render this muscle easily accessible
and very flat at the same time, thus making any stabilisation unnecessary and
minimising any manipulation and the chance of providing injury to either the

3. Results In vivo imaging 83
innervating nerve or the muscle itself. The comparatively smaller and flatter NMJs
with less pSCs (compared to the SM) facilitate imaging, thus making it possible to
minimise the exposure of this muscle to light.
The last control group, therefore, focussed on the SH and aimed to determine the
minimum amount of light required to be able to image this muscle sufficiently. Whilst
it was possible to decrease light exposure significantly, still a number of NMJs
exhibited the changes described above. Thus, it was aspired to decrease the light
intensity even more in further investigations.
3.2.5 Conclusion
Considering the SH did not require any manipulation for imaging, the α-BTx
concentration had been validated and the changes observed in imaged muscles
most accurately resembled those seen following (traumatic or toxic) injury to the
muscle to the muscle itself, it was concluded that the changes were due to
phototoxic damage of the muscle. Fragmentation of the nAChR-pattern, shrinking of
the NMJ and the extension of short pSC processes has been described to be visible
within 3 days of induction of muscle fibre injury (Li & Thompson, 2011). As my
reimaging sessions were conducted after a lag phase of 3 days, it therefore should
have been possible to pick up any changes to the components of the NMJ.
Furthermore, assessments of the neighbouring SM under decreased light exposure
of the SH revealed no changes to these muscles.
Therefore, it was concluded that conservative imaging of the SH by decreasing
the light intensity of the microscope to 17% (or lower), the field diaphragm of the
microscope to 3, the light intensity of camera to 25% (or lower) and the exposure
time to 120ms should allow for in vivo investigations conducted in this muscle. A
concomitant increase of the acquisition gain to x2 would counteract for the loss of
fluorescence intensity observed in the images.
In all cases, the BTx-signal would need to be closely scrutinised for changes, as
fragmentation of the BTx-signal indicates muscle-injury-induced (overillumination,
traumatic and toxic injury) changes to the components of the NMJ. However,

3. Results In vivo imaging 84
considering that these changes appeared to be very localised (see 3.2.3.8), it still
should be possible to extrapolate and combine findings observed on the SM to the
SH and vice versa.

85
3.3 Anti-ganglioside antibody trials
3.3.1 Introduction
As indicated in the introduction (1.1.2) the distribution of gangliosides varies
between the neural and glial structures they are located on. Anti-GM1 Abs, for
example, bind both peripheral motor and sensory nerves (and here also both the
nodal axolemma and the paranodal areas of myelinating SCs), whereas anti-GD1a
Abs preferentially bind motor nerves (Gong et al., 2002).
Similarly, Ab-binding specificities also hold true for the NMJ. Previous studies
investigating the potential neuromuscular neural and/or glial targets for the mouse
monoclonal Abs cloned and produced in-house reached the following observations:
In WT mice, anti-GD3 Abs preferentially induce pSC injury, whilst the application of
anti-GT1a Abs combined with a source of complement leads to a selective injury of
the NTs (Halstead et al., 2005b). Anti-GQ1b Abs in combination with a source of
complement lead to paralysis of the muscle under investigation (Bullens et al.,
2002), thus putatively indicating that this Ab binds and exerts its pathology at the
NT. Other investigators have reported that anti-GM2 Abs bind both the pSCs and
NTs in WT mice (Santafe et al., 2005). In GalNac-Transferase KO s (GM2KO; see
Fig.1), application of an anti-GD3 Abs combined with a source of complement
induce the same electrophysiological changes at the NMJ as a bispecific anti-
GQ1b/anti-GD3-Abs applied to a WT mouse (Bullens et al., 2002), thus also
indicating the ability of this Ab to bind the NT. Finally, in GD3-Synthase KO s
(GD3KO; see Fig.1), anti-GD1a Abs induce axonal/NT injury (Goodfellow et al.,
2005; McGonigal et al., 2010).
Considering the overall aim of the present study was to establish an in vivo imaging
system in which either the neuromuscular neural or glial component or both could be
targeted by anti-ganglioside Abs and monitored, the following investigations were
aimed at determining suitable Abs for the specified injuries of the various structures
of the NMJ. A number of different in house-generated mouse monoclonal Abs were
trialled both in and ex vivo for their staining profiles and injury potential following the
supplementary application of complement.

3. Results Anti-ganglioside antibody trials 86
3.2.2 Specific Materials and Methods
3.2.2.1 Animals and general protocol
WT, GM2KO, GD3KO and PLP-Tg mice, all double-fluorescent, were either
subjected to in vivo (2.2) and/or ex vivo (2.4) application of mouse monoclonal anti-
ganglioside Abs.
3.2.2.2 Antibodies (Table 13)
All Abs applied were mouse monoclonal Abs, generated and characterised for
ganglioside-binding profiles as described previously (Goodfellow et al., 2005;
Goodyear et al., 1999; Halstead et al., 2005b).
Both for in and ex vivo investigations, the Abs were applied for 30 minutes at a
concentration of 100 µg/ml, except for TBG3 which was applied at 200µg/ml (see
2.7). In ex vivo investigations, the Abs were supplemented by fluorescently-labelled
α-BTx.
Antibody Isotype Mouse strain Application Investigation
Binding specificity (ELISA)
WT KO PLP-Tg
In vivo
Ex vivo
Bin-ding
profile Injury
TBG3 GD1a, (GT1b) √ GD3KO √ √ √ √ √
EG1 GT1a, GQ1b, GD3 √ GM2KO √ √ √ √ √
MOG16 GD1b, GT1b, (GD1a) √ GM2KO √ √ √ √ √
CGG3
IgG3
GD3 √ √ √ √
Table 13: Anti-ganglioside Abs applied in the Ab-tr ials
For the illustration of the binding profiles , ex vivo preparations were incubated
with the anti-ganglioside Ab on ice, whilst in vivo-Ab incubations remained at
physiological body temperatures. Following processing of the tissue, the adequate

3. Results Anti-ganglioside antibody trials 87
FITC/TRITC-conjugated secondary Abs were applied as described (see 2.7 and
2.3.1, 2.3.3 and 2.5.1).
In order to investigate the pathological potential of the Abs, tissues was further
incubated with a source of complement (40% normal human serum (NHS), see
2.11) following their Ab-incubation and then processed for qualitative imaging (see
2.3 and 2.5). All these incubations were conducted at 37ºC.
3.2.2.3 Determination of injury to neural/glial structures of the NMJ
The fluorescent proteins expressed in the axons and SCs of the fluorescent mice
are both localised to the cytosol as soluble free proteins (Wesley Thompson,
personal communications). Following a loss of the axolemmal/SC membrane
integrity, for example due to the formation of MAC pores on these, these proteins
(presumably) diffuse out of the axon/SC. Thus a loss of CFP/GFP serves as a rapid
and reliable indicator of complement-mediated injury to these.
3.2.2.4 Additional illustration of a loss of pSC membrane integrity
In order to further demonstrate the loss of pSC membrane integrity, NHS in many
cases was supplemented by EthD-2 (1:500), a nuclear marker, whose cellular
ingress und subsequent nuclear binding indicates a loss of cell membrane integrity.
3.2.2.5 Auxiliary investigations regarding the TBG3-binding profile
TS-preparations incubated as described above were permeabilised as described in
2.6.1 and stained for Ab-deposition as described above.

3. Results Anti-ganglioside antibody trials 88
Fig.17: Anti-ganglioside Ab-binding patterns at the NMJ. In A (MOG16 in WT), B (CCG3 in PLP-Tg) and C (EG1 in PLP-Tg) the Ab-binding patterns (α-IgG3; pink in the composite image) resemble the BTx-signal (which depicts the nAChRs; orange in the composite image), whereas in D (EG1 in GM2KO), E (EG1 in WT) and F (MOG16 in PLP-Tg) the Ab colocalises with the pSCs (GFP, green in the composite image). CFP depicts the axons, which are blue in the composite image. Scale bars: 20 µm.

3. Results Anti-ganglioside antibody trials 89
3.3.3 Results
3.3.3.1 Binding profiles
Depending on the ganglioside-specificity applied the staining of the secondary Abs
either very much resembled the nAChR-pattern or colocalised with the pSCs
(Fig.17).
The binding pattern for TBG3 in WT mice was very difficult to illustrate (Fig.18A).
Therefore, TBG3 was applied to GD3KOs which relatively overexpress the Ab-
target. In these mice, the staining pattern for TBG3 much resembled the nAChR-
pattern (Fig.18B). In PLP-Tg mice TBG3 did not bind (Fig. 18C); this was expected
considering the fact that the NTs of these mice do not possess any complex
gangliosides. Following permeabilisation both of WT- and GD3KO-tissue incubated
with TBG3, Ab could be easily detected in both; the staining pattern now resembled
the CFP-pattern with punctuate interspersed dense patches of Ab (Fig.18D, E).
3.3.3.2 Loss of fluorescent proteins
Following the acute topical application either in vivo or ex vivo of anti-ganglioside
Abs no changes to the neural or glial components could be observed (Fig.19A).
Only once NHS was applied as a source of external complement, a rapid loss of
either GFP and/or CFP was observed. Within 15 minutes of the application of NHS
following a TBG3-incubation, the NTs started to bleb, exhibit constrictions and a
local loss of CFP (Fig.19B). These changes only involved the area overlying the
NMJ or extended proximally along the axon for a short distance (Fig.19C).
With GFP, the loss of fluorescent protein occurred roughly within the same time-
frame and within 30 minutes of the application of complement the nuclei of injured
pSCs were stained with EthD-2 (Figs.20, 21).
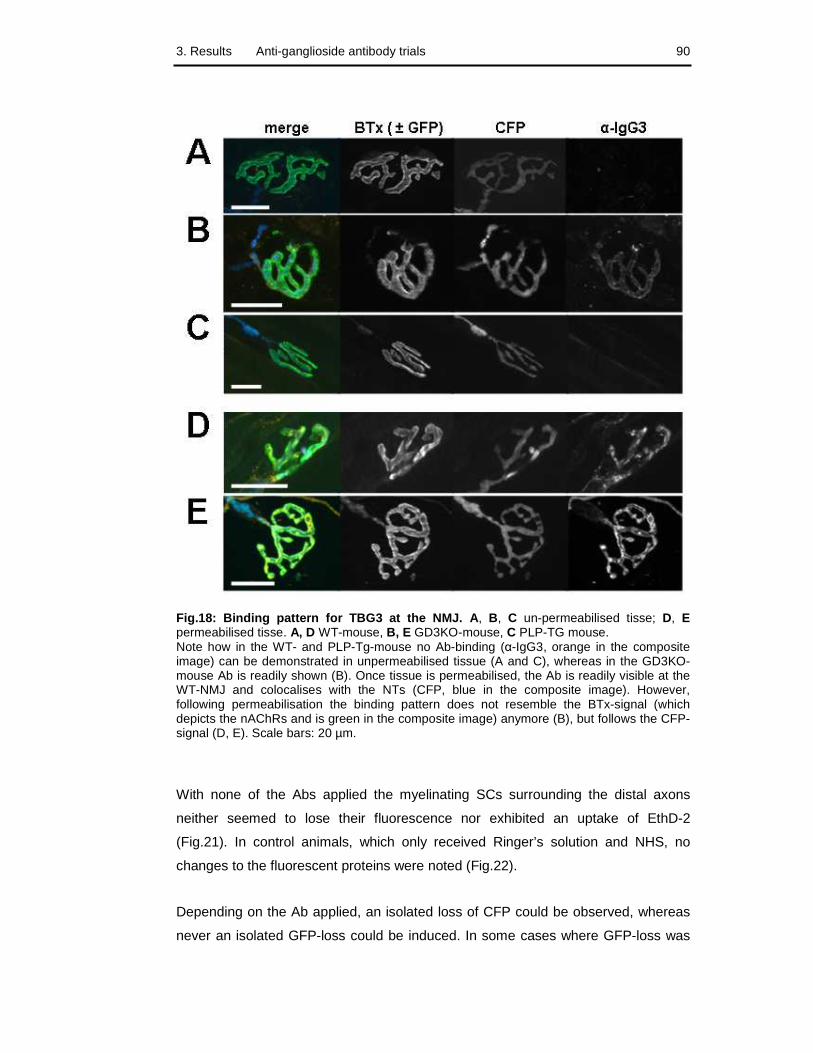
3. Results Anti-ganglioside antibody trials 90
Fig.18: Binding pattern for TBG3 at the NMJ. A, B, C un-permeabilised tisse; D, E permeabilised tisse. A, D WT-mouse, B, E GD3KO-mouse, C PLP-TG mouse. Note how in the WT- and PLP-Tg-mouse no Ab-binding (α-IgG3, orange in the composite image) can be demonstrated in unpermeabilised tissue (A and C), whereas in the GD3KO-mouse Ab is readily shown (B). Once tissue is permeabilised, the Ab is readily visible at the WT-NMJ and colocalises with the NTs (CFP, blue in the composite image). However, following permeabilisation the binding pattern does not resemble the BTx-signal (which depicts the nAChRs and is green in the composite image) anymore (B), but follows the CFP-signal (D, E). Scale bars: 20 µm.
With none of the Abs applied the myelinating SCs surrounding the distal axons
neither seemed to lose their fluorescence nor exhibited an uptake of EthD-2
(Fig.21). In control animals, which only received Ringer’s solution and NHS, no
changes to the fluorescent proteins were noted (Fig.22).
Depending on the Ab applied, an isolated loss of CFP could be observed, whereas
never an isolated GFP-loss could be induced. In some cases where GFP-loss was

3. Results Anti-ganglioside antibody trials 91
readily observed, the changes to the physiological CFP-pattern were only very
subtle (Fig.20), whilst in other cases they were very obvious (Figs.21C, 23).
Especially with EG1, the CFP-changes appeared to be concentration-dependent,
i.e. lower concentrations of EG1 lead to less concomitant loss of CFP in addition to
the well reproducible loss of GFP (Figs.20, 21).
Fig.19: NT injury following the application of TBG3 and complement. A No changes to the NT (CFP) are observed following the application of Ab. Only once the source of complement (NHS) is applied, the NT starts to bleb and looses its fluorescence (arrow). B In vivo documentation of injury progression. At t0 the Ab-application is completed and the muscle is incubated with complement. Within 15 minutes (t15, arrows) of the application of complement, changes to the morphology of the NT (CFP) can be observed, whereas the GFP-signal for the pSCs remains physiological (same as t0). The pSCs also do not exhibit any uptake of EthD-2 (orange in the composite image), indicating that their cell membrane integrity is not compromised by complement-mediated injury. C Ex vivo image of the acute injury following 30 minutes of incubation with Ab and complement. In A, B and C, BTx depicts the nAChRs (orange in the composite image), CFP the axons (blue in the composite images) and GFP the SCs (green in the composite images). Scale bars: 20 µm.

3. Results Anti-ganglioside antibody trials 92
Fig.20: pSC injury in WT-mouse following the applic ation of EG1 and complement. The GFP-positive cell bodies are replaced by EthD-2 stained nuclei (orange in the composite image). Note the very subtle changes to the circled NTs (CFP), wherase the other NTs remain healthy. BTx depicts the nAChRs (pink in the composite image), CFP the axons (blue in the composite image) and GFP the SCs (green in the composite image). Scale bar: 20 µm.
Fig.21: Examination of myelinating SCs and dose-dep endant injury of the NTs following the application of EG1 and complement. No loss of GFP or uptake of EthD-2

3. Results Anti-ganglioside antibody trials 93
(orange in the composite images) in the myelinating SCs in A NT injury, B predominant pSC injury following the application of EG1 at 50 µg/ml (half the usual concentration) and C combined NT and pSC injury following the application of EG1 at 100 µg/ml (usual concentration). BTx depicts the nAChRs (pink in the composite image), CFP the axons (blue in the composite image) and GFP the SCs (green in the composite image). Scale bars: 100 µm.
Fig.22: Control muscles (incubated with Ringer’s so lution followed by complement.) A in vivo application and imaging; B ex vivo application and imaging. No changes to the fluorescent proteins are noted. BTx depicts the nAChRs (orange in the composite image), CFP the axons (blue in the composite image) and GFP the SCs (green in the composite image). Scale bars: A 20 µm, B 100 µm.

3. Results Anti-ganglioside antibody trials 94
3.3.3.3 Summary of results (Table 14)
In and ex vivo application of anti-ganglioside Abs in conjunction with a source of
complement revealed the following binding profiles and injury specificities.
Antibodies with a binding profile resembling the nAChR-pattern corresponded to
selective NT-injuries, whereas Abs which exhibited a binding profile colocalising with
pSCs, resulted in pSC injuries and NT changes of varying degree.
Mouse strain
WT GD3KO GM2KO PLP-Tg
Antibody
binding injury binding injury binding injury binding injury
TBG3 NT NT NT NT n.i. n.i. – –
EG1 pSC pSC + NT n.i. n.i. pSC pSC + NT NT NT
MOG16 NT NT n.i. n.i. – – pSC pSC + NT
CGG3 pSC n.i. n.i. n.i. n.i. n.i. NT NT
Table 14: Results for anti-ganglioside Ab-binding a nd –injury trials (n.i. not investigated)
Fig.23: Application of MOG16 in PLP-Tg mice. Despite this Ab exhibiting a pSC staining pattern (see Fig.17), a loss of CFP (blue in the composite images) overlying the NMJ (BTx, orange in the composite images) can be observed, indicating that the NTs are injured in addition to the pSCs (GFP, green in the composite images). Scale bars: A 100 µm, B 20 µm.

3. Results Anti-ganglioside antibody trials 95
3.3.4 Discussion
Similar to previous investigations conducted in WT and KO non-fluorescent mice,
the application of anti-ganglioside Abs with varying affinities to the different
gangliosides and a source of complement resulted in selective injuries to the neural
and/or glial components of the NMJ depending on the affinity of the Ab applied.
An injury specifically to the NTs in WT mice was elicited following the application of
anti-GD1a-, anti-GD1b- and anti-GT1b-Abs. This corresponds well to previous
investigations (Halstead et al., 2005b) and clinical studies, where anti-GM1 and anti-
GD1a Abs are predominantly found in patients suffering from acute motor axonal
forms of GBS (Kaida et al., 2000; Press et al., 2001). Also, the fact that anti-GD1a
Abs bind at lower levels (i.e. are harder to demonstrate) in WT mice when compared
to GD3KO-mice, correlates well with the literature (Goodfellow et al., 2005). The
rather unexpected and highly interesting finding, that TBG3, the anti-GD1a Ab, could
readily be demonstrated at the NT of WT following permeabilisation of these
structures, indicates that this Ab must be internalised rapidly in this area and lead to
a side-study exploring this phenomenon (see 3.5). Additionally, this finding then also
explains why in previous studies WT-NMJs appeared to be relatively refractory to
anti-GD1a Ab-mediated injury at the standard concentration of 100 µg/ml
(Goodfellow et al., 2005). In the current settings anti-GD1a Ab (TBG3) was applied
at double the concentration (200 µg/ml) and a shorter incubation period, thus
increasing the Ab-load and limiting the time available for uptake into the NT.
Rather unexpectedly, however, and contrary to previous observations, it did not
seem to be possible to elicit a selective injury to the pSCs in WT fluorescent mice.
Previous investigations had indicated that pSC injury in these mice is relatively
associated with a GD3-reactivity of Abs (Halstead et al., 2005b); at the same time it
was surmised that variations in Ab-concentration and exposure times could result in
a broadening of the target structures (Halstead et al., 2005b). In the current study,
both the application of EG1 and CGG3 in WT mice resulted in combined pSC and
NT injuries, however, especially for EG1 a dose-dependant target shift could be
observed, with lower concentrations (50 µg/ml) resulting primary in injuries to the
pSCs (albeit at a lower overall frequency) and regular concentrations (100 µg/ml)
resulting in combined injuries to pSCs and NTs.

3. Results Anti-ganglioside antibody trials 96
The application of EG1 and complement in GM2KO mice resulted in a combined
pSC and NT injury. This potentially can be explained by the knockout of the
GalNacTransferase in these mice which leads to the NTs expressing GD3 instead of
complex gangliosides. Thus an Ab targeting GD3 binds both pSCs and NTs and
results in a complement-mediated injury to both of these. This Ab therefore could
not contribute to explaining the background behind the contradictory observations
described above.
At this point it might be worthwhile mentioning the efficacy of binding patterns. The
binding pattern of Abs which in conjunction with complement lead to injury of the
NTs, closely resemble the staining pattern for nAChRs (BTx) (Fig. 17). This staining
pattern on the other hand is also very similar to that shown for acetylcholineesterase
(Rich & Lichtman, 1989c), glycoproteins of the synaptic basal lamina stained with L-
VVA (O'Malley et al., 1999) or following the application of RH795 (Balice-Gordon &
Lichtman, 1993), a dye used for the functional imaging of neurons (product
information, Molecular Probes). The analogy of staining patterns observed for
muscular, basal membranous and neural structures of the NMJ presumably
indicates the close proximity of these structures to one another, especially for when
Abs applied can only bind the synaptic (abglial) side of the NTs. In stark contrast to
this, the binding patterns for pSCs are very distinct due to colocalisation with GFP-
filled cell bodies overlying the NMJS in these mice (Fig.17). At the same time, it is
not clear to what extent pSC binding patterns mask NT binding patterns due to the
relation of these structures to one another. The pSCs processes precisely align with
the NTs, thus making it difficult to discern whether the Abs actually are binding the
NTs, the pSC processes or both.
Thus, there are three potential explanations, why all Abs which exhibited a pSC
binding profile induced both a pSC and NT injury following the application of
complement (Table 14): a) the Ab binds to both the pSCs and NTs and the NT-
binding is masked by the pSC-binding, b) the NT-injury is a bystander (friendly fire)
injury following a severe complement activation on the pSCs or c) the NTs show
changes to their morphology as a result of the injury to their pSC. As briefly
indicated above, b) and c) lie in direct contrast to previous investigations where the
short-term ablation of the pSCs did not lead to any ultrastructural or functional
changes of the NTs (Halstead et al., 2005b). A caveat to the previous investigations,
however, is that the pSC ablation/injury was not complete (Halstead et al., 2005b)

3. Results Anti-ganglioside antibody trials 97
and the subtle changes to the CFP observed in the present study might not have
been discernible in ultrastructural and electrophysiological investigations conducted
in the previous investigations.
The application of MOG16 in PLP-Tg mice provided some help in elucidating this
question. In ELISAs, MOG16 binds the complex gangliosides GD1b and GT1b. In
WT-muscles, this Ab exhibits a binding pattern similar to the BTx-signal and induces
a selective injury to the NTs. In PLP-Tg mice, however, this Ab colocalises with the
pSCs and, following the application of complement, results in a very pronounced
pSC injury which is accompanied by obvious changes to the NTs (Fig.23).
Technically, PLP-Tg mice only express complex gangliosides in the SCs of their
PNS, as the promoter (PLP) for the enzyme required to synthesise complex
gangliosides is only found in certain glial cells, such as SC precursors,
oligodendrocytes and olfactory ensheating cells, and some non-glial cells (Griffiths
et al., 1998). However, recent publications have indicated a possibility of neuronal
expression of PLP in mice (Miller et al., 2009; Sarret et al., 2010) with research
specifically showing the embryonic expression of soma-restricted products of the
PLP gene in motor neurons of the PNS (Jacobs et al., 2004). This would mean that
depending on the life of the enzyme and the rate of ganglioside turnover at the NT,
PLP-Tg mice potentially could possess complex gangliosides on their NTs
(confirmed by personal communications with Wendy Macklin, supplier of the PLP-
promoter). However, if the neural structures in these mice do possess complex
gangliosides, they should also be vulnerable to the application of TBG3 and
complement, which in WT mice leads to a very reliable NT-injury. In PLP-Tg-mice,
however, TBG3 does not bind and the application of TBG3 and complement does
not lead any changes to the NTs; therefore, PLP-Tg neural structures do not contain
any complex gangliosides, and potential explanation a) (the masking of a NT binding
pattern by a pSC binding pattern) cannot apply to these mice. When comparing pSC
binding profiles for PLP and WT mice no obvious differences can be observed. This,
together with the fact that an Ab which definitely only binds the pSCs leads to a
combined pSC and NT injury in the PLP-Tg mouse, indicates that the concomitant
injury of the NTs with the pSC injury in the WT mouse most likely is the result of a
bystander injury (explanation b)) or reactive changes of the NT following the pSC
injury (explanation c)). Further investigations are warranted to provide a definite
answer to this observation.

3. Results Anti-ganglioside antibody trials 98
In addition to raising a number of questions, the binding and injury profiles, however,
also resulted in the very interesting observation, namely that the reintroduction of
the GalNac-Transferase in PLP-Tg mice via the PLP-promotor resulted in a changed
ganglioside profile of the pSCs of these mice. Instead of the simple ganglioside
GD3, the pSCs of these mice now express the complex gangliosides GD1b and/or
GT1b. The switch seems to be complete as both EG1 and CGG3, Abs which both
bind GD3, exhibit a NT binding profile and induce a selective NT-injury in these mice
(Fig.17).
3.3.5 Conclusion
Despite raising a number of questions, the investigations described in this chapter
indicate that for WT mice, a selective and reliable injury to the NTs can be induced
following the application of TBG3. The concentration of this Ab needs to be
increased and the exposure time decreased to be able to compensate for the rapid
internalisation of this Ab at the NT. A reliable combined injury to NTs and pSCs can
be achieved by applying both TBG3 and EG1 simultaneously.
Currently, no selective injury to pSCs can be elicited in fluorescent mice.

99
3.4 Comparison of SM and SH regarding Ab-binding, N T sprouting and
pSC process extension
3.4.1 Introduction
Previous investigations conducted in the murine model for GBS have revealed
differences in the strain susceptibility to Ab-mediated injury. NIH(s) mice, which
were used in the earliest investigations, seemed relatively refractory to Ab- and
complement-mediated of pSCs when compared to Balb/c and C57Bl/6 mice
(Halstead et al., 2004, 2005b). This appears to be due to a difference in the level of
anti-ganglioside Ab-binding (unpublished data).
The homozygous strain of double-fluorescent mice was outbred with DBA females
to acquire bigger litters and thus increase the availability of mice. As it was intended
to make use of all stocks (both homozygous and heterozygous male and female
mice) the following investigations were aimed at determining whether the Ab-binding
level for the Ab in mind to create in vivo NT-injuries was equal for all muscles under
investigation in both homozygous and heterozygous male and female mice. The Ab-
binding levels were determined semi-quantitatively by assessing the fluorescence
intensity of secondary Abs overlying the NMJ (briefly described in 2.5.3), a method
repeatedly published in previous instances (Goodfellow et al., 2005; Greenshields et
al., 2009; Halstead et al., 2004). Obviously, this methodology does not allow for
determining the exact amount of Ab bound at the NMJ. However, as all staining runs
are carried out in parallel and with the same agents, it does allow for the relative
comparison of the level of Ab bound in the muscles under investigation.
On an entirely different note, research has indicated that the ability and rate of NTs
to sprout following traumatic denervation of the NMJ or toxin-induced paralysis
differs between fast- and slow-twitch muscles, with NTs of slow-twitch-muscles
exhibiting a greater capacity and/or faster NT sprouting (Brown et al., 1980; Duchen,
1970; Duchen & Tonge, 1973; Frey et al., 2000; Hopkins et al., 1986). As indicated
in the introduction (1.3.3.3), NT sprouts follow extended pSC processes and can be
induced by these (Son & Thompson, 1995a); both the axonal sprouts and the
reactive pSCs extending processes are GAP-43 positive (Woolf et al., 1992).
Considering the SM and SH, the muscles aspired to be used in the in vivo
investigations, are predominantly fast-twitch (d'Albis et al., 1988; Kemp et al., 2009;

3. Results Validation of SM and SH 100
van Lunteren & Moyer, 2003), the ability of these muscles to exhibit pSC processes
and NT sprouts following (traumatic) denervation of the NMJs was examined.
3.4.2 Specific Materials and Methods
3.4.2.1 Antibody-binding capacity
The SM, SH and TS of four age-matched (10 to 12 weeks) homozygous and
heterozygous double-fluourescent WT mice (one male and one female each) were
extracted and snap-frozen at -80ºC.
Muscles were mounted on blocks of embedding compound (Bright cryo-m-bed,
Bright Instrument Company Limited, Huntingdon, UK), sectioned longitudinally at 8
µm with a cryostat (Bright Company Limited, Huntingdon, UK) and transferred to
glass slides (Menzel, Braunschweig, Germany).
Two samples per muscle per animal were incubated with TBG3 (50µg/ml) for 2
hours at 4ºC, rinsed in PBS and further incubated with TRITC-conjugated α-m-IgG3
(1:300 in PBS) and FITC-conjugated BTx (1.3 µg/ml) for 6 hours at 4ºC (see also
2.7 and 2.8). Slides were washed in PBS, mounted in Citifluor anti-fading agent
(Citifluor products, Canterbury, UK), coverslipped and sealed.
The Ab-deposit overlying the NMJ was determined and semi-quantified for each
muscle section as described in 2.5.3 and muscles/lines/sexes were compared using
the Mann-Whitney test for non-parametrical data.
3.4.2.2 Nerve terminal sprouting and pSC process extension capacity
In twelve heterozygous double-fluorescent WT mice the SM and SH were exposed
as described in 2.2.1. Then the left CNXI was crushed at the point of appearance
from under the digastric muscle (see Fig. 12; roughly 3 to 5 mm proximal to the

3. Results Validation of SM and SH 101
entrance into the SM) and the left innervating nerve to the SH was crushed directly
at its entrance into the SH. The mice were recovered and sacrificed after four (n=3),
seven (n=3) and 14 days (n=6). For qualitative assessments (n=3 for each time-
point) the SM and SH were processed and imaged as described in 2.3.1 and 2.3.4
The remaining three mice (14 days of regeneration) were perfused as described in
2.3.2 and the SM permeabilised as described in 2.6.2. Anti-GAP-43 was applied in
blocking serum III (2.10) at a concentration of 1:500, 1:250 and 1:125 for 3 days at
4ºC, followed by a PBS wash and an incubation with secondary Ab (TRITC-
conjugated anti-m-IgG2a, 1:100) and Cy5-conjugated BTx (1:500) for 4h at RT. SM
were imaged as described in 2.3.4.
3.4.3 Results
3.4.3.1 Antibody-binding capacity
In total 1867 NMJs (minimum 82 NMJs, maximum 262 NMJs per muscle, sex and
strain) were imaged.
The Ab-binding capacity were similar for all muscles in male and female homo- and
heterozygous double-fluorescent mice with the SH in male heterozygous TS
exhibiting the highest levels and the homozygous TS (both male and female)
exhibiting the lowest levels (Fig.24A).
In statistical analyses, no significant differences were observed between
homozygous and heterozygous SH (p=0.812; Mann-Whitney test, n=830) and SM
(p=0.565; Mann-Whitney test, n=433) with the SM generally exhibiting lower levels
of Ab-deposit when compared to the SH. A significant difference in the levels of Ab-
binding was observed when comparing homozygous and heterozygous TS
(p<0.001; Mann Whitney test, n=604; Fig.24B).

3. Results Validation of SM and SH 102
Fig.24: TBG3-binding at SH-, SM- and TS-NMJs of fem ale and male double-fluorescent mice. A overview of binding values for all muscle sections; B comparison of the different muscles in heterozygous and homozygous double-fluorescent mice. Mann-Whitney test; n=830 (SH), n=433 (SM) and n=604 (TS). Each point represents one measurement. The maximum value obtainable for a measurement is 255.

3. Results Validation of SM and SH 103
When combining all three muscles and comparing male and female heterozygous or
homozygous mice, a slight (however significant (p=0.021; Mann-Whitney test;
n=1037)) difference was noted between male and female heterozygous mice,
however, there was no difference between male and female homozygous mice
(p=0.189; Mann-Whitney test, n=830; Fig.25).
Fig.25: Comparison of TBG3-binding capacity between the female and male individuals of each strain. Mann-Whitney test, n=1037 (het) and n=830 (hom). Each point represents one measurement. The maximum value obtainable for a measurement is 255.
Pooling all three muscles and both sexes and comparing heterozygous and
homozygous mice, a significant difference between the two strains of mice was
observed (p<0.001; Mann-Whitney test, n=1867; Fig.26A). This however, is due to
the difference of Ab-deposit in the TS between the two strains, as the exclusion of
this muscle lead to no significant difference being observed between homozygous
and heterozygous double-fluorescent mice (p=0.853; Mann-Whitney test, n=1263;
Fig.26B).

3. Results Validation of SM and SH 104
Fig.26: Comparison of the TBG3-binding capacity bet ween heterozygous and homozygous double-fluorescent mice. A all muscles; B TS excluded. Statistics were conducted with Mann-Whitney tests; n=1867 (A), n=1263(B). Each point represents one measurement. The maximum value obtainable for a measurement is 255.

3. Results Validation of SM and SH 105
3.4.3.2 Nerve terminal sprouting and pSC process extension in SM and SH following
traumatic denervation
Following four days of regeneration, many NMJs of the left SH already exhibited
CFP overlying the NMJ. The presence of CFP occurred in a latero-medial fashion.
Also, GFP-positive processes and axonal sprouts extending from CFP-positive
NMJs were observed (Fig.27A). In general, there seemed to be a surplus of GFP-
positive cells. At this time-point, the SM exhibited no CFP, whatsoever. In some
areas of the SM, GFP-positive networks were observed, whereas in other areas, the
pSCs and myelinating SCs only extended very tentative processes (Fig.27B).
Fig.27: Sternohyoid (A) and SM (B) muscles four days after crush of the innervating nerve. Note the lack of axons (CFP) in the SM. The reinnervated SH-NMJ extends a NT sprout (CFP in A, arrow) and a pSC process (GFP in A, arrow) whilst the SH-NMJ to the right of the innervated NMJ exhibits a surplus of GFP-positive cells on its efferent axon (asterisk). The close-up of the SM-pSCs (GFP in B) also shows pSC processes (arrows). BTx depicts the nAChRs (orange in the composite images), CFP the axons (blue in the composite images) and GFP the SCs (green in the composite images). Scale bars: A 20 µm, B 100 µm.

3. Results Validation of SM and SH 106
At seven days of regeneration, all SH-NMJs exhibited CFP overlying their BTx-
signal and very many NMJs exhibited processes extending from GFP-positive cells
and NT sprouts (Fig.28A). The SM was in the process of reinnervation, with some
NTs exhibiting short sprouts. Here, a surplus of GFP-positive cells was observed
which formed extensive networks. These often bridged individual NMJs (Fig.28B) A
further seven days later, the SH closely resembled the control muscles, with only
very few and distinct processes extending from GFP-positive cells and one or two
NT sprouts to be seen (Fig.28C). The SM also exhibited CFP overlying all its NMJs,
however, nearly every NMJ exhibited NT sprouts and extensive networks of GFP-
positive cells could be observed, of which there was still a surplus. In many
occasions both CFP- and GFP-positive processes bridged individual NMJs
(Fig.28D)
Control SM and SH did not exhibit any changes to their fluorescent proteins; this
includes pSCs processes or NT sprouts (Fig.28E).
The anti-GAP-43 stain predominantly colocalised with GFP-positive structures. Here
both the cell bodies and processes were stained (Fig.29). Only very occasionally
axonal structures were stained.
Fig. 28 see overleaf
Fig.29: GAP-43-stain at regenerating NMJs. GAP-43 (orange in the composite image) colocalises mainly with the GFP-signal for the pSC cell bodies and processes. BTx depicts the nAChRs (pink in the composite image), CFP the axons (blue in the composite image) and GFP the SCs (green in the composite image). Scale bar: 20 µm.

3. Results Validation of SM and SH 107
Fig.28: Recovery of the SH and SM from crush of the innervating nerve. A, B 7 days after crush. C, D 14 days after crush. E control NMJ. A note the long pSC process (GFP) and NT sprout (CFP) extending to the right in the NMJ. The efferent axon is on the left. B networks of GFP-positive cells and return of some CFP to all three NMJs; the NMJ at the top (arrow) exhibits the most complete reinnervation. C the SH-NMJs exhibit a physiological morphology, D two SM-NMJs are bridged both by axons (CFP) and pSC processes (GFP). BTx depicts the nAChRs (orange in the composite images), CFP the axons (blue in the composite images) and GFP the SCs (green in the composite images). Scale bars: A, B 100 µm, C-E 20 µm.

3. Results Validation of SM and SH 108
3.4.4 Discussion and Conclusion
3.4.4.1 Antibody-binding capacity
Differences in the ganglioside distribution in the same species have been reported
for various areas of the central nervous system and these also seem to undergo
changes during maturation of the animal (Bhargava et al., 1984). Similar findings
were made when comparing human extraocular and limb/axial muscles. Here a
difference in the neuromuscular staining was observed, with the extraocular NMJs
exhibiting a stronger binding for anti-GQ1b, -GT1a and –GD1b Abs when compared
to the limb and axial muscles (Liu et al., 2009).
The results described above reveal no major differences in the ganglioside
distribution at NTs for the two predominantly fast-twitch muscles, SH (van Lunteren
& Moyer, 2003) and SM (Kemp et al., 2009) both in homo- and heterozygous
double-fluorescent mice. In both strains lower Ab-deposits were observed in the SM
when compared to the SH, which means potentially that the SH-NTs are slightly
more susceptible to anti-ganglioside Ab and complement-mediated injury.
Nevertheless, it should be feasible to extrapolate data acquired both from
homozygous and heterozygous mice for these two muscles.
Interestingly, the homozygous predominantly slow-twitch TS (Baxter et al., 2008)
exhibited a much reduced Ab-binding capacity when compared to the heterozygous
TS. The reason behind this remains to be elucidated. Therefore, at this point –
considering the heterozygous TS exhibited Ab-binding levels similar to SH and SM –
further investigations should exclude the homozygous TS and only utilise
heterozygous TS.
3.4.4.2 Nerve terminal sprouting and pSC process extension
Many investigations assessing pSC process extension and associated NT sprouting
following traumatic denervation of the NMJ have been conducted in the soleus
muscle (Brown & Holland, 1979; Love & Thompson, 1999; Reynolds & Woolf, 1992;
Son & Thompson 1995a, 1995b), which predominantly is a slow-twitch muscle

3. Results Validation of SM and SH 109
(d'Albis et al., 1988; Kemp et al., 2009). At the same time, a difference in the
capacity NTs to produce axonal sprouts has been reported with NTs from slow-
twitch muscles exhibiting a greater capacity for this behaviour when compared to
NTs located on fast-twitch muscles (Brown et al., 1980; Duchen & Tonge, 1973;
Frey et al., 2000; Hopkins et al., 1986). This might be due to the fact that
Semaphorin 3A, a growth-cone collapse inducing factor and therefore inhibitory for
the growth of neurites, is selectively expressed in pSCs of fast-twitch (IIb/x) muscle
fibres following denervation or toxin-induced paralysis (De Winter et al., 2006).
Interestingly, however, other investigators have reported that following paralysis of
muscles with botulinum toxin the morphology and actual period of nerve growth (four
weeks) both in slow- and fast-twitch muscles is very similar. The principal difference
is at what rate these changes occur. In slow-twitch muscles these changes are
observed roughly two to three weeks earlier than in fast-twitch muscles (Duchen,
1970).
In general, and as briefly introduced in the introduction (1.3.3.3), following crush
injuries to the innervating nerve, pSCs of denervated NMJs extend processes
towards the periphery in the aim of reaching another NMJ; preferentially these pSCs
bridges are formed between innervated and denervated NMJs (in contrast to two
denervated NMJs) (Love & Thompson, 1999). In the event of contacting an
innervated NMJ, the pSCs then induce the NT to sprout and guide it back to their
own NMJ to regain innervation (Son & Thompson, 1995a). In regenerating muscles,
the NMJs therefore are cross-linked by pSC-processes and axonal sprouts, and
following regeneration “escaping”/overshooting axons which follow pSC processes
extending towards the periphery can be observed (O'Malley et al., 1999; Son &
Thompson 1995a, 1995b; Son et al., 1996).
The results described above, clearly indicate that the SM and SH, which both are
predominantly fast-twitch-muscles (d'Albis et al., 1988; Kemp et al., 2009; van
Lunteren & Moyer, 2003), exhibit pSC processes and NT sprouts during their
reinnervation period after a crush injury to their innervating nerve.
In the early stages after nerve injury, only few pSC processes were observed. In the
SM, however, these soon extended and resulted in extensive networks of GFP-
positive cells, which could still be seen at the time-point when most NMJs had
recovered their CFP-signal (NTs). In the SH, many pSC processes were noted, too,

3. Results Validation of SM and SH 110
these however, did not form extensive networks. Within seven to ten days following
reinnervation, the SH-pSCs had returned to control morphology. During and
following the reinnervation period, the rate of NT sprouts increased until close to all
NMJs exhibited sprouts. These then persisted for a while, in their time-course
presumably mirroring the pSC processes. The occurrence and resolution of pSC
processes and NT sprouts observed in the present study were similar to those
described in the soleus muscle following crush injury to the sciatic nerve (Reynolds
& Woolf, 1992), whilst the rate of the changes observed corresponded well to crush
injuries to the SM-innervation carried out in other groups, albeit in closer location to
the muscle (Marques et al., 2006).
The GAP-43 stain confirmed the presence of activated pSCs (Woolf et al., 1992).
Unfortunately, it proved very problematic to stain the axonal sprouts. This most
probably is due to technical difficulties as most protocols apply this stain in sections
and not wholemount tissue.
Nevertheless, the results acquired in this chapter indicate that following traumatic
denervation of their NMJs, the pSCs and NTs of the SM and SH are capable of
exhibiting the characteristic changes observed in other muscles following
denervation or paralysis of those.
.

111
3.5 Antibody internalisation at the motor NT and pr otection from
complement-mediated injury
3.5.1 Introduction
Previous studies investigating the application of anti-GD1a Abs in WT and GD3KO
mice, have revealed the WT mice as relatively resistant to NT-injury following Ab-
and complement-application. Additionally, the WT mice exhibited significantly lower
levels of IgG and complement deposition when compared to the GD3KO mice
(Goodfellow et al., 2005). This was attributed to the lower expression of the target
ganglioside GD1a in WT compared to the GD3KO mouse (Goodfellow et al., 2005),
as in the latter the a-series gangliosides are relatively overexpressed (Kawai et al.,
2001; Okada et al., 2002). Investigations described in a previous chapter (3.3)
revealed that anti-GD1a Abs are rapidly internalised in the WT mice, whereas in
GD3KO mice these Abs can still demonstrated on the terminal axolemma following
identical incubation times.
Thus, the following study was aimed at determining the rate of Ab-uptake at the NT
in WT mice and how this potentially can protect the NT from complement-mediated
injury. The amount of Ab and complement overlying the NMJ were determined semi-
quantitively, in exactly the same way as described and discussed in the previous
chapter (see 3.4.1) and published on previous occasions (Bullens et al., 2002;
Goodfellow et al., 2005; Greenshields et al., 2009, Halstead et al., 2004, 2005a,
2008b).
3.5.2 Specific Materials and Methods
3.5.2.1 Antibody-binding and -uptake
Twelve TS preparations (see 2.4) of heterozygous double-fluorescent WT mice were
incubated with 0.5 ml of TBG3 (100 µg/ml, supplemented by FITC-labelled-BTx)
with the following four protocols (each n=3):

3. Results Antibody internalisation at the NT 112
• 30 minutes on ice (termed 0 min),
• 30 minutes at 37°C (termed 30 min)
• 30 minutes at 37°C followed by 60 minutes with Rin ger’s solution (2.10.1)
(termed 90 min)
• 30 minutes with Ringer’s solution on ice (control)
Following these incubations the muscles were rinsed, fixed and further processed
for Ab-detection as described in 2.5.1. Semi-quantification of Ab-deposit was
conducted and measurements illustrated as described in 2.5.3. Groups were
compared with the Mann-Whitney test (2 groups) and the Kruskal-Wallis test (>2
groups) for non-parametrical data.
After the first set of quantitative imaging, the muscles were rinsed in PBS,
permeabilised for the level of the NMJ as described in 2.6.1 and reprocessed for Ab-
detection in the same way as the primary event. The second set of imaging was
conducted with the same settings for FITC and TRITC as the first set and
processing of the measurements was also identical to that of the primary event.
3.5.2.2 Ex vivo assessment of complement deposition and NT injury
Twelve TS preparations (see 2.4) of heterozygous single - (only CFP) or double-
fluorescent WT mice were incubated at 37°C with 0.5 ml of TBG3 (200 µg/ml,
supplemented by FITC-labelled-BTx) and 0.5 ml of 40% NHS with the following four
incubation protocols (each n=3):
• TBG3 and NHS together for 30 minutes (termed 0 min)
• TBG3 for 30 minutes followed by NHS for 30 min (termed 30 min)
• TBG3 for 30 minutes, followed by Ringer’s solution for 60 min and NHS for
30 min (termed 90 min)
• NHS for 30 minutes (control)

3. Results Antibody internalisation at the NT 113
The TS were rinsed five times with Ringer’s solution between the individual
solutions.
Following the incubations, all TS were rinsed and incubated with α-C5-9 (1:40 and
FITC-BTx (2 µg/ml) in Ringer’s solution) for 1 hour at room temperature and 3 hours
at 4°C, then fixed with 4% PFA for 20 minutes, rins ed with PBS and 0.1M Glycine in
PBS, incubated further with α-C5b-9 (1:40 in PBS) overnight at 4°C and with
secondary AB (TRITC-α-m-IgG2a 1:200) for 7 hours at 4°C, and processed a s
above.
Following the quantitative analyses of complement deposition (see 2.5.3), 100 NMJs
per TS were assessed for CFP overlying the BTx-signal. To be able to conduct
these investigations in a blinded fashion, the labels of the slides were obscured and
samples coded by an independent colleague. CFP was scored as absent, changed
or normal (Fig.30) and percentages of NMJs calculated for absent, changed or
normal CFP. Groups were compared with the Kruskal-Wallis test for non-
parametrical data (measurements) and chi-square tests (percentages calculated
from counts).
3.5.2.3 In vivo assessment of NT injury
In twelve heterozygous double-fluorescent WT mice, the SM were exposed in vivo
as described in 2.2.1 and incubated with 0.6 ml TBG3 (200 µg/ml) and 0.6 ml of
40% NHS with the following four incubation protocols (each n=3):
• TBG3 and NHS together for 30 minutes (termed 0 min)
• TBG3 for 30 min followed by NHS for 30 minutes (termed 30 min)
• TBG3 for 30 min, followed by sterile Ringer’s solution for 60 minutes and
NHS for 30 minutes (termed 90 min).
• either Ringer’s solution instead of TBG3 or heat-inactivated NHS (control).
3. Results Antibody internalisation at the NT 114
Fig.30: Assessment of NTs (CFP). A CFP absent, B CFP changed, C CFP normal. Note the blebbing of the NT (CFP) in B. BTx depicts the nAChRs (orange in the composite images), CFP the axons (blue in the composite images) and GFP the SCs (green in the composite images). Scale bars: 20 µm. The surgical site was rinsed five times with sterile Ringer’s solution between the
individual solutions. Following the incubations, the mice were immediately sacrificed
and the SM processed for wholemount imaging and imaged as described in 2.3.1
and 2.3.5.
For the quantitative analysis of the injury, the superficial NMJs of the extracted SM
were assessed for CFP overlying the BTx signal. CFP was scored as absent,
changed or normal (Fig.30).

3. Results Antibody internalisation at the NT 115
3.5.3 Results
3.5.3.1 Antibody-binding and -uptake (Fig.31)
A total of 2722 NMJs and 3043 NMJs were assessed in non-permeabilised and
permeabilised tissue, respectively.
In non-permeabilised tissue a significant loss of superficial IgG-deposit could be
observed between the NMJs incubated on ice (0 min) and at 37ºC for 30 minutes
(p<0.001; Mann-Whitney test, n=1645). Following an additional hour of incubation at
37ºC with Ringer’s solution, the values for IgG-deposition further decreased
(p<0.001; Mann-Whitney test, n=1381).
In contrast to this, following permeabilisation of the tissue, only very slight (yet
significant) differences between the IgG-content (both superficial and internalised)
were observed between tissue incubated on ice or at 37ºC (p<0.001; Mann-Whitney
text, n=1663), whereas following a further one hour incubation with Ringer’s solution
the IgG-content decreased dramatically (p<0.001; Mann-Whitney test; n=1557).
In controls, no superficial or internalised Ab was detected.

3. Results Antibody internalisation at the NT 116
Fig.31: Antibody-binding and -uptake. The level of Ab bound to the surface of the NT (non-permeabilised tissue) decreases with an increase in incubation time and there is a statistically significant difference between all time-points assessed (p<0.001; Kruskal-Wallis test, n=2722). Following permeabilisation of the tissue, Ab lying within the NT can also be visualised, thus the measurements depict the summary of superficial and internalised Ab. Here the level also decreases after a prolonged incubation period (90 min) and statistically significant different values are observed between all time-points and control tissue (p<0.001; Kruskal-Wallis test; n=3043). Each outlier point represents one measurement. The maximum value obtainable for a measurement is 255.
3.5.3.2 Complement deposition and ex vivo NT injury
Here a total of 3552 NMJs were assessed for complement deposition.
Concomitant incubation of tissue with anti-ganglioside Ab and complement resulted
in the highest values for MAC-deposition. The later complement was applied, the
less MAC-deposits were observed at the NMJ, with an incubation gap (in which
Ringer’s solution was applied for 1h) resulting in the same MAC-deposits as control
tissue (Fig.32).

3. Results Antibody internalisation at the NT 117
Fig.32: Complement deposition and ex vivo NT injury. A The more time elapses between Ab-incubation and application of complement, the less MAC-deposition is observed at the NMJ (p<0.001; Kruskal-Wallis test, n=3552) Each point represents one measurement. The maximum value obtainable for a measurement was 255. B Example images for MAC deposition (red in the composite images) at the different time-points. Note the CFP-loss at 0 min and 30 min, which represents NT injury, and coincides with MAC-deposition. BTx depicts the nAChRs and GFP the SCs (both green in the composite images), CFP depicts the axons (blue in the composite images). Scale bars: 20 µm.

3. Results Antibody internalisation at the NT 118
The results of the MAC-deposition were mirrored in assessments for NT injury. The
simultaneous application of Ab and complement resulted in the highest score for
unhealthy (CFP absent or changed) NMJs. This score continuously decreased the
later complement was applied and statistically, no difference was observed between
tissue with the incubation gap (90min) and the control tissue (p=0.737; chi-square
test, n=12; Fig.33A). This corresponds directly with the results of the complement
depositions.
Interestingly, the main category contributing to the most detrimental effect of
applying Ab and complement simultaneously was the amount of NTs where the CFP
could not be visualised anymore (absent), indicating the severity of the injury in
these muscles.
3.5.3.3 In vivo NT injury (Fig.34)
Nerve terminal injury following the in vivo application of Ab and complement
mirrored that of ex vivo incubations. Here also the concomitant application of Ab and
complement resulted in the highest counts for non-healthy NTs (CFP absent or
changed). The later complement was applied the less NTs were injured and in
controls all NTs remained healthy.

3. Results Antibody internalisation at the NT 119
Fig.33: Ex vivo NT injury. A Assessment of NT injury through examination of the CFP-signal. B examples for NT injury at the different time-points. Note the increase in amount of healthy NTs (CFP; arrows in 30 min) with an increase in the time between Ab-incubation and application of complement. BTx depicts the nAChRs (green in the composite images) and CFP the axons (blue in the composite images). Scale bars: 100 µm.

3. Results Antibody internalisation at the NT 120
Fig.34: In vivo NT injury. A Assessment of NT injury through examination of the CFP-signal. B examples for NT injury at the different time-points. Arrows in 30 min and 90 min depict healthy NTs (CFP). BTx depicts the nAChRs (orange in the composite images), CFP the axons (blue in the composite images) and GFP the SCs (green in the composite images). Scale bars: 100 µm.
3. Results Antibody internalisation at the NT 121
3.5.4 Discussion
Anti-ganglioside Ab is taken up rapidly at the motor NT, which results in a protection
of the NT from complement-mediated injury. These findings explain why in previous
investigations, the NTs of WT mice appeared to be relatively resistant to anti-
ganglioside Ab- and complement-mediated injury (Goodfellow et al., 2005). At the
same time, the findings, however, also indicate that an increase of Ab-concentration
and a decrease in the protraction time until application of complement result in this
phenomenon being overcome, presumably by saturation of the internalisation
pathways. A saturation of the internalisation pathway presumably also accounts for
the increased vulnerability and higher MAC deposits observed in GD3KO mice
(Goodfellow et al., 2005).
Following a prolonged incubation of TS, the total amount of Ab (both internalised
and superficial) found at the NT decreases which indicates either a local
degradation or a transport of the Ab to a more proximal location.
There are other macromolecules such as cholera, tetanus and botulinum toxin,
which also bind to the gangliosides located on the NT (Helting et al., 1977; van
Heyningen, 1974). Cholera toxin very selectively binds GM1 (Singh et al., 2000; van
Heyningen, 1974), whilst both tetanus and botulinum toxin bind GD1b, GT1b and
GQ1b (Schwab & Thoenen, 1978; Singh et al., 2000). Following their binding, both
cholera and tetanus toxin are taken up into the NT and undergo retrograde transport
in membrane-bound compartments to the cell body at a velocity of 7.5 mm/h
(Schwab & Thoenen, 1978). In the case of cholera toxin, this phenomenon is widely
exploited in research be coupling this toxin with fluorescent proteins and using it as
a retrograde tracer. Botulinum toxin on the other hand is not transported, but locally
undergoes conformational changes to be able to exert its pathological actions
directly at the NT (Foran et al., 2003). Dopamine-β-hydrolase Abs, which
presumably bind to dopamine-β-hydrolases at adrenergic NTs, also are taken up
and undergo retrograde transport; this selectively takes place in axons of the
sympathetic nervous system (Fillenz et al., 1976). Thus, both the possibilities for
local degradation or retrograde transport have been demonstrated for
macromolecules binding gangliosides and being taken up in the NT. The fate for the
anti-ganglioside Abs remains to be elucidated.

3. Results Antibody internalisation at the NT 122
3.5.5 Conclusion
The rapid uptake of anti-ganglioside Abs into the motor NT can protect this structure
from complement-mediated injury. In order to overcome this phenomenon in the
experimental setting, an increased Ab-concentration - preferentially combined with a
decreased protraction period for the incubation with complement - needs to be
applied. Unfortunately, no comment can be made in regards to how the Ab-
concentrations applied in current investigations relate to the clinical situation, as
unlike for example Myasthenia gravis (Rǿdgaard et al., 1987) the serum Ab-
concentrations in relation to disease occurance and disease severity remain
unknown.

123
3.6 Auxiliary investigations associated with the lo ss of CFP at the NT
3.6.1 Introduction
Mice expressing fluorescent proteins in the axons of their peripheral and central
nervous system due to the Thy1.2 gene regulatory elements have been used to
investigate a number of developmental, degenerative and regenerative questions
(Lichtman & Sanes, 2003; Magill et al., 2008; Misgeld, 2005), such as axonal branch
removal at developing synapses (Bishop et al., 2004) and axonal de- and
regeneration in the central nervous system (Dratviman-Storobinsky et al., 2008;
Kerschensteiner et al., 2005) and PNS (Beirowski et al., 2005; Hayashi et al., 2007,
2008; Koob et al., 2007; Magill et al., 2007 ;Nguyen et al., 2002; Pan et al. 2003)
following traumatic nerve injury. The advantages of these mice - especially when
compared to carrying out intravital staining of axons - are multiple and include the
fact that the fluorescent proteins diffuse or are transported along the entire axon.
Therefore the entire NT is labelled, including tiny axonal sprouts. Also, there is no
obvious difference in the staining intensity between distal and proximal portions of
peripheral nerves, the fluorescence remains stable even following numerous
imaging sessions, in many mouse lines the motor axons start exhibiting
fluorescence by embryonic day 13 and the fluorescent proteins do not induce any
(toxic) changes to the motor axons (Feng et al., 2000).
Considering all these investigations are purely based on the incidence or absence of
intracytosolic fluorescent proteins in the axons, it is crucial to determine to which
(commonly investigated) histological changes the loss of fluorescent proteins
correspond. Three studies have investigated the relationship between the loss of
intraaxonal cytosolic proteins and electronmicroscopy (EM) of corresponding nerve
sections following traumatic injury of the peripheral and central nerves (Beirowski et
al., 2004, 2010; Wang, Hamm, & Povlishock, 2011). Both in and ex vivo lesioning of
fluorescent optic, spinal cord and cerebral axons leads to swelling and beading of
these in a proximo-distal fashion. The velocity of the occurrence of these
morphological changes roughly corresponds to the velocity of slow axonal transport
(Beirowski et al., 2010). Fragmentation of the fluorescent signal correlates with
breakdown of the axon (spheroid formation) (Beirowski et al., 2004), which is one of
the first changes observed in Wallerian degeneration (Stoll et al., 2002; Stoll &
Muller, 1999). Up to 48 hours after induction of the injury these spheroids contain

3. Results Auxiliary investigations 124
accumulations of multivesicular bodies, intact or dilated mitochondria and
disorganised cytoskeletal elements, whereas at later time-points the spheroids
appear to be empty or are only filled with floccular material. At early time-points (10-
24 hours after induction of the injury), the spheroids stain for anti-neurofilament,
anti-neuronal βIII-tubulin and anti-tau Abs and also for makers of impaired axonal
transport, such as β-amyloid precursor protein and synatophysin (Beirowski et al.,
2010). Quantitative analyses of preservation rates for peripheral axons following
traumatic injury were conducted both with fluorescence and conventional light
microscopy/EM. No significant difference was observed between the method of
evaluation at any time-point scrutinised (Beirowski et al., 2004). Percussion injury of
the optic nerve also results in the area of focal loss of fluorescent proteins in the
area where the force is applied. Here, EM investigations revealed highly vacuolated
and organelle-devoid axonal cylinders, whereas the proximal and distal swellings
contain disorganised axonal skeletal proteins. The distal swellings are further
characterised by dilated mitochondria and also contain autophagic vacuoles at later
time-points (Wang et al., 2011).
In the following, similar investigations to those described above were carried out in
the murine model of GBS to investigate the significance, nature and presumed
mode for loss of the intraaxonal fluorescent protein following induction of an anti-
ganglioside Ab and complement-mediated injury to the motor NT.
3.6.2 Specific Materials and Methods
3.6.2.1 Ex vivo preparations
Triangularis sterni preparations (see 2.4) of WT double-fluorescent and single-
fluorescent (only CFP) mice were incubated at 37ºC with TBG3 followed by NHS as
described in 2.7. On one occasion, tissue was further incubated with Ringer’s
solution for 4 hours at 37 ºC after the NHS incubation. In control tissue, TBG3 was
replaced by Ringer’s solution.

3. Results Auxiliary investigations 125
Following the incubations, the tissue was processed for Ab-deposition (see 2.5.1) or
for permeabilisation of the NMJ and proximal efferents as described in 2.6.2.
Primary Abs for neurofilament (NF) light (70kDa) and heavy (200 kDa) were applied
at concentration of 1:200 in blocking serum III (see 2.10.6) for 20 hours at 4ºC (see
2.7). Following a rinse in PBS, secondary fluorescence-conjugated goat-anti rabbit-
IgG was applied, also at a concentration of 1:200 in blocking serum III (see 2.10.6)
for 20 hours at 4ºC. Then tissue was processed for imaging as described in 2.5.1.
For each type of NF, 100 NMJs per TS and condition were assessed for the
incidence of the physiological appearance of NF and CFP overlying the BTx-signal.
To assess the contribution of calpain to NT injury and loss of CFP, AK 295 (200 mM,
provided by Dr. J. Glass (Atlanta, GA, USA), which strongly inhibits both calpain I
and II and to a lesser degree also cathepsin B (Li et al., 1996; Wang et al., 2004)
was added to NHS and the tissue was processed for NF heavy as described above.
3.6.2.2 In vivo preparations
The SH and SM of double-fluorescent mice were subjected to in vivo application
(see 2.2.1) of TBG3 followed by NHS as described in 2.7. Then α-IgG3 (1:200) and
α-C5b-9 (1:40) were applied in vivo for 1 hour, before SM and SH were processed
as described in 2.3.1 and 2.3.2. Anti-IgG3 and α-C5b-9 were then reapplied at the
same concentrations overnight at 4ºC. Following a PBS rinse, the secondary Ab for
MAC-deposition (TRITC-α-m-IgG2a; 1:200) was applied in blocking serum I (see
2.10.6) for 7 hours at 4°C (see 2.7).
To assess the complete loss of NF light and heavy immuno-reactivity at 24 hours
after induction of the injury, mice were recovered following the in vivo application of
TBG3 and NHS and sacrificed one day later. Then SM and SH were processed for
permeabilisation of the NMJs and proximal efferents as described in 2.6.2, and α-
NF-Abs (1:100) were applied in blocking serum III for 20 hours at 4ºC, followed by
incubation with secondary Ab (fluorescence-conjugated goat anti-rabbit IgG; 1:200)
also in blocking serum III for 20 hours at 4ºC.

3. Results Auxiliary investigations 126
3.6.2.3 Electronmicroscopic investigations
To acquire tissue for EM, mice subjected to in vivo application of TGB3 or Ringer’s
solution followed by NHS (see 2.2.1 and 2.7). The mice were recovered after
checking the SH/SM in vivo for completeness of the injury and then sacrificed within
the next hour or after 24 hours. Sternomastoid muscles/SH were processed for EM
and imaged by Mrs Jennifer Barrie as described in 2.3.6.
3.6.3 Results
3.6.3.1 Ex vivo preparations
In all control preparations, smooth and regular CFP was observed overlying the
BTx-signal (Fig.35A). Acutely, following the induction of an anti-ganglioside Ab and
complement-mediated injury, a change to the physiological appearance of CFP
overlying the BTx-signal could be observed (also see chapter 3.3). The CFP either
was confined to blebs overlying the NMJ (Fig.35B) or no CFP could be observed
anymore (Fig.35C).
3.6.3.1.1 Antibody-deposition
Following induction of anti-ganglioside Ab and complement-mediated injury to the
NT, it was still possible to illustrate the Ab-binding pattern at the NMJ. The pattern of
Ab-binding was very punctate (Fig.35D) and exhibited a similiar pattern to Ab
applied to NMJs without the ensuing application of complement (Fig. 35E).

3. Results Auxiliary investigations 127
Fig.35: Ex vivo TBG3 and complement application. A control NMJs with no changes to the fluorescent proteins, B blebbing NTs (circles in CFP), C no CFP overlying the BTx-signal, D superficial Ab-deposit (α-IgG3) at NMJs, which exhibit injured NTs (loss of CFP), E Ab-binding at the NMJ without the application of complement. A, B, C: BTx depicts the nAChRs (orange in the composite images), CFP the axons (blue in the composite images) and GFP the SCs (green in the composite images). D, E: BTx depicts the nAChRs (green in the composite images), CFP the axons (blue in the composite images) and α-IgG3 the Ab-deposit (pink/orange in the composite images). Scale bars: 20 µm.

3. Results Auxiliary investigations 128
3.6.3.1.2 Neurofilament immunoreactivity at the NMJ
In all control preparations, the NF immunostaining, both for NF heavy and light,
exhibited a very crisp and distinct signal extending along the motor axons and
spreading into the NMJ (Fig.36A, C, E; Fig.37A).
Fig.36: Neurofilament immunoreactivity (orange in t he composite images) at the NMJ. A, C, E control tissue; B, D, F tissue exposed to TBG3 and complement. A, B NF heavy acutely; C, D NF light acutely; E, F NF light after prolonged incubation times. Note the very distinct and clear signal both for NF heavy (A) and NF light (C, E) in control situations. Acutely following the application of TBG3 and compliment, a loss of CFP-signal (B, D) and loss of the immunoreactivity for NF heavy (B) is observed. The NF light-staining exhibits a spongy appearance (D; compare to the crisp signal in C). Following a prolonged incubation time, the immunoreactivity for NF light also is lost (F). BTx depicts the nAChRs and GFP the SCs (both green in the composite images) and CFP depicts the axons (blue in the composite images) and GFP the SCs. Scale bars: 20 µm.

3. Results Auxiliary investigations 129
In preparations subjected to anti-ganglioside Ab and complement, the changes to
the physiological appearance of CFP at the NMJ were accompanied by changes to
the NF-immunoreactivity. Neurofilament heavy could not be stained for anymore
(Fig.36B), whereas the NF light stain exhibited a swollen and spongy appearance
(Fig.36D). However, following an additional incubation for four hours with Ringer’s
solution at 37ºC the immunostaining for NF light also disappeared (Fig.36F).
These qualitative observations were confirmed in counts assessing the occurrence
or absence of a physiological CFP- and NF-signal overlying the BTx-signal (Table
15).
Neurofilament Condition NMJs
CFP abnormal or
gone normal swollen gone total
abnormal
Ab+NHS 100 97 2 9 89 98 NF heavy acute Ringer’s+NHS 100 1 94 1 5 6
Ab+NHS 100 97 5 90 5 95 NF light acute Ringer’s+NHS 100 1 100 0 0 0
Ab+NHS 100 98 2 6 92 98 NF light 4h
Ringer’s+NHS 100 2 97 2 1 3
Table 15: Occurrence and absence of NF heavy and li ght at the NMJ following the application of TBG3 and complement
3.6.3.1.3 Application of calpain-inhibitors
Applying the calpain-inhibitor AK295 together with the source of complement (NHS),
resulted in NF heavy immunoreactivity remaining, whilst CFP at the NMJ still was
lost (Fig.37B). However, in comparison to the very sharply demarcated loss of CFP
observed predominantly at the NMJ in muscles where anti-ganglioside Ab and
complement were applied, the additional application of AK295 resulted in a more
generalised loss of CFP, with the individual axon branches exhibiting a decrease of
fluorescence intensity and occasionally even the fluorescence of axons in small
nerve bundles appearing faint (Fig.37C).

3. Results Auxiliary investigations 130
Fig.37: Application of the calpain-inhibitor AK295 together with complement following the TBG3-incubation. A CFP and NF heavy at healthy NMJs, B localised and sharply demarked loss of CFP and NF heavy following the application of TBG3 and complement. C generalised decrease of CFP-fluorescence intensity (asterisk) and preservation of NF heavy (arrowheads) following the inhibition of calpain after the application of TBG3, AK295 and complement. BTx depicts the nAChRs and GFP the SCs (both green in the composite images), CFP depicts the axons (blue in the composite images). The NF immunoreactivity is orange in the composite images. Scale bars: 100 µm.

3. Results Auxiliary investigations 131
3.6.3.2 In vivo preparations
At NMJs where CFP was lost or blebbing, MAC deposition was observed (Fig.38B);
Ab-deposition could not be demonstrated.
Fig.38: MAC-deposition (orange in the composite ima ges) at NMJs following the in vivo application of TBG3 and complement. A no MAC-deposition at a healthy NT (smooth CFP), B MAC-deposition at an injured NT (only CFP-blobs). BTx depicts the nAChRs (pink in the composite images) and CFP depicts the axons (blue in the composite images). Scale bars: 20 µm.
Twenty-four hours following the induction of anti-ganglioside Ab and complement-
mediated injury, neither NF light (Fig.39A) nor heavy (Fig.39C) could be stained for
at NMJs which did not exhibit any CFP anymore.

3. Results Auxiliary investigations 132
Fig.39: Absence of NF (orange in composite images) at NTs exhibiting no CFP at 24h after the application of TBG3 and complement. A , B NF light, C, D NF heavy. B and D are on the contralateral side (underside) of the muscles which did not receive any Ab and complement and therefore serve as an internal control. BTx depicts the nAChRs (pink in the composite images), GFP the SCs (green in the composite images) and CFP the axons (blue in the composite images). Scale bars: 20 µm.

3. Results Auxiliary investigations 133
3.6.3.3 Electronmicroscopy of representative tissue
Ultrastructural investigations of tissue processed for EM directly after subjecting the
muscles to anti-ganglioside Ab and complement-mediated injury revealed electron
lucent NTs, some of which were wrapped/engulfed by the overlying pSCs or
segregated into smaller membrane-bound compartments. Most NTs were devoid of
vesicles and filaments; some of them did, however, exhibit swollen mitochondria. No
changes to the muscular components of the NMJs were observed.
At 24h after induction of the injury, the NTs were difficult do address. In many cases
they seem to have decreased in volume and compacted their contents.
Control NMJs exhibited well addressable spherical NTs containing numerous
filaments, synaptic vesicles and a few mitochondria. In some NTs a relative paucity
of synaptic vesicles was observed.
Fig. 40 see overleaf
Fig.41: Electronmicrosopic images of control NMJs. Note the well addressable spherical NTs filled with filaments, synaptic vesicles and mitochondria. Scale bar: 2 µm.

3. Results Auxiliary investigations 134
Fig. 40: Electronmicroscopic images of injured NTs. A acute injury. The left NT (asterisk) is engulfed (presumably) by a pSC, whereas the right NT (arrowhead) is fragmented into a number of membrane-bound compartments. Note the paucity of filaments, mitochondria and synaptic vesicles. B 24h after induction of the injury it is very difficult to address the original NT, which appears to be filled with debris (arrowhead). Scale bars: 2 µm.

3. Results Auxiliary investigations 135
3.6.4 Discussion
3.6.4.1 CFP loss – mode and extent
Immune-mediated injury to the NTs at the NMJ results in a change of the
morphology or loss of the intracytosolic NT-marker (CFP) overlying the NMJ. The
morphological changes comprise localised swelling and blebbing of CFP.
Investigations described in the previous chapter (3.5) indicate that the severity of the
injury might correlate to the morphological changes. Milder injuries result in local
swelling and blebbing, whereas more severe injuries seem to be associated with a
rapid and complete loss of CFP overlying the NMJ. In general, incidence and
absence of CFP is sharply demarcated which indicates that the residual fluorescent
marker must be contained within some kind of membranous structure (similar to the
axolemma which provides a diffusion barrier under physiological circumstances).
Antibody-mediated injury leads to the formation of a MAC-complex on the
axolemmal surface (Halstead et al., 2004) (see 1.1.5), which also could be
demonstrated following the in vivo application of Ab and complement. In contrast to
this, Ab-deposits could not be shown following the in vivo induction of the injury.
However, considering the challenges in demonstrating the Ab-deposit in WT-mice
described in a previous chapter (3.2) and the notorious difficulty in staining and
obtaining sufficient resolution when imaging relatively thick and previously in vivo
imaged wholemount tissue, this result is not entirely surprising and does not reliably
indicate that the injured NTs were not bound by Ab.
The formation of MAC-complexes on the axolemmal surface results in an
uncontrolled influx of ions, small molecules and water into the NT along the diffusion
gradient and specifically a massive increase of intraaxonal Ca2+ (Morgan et al.,
1986). This, in turn and amongst other consequences, leads to Ca2+-dependant
proteases, such as calpain, being activated. One of the major substrates for calpain
is neurofilament (Chan & Mattson, 1999), one of the axonal cytoskeletal proteins
(Schlaepfer, 1987). This explains the loss of the NF heavy overlying the NMJ
observed in the current and also previous investigations (Goodfellow et al., 2005;
O'Hanlon et al., 2003). The relative preservation of NF light acutely, however with a
very different morphology when compared to the physiological situation, presumably
reflects the localisation of NF light within the axon; NF light acts as the backbone of

3. Results Auxiliary investigations 136
the axonal core (Fuchs & Cleveland, 1998), and thus may be less readily accessible
for calpain-mediated cleavage. Further incubation of the ex vivo preparations for
four hours in Ringer’s solution and investigations conducted at 24 hours after
induction of the injury readily show that at these later time-points NF light also
cannot be stained for anymore. This further supports the hypothesis that due to its
location in the axon, NF light requires more time to be degraded when compared to
NF heavy. Similar results were observed following induction of a (traumatic) stretch
injury to the optic nerve. Here the levels for NF heavy decreased acutely (within 30
minutes) following induction of the traumatic axonal injury, whilst the levels for NF
light exhibited a progressive decrease over the first 24 hours (Serbest et al., 2007).
Generally, both following diffuse axonal injury and nerve transection, a loss of NF is
observed (Donat & Wisniewski, 1973) in areas of axonal swelling (Martinez &
Friede, 1970; Maxwell & Graham, 1997). The localised loss of NF overlying the NMJ
observed in the present study corresponds well with observations made at NMJs
following the in vivo application of α-latrotoxin in mice (Duchen et al., 1981; Robbins
et al., 1990) and of β-BTx in rats (Dixon & Harris, 1999).
Application of the calpain-inhibitor AK295 both in previous (McGonigal et al., 2010;
O'Hanlon et al., 2003) and current investigations resulted in the preservation of NF
heavy whilst a loss of CFP at the NMJ is still observed. This finding both confirms
that injury to the architectural structures of the NT in the current model occurs in a
calpain-dependent fashion, whilst at the same time also indicating that CFP is not a
calpain-substrate.
Therefore, the acute CFP-loss of the NT in the present study must be due to a)
either the CFP diffusing from the NT-cytosol into the periphery via MAC pores
located on the NT or b) the CFP being degraded locally by a different protease.
Depending on the severity of the injury, blobs of CFP overlying the NMJ – at early
time-points often associated with pSC cell bodies - can still be observed. At NMJs
where CFP-blobs are evident, it was still possible to illustrate Ab-deposit. This
indicates that the axolemmal membrane must acutely persist following induction of
the injury, even if it may be broken up into small sections filled with CFP or even be
riddled with MAC-pores.

3. Results Auxiliary investigations 137
3.6.4.2 Events in the proximal efferents following the acute NT-injury
Proximal to the injured NT small bead-like axonal compartments filled with CFP are
observed, which probably correspond to the blebbing observed acutely after the
transection of nerve; this is thought to signify temporary events of membrane
resealing (David et al., 1997; Xie & Barrett, 1991). Fragmentation of the
intracytosolic fluorescent signal in axons following sciatic nerve transection has
been shown to correlate well with ovoid bodies (and signifies the axoplasmic content
of those (Pan et al., 2003)) formed in the course of Wallerian degeneration
(Beirowski et al., 2004). It is preceded by cytoplasmic constrictions in Wlds mice
(Beirowski et al., 2005). Both the removal of Ca2+ and the application of calpain-
inhibitors from optic nerve explants result in a massive reduction of the formation of
axonal spheroids, indicating a role for Ca2+-induced calpains in this process
(Beirowski et al., 2010) and supporting that fact that Wallerian degeneration is
largely dependent on the influx of extracellular Ca2+ and the activation of calpains
(George et al., 1995).
A morphologically similar process to the proceedings observed at the NT following
anti-ganglioside Ab and complement-mediated injury also seems to occur in acute
axonal degeneration, which has been observed peracutely following nerve
transection in the spinal cord. Acute axonal degeneration develops very rapidly
(within 10 to 20 minutes after induction of the lesion), is restricted to a small part of
the axon (200-300 µm), takes place both proximal and distal to the lesion and only
lasts for about 5 min (Kerschensteiner et al., 2005). In regards to its morphology and
dynamics (Ca2+- and calpain-dependant) it is very similar to Wallerian degeneration
(Kerschensteiner et al., 2005; Misgeld, 2005). Combining these observations with
the fact that the NT/axonal degeneration in the current setting also is Ca2+- and
calpain-dependant (Halstead et al., 2004; O'Hanlon et al., 2003), indicate that anti-
ganglioside Ab-mediated injury to the NTs possibly shares similar mechanisms with
those taking place directly at the lesioned site early in Wallerian degeneration,
however more rapid in their execution and self-limitating, and therefore very similar
to the acute axonal degeneration described above. This is in line with the hypothesis
that many types of nerve injuries including metabolic, inflammatory, mechanical,
heritable, toxic and ischemic insults share a similar sequence of degenerative
morphological changes, which are the result from the common mechanistic features

3. Results Auxiliary investigations 138
(Coleman, 2005) and originate in the disruption of the physiological axoplasmic Na+,
K+ and Ca2+ concentration (LoPachin & Lehning, 1997; Stoll et al., 2002).
Interestingly and further supporting the resealing hypothesis, following the
application of AK295, a decreased intensity of CFP-fluorescence proximal to the
NMJ and even in small nerve bundles was observed. Calpain has been reported to
play a role in axolemmal resealing following the transection of spinal nerve roots
(Howard et al., 1999) or neuronal processes (Xie & Barrett, 1991), a process which
clearly appears to take place in the current investigations when viewing the sharply
demarcated loss of CFP under those experimental situations where no calpain-
inhibition was carried out. Following the application of AK295 the resealing
potentially is hindered, which then leads to a greater leakage (or a more wide-
spread digestion) of the cytosolic CFP and results in a more generalised loss of
fluorescence. An exacerbated loss of ion homeostasis would then also explain why
the application of AK295 – despite preventing the destruction of the architectural
structure and the nodal proteins in single fibres and small bundles following the
application of anti-ganglioside Ab and complement – did not preserve the perineural
electrophysiological properties in previous investigations (McGonigal et al., 2010).
Regardless of the reason behind the CFP-loss, one important corollary to take from
these observations is that the absence of disappearance of cytosolic CFP cannot
simply be equated to an absence or destruction of the axon, but in these mice rather
needs to be interpreted in the pathophysiological context in which it is occurring, i.e.
in our case as a breach of the axolemmal integrity with all its associated (intra-
axonal) consequences. The additional use of transgenic mice exhibiting membrane-
associated fluorescent proteins (De Paola et al., 2003) might be able to contribute to
elucidate questions specifically associated with the fate of the axonal membrane
following the breaching of its integrity.
3.6.4.3 Ultrastructural changes to the NT following anti-ganglioside Ab and
complement-mediated injury
Electronmicroscopic investigations of NTs directly after subjecting them to anti-
ganglioside Ab and complement-mediated injury revealed electronlucent NTs devoid

3. Results Auxiliary investigations 139
of vesicles and filaments and containing abnormal mitochondria or no mitochondria
at all. These NTs sometimes were segregated into smaller compartments or
“wrapped” by the overlying pSCs. These observations correspond well to previous
investigations conducted in the same model (Goodfellow et al., 2005; Halstead et
al., 2005b; O'Hanlon et al., 2001). An additional 24 hours later, the NTs seemed to
be more difficult to address due to an overall decrease in volume and a compaction
of any remaining contents.
Ultrastructural investigations of motor NTs following proximal axotomy of the efferent
nerve (Gillingwater & Ribchester, 2001; Manolov, 1974: Miledi & Slater, 1970;
Winlow & Usherwood, 1975) or the in vivo application of presynaptic neurotoxins,
such as β-BTx (Dixon & Harris, 1999), crotoxin (Gopalakrishnakone & Hawgood,
1984), α-latrotoxin (Duchen et al., 1981), taipoxin and notexin (Cull-Candy et al.,
1976) result in the same changes to the NT as observed following an anti-
ganglioside Ab and complement-mediated injury to the NT. Following proximal nerve
section the endplates remain unchanged for eight to twelve hours. After this lag
phase, the NT breaks up into smaller fragments, which contain abnormal
mitochondria, honeycomb structures, bags of glycogen particles and exhibit a
decrease of synaptic vesicles. The pSC processes protrude into the synaptic cleft
and engulf NT-fragments (Manolov, 1974; Winlow & Usherwood, 1975). Finally, the
pSC takes the place of the NT at the NMJ (Gillingwater & Ribchester, 2001;
Manolov, 1974; Miledi & Slater, 1970), which can also be observed following the
applicaton of β-BTx (Abe et al., 1976).
The only caveat in the current observations is the relative paucity of synaptic
vesicles observed in some control NMJs (Manolov, 1974; Miledi & Slater, 1970).
However, considering the control muscles were harvested from mice exposed to an
in vivo topical application of complement under general anaesthesia it could be
surmised that manipulations to the muscles might have lead to an increased
expenditure of synaptic vesicles. Poor fixation or fixation artefacts should be
associated with more wide-spread changes to the neuromuscular structures.

3. Results Auxiliary investigations 140
3.6.5 Conclusion
Following anti-ganglioside Ab and complement-mediated injury to the NTs acutely a
sharply demarcated blebbing and/or loss of CFP overlying the NMJ can be
observed. These changes correspond to a loss of the axonal skeletal proteins, NF
light and heavy. The application of calpain-inhibitors results in a preservation of
skeletal proteins, whilst the loss of CFP seems to be even more pronounced
indicating that the events are calpain-dependant and also heavily rely on resealing
processes.
Similar morphological characteristics in fluorescence microscopic investigations and
pathophysiolocial dynamics are noted when comparing the immune-mediated injury
to the NT with acute events in the Wallerian degeneration of axons following
traumatic injury. Presumably (as discussed above) both events are the
consequence of the same mechanisms, and a based on the disruption of the
physiological axonal ion homeostasis. Additionally, ultrastructural investigations of
the NT following anti-ganglioside Ab and complement-mediated injury closely
resemble those of NTs undergoing degeneration following proximal axotomy of the
efferent nerve.
Combining all these observations it is surmised that following an anti-ganglioside Ab
and complement-mediated injury the NTs degenerate. This then in the following
implicates that these structures need to undergo regeneration to restore their
physiological state.

141
3.7 Rate of motor NT regeneration following a singl e anti-ganglioside
Ab and complement-mediated injury
3.7.1 Introduction
Anti-GM1 and anti-GD1a Abs are the circulating Abs predominantly found in patients
suffering from the motor axonal forms of GBS (acute motor axonal neuropathy,
AMAN) (Kaida et al., 2000; Press et al., 2001; Willison, 2005). As described in
1.1.3.1, AMAN patients clinically exhibit paralysis, which may require the patients to
be ventilated artificially (McKhann et al., 1993). Necropsies conducted these
patients reveal Wallerian-like degeneration of the motor nerve fibres. As the
degenerative changes are more pronounced in the ventral roots than the peripheral
nerves, it is surmised that the initial lesion is to be found in the spinal roots.
Occasionally, however, only very few pathological changes are observed in the
ventral roots and these are not compatible with the degree of paralysis observed
(Griffin et al., 1995; McKhann et al., 1993). At the same time, some necropsies
exhibit very extensive motor fibre degeneration, which is not commensurate with the
rapid recovery (Griffin et al., 1995; Ho et al., 1997b) occurring in some patients. The
convalescence of AMAN-patients has been described to occur in two subgroups:
one group which exhibits a rapid improvement within the first two to four weeks after
onset of disease, and the other group, in which recovery is prolonged and the
patients are unable to walk independently at six months after disease onset (Hiraga
et al., 2005; Kuwabara et al., 1998a). The explanations for a rapid recovery include
a) distal demyelination, b) a reversible conduction-block along motor axons and c)
degeneration restricted to the very distal motor nerve (Griffin et al., 1995; Ho et al.,
1997b; Kuwabara et al., 1998a). The investigation of muscle-nerve biopsies
obtained from a rapidly recovering AMAN-patient provides evidence for the third
hypothesis (Ho et al., 1997a). Since the neuromuscular junction (NMJ) lies outside
the BNB (Olsson, 1968), the motor NTs – also under clinical circumstances – are
readily available for Ab-binding (Ho et al., 1997a; Plomp & Willison, 2009).
Thus, the first set of investigations conducted in this chapter aims at determining the
rate of NT recovery following a single anti-ganglioside Ab and complement-mediated
injury. In a second step, a concomitant injury to the pSCs is elicited. Since these
cells have been described to play a supportive role in NT regeneration (see 1.3.3.3),

3. Results NT regeneration 142
it is surmised that a concomitant injury of these should result in decreasing the rate
of NT regeneration.
3.7.2 Specific Materials and Methods
3.7.2.1 Groups and study set-up
Forty-five homozygous and heterozygous double-fluorescent mice were assigned to
three groups (each n=15).
Group A : NT injury Group B : NT and pSC injury Group C : control Survival times
TBG3 + NHS TBG3 + EG1 + NHS Ringer’s + NHS
0d 3 3 3
1d 3 3 3
2d 3 3 3
3d 3 3 3
5d 3 3 3
Table 16: Experimental groups for the NT regenerati on study
Investigations described in chapter 3.3 revealed that the application of TBG3 and a
source of complement in WT mice leads to a selective injury of the NTs, whereas
the application of EG1 is primarily associated with an injury to the pSCs, however
also has a NT-injury component (see 3.3.4). Therefore, to obtain a reliable injury
both the NTs and pSCs, TBG3 and EG1 were applied in combination.
All mice were subjected to a primary in vivo imaging investigation during which the
injury was induced and documented, and a secondary ex vivo imaging investigation
(Fig.42). The ex vivo investigations were carried out immediately after the in vivo
investigations to acquire more information on the acute state and extent of injury, or
after 1, 2, 3 or 5 days to gain insights into the rate of regeneration and the
regenerative processes.

3. Results NT regeneration 143
Fig.42: Flowchart for the in and ex vivo NT-regeneration study.
3.7.2.2 In vivo procedures (see 2.2)
In all mice, the SM and SH muscles were exposed and incubated with rhodamine-
conjugated BTx as described in 2.2.1. The following microscope and camera
settings were applied: field diaphragm: 3, light emission during orientation in the
sample: 10%, light emission during image acquisition: 20%, exposure time during
image acquisition: 120 ms; gain: x2. Following a preliminary imaging session in
which the healthy state of three NMJs was documented, Abs and NHS were applied
topically. In groups A and B, all mice received 0.6 ml of TBG3 (200 µg/ml) followed
by 0.6 ml of 40% NHS (see 2.7). In group B, the NHS was supplemented by 120 µl
of EG1 (1 mg/ml). Control mice (group C) received 0.6 ml of Ringer’s solution
followed by NHS. After the incubations, the muscles were rinsed with Ringer’s
solution and the three originally imaged NMJs were reimaged to document the
injury. Then SH and SM were assessed for completeness of the injury, and the mice
either sacrificed (see 2.2.4) or recovered (see 2.2.3).
In some of the mice sacrificed immediately, the NHS was supplemented by
rhodamine-conjugated EthD-2 (see 2.7), a nuclear marker whose cellular ingress
and subsequent nuclear binding indicates a loss of cell membrane integrity.

3. Results NT regeneration 144
3.7.2.3 Ex vivo procedures
For ex vivo imaging, the muscles were processed and subjected both to
wholemount and quantitative imaging as described in 2.3. Here also the three
originally imaged NMJs were revisited and imaged.
3.7.2.4 Additional investigations associated with the return of CFP
In additional heterozygous double-flourescent mice, SM and SH were processed for
NF heavy immunoreactivity and EM investigations following five days of
regeneration as described in 3.6.2.3 and 2.3.6.
3.7.3 Results
3.7.3.1 In vivo investigations
In groups A and B, the application of TBG3 alone did not lead to any changes at the
NMJ (Figs.43A, B); however, once the source of complement (NHS) was applied, a
very rapid deterioration of the NTs could be seen (Fig.44A). These changes only
involved the area overlying the NMJ or extended proximally along the axon for a
short distance. A sharp line demarcated the presence and absence of CFP.
In group A, the pSCs were entirely unaffected; in all cases they retained their
fluorescence and in no cases was any uptake of EthD2 demonstrable (Fig.43A). In
group B, many pSCs lost their fluorescence and their cell body profiles (now devoid
of GFP) were replaced by EthD-2-stained nuclei (Fig.43B). In both groups, the
myelinated Schwann cells surrounding the distal axons neither lost their
fluorescence nor exhibited an uptake of EthD-2 (Figs.45A, C).
In the control mice (group C), no changes to any of the fluorescent proteins were
noted (Figs.44B, 45E).

3. Results NT regeneration 145
Fig.43: In vivo images of the acute anti-ganglioside Ab and comple ment-mediated injury. A, B evolution of the injury: application of complement (NHS) is required to induce an injury; there are no changes to the NMJs after sole application of the Ab (images for before and after TBG3 are the same). A group A: selective injury of the NTs (CFP; arrowhead); the pSCs (GFP) remain bright and there is no uptake of EthD-2 in these cells. B group B: injury of both the NTs (CFP) and the pSCs (GFP); the EthD-2 staining (arrows) correlates with the former pSC cell bodies. BTx depicts the nAChRs (orange in the composite images), GFP the SCs (green in the composite images) and CFP the axons (blue in the composite images). Scale bars: 20 µm.

3. Results NT regeneration 146
Fig.44: In vivo images of control tissue and evolution of the NT i njury. A rapid evolution of the injury; within 15 minutes of application of complement the NTs (CFP) start to bleb and loose their fluorescence (NMJ from group A). There are no changes to the pSCs (GFP). B group C: negative control; application of Ringer’s solution and NHS does not lead to any changes at the NMJ. BTx depicts the nAChRs (orange in the composite images), GFP the SCs (green in the composite images) and CFP the axons (blue in the composite images). Scale bars: 20 µm.

3. Results NT regeneration 147
Fig.45: Ex vivo images of the extent of injury acutely and after 2 4h. A, B group A (NT injury), C, D group B (NT and pSC injury), E, F group C (control). Acutely (A, C, E), the loss of CFP (NTs) only affects the NMJ. After 24h (B, D, F), however, this loss extends further proximally (groups A and B). In all groups, the myelinating Schwann cells (arrows) remain fluorescent and do not exhibit any uptake of EthD-2 (orange in composite images), indicating that they are not injured. BTx depicts the nAChRs (orange in the composite images), GFP the SCs (green in the composite images) and CFP the axons (blue in the composite images). Scale bars: 100 µm.

3. Results NT regeneration 148
3.7.3.2 Ex vivo investigations
3.7.3.2.1 Group A
Following the acute injury (day 0), approximately 6% (5.7%) of the superficial SH-
NMJs still exhibited CFP overlying their BTx-signal. After one day of regeneration,
this percentage remained unchanged (5.8%, p=0.932; chi-square test, n=12;
Fig.46); however, at many NTs the injury had extended more proximally, with the
CFP appearing fragmented or absent up to 150-200 µm into the distal axon. This
often coincided with the site at which the individual axons coalesce into small
bundles (Fig.45B). A recovery of the CFP-signal at the superficial SH-NMJs could
be demonstrated over the next few days with 93.5% of the NMJs exhibiting CFP
overlying their BTx–signal by day 5 (Fig.46); a precise alignment of the CFP and
BTx-signal could be shown, both of which exhibited the same morphology as the
pre-injury state (Fig.47). At earlier time-points (days 2 and 3), NTs only partially
covering the BTx-signal could be observed (Fig.48A). At these time-points the NTs
also often exhibited an irregular axonal diameter (Figs.47, 48B).
The pSCs were not compromised at any time-point and their cell-bodies always
assumed their originally imaged position (Fig.47). On days 3 and 5, a number of
pSCs extended processes beyond the NMJ-boundaries, which were often
accompanied by short axonal sprouts (Figs.48C, D). Furthermore, many NMJs
exhibited increased numbers of GFP-positive cells (Figs.48B, C, D) and very
occasionally the bridging of two neighbouring NMJs by pSC-processes and axons
was observed (Fig. 48E).

3. Results NT regeneration 149
Fig.46: Recovery of CFP overlying the NMJ. There is a significant difference between groups A (NT injury) and B (NT and pSC injury) on all days (p<0.001; chi-square test, n=12 for each time-point) except day 5 (p=0.739, chi-square test, n=12). In group C (control) there is no difference between all different time-points assessed (p=0.076, chi-square test, n=30). Error bars depict standard deviations.
Fig.47: Regeneration of individual NMJs in group A (NT injury). On day 1, there are no changes to the NMJs when compared to the acute state of injury (post-injury). On day 3, the NT (CFP) of this specific NMJ has recovered, but exhibits a slightly irregular diameter (arrow), whilst the NMJ examined after 5 days of regeneration exhibits a physiological morphology. Note that the pSCs (GFP) of all NMJs all remain in same location when compared to the pre-injury state. BTx depicts the nAChRs (orange in the composite images), GFP the SCs (green in the composite images) and CFP the axons (blue in the composite images). Scale bars: 20 µm.

3. Results NT regeneration 150
Fig.48: Features of regeneration in group A (NT inj ury). A the NT (CFP) only partially covers the NMJ on day 2. B irregular NT-diameter (CFP) and increased numbers of GFP-positive cells at the NMJ on day 3. C, D increased numbers of GFP-positive cells, pSC processes and small terminal sprouts (arrows) on day 3. E bridging of two neighbouring NMJs with pSC processes and axonal sprouts (arrowheads) on day 5. BTx depicts the nAChRs (orange in the composite images), GFP the SCs (green in the composite images) and CFP the axons (blue in the composite images). Scale bars: 20 µm.
3.7.3.2.2 Group B
Following the acute injury, 11.8% of the NMJs examined exhibited CFP overlying
their BTx-signal and 25.0% of the NMJs had overlying GFP-positive cells (Figs.46,
49). In most instances the previously GFP-positive cell profiles were replaced by
EthD2-stained nuclei. At day 1, the percentage of NMJs exhibiting CFP remained at
the same value as with the acute injury (11.8%, p=0.774; chi-square test, n=12; Figs

3. Results NT regeneration 151
45, 48), whilst for the GFP-signal a slight (however, not significant) further
deterioration was observed (22.6%, p=0.462; chi-square test, n=12). Both the CFP-
and GFP-signals overlying the NMJ returned during the regeneration phase, with
94.0% of the NMJs examined expressing CFP and 98.7% expressing GFP at day 5
(Figs.46, 49). As seen in group A, the loss of CFP extended further proximally
between day 0 and day 1 (Fig.45D) and precisely aligned with the BTx-signal
following recovery. Both the BTx- and the CFP-signal exhibited the same
morphology as the pre-injury state (Fig.50). At all time-points, the return of GFP-
positive structures to the NMJ appeared to precede the return of CFP (Figs.49, 50,
51).
Fig.49: Incidence of CFP and GFP overlying the NMJ in group B (NT and pSC injury). The return of CFP overlying the NMJ is preceded by a return of GFP. There is a significant difference between CFP and GFP at all time-points investigated (p<0.001; chi-square test, n=12 for each time-point).
At days 1 and 2 the GFP-positive cells mostly exhibited a spindly morphology with
only faint fluorescence (Figs.50, 51A, B), whilst by day 5 they had a prominent and
brightly fluorescent cell body (Figs.50, 51), similar to GFP-positive cells in the
control situation. The GFP-positive cells did not always assume exactly the same
location with respect to the BTx-signal when compared to the pre-injury state
(Figs.50, 52), and often an increased number (compared to the physiological state)
of GFP-positive cells could be observed overlying the regenerating NT (Fig.51). As

3. Results NT regeneration 152
seen in group A at days 3 and 5, the GFP-positive cells often extended processes
beyond the original NMJ-boundary, occasionally accompanied by axonal sprouts
(Figs.51E, F, G). Also, the bridging of neighbouring NMJs both by pSCs processes
and nerve terminals could occasionally be observed (Fig.51H) and on day 5, the
nerve terminals, albeit filled with bright CFP, often exhibited an irregular diameter
(Figs.51E, F, G).
Fig.50: Regeneration of individual NMJs in group B (NT and pSC injury). On day 1, there are no changes to the NMJs when compared to the acute state of injury (post-injury). On day 3, the efferent axon has only reached the NMJ, but is not covering it yet (asterisk). The NMJ itself is covered by spindly and faintly fluorescent GFP-positive cells (arrowheads). On day 5, the NT (CFP) has also recovered and exhibits an irregular appearance (arrow). The pSCs on this NMJ do not lie in same location when compared to the pre-injury state. BTx depicts the nAChRs (orange in the composite images), GFP the SCs (green in the composite images) and CFP the axons (blue in the composite images). Scale bars: 20 µm.

3. Results NT regeneration 153
Fig.51: Features of regeneration in group B (NT and pSC inj ury). A the NMJ exhibits no CFP (NTs) and is only partly covered by spindly and only faintly GFP-positive structures on day 1. B, C, D day 2; B the NMJ has partially recovered both GFP and CFP (NT). C, D all NMJs exhibit GFP-positive cells, which however, in comparison to the myelinating SCs and the pSCs on the healthy looking NMJ (arrows) are less intense in fluorescence. Not all NMJs exhibit CFP (NTs). E, F, G pSC processes (GFP; arrowheads) and short axonal sprouts (CFP; arrows) extend from NMJs on days 3 and 5. In all three images the NTs (CFP) exhibit irregular diameters. H two neighbouring NMJs are bridged by both pSC processes (GFP, arrowhead) and axonal sprouts (CFP, arrow) on day 5. Note the increased numbers of GFP-positive cells overlying the NMJ in E-H. BTx depicts the nAChRs (orange in the composite images), GFP the SCs (green in the composite images) and CFP the axons (blue in the composite images). Scale bars: 20 µm.

3. Results NT regeneration 154
Fig.52: Regeneration of individual NMJs in group B (NT and pSC injury) – investigation of pSCs. A 3 days, B 5 days. Following regeneration in many cases, but not all, the GFP-positive cells occupy the same areas as originally inhabited by the pSCs (arrows indicate alignment). BTx depicts the nAChRs (orange in the composite images), GFP the SCs (green in the composite images) and CFP the axons (blue in the composite images). Scale bars: 20 µm.

3. Results NT regeneration 155
3.7.3.2.3 Group C
In all control mice, no changes to the fluorescent proteins were noted (Figs.44B,
45E, F; 53, 54) and no pSCs demonstrated any uptake of EthD-2. At each time-
point, between 95.8% and 98.5% of the NMJs assessed exhibited clearly visible
CFP overlying the BTx-signal (p=0.076; chi-square test, n=30; Fig.46). On day 5, a
few NMJs with increased numbers of GFP-positive cell bodies could be observed.
Also, very occasionally, the pSCs exhibited short processes extending beyond the
NMJ-boundaries; these, however, were never accompanied by axonal sprouts.
Fig.53: Overviews for group C (negative control). A day 2, B day 3, C day 5. No changes to the fluorescent proteins are noted. BTx depicts the nAChRs (orange in the composite images), GFP the SCs (green in the composite images) and CFP the axons (blue in the composite images). Scale bars: 100 µm.
3. Results NT regeneration 156
Fig.54: Revisiting individual NMJs over time in gro up C (negative control). No changes to the fluorescent proteins are noted. BTx depicts the nAChRs (orange in the composite images), GFP the SCs (green in the composite images) and CFP the axons (blue in the composite images). Scale bars: 20 µm. 3.7.3.3 Auxiliary investigations
Following five days of regeneration, both NF heavy and a return of CFP could be
demonstrated at NMJs, which acutely (following the in vivo application of anti-
ganglioside Ab and complement) had shown a loss of CFP overlying the NMJ
(Fig.55).
Fig.55: Recovery of CFP and NF heavy (orange in the composite image) following 5 days of regeneration. BTx depicts the nAChRs (pink in the composite image), GFP the SCs (green in the composite image) and CFP the axons (blue in the composite image). Scale bars: 20 µm.

3. Results NT regeneration 157
Electronmicroscopic imaging of muscles five days after induction of anti-ganglioside
Ab and complement-mediated injury revealed easily identifiable spherical NTs filled
with synaptic vesicles, filaments and a few mitochondria. These lay in direct
apposition to the synaptic folds (Fig.56).
Fig.56: Electronmicroscopic images of NMJs 5 days a fter induction of the injury. The NTs exhibit a physiological morphology and are filled with synaptic vesicles and mitochondria. Scale bars: 2 µm.

3. Results NT regeneration 158
3.7.4 Discussion
3.7.4.1 Regeneration of motor nerve terminals
Following five days of regeneration, the axolemmal integrity (determined by
containment of CFP) was restored in nearly all NTs examined, regardless of
whether the pSCs had undergone concomitant injury or not. No obvious difference
in the rate of recovery between the groups with and without concomitant injury to the
pSCs was observed. At the recovering NTs the CFP- (and the BTx-) signal equalled
the pre-injury state and the return of CFP corresponded to a reconstitution of NF-
heavy.
The observation, that the status of NT integrity in both the acute state after induction
of the injury and following one day of regeneration were identical, corresponds with
the initial lag phase observed in rodents following traumatic injury to their nerves
(Forman & Berenberg, 1978). During this lag phase the injury, acutely confined to
the area of the NMJ, extended proximally towards the nerve bundles for a maximum
of 200 µm. The ensuing rapid recovery of the physiological NT-morphology
(including the ultrastructural morphology (Manolov, 1974; Winlow & Usherwood,
1975)) also correlates well to the rates of axonal regeneration observed in rodents
after traumatic denervation (Forman & Berenberg, 1978; Pan et al., 2003; Pestronk
et al., 1980) or the NT recovery following in vivo applications of β-BTx or α-latrotoxin
(Dixon & Harris, 1999; Duchen et al., 1981; Robbins et al., 1990). Some of the
regenerated NTs examined exhibited a slightly irregular diameter of their CFP-
signal. Considering NF determines the axonal calibre (Schlaepfer, 1987), it is quite
possible that the irregular diameter reflects (temporary) irregularities in the NF-
reassembly. Regenerating axons of a smaller diameter and a “wispy” appearance
are also observed following the application of β-BTx (Dixon & Harris, 1999).
Nerve terminal sprouts (always in association with pSCs processes) were observed
during the second half of the regeneration period. Occasionally, these could be
shown to interconnect neighbouring NMJs, however, more regularly they were quite
short and did not venture more than 20 µm from the NMJ-boundaries. In general,
NT sprouts have been shown to be a regular hallmark of NMJs following both
traumatic and neurotoxin mediated injuries (Dixon & Harris, 1999; Duchen et al.,
1981; Rich & Lichtman, 1989b; Robbins et al., 1990). Considering their association

3. Results NT regeneration 159
with and dependency of pSCs processes, the occurrence of these will be discussed
in greater detail below.
As all axons contained the same colour of fluorescence (CFP), no assumptions can
be made to whether the individual NMJs were “reinnervated” by their original NTs.
However, taking into account that the injury did not extend more than 200 µm
proximal and the myelinating Schwann cell tube seemed to persist, it seems very
likely that all axons reoccupied their original endplate sites.
3.7.4.2 Role of the perisynaptic Schwann cells
For group A, the intracytosolic marker (GFP) for the pSCs remained stable at all
times and an uptake of EthD-2 into these cells could not be demonstrated in any
instance. This indicates that these cells were not affected by the local application of
anti-GD1a-/anti-GT1b-Ab and complement. In group B, however, the pSCs exhibited
a loss of their intracytosolic fluorophore and an uptake of EthD-2, which indicates a
loss of their cell membrane integrity consistent with the formation of MAC pores
known to occur in this injury model. EthD-2-uptake usually is equated with cell
death; however, it is not clear whether the pSCs in this model experienced a
sublethal injury and recovered, whether they underwent degeneration, or a
combination of both. One clue to this might lie in the observations regarding the
exact location of the pSCs with respect to their NMJ. In group A, the pSCs never
moved from their assigned place at the NMJ regardless of their NT undergoing
degeneration, whereas in group B, some of the recovering/returning GFP-positive
cells were found in a different position at the NMJ when compared to the pre-injury
state. Considering the relative loyalty of the pSCs to their exact location on the NMJ,
the finding of pSCs at a different position potentially indicates that these have newly
migrated or divided, which then means that the complement-mediated injury was at
both a sublethal and lethal level. In group B, many GFP-positive cells overlying the
NMJs at days 2 and 3 of regeneration exhibited a very spindly morphology with only
faint green fluorescence. A lower expression of S100 has been reported in immature
Schwann cells or their precursors (Jessen & Mirsky, 1999) and diminished levels of
GFP-intensity have been proposed to represent a dedifferentiation of these cells into
a more immature phenotype that does not express S100 as robustly (Magill et al.,
3. Results NT regeneration 160
2007). This then either indicates a) a dedifferentiation of the pSCs following
complement-mediated injury into a morphologically different and more immature
phenotype or b) that many pSCs were killed and were replaced by morphologically
different pSC precursors. Also, increased numbers of GFP-positive cells overlying
the regenerated NTs were regularly observed at the later time-points in both groups,
corresponding to observations made following reinnervation of traumatically
denervated NMJs (Love & Thompson, 1998).
Following the immune-mediated destruction of the NTs, both the pSCs of groups A
and B, however, did exhibit behaviour similar to pSCs challenged by traumatic
denervation of their NMJ. As demonstrated in the second part of chapter 3.4,
following crush injuries to the innervating nerve, pSCs of denervated NMJs extend
processes towards the periphery in the aim of reaching another NMJ. These then
form extensive networks between individual NMJs. In the event of contacting an
innervated NMJ, the pSCs then induce the NT to sprout and guide it back to their
own NMJ to regain innervation (Son & Thompson, 1995a). In regenerating muscles,
the NMJs therefore are cross-linked by pSC-processes and axonal sprouts, and
following regeneration “escaping”/overshooting axons which follow pSC processes
extending towards the periphery can be observed (O'Malley et al., 1999; Son &
Thompson 1995a, 1995b; Son et al., 1996). These could also demonstrated in the
SM following two weeks of regeneration after a crush injury to the innervating nerve
(see 3.4.3.2). Interestingly, following the anti-ganglioside Ab and complement-
mediated injury, such changes were not observed at the magnitude expected. The
fact that in this specific model axonal/NT regeneration occurred at such a rapid rate
might explain the relative paucity of pSC processes and axonal sprouts observed,
especially when considering that crush injury to innervating nerve of the SH – which
was carried out a lot closer to the muscle when compared to the SM – resulted in
less extensive changes regarding pSC processes and NT sprouts when compared
to the crush injury of the innervating nerve of the SM.
Intriguingly, the rate of NT restoration was not dependant on healthy and mature
pSCs overlying the NMJ. The reasons for this can only be surmised and include the
fact that the axonal injury in itself was very small and the myelinated SCs did not
seem to be compromised. However, the return of CFP at the NMJ always seemed to
be preceded by faint GFP-positive cells covering the area; these might be sufficient
to support the newly regenerating NTs. The fact that the occurrence of these GFP-
3. Results NT regeneration 161
positive cells overlying the NMJ seemed to slightly precede the NT restoration at all
time-points investigated either reflects the smaller loss of GFP-positive cells at the
NMJ in comparison to the CFP-loss acutely following the induction of the injury and
a comparable rate of restoration for both, or provides further evidence for the
supporting role of these cells in the event of axonal/NT regeneration (Griffin &
Thompson, 2008).
3.7.5 Conclusion
The results described in this chapter demonstrate that following a single anti-
ganglioside Ab- and complement-mediated injury to the motor NTs and the very
distal parts of the motor axons a fast recovery of the NT axolemma, the axonal
architectural structures and the NT ultrastructure can be observed. These results
support the hypothesis that the rapid recovery from paralysis observed in some
AMAN-patients is due to the anti-ganglioside Ab-mediated injury being concentrated
to the very distal ends of the motor nerves, while the ventral nerve roots and more
proximal axons remain unaffected – or are only injured at a level not sufficiently
contributing to chronic clinical changes.
A concomitant injury to the pSCs did not affect the rate of NT regeneration,
indicating that the NT regeneration in the current setting occurred independent from
the incidence of healthy and mature pSCs overlying the NMJ.

162
4. CONCLUSIONS
The aim of my PhD project was to combine the already well-established mouse
model of GBS with an in and ex vivo imaging system of the murine NMJ and exploit
this investigatory paradigm to examine acute injury and regeneration of neural and
glial structures targeted in GBS.
A number of conclusions were reached.
4.1 Stability of NMJs in double-fluorescent mice
As it was aspired to conduct all investigations in mice expression fluorescent
proteins in the axons (CFP) and SCs (GFP) of their PNS, the first set of
investigations examined the NMJs of these mice regarding their stability over time.
The main focus was concerned with the number of pSCs per NMJ, and these
investigations were conducted in one of the muscles traditionally used for in vivo
imaging investigations (Balice-Gordon, 1997b).
Counts of pSCs overlying the NMJ revealed that the average number of pSCs per
NMJ only increased from 2.6 pSCs per NMJ in one-month-old mice to 3.2 pSCs per
NMJ in twelve-month-old mice, thus indicating that this parameter is fairly stable.
Especially once the mice had reached an age of seven months, no differences in the
counts could be observed anymore. Regarding the appearance of the nAChRs and
NTs in the fluorescent mice, minor changes were observed in the same time-frame.
Here, the mice older than seven months often exhibited slightly fragmented BTx-
signals, which were mirrored by “knobbly” CFP-filled NTs, irregular in their diameter.
These results correspond well with previous investigations examining the number of
pSCs per NMJ (Love & Thompson, 1998; Zuo et al., 2004), general stability (Balice-
Gordon & Lichtman, 1990; Lichtman et al., 1987) and aging of NMJs (Balice-
Gordon, 1997a; Chai et al., 2011; Courtney & Steinbach, 1981; Li et al., 2011) in
rodents, thus indicating that the double-fluorescent mice can be used for extended
in vivo investigations and any prominent changes in pSC numbers must be induced
by pathological events.

4. Conclusions 163
4.2 Minimalising the illumination facilitates in vivo imaging of the SH (and SM)
Like any in vivo procedure, in vivo imaging of NMJs is an invasive procedure and
thus can result in changes of the structures imaged or inhibit processes which
normally occur (Balice-Gordon, 1997b; Lichtman & Fraser, 2001). Investigator-
induced changes can be due to surgical trauma, infection, labelling and phototoxicity
(Lichtman & Fraser, 2001). Therefore, adequate control groups and an optimisation
of the techniques applied are mandatory.
Overillumination, traumatic denervation, inactivation of NMJs following the
application of paralyzing agents and both traumatic and toxic muscle fibre injury all
induce similar changes to the different components of the NMJ. These include
reactive growing of pSC-processes, increase of pSC numbers, extension of NT
sprouts and loss of nAChR-area. All of these changes were observed in the first two
imaging control groups which focused on the SM, the muscle traditionally used for in
vivo imaging procedures.
Control animals validated the concentration and incubation time of the potentially
paralysing agent α-BTx, which was applied to selectively label the nAChRs and be
able to discriminate one NMJ from another. Imaging of NMJs of the SH muscle, a
flat muscle located in the midline directly on top of the trachea (if the mouse lies in
dorsal recumbancy) and therefore requires no manipulation for imaging whatsoever,
further indicated that the changes observed at the previously imaged NMJs were
due to traumatic or phototoxic injury of the muscle. In the following, the light intensity
for imaging was decreased substantially, which resulted in higher percentage of
NMJs retaining their physiological appearance after in vivo imaging.
It was concluded that conservative imaging of the SH by decreasing the light
intensity of the microscope to 17% (or lower), the field diaphragm of the microscope
to 3, the light intensity of camera to 25% (or lower) and the exposure time to 120ms
should allow for in vivo investigations conducted in this muscle. A concomitant
increase of the acquisition gain to x2 would counteract for the loss of fluorescence
intensity observed in the images. Nevertheless, the BTx-signal would need to be
scrutinised closely as an indicator for any muscle-injury (i.e. light-) induced changes
to the components of the NMJ.

4. Conclusions 164
4.3 Specificity of the anti-ganglioside Abs applied determines whether neural
or glial components of the NMJ are injured
The distribution of gangliosides varies between the neural and glial structures they
are located on. Previous investigations conduced in the murine model of GBS have
revealed that in WT mice anti-GD3-Abs preferentially induce pSC-injury, whilst anti-
GD1a-Abs combined with a source of complement lead to a selective injury of the
NTs (Halstead et al., 2005b).
Four anti-ganglioside Abs with varying binding affinities to both simple and complex
gangliosides were applied to WT, GM2KO, GD3KO and PLP-Tg mice to determine
binding and injury profiles.
In WT double-fluorescent mice, previously observed ganglioside specificities for the
NTs were confirmed. However, it seems advantageous to increase the Ab-
concentration for TBG3 to 200µg/ml and a decrease the incubation time to 30
minutes to be able to compensate for the rapid internalisation of Ab observed at the
NT. A reliable injury to both NTs and pSCs can be achieved by applying both TBG3
and EG1 simultaneously.
Interestingly, no selective injury to pSCs could be elicited in double-fluorescent
mice, neither in WT nor PLP-Tg mice, which selectively express complex
gangliosides in glial cells via the PLP-gene regulatory element. This finding was
rather unexpected and lay in contrast to previous investigations conducted in non-
fluorescent WT mice (Halstead et al., 2005b). Following the examination of the
binding and injury patterns of the different Abs, it was concluded that the
concomitant NT-injury observed in both mice strains was either due to a) the NT-
injury being a bystander injury following severe complement activation of pSCs or b)
the NTs acutely exhibit changes following the injury of “their” pSC. Further
investigations are warranted to elucidate this rather intriguing finding.

4. Conclusions 165
4.4 Ab-binding levels in SM, SH and TS of homozygou s and heterozygous
double-fluorescent mice correspond well to eachothe r
Previous investigations conducted in the murine model for GBS have revealed
differences in the strain susceptibility to Ab-mediated injury. This appears to be due
to a difference in the level of anti-ganglioside Ab-binding (unpublished data). Thus,
the different muscles used for all my investigations (SM, SH and TS) and the both
male and female homozygous and heterozygous mice were assessed for the level
of TBG3-binding, the Ab aspired to apply for in vivo NT injury investigations.
For the Ab-deposits no significant differences were observed between homozygous
and heterozygous SH and SM, with the SM in both cases exhibiting a lower level of
Ab-binding when compared to the SH, indicating potentially a slightly higher
susceptibility of the SH-NTs to Ab- and complement-mediated injury. Combining
these two muscles no significant differences between the homozygous and
heterozygous double-fluorescent mouse strains could be observed. There was
however, a significant difference when comparing homozygous and heterozygous
TS, with the homozygous TS exhibiting very low Ab-binding levels, indicating that
this muscle should be excluded from being used in any investigations. With the
heterozygous TS, the binding levels were similar to the SM and SH. No (or only very
slight) differences were observed between the muscles of male and female mice of
each strain.
4.5 Both SH- and SM-NMJs react to traumatic denerva tion with the extension
of pSC processes and axonal sprouts
The ability or rate of NTs to sprout following traumatic denervation of the NMJ or
toxin-induced paralysis has been shown to differ between fast- and slow-twitch
muscles, with NTs of slow-twitch-muscles exhibiting a greater capacity and/or faster
NT sprouting (Brown et al., 1980; Duchen, 1970; Duchen & Tonge, 1973; Frey et al.,
2000; Hopkins et al., 1986). Considering the muscles used for the in and ex vivo

4. Conclusions 166
investigations were predominantly fast-twitch muscles, their ability to produce pSC
processes and NT sprouts following traumatic denervation was examined.
Both SM and SH exhibited pSC processes and NT sprouts following crush injuries to
their innervating nerves. These were more extensive in the SM, probably reflecting
the fact that the crush of the innervating nerve was carried out at a further distance
to the muscle when compared to the SH and therefore resulting in the SM requiring
more time to regain innervation. Both the rate of the process extensions and the
mode in which the changes occurred, correlated well with the literature (Marques et
al., 2006; Reynolds & Woolf, 1992), indicating the capability of the SM and SH to
show the changes expected and further validating these two muscles for the in vivo
anti-ganglioside Ab and complement-mediated NT-injury.
4.6 Anti-ganglioside Ab is rapidly internalised at the NT; this mechanism
protects the NT from complement-mediated injury
Investigations associated with the validation of anti-ganglioside Abs for the specific
injury of NTs in WT mice, indicated that TBG3, the Ab of choice, is internalised
rapidly at the NT. This raised the question whether this interesting observation could
help protect the NTs from anti-ganglioside Ab and complement-mediated injury.
In ex vivo TS-preparations it could be shown that an increase of incubation times at
37ºC resulted in Ab being internalised and subsequently removed from the NT. This
was accompanied by decreased MAC-deposition and lower rates of NT-injury. In
vivo investigations confirmed these observations. In summary, it could be shown
that rapid uptake of anti-ganglioside Ab into the motor NT can protect this structure
from complement-mediated injury.
In order to overcome this phenomenon (in the experimental setting), the Ab-
concentration needs to be increased, whilst a decrease of the protraction period for
the incubation with complement further facilitates the induction of a NT-injury.

4. Conclusions 167
4.7 Loss of CFP at the NT corresponds with a loss o f physiological axonal
architectural and ultrastructural properties
The present study and also numerous other studies investigating developmental,
degenerative and also regenerative questions of the PNS and CNS have and are
being conducted in mice expressing fluorescent proteins in their axons. Only very
few investigations have been carried out to assess which conventional observations
(EM) the loss of fluorescent proteins in these structures corresponds to. None of
these investigations were conducted at the NMJ.
The loss or abnormal morphology of CFP overlying the NMJ corresponds well with a
loss of the axonal architectural proteins NF light and heavy. The immunoreactivity
for NF light persisted longer than that for NF heavy, albeit with a changed
morphology; which presumably reflects the localisation of the different NFs within
the axon (Fuchs & Cleveland, 1998) and corresponds well to the literature (Serbest
et al., 2007). Application of a calpain-inhibitor resulted in NF heavy being rescued
from degradation, whilst an increased loss of CFP was observed. This observation
indicates that both resealing events (which are calpain-dependant) and calpain-
mediated destruction of the architectural proteins are occurring in this model.
Additionally, the Ca2+-dependency of the process, in combination with the
morphology of the loss of the axonal fluorescent proteins and EM investigations
conducted at the NMJ, surmise that degenerative events similar to those observed
acutely in axons following the induction of Wallerian degeneration take place at the
NT following anti-ganglioside Ab and complement-mediated injury. Injured NTs,
therefore, need to undergo regenerative processes in order to regain their
physiological morphology.

4. Conclusions 168
4.8 Rapid motor NT regeneration following anti-gang lioside Ab- and
complement-mediated injury; the rate of NT regenera tion is not affected by a
concomitant injury to the pSCs
Following a single anti-ganglioside Ab and complement-mediated injury, the NTs
exhibit a rapid loss of intracytosolic fluorescent protein (CFP), which corresponds to
both a loss of the axonal architectural structures and the physiological ultrastructure
(see 3.6). In the NT-regeneration study the incidence of CFP overlying the NMJ-
area was used as an indicator of NT-regeneration.
Acutely after an in vivo induction of the injury and at 24h, roughly 6% of all NMJs
exhibited CFP overlying their BTx-signal. Over the next four days, CFP returned with
close to all NMJs (93.5%) exhibiting CFP by day five. A concomitant injury to the
pSCs did not decrease the rate of NT regeneration. No differences between the
extent of NT regeneration on day 5 were observed between the two groups with and
without concomitant injury to the pSCs. However in the group subjected to both NT-
and pSC-injury, the return of CFP was preceded by a return of GFP-positive cells
overlying the NMJ.
In both groups, some pSCs extended processes beyond the physiological boundary
of the NMJ, which occasionally were accompanied by axonal sprouts. Thus, the
changes observed following Ab-mediated injury were similar to those of NMJs
subjected to traumatic denervation, albeit at a lower magnitude; this is presumably
due to very rapid time-course of reinnervation. In the control group, no changes to
the fluorescent proteins were noted.
Auxiliary investigations revealed that following five days of regeneration both the
axolemmal integrity and the architectural integrity of the NTs were re-established,
and the physiological ultrastructural characterists of NMJs are observed once again.
This data supports the notion that an equivalent mechanism may account for the
rapid recovery seen in some clinical cases of AMAN.

169
5. SUMMARY and OUTLOOK
In summary, the aim of my thesis-project was achieved.
I managed to successfully combine the murine model of GBS with in vivo and ex
vivo imaging of the murine NMJ and exploit this system to investigate acute injury
and regeneration of neural and glial structures targeted in GBS.
In the in vivo imaging system, it was possible to document the integrity of the
structures under investigation under physiological circumstances. Following
induction of an anti-ganglioside Ab and complement-mediated injury, this system
then also allowed to monitor and image the degenerative changes to the structures
under attack.
The in vivo imaging system was combined with ex vivo imaging of the same site,
which allowed to track the degeneration and regeneration of individual NMJs over
time, thus decreasing the amount of research subjects required for these kinds of
investigations. Quantitative assessments complemented the qualitative imaging
sessions to determine the acute extent of distal motor nerve and NT degeneration
and also the rate of regeneration following a single anti-ganglioside Ab and
complement-mediated injury.
Both qualitative and quantitative imaging confirmed that following an anti-
ganglioside Ab and complement-mediated injury, the NT degenerates very quickly.
Regeneration occurs within five days. This rapid rate of regeneration corresponds
well to rates of NT regeneration observed following the application of snake and
spider toxins which mediate selective injury to the NT. However, the observations
described here are the first investigation of the rate of NT regeneration following Ab-
and complement-mediated injury to this structure.
Furthermore, this study directly confirms the hypothesis that in some patients
suffering from the motor axonal forms of GBS only the very distal motor nerves and
NTs are injured, and that these can recover within a short time-frame.
A concomitant injury applied to pSCs in this injury paradigm revealed that (in this
setting) successful NT-regeneration is not dependant on mature and healthy pSCs

5. Summary and Outlook 170
situated at the NMJ. Nevertheless, a return of GFP-positive structures (pSCs)
overlying the NMJs preceded the restoration of the CFP-filled NTs, thus further
supporting the notion of a dependency of the NTs on the glial structures of the NMJ.
The very interesting observation that anti-ganglioside Ab physiologically can rapidly
be internalised at the NT was further explored in a side-study. Investigations showed
that the removal of anti-ganglioside Ab from the axolemmal surface and
internalisation into the NT is associated with a decrease of complement deposition
on the axolemmal surface. This in turn correlates with a decrease in the rate of NT
injury observed. Thus, NTs can also be protected from complement-mediated injury
by internalisation of antiganglioside Ab bound to the axolemma. In what way these
observations correspond to physiological circumstances in the GBS-patients
remains open, as to date the concentrations of circulating anti-ganglioside Abs in
GBS-patients have not been determined and internalization rates for NTs also
remain to be investigated.
However, in addition to being able to provide some answers - in the very nature of
science - my examinations also raised a number of queries which warrant further
investigation.
These include
• the observation that in the mice expressing fluorescent proteins in the neural
and glial structures of their PNS no selective injuries to the pSCs could be
elicited. This is contradictory to previous investigations conducted in non-
fluorescent mice. The results of my investigations indicate that the NTs either
are injured in a bystander fashion following an extensive complement
activation on the pSCs or undergo rapid reactive changes following injury to
“their” pSC.
• the fate of the anti-ganglioside Ab once taken up at the NT. Quantitative
investigations revealed a decrease of internatised Ab over time, pointing to
either a local degradation or retrograde transport.
• the origin and nature of the surplus of GFP-positive cells at regenerative
time-points following immune-mediated or traumatic denervation of the NMJ.

5. Summary and Outlook 171
• the fate of the pSCs following anti-ganglioside Ab and complement-mediated
injury. Can these cells recover, or do they regenerate and are replaced by
newly generated pSCs? If the latter is the case, where are the progenitors of
these new pSCs located and do these also differentiate into the surplus of
GFP-positive cells overlying the NMJ and observed at regenerative time-
points following neuromuscular denervation?
Nevertheless, the use of a combined in and ex vivo imaging approach in mice
expressing fluorescent proteins in the neural and glial structures of their PNS proved
to be useful and informative for the investigation both of the acute degenerative and
also the regenerative changes to these structures following an anti-ganglioside Ab
and complement-mediated injury.
Future investigations based on (repeated) in vivo imaging investigations, if
necessary combined with ex vivo imaging sessions, are numerous and include:
• the chronic effect of circulating anti-ganglioside Abs (without the external
application of complement) following repeated passive immunisations or
active immunisation of immune-responsive mice
• the extent of regeneration observed in chronic anti-ganglioside Ab and
complement-mediated injuries
• the regenerative capacities of the ganglioside-KO vs WT mice following both
immune-mediated and traumatic denervation of the NMJ
• the effects of resealing components, such as tri-block copolymers (Borgens
et al. 2004; Kilinc, Gallo, & Barbee 2007), in complement-mediated injury
• the effects of complement-and calpain-inhibitors in a chronic setting of anti-
ganglioside Ab and complement-application.
172
6. REFERENCES
Abe T., Limbrick A.R., Miledi, R., 1976. Acute muscle denervation induced by beta-bungarotoxin. Proc R Soc Lond B Biol Sci 1117:545-53.
Acosta J.A., Benzaquen L.R., Goldstein D.J., Tosteson M.T., Halperin J.A., 1996. The transient pore formed by homologous terminal complement complexes functions as a bidirectional route for the transport of autocrine and paracrine signals across human cell membranes. Mol Med 2(6):755-65.
Alaedini A., Briani C., Wirguin I., Siciliano G., D'Avino C., Latov N., 2002. Detection of anti-ganglioside antibodies in Guillain-Barré syndrome and its variants by agglutination assay. J Neurol Sci 196: 41-4.
Ang C.W., Noordzij P.G., de Klerk M.A., Endtz H.P., van Doorn P.A., Laman J.D., 2002. Ganglioside mimicry of Campylobacter jejuni lipopolysaccharides determines antiganglioside specificity in rabbits. Infect Immun 70(9):5081-5.
Ariga T., Yu R.K., 2005. Antigycolipid antibodies in Guillain-Barré syndrome and related diseases: review of clinical features and antibody specificities. J. Neurosci Res 80:1-17.
Armstrong R.B., Phelps R.O., 1984. Muscle fiber type composition of the rat hindlimb. Am J Anat 171(3):259-72.
Asbury A.K., Arnason B.G., Adams R.D., 1969. The inflammatory lesion in idiopathic polyneuritis. Its role in pathogenesis. Medicine 48(3):173-215.
Aspinall, G. O., McDonald, A. G., Pang, H., Kurjanczyk, L. A., & Penner, J. L. 1994, "Lipopolysaccharides of Campylobacter jejuni serotype O:19: structures of core oligosaccharide regions from the serostrain and two bacterial isolates from patients with the Guillain-Barre syndrome", Biochemistry.33(1):241-9.
Astrow S.H., Qiang H., Ko C.P., 1998. Perisynaptic Schwann cells at neuromuscular junctions revealed by a novel monoclonal antibody. J Neurocytol 27(9):667-81.
Astrow S.H., Son Y.J., Thompson W.J., 1994. Differential neural regulation of a neuromuscular junction-associated antigen in muscle fibers and Schwann cells. J Neurobiol 25(8):937-52.
Attal P., Lambert F., Marchand-Adam S., Bobin S., Pourny J.C., Chemla D., Lecarpentier Y., Coirault, C., 2000. Severe mechanical dysfunction in pharyngeal muscle from adult mdx mice. Am J Resp Crit Care 162(1):278-81.
Auld D.S., Robitaille R., 2003. Perisynaptic Schwann cells at the neuromuscular junction: nerve- and activity-dependent contributions to synaptic efficacy, plasticity, and reinnervation. Neuroscientist.9(2):144-57.
Bader S.R., Kothlow S., Trapp S., Schwarz S.C.N., Philipp H.-C., Weigend S., Sharifi A.R., Preisinger R., Schmahl W., Kaspers B., Matiasek K., 2010. Acute paretic syndrome in juvenile white leghorn chickens resembles late stages of acute inflammatory demyelinating polyneuropathies in humans. J Neuroinflammation 7:7.

6. References 173
Balice-Gordon R.J., 1996. Dynamic roles at the neuromuscular junction. Schwann cells. Current Biol 6(9):1054-6.
Balice-Gordon R.J., 1997a. Age-related changes in neuromuscular innervation. Muscle Nerve Supplement.5:S 83-7.
Balice-Gordon R.J., 1997b. In vivo approaches to neuromuscular structure and function. Method Cell Biol 52:323-48.
Balice-Gordon R.J., Lichtman J.W., 1990. In vivo visualization of the growth of pre- and postsynaptic elements of neuromuscular junctions in the mouse. J Neurosci 10(3):894-908.
Balice-Gordon R.J., Lichtman J.W., 1993. In vivo observations of pre- and postsynaptic changes during the transition from multiple to single innervation at developing neuromuscular junctions. J Neurosci 13(2):834-55.
Balice-Gordon R.J., Lichtman J.W., 1994. Long-term synapse loss induced by focal blockade of postsynaptic receptors. Nature.372(6506):519-24.
Barrientos S.A., Martinez N.W., Yoo S., Jara J.S., Zamorano S., Hetz C., Twiss J.L., Alvarez J., Court, F.A., 2011. Axonal Degeneration is mediated by the mitochondrial permeability transition pore. J Neurosci 31(3): 966-78.
Baxter B., Gillingwater T.H., Parson S.H., 2008. Rapid loss of motor nerve terminals following hypoxia-reperfusion injury occurs via mechanisms distinct from classic Wallerian degeneration. J Anat 212(6):827-35.
Baxter R.L., Vega-Riveroli L., Deuchars J., Parson S.H., 2005. A2A Adenosine receptors are located on presynaptic motor nerve terminals in the mouse. Synapse 57:229-34.
Beirowski B., Adalbert R., Wagner D., Grumme D.S., Addicks K., Ribchester R.R., Coleman M.P., 2005. The progressive nature of Wallerian degeneration in wild-type and slow Wallerian degeneration (WldS) nerves. BMC Neuroscience.6:6.
Beirowski B., Berek L., Adalbert R., Wagner D., Grumme D.S., Addicks K., Ribchester R. R., Coleman, M.P., 2004. Quantitative and qualitative analysis of Wallerian degeneration using restricted axonal labelling in YFP-H mice. J Neurosci Meth134(1):23-35.
Beirowski B., Nogradi A., Babetto E., Garcia-Alias G., Coleman M.P., 2010. Mechanisms of axonal spheroid formation in central nervous system Wallerian degeneration. J Neuropath Exp Neurol 69(5):455-72.
Betz W.J., Mao F., Bewick G.S., 1992. Activity-dependent fluorescent staining and destaining of living vertebrate motor nerve terminals. J Neurosi 12:363-75.
Bevan S., Miledi R., Grampp W., 1973. Induced transmitter release from Schwann cells and its suppression by actinomycin D. Nature 241(107):85-6.
Bhargava P., Rao P.S., Vajreshwari A., Shankar R. 1984. Total gangliosides, ganglioside species and the activity of neuraminidase in different brain regions and spinal cord of normal and undernourished rats. Lipids 3:179-86.

6. References 174
Birchmeier C., Nave K.A., 2008. Neuregulin-1, a key axonal signal that drives Schwann cell growth and differentiation. GLIA 56(14):1491-7.
Bishop D.L., Misgeld T., Walsh M.K., Gan W.B., Lichtman J.W., 2004. Axon branch removal at developing synapses by axosome shedding. Neuron 44(4):651-61.
Borgens R.B., Bohnert D., Duerstock B., Spomar D., Lee, R.C. 2004. Subcutaneous tri-block copolymer produces recovery from spinal cord injury. J Neurosci Res 76(1):141-54.
Brown M.C., Holland, R.L., 1979. A central role for denervated tissues in causing nerve sprouting. Nature 282(5740):724-6.
Brown M.C., Holland R.L., Ironton R., 1980. Nodal and terminal sprouting from motor nerves in fast and slow muscles of the mouse. J Physiol 306:493-510.
Brown M.C. & Ironton R. 1978. Sprouting and regression of neuromuscular synapses in partially denervated mammalian muscles", J Physiol 278:325-48.
Bullens R.W., O'Hanlon G.M., Wagner E., Molenaar P.C., Furukawa K., Furakawa K., Plomp J.J., Willison H.J., 2002. Complex gangliosides at the neuromuscular junction are membrane receptors for autoantibodies and botulinum neurotoxin but redundant for normal synaptic function. J Neurosci 22(16):6876-84.
Castonguay A., Robitaille R., 2001. Differential regulation of transmitter release by presynaptic and glial Ca2+ internal stores at the neuromuscular synapse. J Neurosci 21(6):1911-22.
Caudie C., Vial C., Bancel J., Petiot P., Antoine J.-C., Gonnaud P.-M., 2002. Antiganglioside antibody profiles in 249 cases of Guillain-Barré syndrom. Ann Biol Clin 60(5):589-97.
Chai R.J., Vucovic J., Dunlop S., Grounds M.D., Shavlakadze T., 2011. Striking denervation of neuromuscular junctions without lumbar motoneuron loss in geriatric mouse muscle. PLos One 6(12): e28090.
Chan S.L., Mattson M.P., 1999. Caspase and calpain substrates: roles in synaptic plasticity and cell death. J Neurosci Res 58(1):167-90.
Chiba A., Kusunoki S., Obata H., Machinami R., Kanazawa I., 1997. Ganglioside composition of the human cranial nerves, with special reference to pathophysiology of Miller Fisher syndrome. Brain Res 745(1-2):32-6.
Coleman M., 2005. Axon degeneration mechanisms: commonality amid diversity. Nat Rev Neurosci 6(11):889-98.
Court F.A., Gillingwater T.H., Melrose S., Sherman D.L., Greenshields K.N., Morton A.J., Harris J.B., Willison H.J., Ribchester R.R., 2008. Identity, developmental restriction and reactivity of extralaminar cells capping mammalian neuromuscular junctions. J Cell Sci 121(23):3901-11.
Courtney J., Steinbach J.H., 1981. Age changes in neuromuscular junction morphology and acetylcholine receptor distribution on rat skeletal muscle fibres. J Physiol 320:435-47.

6. References 175
Cummings J.F., Haas D.C., 1967. Coonhound paralysis. An acute idiopathic polyradiculoneuritis in dogs resembling the Landry-Guillain-Barré syndrome. J Neurol Sci 4:51-81.
Cull-Candy S.G., Fohlman J., Gustavsson D., Lullmann-Rauch R., Thesleff S., 1976. The effects of taipoxin and notexin on the function and fine structure of the murine neuromuscular junction. Neuroscience 1(3):175-80.
Dadon-Nachum M., Melamed E., Offen D., 2011. The "dying-back" phenomenon of motor neurons in ALS. J Mol Neurosci 43: 470-77.
d'Albis A., Couteaux R., Janmot C., Roulet A., Mira J.C., 1988. Regeneration after cardiotoxin injury of innervated and denervated slow and fast muscles of mammals. Myosin isoform analysis. Eur J Biochem 174(1):103-10.
David G., Barrett J.N., Barrett E.F., 1997. Spatiotemporal gradients of intra-axonal [Na+] after transection and resealing in lizard peripheral myelinated axons. J Physiol 498(2):295-307.
De Angelis M.V., Di Muzio A., Lupo S., Gambi D., Uncini A., Lugaresi A., 2001. Anti-GD1a antibodies from an acute motor axonal neuropathy patient selectively bind to motor nerve fiber nodes of Ranvier. J Neuroimmunol 121(1-2):79-82.
De Paiva A., Meunier F.A., Molgo J., Aoki K.R., Dolly, J.O., 1999. Functional repair of motor endplates after botulinum neurotoxin type A poisoning: biphasic switch of synaptic activity between nerve sprouts and their parent terminals. P Natl Acad Sci USA 96(6):3200-5.
De Winter F., Vo T., Stam F.J., Wisman L.A., Bar P.R., Niclou S.P., van Muiswinkel F.L., Verhaagen J., 2006. The expression of the chemorepellent Semaphorin 3A is selectively induced in terminal Schwann cells of a subset of neuromuscular synapses that display limited anatomical plasticity and enhanced vulnerability in motor neuron disease. Mol Cell Neurosci 32(1-2):102-17.
De Paola V., Arber S., Caroni P., 2003. AMPA receptors regulate dynamic equilibrium of presynaptic terminals in mature hippocampal networks. Nat Neurosci 6(5):491-500.
Dennis M.J., Miledi R., 1974. Electrically induced release of acetylcholine from denervated Schwann cells. J Physiol 237(2):431-52.
Dixon R. W., Harris J.B., 1999. Nerve terminal damage by beta-bungarotoxin: its clinical significance. Am J Pathol 154(2):447-55.
Donat J.R., Wisniewski H.M., 1973. The spatio-temporal pattern of Wallerian degeneration in mammalian peripheral nerves. Brain Res 53(1):41-53.
Dratviman-Storobinsky O., Hasanreisoglu M., Offen D., Barhum Y., Weinberger D., Goldenberg-Cohen N., 2008. Progressive damage along the optic nerve following induction of crush injury or rodent anterior ischemic optic neuropathy in transgenic mice. Mol Vis 14:2171-9.

6. References 176
Duchen L.W., 1970. Changes in motor innervation and cholinesterase localization induced by botulinum toxin in skeletal muscle of the mouse: differences between fast and slow muscles. J Neurol Neurosurg PS 33(1):40-54.
Duchen L.W., Excell B.J., Patel R., Smith B., 1974. Changes in motor end-plates resulting from muscle fibre necrosis and regeneration. A light and electron microscopic study of the effects of the depolarizing fraction (cardiotoxin) of Dendroaspis jamesoni venom. J Neurol Sci 21(4):391-417.
Duchen L.W., Gomez S., Queiroz L.S., 1981. The neuromuscular junction of the mouse after black widow spider venom. J Physiol 316:279-291.
Duchen L.W., Strich, S.J., 1968. The effects of botulinum toxin on the pattern of innervation of skeletal muscle in the mouse. Q J Exp Physiol CMS 53(1):84-9.
Duchen L.W., Tonge D. A., 1973. The effects of tetanus toxin on neuromuscular transmission and on the morphology of motor end-plates in slow and fast skeletal muscle of the mouse. J Physiol 228(1):157-72.
Dupin E., Calloni G., Real C., Goncalves-Trentin A., Le Douarin N.M., 2007. Neural crest progenitors and stem cells. CR Biol 330(6-7):521-9.
Fahim M.A., Holley J.A., Robbins N., 1983. Scanning and light microscopic study of age changes at a neuromuscular junction in the mouse. J Neurocytol 12(1):13-25.
Feasby T.E., Gilbert J.J., Brown W.F., Bolton C.F., Hahn A.F., Koopman W.F., Zochodne D.W., 1986. An acute axonal form of Guillain-Barre polyneuropathy. Brain 109(6):1115-26.
Feng G., Mellor R.H., Bernstein M., Keller-Peck C., Nguyen Q.T., Wallace M., Nerbonne J.M., Lichtman J.W., Sanes J.R., 2000. Imaging neuronal subsets in transgenic mice expressing multiple spectral variants of GFP. Neuron 28(1):41-51.
Feng Z., Ko C.P., 2007. Neuronal glia interactions at the vertebrate neuromuscular junction", Curr Opin Pharmacol 7:316-324.
Fillenz M., Gagnon C., Stoeckel K., Thoenen H., 1976. Selective uptake and retrograde axonal transport of dopamine-beta-hydroxylase antibodies in peripheral adrenergic neurons. Brain Res 114(2):293-303.
Filosto M., Tentorio M., Broglio L., Buzio S., Lazzarini C., Pasolini M.P., Cotelli M.S., Scarpelli M., Mancuso M., Choub A., Padovani A., 2008. Disulfiram neuropathy: two cases of distal axonopathy. Clin Toxicol 46:314-6.
Fitzgerald M.J., Comerford P.T., Tuffery A.R., 1982. Sources of innervation of the neuromuscular spindles in sternomastoid and trapezius. J Anat 134(3):471-90.
Foran P.G., Davletov B., Meunier, F.A., 2003. Getting muscles moving again after botulinum toxin: novel therapeutic challenges. Trends Mol Med 9(7):291-9.

6. References 177
Forman D.S., Berenberg R.A., 1978. Regeneration of motor axons in the rat sciatic nerve studied by labeling with axonally transported radioactive proteins. Brain Res 156(2):213-25.
Freimer M.L., McIntosh K., Adams R.A., Alving C.R., Drachman, D.B., 1993. Gangliosides elicit a T-cell independent antibody response. J Autoimmun 6(3):281-9.
Frey D., Schneider C., Xu L., Borg J., Spooren W., Caroni P., 2000. Early and selective loss of neuromuscular synapse subtypes with low sprouting competence in motoneuron diseases. J Neurosci 7:2534-42.
Fuchs E., Cleveland D.W., 1998. A structural scaffolding of intermediate filaments in health and disease. Science. 279(5350):514-9.
George E.B., Glass J.D., Griffin J.W., 1995. Axotomy-induced axonal degeneration is mediated by calcium influx through ion-specific channels. J Neurosci 15(10):6445-52.
Georgiou J., Charlton M.P., 1999.Non-myelin-forming perisynaptic schwann cells express protein zero and myelin-associated glycoprotein. GLIA.27(2):101-9.
Georgiou J., Robitaille R., Trimble W.S., Charlton M.P., 1994. Synaptic regulation of glial protein expression in vivo. Neuron 12(2):443-55.
Gilbert M., Brisson J.R., Karwaski M.F., Michniewicz J., Cunningham A.M., Wu Y., Young N.M., Wakarchuk W.W., 2000. Biosynthesis of ganglioside mimics in Campylobacter jejuni OH4384. Identification of the glycosyltransferase genes, enzymatic synthesis of model compounds, and characterization of nanomole amounts by 600-mhz (1)h and (13)c NMR analysis. J Biol Chem 275(6):3896-906.
Gillespie M.J., Gordon T., Murphy P.R., 1987. Motor units and histochemistry in rat lateral gastrocnemius and soleus muscles: evidence for dissociation of physiological and histochemical properties after reinnervation. J Neurophysiol 57(4):921-37.
Gillingwater T.H., Ribchester R.R., 2001. Compartmental neurodegeneration and synaptic plasticity in the Wld(s) mutant mouse. J Physiol 534(3):627-39.
Glass J.D., Cornblath D.R., 1994. Chronic inflammatory demyelinating polyneuropathy and paraproteinemic neuropathies. Curr Opin Neurol 7(5):393-7.
Gold R., Hartung H.P., Toyka K.V., 2000. Animal models for autoimmune demyelinating disorders of the nervous system. Mol Med Today 6(2):88-91.
Gong Y., Tagawa Y., Lunn M.P., Laroy W., Heffer-Lauc M., Li C.Y., Griffin J.W., Schnaar R.L., Sheikh K.A., 2002. Localization of major gangliosides in the PNS: implications for immune neuropathies. Brain 125(11):2491-506.
Goodfellow J.A., Bowes T., Sheikh K., Odaka M., Halstead S.K., Humphreys P.D., Wagner E.R., Yuki N., Furukawa K., Furukawa K., Plomp J.J., Willison, H.J., 2005. Overexpression of GD1a ganglioside sensitizes motor nerve terminals to

6. References 178
anti-GD1a antibody-mediated injury in a model of acute motor axonal neuropathy. J Neurosci 25(7):1620-8.
Goodyear C.S., O'Hanlon G.M., Plomp J.J., Wagner E.R., Morrison I., Veitch J., Cochrane L., Bullens R.W., Molenaar P.C., Conner J., Willison H.J., 1999. Monoclonal antibodies raised against Guillain-Barre syndrome-associated Campylobacter jejuni lipopolysaccharides react with neuronal gangliosides and paralyze muscle-nerve preparations. J Clin Invest 104(6):697-708.
Gopalakrishnakone P., Hawgood B.J., 1984. Morphological changes induced by crotoxin in murine nerve and neuromuscular junction. Toxicon 22(5):791-804.
Gorlewicz A., Wlodarczyk J., Wilczek E., Gawlak M., Cabaj A., Majczynski H., Nestorowicz K., Herbik M.A., Grieb P., Slawinska U., Kaczmarek L., & Wilczynski G.M., 2009. CD44 is expressed in non-myelinating Schwann cells of the adult rat, and may play a role in neurodegeneration-induced glial plasticity at the neuromuscular junction. Neurobiol Dis 34(2):245-58.
Gottschall J., Zenker W., Neuhuber W., Mysicka A., Muntener M., 1980. The sternomastoid muscle of the rat and its innervation. Muscle fiber composition, perikarya and axons of efferent and afferent neurons. Anat Embryol 160(3):285-300.
Greenshields K.N., Halstead S.K., Zitman F.M.P., Rinaldi S., Brennan K.M., O'Leary C., Chamberlain L.H., Easton A., Roxburgh J., Pediani J., Furakawa K., Furakawa K., Goodyear C.S., Plomp J.J., Willison H.J., 2009. J Clin Invest 119(3): 595-610.
Griffin J.W., Li C.Y., Ho T.W., Tian M., Gao C.Y., Xue P., Mishu B., Cornblath D.R., Macko C., McKhann G.M., Asbury A.K., 1996a. Pathology of the motor-sensory axonal Guillain-Barre syndrome. Ann of Neurol 39(1):17-28.
Griffin J.W., Li C.Y., Ho T.W., Xue P., Macko C., Gao C.Y., Yang C., Tian M., Mishu B., Cornblath D.R., 1995. Guillain-Barre syndrome in northern China. The spectrum of neuropathological changes in clinically defined cases. Brain 118 (3):577-95.
Griffin J.W., Li C.Y., Macko C., Ho T.W., Hsieh S.T., Xue P., Wang F.A., Cornblath D.R., McKhann G.M., Asbury A.K., 1996b. Early nodal changes in the acute motor axonal neuropathy pattern of the Guillain-Barre syndrome. J Neurocytol 25(1):33-51.
Griffin J.W., Thompson W.J., 2008. Biology and pathology of nonmyelinating Schwann cells. GLIA.56(14):1518-31.
Griffiths I., Klugmann M., Anderson T., Thomson C., Vouyiouklis D., Nave K.A., 1998. Current concepts of PLP and its role in the nervous system. Micros Res Techniq 41(5):344-58.
Guerry P., Szymanski C.M., Prendergast M.M., Hickey T.E., Ewing C.P., Pattarini D. L., Moran A.P., 2002. Phase variation of Campylobacter jejuni 81-176 lipooligosaccharide affects ganglioside mimicry and invasiveness in vitro", Infect Immun 70(2):787-93.

6. References 179
Hadden R.D.M., Gregson N.A., Gold R., Smith K.J., Hughes R.A.C., 2002. Accumulation of immunoglobulin across the 'blood-nerve barrier' in spinal roots in adoptive transfer experimental autoimmune neuritis. Neuropathol Appl Neurobiol 28:489-97.
Hafer-Macko C., Hsieh S.T., Li C.Y., Ho T.W., Sheikh K., Cornblath D.R., McKhann G.M., Asbury A.K., & Griffin J.W., 1996a. Acute motor axonal neuropathy: an antibody-mediated attack on axolemma. Ann Neurol 40(4):635-44.
Hafer-Macko C.E., Sheikh K.A., Li C.Y., Ho T.W., Cornblath D.R., McKhann G.M., Asbury A. K., Griffin J.W., 1996b. Immune attack on the Schwann cell surface in acute inflammatory demyelinating polyneuropathy. Ann Neurol 39(5):625-35.
Hahn A.F., 1998. Guillain-Barre syndrome. Lancet 352(9128):635-41.
Hahn A.F., Feasby T.E., Wilkie L., Lovgren D., 1993. Antigalactocerebroside antibody increases demyelination in adoptive transfer experimental allergic neuritis. Muscle Nerve 16(11):1174-80.
Halstead S.K., Humphreys P.D., Goodfellow J.A., Wagner E.R., Smith R.A., Willison, H.J., 2005a. Complement inhibition abrogates nerve terminal injury in Miller Fisher syndrome. Ann Neurol 58(2):203-10.
Halstead S.K., Humphreys P.D., Zitman F.M., Hamer J., Plomp J.J., Willison H.J., 2008a. C5 inhibitor rEV576 protects against neural injury in an in vitro mouse model of Miller Fisher syndrome. J Peripher Nerv Syst13(3):228-35.
Halstead S.K., Morrison I., O'Hanlon G.M., Humphreys P.D., Goodfellow J.A., Plomp J.J., Willison H.J., 2005b. Anti-disialosyl antibodies mediate selective neuronal or Schwann cell injury at mouse neuromuscular junctions. GLIA 52(3):177-89.
Halstead S.K., O'Hanlon G.M., Humphreys P.D., Morrison D.B., Morgan B.P., Todd A.J., Plomp J.J., Willison H.J., 2004. Anti-disialoside antibodies kill perisynaptic Schwann cells and damage motor nerve terminals via membrane attack complex in a murine model of neuropathy. Brain 127(9):2109-23.
Halstead S.K., Zitman F.M., Humphreys P.D., Greenshields K., Verschuuren J.J., Jacobs B.C., Rother R.P., Plomp J.J., Willison H.J., 2008b. Eculizumab prevents anti-ganglioside antibody-mediated neuropathy in a murine model. Brain 131(5):1197-208.
Hamberger A., Svennerholm L., 1971. Composition of gangliosides and phospholipids of neuronal and glial cell enriched fractions. J Neurochem 18(10):1821-9.
Hayashi A., Koob J.W., Liu D.Z., Tong A.Y., Hunter D.A., Parsadanian A., Mackinnon S.E., Myckatyn T.M., 2007. A double-transgenic mouse used to track migrating Schwann cells and regenerating axons following engraftment of injured nerves. Exp Neurol 1:128-38.
Hayashi A., Pannucci C., Moradzadeh A., Kawamura D., Magill C., Hunter D.A., Tong A.Y., Parsadanian A., Mackinnon S.E., Myckatyn T.M., 2008. Axotomy or

6. References 180
compression is required for axonal sprouting following end-to-side neurorrhaphy. Exp Neurol 211(2):539-50.
Hayworth C.R., Moody S.E., Chodosh L.A., Krieg P., Rimer M., Thompson W.J. 2006. Induction of neuregulin signaling in mouse schwann cells in vivo mimics responses to denervation. J Neurosci 26(25):6873-84.
Helting T.B., Zwisler O., Wiegandt H., 1977. Strucuture of tetanus toxin. II. Toxin binding to ganglioside. J Biol Chem 252(1):194-8.
Herrera A.A., Banner L.R., Nagaya N., 1990. Repeated, in vivo observation of frog neuromuscular junctions: remodelling involves concurrent growth and retraction. J Neurocytol 1:85-99.
Hiraga A., Mori M., Ogawara K., Kojima S., Kanesaka T., Misawa S., Hattori T., Kuwabara S., 2005. Recovery patterns and long term prognosis for axonal Guillain-Barre syndrome. J Neurol Neurosurg PS 76(5):719-22.
Hirata K., Zhou C., Nakamura K., Kawabuchi M., 1997. Postnatal development of Schwann cells at neuromuscular junctions, with special reference to synapse elimination. J Neurocytol 26(12):799-809.
Ho T.W., Hsieh S.T., Nachamkin I., Willison H.J., Sheikh K., Kiehlbauch J., Flanigan K., McArthur J.C., Cornblath D.R., McKhann G.M., Griffin J.W., 1997a. Motor nerve terminal degeneration provides a potential mechanism for rapid recovery in acute motor axonal neuropathy after Campylobacter infection. Neurology 48(3):717-24.
Ho T.W., Li C.Y., Cornblath D.R., Gao C.Y., Asbury A.K., Griffin J.W., McKhann G.M., 1997b. Patterns of recovery in the Guillain-Barre syndromes. Neurology 48(3):695-700.
Hopkins W.G., Liang J., Barrett E.J., 1986. Effect of age and muscle type on regeneration of neuromuscular synapses in mice. Brain Res 372(1):163-6.
Howard M.J., David G., Barrett J.N., 1999. Resealing of transected myelinated mammalian axons in vivo: evidence for involvement of calpain. Neuroscience 93(2):807-15.
Hucho F., 1995. Toxins as tools in neurochemistry. Angew Chem Int Edit 34(1):39-50.
Hughes B.W., Kusner L.L., Kaminski H.J., 2006. Molecular architecture of the neuromuscular junction. Muscle Nerve 33(4):445-61.
Hughes R.A., Hadden R.D., Gregson N.A., Smith, K.J., 1999. Pathogenesis of Guillain-Barre syndrome. J Neuroimmunol 100(1-2):74-97.
Iida H., Schmeichel A.M., Wang Y., Schmelzer J.D., Low P.A., 2004. Schwann cell is a target in ischemia-reperfusion injury to peripheral nerve. Muscle Nerve 30(6):761-6.
Ilyas A.A, Chen Z.W., 2007. Lewis rats immunized with GM1 ganglioside do not develop peripheral neuropathy. J Neuroimmunol 188(1-2):34-8.

6. References 181
Ilyas A.A., Dalakas M.C., Brady R.C., Quarles R.H., 1986. Sulfated glucuronyl glycolipids reacting with anti-myelin-associated glycoprotein monoclonal antibodies including IgM paraproteins in neuropathy: species distribution and partial characterization of epitopes. Brain Res 385:1-9.
Ilyas A.A., Gu Y., Dalakas M.C., Quarles R.H., Bhatt S., 2008. Induction of experimental ataxic sensory neuronopathy in cats by immunization with purified SGPG. J Neuroimmunol 193:87-93.
Ilyas A.A., Willison H.J., Quarles R.H., Jungalwala F.B., Cornblath D.R., Trapp B.D., Griffin D.E., Griffin J.W., McKhann G.M., 1988. Serum antibodies to gangliosides in Guillain-Barré sydnrome. Ann Neurol 23:440-7.
Jacobs E.C., Bongarzone E.R., Campagnoni C.W., Campagnoni A.T., 2004. Embryonic expression of the soma-restricted products of the myelin proteolipid gene in motor neurons and muscle. Neurochem Res 29(5):997-1002.
Jahromi B.S., Robitaille R., Charlton M.P., 1992. Transmitter release increases intracellular calcium in perisynaptic Schwann cells in situ. Neuron 8(6):1069-77.
Jaweed M.M., Herbison G.J., Ditunno J.F., 1975. Denervation and reinnervation of fast and slow muscles. A histochemical study in rats. J Histochem Cytochem 23(11):808-27.
Jennekens F.G.I, Veldman H., Schotman P., Gispen W.H., 1979. Sequence of motor nerve terminal involvement in acrylamide neuropathy. Acta Neuropathol 46: 57-63.
Jessen K.R., Mirsky R., 1999. Schwann cells and their precursors emerge as major regulators of nerve development. Trends Neurosci 22(9):402-10.
Jessen K.R., Mirsky R., 2005. The origin and development of glial cells in peripheral nerves. Nat Reviews Neurosci 6(9):671-82.
Jessen K.R., Morgan L., Brammer M., Mirsky R., 1985. Galactocerebroside is expressed by non-myelin-forming Schwann cells in situ. J Cell Biol 101:1135-43.
Joseph N.M., Mukouyama Y.S., Mosher J.T., Jaegle M., Crone S.A., Dormand E.L., Lee K.F., Meijer D., Anderson D.J., Morrison S.J., 2004. Neural crest stem cells undergo multilineage differentiation in developing peripheral nerves to generate endoneurial fibroblasts in addition to Schwann cells. Development 131(22):5599-612.
Kaida K., Kusunoki S., Kamakura K., Motoyoshi K., Kanazawa I., 2000. Guillain-Barre syndrome with antibody to a ganglioside, N-acetylgalactosaminyl GD1a. Brain 123 (1):116-24.
Kanda T., Iwasaki T., Yamawaki M., Ikeda K., 1997. Isolation and culture of bovine endothelial cells of endoneurial origin. J Neurosci Res 49:769-77.
Kanda T., Yamawaki M., Iwasaki T., Mizusawa H., 2000. Glycosphingolipid antibodies and blood-nerve-barrier in autoimmune demyelinative neuropathy. Neurology 54:1459-64.

6. References 182
Kang H., Tian L., Son Y.J., Zuo Y., Procaccino D., Love F., Hayworth C., Trachtenberg J., Mikesh M., Sutton L., Ponomareva O., Mignone J., Enikolopov G., Rimer M., Thompson W., 2007. Regulation of the intermediate filament protein nestin at rodent neuromuscular junctions by innervation and activity. J Neurosci 27(22):5948-57.
Kasthuri, N., Lichtman, J.W., 2004. Structural dynamics of synapses in living animals. Curr Opin Neurobiol 14(1):105-11.
Katz B., Miledi, R., 1973. The effect of alpha-bungarotoxin on acetylcholine receptors. Brit J Pharmacol 49(1):138-9.
Kawai H., Allende M. L., Wada R., Kono M., Sango K., Deng C., Miyakawa T., Crawley J.N., Werth N., Bierfreund U., Sandhoff K., Proia R.L., 2001. Mice expressing only monosialoganglioside GM3 exhibit lethal audiogenic seizures. J Biol Chem 276(10):6885-8.
Kelly J.J., Karcher D.S., 2005. Lymphoma and peripheral neuropathy: a clinical review. Muscle Nerve 31(3):301-13.
Kemp J.G., Blazev R., Stephenson D.G., Stephenson G.M., 2009. Morphological and biochemical alterations of skeletal muscles from the genetically obese (ob/ob) mouse. Int J Obesity 33(8):831-41.
Kemplay S., Stolkin C., 1980. End plate classification and spontaneous sprouting in the sternocostalis muscle of the rat: a new whole mount preparation. Cell Tissue Res 212(2):333-9.
Kerschensteiner M., Reuter M.S., Lichtman J.W., Misgeld T., 2008. Ex vivo imaging of motor axon dynamics in murine triangularis sterni explants. Nat Protoc 3(10):1645-53.
Kerschensteiner M., Schwab M.E., Lichtman J.W., Misgeld T, 2005. In vivo imaging of axonal degeneration and regeneration in the injured spinal cord. Nat Med 11(5):572-7.
Kilinc D., Gallo G., Barbee, K., 2007. Poloxamer 188 reduces axonal beading following mechanical trauma to cultured neurons. Conference Proceedings: .Annual International Conference of the IEEE Engineering in Medicine & Biology Society: 5395-8.
Koirala S., Reddy L.V., Ko C.P., 2003. Roles of glial cells in the formation, function, and maintenance of the neuromuscular junction. J Neurocytol 32(5-8):987-1002.
Koob J.W., Moradzadeh A., Tong A., Hayashi A., Myckatyn T.M., Tung T.H., Mackinnon S E., 2007. Induction of regional collateral sprouting following muscle denervation. Laryngoscope 117(10):1735-40.
Kornberg A.J., Pestronk A., Blume G.M., Lopate G., Yue J., Hahn, A., 1996. Selective staining of the cerebellar molecular layer by serum IgG in Miller-Fisher and related syndromes. Neurology 47(5):1317-20.

6. References 183
Kusunoki S., Shimizu J., Chiba A., Ugawa Y., Hitoshi S., Kanazawa I., 1996. Experimental sensory neuropathy induced by sensitization with ganglioside GD1b. Ann Neurol 39(4):424-31.
Kuwabara S., Asahina M., Koga M., Mori M., Yuki N., Hattori T., 1998a. Two patterns of clinical recovery in Guillain-Barre syndrome with IgG anti-GM1 antibody. Neurology 51(6):1656-60.
Kuwabara S., Yuki N., Koga M., Hattori T., Matsuura D., Miyake M., Noda, M., 1998b. IgG anti-GM1 antibody is associated with reversible conduction failure and axonal degeneration in Guillain-Barre syndrome. Ann Neurol 44(2):202-8.
Lampa S.J., Potluri S., Norton A.S., Laskowski M.B., 2004. A morphological technique for exploring neuromuscular topography expressed in the mouse gluteus maximus muscle. J Neurosci Methods 138(1-2):51-6.
Le Douarin N., Calloni G.W., Dupin E., 2008. The stem cells of the neural crest. Cell Cycle 7(8):1013-9.
Lelyanova V.G., Thomson D., Ribchester R.R., Tonevitsky E.A., Ushkaryov Y.A., 2009. Activation of the α-latrotoxin receptors in neuromuscular synapses leads to a prolonged splash actylcholine release. Bull Exp Biol Med 146(6):701-3.
Li Y., Lee Y., Thompson WJ., 2011. Changes in aging mouse neuromuscular junctions are explained by degeneration and regeneration of muscle fiber segments at the synapse. J. Neurosci 31(42): 14910-9.
Li Y., Thompson W.J., 2011. Nerve terminal growth remodels neuromuscular synapses in mice following regeneration of the postsynaptic muscle fiber. J Neurosi 31 (37): 13191-203.
Li Z., Ortega-Vilain A.C., Patil G.S., Chu D.L., Foreman J.E., Eveleth D.D., Powers J.C., 1996. Novel peptidyl alpha-keto amide inhibitors of calpains and other cysteine proteases. J Med Chem 39(20):4089-98.
Lichtman J.W., Fraser S.E., 2001. The neuronal naturalist: watching neurons in their native habitat. Nat Neurosci 4 Suppl:1215-20.
Lichtman J.W., Magrassi L., Purves D., 1987. Visualization of neuromuscular junctions over periods of several months in living mice. J Neurosci 7(4):1215-22.
Lichtman J.W., Sanes J.R., 2003. Watching the neuromuscular junction. J Neurocytol 32(5-8):767-75.
Linington C., Rumsby M.G., 1980. Accessibility of galactosy ceramides to probe reagents in central nervous system myelin. Biochem J 171:559-65.
Liu J.X., Willison H.J., Pedrosa-Domellof F., 2009. Immunolocalization of GQ1b and related gangliosides in human extraocular neuromuscular junctions and muscle spindles. Invest Ophth Vis Sci 50(7):3226-32.
Livet J., Weissman T.A., Kang H., Draft R.W., Lu J., Bennis R.A., Sanes J.R., Lichtman J.W., 2007. Transgenic strategies for combinatorial expression of fluorescent proteins in the nervous system. Nature 450(7166):56-62.

6. References 184
LoPachin R.M., Lehning E.J., 1997. Mechanism of calcium entry during axon injury and degeneration. Toxicol Appl Pharm 143(2):233-44.
Love F.M., Thompson W.J., 1998. Schwann cells proliferate at rat neuromuscular junctions during development and regeneration. J Neurosci 18(22):9376-85.
Love F.M., Thompson W.J., 1999. Glial cells promote muscle reinnervation by responding to activity-dependent postsynaptic signals. J Neurosci 23:10390-6.
Lu J., Lichtman J.W., 2007. Imaging the neuromuscular junction over the past centuries. Acta Physiol Sinica 59(6):683-96.
Lubischer J.L., Bebinger D.M., 1999. Regulation of terminal Schwann cell number at the adult neuromuscular junction. J Neurosci 19(24): RC46.
Lubischer J.L., Thompson W.J., 1999. Neonatal partial denervation results in nodal but not terminal sprouting and a decrease in efficacy of remaining neuromuscular junctions in rat soleus muscle. J Neurosci 20:8931-44.
Luo L., O'Leary D.D.M, 2005. Axon retraction and degeneration in development and disease. Annu Rev Neurosci 28: 127-56.
Luther P.W., Yip R.K., Bloch R.J., Ambesi A., Lindenmayer G.E., Blaustein M.P., 1992. Presynaptic localization of sodium/calcium exchangers in neuromuscular preparations. J Neurosci 12(12):4898-904.
Ma J., Smith B.P., Smith T.L., Walker F.O., Rosencrance E.V., Koman L.A., 2002. Juvenile and adult rat neuromuscular junctions: density, distribution, and morphology. Muscle Nerve 26(6):804-9.
Magill C., Whitlock E., Solowski N., Myckatyn T., 2008. Transgenic models of nerve repair and nerve regeneration. Neurol Res 30(10):1023-9.
Magill C.K., Tong A., Kawamura D., Hayashi A., Hunter D.A., Parsadanian A., Mackinnon S.E., Myckatyn T.M., 2007. Reinnervation of the tibialis anterior following sciatic nerve crush injury: a confocal microscopic study in transgenic mice. Exp Neurol 1:64-74.
Magrassi L., Purves D., Lichtman J.W., 1987. Fluorescent probes that stain living nerve terminals. J Neurosci 7(4):1207-14.
Manolov S., 1974. Initial changes in the neuromuscular synapses of denervated rat diaphragm. Brain Res 65(2):303-16.
Marques M.J., Pereira E.C., Minatel E., Neto H.S., 2006. Nerve-terminal and Schwann-cell response after nerve injury in the absence of nitric oxide. Muscle Nerve 34(2):225-31.
Martin P.T., 2003. Glycobiology of the neuromuscular junction. J Neurocytol 32(5-8):915-29.
Martinez A.J., Friede R.L., 1970. Accumulation of axoplasmic organelles in swollen nerve fibers. Brain Res 2:183-198.

6. References 185
Matà S., Galli E., Amantini A., Pinto F., Sorbi S., Lolli F., 2006. Anti-ganglioside antibodies and elevated CSF IgG levels in Guillain-Barré sydrome. Eur J Neurol 13: 153-60.
Matthews P.B.C., 1981. Evolving views on the internal operation and functional role of the muscle spindle. J Physiol 320:1-30.
Maurer M., Gold R., 2002. Animal models of immune-mediated neuropathies. Curr Opin Neurol 15:617-22.
Maurer M., Toyka K.V., Gold R., 2002. Immune mechanisms in acquired demyelinating neuropathies: lessons from animal models. Neuromuscular Disord 12(4):405-14.
Maxwell W.L., Graham D.I., 1997. Loss of axonal microtubules and neurofilaments after stretch-injury to guinea pig optic nerve fibers. J Neurotraum 14(9):603-14.
McArdle J.J., Angaut-Petit D., Mallart A., Bournaud R., Faille L., Brigant J.L., 1981. Advantages of the triangularis sterni muscle of the mouse for investigations of synaptic phenomena. J Neurosci Meth 4(2):109-15.
McGonigal R., Rowan E.G., Greenshields K.N., Halstead S.K., Humphreys P.D., Rother R.P., Furukawa K., Willison H.J., 2010. Anti-GD1a antibodies activate complement and calpain to injure distal motor nodes of Ranvier in mice. Brain 133: 1944-1960.
McKhann G.M., Cornblath D.R., Griffin J.W., Ho T.W., Li C.Y., Jiang Z., Wu H.S., Zhaori G., Liu Y., Jou L.P., 1993. Acute motor axonal neuropathy: a frequent cause of acute flaccid paralysis in China. Ann Neurol 33(4):333-42.
McKhann G.M., Cornblath D.R., Ho T., Li C.Y., Bai A.Y., Wu H.S., Yei Q.F., Zhang W.C., Zhaori Z., Jiang Z., 1991. Clinical and electrophysiological aspects of acute paralytic disease of children and young adults in northern China. Lancet 338(8767):593-7.
Meena A.K., Archana A.D., Reddy G.C., Ramakrishna D., Rao P., 2010. Antiganglioside antibodies in subtypes of Guillain-Barré syndrome in an indian population. J Med Scie 10(5):138-42.
Mehta A., Reynolds M.L., Woolf C.J., 1993. Partial denervation of the medial gastrocnemius muscle results in growth-associated protein-43 immunoreactivity in sprouting axons and schwann cells. Neuroscience 57(2):433-42.
Miledi R., Slater C.R., 1970. On the degeneration of rat neuromuscular junctions after nerve section. J Physiol 207:507-28.
Miller M.J., Kangas C.D., Macklin W.B., 2009. Neuronal expression of the proteolipid protein gene in the medulla of the mouse. J Neurosci Res 87(13):2842-53.
Misgeld T., 2005. Death of an axon: studying axon loss in development and disease. Histochem Cell Biol 124(3-4):189-96.

6. References 186
Mizisin A.P., Powell H.C., 1993. Schwann cell injury is attenuated by aldose reductase inhibition in galactose intoxication. Journal Neuropath Exp Neur 52(1):78-86.
Morgan B.P., Luzio J.P., Campbell A.K., 1986. Intracellular Ca2+ and cell injury: a paradoxical role of Ca2+ in complement membrane attack. Cell Calcium 7(5-6):399-411.
Morgan D.L., Proske U., 1984. Vertebrate slow muscle: its structure, pattern of innervation, and mechanical properties. Physiol Rev 64: 103-169.
Morgan-Hughes J.A., 1968. Experimental diphtheritic neuropathy. A pathological and electrophysiological study. J Neurol Sci 7(1):157-75.
Moyano A.L., Comin R., Lardone R.D., Alaniz M.E., Theaux R., Irazoqui F.J., Nores G.A., 2008. Validation of a rabbit model of neuropathy induced by immunization with gangliosides. J Neurol Sci 272:110-4.
Must R., 1987. Experimental investigation of muscular neurotization in the rat. Muscle Nerve 10(6):530-6.
Nagai Y., Momoi T., Saito M., Misuzawa E., Ohtani S., 1976. Ganglioside syndrome, a new autoimmune neurologic disorder, experimentally induced with brain gangliosides. Neurosci Lett 2:107-111.
Nguyen Q.T., Sanes J.R., Lichtman J.W., 2002. Pre-existing pathways promote precise projection patterns. Nat Neurosci 5(9):861-7.
Nickel R., Schummer A., Seiferle, E., 1992. Lehrbuch der Anatomie der Haustiere, 6 edn, Paul Parey, Berlin and Hamburg.
Northington J.W., Brown M.J., 1982. Acute canine idiopathic polyneuropathy. J Neurol Sci 56:259-73.
Ogawara K., Kuwabara S., Mori M., Hattori T., Koga M., Yuki N., 2000. Axonal Guillain-Barré syndrome: relation to anti-ganglioside antibodies and Campylobacter jejuni infection in Japan. Ann Neurol 48:624-31.
O'Hanlon G.M., Humphreys P.D., Goldman R.S., Halstead S.K., Bullens R.W., Plomp J.J., Ushkaryov Y., Willison H.J., 2003. Calpain inhibitors protect against axonal degeneration in a model of anti-ganglioside antibody-mediated motor nerve terminal injury. Brain 126(11):2497-509.
O'Hanlon G.M., Plomp J.J., Chakrabarti M., Morrison I., Wagner E.R., Goodyear C.S., Yin X., Trapp B.D., Conner J., Molenaar P.C., Stewart S., Rowan E.G., Willison H.J., 2001. Anti-GQ1b ganglioside antibodies mediate complement-dependent destruction of the motor nerve terminal. Brain 124(5):893-906.
O'Malley J.P., Waran M.T., Balice-Gordon R.J., 1999. In vivo observations of terminal Schwann cells at normal, denervated, and reinnervated mouse neuromuscular junctions. J Neurobiol 38(2):270-86.
Okada M., Itoh M.M., Haraguchi M., Okajima T., Inoue M., Oishi H., Matsuda Y., Iwamoto T., Kawano T., Fukumoto S., Miyazaki H., Furukawa K., Aizawa S., &

6. References 187
Furukawa K., 2002. b-series Ganglioside deficiency exhibits no definite changes in the neurogenesis and the sensitivity to Fas-mediated apoptosis but impairs regeneration of the lesioned hypoglossal nerve. J Biol Chem 277(3):1633-6.
Olsson Y., 1968. Topographical Differences in Vascular Permeability of Peripheral Nervous System. Acta Neuropathol 10(1):26-33.
Pan Y.A., Misgeld T., Lichtman J.W., Sanes J.R., 2003. Effects of neurotoxic and neuroprotective agents on peripheral nerve regeneration assayed by time-lapse imaging in vivo. J Neurosci 23(36):11479-88.
Paparounas K., O'Hanlon G.M., O'Leary C.P., Rowan E.G., Willison H.J., 1999. Anti-ganglioside antibodies can bind peripheral nerve nodes of Ranvier and activate the complement cascade without inducing acute conduction block in vitro. Brain 122(5):807-16.
Patton B.L., 2003. Basal lamina and the organization of neuromuscular synapses. J Neurocytol 32(5-8):883-903.
Pestronk A., Drachman D.B., Griffin J.W., 1980. Effects of aging on nerve sprouting and regeneration. Exp Neurol 70(1):65-82.
Plomp J.J., Willison H.J., 2009. Pathophysiological actions of neuropathy-related anti-ganglioside antibodies at the neuromuscular junction. J Physiol-London 587(16):3979-99.
Popesko P., Rajtova V., Horak J., 1992. Anatomy of small laboratory animals Saunders, Elsevier Science Ltd, Bratislava.
Powell H.C., Myers R.R., Lampert P.W., 1982. Changes in Schwann cells and vessels in lead neuropathy. Am J Pathol 109(2):193-205.
Prendergast M.M., Lastovica A.J., Moran A.P., 1998. Lipopolysaccharides from Campylobacter jejuni O:41 strains associated with Guillain-Barre syndrome exhibit mimicry of GM1 ganglioside. Infect Immun 66(8):3649-55.
Press R., Mata S., Lolli F., Zhu J., Andersson T., Link H., 2001. Temporal profile of anti-ganglioside antibodies and their relation to clinical parameters and treatment in Guillain-Barre syndrome. J Neurol Sci 190(1-2):41-47.
Pun S., Sigrist M., Santos A.F., Ruegg M.A., Sanes J.R., Jessel T.M., Arber S., Caroni P., 2002. An intrinsic distinction in neuromuscular junction assembly and maintenance in different skeletal muscles. Neuron 34: 357-70.
Purves D., Hadley R.D., 1985. Changes in the dendritic branching of adult mammalian neurones revealed by repeated imaging in situ. Nature 315(6018):404-6.
Ranscht B., Wood P., Bunge R.P., 1987. Inhibition of in vitro peripheral myelin formation by monoclonal anti-galactocerebroside. J Neurosci 7(9):2935-47.
Reddy L.V., Koirala S., Sugiura Y., Herrera A.A., Ko C.P., 2003. Glial cells maintain synaptic structure and function and promote development of the neuromuscular junction in vivo. Neuron 40(3):563-80.

6. References 188
Reynolds M.L., Woolf C.J., 1992. Terminal Schwann cells elaborate extensive processes following denervation of the motor endplate. J Neurocytol 21(1):50-66.
Ribchester R.R., 2009. Mammalian neuromuscular junctions: modern tools to monitor synaptic form and function. Curr Opin Pharmacol 9(3):297-305.
Rich M., Lichtman J.W., 1989a. Motor nerve terminal loss from degenerating muscle fibers. Neuron 3(6):677-88.
Rich M.M., Lichtman J.W., 1989b. In vivo visualization of pre- and postsynaptic changes during synapse elimination in reinnervated mouse muscle. J Neurosci 9(5):1781-1805.
Rich M., Lichtman J.W., 1989c. Motor nerve terminal loss from degenerating muscle fibers. Neuron 3(6):677-688.
Robbins N., Kuchynski M., Polak J., Grasso A., 1990. Motor nerve terminal restoration after focal destruction in young and old mice. Int J Dev Neurosci 8(6):667-78.
Robitaille R., 1998. Modulation of synaptic efficacy and synaptic depression by glial cells at the frog neuromuscular junction. Neuron 21(4):847-55.
Rochon D., Rousse I., Robitaille R., 2001. Synapse-glia interactions at the mammalian neuromuscular junction. J Neurosci 21(11):3819-29.
Rǿdgaard A., Nielsen F.C., Djurup R., Somnier F., Gammeltoft S., 1987. Acetylcholine receptor antibody in myasthenia gravis: predominance of IgG subclasses 1 and 3. Clin Exp Immunol 67: 82-8.
Saida K., Saida T., Brown M.J., Silberberg D.H., 1979. In vivo demyelination induced by intraneural injection of anti-galactocerebroside serum. Am J Pathol 95(1):99-116.
Saida T., Saida K., Silberberg D.H., Brown M.J., 1981. Experimental allergic neuritis induced by galactocerebroside. Ann Neurol 9:87-101.
Sanes J.R., Lichtman J.W., 1999. Development of the vertebrate neuromuscular junction. Annu Rev Neurosci 22:389-442.
Sanes J. R., 1995. The synaptic cleft of the neuromuscular junction. Semin Dev Biol 6(3):163-173.
Santafe M.M., Sabate M.M., Garcia N., Ortiz N., Lanuza M.A., Tomas J., 2005. Changes in the neuromuscular synapse induced by an antibody against gangliosides. Ann Neurol 57(3):396-407.
Santos A.F., Caroni F., 2003. Assembly, plasticity and selective vulnerability to disease of mouse neuromuscular junctions. J Neurocytol 32: 849-62.
Sarret C., Combes P., Micheau P., Gelot A., Boespflug-Tanguy O., Vaurs-Barriere C., 2010. Novel neuronal proteolipid protein isoforms encoded by the human myelin proteolipid protein 1 gene. Neuroscience 166(2):522-38.

6. References 189
Saxena S., Caroni P., 2007. Mechanism of axon degeneration: from development to disease. Prog Neurobiol 83: 174-91.
Scherer S.S., Wrabetz L., 2008. Molecular mechanisms of inherited demyelinating neuropathies. GLIA 56(14):1578-89.
Schlaepfer W.W., 1987. Neurofilaments: structure, metabolism and implications in disease. J Neuropath Exp Neur 46(2):117-29.
Schwab M.E., Thoenen H., 1978. Selective binding, uptake, and retrograde transport of tetanus toxin by nerve terminals in the rat iris. An electron microscope study using colloidal gold as a tracer. J Cell Biol 77(1):1-13.
Sejvar S., Baughman A.L., Wise M., Morgan O.W., 2011. Population Incidence of Guillain-Barre Syndrome: A Systematic Review and Meta-Analysis. Neuroepidemiology 36:123-33.
Serbest G., Burkhardt M.F., Siman R., Raghupathi R., Saatman K.E., 2007. Temporal profiles of cytoskeletal protein loss following traumatic axonal injury in mice. Neurochem Res 32(12):2006-14.
Sheikh K.A., Deerinck T.J., Ellisman M.H., Griffin J.W., 1999a. The distribution of ganglioside-like moieties in peripheral nerves. Brain 122(3):449-60.
Sheikh K.A., Sun J., Liu Y., Kawai H., Crawford T.O., Proia R.L., Griffin J.W., Schnaar R.L., 1999b. Mice lacking complex gangliosides develop Wallerian degeneration and myelination defects. P Natl Acad Sci USA 96(13):7532-7.
Sheikh K.A., Zhang G., Gong Y., Schnaar R.L., Griffin J.W., 2004. An anti-ganglioside antibody-secreting hybridoma induces neuropathy in mice. Ann Neurol 56(2):228-39.
Shin Y.K., Jang S.Y., Lee H.K., Jung J., Suh D.J., Seo S.Y., Park H.T., 2010. Pathological adaptive responses of Schwann cells to endoplasmic reticulum stress in bortezomib-induced peripheral neuropathy. GLIA 58(16):1961-76.
Shorey C.D., Cleland K.W., 1988. Morphometric analysis of frozen transverse sections of human skeletal muscle taken post-mortem. Acta Anat 131(1):30-4.
Singh A.K., Harrison S.H., Schoeniger J.S., 2000. Gangliosides as receptors for biological toxins: development of sensitive fluoroimmunoassays using ganglioside-bearing liposomes. Anal Chem 72(24):6019-24.
Smith D.O., Rosenheimer J.L., 1982. Decreased sprouting and degeneration of nerve terminals of active muscles in aged rats. J Neurophysiol 48(1):100-9.
Son Y.J., Thompson W.J., 1995a. Nerve sprouting in muscle is induced and guided by processes extended by Schwann cells. Neuron 14(1):133-41.
Son Y.J., Thompson W.J., 1995b. Schwann cell processes guide regeneration of peripheral axons. Neuron.14(1):125-32.
Son Y.J., Trachtenberg J.T., Thompson W.J., 1996. Schwann cells induce and guide sprouting and reinnervation of neuromuscular junctions. Trends Neurosci 7: 280-285.
6. References 190
Spierings E., De Boer T., Zulianello L., Ottenhoff T.H., 2000. Novel mechanisms in the immunopathogenesis of leprosy nerve damage: the role of Schwann cells, T cells and Mycobacterium leprae. Immunol Cell Biol 78(4):349-55.
Stemple D.L., Anderson D.J., 1992. Isolation of a stem cell for neurons and glia from the mammalian neural crest. Cell 71(6):973-85.
Stevens J.G., Pepose J.S., Cook M.L., 1981. Marek's disease: a natural model for the Landry-Guillain-Barré syndrome. Ann Neurol 9:102-6.
Stoll G., Jander S., Myers R.R., 2002. Degeneration and regeneration of the peripheral nervous system: from Augustus Waller's observations to neuroinflammation. J Peripher Nerv Syst 7(1):13-27.
Stoll G., Muller H.W., 1999. Nerve injury, axonal degeneration and neural regeneration: basic insights. Brain Pathol 9(2):313-25.
Subramani V., Sahgal V., Sahgal S., Shah A., 1986. Morphology and morphometry of motor endings in primate intrafusal fibers. Exp Brain Res 64:149-57.
Susuki K., Rasband M.N., Tohyama K., Koibuchi K., Okamoto S., Funakoshi K., Hirata K., Baba H., Yuki N., 2007. Anti-GM1 antibodies cause complement-mediated disruption of sodium channel clusters in peripheral motor nerve fibers. J Neurosci 27(15):3956-67.
Suzuki K., 2003. Globoid cell leukodystrophy (Krabbe's disease): update. J Child Neurol 18(9):595-603.
Svennerholm L., 1963. Chromatographic separation of human brain gangliosides. J Neurochem 10:613-23.
Takamiya K., Yamamoto A., Furukawa K., Yamashiro S., Shin M., Okada M., Fukumoto S., Haraguchi M., Takeda N., Fujimura K., Sakae M., Kishikawa M., Shiku H., Furukawa K., Aizawa S., 1996. Mice with disrupted GM2/GD2 synthase gene lack complex gangliosides but exhibit only subtle defects in their nervous system. P Natl Acad Sci USA (20):10662-7.
Tegla C.A., Cudrici C., Patel S., Trippe R 3rd, Rus V., Niculescu F., Rus H., 2011. Membrane attack complex by complement: the assembly and biology of terminal complement complexes. Immunol Res 51: 45-60.
Thomas F.P., Trojaborg W., Nagy C., Santoro M., Sadiq S.A., Latov N., Hays A.P, 1991. Experimental autoimmune neuropathy with anti-GM1 antibodies and immunoglobulin deposits at the nodes of Ranvier. Acta Neuropathol 82(5):378-83.
Trachtenberg J.T., Thompson W.J, 1996. Schwann cell apoptosis at developing neuromuscular junctions is regulated by glial growth factor. Nature 379(6561):174-7.
Trachtenberg J.T., Thompson W.J., 1997. Nerve terminal withdrawal from rat neuromuscular junctions induced by neuregulin and Schwann cells. J Neurosci 17(16):6243-55.
6. References 191
Turney S.G., Culican S.M., Lichtman J.W., 1996. A quantitative fluorescence-imaging technique for studying acetylcholine receptor turnover at neuromuscular junctions in living animals. J Neurosci Meth 64(2):199-208.
Ullah M., Mansor O., Ismail Z.I., Kapitonova M.Y., Sirajudeen K.N., 2007. Localization of the spinal nucleus of accessory nerve in rat: a horseradish peroxidase study. J Anat 210(4):428-38.
Van Doorn P.A., Kuitwaard K., Walgaard C., van Koningsveld R., Ruts L., Jacobs B.C., 2010. IVIG treatment and prognosis in Guillain-Barré syndrome. J Clin Immunol 30(Suppl 1):S74-8.
Van Heyningen W.E., 1974. Gangliosides as membrane receptors for tetanus toxin, cholera toxin and serotonin. Nature 249:415-7.
Van Lunteren E., Moyer M., 2003. Sternohyoid muscle fatigue properties of dy/dy dystrophic mice, an animal model of merosin-deficient congenital muscular dystrophy. Pediatr Res 54(4):547-553.
Van Mier P., Lichtman J.W., 1994. Regenerating muscle fibers induce directional sprouting from nearby nerve terminals: studies in living mice. J Neurosci 14(9):5672-86.
Vincent A., 1998. Antiganglioside antibodies in peripheral neuropathies. J Clin Pathol 51:641-2.
Vincent A., 2008. Autoimmune disorders of the neuromuscular junction. Neurol India 56(3):305-13.
Walgaard C., Jacobs B.C., van Doorn P.A., 2011. Emerging drugs for Guillain-Barré syndrome. Expert Opin Emerging Drugs 16(1):105-20.
Walsh M.K., Lichtman J.W., 2003. In vivo time-lapse imaging of synaptic takeover associated with naturally occurring synapse elimination. Neuron 37(1):67-73.
Wang J., Hamm R.J., Povlishock J.T., 2011. Traumatic axonal injury in the optic nerve: evidence for axonal swelling, disconnection, dieback, and reorganization. J Neurotraum 28:1185-98.
Wang M.S., Davis A.A., Culver D.G., Wang Q., Powers J.C., Glass J.D., 2004. Calpain inhibition protects against Taxol-induced sensory neuropathy. Brain 127(3):671-9.
Wang Y., Schmeichel A.M., Iida H., Schmelzer J.D., Low P.A., 2005. Ischemia-reperfusion injury causes oxidative stress and apoptosis of Schwann cell in acute and chronic experimental diabetic neuropathy. Antioxid Redox Signal 7(11-12):1513-20.
Wicklein E.M., Pfeiffer G., Yuki N., Hartard C., Kunze K., 1997. Prominent sensory ataxia in Guillain-Barré syndrome associated with IgG anti-GD1b antibody. J Neurol Sci 151: 227-229.
Wigston, D.J., 1989. Remodeling of neuromuscular junctions in adult mouse soleus. J Neurosci 9(2):639-47.

6. References 192
Wigston D.J., 1990. Repeated in vivo visualization of neuromuscular junctions in adult mouse lateral gastrocnemius. J Neurosci 10(6):1753-61.
Willison H.J., 2005. The immunobiology of Guillain-Barre syndromes. J Peripher Nerv Syst 10(2):94-112.
Willison H.J., 2007. Gangliosides as targets for autoimmune injury to the nervous system. J Neurochem 103 Suppl 1:143-9.
Willison H.J., Halstead S.K., Beveridge E., Zitman F.M.P., Greenshields K.N., Morgan B.P., Plomp J.J., 2008. The role of complement and complement regulators in mediating motor nerve terminal injury in murine models of Guillain-Barré syndrome. J Neuroimmunol 201-202:172-82.
Willison H.J., Yuki N., 2002. Peripheral neuropathies and anti-glycolipid antibodies. Brain 125(12):2591-625.
Winlow W., Usherwood P.N., 1975. Ultrastructural studies of normal and degenerating mouse neuromuscular junctions. J Neurocytol 4(4):377-94.
Woodhoo A., Sommer L., 2008. Development of the Schwann cell lineage: from the neural crest to the myelinated nerve. GLIA 56(14):1481-90.
Woolf C.J., Reynolds M.L., Chong M.S., Emson P., Irwin N., Benowitz L.I., 1992. Denervation of the motor endplate results in the rapid expression by terminal Schwann cells of the growth-associated protein GAP-43. J Neurosci 12(10):3999-4010.
Xia R.H., Yosef N., Ubogu E.E., 2010. Clinical, electrophysiological and pathologic correlations in a severe murine experimental autoimmune neuritis model of Guillain-Barré syndrome. J Neuroimmunol 219:54-63.
Xie X.Y., Barrett J.N., 1991. Membrane resealing in cultured rat septal neurons after neurite transection: evidence for enhancement by Ca(2+)-triggered protease activity and cytoskeletal disassembly. J Neurosci 11(10):3257-67.
Yamagata M., Sanes J.R., Weiner J.A., 2003. Synaptic adhesion molecules. Curr Opin Cell Biol 15(5):621-32.
Yoshii M., Sakiyama K., Abe S., Agematsu H., Mitarashi S., Tamatsu Y., Ide Y., 2008. Changes in the myosin heavy chain 2a and 2b isoforms of the anterior belly of the digastric muscle before and after weaning in mice. Anat Histol Embryol 37(2):147-52.
Young P., Nie J., Wang X., McGlade C.J., Rich M.M., Feng G., 2005. LNX1 is a perisynaptic Schwann cell specific E3 ubiquitin ligase that interacts with ErbB2. Mol Cell Neurosci 30(2):238-48.
Yu R.K., Usuki S., Ariga T., 2006. Ganglioside molecular mimicry and its pathological roles in Guillain-Barre syndrome and related diseases. Infect Immun 74(12):6517-27.

6. References 193
Yuki N., Taki T., Inagaki F., Kasama T., Takahashi M., Saito K., Handa S., Miyatake T., 1993. A bacterium lipopolysaccharide that elicits Guillain-Barre syndrome has a GM1 ganglioside-like structure. J Exp Med 178(5):1771-5.
Yuki N., Taki T., Takahashi M., Saito K., Yoshino H., Tai T., Handa S., Miyatake T., 1994. Molecular mimicry between GQ1b ganglioside and lipopolysaccharides of Campylobacter jejuni isolated from patients with Fisher's syndrome. Ann Neurol 36(5):791-3.
Yuki N., Yamada M., Koga M., Odaka M., Susuki K., Tagawa Y., Ueda S., Kasama T., Ohnishi A., Hayashi S., Takahashi H., Kamijo M., Hirata K., 2001. Animal model of axonal Guillain-Barre syndrome induced by sensitization with GM1 ganglioside. Ann Neurol 49(6):712-20.
Zeller C.B., Marchase R.B. 1992. Gangliosides as modulators of cell function. Am J Physiol 262(6,1):C1341-55.
Zenker W., Snobl D., Boetschi R., 1990. Multifocal innervation and muscle length. A morphological study on the role of myo-myonal junctions, fiber branching and multiple innervation in muscles of different size and shape. Anat Embryol 182(3):273-83.
Zimmer D.B., Cornwall E.H., Landar A., Song W., 1995. The S100 protein family: history, function and expression. Brain Res Bull 37(4): 417-29.
Zuo Y., Lubischer J.L., Kang H., Tian L., Mikesh M., Marks A., Scofield V.L., Maika S., Newman C., Krieg P., Thompson W.J., 2004. Fluorescent proteins expressed in mouse transgenic lines mark subsets of glia, neurons, macrophages, and dendritic cells for vital examination. J Neurosci 24(49):10999-11009.

194
Appendix : Commands for macros generated in-house
macro "MinMax " {run("Set Measurements...", " min display redirect=None decimal=0"); run("Measure"); min = getResult("Min") max = getResult("Max") run("Select None"); setMinAndMax(min,max); run("Apply LUT"); run("Clear Results");} macro "Deblurrr single stack " {type = 1 rename ("original"); run("8-bit"); run("Duplicate...", "title=[blur] duplicate"); run("Gaussian Blur...", "radius=30 stack"); run("Gamma...", "stack value=1.25"); imageCalculator("Subtract create stack", "original", "blur" ); //run("Enhance Contrast", "saturated=0 normalize normalize_all"); selectWindow("blur"); close();} macro "Intensity (Red BTx) " {type = 1 dir = getDirectory("Choose Image Folder"); list = getFileList(dir); setBatchMode(true); for (i=0; i<list.length; i++){ path = dir+list[i]; if (endsWith(path, ".lsm")){ open(path); if (nImages==2) { title=list[i] + " Channel : Ch2-T2"; title2 =list[i] + " Channel : Ch1-T1"; selectWindow(title2); rename("red"); selectWindow(title); rename(list[i]); run("Set Measurements...", "area mean display redirect="+list[i] ); selectWindow("red"); setThreshold(50, 255); run("Analyze Particles...", "size=10-1000 circularity=0.00-1.00 show=Nothing display"); close(); close();} else {close();}
Appendix 195
macro "Intensity (Green BTx) " {type = 1 dir = getDirectory("Choose Image Folder"); list = getFileList(dir); setBatchMode(true); for (i=0; i<list.length; i++){ path = dir+list[i]; if (endsWith(path, ".lsm")){ open(path); if (nImages==2) { title=list[i] + " Channel : Ch2-T2"; title2 =list[i] + " Channel : Ch1-T1"; selectWindow(title); rename("green"); selectWindow(title2); rename(list[i]); run("Set Measurements...", "area mean display redirect="+list[i] ); selectWindow("green"); setThreshold(50, 255); run("Analyze Particles...", "size=10-1000 circularity=0.00-1.00 show=Nothing display"); close(); close();} else {close();}

196
Publications linked to this thesis:
a.) Experimental Neurology 233 (2012): 836-848
b.) The Journal of Clinical Investigation 122 (2012): 1037-1061