Embed Size (px)
Citation preview
Utilizing ion mobility and tandem mass spectrometry to evaluate the
structure and behaviour of multimeric cyclodextrin complexes
Kevin Berland, Justin B. Renaud, Paul M. Mayer
Chemistry Department, University of Ottawa, 10 Marie Curie, Ottawa, ON Canada K1N 6N5
* keywords: cyclodextrin, ion mobility, RRKM, ion dissociation, inclusion complex, tandem mass
spectrometry
1
Abstract
Characterizing non-covalent complexes of molecular dimers and higher complexes using tandem
mass spectrometry (MS/MS) can be hindered due to spectral overlap in both the MS and the
MS/MS. We investigated the structures and dissociation energetics of multimeric β-cyclodextrin
(β-CD) complexes alone or with substrates using combinations of ion mobility spectrometry
(IMS), MS/MS and RRKM unimolecular rate modelling. The doubly charged β-CD dimers ([(β-
CD)2-2H+]-2) dissociate to two [β-CD-H+]-1 ions with the same m/z. IMS was used to separate
source generated [(β-CD)2-2H+]-2 from [β-CD-H+]-1 and the extent of [(β-CD)2-2H+]-2
dissociation versus collision energy was determined by modelling changes in the ion’s isotopic
profile. The RRKM derived E0 for dissociation of [(β-CD)2-H+]-1 and [(β-CD)2-2H+]-2 were 1.85
± 0.11eV and 1.79 ± 0.09eV, respectively, corresponding to a slight decrease in complex
stability due to increased charge-charge repulsion in the dianion. This approach was extended to
include dimeric complexes complexed to 4,4’-(propane-1,3-diyl) dibenzoic acid (PDDA) and
Ibuprofen (Ibu).
2
Introduction
Cyclodextrins (CD) are well known to form non-covalent complexes with substrates as
well as multimeric aggregates.1, 2 Solution phase interactions between CD and some substrates
are believed to be driven primarily by hydrophobic interactions3 when a substrate is capable of
fitting into the inner cavity of the CD host. This interaction is often modelled in a 1:1
host:substrate manner,4 however this is possibly an over simplification of the global interactions
taking place.5 For example, 1H-NOESY experiments have suggested the existence of two
binding modes between CD and cinchona alkaloids in solution6 which has been interpreted by
Wen and co-workers as evidence for both a 1:1 and 2:1 CD–substrate molecular interaction.7
Using molecular modelling and phase solubility diagrams, Wen proposed the formation of
‘sandwich-type’ inclusion complexes of two CD and a cinchonine, but it is possible that an even
wider variety of binding stoichiometries are present.
Electrospray ionization (ESI) mass spectrometry (MS) of certain chemical species is
often able to detect a rich variety of multimeric complexes, clusters and aggregates that could be
present in solution as well as formed by the ESI process. One method used to investigate the
dissociation energetics of non-covalent complexes is tandem mass spectrometry (MS/MS)
followed by RRKM modelling of breakdown diagrams in order to obtain critical energies (E0)
and entropies of activation (∆S‡) for each dissociation channel.8, 9 MS/MS is used to generate
breakdown diagrams by measuring the relative intensity of the reactant and product ions as a
function of collision energy. However, generating a breakdown diagram of some multimeric
complexes can be complicated when the m/z signal of a reactant ion is overlapped with other
compounds having the same m/z. This readily occurs when studying compounds such as CD that
have a propensity to form aggregates. For example, a singly deprotonated CD monomer ([M-
3
H+]-1) will have the same monoisotopic m/z as a doubly deprotonated CD dimer ([(M)2-2H+]-2), a
triply deprotonated CD trimer ([(M)3-3H+]-3), and so forth. With sufficient mass resolution, the
existence of overlapping multimeric complexes can be detected based on the observed isotopic
distributions. The mass difference between a 12C and a 13C isotope is 1.00 Da and therefore the
m/z separation between isotopic peaks would be 1.0 m/z and 0.5 m/z for singly and doubly
charged compounds respectively.
Kralj, Šmidovnik and Kobe used a combination of ESI-IMS-MS, ESI-MS and
ESI-MS/MS to explore interactions between α or β-CD with positional isomers of coumaric
acid.10 Using ESI-MS, they identified the established 1:1 complex, [CD+substrate-H+]-1, as well
as significant signals for multimeric complexes including [(CD)2-2H+]-2, [(CD)2+substrate-2H+]-2
and [(CD)2+substrate-H+)2]-2. The fragmentation pathways of the multimeric CD complexes
were identified using ESI-MS/MS of a combined dimer/monomer m/z signal. Although the
monoisotopic m/z of related multimeric complexes can be identical, their experimental collision
cross sections (Ωexp) and charge are often sufficiently different to give distinct arrival time
distributions using ion mobility spectrometry (IMS). Kralj, Šmidovnik and Kobe showed that
ESI-IMS is able to separate overlapping mass spectral signals of deprotonated CD monomers
and dimers.
In this work, we have developed an approach to investigate the gas phase energetics of
overlapping multimeric complexes using combinations of IMS and MS/MS that allow for
breakdown diagrams to be generated and modelled. Furthermore, when fragment ions possess
the same monoisotopic m/z as the reactant ion, we demonstrate how the percentage of complex
dissociation can be obtained by monitoring changes in the isotope profile. Based on the findings
of Kralj, Šmidovnik and Kobe that identified the presence of CD multimeric complexes in ESI-
4
MS and ability of IMS to separated overlapping signals, β-CD was chosen as a model system.
The energetics of β-CD dimeric complexes alone and with two different organic substrates were
investigated using IMS to mobility-separate different molecular species with identical
monoisotopic m/z followed by MS/MS. The breakdown diagrams were modelled with RRKM
unimolecular rate theory and the results connected with structural data obtained with IMS.
Materials and Methods
Materials
β-Cyclodextrin (β-CD), and the substrates 4,4’-(propane-1,3-diyl) dibenzoic acid
(PDDA) and Ibuprofen (Ibu) were purchased from Sigma-Aldrich (St. Louis). 40 μM solutions
of β-CD were prepared in 90:10, HPLC grade methanol:water. Substrate/ β-CD mixtures
contained 40 μM β-CD and 20 μM substrate prepared in 90:10, HPLC grade methanol:water.
ESI-MS
MS was acquired in negative mode ESI on a Waters Synapt G1 Mass spectrometer in ‘V’
resolution mode and the sample was introduced via syringe pump at 10μL min -1. The capillary,
sample cone and extracting cone voltages were held constant at 3.0 kV, 40 V, and 4 V
respectively and the source and desolvation temperatures were 100°C and 200 °C respectively.
Ωexp measurements were derived from IMS drift times using a α,ω-dicarboxy polystyrene11 and
decathymidine standards12 according to procedure outlined by Smith.13 IMS buffer gas was N2 at
a flow rate of 24 mL min-1. The reported Ωexp are averages obtained from 4 different
combinations of wave height and wave velocities: 20V-1250 m/s, 20V-1050 m/s, 15V-1050 m/s
5
and 13V-850m/s. Ωexp uncertainties reported are standard deviations of the Ωexp values measured
at different mobility settings, while absolute uncertainties resulting from error in the calibration
curve are ~8%. Ions were mass selected at a LM and HM resolution of 5.0 and 7.0 on the
Masslynx 4.0 software to transmit the complete isotope profile through the quadrupole.
Collision-induced dissociation (CID) was accomplished post-IMS in the transfer cell with an
argon flow rate of 1.0 mL min-1 at collision energy intervals of 1.0 eV for 1.0 min acquisition at
each collision energy. Breakdown diagrams were generated by plotting the relative intensities of
the reactant and fragment ions as a function of center-of-mass collision energy (Ecom).
Theoretical MS/MS breakdown curves
The complete description of our RRKM fitting of experimental breakdown curves is
described in detail elsewhere.8, 9 Briefly, vibrational frequencies of [β-CD-H+]-1 and neutral
substrate molecules were calculated at the AM1 level14 in the Gaussian 09 program suite.15 Using
these frequencies, reactant densities of states and transition state sums-of-states were calculated
by direct count according to the algorithm of Beyer and Swinehart.16, 17 The effective temperature
(Teff) of the reactant ions at Ecom is approximated by:
(1) T eff=400 K+α ∙ (Ecom )
The α value (units eV-1K) represents a linear approximation between the Teff and Ecom and
400K is an approximation of the initial temperature. The vibrational frequencies of the transition
state were approximated by removing a critical oscillator to represent the reaction coordinate and
altering the eight lowest vibrational frequencies. Altering these frequencies and the E0 values,
thousands of theoretical breakdown curves were automatically generated and their agreement
6
with the experimental breakdown curve was scored. The approximate nature of the assigned
post-collision internal energy distribution of the dissociating ions means that the values for ∆S‡
and E0 derived herein must be taken as approximate only. However, due to the structural
similarity of the systems of study, relative values of these quantities should be reliable for
comparison. Uncertainties of E0 and ∆S‡ listed within this study represent uncertainties of the
theoretical fit only and do not reflect the absolute uncertainly due to the approximate nature of
equation 1.
Results and discussion
ESI-MS of β-CD and organic substrate solutions
ESI-MS of a 40 μM β-CD solution under the conditions described yields a prominent
signal at 1133.4 m/z (Fig. 1). Close examination of the 1133.4 m/z signal shows a staggered
isotopic profile; major isotope peaks separated by 1 m/z and interposed minor peaks separated by
0.5 m/z (Fig. 2). The singly deprotonated monomer, [β-CD-H+]-1 has the same monoisotopic m/z
of the doubly deprotonated dimer, [(β-CD)2-2H+]-2 and the co-occurrence of both species is
evident by differences in 13C isotope separation. Under the experimental conditions used, many
other β-CD containing compounds were observed in the mass spectrum including 566.2 m/z, [β-
CD-2H+]-2; 1169.4 m/z, [β-CD+Cl-]-1 / [(β-CD)2 +2Cl-]-2; 1179.4 m/z, [β-CD+HCO2-]-1
; 1700.5
m/z, [(β-CD)3-2H+]-2 and 2267.7, [(β-CD)2-H+]-1.
β-CD was mixed in a 2:1 molar ratio with either Ibu or PDDA in order to favour the
complexation of multiple β-CD with a single organic substrate (Fig. 2). Ibu and PDDA were
used as substrates primarily because they have similar reported gas phase E0 of dissociation in a
1:1 β-CD complex,18 yet differ in length and number of carboxylic groups. ESI-MS of the β-CD-
7
Ibu solution resulted in signals for [β-CD+Ibu-H+]-1 as well as a signals that corresponded to [(β-
CD)2+Ibu-2H+]-2 and [(β-CD+Ibu-H+)2]-2 (Fig. 2a). The summed isotope intensity of the dimer
species [(β-CD)2+Ibu-H+]-2 was 30% of the intensity of the monomer species [β-CD+Ibu-H+]-1.
In comparison, under the same experimental conditions, the summed isotope intensity of [(β-
CD)2+PDDA-2H+]-2 was 183% that of the 1:1 bound complex of [β-CD+PDDA-H+]-1 (Fig. 2b),
suggesting a greater ability for PDDA to form multimeric complexes with β-CD. In solution
studies, Peña determined that a 2:1 CD complex formation was favoured for a pyrene substrate
because pyrene is not able to be completely enveloped by a single CD, leaving a portion of the
substrate available for a secondary association.19 PDDA is not only longer than Ibu, it contains a
secondary carboxylic acid group which could allow it to more easily form electrostatic
interactions with two CD molecules simultaneously.
ESI-IMS separation of [β-CD-H+]-1 and [(β-CD)2-2H+]-2
The monomer [β-CD-H+]-1 and dimer [(β-CD)2-2H+]-2 have an identical monoisotopic m/z
of 1133.4. ESI-IMS-MS of m/z 1133.4 shows two distinct arrival time distributions (ATD) (Fig.
3a). The mass spectrum of the ion packet with the shortest IMS ATD, labeled I in Fig. 3, has
isotopic separations of 0.50 m/z which corresponds to the dimer [(β-CD)2-2H+]-2 (Fig. 3b). The
ion packet with the longer ATD, labelled II in Fig. 3, has an isotopic profile separated by 1.0
m/z, which corresponds to the monomer [β-CD-H+]-1 (Fig. 3c). Generating a breakdown
diagram of [(β-CD)2-2H+]-2 with MS/MS alone would not be possible because of spectral
overlap.
8
Determining proportion of [(β-CD)2-2H+]-2 dissociation by monitoring
changes in isotopic profile
Generating a breakdown diagram for the singly charged dimer; [(β-CD)2-H+]-1 (2267.8
m/z) is straightforward as it dissociates by the loss of neutral [(β-CD]0 to give a single [β-CD-
H+]-1 product ion at m/z 1133.4. Generating a breakdown diagram of [(β-CD)2-2H+]-2 is not
straightforward. The reactant ion; [(β-CD)2-2H+]-2 and product ions; [β-CD-H+]-1 have the same
monoisotopic mass and the main evidence of a dissociation taking place is the transformation of
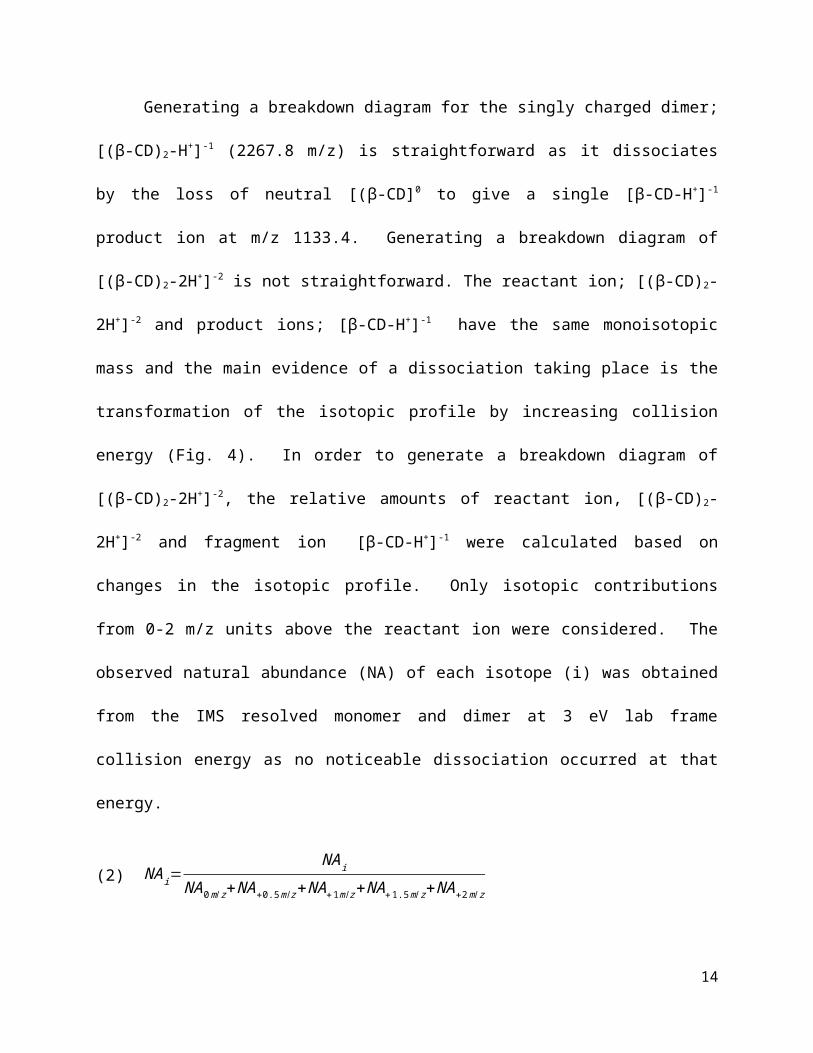
the isotopic profile by increasing collision energy (Fig. 4). In order to generate a breakdown
diagram of [(β-CD)2-2H+]-2, the relative amounts of reactant ion, [(β-CD)2-2H+]-2 and fragment
ion [β-CD-H+]-1 were calculated based on changes in the isotopic profile. Only isotopic
contributions from 0-2 m/z units above the reactant ion were considered. The observed natural
abundance (NA) of each isotope (i) was obtained from the IMS resolved monomer and dimer at
3 eV lab frame collision energy as no noticeable dissociation occurred at that energy.
(2) NAi=NA i
NA0m / z+NA+0.5 m/ z+NA+1m / z+NA+1.5m / z+NA+2m / z
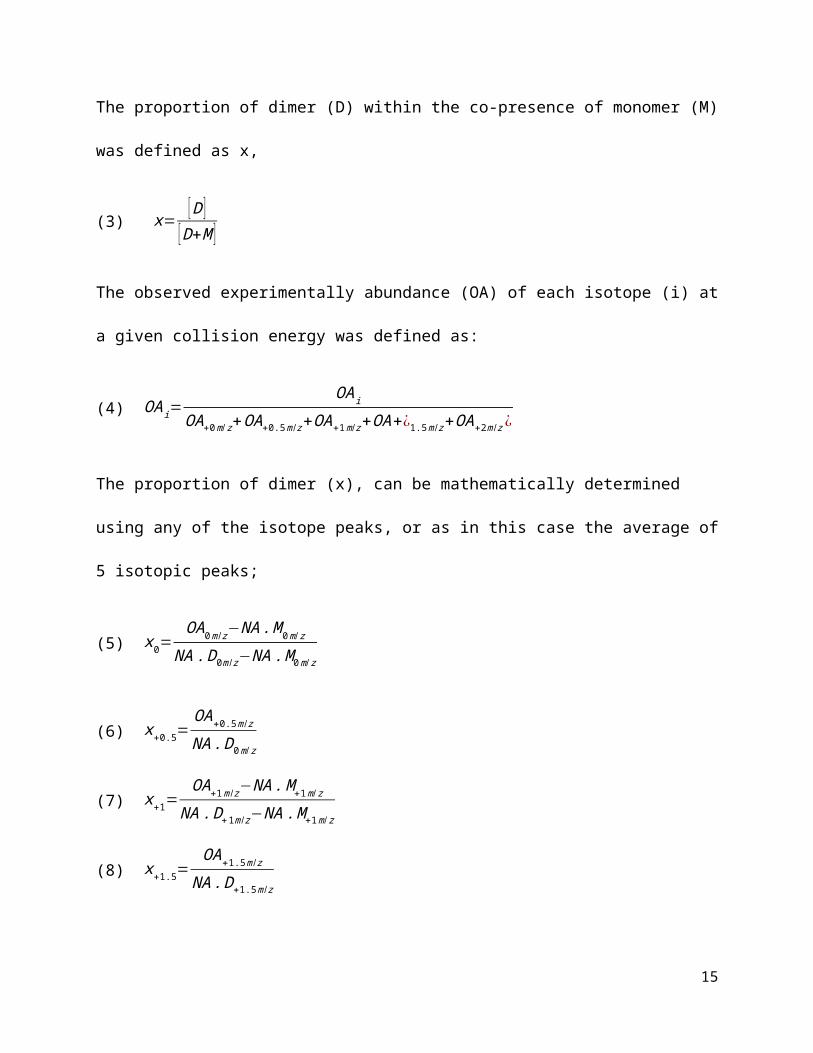
The proportion of dimer (D) within the co-presence of monomer (M) was defined as x,
(3) x=[D ]
[D+M ]
The observed experimentally abundance (OA) of each isotope (i) at a given collision energy was
defined as:
(4) OA i=OA i
OA+0m / z+OA+0.5m / z+OA+1m / z+OA+¿1.5m/ z+OA+ 2m / z ¿
9
The proportion of dimer (x), can be mathematically determined using any of the isotope peaks,
or as in this case the average of 5 isotopic peaks;
(5) x0=OA0m / z−NA .M 0m / z
NA .D0m / z−NA .M 0m / z
(6) x+0.5=OA+0.5m / z
NA .D 0m/ z
(7) x+1=OA+1m / z−NA .M+1m / z
NA . D+1m / z−NA .M+1m / z
(8) x+1.5=OA+1.5m / z
NA .D+1.5m/ z
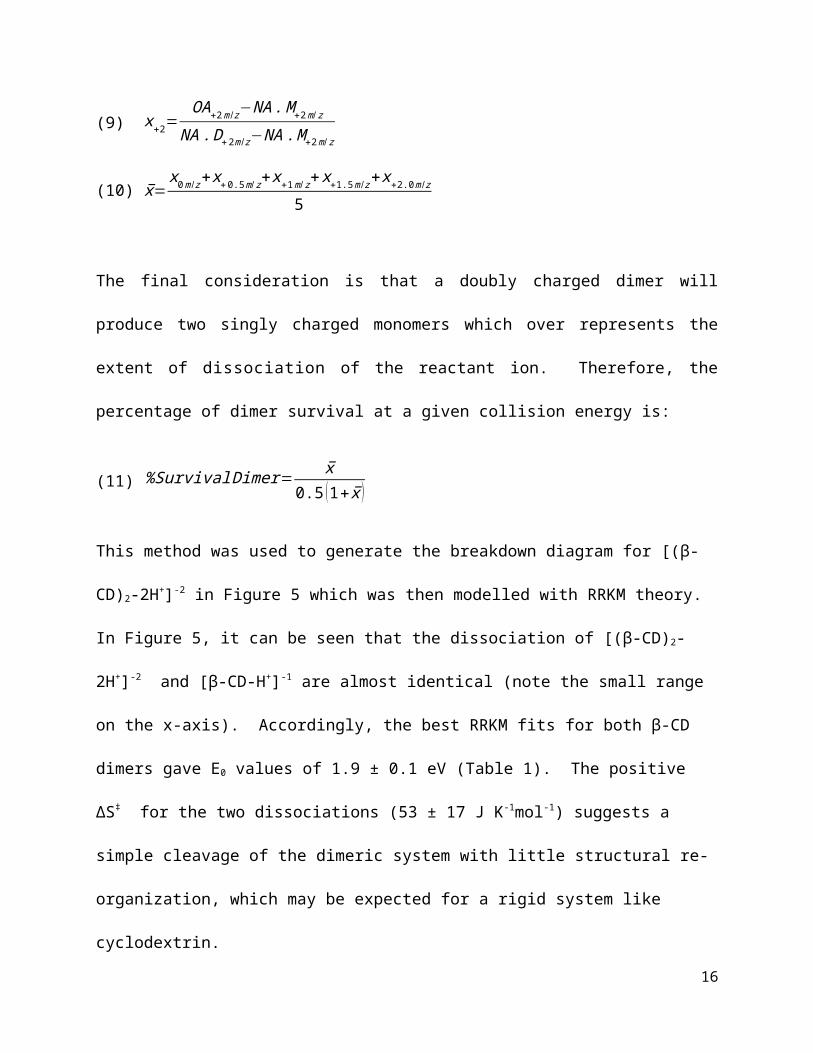
(9) x+2=OA+2m / z−NA .M+2m / z
NA .D+2m / z−NA .M +2m/ z
(10) x̅=x0m / z+x+ 0.5m/ z+x+1m / z+x+1.5m / z+ x+2.0m/ z
5
The final consideration is that a doubly charged dimer will produce two singly charged
monomers which over represents the extent of dissociation of the reactant ion. Therefore, the
percentage of dimer survival at a given collision energy is:
(11) %Survival Dimer= x̅0.5 (1+ x̅ )
This method was used to generate the breakdown diagram for [(β-CD)2-2H+]-2 in Figure 5 which
was then modelled with RRKM theory. In Figure 5, it can be seen that the dissociation of [(β-
CD)2-2H+]-2 and [β-CD-H+]-1 are almost identical (note the small range on the x-axis).
Accordingly, the best RRKM fits for both β-CD dimers gave E0 values of 1.9 ± 0.1 eV (Table 1).
10
The positive ∆S‡ for the two dissociations (53 ± 17 J K-1mol-1) suggests a simple cleavage of the
dimeric system with little structural re-organization, which may be expected for a rigid system
like cyclodextrin.
11
Generating breakdown diagrams of [(β-CD)2+substrate-2H+]-2 complexes
Unlike the MS/MS of [(β-CD)2-2H+]-2, [(β-CD)2+substrate-2H+]-2 signals contained far
less m/z overlap with other species; however, there were two competing pathways which
produced different fragment ions with identical m/z (Fig. 6): Pathway (1) is the loss of a neutral
substrate to give the single product ion [(β-CD)2-2H+]-2 at m/z 1133.4 and pathway (2) is the
charge separation producing [β-CD-H+]-1 (m/z 1133.4) and [β-CD+substrate–H+]-1.
Both dissociation pathways resulted in [β-CD-H+]-1 product ions and therefore obtaining
the relative intensities of each dissociation pathway again was not straight forward. The
intensity of fragment ions of pathway 2 were obtained from the summed ion intensity of [β-
CD+substrate–H+]-1. The [β-CD +substrate–H+]-1 signal of pathway 2 will produce an equivalent
signal at 1133.4 m/z for [β-CD-H+]-1. Therefore, the intensity of [(β-CD)2-2H]-2 originating from
pathway (1) was obtained by subtracting the summed isotope intensity of [β-CD +substrate–H+]-1
from the summed isotope intensity of m/z 1133.4 according to equation 12:
(12) IPathway 1=I 1133.4−I ¿ ¿¿
With this, it was possible to obtain breakdown diagrams for both [(β-CD)2+Ibu–2H+]-2 and [(β-
CD)2+PDDA–2H+]-2
It can be seen directly from the breakdown diagrams (Figs 7a,b) that the onset of
dissociation of [(β-CD)2–2H+Ibu]-2 is earlier than [(β-CD)2+PDDA–2H+]-2. For both [(β-
CD)2+Ibu–2H+]-2 and [(β-CD)2+PDDA–2H+]-2 the dominant pathway is the loss of the neutral
substrate, indicating a stronger binding between both β-CD than the binding between β-CD and
the substrate.
12
The loss of [Ibu]0 and [PDDA]0 from the reactant complex had similar critical energies of
1.12 ± 0.05 and 1.11 ± 0.05, respectively (Table 2). The PDDA containing complex is more
kinetically stable due to an entropic effect. The ∆S‡ for loss of [Ibu]0 and [PDDA]0 were
approximated to be 0 ± 11 and -18 ± 10, respectively. This suggests that the transition state for
the loss of PDDA requires a tighter conformational re-organization than the loss of Ibu and
connects with IMS measurements that show the [β-CD+PDDA–2H+]-2 ion being more compact
than [β-CD+Ibu–2H+]-2 (Table 3). The minor pathway, whereby [β-CD–H+]-1 dissociates from
the reactant ion complex, is the most closely related to the dissociation of the β-CD dimer. The
E0 for this channel is 1.4 ± 0.1 eV and 1.5 ± 0.1 eV for Ibu and PDDA, respectively, while the
∆S‡ are 25 ± 10 and 38 ± 9 J K-1mol-1. This means that binding of Ibu or PDDA to [(β-CD)2–
2H+]-2 significantly lowers the binding between the two β-CD by 0.4 and 0.3 eV respectively,
again pointing to an inclusion complex in the substrate-bound dimer.
Determination of Ωexp using IMS
Using IMS allows for the determination of Ωexp which provides a structural facet to
explain energetic observations. The Ωexp was calculated as an average value from four different
instrumental combinations of wave velocity and wave height. The results are listed in Table 3.
Figure 8 shows the ATD of 1:1 -CD to Ibu/PDDA complexes: the central distribution (*)
corresponds to [β-CD-H+]-1 which is present in both solutions and has the same ATD indicating
that the instrumental conditions were equivalent. Peak II in Figs. 8a,b correspond to [β-CD+Ibu–
H+]-1 and [β-CD+PDDA–H+]-1, respectively. [β-CD+Ibu–H+]-1 has a shorter drift time than [β-
CD+PDDA–H+]-1 which is reflected by their Ωexp of 220 ± 5 Å2 and 223 ± 5 Å2, respectively.
Although the difference is only 3 Å2, a larger Ωexp for the PDDA complex is consistently obtained
at different IMS settings. The difference in the Ωexp of the substrate bound complexes to the
13
unbound [β-CD–H+]-1 is defined here as “∆Ωexp” and corresponds to the increase in Ωexp caused
by the substrate and/or induced conformational changes by complexation. The ∆Ωexp of Ibu and
PDDA are +21 Å2 and +24 Å2, respectively. This suggests that Ibu and PDDA are not
completely contained within the inner cavity of β-CD.
In contrast to the 1:1 complexes, the drift time of [(β-CD)2+Ibu–2H+]-2 is consistently
longer than that of [(β-CD)2+PDDA–2H+]-2 (Figure 8, peak I) even though PDDA is a longer
molecule than Ibu. This is reflected in the Ωexp of 370 ± 3 Å2 and 366 ± 3 Å2 for [(β-CD)2–
2H+Ibu]-2 and [(β-CD)2–2H+PDDA]-2, respectively (Table 3). The ∆Ωexp between the bound to
the unbound (β-CD)2 is therefore a modest 15 Å2and 11 Å2 for Ibu and PDDA, respectively.
This suggests that the substrates are less exposed than when they are bound to a single β-CD. A
major structural difference between Ibu and PDDA is the additional carboxylic acid of PDDA.
Substrate interactions with CD in the gas phase are driven predominately through electrostatic
interactions, and both carboxylic group of PDDA are likely forming hydrogen bonds with each
β-CD, resulting in a slightly tighter conformation.
14
Conclusion
β-CD dimers alone and in complexes with PDDA or Ibu were studied in order to develop
an approach to generate breakdown diagrams when there is m/z overlap of the reactant ion
and/or fragment ions. ESI-IMS was used to prior to MS/MS in order to deconvolute m/z spectral
overlap that occurs in the dissociation of doubly deprotonated dimers [(β-CD)2-2H]-2. When the
fragment ions have identical m/z as the reactant ion, breakdown diagrams were generated by
monitoring the relative abundance of fragment ions through changes in the isotopic profile. This
allowed for RRKM fitting of the breakdown diagram and the E0 and ∆S‡ values for the
dissociation to be obtained, providing insight into the different dissociation reactions. The
RRKM derived E0 and ∆S‡ values for the dissociation of [(β-CD)2-H+]-1 and [(β-CD)2-2H+]-2 were
virtually identical indicating similar simple bond cleavage reactions in each case. The E 0 for the
loss of a β-CD from the [(β-CD)2+substrate-2H+]-2 complex was 1.4 ± 0.1 eV and 1.5 ± 0.1 eV
for Ibu and PDDA respectively, which suggests that substrate binding decreases the (β-CD)-(β-
CD) binding within the complex. Ωexp values were derived from ion mobility arrival time
distributions using calibrants. The increase of Ωexp upon binding of Ibu and PDDA to [β-CD-H+]-
1 was 21 Å2 and 24 Å2, while Ibu and PDDA binding to [(β-CD)2-2H+]-2 resulted in smaller cross-
section increases of 15 Å2 and 11 Å2, respectively, suggesting that the neutral drugs are indeed
bound as inclusion complexes within both β-CD moieties. This experimental approach which
relies on the incorporation of IMS, MS/MS and isotopic profile modelling could be applied to the
investigation of other multimeric complexes where this type of spectral overlap occurs.
15
16
References
(1) Gabelica, V.; Galic, N.; De Pauw, E. J. Am. Soc. Mass. Spectrom. 2002, 13, 8, 946-953.(2) Gabelica, V.; Galic, N.; Rosu, F.; Houssier, C.; De Pauw, E. J. Mass Spectrom. 2003, 38, 5, 491-501.(3) Lebrilla, C. B. Acc. Chem. Res. 2001, 34, 8, 653-661.(4) Li, Z.; Couzijn, E. P.; Zhang, X. J. Phys Chem. B. 2012, 116, 3, 943-950.(5) Loftsson, T.; Masson, M.; Brewster, M. E. J. Pharm. Sci. 2004, 93, 5, 1091-1099.(6) Liu, Y.; Li, L.; Zhang, H.-Y.; Fan, Z.; Guan, X.-D. Bioorg Chem. 2003, 31, 1, 11-23.(7) Wen, X.; Liu, Z.; Zhu, T.; Zhu, M.; Jiang, K.; Huang, Q. Bioorg Chem. 2004, 32, 4, 223-233.(8) Mayer, P. M.; Martineau, E. Phys. Chem. Chem. Phys.. 2011, 13, 11, 5178-5186.(9) Renaud, J. B.; Martineau, E.; Mironov, G. G.; Berezovski, M. V.; Mayer, P. M. Phys. Chem. Chem. Phys. 2012, 14, 1, 165-172.(10) Kralj, B.; Šmidovnik, A.; Kobe, J. Rapid Commun. Mass Spectrom. 2009, 23, 1, 171-180.(11) Hamilton, J. V.; Renaud, J. B.; Mayer, P. M. Rapid Commun. Mass Spectrom. 2012, 26, 14, 1591-1595.(12) Hoaglund, C. S.; Liu, Y.; Ellington, A. D.; Pagel, M.; Clemmer, D. E. J. Am. Chem. Soc.. 1997, 119, 38, 9051-9052.(13) Smith, D. P.; Knapman, T. W.; Campuzano, I.; Malham, R. W.; Berryman, J. T.; Radforda, S. E.; Ashcrofta, A. E. Eur. J. Mass Spectrom. 2009, 15, 13, 113-130.(14) Dewar, M. J.; Zoebisch, E. G.; Healy, E. F.; Stewart, J. J. J. Am. Chem. Soc. 1985, 107, 13, 3902-3909.(15) Frisch, M. J.; Trucks, G. W.; Schlegel, H. B.; Scuseria, G. E.; Robb, M. A.; Cheeseman, J. R.; Scalmani, G.; Barone, V.; Mennucci, B.; Petersson, G. A.; Nakatsuji, H.; Caricato, M.; Li, X.; Hratchian, H. P.; Izmaylov, A. F.; Bloino, J.; Zheng, G.; Sonnenberg, J. L.; Hada, M.; Ehara, M.; Toyota, K.; Fukuda, R.; Hasegawa, J.; Ishida, M.; Nakajima, T.; Honda, Y.; Kitao, O.; Nakai, H.; Vreven, T.; Montgomery, J. A.; Peralta, J. E.; Ogliaro, F.; Bearpark, M.; Heyd, J. J.; Brothers, E.; Kudin, K. N.; Staroverov, V. N.; Kobayashi, R.; Normand, J.; Raghavachari, K.; Rendell, A.; Burant, J. C.; Iyengar, S. S.; Tomasi, J.; Cossi, M.; Rega, N.; Millam, J. M.; Klene, M.; Knox, J. E.; Cross, J. B.; Bakken, V.; Adamo, C.; Jaramillo, J.; Gomperts, R.; Stratmann, R. E.; Yazyev, O.; Austin, A. J.; Cammi, R.; Pomelli, C.; Ochterski, J. W.; Martin, R. L.; Morokuma, K.; Zakrzewski, V. G.; Voth, G. A.; Salvador, P.; Dannenberg, J. J.; Dapprich, S.; Daniels, A. D.; Farkas, Ö.; Foresman, J. B.; Ortiz, J. V.; Cioslowski, J.; Fox, D. J. Inc., Wallingford, CT. 2009, GAUSSIAN 09.(16) Beyer, T.; Swinehart, D. Commun. ACM. 1973, 16, 6, 379.(17) Baer, T.; Mayer, P. M. J. Am. Soc. Mass. Spectrom. 1997, 8, 2, 103-115.(18) Mironov, G. G.; Logie, J.; Okhonin, V.; Renaud, J. B.; Mayer, P. M.; Berezovski, M. V. J. Am. Soc. Mass. Spectrom. 2012, 23, 7, 1232-1240.(19) Muñoz De La Peña, A.; Ndou, T.; Zung, J.; Warner, I. J. Phys. Chem. 1991, 95, 8, 3330-3334.
17
Tables
Table 1. RRKM derived E0 and ∆S‡ values for the dissociation of [(β-CD)2 –nH+]-n
Parent Ion Dissociation E0
(eV)
∆S‡
(J K-1mol-1)
[(β-CD)2-H+]-1 -[β-CD]0 1.9 ± 0.1 53 ± 16
[(β-CD)2-2H+]-2 -[β-CD]-1 1.8 ± 0.1 54 ± 19
Table 2. RRKM derived energetic values for the dissociation of [(β-CD)2+substrate-2H+] complexes
Parent Ion Dissociation E0
(eV)
∆S‡
(J K-1mol-1)
[(β-CD)2+Ibu-2H+]-2 -[β-CD]-1 1.4 ± 0.1 25 ± 10
[(β-CD)2+Ibu-2H+]-2 -[Ibu]0 1.1 ± 0.1 0 ± 11
[(β-CD)2+PDDA-2H+]-2 -[β-CD]-1 1.5 ± 0.1 38 ± 9
[(β-CD)2+PDDA-2H+]-2 -[PDDA]0 1.1 ± 0.1 -18 ± 10
Table 3. Ωexp of β-CD and (β-CD+substrate) complexes measured with TWIMS
18
Error represents standard deviation between four combinations of travelling wave velocity and height. Absolute error is 8%.
Complex Ωexp (Å2)
[β-CD-H+]-1 199 ± 2
[β-CD+Ibu-H+]-1 220 ± 5
[β-CD+PDDA-H+]-1 223 ± 5
[(β-CD)2-2H+]-2 355 ± 2
[(β-CD)2+Ibu-2H+]-2 370 ± 3
[(β-CD)2+PDDA-2H+]-2 366 ± 3
19
Figure captions
Figure 1. ESI-MS of 40 μM β-CD solution(a) ESI-MS of 40 μM β-CD solution. Multiple adducts β-CD and multimeric complexes are observed and (b) the most prominent peak at 1133.4 m/z is a combination of [(β-CD)2 -2H+]-2 and [β-CD-H+]-1(*)as seen by the staggered isotope distribution
Figure 2. ESI-MS of 40 μM β-CD with 20 μM (a) Ibu and (b) PDDA[β-CD+substrate-H+]-1 and [(β-CD)2+substrate-2H+]-2 are observed for both compounds.
Figure 3. Arrival time distribution of mass selected 1130-1340 m/z(a) Arrival time distribution of mass selected 1130-1340 m/z showing two distributions. (b) The fastest arrival distribution I corresponds to [(β-CD)2-2H+]-2 and (c) arrival distribution II corresponds to [β-CD-H+]-1
Figure 4. Change in isotope profile during MS/MS of [(β-CD)2 -2H+]-2 post IMS separationChange in isotope profile during MS/MS of [(β-CD)2-2H+]-2 post IMS separation. (a) at Elab of 20 eV, signal is exclusively [(β-CD)2-2H+]-2 (b) Elab of 35 eV is a mixture of [(β-CD)2-2H+]-2 and [β-CD –H+]-2 and (c) Elab of 50 eV results in complete dissociation of [(β-CD)2-2H+]-2
Figure 5. Experimental breakdown diagrams for (a) [(β-CD)2-2H+]-2 (×) and [(β-CD)2-H+]-1 (□).
Figure 6. ESI-MS/MS of [(β-CD)2-2H+substrate]-2 for (a) Ibu and (b) PDDA at Elab 20 eV. Main fragmentation path is the loss of neutral substrate yielding [(β-CD)2-2H]-2 and minor pathway is the loss of [β-CD-H+]-1 yielding [β-CD-H + substrate]-1
Figure 7. RRKM fitted breakdown diagrams of (a) [(β-CD)2+Ibu-2H+]-2 and (b) [(β-CD)2+PDDA-2H+]-2. The two dissociation channels are the neutral loss of substrate (○) or loss of [β-CD -H+]-1 (∆). Dashed lines indicate best RRKM fit to data.
Figure 8. Extracted arrival time distributions from β-CD mixed with (a) ibuprofen and (b) PDDA. The [β-CD-H+]-1 (*) arrival times in both solutions were identical (3.88 ms). ATDs of I [(β-CD)2 + substrate-2H+] -2 are 3.16 and 2.98 ms for Ibu and PDDA, respectively. ATDs of II [β-CD + substrate-H+]-1 are 5.14 and 5.16 ms for Ibu and PDDA, respectively
20