Embed Size (px)
Citation preview
1
This module explains how to use TEPHRA2
Authors: Laura Connor, Chuck Connor
University of South Florida, Tampa
Tephra2 is open source software Manual by: Leah Courtland
Tephra2 uses the advection-diffusion equation to
calculate tephra accumulation at locations about a
volcano based on a pre-defined set of eruptive conditions.
Photo by P.C. LaFemina
Tephra2 Manual
Tephra2
2
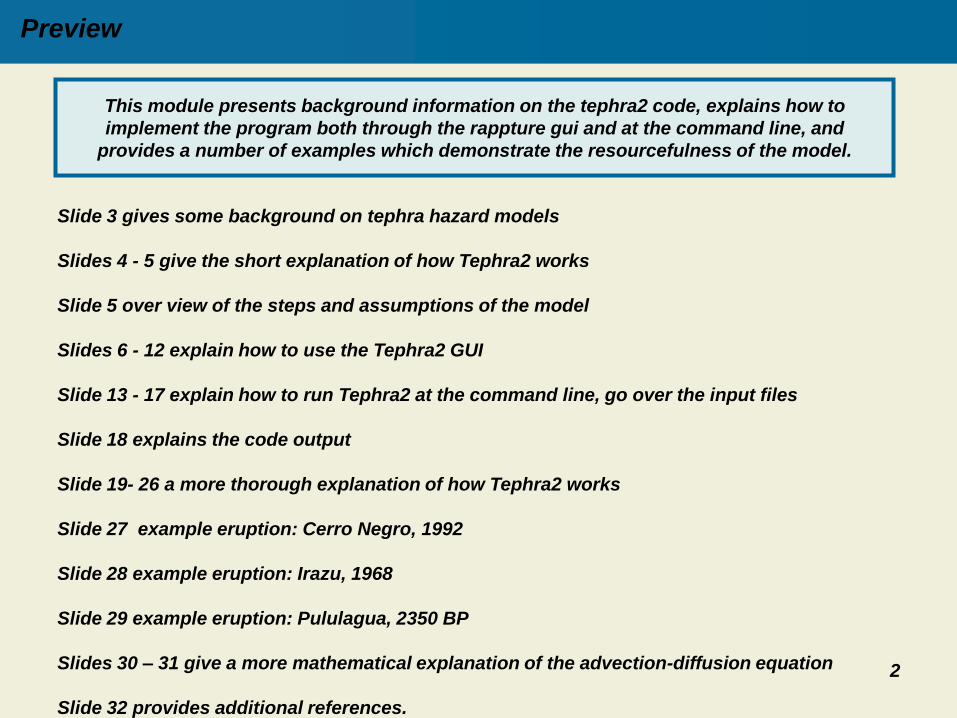
Slide 3 gives some background on tephra hazard models
Slides 4 - 5 give the short explanation of how Tephra2 works
Slide 5 over view of the steps and assumptions of the model
Slides 6 - 12 explain how to use the Tephra2 GUI
Slide 13 - 17 explain how to run Tephra2 at the command line, go over the input files
Slide 18 explains the code output
Slide 19- 26 a more thorough explanation of how Tephra2 works
Slide 27 example eruption: Cerro Negro, 1992
Slide 28 example eruption: Irazu, 1968
Slide 29 example eruption: Pululagua, 2350 BP
Slides 30 – 31 give a more mathematical explanation of the advection-diffusion equation
Slide 32 provides additional references.
Preview
This module presents background information on the tephra2 code, explains how to
implement the program both through the rappture gui and at the command line, and
provides a number of examples which demonstrate the resourcefulness of the model.
3
Background
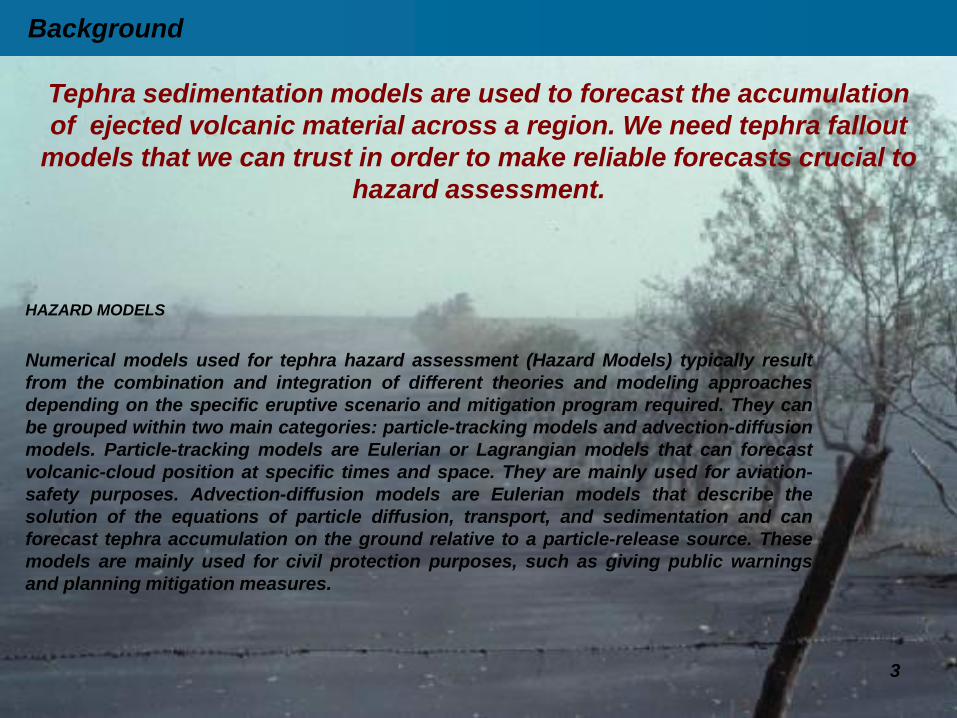
HAZARD MODELS
Numerical models used for tephra hazard assessment (Hazard Models) typically result
from the combination and integration of different theories and modeling approaches
depending on the specific eruptive scenario and mitigation program required. They can
be grouped within two main categories: particle-tracking models and advection-diffusion
models. Particle-tracking models are Eulerian or Lagrangian models that can forecast
volcanic-cloud position at specific times and space. They are mainly used for aviation-
safety purposes. Advection-diffusion models are Eulerian models that describe the
solution of the equations of particle diffusion, transport, and sedimentation and can
forecast tephra accumulation on the ground relative to a particle-release source. These
models are mainly used for civil protection purposes, such as giving public warnings
and planning mitigation measures.
Tephra sedimentation models are used to forecast the accumulation
of ejected volcanic material across a region. We need tephra fallout
models that we can trust in order to make reliable forecasts crucial to
hazard assessment.
4
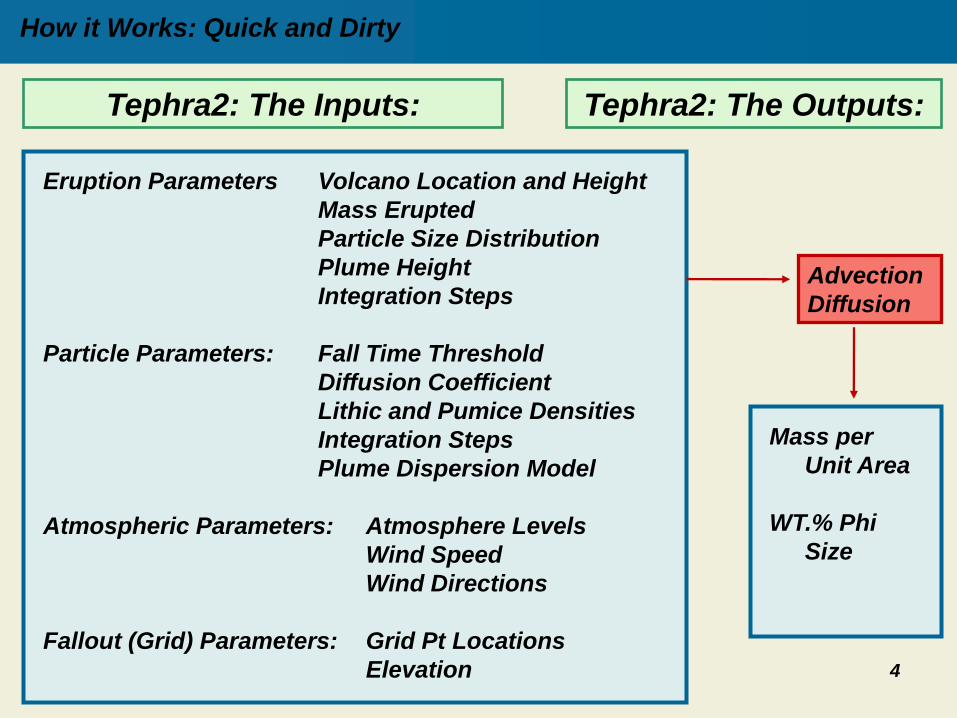
How it Works: Quick and Dirty
Tephra2: The Inputs:
Eruption Parameters Volcano Location and Height
Mass Erupted
Particle Size Distribution
Plume Height
Integration Steps
Particle Parameters: Fall Time Threshold
Diffusion Coefficient
Lithic and Pumice Densities
Integration Steps
Plume Dispersion Model
Atmospheric Parameters: Atmosphere Levels
Wind Speed
Wind Directions
Fallout (Grid) Parameters: Grid Pt Locations
Elevation
Mass per
Unit Area
WT.% Phi
Size
Tephra2: The Outputs:
Advection
Diffusion
5
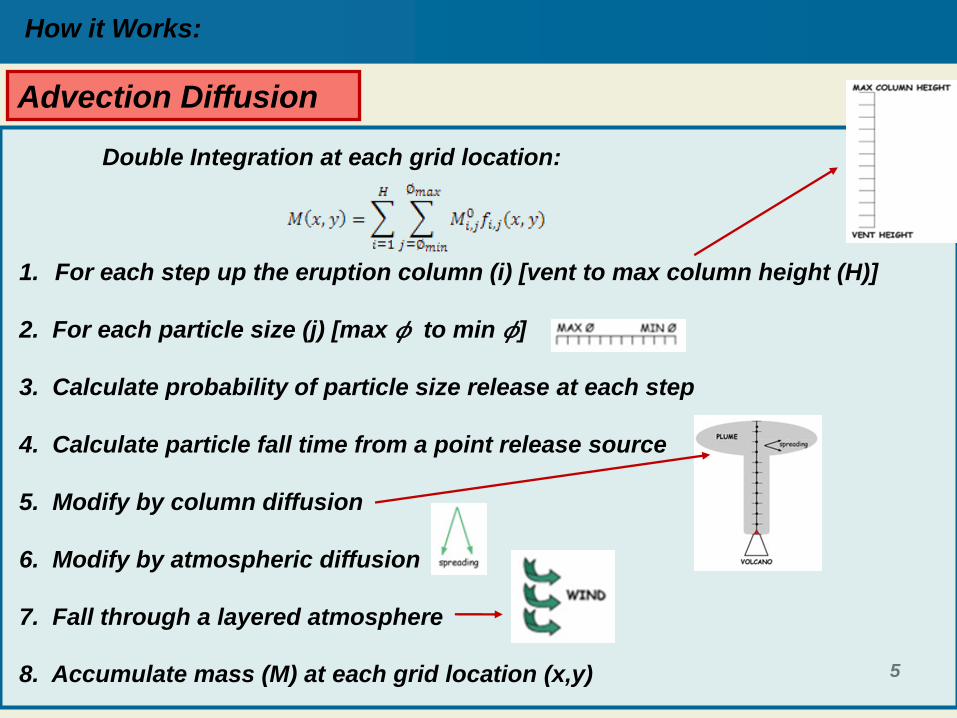
How it Works:
Double Integration at each grid location:
1. For each step up the eruption column (i) [vent to max column height (H)]
2. For each particle size (j) [max 𝜙 to min 𝜙]
3. Calculate probability of particle size release at each step
4. Calculate particle fall time from a point release source
5. Modify by column diffusion
6. Modify by atmospheric diffusion
7. Fall through a layered atmosphere
8. Accumulate mass (M) at each grid location (x,y)
Advection Diffusion
6
Once you have launched the Tephra2 Tool, simply:
Running Tephra2: the GUI: Quick and Dirty Version
Load a wind file
Load a grid file
Load a config file OR input config values into the GUI
Press ‘Simulate’
7
Running Tephra2 : GUI : Input
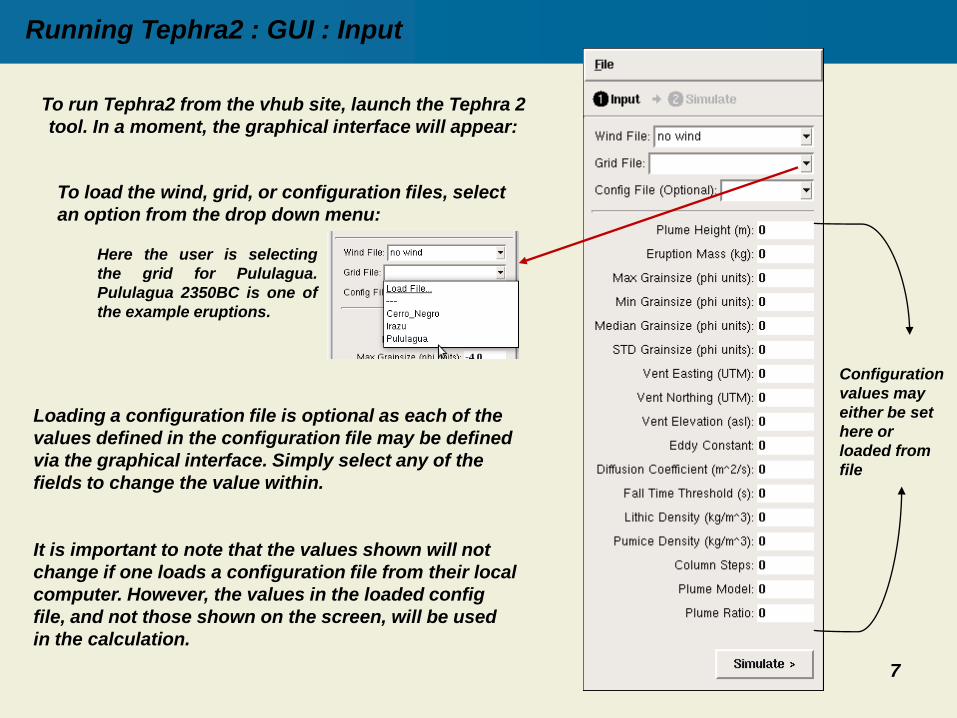
To run Tephra2 from the vhub site, launch the Tephra 2
tool. In a moment, the graphical interface will appear:
To load the wind, grid, or configuration files, select
an option from the drop down menu:
Here the user is selecting
the grid for Pululagua.
Pululagua 2350BC is one of
the example eruptions.
Loading a configuration file is optional as each of the
values defined in the configuration file may be defined
via the graphical interface. Simply select any of the
fields to change the value within.
It is important to note that the values shown will not
change if one loads a configuration file from their local
computer. However, the values in the loaded config
file, and not those shown on the screen, will be used
in the calculation.
Configuration
values may
either be set
here or
loaded from
file
8
Running Tephra2 : GUI : Input
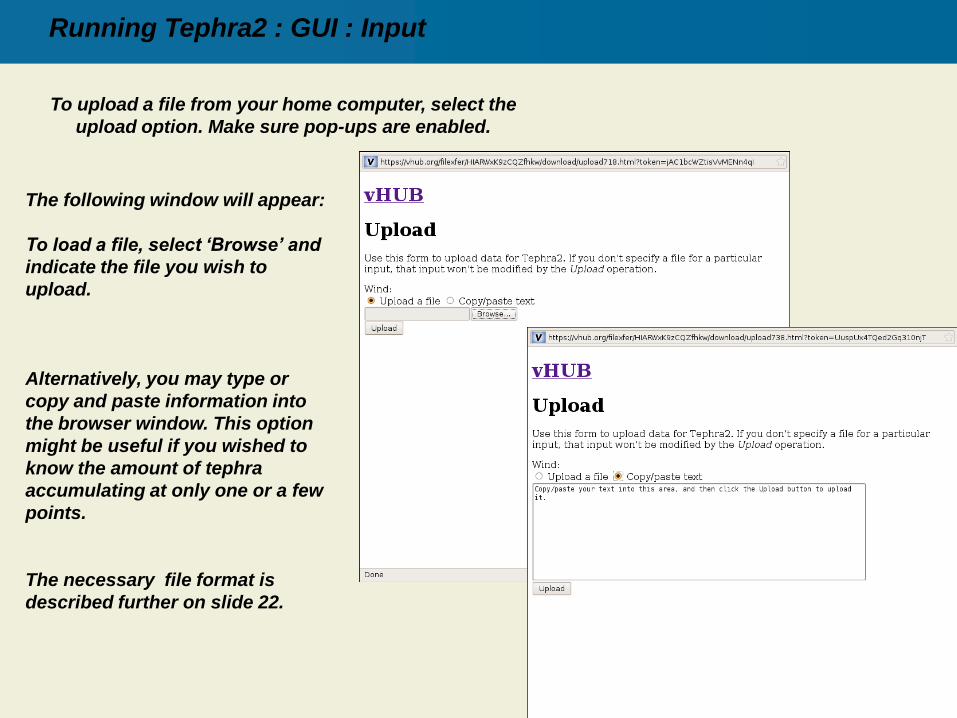
To upload a file from your home computer, select the
upload option. Make sure pop-ups are enabled.
The following window will appear:
To load a file, select ‘Browse’ and
indicate the file you wish to
upload.
Alternatively, you may type or
copy and paste information into
the browser window. This option
might be useful if you wished to
know the amount of tephra
accumulating at only one or a few
points.
The necessary file format is
described further on slide 22.
9
Running Tephra2 : GUI : Simulation
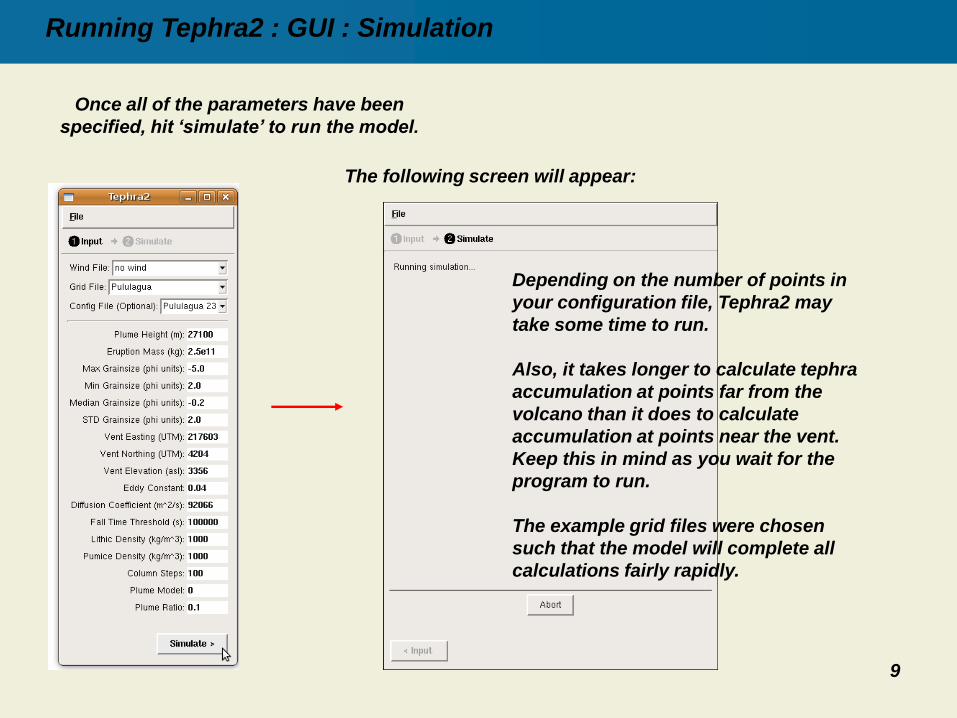
Once all of the parameters have been
specified, hit ‘simulate’ to run the model.
Depending on the number of points in
your configuration file, Tephra2 may
take some time to run.
Also, it takes longer to calculate tephra
accumulation at points far from the
volcano than it does to calculate
accumulation at points near the vent.
Keep this in mind as you wait for the
program to run.
The example grid files were chosen
such that the model will complete all
calculations fairly rapidly.
The following screen will appear:
10
Running Tephra2 : GUI : Output
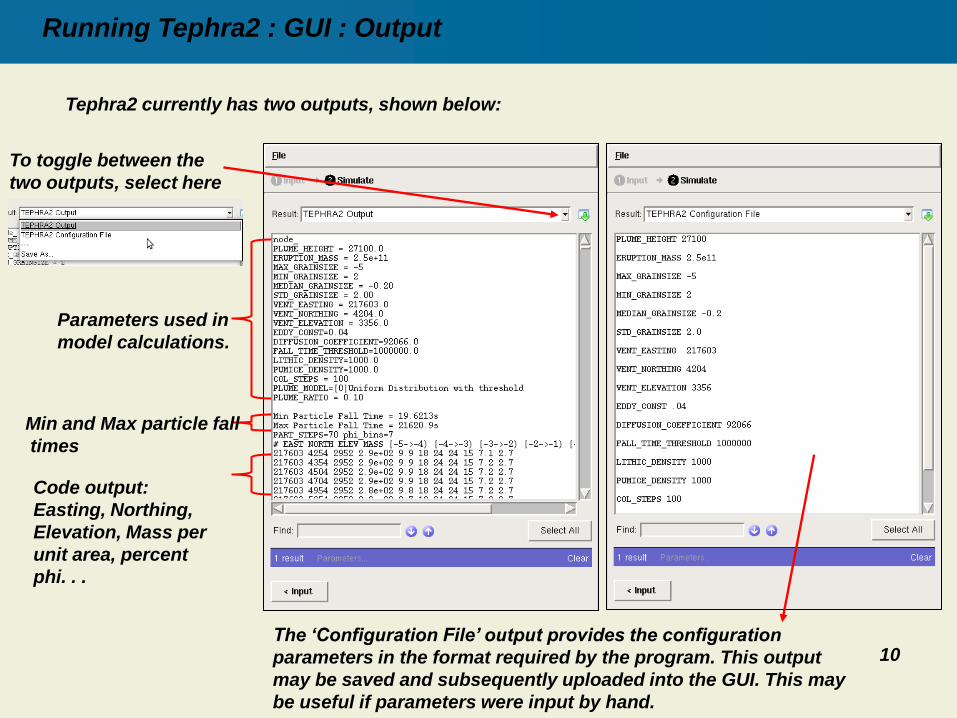
Tephra2 currently has two outputs, shown below:
To toggle between the
two outputs, select here
Parameters used in
model calculations.
Min and Max particle fall
times
Code output:
Easting, Northing,
Elevation, Mass per
unit area, percent
phi. . .
The ‘Configuration File’ output provides the configuration
parameters in the format required by the program. This output
may be saved and subsequently uploaded into the GUI. This may
be useful if parameters were input by hand.
11
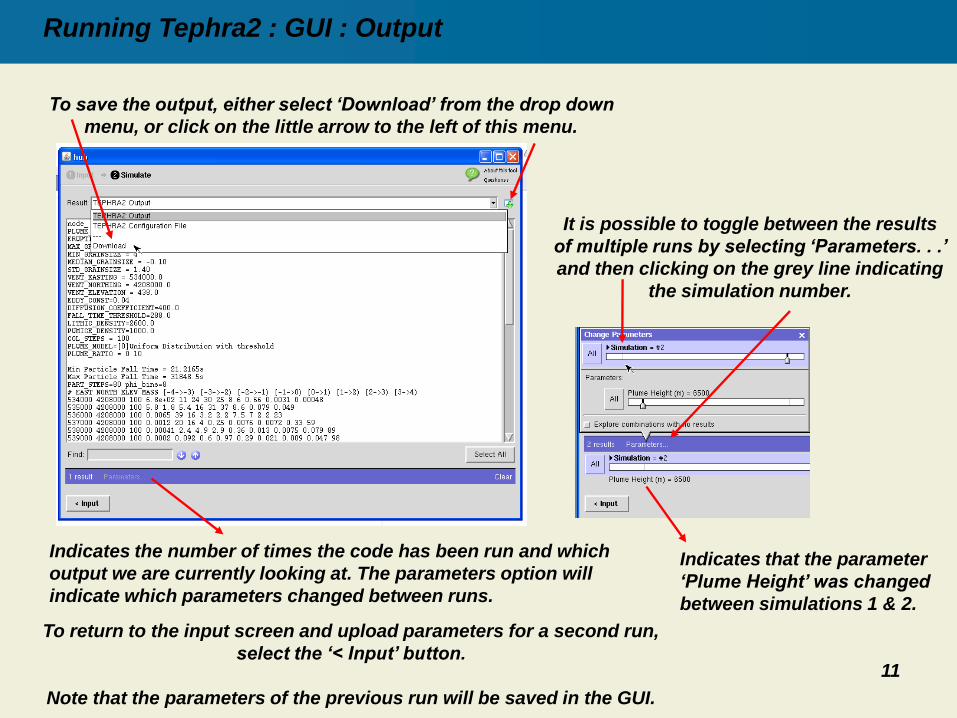
Running Tephra2 : GUI : Output
To save the output, either select ‘Download’ from the drop down
menu, or click on the little arrow to the left of this menu.
To return to the input screen and upload parameters for a second run,
select the ‘< Input’ button.
Note that the parameters of the previous run will be saved in the GUI.
It is possible to toggle between the results
of multiple runs by selecting ‘Parameters. . .’
and then clicking on the grey line indicating
the simulation number.
Indicates the number of times the code has been run and which
output we are currently looking at. The parameters option will
indicate which parameters changed between runs.
Indicates that the parameter
‘Plume Height’ was changed
between simulations 1 & 2.
12
Running Tephra2: the GUI
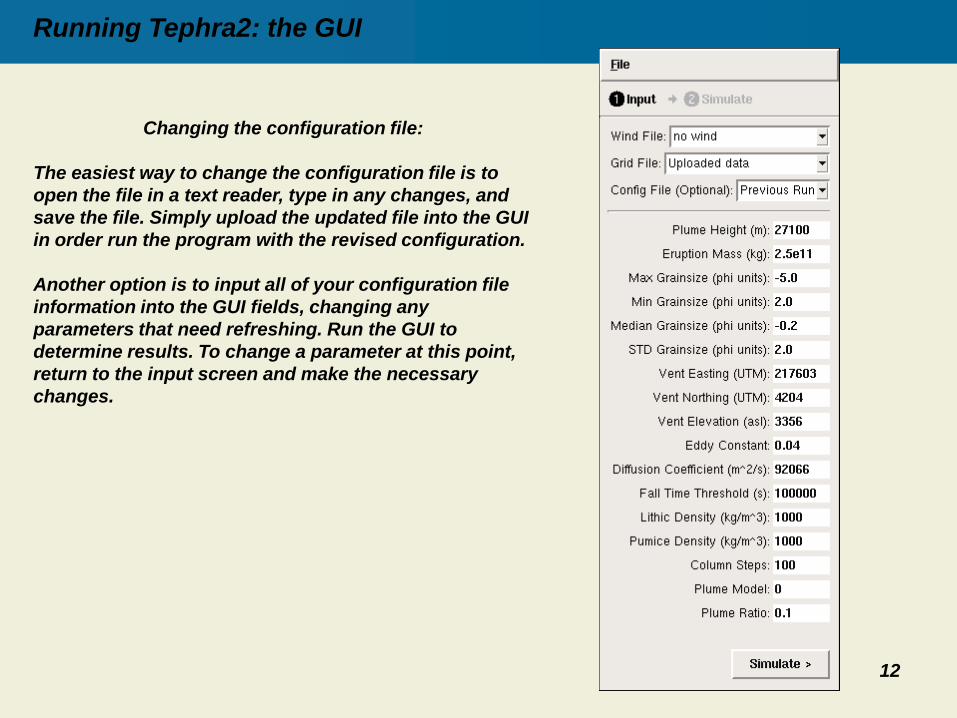
Changing the configuration file:
The easiest way to change the configuration file is to
open the file in a text reader, type in any changes, and
save the file. Simply upload the updated file into the GUI
in order run the program with the revised configuration.
Another option is to input all of your configuration file
information into the GUI fields, changing any
parameters that need refreshing. Run the GUI to
determine results. To change a parameter at this point,
return to the input screen and make the necessary
changes.
13
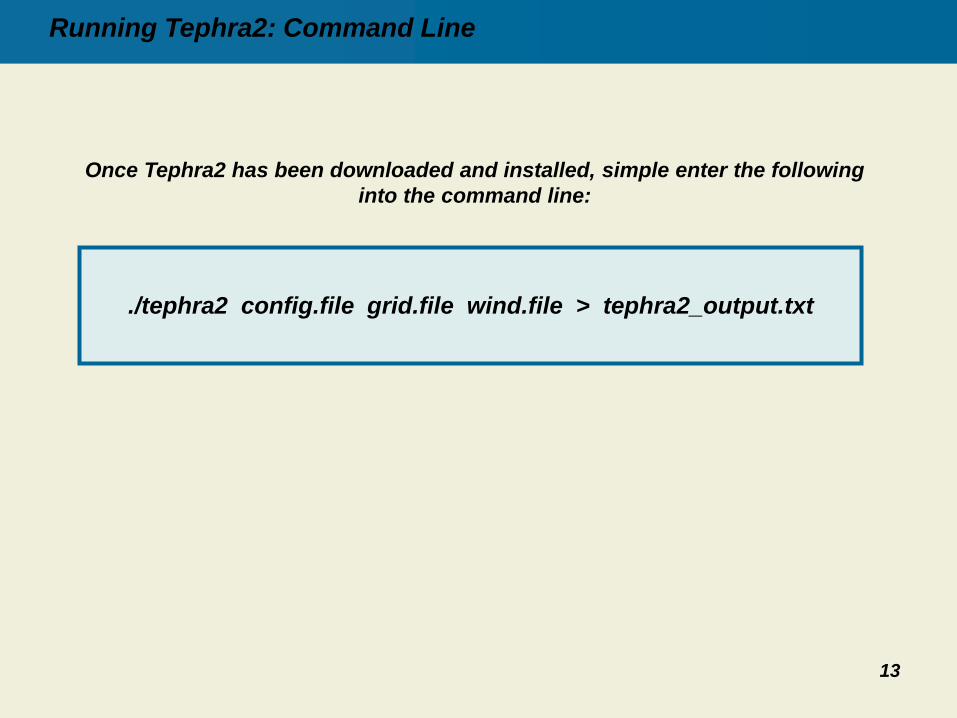
Once Tephra2 has been downloaded and installed, simple enter the following
into the command line:
Running Tephra2: Command Line
./tephra2 config.file grid.file wind.file > tephra2_output.txt
14
Running Tephra 2: Command Line: Input
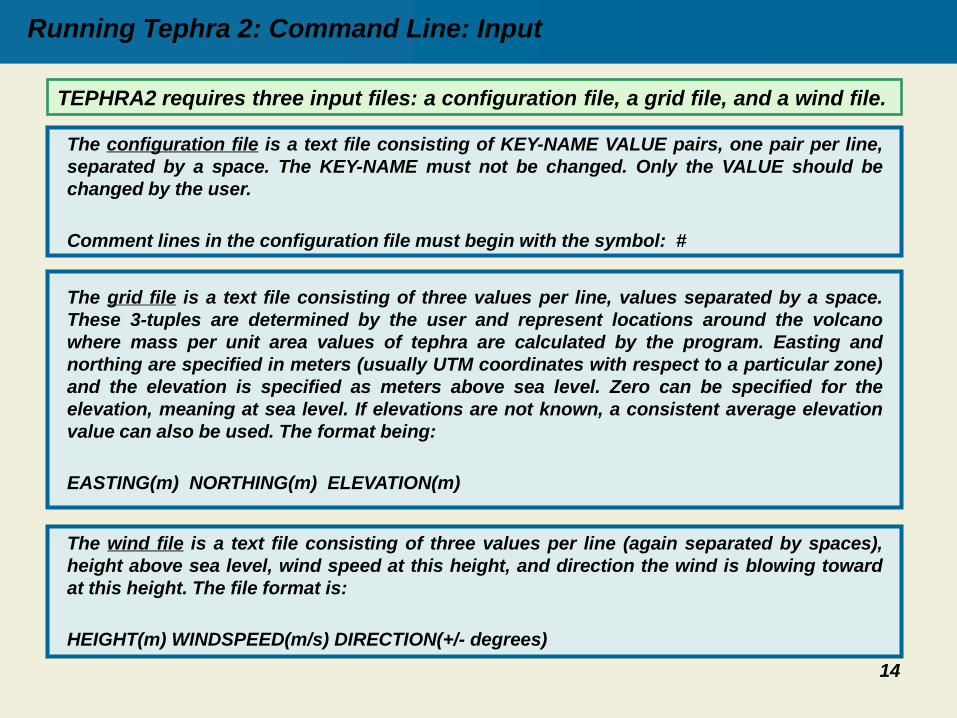
The configuration file is a text file consisting of KEY-NAME VALUE pairs, one pair per line,
separated by a space. The KEY-NAME must not be changed. Only the VALUE should be
changed by the user.
Comment lines in the configuration file must begin with the symbol: #
TEPHRA2 requires three input files: a configuration file, a grid file, and a wind file.
The grid file is a text file consisting of three values per line, values separated by a space.
These 3-tuples are determined by the user and represent locations around the volcano
where mass per unit area values of tephra are calculated by the program. Easting and
northing are specified in meters (usually UTM coordinates with respect to a particular zone)
and the elevation is specified as meters above sea level. Zero can be specified for the
elevation, meaning at sea level. If elevations are not known, a consistent average elevation
value can also be used. The format being:
EASTING(m) NORTHING(m) ELEVATION(m)
The wind file is a text file consisting of three values per line (again separated by spaces),
height above sea level, wind speed at this height, and direction the wind is blowing toward
at this height. The file format is:
HEIGHT(m) WINDSPEED(m/s) DIRECTION(+/- degrees)
15
Configuration File
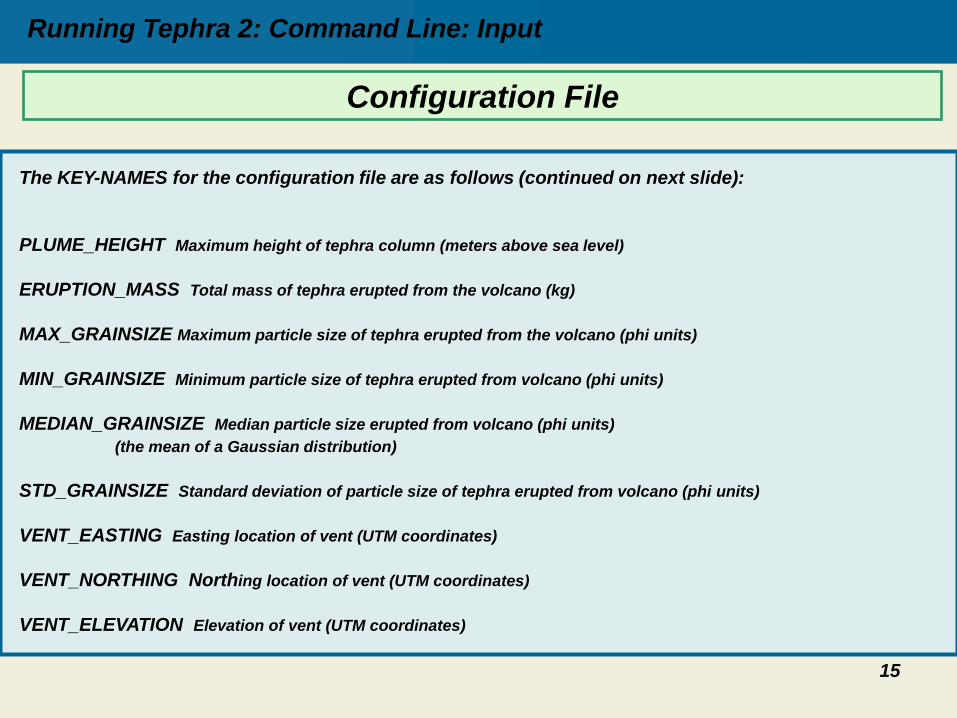
The KEY-NAMES for the configuration file are as follows (continued on next slide):
PLUME_HEIGHT Maximum height of tephra column (meters above sea level)
ERUPTION_MASS Total mass of tephra erupted from the volcano (kg)
MAX_GRAINSIZE Maximum particle size of tephra erupted from the volcano (phi units)
MIN_GRAINSIZE Minimum particle size of tephra erupted from volcano (phi units)
MEDIAN_GRAINSIZE Median particle size erupted from volcano (phi units)
(the mean of a Gaussian distribution)
STD_GRAINSIZE Standard deviation of particle size of tephra erupted from volcano (phi units)
VENT_EASTING Easting location of vent (UTM coordinates)
VENT_NORTHING Northing location of vent (UTM coordinates)
VENT_ELEVATION Elevation of vent (UTM coordinates)
Running Tephra 2: Command Line: Input
16
Configuration File:
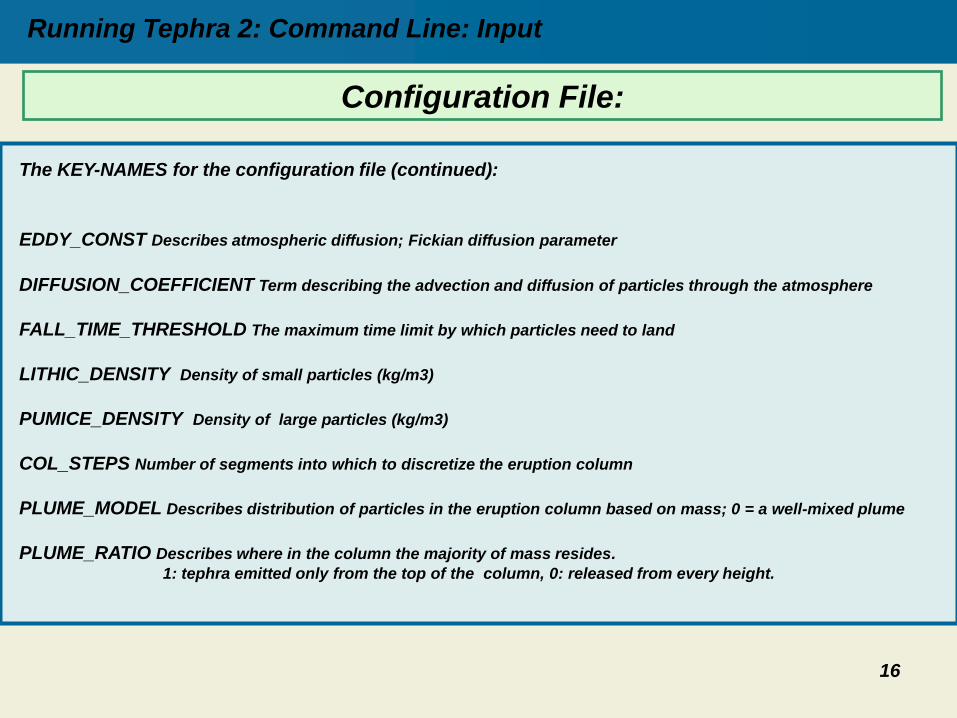
The KEY-NAMES for the configuration file (continued):
EDDY_CONST Describes atmospheric diffusion; Fickian diffusion parameter
DIFFUSION_COEFFICIENT Term describing the advection and diffusion of particles through the atmosphere
FALL_TIME_THRESHOLD The maximum time limit by which particles need to land
LITHIC_DENSITY Density of small particles (kg/m3)
PUMICE_DENSITY Density of large particles (kg/m3)
COL_STEPS Number of segments into which to discretize the eruption column
PLUME_MODEL Describes distribution of particles in the eruption column based on mass; 0 = a well-mixed plume
PLUME_RATIO Describes where in the column the majority of mass resides.
1: tephra emitted only from the top of the column, 0: released from every height.
Running Tephra 2: Command Line: Input
17
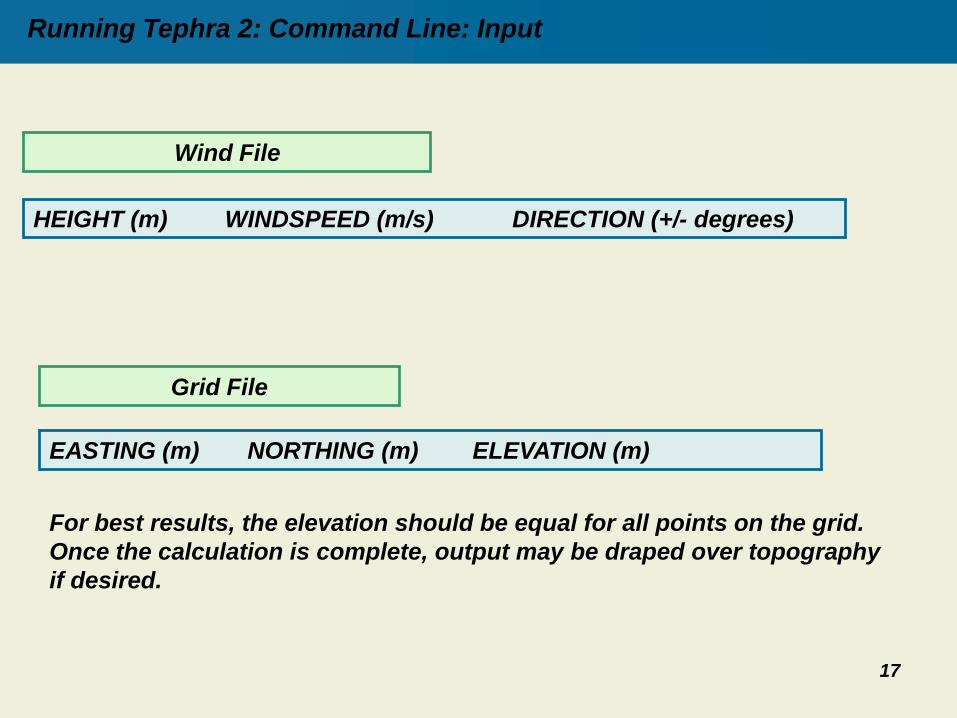
HEIGHT (m) WINDSPEED (m/s) DIRECTION (+/- degrees)
Wind File
Grid File
EASTING (m) NORTHING (m) ELEVATION (m)
For best results, the elevation should be equal for all points on the grid.
Once the calculation is complete, output may be draped over topography
if desired.
Running Tephra 2: Command Line: Input
18
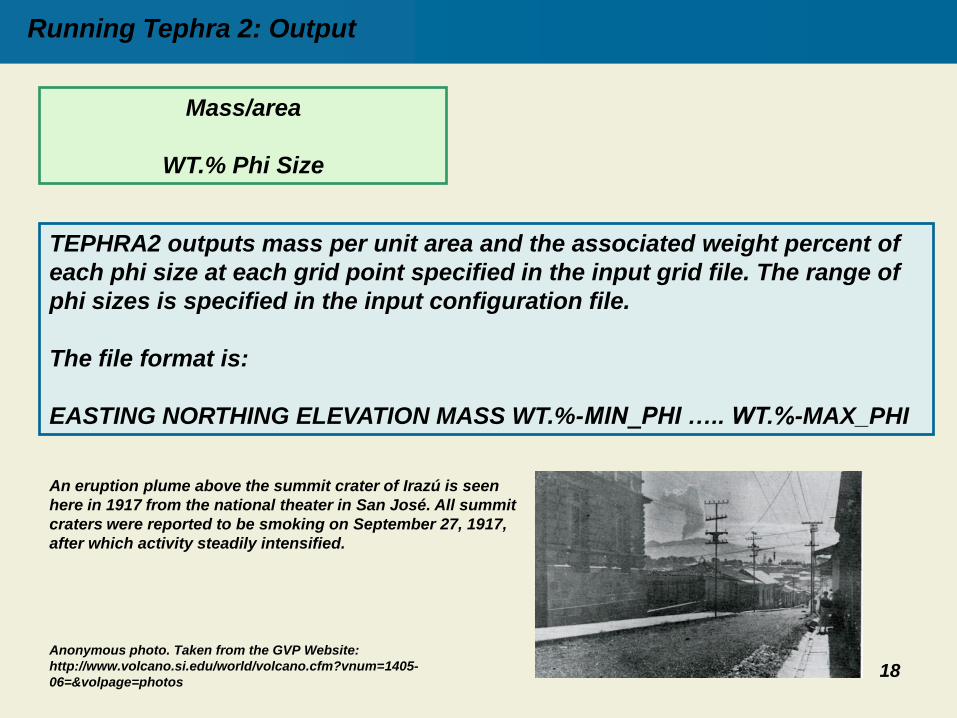
TEPHRA2 outputs mass per unit area and the associated weight percent of
each phi size at each grid point specified in the input grid file. The range of
phi sizes is specified in the input configuration file.
The file format is:
EASTING NORTHING ELEVATION MASS WT.%-MIN_PHI ….. WT.%-MAX_PHI
Mass/area
WT.% Phi Size
An eruption plume above the summit crater of Irazú is seen
here in 1917 from the national theater in San José. All summit
craters were reported to be smoking on September 27, 1917,
after which activity steadily intensified.
Anonymous photo. Taken from the GVP Website:
http://www.volcano.si.edu/world/volcano.cfm?vnum=1405-
06=&volpage=photos
Running Tephra 2: Output
19
Background
Eruption Column
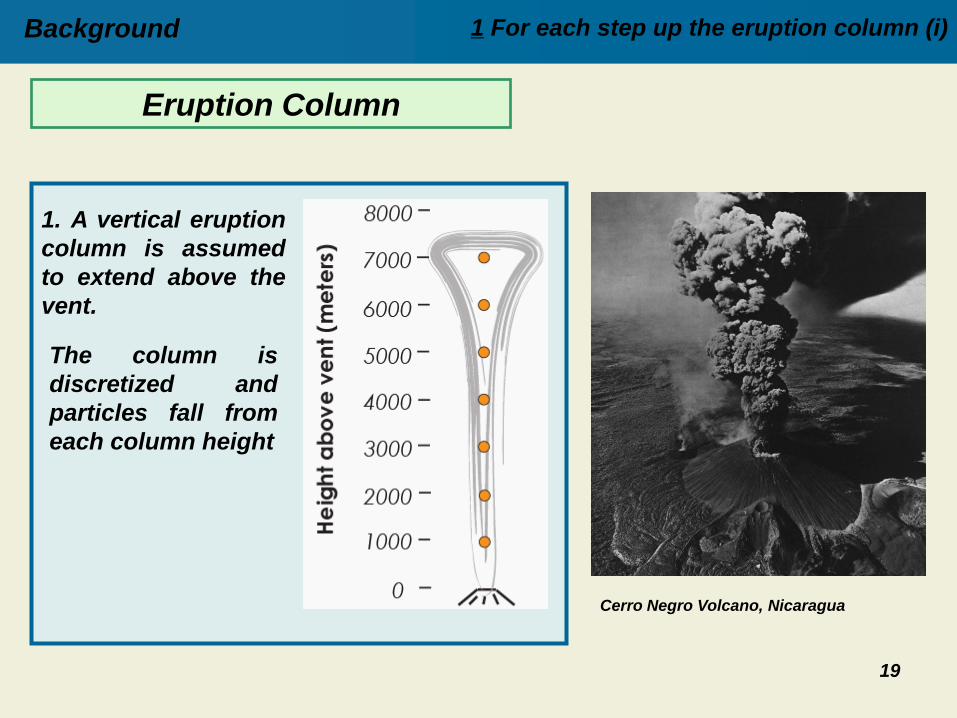
1. A vertical eruption
column is assumed
to extend above the
vent.
The column is
discretized and
particles fall from
each column height
Cerro Negro Volcano, Nicaragua
1 For each step up the eruption column (i)
20
Background
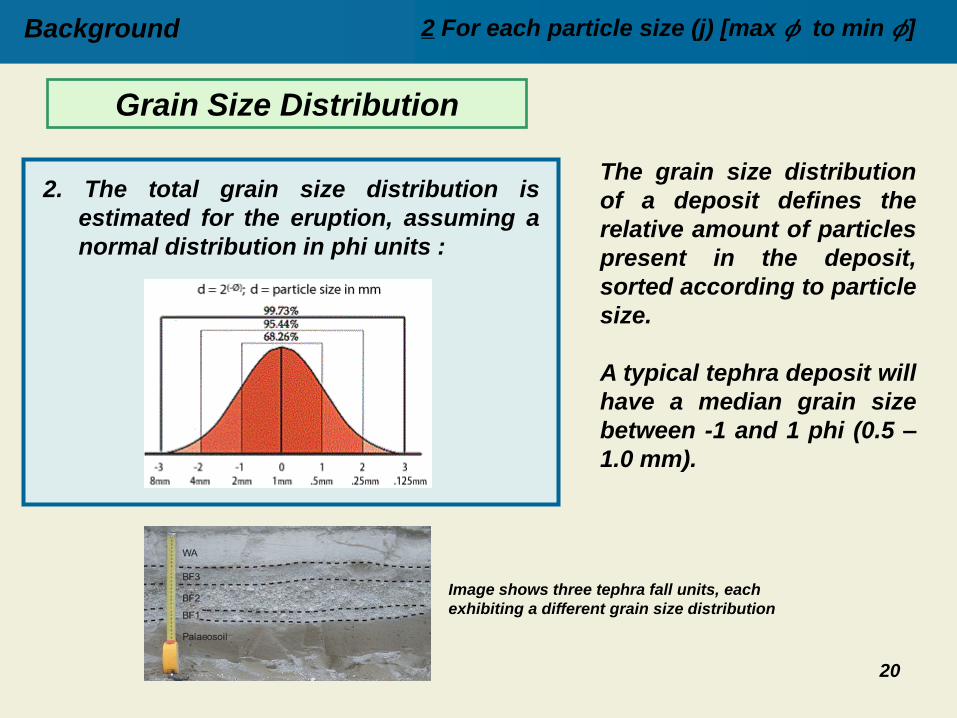
2. The total grain size distribution is
estimated for the eruption, assuming a
normal distribution in phi units :
Grain Size Distribution
The grain size distribution
of a deposit defines the
relative amount of particles
present in the deposit,
sorted according to particle
size.
A typical tephra deposit will
have a median grain size
between -1 and 1 phi (0.5 –
1.0 mm).
Image shows three tephra fall units, each
exhibiting a different grain size distribution
2 For each particle size (j) [max 𝜙 to min 𝜙]
21
Background
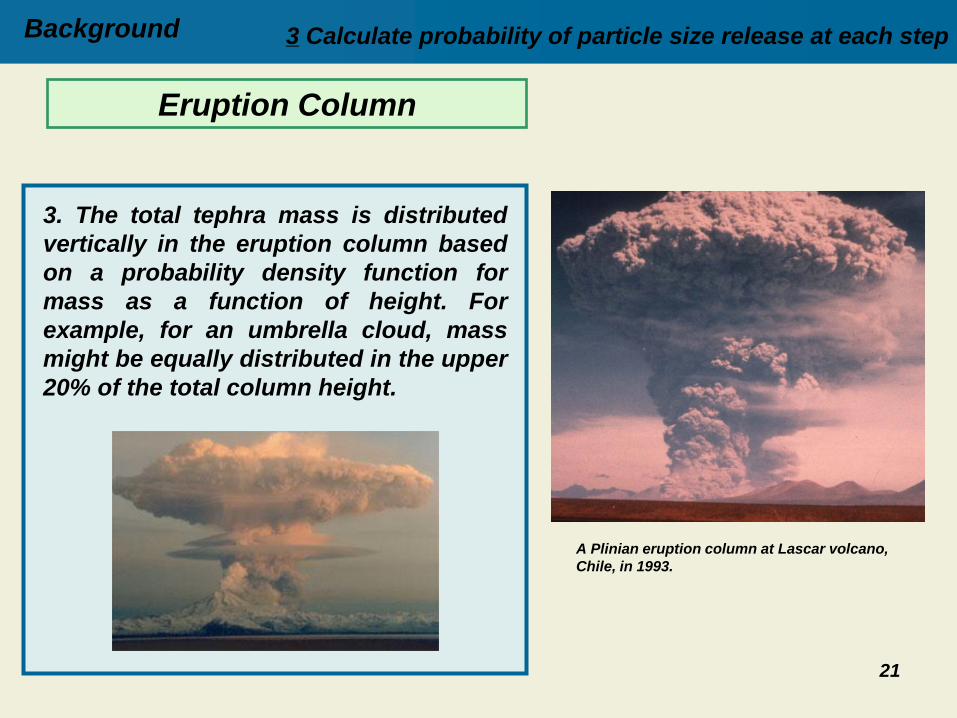
3. The total tephra mass is distributed
vertically in the eruption column based
on a probability density function for
mass as a function of height. For
example, for an umbrella cloud, mass
might be equally distributed in the upper
20% of the total column height.
Eruption Column
A Plinian eruption column at Lascar volcano,
Chile, in 1993.
3 Calculate probability of particle size release at each step
22
Background
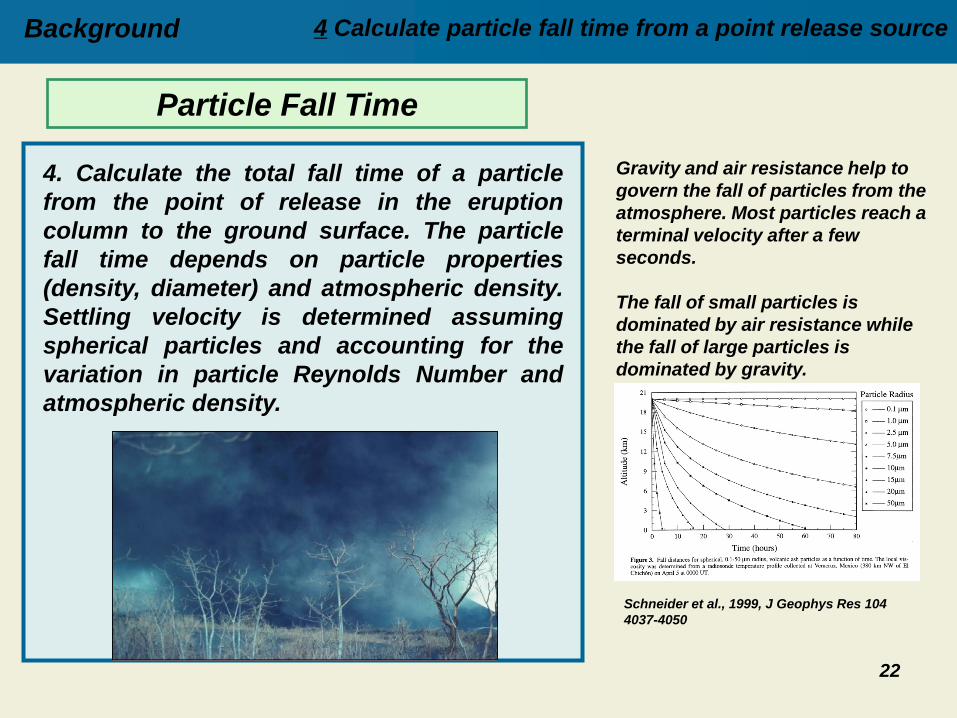
4. Calculate the total fall time of a particle
from the point of release in the eruption
column to the ground surface. The particle
fall time depends on particle properties
(density, diameter) and atmospheric density.
Settling velocity is determined assuming
spherical particles and accounting for the
variation in particle Reynolds Number and
atmospheric density.
Particle Fall Time
4 Calculate particle fall time from a point release source
Gravity and air resistance help to
govern the fall of particles from the
atmosphere. Most particles reach a
terminal velocity after a few
seconds.
The fall of small particles is
dominated by air resistance while
the fall of large particles is
dominated by gravity.
Schneider et al., 1999, J Geophys Res 104
4037-4050
23
Background
Eruption Column
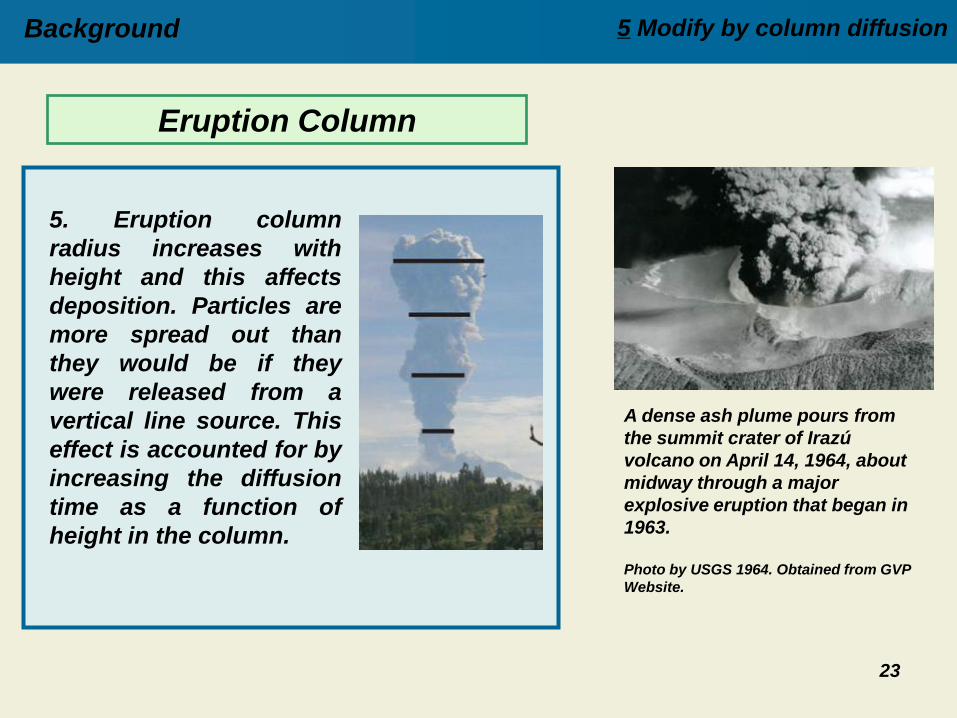
5. Eruption column
radius increases with
height and this affects
deposition. Particles are
more spread out than
they would be if they
were released from a
vertical line source. This
effect is accounted for by
increasing the diffusion
time as a function of
height in the column.
5 Modify by column diffusion
A dense ash plume pours from
the summit crater of Irazú
volcano on April 14, 1964, about
midway through a major
explosive eruption that began in
1963.
Photo by USGS 1964. Obtained from GVP
Website.
24
Background
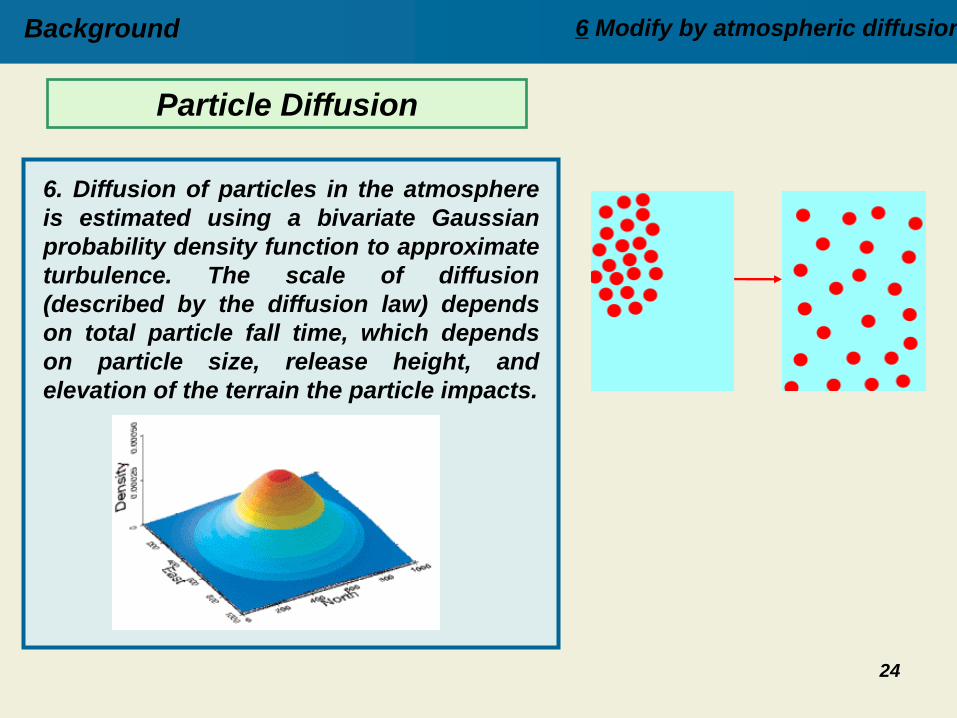
6. Diffusion of particles in the atmosphere
is estimated using a bivariate Gaussian
probability density function to approximate
turbulence. The scale of diffusion
(described by the diffusion law) depends
on total particle fall time, which depends
on particle size, release height, and
elevation of the terrain the particle impacts.
Particle Diffusion
6 Modify by atmospheric diffusion
25
Background
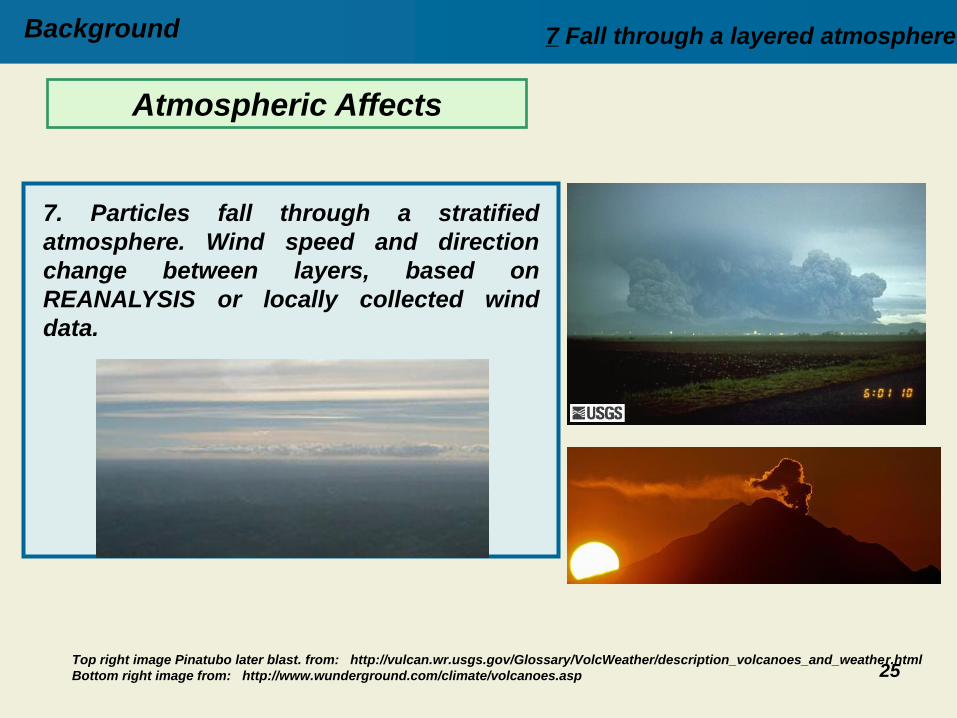
7. Particles fall through a stratified
atmosphere. Wind speed and direction
change between layers, based on
REANALYSIS or locally collected wind
data.
Atmospheric Affects
7 Fall through a layered atmosphere
Top right image Pinatubo later blast. from: http://vulcan.wr.usgs.gov/Glossary/VolcWeather/description_volcanoes_and_weather.html
Bottom right image from: http://www.wunderground.com/climate/volcanoes.asp
26
Background
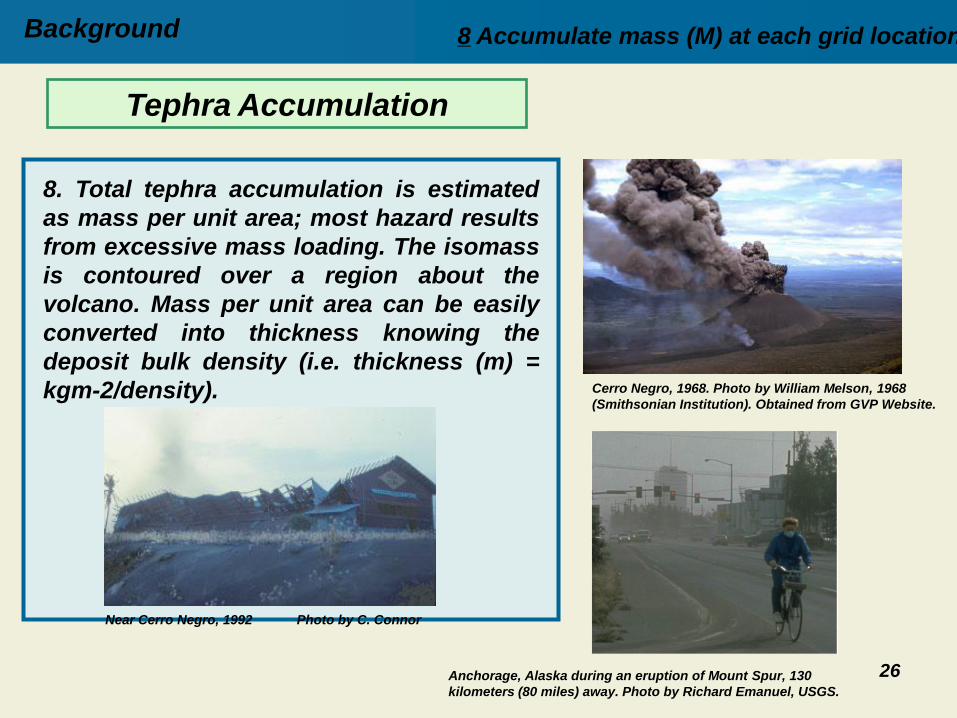
8. Total tephra accumulation is estimated
as mass per unit area; most hazard results
from excessive mass loading. The isomass
is contoured over a region about the
volcano. Mass per unit area can be easily
converted into thickness knowing the
deposit bulk density (i.e. thickness (m) =
kgm-2/density).
Tephra Accumulation
8 Accumulate mass (M) at each grid location
Cerro Negro, 1968. Photo by William Melson, 1968
(Smithsonian Institution). Obtained from GVP Website.
Anchorage, Alaska during an eruption of Mount Spur, 130
kilometers (80 miles) away. Photo by Richard Emanuel, USGS.
Near Cerro Negro, 1992 Photo by C. Connor
27
Example Eruption example included in GUI
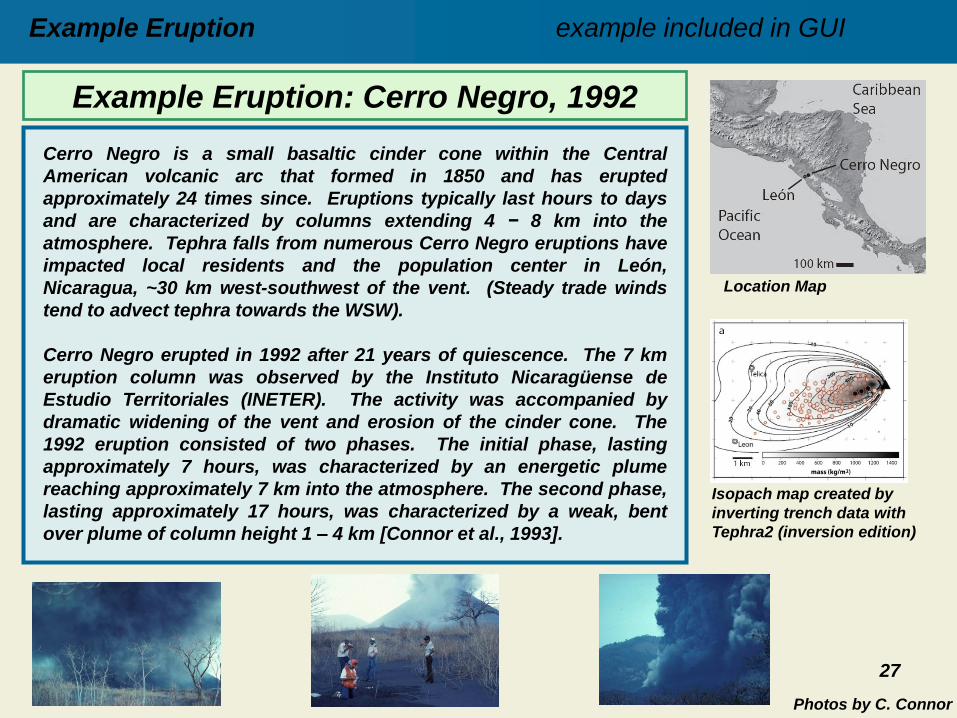
Example Eruption: Cerro Negro, 1992
Cerro Negro is a small basaltic cinder cone within the Central
American volcanic arc that formed in 1850 and has erupted
approximately 24 times since. Eruptions typically last hours to days
and are characterized by columns extending 4 − 8 km into the
atmosphere. Tephra falls from numerous Cerro Negro eruptions have
impacted local residents and the population center in León,
Nicaragua, ~30 km west-southwest of the vent. (Steady trade winds
tend to advect tephra towards the WSW).
Cerro Negro erupted in 1992 after 21 years of quiescence. The 7 km
eruption column was observed by the Instituto Nicaragüense de
Estudio Territoriales (INETER). The activity was accompanied by
dramatic widening of the vent and erosion of the cinder cone. The
1992 eruption consisted of two phases. The initial phase, lasting
approximately 7 hours, was characterized by an energetic plume
reaching approximately 7 km into the atmosphere. The second phase,
lasting approximately 17 hours, was characterized by a weak, bent
over plume of column height 1 – 4 km [Connor et al., 1993].
Location Map
Isopach map created by
inverting trench data with
Tephra2 (inversion edition)
Photos by C. Connor
28
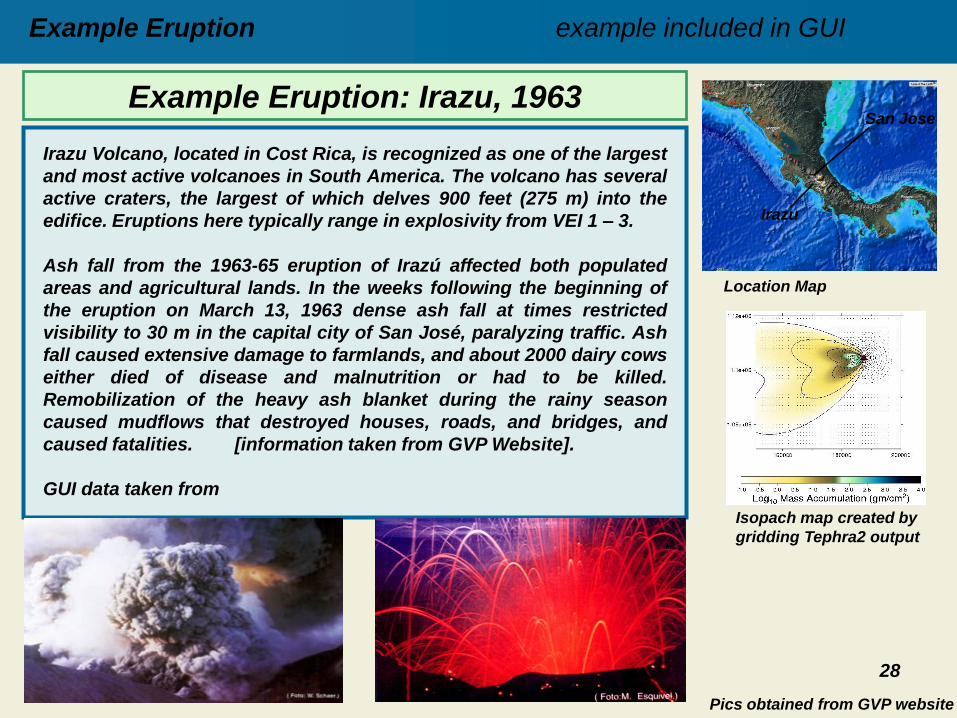
Example Eruption: Irazu, 1963
Irazu Volcano, located in Cost Rica, is recognized as one of the largest
and most active volcanoes in South America. The volcano has several
active craters, the largest of which delves 900 feet (275 m) into the
edifice. Eruptions here typically range in explosivity from VEI 1 – 3.
Ash fall from the 1963-65 eruption of Irazú affected both populated
areas and agricultural lands. In the weeks following the beginning of
the eruption on March 13, 1963 dense ash fall at times restricted
visibility to 30 m in the capital city of San José, paralyzing traffic. Ash
fall caused extensive damage to farmlands, and about 2000 dairy cows
either died of disease and malnutrition or had to be killed.
Remobilization of the heavy ash blanket during the rainy season
caused mudflows that destroyed houses, roads, and bridges, and
caused fatalities. [information taken from GVP Website].
GUI data taken from
Location Map
Pics obtained from GVP website
Irazu
San Jose
Isopach map created by
gridding Tephra2 output
Example Eruption example included in GUI
29
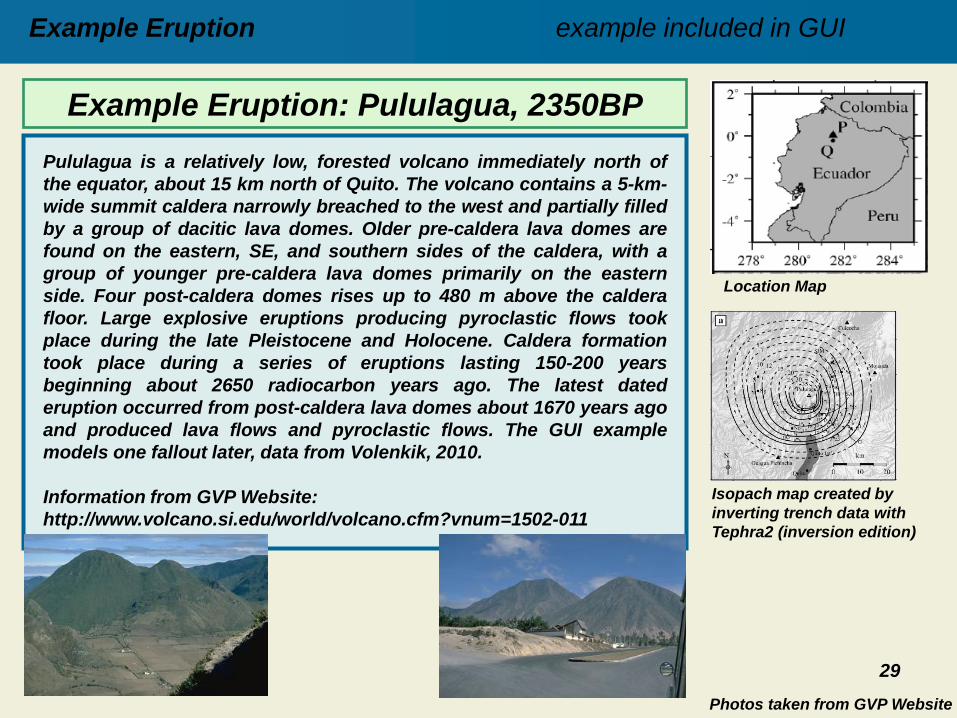
Example Eruption: Pululagua, 2350BP
Pululagua is a relatively low, forested volcano immediately north of
the equator, about 15 km north of Quito. The volcano contains a 5-km-
wide summit caldera narrowly breached to the west and partially filled
by a group of dacitic lava domes. Older pre-caldera lava domes are
found on the eastern, SE, and southern sides of the caldera, with a
group of younger pre-caldera lava domes primarily on the eastern
side. Four post-caldera domes rises up to 480 m above the caldera
floor. Large explosive eruptions producing pyroclastic flows took
place during the late Pleistocene and Holocene. Caldera formation
took place during a series of eruptions lasting 150-200 years
beginning about 2650 radiocarbon years ago. The latest dated
eruption occurred from post-caldera lava domes about 1670 years ago
and produced lava flows and pyroclastic flows. The GUI example
models one fallout later, data from Volenkik, 2010.
Information from GVP Website:
http://www.volcano.si.edu/world/volcano.cfm?vnum=1502-011
Location Map
Isopach map created by
inverting trench data with
Tephra2 (inversion edition)
Photos taken from GVP Website
Example Eruption example included in GUI
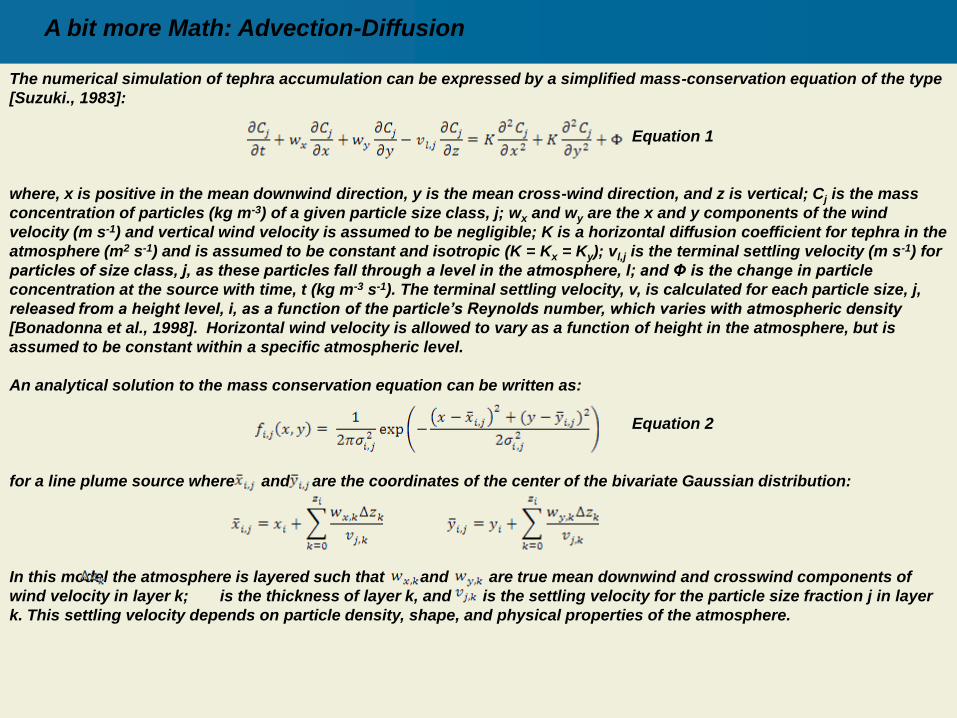
The numerical simulation of tephra accumulation can be expressed by a simplified mass-conservation equation of the type
[Suzuki., 1983]:
Equation 1
where, x is positive in the mean downwind direction, y is the mean cross-wind direction, and z is vertical; Cj is the mass
concentration of particles (kg m-3) of a given particle size class, j; wx and wy are the x and y components of the wind
velocity (m s-1) and vertical wind velocity is assumed to be negligible; K is a horizontal diffusion coefficient for tephra in the
atmosphere (m2 s-1) and is assumed to be constant and isotropic (K = Kx = Ky); vl,j is the terminal settling velocity (m s-1) for
particles of size class, j, as these particles fall through a level in the atmosphere, l; and Φ is the change in particle
concentration at the source with time, t (kg m-3 s-1). The terminal settling velocity, v, is calculated for each particle size, j,
released from a height level, i, as a function of the particle’s Reynolds number, which varies with atmospheric density
[Bonadonna et al., 1998]. Horizontal wind velocity is allowed to vary as a function of height in the atmosphere, but is
assumed to be constant within a specific atmospheric level.
An analytical solution to the mass conservation equation can be written as:
Equation 2
for a line plume source where and are the coordinates of the center of the bivariate Gaussian distribution:
In this model the atmosphere is layered such that and are true mean downwind and crosswind components of
wind velocity in layer k; is the thickness of layer k, and is the settling velocity for the particle size fraction j in layer
k. This settling velocity depends on particle density, shape, and physical properties of the atmosphere.
A bit more Math: Advection-Diffusion
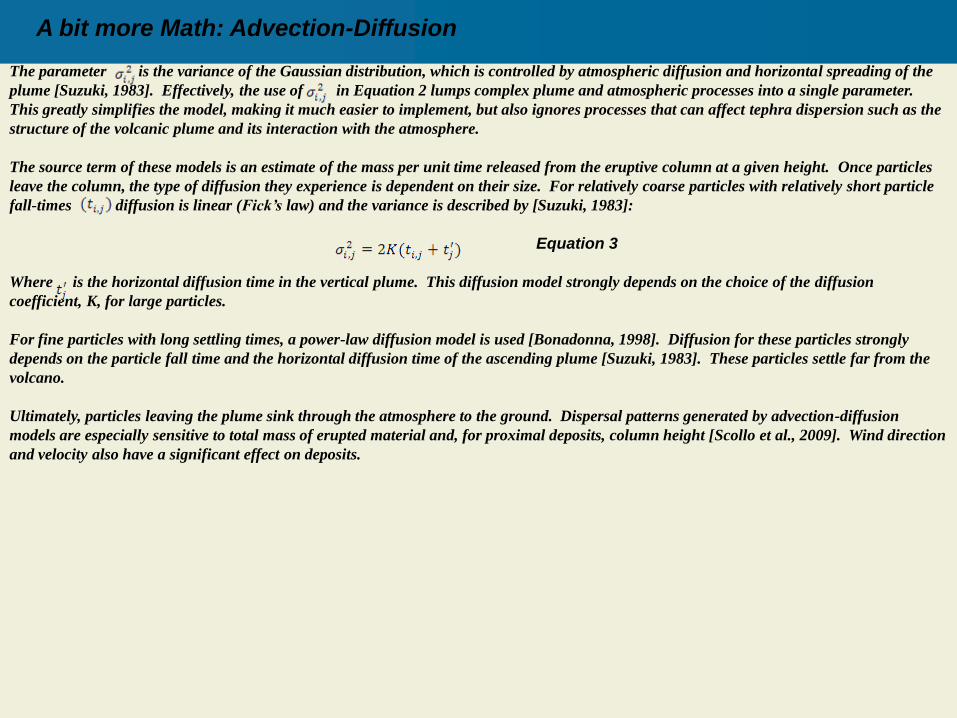
The parameter is the variance of the Gaussian distribution, which is controlled by atmospheric diffusion and horizontal spreading of the
plume [Suzuki, 1983]. Effectively, the use of in Equation 2 lumps complex plume and atmospheric processes into a single parameter.
This greatly simplifies the model, making it much easier to implement, but also ignores processes that can affect tephra dispersion such as the
structure of the volcanic plume and its interaction with the atmosphere.
The source term of these models is an estimate of the mass per unit time released from the eruptive column at a given height. Once particles
leave the column, the type of diffusion they experience is dependent on their size. For relatively coarse particles with relatively short particle
fall-times diffusion is linear (Fick’s law) and the variance is described by [Suzuki, 1983]:
Equation 3
Where is the horizontal diffusion time in the vertical plume. This diffusion model strongly depends on the choice of the diffusion
coefficient, K, for large particles.
For fine particles with long settling times, a power-law diffusion model is used [Bonadonna, 1998]. Diffusion for these particles strongly
depends on the particle fall time and the horizontal diffusion time of the ascending plume [Suzuki, 1983]. These particles settle far from the
volcano.
Ultimately, particles leaving the plume sink through the atmosphere to the ground. Dispersal patterns generated by advection-diffusion
models are especially sensitive to total mass of erupted material and, for proximal deposits, column height [Scollo et al., 2009]. Wind direction
and velocity also have a significant effect on deposits.
A bit more Math: Advection-Diffusion
Additional Reading:
Suzuki's (1983) model computes the mass of tephra deposited at a location relative to the eruption source using an analytic solution
to the diffusion - advection equation and a line source for tephra in the eruption column. A complete description of the original
mathematical development is available in:
Suzuki, T., 1983. A theoretical model for dispersion of tephra, in: D. Shimozuru and I. Yokoyama (eds) Arc Volcanism: Physics and
Tectonics, Terra Scientific Publishing, Tokyo, 95-116.
The model used here is slightly modified. See:
Connor, C.B., B.E. Hill, B. Winfrey, N.M. Franklin, and P.C. LaFemina, 2001, Estimation of volcanic hazards from tephra fallout,
Natural Hazards Review, 2: 33-42.
Bonadonna, C., C.B. Connor, B.F. Houghton, L. Connor, M. Byrne, A. Laing, and T. Hincks, 2005. Probabilistic modeling of tephra
dispersion: hazard assessment of a multi-phase eruption at Tarawera, New Zealand, Journal of Geophysical Research, 110 (B03203).
Further Reading:
Barberi, F., G. Macedonio, M.T. Pareschi, and R. Santacroce, 1990. Mapping the tephra fallout risk: an example from Vesuvius, Italy,
Nature, 344, 142-144.
Costa, A., G. Macedonio and A. Folch, 2006. A three-dimensional Eulerian model for transport and deposition of volcanic ashes,
Earth and Planetary Science Letters, 241 (3-4), 634-647.
D'Amours, R., 1998. Modeling the ETEX plume dispersion with the Canadian emergency response model, Atmospheric Environment,
32 (24), 4335-4341.
Heffter, J.L., and B.J.B. Stunder, 1993. Volcanic Ash Forecast Transport and Dispersion (Vaftad) Model, Weather and Forecasting, 8
(4), 533-541.
Hurst, A.W., and R. Turner, 1999. Performance of the program ASHFALL for forecasting ashfall during the 1995 and 1996 eruptions
of Ruapehu volcano, New Zealand Journal of Geology and Geophysics, 42 (4), 615-622.
Macedonio, G., M.T. Pareschi, and R. Santacroce, 1998. A numerical simulation of the Plinian fall phase of 79 AD eruption of
Vesuvius, Journal of Geophysical Research-Solid Earth and Planets, 93 (B12), 14817-14827.
Volentik A.C.M., Bonadonna C., Connor C.B., Connor L.J., and Rosi M. Modeling tephra dispersal in absence of wind: insights from
the climactic phase of the 2450 BP Plinian eruption of Pululagua volcano (Ecuador). Journal of Volcanology and Geothermal
Research, 193(1-2), pp. 117-136, doi:10.1016/j.jvolgeores.2010.03.011