Embed Size (px)
Citation preview
Running Head: TIER 2 KINDERGARTEN INTERVENTION
Examining the Efficacy of a Tier 2 Kindergarten Intervention
Ben Clarke
Christian Doabler
University of Oregon
Keith Smolkowski
Oregon Research Institute
Scott Baker
Hank Fien
Mari Strand Cary
University of Oregon
Technical Report #1104
Center on Teaching and Learning
University of Oregon
TIER 2 KINDERGARTEN INTERVENTION 2
Introduction
The low level of mathematics performance of U.S. students in relation to national
standards and in international comparisons has concerned educators and policy makers
and garnered increasing attention in the past decade (National Mathematics Advisory
Panel [NMAP], 2008; National Research Council [NRC], 2001; Schmidt, Houang, &
Cogan, 2002). Results from the 2011National Assessment for Educational Progress
(NAEP) indicate that only 40% of 4th graders were deemed at or above proficient in
mathematics and 18% were below basic (National Center for Education Statistics, 2011).
Difficulties in mathematics achievement are particularly severe for students from low
income and minority backgrounds and those with learning disabilities. Signs of long-term
difficulty in mathematics appear early. Specifically, significant differences in student
knowledge can be reliably assessed at school entry on measures ranging from counting
principles and number knowledge to more complex understandings of quantities,
operations, and problem solving (Griffin, Case, & Siegler, 1994; Jordan, Kaplan, &
Locuniak, 2007). Longitudinal research suggests that students who perform poorly in
mathematics at the end of kindergarten are likely to continue to struggle throughout
elementary school (Bodovski & Farkas, 2007; Duncan et al., 2007; Hanich, Jordan,
Kaplan, & Dick, 2001; Morgan, Farkas, & Wu, 2009). Using a nationally representative
sample of students from the Early Childhood Longitudinal Study-Kindergarten Cohort
(ECLS-K), Morgan et al. (2009) found that students who were in the lowest 10th
percentile at entrance and exit from kindergarten (considered an indicator of a learning
disability in mathematics – MLD) had a 70% chance of remaining in the lowest 10th
percentile five years later. Their overall mathematics achievement in fifth grade remained
TIER 2 KINDERGARTEN INTERVENTION 3
2 standard deviation units below students who did not demonstrate a MLD profile in
kindergarten. These data as well as Duncan et al.’s (2007) recent meta-analysis of
longitudinal research on the development of mathematics proficiency argue strongly for
the importance of a successful start in mathematics. Unless these differences are
addressed at entry into kindergarten, they are likely to persist and become more difficult
to remediate over time as students exit kindergarten without a solid foundation upon
which to build an increasing complex understanding of mathematics (Geary, 1993;
Jordan, Kaplan, & Hanich, 2002; Lyon et al., 2001; Morgan et al., 2009).
Recognizing that mathematics trajectories are established early in school and
kindergarten represents a critical transition from informal to formal mathematics, our
research group developed and evaluated ROOTS, a 50-lesson (Tier 2) kindergarten math
intervention. The purpose of this technical report is to summarize results from an initial
randomized controlled trial (RCT) study on the efficacy and efficiency of ROOTS. In this
report, we present an overview of the ROOTS curriculum, study design, methodology
and results focusing on the impact of ROOTS on kindergarten student math outcomes.
Our research team had previously developed and evaluated the Early Learning in
Mathematics (ELM) kindergarten core curriculum (Davis & Jungjohann, 2009). ELM
consists of 120 lessons and focuses on four key mathematics strands: (a) Number and
Operations, (b) Geometry, (c) Measurement, and (d) Vocabulary. The first three of these
map directly onto the three content domains contained in the National Council of
Teachers of Mathematics Curriculum Focal Points (NCTM, 2006), and the fourth
(vocabulary) is addressed in the NCTM Process Standards (2000). We tested the efficacy
of ELM in a RCT, randomly assigning 66 kindergartens classrooms to treatment and
TIER 2 KINDERGARTEN INTERVENTION 4
control conditions. Students in the treatment condition, ELM, outperformed their control
classroom peers on two distal measures of math proficiency. ELM students significantly
outperformed control students on both the Test of Early Mathematics Ability – 3rd
Edition (TEMA; t = 2.41, p = .02) and Early Numeracy Curriculum Based Measurement
(EN-CBM; t = 1.99 p = .05). Overall Hedges g effect sizes were .13 on the TEMA and
.14 on EN-CBM (Clarke et al., 2011). In condition by risk status analyses, at-risk
students (defined as performing below the 40th percentile on the TEMA at pretest)
demonstrated the greatest treatment benefit (Clarke et al., 2011). At-risk treatment
students significantly outperformed at-risk control students on both the TEMA (t = 3.29,
p = .0017, g = .24) and EN-CBM total score (t = 2.54, p = .0138, g = .22).
The pattern of findings is important for two reasons. First, differential impact
favoring the at-risk students was aligned with our theoretical framework. In developing
ELM our objective was to create a core mathematics programs (i.e., Tier 1) that would
address the needs of the average- and high-performing students (in the analysis, students
above the 40th percentile at pretest performed the same at posttest in both ELM and
control conditions) and substantially increase the mathematics achievement of students at
risk for math difficulties (which occurred). Second, although the ELM curriculum was
beneficial to at-risk students in particular, the performance of at-risk students at the end
of the year did not match the performance of students not at risk (at pretest). In other
words, although there was differential impact by risk status, the program did not fully
eliminate the gap between at-risk and average-achieving students.
Spurred by our findings that while ELM helped reduce but not fully eliminate the
achievement gap between at-risk students and their on track peers, we developed a Tier 2
TIER 2 KINDERGARTEN INTERVENTION 5
intervention, ROOTS, to be used as a supplemental program with ELM. The ROOTS
intervention was designed to focus exclusively on Number and Operations because an in-
depth understanding of the whole number system is a critical step in achieving
proficiency in more sophisticated mathematics, such as rational numbers and algebra
(Gersten et al., 2009a; NCTM, 2006; NRC, 2001, 2009). For example, authors of the IES
practice guide on effective mathematics instruction and intervention for at-risk students
observed that “individuals knowledgeable in instruction and mathematics look for [and
develop] interventions that focus on whole numbers extensively in kindergarten through
grade 5” (Gersten et al., p. 18; 2009a). Concurring, the Common Core State Standards for
Mathematics (CCSS, 2010) recommends extensive coverage of whole number concepts
and skills during kindergarten (i.e., counting and cardinality, operations and algebraic
thinking, and number and operations in base ten).
In the second study of the ELM efficacy trial (Baker et al., 2008), we explored the
value added of the intervention program, ROOTS, to accelerate the learning of students at
risk for MLD. All students randomly assigned to the treatment condition received core
instruction in ELM and at-risk students received the combination of ELM and the
ROOTS intervention. Instructional assistants delivered ROOTS to small groups of 4-5 at-
risk students during the second half of the kindergarten school year. This technical report
summarizes findings from that study.
ROOTS Intervention Overview
ROOTS is a 50-lesson kindergarten intervention program designed to develop
procedural fluency with and conceptual understanding of whole number concepts.
ROOTS is delivered by instructional assistants to small groups consisting of 4-5 students,
TIER 2 KINDERGARTEN INTERVENTION 6
2 to 3 times per week, for 20 weeks during the second half of the school year. Each
ROOTS lesson is approximately 20 minutes in duration and includes 4 to 5 brief math
activities that center on whole number concepts and skills. ROOTS provides in-depth
instruction in whole number concepts by linking the informal mathematics developed
prior to kindergarten to the formal mathematics of kindergarten. Specifically, ROOTS
focuses on three key areas of whole number understanding (a) Counting and Cardinality
(b) Number Operations and (c) Base 10/Place Value. Students advance from objectives
centered on counting objects and identifying numerals to applying their knowledge of
foundational principles to number operations and the base 10 system. The specific focus
on whole number aligns with calls for more focused and coherent curricula (NCTM,
2006; NMAP, 2008), and intervention programs designed to meet the needs of students
at-risk for MLD (Gersten et al., 2009a). ROOTS Objectives and the alignment overview
between ROOTS and the Common Core State Standards (CCSS, 2010) are listed in
Appendix A (pp. A1-A10).
A central feature of the ROOTS program, established through a set of research-
based instructional design principles (Doabler et al., in press), is an explicit and
systematic approach to instruction. Mathematics intervention studies consistently
demonstrate that students at-risk for MLD learn more from explicit math instruction
compared to other approaches to instruction (Baker, Gersten, & Lee, 2002; Gersten, et
al., 2009b; Haas, 2005; Kroesbergen & Luit, 2003). Explicit and systematic instruction is
a method for teaching the “essential skills in the most effective and efficient manner
possible” (Carnine, Silbert, Kame’enui, & Tarver, 2004; p. 5). This approach
incorporates the instructional design principles that (a) facilitate overt and conspicuous
TIER 2 KINDERGARTEN INTERVENTION 7
instructional interactions among teachers and students targeting key math content and (b)
increase intervention intensity required to accelerate learning for kindergartners at-risk
for MLD. For example, the lessons provide teachers with guidelines for modeling and
demonstrating what they want students to learn, and providing specific academic
feedback to students as they engage in learning activities. The program also provides
students with frequent and structured opportunities to practice learning key mathematics
concepts and content.
Methodology
Design
A randomized controlled trial was the research design used. Math achievement
data were collected from individual students, and random assignment and instructional
delivery took place at the classroom level. Classrooms were randomly assigned to
treatment or control conditions, blocking on school. Our primary analysis framework is a
group-randomized trial (Murray, 1998) with students nested within classrooms and
classrooms nested within condition. Fourteen classrooms were in the treatment condition
and 15 classrooms were in the control condition.
Participants
Full day kindergarten classrooms who participated in the ELM study were
randomly assigned to treatment or control conditions, blocking on teachers’ ELM
experience (one year or none) and school. Fourteen classrooms were in the treatment
condition (ELM+Roots) and 15 classrooms were in the control condition (ELM-only).
Time was controlled so that treatment and control classrooms provided the same amount
of daily mathematics instruction. This was accomplished by delivering the Roots
TIER 2 KINDERGARTEN INTERVENTION 8
instruction during the individual, worksheet-based “math practice” portion of ELM in
treatment classrooms. Classroom teachers (treatment and control) provided whole class
ELM instruction throughout the year. Roots instruction began in January and was
provided by trained instructional assistants.
Instructional Assistants. Fourteen instructional assistants (IAs) participated in
the study, of which thirteen were female and all identified themselves as White. Three of
the IAs had college degrees and two held current teacher certifications. In this sample,
nine of the IAs had four or more years experience as an instructional assistant and all but
four of the IAs had completed college level coursework in mathematics.
Students. A list of students by classroom who had scored below the 40th
percentile on the TEMA pre-test was provided to participating teachers (n = 29) who
were asked to select 5 students from the list who they believed would benefit from a
small group math intervention. In treatment classrooms (ELM+Roots), these “Roots
students” (n=69) received all of the whole-class ELM instruction, however, three days
per week, instead of practicing that day’s ELM topics independently (i.e. math practice
worksheets), they received Roots instruction. Nominated students in control classrooms
(n = 74) served as “matched pairs.” Given that Roots was not offered in their classrooms,
they participated only in whole class ELM instruction, five days per week.
Fidelity of Implementation
Professional development. Participating IAs attended three PD workshops
focused on the ROOTS curriculum. The initial PD workshop focused on the instructional
objectives related to Lessons 1-25, the critical content of kindergarten mathematics,
small-group management techniques, and the instructional practices that have been
TIER 2 KINDERGARTEN INTERVENTION 9
empirically validated to increase student math achievement (e.g., teacher provided
academic feedback). In the second and third workshops the same format was followed as
in workshop 1 but with a focus on the second half of the ROOTS curriculum, Lessons 26-
50. Workshops were 4 hours in length and organized around three principles: (a) active
participation (b) content focused, and (c) coherence. Although the empirical literature on
PD in math instruction is thin, a burgeoning base of evidence indicates these principles
can lead to improved outcomes for teachers and students (Blank & de las Alas, 2009;
Fixsen et al., 2005; Joyce & Showers, 2002; Scher & O’Reilly, 2009). On at least three
occasions, IAs also received onsite coaching from two expert teachers. Some IAs
received more than three coaching visits if the IA or coach felt more support was
warranted (e.g., when there were particularly pervasive student behavior problems or the
IA struggled with lesson implementation).
Fidelity. Online logs completed by the 14 instructional assistants (IA) who
delivered the ROOTS intervention revealed that groups generally completed all 50
ROOTS lessons during the year. Research staff observed ROOTS instruction 1-3 times
over the course of the study and rated fidelity of implementation using a 3-point rating
scale where 3 represented “full implementation,” 2 represented “partial implementation,”
and 1 was “not taught.” IAs demonstrated high fidelity scores (M = 2.92, SD = 0.06) for
the activities prescribed. Surveys were completed by the 14 ROOTS IAs as well as the 14
classroom teachers who provided whole class instruction to ROOTS students. IAs
(100%) and teachers (87.5%) reported that is was possible to provide 20 minutes of
ROOTS instruction on a regular basis. Using a 7-point Likert scale where 1 represented
“greatly benefited,” 4 represented “moderately benefited,” and 7 represented “did not
TIER 2 KINDERGARTEN INTERVENTION 10
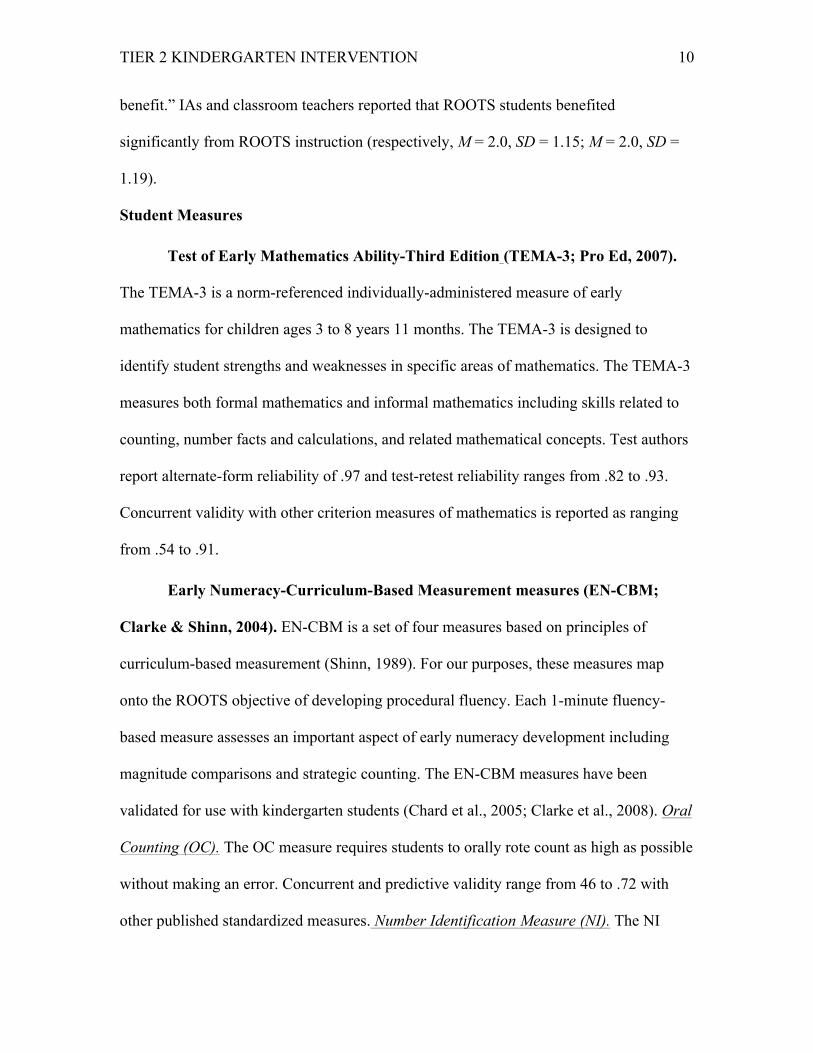
benefit.” IAs and classroom teachers reported that ROOTS students benefited
significantly from ROOTS instruction (respectively, M = 2.0, SD = 1.15; M = 2.0, SD =
1.19).
Student Measures
Test of Early Mathematics Ability-Third Edition (TEMA-3; Pro Ed, 2007).
The TEMA-3 is a norm-referenced individually-administered measure of early
mathematics for children ages 3 to 8 years 11 months. The TEMA-3 is designed to
identify student strengths and weaknesses in specific areas of mathematics. The TEMA-3
measures both formal mathematics and informal mathematics including skills related to
counting, number facts and calculations, and related mathematical concepts. Test authors
report alternate-form reliability of .97 and test-retest reliability ranges from .82 to .93.
Concurrent validity with other criterion measures of mathematics is reported as ranging
from .54 to .91.
Early Numeracy-Curriculum-Based Measurement measures (EN-CBM;
Clarke & Shinn, 2004). EN-CBM is a set of four measures based on principles of
curriculum-based measurement (Shinn, 1989). For our purposes, these measures map
onto the ROOTS objective of developing procedural fluency. Each 1-minute fluency-
based measure assesses an important aspect of early numeracy development including
magnitude comparisons and strategic counting. The EN-CBM measures have been
validated for use with kindergarten students (Chard et al., 2005; Clarke et al., 2008). Oral
Counting (OC). The OC measure requires students to orally rote count as high as possible
without making an error. Concurrent and predictive validity range from 46 to .72 with
other published standardized measures. Number Identification Measure (NI). The NI
TIER 2 KINDERGARTEN INTERVENTION 11
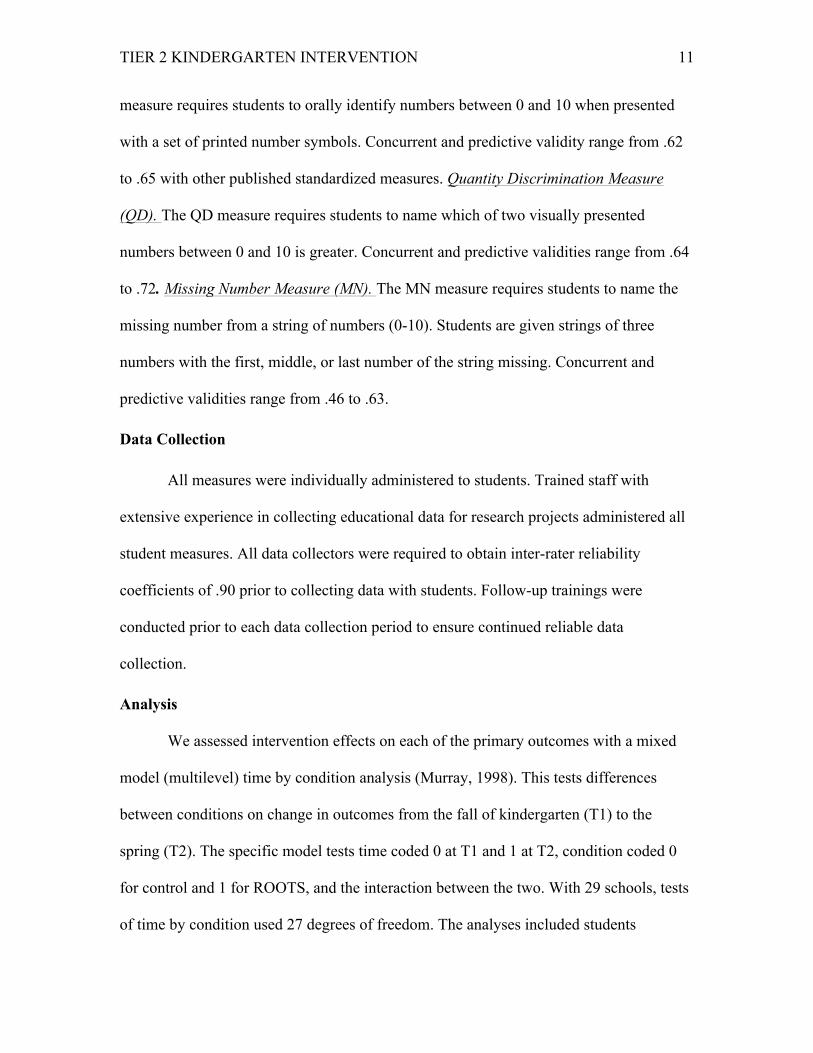
measure requires students to orally identify numbers between 0 and 10 when presented
with a set of printed number symbols. Concurrent and predictive validity range from .62
to .65 with other published standardized measures. Quantity Discrimination Measure
(QD). The QD measure requires students to name which of two visually presented
numbers between 0 and 10 is greater. Concurrent and predictive validities range from .64
to .72. Missing Number Measure (MN). The MN measure requires students to name the
missing number from a string of numbers (0-10). Students are given strings of three
numbers with the first, middle, or last number of the string missing. Concurrent and
predictive validities range from .46 to .63.
Data Collection
All measures were individually administered to students. Trained staff with
extensive experience in collecting educational data for research projects administered all
student measures. All data collectors were required to obtain inter-rater reliability
coefficients of .90 prior to collecting data with students. Follow-up trainings were
conducted prior to each data collection period to ensure continued reliable data
collection.
Analysis
We assessed intervention effects on each of the primary outcomes with a mixed
model (multilevel) time by condition analysis (Murray, 1998). This tests differences
between conditions on change in outcomes from the fall of kindergarten (T1) to the
spring (T2). The specific model tests time coded 0 at T1 and 1 at T2, condition coded 0
for control and 1 for ROOTS, and the interaction between the two. With 29 schools, tests
of time by condition used 27 degrees of freedom. The analyses included students
TIER 2 KINDERGARTEN INTERVENTION 12
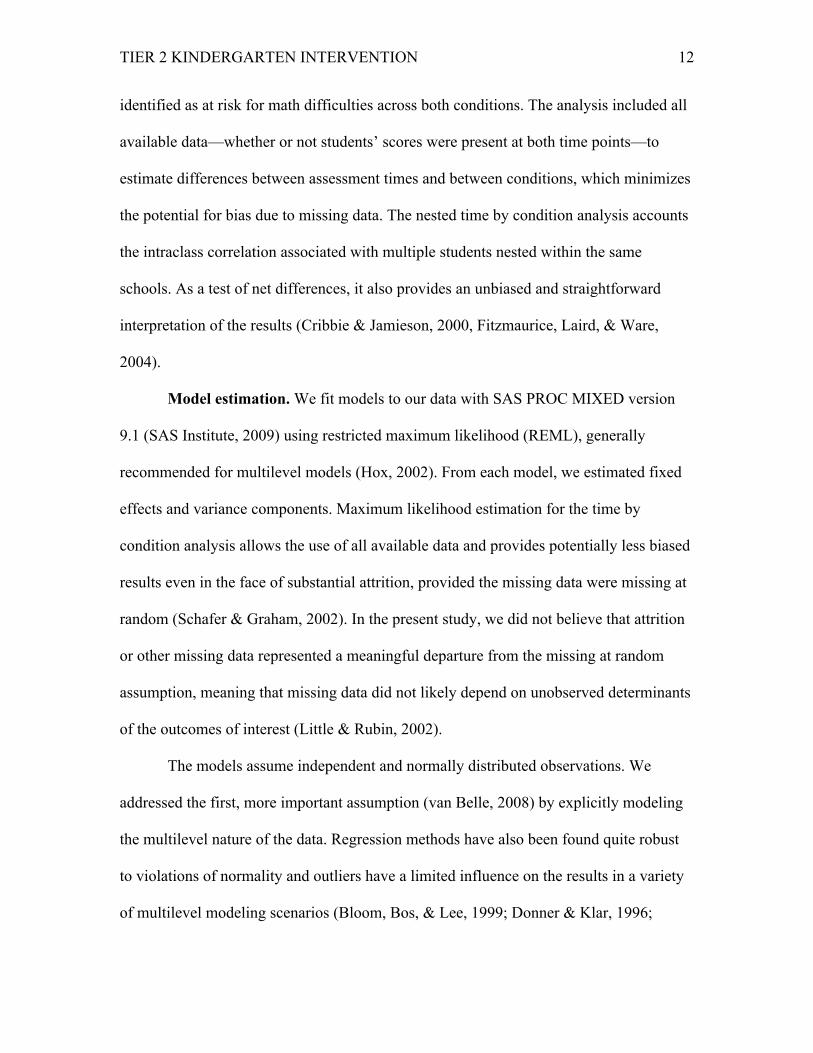
identified as at risk for math difficulties across both conditions. The analysis included all
available data—whether or not students’ scores were present at both time points—to
estimate differences between assessment times and between conditions, which minimizes
the potential for bias due to missing data. The nested time by condition analysis accounts
the intraclass correlation associated with multiple students nested within the same
schools. As a test of net differences, it also provides an unbiased and straightforward
interpretation of the results (Cribbie & Jamieson, 2000, Fitzmaurice, Laird, & Ware,
2004).
Model estimation. We fit models to our data with SAS PROC MIXED version
9.1 (SAS Institute, 2009) using restricted maximum likelihood (REML), generally
recommended for multilevel models (Hox, 2002). From each model, we estimated fixed
effects and variance components. Maximum likelihood estimation for the time by
condition analysis allows the use of all available data and provides potentially less biased
results even in the face of substantial attrition, provided the missing data were missing at
random (Schafer & Graham, 2002). In the present study, we did not believe that attrition
or other missing data represented a meaningful departure from the missing at random
assumption, meaning that missing data did not likely depend on unobserved determinants
of the outcomes of interest (Little & Rubin, 2002).
The models assume independent and normally distributed observations. We
addressed the first, more important assumption (van Belle, 2008) by explicitly modeling
the multilevel nature of the data. Regression methods have also been found quite robust
to violations of normality and outliers have a limited influence on the results in a variety
of multilevel modeling scenarios (Bloom, Bos, & Lee, 1999; Donner & Klar, 1996;
TIER 2 KINDERGARTEN INTERVENTION 13
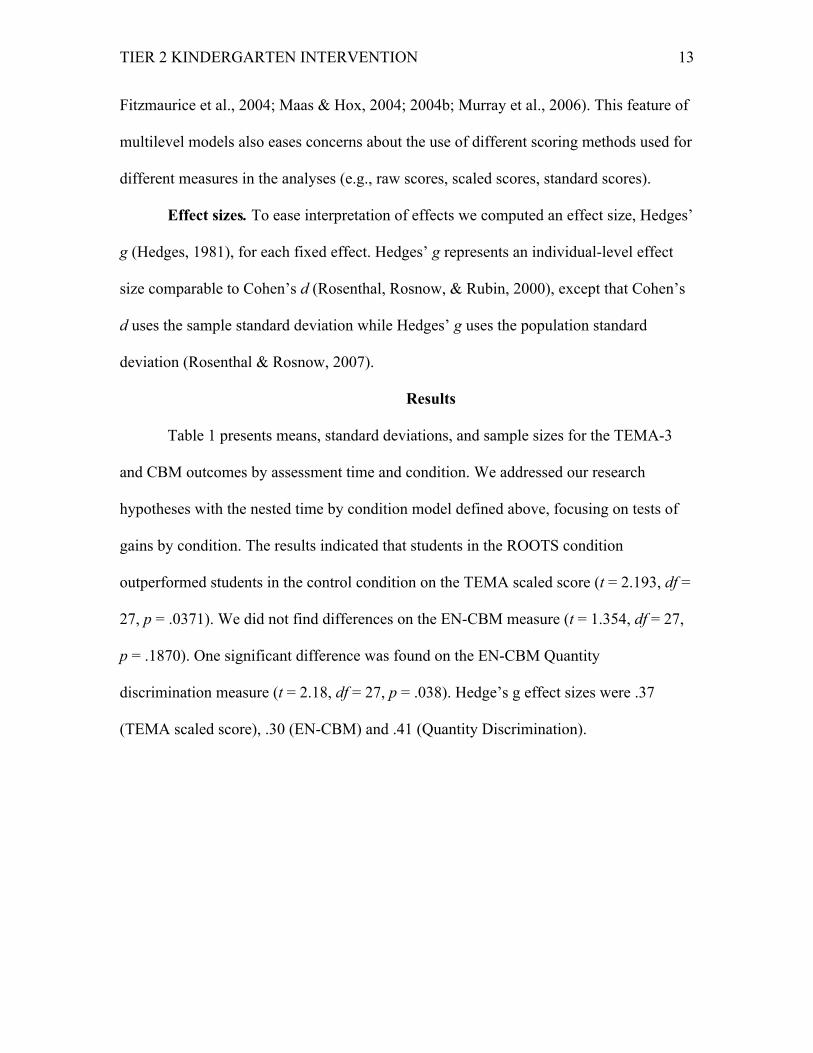
Fitzmaurice et al., 2004; Maas & Hox, 2004; 2004b; Murray et al., 2006). This feature of
multilevel models also eases concerns about the use of different scoring methods used for
different measures in the analyses (e.g., raw scores, scaled scores, standard scores).
Effect sizes. To ease interpretation of effects we computed an effect size, Hedges’
g (Hedges, 1981), for each fixed effect. Hedges’ g represents an individual-level effect
size comparable to Cohen’s d (Rosenthal, Rosnow, & Rubin, 2000), except that Cohen’s
d uses the sample standard deviation while Hedges’ g uses the population standard
deviation (Rosenthal & Rosnow, 2007).
Results
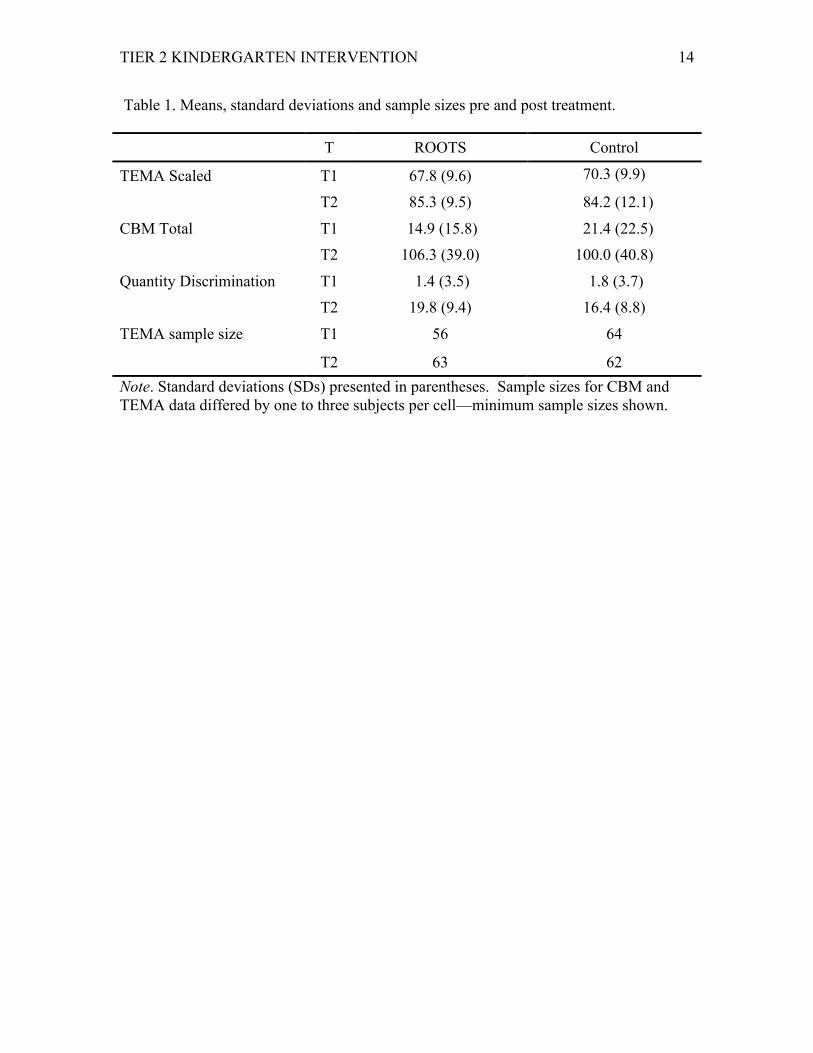
Table 1 presents means, standard deviations, and sample sizes for the TEMA-3
and CBM outcomes by assessment time and condition. We addressed our research
hypotheses with the nested time by condition model defined above, focusing on tests of
gains by condition. The results indicated that students in the ROOTS condition
outperformed students in the control condition on the TEMA scaled score (t = 2.193, df =
27, p = .0371). We did not find differences on the EN-CBM measure (t = 1.354, df = 27,
p = .1870). One significant difference was found on the EN-CBM Quantity
discrimination measure (t = 2.18, df = 27, p = .038). Hedge’s g effect sizes were .37
(TEMA scaled score), .30 (EN-CBM) and .41 (Quantity Discrimination).
TIER 2 KINDERGARTEN INTERVENTION 14
Table 1. Means, standard deviations and sample sizes pre and post treatment. T ROOTS Control
TEMA Scaled T1 67.8 (9.6) 70.3 (9.9)
T2 85.3 (9.5) 84.2 (12.1)
CBM Total T1 14.9 (15.8) 21.4 (22.5) T2 106.3 (39.0) 100.0 (40.8)
Quantity Discrimination T1 1.4 (3.5) 1.8 (3.7) T2 19.8 (9.4) 16.4 (8.8)
TEMA sample size T1 56 64
T2 63 62 Note. Standard deviations (SDs) presented in parentheses. Sample sizes for CBM and TEMA data differed by one to three subjects per cell—minimum sample sizes shown.
TIER 2 KINDERGARTEN INTERVENTION 15
References
Baker, S. K., Chard, D., Clarke, B. S., Smolkowski, K., & Fien, H. (2008) Early Learning
in Mathematics: Efficacy in Kindergarten Classrooms (ELM).(Oregon: U.S.
Department of Education, Institute for Education Science, 2008-2012,
$4,280,188).
Baker, S. K., Gersten, R. M., & Lee, D.-S. (2002). A synthesis of empirical research on
teaching mathematics to low- achieving students. Elementary School Journal,
103(1), 51–73.
Blank, R. K., & de las Alas, N. (2009). Effects of teacher professional development on
gains in student achievement: How meta analysis provides scientific evidence
useful for education leaders. Washington, DC: Council of Chief State School
Officers.
Bloom, H. S., Bos, J. M., & Lee, S. W. (1999). Using cluster random assignment to
measure program impacts. Evaluation Review, 23(4), 445-469.
Bodovski, K., & Farkas, G. (2007). Mathematics growth in early elementary school: The
roles of beginning knowledge, student engagement, and instruction. The
Elementary School Journal.
Carnine, D., Silbert, J., Kame'enui, E., & Tarver, S. (2004). Direct instruction reading (4
ed.). Upper Saddle River, NJ: Pearson.
CCSS. (2010). Common Core State Standards Initiative: Designing common state
assessment systems. from
http://www.nga.org/Files/pdf/1004NGACCSSOASSESSMENTS.PDF
TIER 2 KINDERGARTEN INTERVENTION 16
Chard, D., Clarke, B., Baker, S. K., Otterstedt, J., Braun, D., & Katz, R. (2005). Using
measures of number sense to screen for difficulties in mathematics: Preliminary
findings. Assessment for Effective Intervention, 30(2), 3–14.
Clarke, B., Baker, S. K., & Chard, D. J. (2008). Best practices in mathematics assessment
and intervention with elementary students. In A. Thomas & J. Grimes (Eds.), Best
practices in school psychology (Vol. V, pp. 453–464). Bethesda, MD: National
Association of School Psychologists.
Clarke, B., & Shinn, M. R. (2004). A preliminary investigation into the identification and
development of early mathematics curriculum-based measurement. School
Psychology Review, 33, 234-248.
Clarke, B., Smolkowski, K., Baker, S. K., Fien, H., Doabler, C. T., & Chard, D. J. (2011).
The impact of a comprehensive Tier I core kindergarten program on the
achievement of students at risk in mathematics. The Elementary School Journal,
111(4), 561-584.
Cribbie, R. A., & Jamieson, J. (2000). Structural equation models and the regression bias
for measuring correlates of change. Educational and Psychological Measurement,
60(6), 893–907. doi: 10.1177/00131640021970970
Davis, K., & Jungjohann, K. (2009). Early learning in mathematics: Level
K. Unpublished curriculum, Center on Teaching and Learning, College of
Education, University of Oregon, Eugene, OR.
Doabler, C. Strand Cary, M., Jungjohann, K., Fien, H., Clarke, B., Baker, S.,
Smolkowski, K., & Chard, D. (in press). Enhancing Core Math Instruction for
Students with or At-risk for Math Disabilities, Teaching Exceptional Children.
TIER 2 KINDERGARTEN INTERVENTION 17
Donner, A., & Klar, N. (1996). Statistical considerations in the design and analysis of
community intervention trials. Journal of Clinical Epidemiology, 49(4), 435–439.
Duncan, G. J., Dowsett, C. J., Claessens, A., Magnuson, K., Huston, A. C., Klebanov, P.,
. . . Japel, C. (2007). School readiness and later achievement. Developmental
Psychology, 43(6), 1428–1446. doi: 10.1037/0012-1649.43.6.1428
Fitzmaurice, G. M., Laird, N. M., & Ware, J. H. (2004). Applied longitudinal analysis.
Hoboken, NJ: Wiley.
Fixsen, D., Naoom, S., Blase, K., Friedman, R., & Wallace, F. (2005). Implementation
Research: A Synthesis of the Literature FL: University of South Florida, Louis de
la Parte Florida Mental Health Institute, The National Implementation Research
Network (FMHI Publication# 231).
Geary, D. C. (1993). Mathematical disabilities: Cognitive, neuropsychological, and
genetic components. Psychological bulletin, 114(2), 345-362.
Gersten, R. M., Beckmann, S., Clarke, B., Foegen, A., March, L., Star, J. R., & Witzel, B.
(2009 a). Assisting students struggling with mathematics: Response to
Intervention (RtI) for elementary and middle schools. (Practice Guide Report No.
NCEE 2009-4060). Washington, DC: National Center for Education Evaluation
and Regional Assistance, Institute of Education Sciences, US Department of
Education.
Gersten, R. M., Chard, D., Jayanthi, M., Baker, S. K., Morphy, P., & Flojo, J. (2009 b).
Mathematics instruction for students with learning disabilities: A meta-analysis of
instructional components. Review of Educational Research, 79, 1202–1242.
TIER 2 KINDERGARTEN INTERVENTION 18
Griffin, S., Case, R., & Siegler, R. S. (1994). Rightstart: Providing the central conceptual
prerequisites for first learning of arithmetic to students at risk for school failure.
In K. McGilly (Ed.), Classroom lessons: Integrating cognitive theory and
classroom practice (pp. 24–49). Cambridge, MA: MIT Press.
Haas, M. (2005). Teaching methods for secondary algebra: A meta-analysis of findings.
Nassp Bulletin, 89(642), 24-46.
Hanich, L. B., Jordan, N. C., Kaplan, D., & Dick, J. (2001). Performance across different
areas of mathematical cognition in children with learning difficulties. Journal of
Educational Psychology, 93(3), 615–627.
Hedges, L. V. (1981). Distribution theory for Glass's estimator of effect size and related
estimators. Journal of Educational Statistics, 6(2), 107–128.
Hox, J. J. (2002). Multilevel analysis: Techniques and applications. Mahwah, NJ:
Lawrence Erlbaum Associates.
Jordan, N., Kaplan, D., & Hanich, L. (2002). Achievement growth in children with
learning difficulties in mathematics: Findings of a two-year longitudinal study.
Journal of Educational Psychology, 94(3), 586–597.
Jordan, N. C., Kaplan, D., Locuniak, M. N., & Ramineni, C. (2007). Predicting first grade
math achievement from developmental number sense trajectories. Learning
Disabilities Research & Practice, 22(1), 36-46.
Joyce, B., & Showers, B. (2002). Designing training and peer coaching: Our needs for
learning. VA: ASCD.
Kroesbergen, E. H., & Van Luit, J. E. H. (2003). Mathematics interventions for children
with special educational needs: A meta-analysis. Remedial & Special Education,
TIER 2 KINDERGARTEN INTERVENTION 19
24(2), 97–114.
Little, R. J. A., & Rubin, D. B. (2002). Statistical analysis with missing data (2nd ed.).
New York: John Wiley & Sons.
Lyon, G. R., Fletcher, J. M., Shaywitz, S. E., Shaywitz, B. A., Torgesen, J. K., Wood, F.
B., . . . Olson, R. (2001). Rethinking learning disabilities. In C. E. Finn, A. J.
Rotherham & C. R. Hokanson (Eds.), Rethinking special education for a new
century (pp. 259–288). Washington, DC: Thomas B. Fordham Foundation and the
Progressive Policy Institute.
Maas, C. J. M., & Hox, J. J. (2004). The influence of violations of assumptions on
multilevel parameter estimates and their standard errors. Computational Statistics
& Data Analysis, 46(3), 427–440.
Maas, C. J. M., & Hox, J. J. (2004b). Robustness issues in multilevel regression analysis.
Statistica Neerlandica, 58(2), 127–137.
Morgan, P. L., Farkas, G., & Wu, Q. (2009). Five-year growth trajectories of
kindergarten children with learning difficulties in mathematics. Journal of
Learning Disabilities, 42(4), 306–321.
Murray, D. M. (1998). Design and analysis of group-randomized trials. New York:
Oxford University Press.
Murray, D. M., Hannan, P. J., Pals, S. P., McCowen, R. G., Baker, W. L., & Blitstein, J.
L. (2006). A comparison of permutation and mixed-model regression methods for
the analysis of simulated data in the context of a group-randomized trial. Statistics
in Medicine, 25(3), 375–388.
TIER 2 KINDERGARTEN INTERVENTION 20
National Center for Education Statistics. (2011). NAEP 2011 mathematics: Report
card for the nation and the states. Washington, D. C.: U. S. Department of
Education, Institute of Education Sciences.
National Council of Teachers of Mathematics. (2000). Standards 2000 project. Accessed
Feb 8, 2001, from http://standards.nctm.org/document/index.htm
National Council of Teachers of Mathematics. (2006). Curriculum Focal Points for
prekindergarten through grade 8 mathematics: A quest for coherence. from
http://www.nctm.org/standards/focalpoints.aspx?id=282
National Mathematics Advisory Panel. (2008). Foundations for success: The final report
of the National Mathematics Advisory Panel. Washington, DC: US Department of
Education.
National Research Council. (2001). Adding it up: Helping children learn mathematics.
Washington, DC: Mathematics Learning Study Committee.
National Research Council. (2009). Mathematics Learning in Early Childhood: Paths
Toward Excellence and Equity.
Pro-Ed. (2007). Test of early mathematics ability, third edition. Austin, TX: Author.
Rosenthal, R., Rosnow, R. L., & Rubin, D. B. (2000). Contrasts and effect sizes in
behavioral research: A correlational approach. New York Cambridge University
Press.
Rosenthal, R., & Rosnow, R. L. (2007). Essentials of behavioral research: Methods and
data analysis (3 ed.). Boston: McGraw-Hill.
TIER 2 KINDERGARTEN INTERVENTION 21
SAS Institute. (2009). SAS/STAT® 9.2 user's guide (2nd ed.). Cary, NC: SAS Institute,
Inc. Retrieved March 10, 2010, from the SAS Product Documentation web site:
http://support.sas.com/documentation/index.html
Schafer, J. L., & Graham, J. W. (2002). Missing data: Our view of the state of the art.
Psychological Methods, 7(2), 147–177.
Scher, L., & O'Reilly, F. (2009). Professional development for K-12 math and science
teachers: What do we really know? Journal of Research on Educational
Effectiveness, 2(3), 209 –249.
Schmidt, W., Houang, R., & Cogan, L. (2002). A coherent curriculum: The case of
mathematics. American Educator, 26(2), 1-18.
Shinn, M. R. (1989). Curriculum-based measurement: Assessing special children. New
York: Guilford.
van Belle, G. (2008). Statistical rules of thumb (2nd ed.). New York: John Wiley & Sons.