Embed Size (px)
Citation preview
1
Running Head: High Levels of PHB Production in Transplastomic Tobacco
Corresponding Author:
Kristi D. Snell
Metabolix, Inc.
21 Erie St.
Cambridge, MA 02139
Phone: 617-583-1729
e-mail: [email protected]
FOR Plant Physiology Focus Issue on Plastid Biology
Plant Physiology Preview. Published on February 16, 2011, as DOI:10.1104/pp.110.169581
Copyright 2011 by the American Society of Plant Biologists
www.plantphysiol.orgon June 13, 2018 - Published by Downloaded from Copyright © 2011 American Society of Plant Biologists. All rights reserved.
2
TITLE
High levels of bioplastic are produced in fertile transplastomic tobacco plants engineered
with a synthetic operon for production of polyhydroxybutyrate
AUTHORS
Karen Bohmert-Tatarev,
Susan McAvoy,
Sean Daughtry,
Oliver P. Peoples,
Kristi D. Snell
INSTITUTION
Metabolix, Inc.
21 Erie St., Cambridge, MA, USA 02139
www.plantphysiol.orgon June 13, 2018 - Published by Downloaded from Copyright © 2011 American Society of Plant Biologists. All rights reserved.

3
FINANCIAL SOURCES
This work was supported in part by a Department of Energy Industry of the Future
Award (DE-FC07-011D14214) and a grant from the United States Department of
Agriculture (USDA-68-3A75-3-142).
CORRESPONDING AUTHOR
Kristi D. Snell
www.plantphysiol.orgon June 13, 2018 - Published by Downloaded from Copyright © 2011 American Society of Plant Biologists. All rights reserved.
4
ABSTRACT
An optimized genetic construct for plastid transformation of Nicotiana tabacum
for production of the renewable, biodegradable plastic polyhydroxybutyrate (PHB) was
designed using an operon extension strategy. Bacterial genes encoding the PHB pathway
enzymes were selected for use in this construct based on their similarity to the codon
usage and GC content of the tobacco plastome. Regulatory elements with limited
homology to the host plastome yet known to yield high levels of plastidial recombinant
protein production were used to enhance expression of the transgenes. A partial
transcriptional unit, containing genes of the PHB pathway and a selectable marker gene
encoding spectinomycin resistance, was flanked at the 5’ end by the host plant’s psbA
coding sequence and at the 3’ end by the host plant’s 3’ psbA untranslated region. This
design allowed insertion of the transgenes into the plastome as an extension of the psbA
operon, rendering the addition of a promoter to drive expression of the transgenes
unnecessary. Transformation of the optimized construct into tobacco and subsequent
spectinomycin selection of transgenic plants yielded T0 plants that were capable of
producing up to 18.8% dwt PHB in samples of leaf tissue. These plants were fertile and
produced viable seed. T1 plants producing up to 17.3% dwt PHB in samples of leaf tissue
and 8.8% dwt PHB in the total biomass of the plant were also isolated.
www.plantphysiol.orgon June 13, 2018 - Published by Downloaded from Copyright © 2011 American Society of Plant Biologists. All rights reserved.
5
INTRODUCTION
Sustainable, efficient, and economical methods for producing high quality bio-
based renewable materials, chemicals, and fuels are necessary to decrease the world’s
dependence on petroleum. To gain acceptance, bio-based products must either provide
differentiated performance through new properties or be able to compete with their
petroleum derived counterparts on cost. Polyhydroxyalkanoates (PHAs) are a family of
biodegradable, renewable plastics that possess properties spanning the range from
elastomeric materials to soft films to crystalline materials allowing their use in a variety
of applications currently served by petroleum based plastics. Differences in monomer
unit composition as well as polymer molecular weight form the basis of the wide range of
properties that can be obtained with these plastics (Abe and Doi, 2002; Feng et al., 2002;
Satkowski et al., 2002; Reddy et al., 2003). PHAs exist in nature within various bacteria
where they serve as a carbon storage material when the microbes are faced with a nutrient
limitation that impedes their growth and as a source of energy when more favorable
growth conditions return (Madison and Huisman, 1999; Suriyamongkol et al., 2007).
PHAs possess excellent stability and shelf life in use, coupled with an unique ability to
biodegrade in a wide range of environments including compost, soil, wetlands, marine,
and anaerobic digestion facilities (Jendrossek and Handrick, 2002). PHAs can also be
converted through simple processes to a range of chemical intermediates. For example
poly-3-hydroxypropionic acid can be converted to acrylic acid using a simple thermal
procedure (Zhong and Whitehouse, 2005). Similarly poly-3-hydroxybutyrate (PHB) can
be thermally converted to crotonic acid, a potential renewable platform chemical, which
can be readily transformed to a number of commodity chemicals including propylene by
decarboxylation (Peterson and Fischer, 2010) and butanol by hydrogenation (Coons,
2010). The ability to sequester PHAs in bacterial or plant biomass as an inert granular
material makes it possible to produce large amounts of a readily convertible polymeric
chemical precursor in a biological system where production of the chemical itself might
be toxic to the host.
Genetic engineering has allowed the enhancement and/or modification of native
microbial pathways for PHA production as well as the transfer of pathways to non-native
producers. Significant progress has been made in efforts to produce PHAs in microbial
www.plantphysiol.orgon June 13, 2018 - Published by Downloaded from Copyright © 2011 American Society of Plant Biologists. All rights reserved.

6
systems using large scale industrial fermentations of bacteria and select compositions of
materials produced using this technology are in commercial production (Snell and
Peoples, 2009; Coons, 2010). Direct production of PHAs in crop plants is another route
for large scale manufacture of these polymers and could be especially advantageous in
energy crops where a plant by-product, such as biomass or seed oil, could be used for
production of energy (Snell and Peoples, 2009). Most of the efforts to produce PHAs in
plants have focused on the homopolymer PHB or the copolymer poly-3-hydroxybutyrate-
co-3-hydroxyvalerate, although some effort has been directed towards the production of
medium chain length PHAs (Suriyamongkol et al., 2007; van Beilen and Poirier, 2008;
Snell and Peoples, 2009). To date, the highest levels of PHB have been achieved in
plastids (Suriyamongkol et al., 2007; van Beilen and Poirier, 2008; Snell and Peoples,
2009), likely due to the high flux of the PHB pathway substrate acetyl-CoA through this
organelle during fatty acid biosynthesis. In the model plant Arabidopsis thaliana, PHB
has been produced in leaf tissue samples at levels up to 4% of the tissue’s fresh weight
(equivalent to ~ 40% dwt PHB) in plants engineered with nuclear-encoded expression
cassettes for plastid-targeted enzymes (Bohmert et al., 2000). In other plants, PHB levels
ranging from trace amounts to 7.7% of the dry weight of the leaf or seed sample have
been achieved depending on the plant host (Poirier and Gruys, 2002; Suriyamongkol et
al., 2007; Snell and Peoples, 2009). PHB synthesis in biomass crops of industrial interest
such as switchgrass (Somleva et al., 2008), sugarcane (Petrasovits et al., 2007; Purnell et
al., 2007), and corn stover (Poirier and Gruys, 2002) have also been reported. Further
work is however needed to increase levels in these crops for commercial purposes.
One approach to increasing product yield is to increase expression of the PHB
pathway genes in the host plant. Plastid-encoded gene expression has yielded extremely
high levels of protein production, with transformants producing 45% (De Cosa et al.,
2001) to 70% (Oey et al., 2009) of the transgene encoded protein per unit of soluble leaf
protein, and up to 72% (Ruhlman et al., 2010) of the transgene encoded protein per unit
of total leaf protein in tobacco. While these expression levels are too high for most
metabolic engineering strategies for production of chemicals, fuels, or materials without
creating unwanted stress on the host plant, expression levels can be somewhat controlled
by the choice of regulatory elements flanking the transgenes. Plastid gene expression is
www.plantphysiol.orgon June 13, 2018 - Published by Downloaded from Copyright © 2011 American Society of Plant Biologists. All rights reserved.

7
regulated to a large extent at the post-transcriptional level (Sugita and Sugiura, 1996;
Stern et al., 1997; Bruick and Mayfield, 1999; Dubald et al., 2008) and 5’- and 3’-UTRs
have been shown to impact translational efficiency and mRNA stability, respectively
(Eibl et al., 1999). However these UTR sequences, as well as any other sequences with
significant homology to the host’s plastome, must be used with care since they can cause
unwanted rearrangements (Svab and Maliga, 1993; Staub and Maliga, 1994; Rogalski et
al., 2006; McCabe et al., 2008; Rogalski et al., 2008; Zhou et al., 2008; Gray et al., 2009).
Reducing the use of DNA fragments with homology to endogenous sequences and/or
replacing them with heterologous sequences can decrease the occurrence of unexpected
rearrangements (Nadai et al., 2009) but may yield lower transgene expression levels
(Ruhlman et al., 2010).
The first attempts to produce PHB in tobacco with plastid-encoded expression of
genes encoding the PHB biosynthetic pathway were successful in producing polymer,
however the success was limited in that polymer levels were very low (Nakashita et al.,
2001; Lössl et al., 2003; Arai et al., 2004; Lössl et al., 2005). These experiments were
performed with plastid transformation vectors that included minimal, if any, optimization
of transgene expression cassettes. Efforts included direct placement of a native bacterial
operon behind a plastid promoter (Nakashita et al., 2001), optimization of the ribosome
binding sites of PHB genes in a bacterial operon (Arai et al., 2004), placement of a
plastid promoter and plastid 5’-UTR in front of a native bacterial operon (Lössl et al.,
2003), and creation of a genetic construct where expression of the PHB genes is under the
control of an ethanol inducible expression system (Lössl et al., 2005). Of these strategies,
the highest levels of PHB were obtained using a plastidial promoter and 5’-UTR in front
of the native bacterial operon. Up to 1.7 % dwt PHB in leaves of tobacco plantlets
regenerated from callus was obtained, however subsequent growth of these plantlets for
three weeks under in vitro conditions reduced the average PHB content of lines to 20
ppm and lines were sterile (Lössl et al., 2003). Subsequent work reported that high level,
plastid-encoded expression of the phaA gene encoding the 3-ketothiolase enzyme can
result in sterile plants (Ruiz and Daniell, 2005). Since little success has been achieved
with nuclear-encoded expression systems for PHB genes encoding plastid-targeted
enzymes in tobacco (Arai et al., 2001; Bohmert et al., 2002), it was unclear whether the
www.plantphysiol.orgon June 13, 2018 - Published by Downloaded from Copyright © 2011 American Society of Plant Biologists. All rights reserved.

8
low yields obtained upon plastid-encoded expression of PHB genes were due to problems
associated with tobacco as a host system for PHB production, the inability to divert
substrate acetyl-CoA from fatty acid biosynthesis pathways, or to limitations in the
design of the plastid transformation constructs used in the experiments.
In this study, we chose to re-examine plastid-encoded PHB production using
tobacco as a host plant to determine if stable production of high levels of polymer could
be obtained in soil grown plants and to explore the potential of plastid-encoded gene
expression as a system for reliable engineering of multi-gene pathways for production of
industrial products. Our efforts focused on the enhancement and stabilization of
transgene expression by extending the psbA operon by four transgenes, the three genes
encoding the PHB pathway and a selectable marker. Short translational control elements
were used to optimize each transgene’s expression. In addition genes with similar codon
usage and GC content to the native tobacco plastome were chosen to further improve
expression. This strategy allowed the production of significantly higher levels of PHB in
both hetero- and autotrophically grown plants compared to previously published results
(Nakashita et al., 2001; Lössl et al., 2003; Arai et al., 2004; Lössl et al., 2005).
www.plantphysiol.orgon June 13, 2018 - Published by Downloaded from Copyright © 2011 American Society of Plant Biologists. All rights reserved.
9
RESULTS
Design of plastid transformation vectors
Tobacco was chosen as the host plant for plastid-encoded PHB production since
plastid transformation procedures, while available for an increasing number of crops, are
considered to be most routine in this plant (Maliga, 2003; Lutz et al., 2007). A set of
vectors for plastid transformation was designed to target insertion of transgenes encoding
enzymes of the PHB biosynthetic pathway behind the native psbA promoter and its
coding sequence. This so called operon-extension vector (Herz et al., 2005) reduces
repetition of plastidial sequences that may lead to unwanted rearrangements in the
plastome by eliminating the need for a promoter in the inserted DNA that may possess
homology to regions in the host’s plastid genome. The N. tabacum psbA coding sequence
was used as a left flank and the 3’ UTR of psbA, the trnH gene, and a partial sequence of
rpl2 was used as a right flank within the plastid transformation vectors to promote
homologous recombination into the selected site. Genes encoding the Acinetobacter sp.
thiolase (phaA) and synthase (phaC) (Schembri et al., 1995) and the B. megaterium
reductase (phaB) (McCool and Cannon, 1999) were chosen from the set of available PHB
biosynthetic pathway gene sequences since their GC content is similar to that of the N.
tabacum plastome and codons with a low frequency of use in the N. tabacum plastome
are either absent or rarely occur. The 5’UTR of gene 10 from bacteriophage T7 (Kuroda
and Maliga, 2001) and short (< 56 nucleotides) spacer elements of plastidial origin (Herz
et al., 2005) were used upstream of the individual transgenes to optimize expression.
Construct pCAB, containing the PHB pathway genes and the aadA gene conferring
resistance to spectinomycin was prepared using this strategy. Control constructs
pUCaadA, containing aadA, and pCA, containing genes encoding synthase and thiolase
as well as the aadA gene, were also prepared. The arrangements of transgene expression
cassettes and the identity of spacer elements in these transformation vectors are described
in detail in Table I.
Constructs pCAB, pCA, and pUCaadA were transformed into leaf sections of
Nicotiana tabacum L. cv Petite Havana using particle bombardment and subsequent
selection in the presence of spectinomycin yielded putative transplastomic plants for all
three constructs. PCR was used to confirm integration of the pCAB transgenic insert
www.plantphysiol.orgon June 13, 2018 - Published by Downloaded from Copyright © 2011 American Society of Plant Biologists. All rights reserved.

10
downstream of the psbA coding sequence using primers designed to bind to the host
plastidial sequences neighboring either the left or right flank, and a sequence within the
transgene of interest. Expected bands in PCR reactions designed to detect correct
integration were observed in total DNA isolated from candidate transgenic plants grown
under in vitro conditions but not in wild-type plants (Figure 1). Correct integration of
DNA into the plastome was also confirmed in Southern blotting experiments with DNA
from pCAB and control vector transformants using a probe with homology to a portion of
the aadA gene (Figure 1). In these experiments, the expected 3.04 kb fragment (Figure
1D) that would be present in plants containing correctly inserted DNA from pCAB into
the host plastome was observed. Likewise, 3.3 kb and 6.4 kb bands indicating correct
integration of DNA from the pUCaadA and pCA plastid transformation vectors,
respectively, were also observed (Figure 1D). An additional fragment of 5.4 kb was
detected in some of the CAB lines that will be discussed in detail later. Plants from
pCAB transformations were found to possess a slightly paler green phenotype and grew
slower than wild-type plants (Figure 2). These phenotypical differences persisted
throughout plant development. Four out of five plants transformed with the pCA plasmid
possessed a wild-type phenotype. However, one line developed slightly lighter green
young leaves when the plant was at a developmental stage in which it possessed between
five and ten leaves. This phenotypic alteration was not detectable during earlier or later
developmental stages. Plants generated with the pUCaadA control plasmids possessed a
wild-type phenotype.
Plants transformed with plasmid pCAB accumulate high levels of PHB in leaf tissue
Polymer content in plants transformed with pCAB was measured by gas
chromatography/mass spectrometry (GC/MS) procedures after subjecting tissue to a
simultaneous extraction and butanolysis procedure (Kourtz et al., 2007). Tissue from
seven independent transplastomic CAB lines was analyzed for PHB content over three
regeneration cycles using these procedures and average polymer levels ranging from 10.0
to 18.8% dwt PHB were observed (Figure 3). PHB levels in control plants transformed
with pUCaadA were similar to the PHB levels detected in wild-type plants (below 0.01%
dwt). Interestingly plants transformed with the pCA construct possessed PHB levels
www.plantphysiol.orgon June 13, 2018 - Published by Downloaded from Copyright © 2011 American Society of Plant Biologists. All rights reserved.

11
between 0 and 0.1% dwt with average PHB levels of 0.02 to 0.03% dwt. Since these
plants do not contain a reductase transgene, this observation suggests that an endogenous
enzyme activity present in the plastid is able to reduce acetoacetyl-CoA to R-3-
hydroxybutryl-CoA albeit at a low level.
Polymer from leaf tissue from the first regeneration cycle (R1) of CAB line #4
(Figure 3), containing 12.7 % dwt PHB, was found to have a weight averaged molecular
weight (Mw) of 471,000 + 37,000 using gel permeation chromatography techniques. The
polydispersity index of the polymer, defined as Mw divided by the number averaged
molecular weight (Mn) and an indication of the molecular weight distribution of the
polymer sample, was found to be 2.2 + 0.3.
Granules of PHB are localized in plastids
Transmission electron microscopy (TEM) was used to examine the distribution of
polymer granules in palisade and spongy mesophyll cells as well as in vascular tissue
(Figure 4) of CAB transformants. Leaf samples from CAB line 2.1, grown from seeds of
plants after two regeneration cycles and containing 6.3% dwt PHB, were sectioned for
these studies. Granular inclusions indicative of PHB formation were found in plastids of
all three cell types from the transplastomic line but not in samples obtained from wild-
type plants. There was no evidence for PHB granules outside the plastid in any of the
CAB lines analyzed. Interestingly, starch granules and plastoglobuli were either
significantly reduced or absent within PHB producing plastids (Figure 4) and PHB
granules often appeared to be co-localized with remnants of the plastoglobuli. This
apparent co-localization has also been observed in PHB producing lines of switchgrass
(Somleva et al., 2008).
Lines from pCAB transformations are fertile and produce progeny with high PHB
Since previous researchers have obtained sterile lines upon plastid transformation
of genes encoding the PHB pathway even though the plants produced low levels of PHB
(~20 ppm) (Lössl et al., 2003), the fertility of our high PHB producing CAB lines was
analyzed. All T0 CAB lines were found to be fertile and capable of setting seeds. PHB
production in T1 plants was examined by planting T1 seeds obtained from CAB lines 2
www.plantphysiol.orgon June 13, 2018 - Published by Downloaded from Copyright © 2011 American Society of Plant Biologists. All rights reserved.
12
and 6 (Figure 3) and allowing them to grow to maturity in a greenhouse. Leaf material
was sampled after one and two to three months of growth. T1 plants were found to
produce similar PHB levels as the original T0 parent plants with average PHB levels in T1
lines 2.1 through 2.8 reaching 15.0 + 1.0 and T1 lines 6.1 through 6.8 reaching 15.1 + 1.4
% dwt (Figure 5).
PHB was also found to occur primarily in the leaf tissue of T1 lines with little
produced in the seeds or roots. PHB content in T1 seed samples produced from T0 lines 2,
3, 6, 8, and 11 (Figure 3) ranged from 0.023 to 0.028 % of the seed weight. Root samples
from T1 lines CAB 2 and CAB 6 contained PHB ranging from 0.06 to 0.35% dwt. No
PHB was detected in seeds and roots from wild-type plants.
Expression of PHB pathway enzymes in T1 plants
Immunoblot analysis using antibodies prepared against the thiolase, reductase,
and synthase proteins was used to confirm the expression of the PHB pathway enzymes
in T1 plants. T1 seeds were germinated and grown in tissue culture in the presence of
spectinomycin for 46 days and plantlets were transferred to a greenhouse and grown for
an additional six days before the 3rd leaf from the bottom of the plant was harvested for
analysis. Proteins were separated by sodium dodecyl sulfate-polyacrylamide gel
electrophoresis (SDS-PAGE) and detected by Coomassie staining. Since PhaC binds to
granules of polymer (Gerngross et al., 1993), all SDS-PAGE gel analyses for PhaC were
performed using a total protein extract whereas gels to monitor expression of thiolase and
reductase were performed using soluble protein fractions. Detectable bands at the
expected size for PhaC (67.7 kDa) were found in all transplastomic lines analyzed in
both Coomassie stained gels and Western blots probed with polyclonal antibodies raised
against the PhaC protein from Ralstonia eutropha (Gerngross et al., 1993) suggesting
strong expression of the phaC gene (Figure 6A, B). In contrast, expression of phaA and
phaB was lower and more variable and bands for these proteins were only visible in
Western blots (Figure 6D, E), not in Coomassie stained gels (Figure 6C). The strong
expression of phaC in these plants was likely due to the use of the strong 5’UTR from
gene 10 of bacteriophage T7 to regulate its expression and possibly its position directly
behind the psbA coding sequence in the synthetic operon.
www.plantphysiol.orgon June 13, 2018 - Published by Downloaded from Copyright © 2011 American Society of Plant Biologists. All rights reserved.
13
T1 lines have delayed flowering but are fertile
Flowering of T1 lines was found to be delayed such that the T1 lines derived from
parental lines 2 and 6 took 44 to 49% longer to flower than wild-type plants (Figure 7A).
The delayed flowering could be in response to the slower growth and delayed
development of CAB transgenic lines. The plant height at maturity of T1 lines derived
from parental lines 2 and 6 was found, on average, to be ~80% of the height of wild-type
plants (Figure 7B). In general, the phenotype of T1 lines was similar to the parental T0
lines. However, in one out of 22 soil-grown T1 plants from line 6, a phenotype
substantially different than the parent phenotype was observed. This plant was smaller
and bushier and had curly, pointed leaves yet still produced PHB. We are currently
investigating the possible reasons for this phenotypic alteration.
Spatial Distribution of Polymer Production in a T1 line
To determine the distribution of PHB accumulation in CAB transplastomic plants,
a T1 seed from CAB line 2 from the R2 regeneration cycle (Figure 3) was germinated and
grown in vitro for seven weeks (after seed imbibition) prior to transfer to soil. The plant
was grown to maturity in the greenhouse for an additional eight weeks. Leaves and stems
from this plant were sectioned and the PHB content and dry weight of each section was
measured (Figure 8). PHB was found to accumulate at significantly higher levels in the
leaves than in the stems with the highest average levels of PHB per leaf reaching
approximately 15-16% dwt. Tissue at the tip of the leaf contained higher levels of PHB
than the younger base of the leaf in eight out of nine transversally sectioned leaves. In all
four stems of the plant analyzed, the leaves at positions in the middle of the stem showed
the highest levels of PHB production. In the two bolts, the most basal leaves were the
highest PHB producers. The total polymer content of the plant when PHB values of leaf
and stem tissue were weight averaged was found to be 8.8% dwt (Table II).
Interestingly, leaf tissue from this CAB plant was a greater percentage of the total plant
biomass (71%) than leaf tissue from wild-type plants (54%) (Table II).
Determination of homoplasmy
www.plantphysiol.orgon June 13, 2018 - Published by Downloaded from Copyright © 2011 American Society of Plant Biologists. All rights reserved.

14
Southern blot analysis of total DNA isolated from plants grown under in vitro
conditions was performed to visually determine the extent of homoplasmy of the lines
analyzed. For this experiment, a digoxigenin-labeled DNA probe homologous to a region
of the psbA gene (Probe 1, Figure 9) was used and the Southern blot was purposely
overexposed so that faint wild-type bands could be detected in DNA samples of
transplastomic lines. DNA from a wild-type control plant yielded the expected 2.4 kb
fragment of the wild-type plastome when digested with restriction enzyme Pst I and
probed with the labeled psbA DNA fragment (Figure 9E, lane wt). DNA from a plant
transformed with control plasmid pUCaadA in the R2 regeneration cycle yielded a 3.28
kb fragment as expected for insertion of the aadA gene (Figure 9E, lane PB1 R2). There
was little if any signal visible at 2.4 kb in the sample lane suggesting that this plant was
near homoplasmy. A plant transformed with control vector pCA in the R2 regeneration
cycle yielded a band close to the predicted 6.37 kb size (Figure 9E, lane CA4 R2). Again
there was little if any signal detectable at 2.4 kb in this sample suggesting that this plant
was near homoplasmy. Plants from transformations of pCAB from either the R1
regeneration cycle (Figure 9E, lines 4 & 6) or the R2 regeneration cycle (Figure 9E, lines
2, 3, 4, 6, 8, 10, & 11) yielded a prominent 4.12 kb fragment as expected for correct
integration of the transgenic DNA into the plastome. Little, if any, of the 2.4 kb fragment
expected for wild-type plastome was observed in these samples suggesting that these
plants had reached near homoplasmy in both the R1 and R2 regeneration cycles. An
additional fragment of 5.4 kb was also observed in some of the CAB lines that will be
discussed in detail later.
While overexposure of Southern blots allows the visualization of faint bands that
might occur in samples that are not homoplasmic, detection of a few wild-type plastome
copies in a sample dominated by transgenic plastomes is not possible with this technique.
Thus additional screening of select lines judged to be near homoplasmy was performed
by screening T1 seeds obtained from self-pollination on media containing spectinomycin.
This procedure allows detection of residual wild-type copies of the plastome in the parent
plant since these copies should be maternally inherited producing seeds with
spectinomycin sensitive seedlings. These seedlings are able to germinate in the presence
of the antibiotic but are visually distinguishable from spectinomycin resistant seedlings
www.plantphysiol.orgon June 13, 2018 - Published by Downloaded from Copyright © 2011 American Society of Plant Biologists. All rights reserved.

15
by their bleached phenotype. The best PHB producing T0 lines (lines 2, 3, and 6; Figure
3) were chosen for this analysis and T1 seeds obtained from self-pollination were
germinated on media both with and without 500 mg/ml spectinomycin. While
germination rates of lines 2 and 3 were low in this experiment (Table III), subsequent
studies with CAB seeds showed that reduced incubation times in the seed sterilization
agent can substantially improve germination. Three weeks after seed plating, a portion of
the germinating seeds on plates containing spectinomycin possessed mosaic white
patches on their cotyledons suggesting possible sensitivity to the antibiotic and
inheritance of some copies of the wild-type plastome. The percent of seedlings with
mosaic cotyledons ranged from 0.6 to 11.6% depending on the line analyzed (Table III).
Interestingly, seedlings with mosaic cotyledons did not show any mosaic patterns on their
true leaves during growth on medium containing selection agent, and none of the
seedlings grown on media without spectinomycin showed any mosaic patterns (Table
III).
Integrity of the transplastomic DNA insertion
Extensive unwanted recombination of sequences within plastid transformation
vectors with the host plastome has been observed previously in our laboratory, as well as
in other laboratories (Svab and Maliga, 1993; Staub and Maliga, 1994; Rogalski et al.,
2006; McCabe et al., 2008; Rogalski et al., 2008; Zhou et al., 2008; Gray et al., 2009),
when stretches of sequences homologous to the host plastome are present in the plastid
transformation vectors. When designing vector pCAB and its corresponding control
vectors, care was taken to avoid as many sequences with homology to the tobacco
plastome as possible in an attempt to prevent these unwanted recombination events.
Despite these efforts, additional bands were observed in Southern blots in some lines
using both a labeled aadA fragment (Probe 4, Figure 1D, 5.4 kb band in lines CAB 11 R1
and CAB 3 R2, & CAB 11 R2) and a labeled psbA fragment (Probe 1, Figure 9, 5.4 kb
band in CAB 4 R1 and CAB 3 R2). Southern blotting and PCR experiments designed to
determine the source of these unexpected bands lead to the realization that a portion of
the rpl2 gene included in the right flank could lead to an unwanted additional integration
event. The region chosen for the right flank in our plastid transformation vectors spans
www.plantphysiol.orgon June 13, 2018 - Published by Downloaded from Copyright © 2011 American Society of Plant Biologists. All rights reserved.
16
both the large single copy region [LSC, (Shinozaki et al., 1986)] and the inverted repeat
A region [IR-A, (Shinozaki et al., 1986; Staub, 2002), Figure 9A], such that a portion of
the right flank corresponding to a 490 bp fragment of the rpl2 gene is also located in the
inverted repeat B region [IR-B, (Shinozaki et al., 1986), Figure 10A]. Recombination of
only the rpl2 portion of the right flank with rpl2 within IR-B of the host plastome would
form the cointegrate (Klaus et al., 2004) in Figure 10C, in which the entire plastid
transformation vector is inserted in the plastome. To determine if this unwanted
integration event occurred, Probe 2 was designed to anneal to the rps19 gene downstream
of the rpl2 gene such that a 3.9 kb fragment would be detected if a cointegrate (Figure
10C) had formed at the second rpl2 locus in IR-B. Analysis of total DNA from selected
plant lines via Southern blotting procedures detected an expected 1.58 kb fragment that
should be present in all samples, including wild-type, with an intact rpl2 gene (Figure
10D). However, in some CAB transformants, an additional 3.9 kb fragment expected for
unwanted insertion of the transgenes at rpl2 in IR-B was detected (Figure 10D, lane CAB
4 R1). Since this fragment was faint, it appeared that cointegrates were present in only
some of the copies of the plastid genome within the plant. This is not surprising as
cointegrates are thought to be inherently unstable due to the presence of nearby direct
repeats of the left and/or right flank sequences. These sequence repeats can promote a
loop-out recombination event (Klaus et al., 2004) leading to the wild-type plastome
(Figure 10C). PCR experiments using primers KMB 157 and KMB 158 (Figure 10C)
provided confirmation of the formation of the rpl2-mediated cointegrates in IR-B and the
presence of vector backbone at the second rpl2 site producing the expected 0.7kb band in
PCR reactions (Figure 10E). Additional Southern blotting experiments were performed
with Probe 3, designed to bind at a portion of the pUC19 vector backbone. A faint 3.9 kb
fragment indicating the presence of vector backbone at the rpl2 locus in lines CAB 3 R1,
CAB 4 R1, and CAB 11 R1 was observed (Figure 10F). These same lines had previously
tested PCR positive for the presence of vector backbone at the second rpl2 locus (Figure
10E). A more intense band at 5.4 kb was also detected in CAB lines 3, 4, 8, and 11 in the
R1 regeneration cycle (Figure 10F). Interestingly, the 5.4 kb fragment was previously
detected in Southern blots probed with a labeled aadA fragment (Probe 4, Figure 1D;
lines CAB 11 R1, CAB 3 R2, and CAB 11 R2) and a labeled psbA fragment (Probe 1,
www.plantphysiol.orgon June 13, 2018 - Published by Downloaded from Copyright © 2011 American Society of Plant Biologists. All rights reserved.

17
Figure 9E; lines CAB 4 R1 and CAB 3 R2). While the origin of the 5.4 kb band is not
certain, bands of this size would be present in a cointegrate formed from integration of
the right flank only (Figure 10G) or in free, un-integrated plasmid (Figure 10H).
Additional experiments were not performed to differentiate between these two
possibilities since this was outside the scope of our investigation.
Vector backbone was also observed in some CA lines (Figure 10B, F).
Interestingly, CAB lines 2 and 6, our highest PHB producing lines (Figure 3) and the
lines that appeared to be closest to homoplasmy as determined through T1 seed plating
experiments (Table III), did not contain any vector backbone. In contrast, three of the
four lines with vector backbone (Figure 10F) were determined in separate experiments to
be unstable R1 or R2 lines, reverting to wild-type in some tissues, a possible consequence
of loop-out recombinations between the duplicated sequences expected in cointegrates
(Klaus et al., 2004). Line 3, containing the highest percentage of mosaic cotyledons in
the T1 seed plating experiments and thus likely possessing the most wild-type plastome
copies of the three lines analyzed, also contained the vector backbone. These results
suggest that screening of plants for “single flank” recombination events and vector
backbone insertion should be performed routinely in protocols to identify stable plastid
transformants.
www.plantphysiol.orgon June 13, 2018 - Published by Downloaded from Copyright © 2011 American Society of Plant Biologists. All rights reserved.

18
DISCUSSION
There is widespread interest among industrialized nations to develop viable
technologies for production of renewable fuels and energy. In the United States,
government policy is promoting the production of biofuels with legislation mandating the
blending of renewable fuels into gasoline with timelines for achieving designated quotas
(Sissine, 2007). Production of fuels from energy crops, such as perennial grasses and
industrial oilseeds, has the potential to help meet these blending quotas. The challenge to
the technology sector is to develop robust processes that provide economically viable
businesses. The production of value-added co-products in bioenergy crops makes the
production of biofuel and bioenergy more economically attractive by providing an
additional revenue stream. PHAs, a family of renewable biodegradable bioplastics, are an
ideal co-product for energy crops since their material properties allow them to access
many of the large markets currently served by petroleum based plastics, and markets for
these materials are scalable with the eventual widespread production of biofuels (Snell
and Peoples, 2009). The production of PHAs from renewable resources, as well as their
inherent biodegradability, makes these materials particularly attractive to industries that
are facing the challenge of becoming more environmentally responsible.
In our quest to continually improve multi-gene expression systems for the
production of industrial products in plants, we evaluated plastid-encoded expression
systems for production of PHB. Plastid transformation systems allow the expression of
multiple genes in polycistronic synthetic operons and the maternal inheritance of plastid
DNA in most plants provides a level of, albeit possibly not complete (Svab and Maliga,
2007; Sheppard et al., 2008), gene containment. Disadvantages of plastid
transformation systems include the limited number of plants that can be routinely
transformed and the extent of unwanted recombination that can occur if plastid
transformation vectors contain sequences that are homologous to the host’s plastome.
To evaluate the robustness of current plastid-encoded multi-gene expression
technologies for industrial purposes, we chose tobacco as the host plant for production of
PHB. Tobacco has historically been a difficult host plant for PHB production with
nuclear-encoded expression of genes fused to sequences encoding plastid targeting
signals yielding only 0.3% dwt PHB (Bohmert et al., 2002). For comparison purposes,
www.plantphysiol.orgon June 13, 2018 - Published by Downloaded from Copyright © 2011 American Society of Plant Biologists. All rights reserved.
19
similar nuclear-encoded, plastid targeting strategies have yielded up to ~40% dwt PHB in
leaf tissue of Arabidopsis (Bohmert et al., 2000), and up to 5.7 and 3.7 % dwt PHB in
corn (Poirier and Gruys, 2002) and switchgrass leaves (Somleva et al., 2008),
respectively. Previous attempts at plastid-encoded production in tobacco yielded up to ~
1.7% dwt PHB in young leaf tissue, a number that dropped to an average of 20 ppm upon
subsequent growth of the plants (Lössl et al., 2003).
When we designed and cloned our plastid transformation constructs, there were
some suggestions in the literature about unwanted rearrangements occurring between
regions of the transgenic insert and the host plastome if sequence homology was present
(Svab and Maliga, 1993; Staub and Maliga, 1994; Eibl et al., 1999). However,
researchers still routinely used regulatory elements including promoters and untranslated
regions with homology to sequences within the host plastome (Verma and Daniell, 2007),
often because these were the only sequences readily available for use. While our
experiments were in progress, the magnitude of the recombination issue was realized by
several laboratories (Huang et al., 2002; Rogalski et al., 2006; Zhou et al., 2008; Gray et
al., 2009) including our own. We had previously constructed several other generations of
plastid transformation constructs that contained duplications of endogenous tobacco
regulatory sequences and observed extensive recombination of our transgene expression
cassettes with the corresponding sites in the tobacco plastome. We therefore designed
expression cassettes such that minimal sequences with homology to the host plastome
were present in the vectors. This task was somewhat challenging since the majority of
regulatory sequences readily available at the time were tobacco sequences. As more
sequences with little to no homology to plant plastomes become available, such as the
5’UTR of gene 10 of bacteriophage T7 (Dunn and Studier, 1983; Kuroda and Maliga,
2001), this task should become more routine.
A synthetic operon extending from the endogenous copy of the psbA coding
sequence with transcription initiated at the endogenous psbA promoter was designed to
test PHB production. The necessity of a promoter within our transgene insert, and thus
the sequence homology that would be associated with the additional promoter, was
therefore avoided. So called “operon-extension vectors” that allow placement of
transgenes downstream of an endogenous promoter and coding sequence have been
www.plantphysiol.orgon June 13, 2018 - Published by Downloaded from Copyright © 2011 American Society of Plant Biologists. All rights reserved.

20
previously described using the reporter gene uidA encoding β-glucuronidase, and the
selectable marker aadA providing resistance to spectinomycin (Herz et al., 2005). To our
knowledge, our efforts are the first time this strategy has been used for the expression of
four transgenes. Transformation of the synthetic operon into tobacco and subsequent
selection for transformants yielded plants that contained significantly higher PHB levels
in both in vitro and greenhouse grown plants than what has previously been reported. In
greenhouse grown plants, we observed on average 10 to 18% dwt PHB in tissue
harvested from portions of leaves of transgenic lines (Figure 3). The maximum levels
reported by previous researchers in greenhouse grown plants were 8 ppm [~0.0008% dwt
PHB; (Nakashita et al., 2001)], 60 ppm [~0.006% dwt PHB; (Arai et al., 2004)], and
1031 ppm [~ 0.1% dwt PHB; (Lössl et al., 2003)]. While the reasons for the vast
difference in PHB accumulation levels between our experiments and those previously
reported are not definitively known, the design of our transformation vector for enhanced
expression of each transgene and limited homology to the host plastome are probable
reasons. Although our lines were paler green and smaller than wild-type plants, they
were fertile and produced viable seed. Transgenes remained stably integrated into the
next generation (T1 generation) and similar levels of PHB were found to accumulate in
the T0 and T1 generations. Previous researchers reported loss of flowers and male
sterility with PHB production at < 0.1% dwt in soil grown plants (Lössl et al., 2003).
The unexpected occurrence of low levels of PHB in plants transformed with the
pCA construct lacking the acetoacetyl-CoA reductase transgene suggests the presence of
an endogenous enzyme capable of converting acetoacetyl-CoA to R-3-hydroxybutyrl-
CoA. While it is currently unknown which endogenous activity in the plastids is capable
of catalyzing this reaction, one possible candidate is 3-ketoacyl-ACP reductase, an
enzyme in the fatty acid biosynthetic pathway. Bacterial equivalents of this enzyme have
been used to produce PHAs containing 3-hydroxybutrate monomers in recombinant
bacterial hosts (Park et al., 2005; Nomura et al., 2008) and the presence of this enzyme in
plant plastids makes it a likely candidate for the low levels of PHB observed in plants
transformed with the pCA construct.
PHB was found to accumulate at minimal levels in seeds and roots of our plants,
likely due to the transcription of the synthetic operon from the endogenous psbA
www.plantphysiol.orgon June 13, 2018 - Published by Downloaded from Copyright © 2011 American Society of Plant Biologists. All rights reserved.

21
promoter combined with different translational control elements. Although the psbA
promoter is known to produce mRNA in all tissues, its 5’UTR regulates the accumulation
of the psbA encoded D1 protein in photosynthetic tissue in response to light (Staub and
Maliga, 1993; Staub and Maliga, 1994). Low translational activity in non-photosynthetic
plastids initiated from the translational control elements used in our expression constructs
might be the cause for the low PHB accumulation observed in non-green tissues.
PHB accumulated to higher levels in leaves than in stems of the transplastomic
tobacco plants. The highest PHB levels were found in leaves located in the middle of the
stem, not in the oldest basal leaves of the plant, possibly because the oldest basal leaves
developed and matured while the plant was still small and had not reached its full
“production capacity”. Consistent with this interpretation, basal leaves on bolts of the
plant that formed when the plant was more mature contained higher levels of PHB than
leaves in the middle of the bolt. The PHB distribution pattern in the tobacco plant
analyzed in this study is similar to what has previously been observed in PHB producing
tobacco (Lössl et al., 2003), switchgrass (Somleva et al., 2008), and sugarcane (Purnell et
al., 2007) where maximum PHB accumulation was observed in fully developed mature
leaf tissues and older basal sections of leaves in general possessed more PHB than the
younger tips.
While it is unknown why our PHB producing plants contained a higher
percentage of their total biomass in leaf tissue than the corresponding wild-type plants
(Table II), this phenotypical difference could be a physiological response to reduced or
impaired photosynthesis. Previous researchers have shown that plants stressed by low
light conditions, as well as variegated plants, compensate for the reduced photosynthetic
efficiency of leaves by producing more leaf area per unit of biomass (Lee, 1986; Sadof
and Raupp, 1991; Yang and Sadof, 1995). This same response has also been observed in
tobacco transformed with a construct designed to reduce levels of the small subunit of
ribulose-1, 5-bisphosphate carboxylase-oxygenase (rbcS) via antisense (Quick et al.,
1991; Stitt and Schulze, 1994). Additional studies involving detailed analyses of the
photosynthetic capacity of the PHB producing transplastomic tobacco lines would need
to be performed to corroborate this theory.
www.plantphysiol.orgon June 13, 2018 - Published by Downloaded from Copyright © 2011 American Society of Plant Biologists. All rights reserved.

22
Despite our efforts to prevent recombination, we did observe some unexpected
events. In addition to the expected insertion of our transgenes downstream of the psbA
coding sequence, we observed the unexpected integration of the entire pCAB plastid
transformation vector, including the pUC19 vector backbone, into the second rpl2 gene
that is not adjacent to psbA. While this was a low frequency event, the plant lines that
possessed this recombination event also contained additional vector backbone in an
unknown location and were not our best lines in terms of PHB production or
homoplasmy. Future efforts using the psbA locus as the insertion site for plastid
transformation experiments can prevent this unwanted recombination event by removing
the rpl2 region from the right flank, yielding a considerably shorter right flank sequence
for homologous recombination. Alternatively, the unwanted presence of vector backbone
can easily be screened for via Southern blotting or PCR allowing the affected plants to be
identified and discarded from the pool of transgenics. Since single recombination events
initiated by homology between transgene and endogenous host plastome sequences is
known to happen frequently, this kind of vector backbone screening has become a routine
task in our lab.
One of the T1 plants produced during this study was smaller than the other T1
plants with a bushy phenotype. The cause of this altered phenotype is currently unknown
but could be due to unexpected random insertion of the construct into the nuclear genome
(tagged mutation), a spontaneous nuclear mutation, or an additional yet uncharacterized
plastidial recombination event(s). Additional studies are needed to determine the cause
of this phenotype.
The polymer produced in CAB lines was found to be a high molecular weight
molecule with a weight averaged molecular weight (Mw) of 471,000. This value is lower
than what is typically observed in a native bacterial PHB producer such as Cupriavidus
necator [formerly Alcaligenes eutropha; (Kawaguchi and Doi, 1992)]. This lower
molecular weight may be due to the high levels of PHA synthase observed in our plant
lines via Western blotting. It has been previously shown that the molecular weight of
PHB can be controlled in some bacterial (Sim et al., 1997) and in vitro systems
(Gerngross and Martin, 1995) with PHA synthase such that the Mw of the polymer
produced is inversely proportional to synthase activity.
www.plantphysiol.orgon June 13, 2018 - Published by Downloaded from Copyright © 2011 American Society of Plant Biologists. All rights reserved.
23
CONCLUSION
Plastid transformation is clearly a promising technique for expressing genes
necessary for producing fuels, chemicals, and materials in plants. In this study, we
evaluated the utility of plastid transformation in engineering a robust system for
expression of a multi-gene biosynthetic pathway for production of the bioplastic PHB.
The low levels of PHB as well as the plant sterility obtained by previous researchers had
provided some concern regarding the utility of this technique for stable high level
production of industrial products in plants. In this study we have shown that plastid
encoded expression of the PHB multi-gene pathway can produce high levels of PHB in
tobacco without affecting its fertility and that the engineered pathway is stably transferred
to the next generation. We have also shown that tobacco has the capability as a host
system to produce high levels of PHB, up to an average of 15-18% dwt PHB in samples
of leaf tissue and 8.8 % in the total biomass of the plant, despite earlier efforts with
nuclear and plastid transformation that resulted in the production of only low levels in
greenhouse grown plants (Nakashita et al., 2001; Bohmert et al., 2002; Lössl et al., 2003;
Arai et al., 2004). Duplication of this effort in the high yielding bioenergy crops that are
under consideration for the production of biofuels will require the development and/or
optimization of reliable, efficient plastid transformation procedures for these crops.
www.plantphysiol.orgon June 13, 2018 - Published by Downloaded from Copyright © 2011 American Society of Plant Biologists. All rights reserved.
24
MATERIALS AND METHODS
Plastid Transformation Vectors
The plastome of Nicotiana tabacum contains 23 codons with a low frequency of
use (<10/1000) (http://www.kazusa.or.jp/codon/). The presence of these codons in PHB
pathway genes from various natural PHA producers as well as the overall GC content of
the genes was compared to data available for the N. tabacum plastome. Genes from
Acinetobacter sp. (Schembri et al., 1995) and Bacillus megaterium (McCool and Cannon,
1999) were found to be most similar to the codon usage (i.e. avoids the use of codons
with a low frequency of use (<10/1000)) and GC content (< 50%) of the N. tabacum
plastome sequence and were chosen for use in plastid transformation vectors.
Detailed descriptions of the plastid transformation vectors used in this study as
well as references to pertinent DNA sequences are available in Table I. Plasmid
pJKD1425 (Schembri et al., 1995) was used as the source of the Acinetobacter sp. PHA
operon. Plasmid pGM10 (McCool and Cannon, 1999) was used as the source of PHB
genes from B. megaterium.
Plant Material and Transformation
Seeds of tobacco (Nicotiana tabacum L. cv Petite Havana SR1) were obtained
from Lehle Seeds (Round Rock, Texas). Plants in tissue culture were grown (16 h light
period, 20 to 30 µmol photons m-2 s-1, 23°C; 8 h dark period, 20°C) on Murashige and
Skoog medium (Murashige and Skoog, 1962) containing 2% (w/v) sucrose. Plastid
transformation was performed using a PDS 1000 System (BIO RAD, Hercules, CA,
USA) and 0.6 μm gold particles as previously described (Svab et al., 1990; Daniell,
1997). Selection of transplastomic lines was performed on Murashige and Skoog/sucrose
medium supplemented with 500 mg/L spectinomycin. Once transferred to soil, plants
were grown in growth chambers (16 h light period, 40 to 80 µmol photons m-2 s-1, 23°C;
8 h dark period, 20°C) or in a greenhouse with supplemental lighting (16 h light period,
minimum 150 µmol photons m-2 s-1, 23 -25°C; 8 h dark period, 20-22°C ).
www.plantphysiol.orgon June 13, 2018 - Published by Downloaded from Copyright © 2011 American Society of Plant Biologists. All rights reserved.

25
Genetic Analysis
Total DNA was isolated from in vitro or green house derived tobacco leaves using
the DNeasy kit (Qiagen, Santa Clarita, CA). PCR analysis of plants was performed
using 10-12 ng of total DNA with PCR Supermix Kit (Invitrogen). Total DNA was
isolated from in vitro or green house derived tobacco leaves using the DNeasy kit
(Qiagen, Santa Clarita, CA). Oligonucleotides for detection of transgenes included:
KMB 41 (5' ttg agc tgc gcc aaa gcc tc 3'); KMB 77 (5'- ctt gtg cta gaa ctt tag ctcg -3');
KMB 153 (5' - cca ccc atg tgg tac ttc att cta cg - 3'); and KMB 36 (5'- gag ttg tag gga ggc
aac cat ggc ag -3'). Binding sites of PCR primers designed to detect the PHB transgene
integration are shown in Figure 1. Oligonucleotides designed to detect the presence of a
vector backbone-containing cointegrate at the 2nd rpl2 locus in IR-B are KMB 157 (5’
gac cga tca ttg tgg gta taa tgg 3’) and KMB 158/M13R (5’ cag gaa aca gct atg ac 3’).
For Southern analysis, 2.5 to 7.5 μg of total DNA was digested with the indicated
restriction enzymes and blotted onto positively charged nylon membranes (Roche
Molecular Biochemicals, Indianapolis, IN). Digoxigenin-labeled hybridization probes for
detection of genetic elements were prepared with the DIG probe synthesis kit (Roche
Molecular Biochemicals) using the following oligonucleotides: Probe 4/aadA, KMB 85
(5'- ggc aga agc ggt gat cgc cga agt atc gac t -3') and KMB 86 (5-' gcc gac tac ctt ggt gat
ctc gcc ttt cac gta gtg gac -3'); Probe 1/psbA, KMB 96 (5'- ctt ctg taa ctg gat aac tag cac tg
-3') and KMB 97 (5'- gtt acc aag gaa cca tgc ata gca ctg -3'); Probe 2/rpl22,rps19, large
single copy region [LSC, (Shinozaki et al., 1986)], KMB 177 (5’ ggc cgc gaa ttt gat taa
tta ct ctt cg 3’) and KMB 178 (5’ ccg ggc atc tac cat tat acc cac aat g -3’); Probe 3/pUC19
vector backbone, KMB 123 (5’ ccg gga gct gca tgt gtc aga gg 3’) and KMB 181 (5’ cat
tct gag aat agt gta tgc ggc 3’). Hybridization signals were detected with alkaline-
phosphatase conjugated anti-digoxigenin antibody and chemoluminescent detection
(CDP-Star, Roche Molecular Biochemicals). The Dige marker VII (Roche Molecular
Biochemicals) was used as the DNA molecular weight marker for all southerns.
Intein-mediated Purification of Proteins
Purified protein samples of Acinetobacter sp. β-ketothiolase (PhaAAs) and
Bacillus megaterium acetoacetyl-CoA reductase (PhaBBm) were generated using the
www.plantphysiol.orgon June 13, 2018 - Published by Downloaded from Copyright © 2011 American Society of Plant Biologists. All rights reserved.

26
IMPACT-CN Protein Fusion and Purification System [New England Biolabs (NEB),
Beverly, MA]. The coding sequence of each gene was amplified by PCR and cloned
separately into vector pCR-BluntII-TOPO (Invitrogen, Carlsbad, CA). Primers used for
coding sequence amplification are as follows: phaA, KMB18 (5'-ctc gga tcc cat atg aaa
gat gtt gtg att gtt gca g-3') and KMB19 (5'-tgg aat tcc cgg ggt cac gtt caa ctg caa gtg caa
cac cc-3'); phaB, KMB17 (5'-ctc gga tcc cat atg aca aca tta caa ggt aaa gta g-3') and
KMB20 (5'-tgg aat tcc cgg gca tgt ata agc cgc cgt taa tgt tta act g-3'). The resulting
plasmids were digested with NdeI and SmaI and fragments encoding PhaAAs (1.1kb) and
PhaBBm (0.75 kb) were ligated into the C-terminal intein fusion vector pTYB2 (NEB).
Plasmids pTYB2A2 andpTYB2B19 were isolated encoding thiolase or reductase
proteins, respectively, fused at the C-terminus to the intein/chitin binding domain.
Plasmids were separately transformed into E. coli strain ER2566 (NEB) and grown at
37°C in one L of LB media supplemented with 100 mg/ml ampicillin. Cell cultures were
grown to mid-log phase prior to induction with 0.3 mM IPTG for 20 hours at 16°C. Cells
were lysed by sonication and soluble extracts were purified using the IMPACT Protein
Purification System (NEB) according to the manufacturer’s instructions. Purified B.
megaterium reductase samples possessed proteins that migrated at the expected relative
molecular weights in SDS-PAGE gels. N-terminal sequencing (Macromolecular
Structure Facility, Department of Biochemistry, Michigan State University, East Lansing,
MI) confirmed the isolation of the expected reductase protein. SDS-PAGE analysis of
Acinetobacter sp. β-ketothiolase obtained from purified protein preparations of E. coli
strain ER2566/pTYB2A2 revealed two major bands (40.6kDa and 55kDa), both
possessing an N-terminal amino acid sequence in the first 5 amino acids identical to β-
ketothiolase from Acinetobacter sp. The band with the expected molecular weight for
Acinetobacter sp. thiolase (40.6 kDa) was chosen for the production of polyclonal
antibodies.
Production of Antibodies
Samples of Acinetobacter sp. thiolase and Bacillus megaterium reductase proteins
purified with the IMPACT system were loaded onto SDS-PAGE gels, stained with
Coomassie blue, and bands corresponding to each protein were excised for use as
www.plantphysiol.orgon June 13, 2018 - Published by Downloaded from Copyright © 2011 American Society of Plant Biologists. All rights reserved.

27
antigen. Polyclonal antibodies were produced by Fitzgerald Industries International, Inc.
(Concord, MA) in SPF (pasturella) New Zealand White rabbits. The IgG fraction was
purified from the crude antibody mixture by protein A affinity chromatography.
The production of polyclonal antibodies to the R. eutropha synthase has been
described previously (Gerngross et al., 1993). Aliquots of these antibodies were further
purified with an acetone powder prepared from crude wild-type tobacco protein extracts
prior to use and were found to cross react sufficiently with the Acinetobacter sp. synthase
to allow its detection.
Protein Analysis
Crude cell lysates were prepared in 125 μl Cell Extraction Buffer (CEB Buffer:
100 mM Tris –HCl, pH 6.8, 10 mM EDTA, 4 mM β-mercaptoethanol, 0.1 mM PMSF)
by grinding 100 to 150 mg of tobacco tissue in liquid nitrogen. Insoluble proteins were
removed by centrifugation. The resulting crude soluble extracts were diluted 1:5 in CEB
buffer and protein concentrations were measured using the Bradford assay (Bradford,
1976) with reagent purchased from Biorad (Hercules, CA) using bovine serum albumin
as a standard. Samples of soluble protein extracts were diluted in 3x SDS Sample Buffer
(New England Biolabs, Beverly, MA), boiled, and loaded onto Novex precast Tris-
glycine gels (Invitrogen, Carlsbad, CA).
Total protein extracts for analysis of PHB synthase were prepared in CEB buffer
supplemented with 4% SDS to solubilize granule bound PHB synthase. Samples were
diluted with 3x SDS Sample buffer (New England Biolabs) prior to gel loading. To
standardize amounts of SDS containing total protein extracts loaded in each well of SDS-
PAGE gels, an initial gel was run with an equal amount of lysate in each lane and stained
with Coomassie blue. Loading volumes for subsequent SDS-PAGE gels were adjusted
based on comparative differences in band intensity of lanes.
For Western blots, proteins were transferred to PVDF membranes (Biorad) using
a Biorad Mini-Trans Blot cell. Transfer buffer consisted of 20% methanol, 25 mM Tris-
base and 192 mM glycine. Blots were blocked in TBS buffer (20 mM Tris-HCl, pH 7.5,
500 mM NaCl) supplemented with 0.05% Tween 20 and 3% blotting grade non-fat dry
milk (Biorad). Protein detection by immunoblotting was performed using goat anti-rabbit
www.plantphysiol.orgon June 13, 2018 - Published by Downloaded from Copyright © 2011 American Society of Plant Biologists. All rights reserved.
28
alkaline phosphatase-linked secondary antibodies in TBS supplemented with 0.05%
Tween 20 and 1% blotting grade non-fat dry milk. Protein bands were visualized using
the alkaline phosphatase conjugate substrate kit and BCIP/NBT color development
reagents (Biorad).
PHB Analysis
PHB concentrations in plant tissue were measured by gas chromatography/mass
spectroscopy (GC/MS) as previously described (Kourtz et al., 2007) using 30-150 mg of
lyophilized leaf material.
Polymer Extraction and Molecular Weight Determination
For molecular weight determination, plant tissue was prepared for analysis as
follows. A plant from line 4 obtained from transformation with plasmid pCAB after one
regeneration cycle (Figure 3) was grown in a green house with supplemental lighting for
approximately four months prior to MW analysis. Samples of plant tissue (~450 mgs
dwt) were heated in chloroform (1 mL per 17 mgs of dry tissue) at 61oC for four
hours. The CAB plant tissue sample was obtained from a plant that previously had been
determined to contain an average content of 12.7 % dwt PHB in a mixed sample of leaves
6 and 11. Cooled samples were triple filtered with 2 μm Teflon filters. The weight
averaged molecular weight (Mw) of the extracted polymer was determined by gel
permeation chromatography in chloroform calibrated against monodisperse polystyrene
standards with a Waters 2414 Refractive Index detector and three miniMix B 10 micron
columns in series (Polymer Laboratories, Amherst, MA). The polydispersity index,
equivalent to Mw/Mn where Mw is the weight average molecular weight and Mn is the
number averaged molecular weight, was calculated from Mw and Mn values determined
in gel permeation chromatography experiments. Data reported for Mw, Mn, and PDI of
CAB line 4 are average values obtained from two tissue samples from the same plant.
Transmission Electron Microscopy
Leaf samples were prepared for analysis by transmission electron microscopy by
fixing in 2% paraformaldehyde, 2% glutaraldehyde, 4% sucrose, 1 mM CaCl2, 2 mM
www.plantphysiol.orgon June 13, 2018 - Published by Downloaded from Copyright © 2011 American Society of Plant Biologists. All rights reserved.
29
MgCl2 in 50 mM sodium cacodylate buffer, pH 7.2. One cm square leaf pieces were cut
from the mid-blade area and cut into strips 0.5-1.0 mm wide while submerged in the
fixative. The fixative was vacuum infiltrated into the leaf tissue at ~70 kPa for several
cycles until most pieces sank. The fixation was conducted for 2 h at room temperature.
Tissue was rinsed in 3 changes of 50 mM sodium cacodylate buffer containing 4%
sucrose, and post-fixed in the same buffer with 1% osmium tetroxide for 8 h at 4oC.
Tissue was rinsed in several changes of distilled water and dehydrated in acetone by 10%
increments to 100% acetone, and gradually infiltrated (1:3, 1:2, 1:1, 2:1, 3:1, 100%) with
Ellis low-viscosity epoxy resin formulation (Ellis, 2006), an update of the Spurr's resin
mixture (Spurr, 1969). The samples received three changes of 100% resin at two hour
intervals and were embedded in the same and polymerized 16 h at 70oC. Sections were
cut at 60 nm thickness, mounted on copper grids, and stained 20 min at room temperature
with uranyl acetate (uranyl acetate solution was saturated at 4oC in 50% ethanol), and
three minutes in lead citrate (2.5 mg/ml in 0.1 N NaOH). Sections were observed at 80
kV in a JEOL JEM-100S transmission electron microscope and photographed with a
CCD camera (SIA, Model 7C). The images were adjusted for brightness and contrast,
and occasionally gamma, to best represent the image details of interest.
Growth of T1 Plants
T1 seeds of CAB lines 2 and 6 from the R2 regeneration cycle (Figure 3) were
germinated on Murashige and Skoog medium (Murashige and Skoog, 1962) containing
2% (w/v) sucrose. The medium for transgenic lines was supplemented with 500 mg/ml
spectinomycin. Wild-type plants were grown in tissue culture medium without
spectinomycin. Plants in tissue culture were grown with a 16 h light period (20 to 30
µmol photons m-2 s-1, 23°C) and an 8 h dark period at 20°C. Three weeks after seed
imbibition, germinated seedlings were transferred to tissue culture vessels and maintained
on the media described above. Six weeks after seed imbibition, six wild type plants and
eight plants of CAB lines 2 and 6, respectively, were transferred to a greenhouse with
supplemental lighting (16 h light period, minimum 150 µmol photons m-2 s-1, 23 -25°C; 8
h dark period, 20-22°C). The onset of formation of inflorescences was monitored. Days
until flowering were calculated from the day of seed imbibition until opening of the first
www.plantphysiol.orgon June 13, 2018 - Published by Downloaded from Copyright © 2011 American Society of Plant Biologists. All rights reserved.

30
flower of the first inflorescence. Plant height was measured at the end of the plant’s life
cycle.
ACKNOWLEDGMENTS
The authors thank Renate Ruszczyk for assistance with plant sampling and data
analysis and Mirel Sharxhi and Muna Ray for analytical help during the course of this
study. TEM was performed by Dale Callaham at the Central Microscopy Facility of the
University of Massachusetts, Amherst, MA.
www.plantphysiol.orgon June 13, 2018 - Published by Downloaded from Copyright © 2011 American Society of Plant Biologists. All rights reserved.

31
LITERATURE CITED
Abe H, Doi Y (2002) Molecular and Material Design of Biodegradable Poly(hydroxyalkanoate)s In Y Doi, A Steinbuchel, eds, Biopolymers Vol. 3b: Polyesters II - Properties and Chemical Synthesis. Wiley-VCH, Weinheim, pp 105 - 132
Arai Y, Nakashita H, Doi Y, Yamaguchi I (2001) Plastid Targeting of Polyhydroxybutyrate Biosynthetic Pathway in Tobacco. Plant Biotechnol J 18: 289-293
Arai Y, Shikanai T, Doi Y, Yoshida S, Yamaguchi I, Nakashita H (2004) Production of Polyhydroxybutyrate by Polycistronic Expression of Bacterial Genes in Tobacco Plastid. Plant Cell Physiol 45: 1176-1184
Bohmert K, Balbo I, Kopka J, Mittendorf V, Nawrath C, Poirier Y, Tischendorf G, Trethewey RN, Willmitzer L (2000) Transgenic Arabidopsis plants can accumulate polyhydroxybutyrate to up to 4% of their fresh weight. Planta 211: 841-845
Bohmert K, Balbo I, Steinbuchel A, Tischendorf G, Willmitzer L (2002) Constitutive Expression of the β-Ketothiolase Gene in Transgenic Plants. A Major Obstacle for Obtaining Polyhydroxybutyrate-Producing Plants. Plant Physiol 128: 1282-1290
Bradford MM (1976) A rapid and sensitive method for the quantitation of microgram quantities of protein utilizing the principle of protein-dye binding. Anal Biochem 72: 248-254
Bruick RK, Mayfield SP (1999) Light-activated translation of chloroplast mRNAs. Trends Plant Sci 4: 190-195
Coons R (2010) Industrial Biotechnology Turning Process Engineering into Profits. Chem Week November 15
Daniell H (1997) Transformation and foreign gene expression in plants mediated by microprojectile bombardment. In R Tuan, ed, Methods in Molecular Biology, Vol 62. Humana Press Inc., Totowa, NJ, pp 463-489
De Cosa B, Moar W, Lee S-B, Miller M, Daniell H (2001) Overexpression of the Bt cry2Aa2 operon in chloroplasts leads to formation of insecticidal crystals. Nat Biotechnol 19: 71-74
Dubald M, Tissot G, Dufourmantel N, Goutorbe F (2008) The Engineering of Recombinant Plastids in Higher Plants. In A Kumar, SK Sopory, eds, Recent Advances in Plant Biotechnology and its Applications. J. K. International, New Delhi, pp 36-59
Dunn JJ, Studier FW (1983) Complete nucleotide sequence of bacteriophage T7 DNA and the locations of T7 genetic elements. J Mol Biol 166: 477-535
Eibl C, Zou Z, Beck A, Kim M, Mullet J, Koop H-U (1999) In vivo analysis of plastid psbA, rbcL and rpl32 UTR elements by chloroplast transformation: tobacco plastid gene expression is controlled by modulation of transcript levels and translation efficiency. Plant J 19: 333-345
www.plantphysiol.orgon June 13, 2018 - Published by Downloaded from Copyright © 2011 American Society of Plant Biologists. All rights reserved.
32
Ellis EA (2006) Solutions to the problem of substitution of ERL 4221 for vinyl cyclohexene dioxide in Spurr low viscosity embedding formulations. Microscopy Today 14: 32-33
Feng L, Watanabe T, Wang Y, Kichise T, Fukuchi T, Chen G-Q, Doi Y, Inoue Y (2002) Studies on Comonomer Compositional Distribution of Bacterial Poly(3-hydroxybutyrate-co-3-hydroxyhexanoate)s and Thermal Characteristics of Their Factions. Biomacromolecules 3: 1071-1077
Gerngross T, Martin D (1995) Enzyme-Catalyzed Synthesis of Poly[(R)-(-)-3-Hydroxybutyrate]: Formation of Macroscopic Granules In vitro. Proc Natl Acad Sci USA 92: 6279-6283
Gerngross TU, Reilly P, Stubbe J, Sinskey AJ, Peoples OP (1993) Immunocytochemical analysis of poly-beta-hydroxybutyrate (PHB) synthase in Alcaligenes eutrophus H16: localization of the synthase enzyme at the surface of PHB granules. J Bacteriol 175: 5289-5293
Gray BN, Ahner BA, Hanson MR (2009) Extensive homologous recombination between introduced and native regulatory plastid DNA elements in transplastomic plants. Transgenic Res 18: 559-572
Herz S, Füβl M, Steiger S, Koop H-U (2005) Development of Novel Types of Plastid Transformation Vectors and Evaluation of Factors Controlling Expression. Transgenic Res 14: 969-982
Huang F, Klaus S, Herz S, Zou Z, Koop H, Golds T (2002) Efficient plastid transformation in tobacco using the aphA-6 gene and kanamycin selection. Mol Genet Genomics 268: 19-27
Jendrossek D, Handrick R (2002) Microbial degradation of polyhydroxyalkanoates. Annu Rev Microbiol 56: 403-432
Kawaguchi Y, Doi Y (1992) Kinetics and mechanism of synthesis and degradation of poly(3-hydroxybutyrate) in Alcaligenes eutrophus. Macromolecules 25: 2324-2329
Klaus SM, Huang FC, Golds TJ, Koop HU (2004) Generation of marker-free plastid transformants using a transiently cointegrated selection gene. Nat Biotechnol 22: 225-229
Kourtz L, Dillon K, Daughtry S, Peoples OP, Snell KD (2007) Chemically inducible expression of the PHB biosynthetic pathway in Arabidopsis. Transgenic Res 16: 759-769
Kuroda H, Maliga P (2001) Sequences Downstream of the Translation Initiation Codon Are Important Determinants of Translation Efficiency in Chloroplasts. Plant Physiol 125: 430-436
Lee D (1986) Unusual strategies of light absorption in rain-forest herbs. In T Givnish, ed, On the economy of plant form and function. Cambridge University, New York
Lössl A, Bohmert K, Harloff H, Eibl C, Mühlbauer S, Koop H-U (2005) Inducible Trans-Activation of Plastid Transgenes: Expression of the R. eutropha phb Operon in Transplastomic Tobacco. Plant Cell Physiol 46: 1462-1471
Lössl A, Eibl C, Harloff HJ, Jung C, Koop H-U (2003) Polyester Synthesis in Transplastomic Tobacco (Nicotiana tabacum L.): Significant Contents of Polyhydroxybutyrate are Associated with Growth Reduction. Plant Cell Rep 21: 891-899
www.plantphysiol.orgon June 13, 2018 - Published by Downloaded from Copyright © 2011 American Society of Plant Biologists. All rights reserved.

33
Lutz KA, Azhagiri AK, Tungsuchat-Huang T, Maliga P (2007) A guide to choosing vectors for transformation of the plastid genome of higher plants. Plant Physiol 145: 1201-1210
Madison LL, Huisman GW (1999) Metabolic Engineering of Poly(3-Hydroxyalkanoates): From DNA to Plastic. Microbiol Mol Biol Rev 63: 21-53
Maliga P (2003) Progress towards commercialization of plastid transformation technology. Trends Biotechnol 21: 20-28
McCabe MS, Klaas M, Gonzalez-Rabade N, Poage M, Badillo-Corona JA, Zhou F, Karcher D, Bock R, Gray JC, Dix PJ (2008) Plastid transformation of high-biomass tobacco variety Maryland Mammoth for production of human immunodeficiency virus type 1 (HIV-1) p24 antigen. Plant Biotechnol J 6: 914-929
McCool GJ, Cannon MC (1999) Polyhydroxyalkanoate inclusion body-associated proteins and coding region in Bacillus megaterium. J Bacteriol 181: 585-592
Murashige T, Skoog F (1962) A revised medium for rapid growth and bioassays with tobacco tissue cultures. Physiol Plantarum 15: 473-497
Nadai M, Bally J, Vitel M, Job C, Tissot G, Botterman J, Dubald M (2009) High-level expression of active human alpha1-antitrypsin in transgenic tobacco chloroplasts. Transgenic Res 18: 173-183
Nakashita H, Arai Y, Shikanai T, Doi Y, Yamaguchi I (2001) Introduction of Bacterial Metabolism into Higher Plants by Polycistronic Transgene Expression. Biosci Biotechnol Biochem 65: 1688-1691
Nomura CT, Tanaka T, Eguen TE, Appah AS, Matsumoto K, Taguchi S, Ortiz CL, Doi Y (2008) FabG mediates polyhydroxyalkanoate production from both related and nonrelated carbon sources in recombinant Escherichia coli LS5218. Biotechnol Prog 24: 342-351
Oey M, Lohse M, Kreikemeyer B, Bock R (2009) Exhaustion of the chloroplast protein synthesis capacity by massive expression of a highly stable protein antibiotic. Plant J 57: 436-445
Park SJ, Choi J-I, Lee SY (2005) Engineering of Escherichia coli fatty acid metabolism for the production of polyhydroxyalkanoates. Enzyme Microb Tech 36: 579-588
Peterson AA, Fischer CR, inventors. September 9, 2010. Conversion of natural products including cellulose to hydrocarbons, hydrogen and/or other related compounds. US Patent Application No. 2010/0228067
Petrasovits LA, Purnell MP, Nielsen LK, Brumbley S, M. (2007) Production of polyhydroxybutyrate in sugarcane. Plant Biotechnol J 5: 162-172
Poirier Y, Gruys KJ (2002) Production of polyhydroxyalkanoates in transgenic plants. In Y Doi, A Steinbüchel, eds, Biopolymers: Polyesters I - Biological Systems and Biotechnological Production, Vol 3a. Wiley-VCH, Weinheim, pp 401-435
Purnell MP, Petrasovits LA, Nielsen LK, Brumbley SM (2007) Spatio-temporal characterisation of polyhydroxybutyrate accumulation in sugarcane. Plant Biotechnol J 5: 173-184
Quick WP, Schurr U, Fichtner K, Schulze ED, Rodermel SR, Bogorad L, Stitt M (1991) The impact of decreased Rubisco on photosynthesis, growth, allocation and storage in tobacco plants which have been transformed with antisense rbcS. Plant J 1: 51-58
www.plantphysiol.orgon June 13, 2018 - Published by Downloaded from Copyright © 2011 American Society of Plant Biologists. All rights reserved.

34
Reddy CSK, Ghai R, Kalia VC (2003) Polyhydroxyalkanoates: an overview. Bioresource Technol 87: 137-146
Rogalski M, Ruf S, Bock R (2006) Tobacco plastid ribosomal protein S18 is essential for cell survival. Nucleic Acids Res 34: 4537-4545
Rogalski M, Schottler MA, Thiele W, Schulze WX, Bock R (2008) Rpl33, a nonessential plastid-encoded ribosomal protein in tobacco, is required under cold stress conditions. Plant Cell 20: 2221-2237
Ruhlman T, Verma D, Samson N, Daniell H (2010) The Role of Heterologous Chloroplast Sequence Elements in Transgene Integration and Expression. Plant Physiol 152: 2088-2104
Ruiz ON, Daniell H (2005) Engineering Cytoplasmic Male Sterility via the Chloroplast Genome by Expression of β-Ketothiolase. Plant Physiol 138: 1232-1246
Sadof CS, Raupp MJ (1991) Effect of Variegation in Euonymus japonica var. aureus on Two Phloem Feeding Insects, Unaspis euonymi (Homoptera: Diaspididae) and Aphis fabae (Homoptera: Aphididae). Environ Entomol 20: 83-89
Satkowski M, Melik D, Autran J-P, Green P, Noda I, Schechtman L (2002) Physical and Processing Properties of Polyhydroxyalkanoate Copolymers. In Y Doi, A Steinbuchel, eds, Biopolymers Vol. 3b: Polyesters II - Properties and Chemical Synthesis. Wiley-VCH, Weinheim, pp 231-263
Schembri MA, Bayly RC, Davies JK (1995) Phosphate concentration regulates transcription of the Acinetobacter polyhydroxyalkanoic acid biosynthetic genes. J Bacteriol 177: 4501-4507
Sheppard AE, Ayliffe MA, Blatch L, Day A, Delaney SK, Khairul-Fahmy N, Li Y, Madesis P, Pryor AJ, Timmis JN (2008) Transfer of plastid DNA to the nucleus is elevated during male gametogenesis in tobacco. Plant Physiol 148: 328-336
Shinozaki K, Ohme M, Tanaka M, Wakasugi T, Hayashida N, Matsubayashi T, Zaita N, Chunwongse J, Obokata J, Yamaguchi-Shinozaki K, Ohto C, Torazawa K, Meng BY, Sugita M, Deno H, Kamogashira T, Yamada K, Kasuda J, Takaiwa F, Kato A, Tohdoh N, Shimada H, Sugiura M (1986) The complete nucleotide sequence of the tobacco chloroplast genome: its gene organization and expression. EMBO J. 5: 2043-2049
Sim S, Snell K, Hogan S, Stubbe J, Rha C, Sinskey A (1997) PHA synthase activity controls the molecular weight and polydispersity of polyhydroxybutyrate in vivo. Nat Biotechnol 15: 63-67
Sissine F (2007) Energy Independence and Security Act of 2007: A Summary of Major Provisions. A CRS Report for Congress. http://energy.senate.gov/public/_files/RL342941.pdf
Snell KD, Peoples OP (2009) PHA bioplastic: A value-added coproduct for biomass biorefineries. Biofuel Bioprod Bior 3: 456-467
Somleva MN, Snell KD, Beaulieu JJ, Peoples OP, Garrison BR, Patterson NA (2008) Production of polyhydroxybutyrate in switchgrass, a value-added co-product in an important lignocellulosic biomass crop. Plant Biotechnol J 6: 663-678
Spurr AR (1969) A low-viscosity epoxy resin embedding medium for electron microscopy. J Ultrastruct Res 26: 31-43
www.plantphysiol.orgon June 13, 2018 - Published by Downloaded from Copyright © 2011 American Society of Plant Biologists. All rights reserved.

35
Staub JM (2002) Expression of Recombinant Proteins via the Plastid Genome. In V Vinci, A., SR Parekh, eds, Handbook of Industrial Cell Culture: Mammalian, Microbial, and Plant Cells. Humana Press, Totowa, NJ, pp 259-278
Staub JM, Maliga P (1993) Accumulation of D1 polypeptide in tobacco plastids is regulated via the untranslated region of the psbA mRNA. EMBO J 12: 601-606
Staub JM, Maliga P (1994) Extrachromosomal elements in tobacco plastids. Proc Natl Acad Sci USA 91: 7468-7472
Staub JM, Maliga P (1994) Translation of psbA mRNA is regulated by light via the 5'-untranslated region in tobacco plastids. Plant J 6: 547-553
Stern DS, Higgs DC, Yang J (1997) Transcription and translation in chloroplasts. Trends Plant Sci 2: 308-315
Stitt M, Schulze D (1994) Does Rubisco control the rate of photosynthesis and plant growth? An exercise in molecular ecophysiology. Plant Cell Environ 17: 465-487
Sugita M, Sugiura M (1996) Regulation of gene expression in chloroplasts of higher plants. Plant Mol Biol 32: 315-326
Suriyamongkol P, Weselake R, Narine S, Moloney M, Shah S (2007) Biotechnological approaches for the production of polyhydroxyalkanoates in microorganisms and plants - A review. Biotechnol Adv 25: 148-175
Svab Z, Hajdukiewicz P, Maliga P (1990) Stable transformation of plastids in higher plants. Proc Natl Acad Sci USA 87: 8526-8530
Svab Z, Maliga P (1993) High-frequency plastid transformation in tobacco by selection for a chimeric aadA gene. Proc Natl Acad Sci USA 90: 913-917
Svab Z, Maliga P (2007) Exceptional transmission of plastids and mitochondria from the transplastomic pollen parent and its impact on transgene containment. Proc Natl Acad Sci USA 104: 7003-7008
van Beilen JB, Poirier Y (2008) Production of renewable polymers from crop plants. Plant J 54: 684-701
Verma D, Daniell H (2007) Chloroplast vector systems for biotechnology applications. Plant Physiol 145: 1129-1143
Yang J, Sadof C (1995) Variegation in Coleus blumei and the Life History of Citrus Mealybug (Homoptera: Pseudococcidae). Environ Entomol 24: 1650-1655
Yanisch-Perron C, Vieira J, Messing, J. (1985) Improved M13 phage cloning vectors and host strains: nucleotide sequences of the M13mp18 and pUC19 vectors. Gene 33: 103-119
Zhong L, Whitehouse RS, inventors. May 24, 2005. Methods of making intermediates from polyhydroxyalkanoates. US Patent No. 6,897,338
Zhou F, Badillo-Corona JA, Karcher D, Gonzalez-Rabade N, Piepenburg K, Borchers AM, Maloney AP, Kavanagh TA, Gray JC, Bock R (2008) High-level expression of human immunodeficiency virus antigens from the tobacco and tomato plastid genomes. Plant Biotechnol J 6: 897-913
www.plantphysiol.orgon June 13, 2018 - Published by Downloaded from Copyright © 2011 American Society of Plant Biologists. All rights reserved.

36
Figure Captions. Figure 1. Integration of pCAB at psbA locus. Diagram illustrating the genetic
arrangement of (A) the wild-type psbA locus and (B) the expected genetic arrangement of
the psbA locus after plastid transformation with pCAB. Binding sites of PCR primers
used to verify correct insertion of the transgenic DNA behind the psbA coding sequence
(KMB 77, KMB 41, KMB 36, and KMB 153) are shown in (B) along with the size of
each predicted PCR product. (C) Agarose gel electrophoresis of PCR reactions
demonstrating correct integration of the transgenic DNA. M, marker; Wt, wild-type plant.
Samples 2, 3, 6, and 8 are derived from CAB plant lines 2, 3, 6 and 8 in the R2
regeneration cycle (See Figure 3 for explanation of regeneration cycles). (D) Southern
blot of Pst I digested genomic DNA from transplastomic and wild-type lines probed with
Probe 4, a DNA fragment with homology to the aadA gene. Genomic DNA was isolated
from the following lines: Wt, wild-type; PB1 R2, line obtained after plastid
transformation of pUCaadA in the R2 regeneration cycle; CA 4 R2, line obtained after
plastid transformation of pCA in the R2 regeneration cycle; CAB R1 lines 6 and 11, lines
obtained after plastid transformation of plasmid pCAB in the R1 regeneration cycle; CAB
R2 lines 2, 3, 4, 6, 8, 10, and 11, lines obtained after plastid transformation of pCAB in
the R2 regeneration cycle. Arrow shows expected 3.04 kb band for expected integration
event for CAB lines.
Figure 2. Phenotype of transplastomic lines obtained after transformation of pCAB. (A)
Wild-type (left) and transplastomic CAB 2 R2 (right) plants after growth in tissue culture
and subsequent transfer to soil. Both plants were grown in the greenhouse in soil for 19
days. The total age of the wild-type and CAB 2 R2 plants (including tissue culture
growth) is 6 and 10 weeks, respectively. Line CAB 2 R2 was obtained after plastid
transformation of pCAB, isolation of a regenerant, and one additional cycle of shoot
regeneration from an excised leaf (R2 regeneration cycle described in Figure 3). (B)
Wild-type (left) and transplastomic CAB 2 R2 T1 (right) plants after 63 and 85 days of
growth, respectively, in the greenhouse. Line CAB 2 was grown from T1 seed produced
from a line obtained after plastid transformation of plasmid pCAB, isolation of a
regenerant, and performance of one additional cycle of shoot regeneration from an
www.plantphysiol.orgon June 13, 2018 - Published by Downloaded from Copyright © 2011 American Society of Plant Biologists. All rights reserved.
37
excised leaf (R2 regeneration cycle). Growth of plants in (A) and (B) was staggered so
that comparison of plants at similar developmental stages could be recorded. Mesh bags
shown in (B) were used for seed collection. (C) Leaves harvested from wild-type and
transplastomic CAB plants of equivalent age. Each plant was grown in tissue culture and
then transferred to soil and grown for an additional 20 days in a greenhouse. The total age
of each plant at the time of harvest was two months. Each harvested leaf is leaf eight,
where leaf one is defined as the oldest leaf of the plant. Lines are as follows: WT, wild-
type; CAB 4 R1, line obtained after plastid transformation and isolation of a regenerant
(R1 regeneration cycle described in Figure 3); CAB 11 R1, line in R1 regeneration cycle.
Figure 3. PHB production in leaf samples of greenhouse-grown transplastomic lines over
three regeneration cycles. Regeneration cycles in the legend are as follows: R1, lines
obtained after plastid transformation of pCAB and isolation of regenerant; R2, R1 lines
that were subjected to one additional cycle of shoot regeneration from an excised leaf;
R3, R2 lines that were subjected to another additional cycle of shoot regeneration from an
excised leaf. Samples from the R2 regeneration cycle of line 4 and the R1 regeneration
cycle of line 10 were not analyzed. Data points represent the average of two mature to
senescent leaf samples harvested from the indicated line. One of these samples was
harvested from leaf four to seven (oldest leaf of plant is defined as leaf one), the other
sample was harvested from leaf eight to twelve of the plant. Error bars represent standard
deviation.
Figure 4. Polyhydroxybutyrate accumulation in tobacco leaves. Transmission electron
micrographs were obtained from samples of leaf 17 (leaf 1 is defined as oldest leaf of
plant) from wild-type plants and CAB line 2.1, a plant obtained from seeds formed from
a plant in the R2 regeneration cycle (see Figure 3 for the definition of regeneration cycle).
Cells from the palisade and spongy mesophyll layers as well as from vascular bundles
were analyzed. Abbreviations are as follows. S, starch granules; P, plastoglobuli; G,
PHB granules. Scale bars in the lower left hand corner indicate 1 μM.
www.plantphysiol.orgon June 13, 2018 - Published by Downloaded from Copyright © 2011 American Society of Plant Biologists. All rights reserved.

38
Figure 5. PHB production in T1 progeny of CAB lines 2 and 6. Seeds obtained from
plants in the R2 regeneration cycle from CAB lines 2 and 6 (Figure 3) were germinated
on tissue culture medium in the presence of spectinomycin as described in Materials and
Methods. Plantlets were transferred to soil and grown in the green house. Leaf tissue
samples were taken after 1 and 2-3 months of growth. WT, wild-type line. Lines 2.8,
2.7, 2.3, 2.2, 2.5, 2.6, 2.4, and 2.1 are T1 progeny from parental CAB line 2. Lines 6.2,
6.3, 6.5, 6.8, 6.6, 6.4, 6.7, and 6.1 are T1 progeny from parental CAB line 6. Each data
point is an average of two different leaf tissue samples with the error bars representing
the standard deviation. One of these samples was harvested from leaf three to five (oldest
leaf of plant is defined as leaf one), the other sample was harvested from leaf eight to
thirteen of the plant.
Figure 6. Expression of transgenes in leaf tissue of T1 plants. Synthase (A, B), thiolase
(C, D), and reductase (C, E) enzymes were detected in extracts prepared from leaf tissue
of T1 lines obtained from seed of parent line CAB 6 from the R2 regeneration cycle
(Figure 3). (A) SDS-PAGE gel of whole SDS solubilized cell lysates prepared from
tobacco leaf tissue. Samples are as follows: M, molecular weight marker; wt, wild-type
line; 1, 2, 3, 4, 6, 7, and 8, T1 lines obtained from parent line CAB 6. Lane C contains 268
ng of purified Acinetobacter sp. PHA synthase mixed with 30 μg of whole lysate
obtained from a wild-type plant. (B) Western blot of whole SDS solubilized cell lysates
probed with polyclonal antibodies prepared against the PHA synthase protein from
Ralstonia eutropha. For line designations, see (A). Lane C contains 268 ng of purified
Acinetobacter sp. PHA synthase mixed with 30 μg of whole lysate obtained from a wild-
type plant. (C) SDS-PAGE gel of soluble protein extracts (15 μg) prepared from tobacco
leaf tissue. For line designations, see (A). (D) Western blot of soluble extracts (15 μg)
probed with polyclonal antibodies prepared to the β-ketothiolase protein from
Acinetobacter sp. For line designations, see (A). Lane C contains 108 ng of purified
Acinetobacter sp. β-ketothiolase protein. Antibodies to thiolase were diluted 1:5000
before use. (E) Western blot of soluble extracts (15 μg) probed with polyclonal
antibodies prepared to the acetoacetyl-CoA reductase protein from Bacillus megaterium.
www.plantphysiol.orgon June 13, 2018 - Published by Downloaded from Copyright © 2011 American Society of Plant Biologists. All rights reserved.

39
For line designations, see (A). Lane C contains 331 ng of purified Acinetobacter sp.
reductase protein. Antibodies to reductase were diluted 1:250 before use.
Figure 7. Comparison of the average days to flowering (A) and height (B) of wild-type
and PHB producing CAB lines. Plants were grown in the green house and days to
flowering (when first flowers formed) and the height of the plant at seed set was recorded
for each line. Each data point is an average of values from eight transplastomic lines or
six wild-type plants. Error bars represent standard deviation. Lines are as follows: wt,
wild-type; CAB 2 R2 T1 and CAB 6 R2 T1, T1 lines obtained from seed of parental lines
CAB lines 2 and 6 in the R2 regeneration cycle. The PHB value of parental lines 2 and 6
is shown in Figure 3.
Figure 8. Spatial distribution of PHB in a transplastomic tobacco plant grown from a T1
seed of a pCAB transformant. T1 line 2.2 (Figure 5) was sectioned to determine the
spatial distribution of PHB. (A) Leaves obtained from the main stem (stem 1), side
stems, bolts, and side shoots were sectioned as shown in the diagram and the dry weight
of each sample was recorded. Numbers within the leaf sections indicate the PHB content
(% dwt) of each sample as measured by GC/MS. (B) Inset contains a diagram illustrating
the position of stems, bolts, and side shoots in the original plant before sectioning. For
purposes of simplicity, the PHB values in stem tissue were recorded as an average value
obtained for the whole stem. Leaf slices designated with an “x” were not measured.
Figure 9. Genetic analysis of CAB lines. Diagrams illustrating the genetic arrangement
of (A) the wild-type psbA locus and the expected loci after plastid transformation with
(B) pUCaadA, (C) pCA, and (D) pCAB. The annealing sites of Probe 1 (5’ end of the
psbA gene) and Probe 4 (aadA gene) as well as the expected size of southern fragments
when genomic DNA is digested with Pst I are shown. The junction point of the large
single copy region (LSC) and the inverted repeat region A (IR-A) of the tobacco
plastome (44) are shown. Gene abbreviations can be found in Table I. Other
abbreviations are as follows: UTR, untranslated region; CDS, coding sequence. (E)
Southern blot of Pst I digested genomic DNA from transplastomic and wild-type lines
www.plantphysiol.orgon June 13, 2018 - Published by Downloaded from Copyright © 2011 American Society of Plant Biologists. All rights reserved.

40
probed with Probe 1. Genomic DNA was isolated from the following lines: wt, wild-
type; PB1 R2, line obtained after plastid transformation of pUCaadA in the R2
regeneration cycle; CA 4 R2, line obtained after plastid transformation of pCA in the R2
regeneration cycle; CAB R1 lines 4 and 6 obtained after plastid transformation of
plasmid pCAB in the R1 regeneration cycle; CAB R2 lines 2, 3, 4, 6, 8, 10, and 11, lines
obtained after plastid transformation of pCAB in the R2 regeneration cycle. Arrow
shows expected 4.12 kb band for expected integration event for CAB lines.
Figure 10. Recombination events observed in CA and CAB lines. (A) Map of the
tobacco wild-type plastome near rpl2 in the inverted repeat region B (IR-B). (B, C) Maps
of partial right flank cointegrates resulting from recombination of the partial rpl2 gene
present in the right flank with rpl2 in IR-B. Cointegrates from recombination of pCA (B)
and pCAB (C) are shown. A possible loop-out recombination event leading to a wild-
type locus is shown in (C) for pCAB. (D) Southern blot of Pst I digested genomic DNA
from transplastomic and wild-type lines probed with Probe 2 which binds to the rps19
gene. Lanes markings are as follows: M, DIGe molecular weight markers; wt, wild-type;
PB1 R2, line obtained after plastid transformation of pUCaadA in the R2 regeneration
cycle; CA 4 R2, line obtained after plastid transformation of pCA in the R2 regeneration
cycle; CAB R1 lines 4 and 6, lines obtained after plastid transformation of plasmid pCAB
in the R1 regeneration cycle; (E) Agarose gel electrophoresis of PCR products obtained
using primers KMB 157 and KMB 158. Binding sites of these primers as well as the
expected size of the PCR product are shown in panel (C). Lane markings are as follows:
wt, DNA from wild-type tobacco line; “v”, sample of plastid transformation vector pCAB
plasmid DNA; CAB 3 R1 Leaf # 15, 10, and 7, leaves 15, 10, and 7 harvested from plant
line CAB 3 in the R1 regeneration cycle where leaf 1 is defined as the oldest leaf of the
plant; M, DNA molecular weight marker; CAB R1 11, 10, 8, 6, 4, 3, and 2, CAB lines
11, 10, 8, 6, 4, 3, in the R1 regeneration cycle. (F) Southern blot of Pst I digested
genomic DNA from transplastomic and wild-type lines probed with Probe 3 which binds
to a portion of the pUC19 vector backbone found in plant transformation constructs
pUCaadA, pCA, and pCAB. Lanes markings are as follows: M, DIGe molecular weight
markers; wt, wild-type; CA R1 1, 4, 6, and 7, lines obtained after plastid transformation
www.plantphysiol.orgon June 13, 2018 - Published by Downloaded from Copyright © 2011 American Society of Plant Biologists. All rights reserved.
41
of pCA in the R1 regeneration cycle; CAB R1 2, 3, 4, 6, 8, 10, and 11, lines obtained
after plastid transformation of plasmid pCAB in the R1 regeneration cycle. (G) Map of
putative left flank cointegrate resulting from recombination of pCAB via the left flank
into the psbA locus. (H) Map of plasmid pCAB. Abbreviations throughout Figure 10 are
as follows: LF, left flank; RF, right flank; LSC, large single copy region; IR-A, inverted
repeat region A; IR-B, inverted repeat region B; Apr, gene encoding ampicillin resistance.
Abbreviations of genes located in transformation constructs can be found in Table 1.
Abbreviations of additional genes shown in the figure are as follows: rpl22, ribosomal
protein L22; rps19, 30S ribosomal protein S19; rpl23, 50S ribosomal protein L23.
www.plantphysiol.orgon June 13, 2018 - Published by Downloaded from Copyright © 2011 American Society of Plant Biologists. All rights reserved.
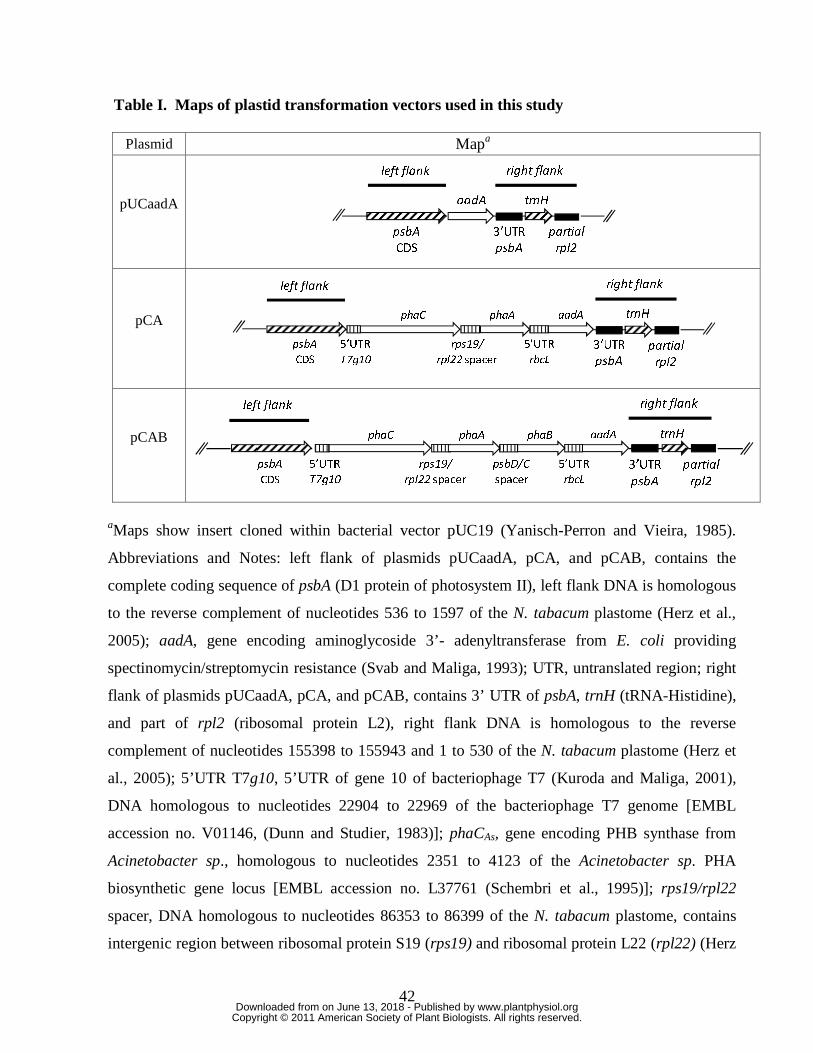
42
Table I. Maps of plastid transformation vectors used in this study
Plasmid Mapa
pUCaadA
pCA
pCAB
aMaps show insert cloned within bacterial vector pUC19 (Yanisch-Perron and Vieira, 1985).
Abbreviations and Notes: left flank of plasmids pUCaadA, pCA, and pCAB, contains the
complete coding sequence of psbA (D1 protein of photosystem II), left flank DNA is homologous
to the reverse complement of nucleotides 536 to 1597 of the N. tabacum plastome (Herz et al.,
2005); aadA, gene encoding aminoglycoside 3’- adenyltransferase from E. coli providing
spectinomycin/streptomycin resistance (Svab and Maliga, 1993); UTR, untranslated region; right
flank of plasmids pUCaadA, pCA, and pCAB, contains 3’ UTR of psbA, trnH (tRNA-Histidine),
and part of rpl2 (ribosomal protein L2), right flank DNA is homologous to the reverse
complement of nucleotides 155398 to 155943 and 1 to 530 of the N. tabacum plastome (Herz et
al., 2005); 5’UTR T7g10, 5’UTR of gene 10 of bacteriophage T7 (Kuroda and Maliga, 2001),
DNA homologous to nucleotides 22904 to 22969 of the bacteriophage T7 genome [EMBL
accession no. V01146, (Dunn and Studier, 1983)]; phaCAs, gene encoding PHB synthase from
Acinetobacter sp., homologous to nucleotides 2351 to 4123 of the Acinetobacter sp. PHA
biosynthetic gene locus [EMBL accession no. L37761 (Schembri et al., 1995)]; rps19/rpl22
spacer, DNA homologous to nucleotides 86353 to 86399 of the N. tabacum plastome, contains
intergenic region between ribosomal protein S19 (rps19) and ribosomal protein L22 (rpl22) (Herz
psbA
CDS
aadA
3’UTR
psbA
trnH
left flank right flank
partial
rpl2
psbA
CDS
phaC
5’UTR
T7g10
rps19/
rpl22 spacer
phaA
5’UTR
rbcL
aadA
left flank
3’UTR
psbA
trnH
right flank
partial
rpl2
phaC
5’UTR
T7g10
rps19/
rpl22 spacer
phaA
psbD/C
spacer
phaB
5’UTR
rbcL
aadA
psbA
CDS
left flank
3’UTR
psbA
trnH
right flank
partial
rpl2
www.plantphysiol.orgon June 13, 2018 - Published by Downloaded from Copyright © 2011 American Society of Plant Biologists. All rights reserved.
43
et al., 2005); phaAAs, gene encoding thiolase from Acinetobacter sp., homologous to nucleotide
4206 to 5384 of the Acinetobacter sp. PHA biosynthetic gene locus; 5’ UTR rbcL, 15 nucleotides
of the 5’ leader sequence of the gene encoding the large subunit of rubisco, homologous to
nucleotides 57580 to 57594 of the N. tabacum plastome (Svab and Maliga, 1993); psbD/C spacer,
DNA homologous to nucleotides 35463 to 35517 of the N. tabacum plastome, contains the
sequence region upstream of the gene encoding photosystem II 44kd protein(psbC) which is
overlapped by the coding region of the psbD gene encoding the photosystem II D2 protein (Herz
et al., 2005); phaBBm, gene encoding acetoacetyl-CoA reductase from Bacillus megaterium,
homologous to nucleotide 4758 to 5501 of the Bacillus megaterium PHA gene cluster [EMBL
accession no. AF109909 (McCool and Cannon, 1999)].
www.plantphysiol.orgon June 13, 2018 - Published by Downloaded from Copyright © 2011 American Society of Plant Biologists. All rights reserved.
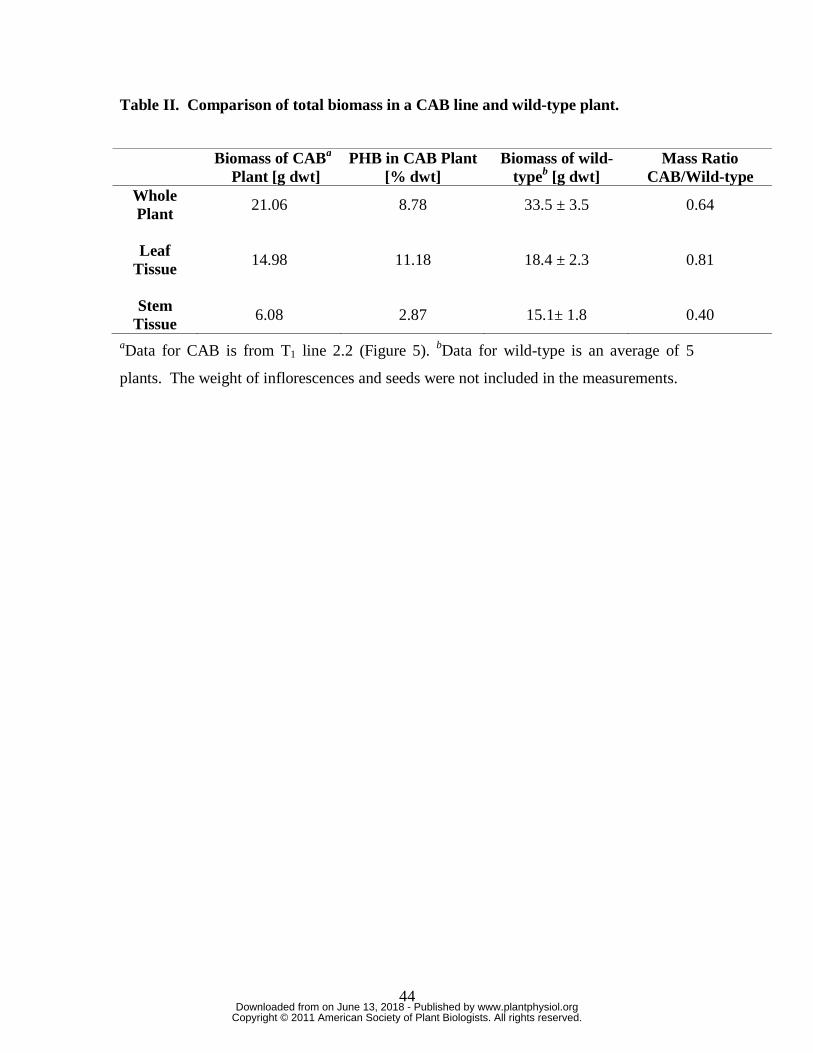
44
Table II. Comparison of total biomass in a CAB line and wild-type plant.
Biomass of CABa
Plant [g dwt] PHB in CAB Plant
[% dwt] Biomass of wild-
typeb [g dwt] Mass Ratio
CAB/Wild-type Whole Plant
21.06 8.78 33.5 ± 3.5 0.64
Leaf
Tissue 14.98 11.18 18.4 ± 2.3 0.81
Stem
Tissue 6.08 2.87 15.1± 1.8 0.40
aData for CAB is from T1 line 2.2 (Figure 5). bData for wild-type is an average of 5
plants. The weight of inflorescences and seeds were not included in the measurements.
www.plantphysiol.orgon June 13, 2018 - Published by Downloaded from Copyright © 2011 American Society of Plant Biologists. All rights reserved.
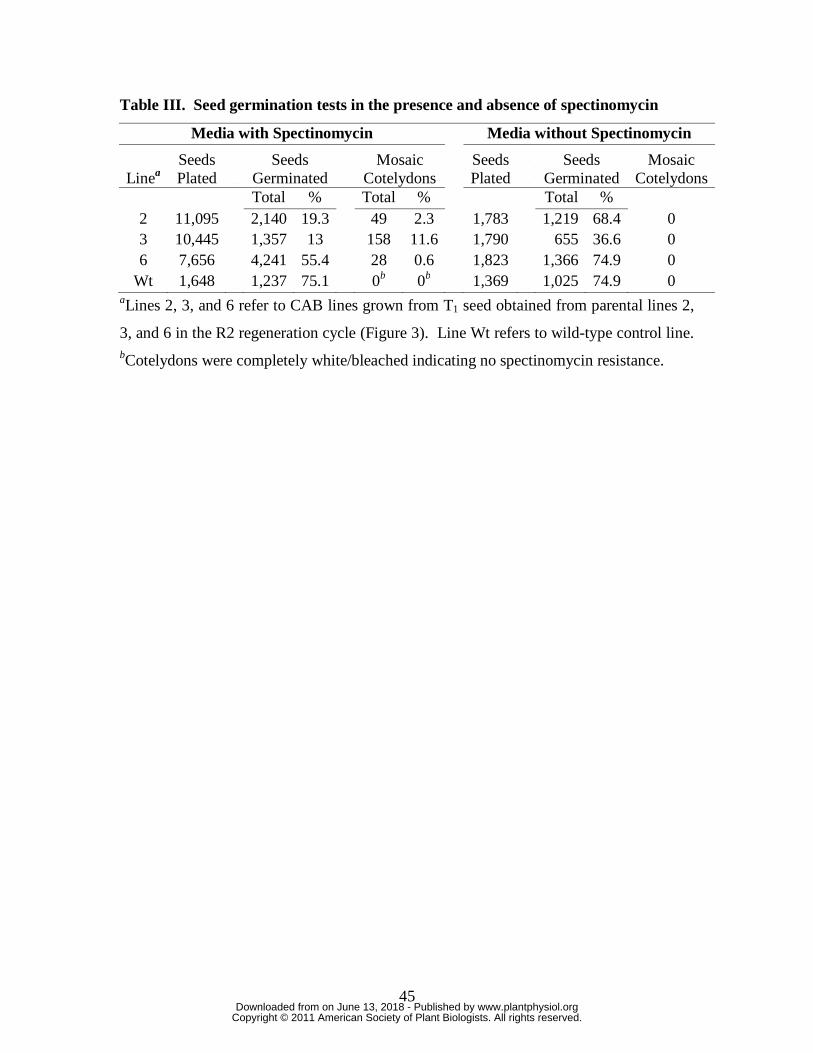
45
Table III. Seed germination tests in the presence and absence of spectinomycin
Media with Spectinomycin Media without Spectinomycin
Seeds Plated
Seeds Germinated
Mosaic Cotelydons
Seeds Plated
Seeds Germinated
Mosaic Cotelydons Linea
Total % Total %
Total % 2 11,095
2,140 19.3 49 2.3 1,783
1,219 68.4 0 3 10,445
1,357 13 158 11.6 1,790
655 36.6 0 6 7,656
4,241 55.4 28 0.6 1,823
1,366 74.9 0 Wt 1,648
1,237 75.1 0b 0b 1,369
1,025 74.9 0
aLines 2, 3, and 6 refer to CAB lines grown from T1 seed obtained from parental lines 2,
3, and 6 in the R2 regeneration cycle (Figure 3). Line Wt refers to wild-type control line. bCotelydons were completely white/bleached indicating no spectinomycin resistance.
www.plantphysiol.orgon June 13, 2018 - Published by Downloaded from Copyright © 2011 American Society of Plant Biologists. All rights reserved.
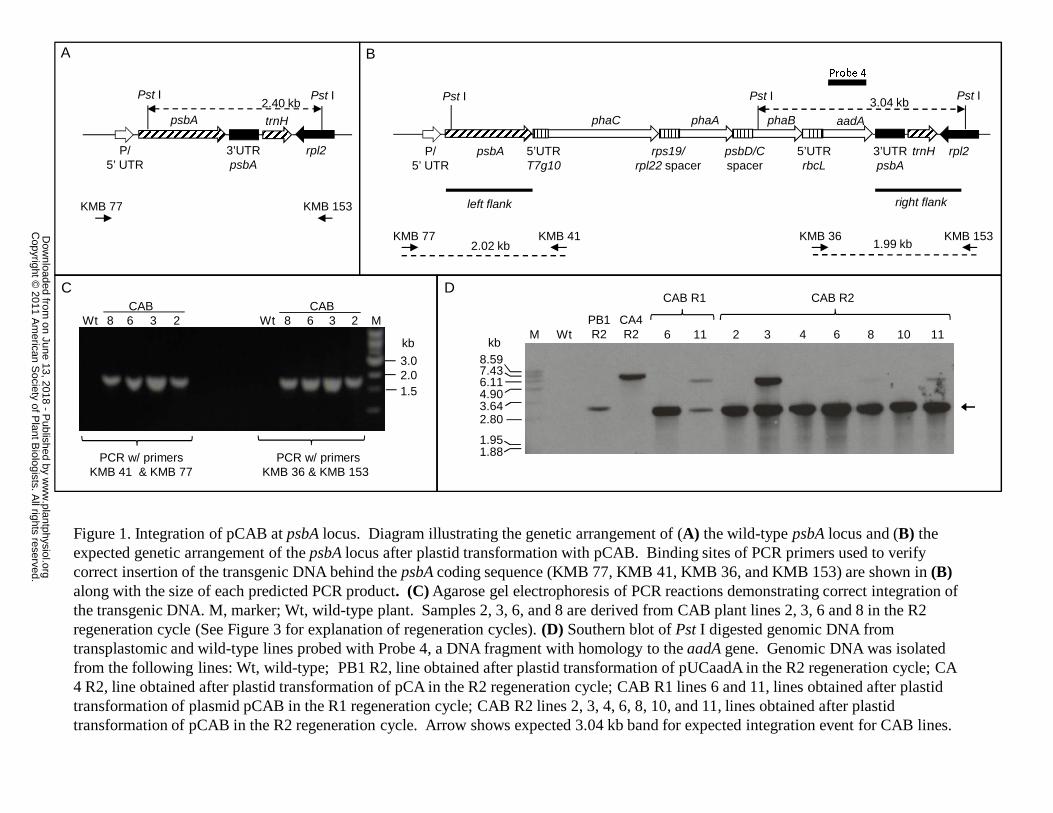
psbA
phaC
5’UTRT7g10
rps19/rpl22 spacer
phaA
psbD/C spacer
phaB
5’UTR rbcL
aadA
3’UTRpsbA
trnH
left flank right flank
KMB 77 KMB 412.02 kb 1.99 kb
KMB 36 KMB 153
B
P/5’ UTR
rpl2
A
kb8.597.436.114.903.642.80
1.951.88
CCAB CAB
Wt 8 6 3 2 Wt 8 6 3 2 M
PCR w/ primers PCR w/ primers KMB 41 & KMB 77 KMB 36 & KMB 153
2.01.5
kb
3.0
psbA
3’UTRpsbA
trnH
P/5’ UTR
rpl2
KMB 77 KMB 153
M WtPB1R2
CA4R2 6 11 2 3 6 8 10 114
CAB R2 CAB R1 D
Probe 4
Pst I Pst I Pst IPst I Pst I3.04 kb2.40 kb
Figure 1. Integration of pCAB at psbA locus. Diagram illustrating the genetic arrangement of (A) the wild-type psbA locus and (B) the expected genetic arrangement of the psbA locus after plastid transformation with pCAB. Binding sites of PCR primers used to verify correct insertion of the transgenic DNA behind the psbA coding sequence (KMB 77, KMB 41, KMB 36, and KMB 153) are shown in (B) along with the size of each predicted PCR product. (C) Agarose gel electrophoresis of PCR reactions demonstrating correct integration of the transgenic DNA. M, marker; Wt, wild-type plant. Samples 2, 3, 6, and 8 are derived from CAB plant lines 2, 3, 6 and 8 in the R2 regeneration cycle (See Figure 3 for explanation of regeneration cycles). (D) Southern blot of Pst I digested genomic DNA from transplastomic and wild-type lines probed with Probe 4, a DNA fragment with homology to the aadA gene. Genomic DNA was isolated from the following lines: Wt, wild-type; PB1 R2, line obtained after plastid transformation of pUCaadA in the R2 regeneration cycle; CA 4 R2, line obtained after plastid transformation of pCA in the R2 regeneration cycle; CAB R1 lines 6 and 11, lines obtained after plastid transformation of plasmid pCAB in the R1 regeneration cycle; CAB R2 lines 2, 3, 4, 6, 8, 10, and 11, lines obtained after plastid transformation of pCAB in the R2 regeneration cycle. Arrow shows expected 3.04 kb band for expected integration event for CAB lines.
w
ww
.plantphysiol.orgon June 13, 2018 - P
ublished by D
ownloaded from
C
opyright © 2011 A
merican S
ociety of Plant B
iologists. All rights reserved.
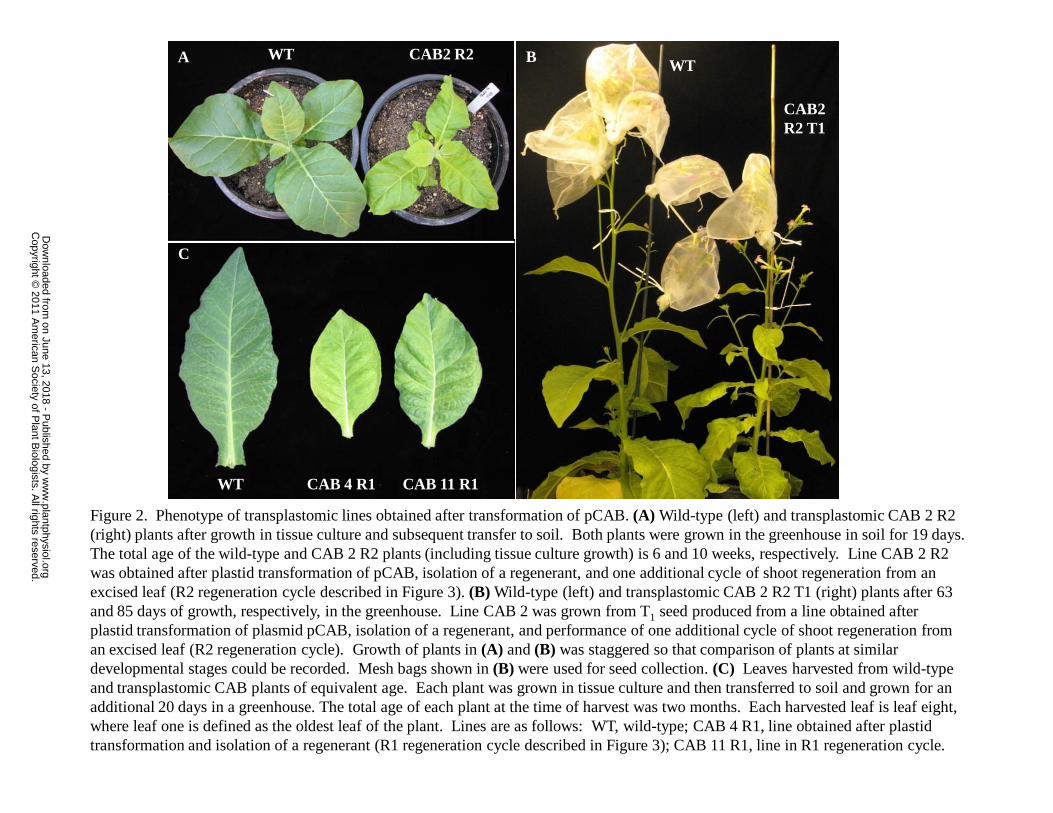
a)
CAB2 R2WTA WT
CAB2 R2 T1
)
WT CAB 4 R1 CAB 11 R1
C
B
Figure 2. Phenotype of transplastomic lines obtained after transformation of pCAB. (A) Wild-type (left) and transplastomic CAB 2 R2 (right) plants after growth in tissue culture and subsequent transfer to soil. Both plants were grown in the greenhouse in soil for 19 days. The total age of the wild-type and CAB 2 R2 plants (including tissue culture growth) is 6 and 10 weeks, respectively. Line CAB 2 R2 was obtained after plastid transformation of pCAB, isolation of a regenerant, and one additional cycle of shoot regeneration from an excised leaf (R2 regeneration cycle described in Figure 3). (B) Wild-type (left) and transplastomic CAB 2 R2 T1 (right) plants after 63 and 85 days of growth, respectively, in the greenhouse. Line CAB 2 was grown from T1 seed produced from a line obtained after plastid transformation of plasmid pCAB, isolation of a regenerant, and performance of one additional cycle of shoot regeneration from an excised leaf (R2 regeneration cycle). Growth of plants in (A) and (B) was staggered so that comparison of plants at similar developmental stages could be recorded. Mesh bags shown in (B) were used for seed collection. (C) Leaves harvested from wild-type and transplastomic CAB plants of equivalent age. Each plant was grown in tissue culture and then transferred to soil and grown for an additional 20 days in a greenhouse. The total age of each plant at the time of harvest was two months. Each harvested leaf is leaf eight, where leaf one is defined as the oldest leaf of the plant. Lines are as follows: WT, wild-type; CAB 4 R1, line obtained after plastid transformation and isolation of a regenerant (R1 regeneration cycle described in Figure 3); CAB 11 R1, line in R1 regeneration cycle.
w
ww
.plantphysiol.orgon June 13, 2018 - P
ublished by D
ownloaded from
C
opyright © 2011 A
merican S
ociety of Plant B
iologists. All rights reserved.
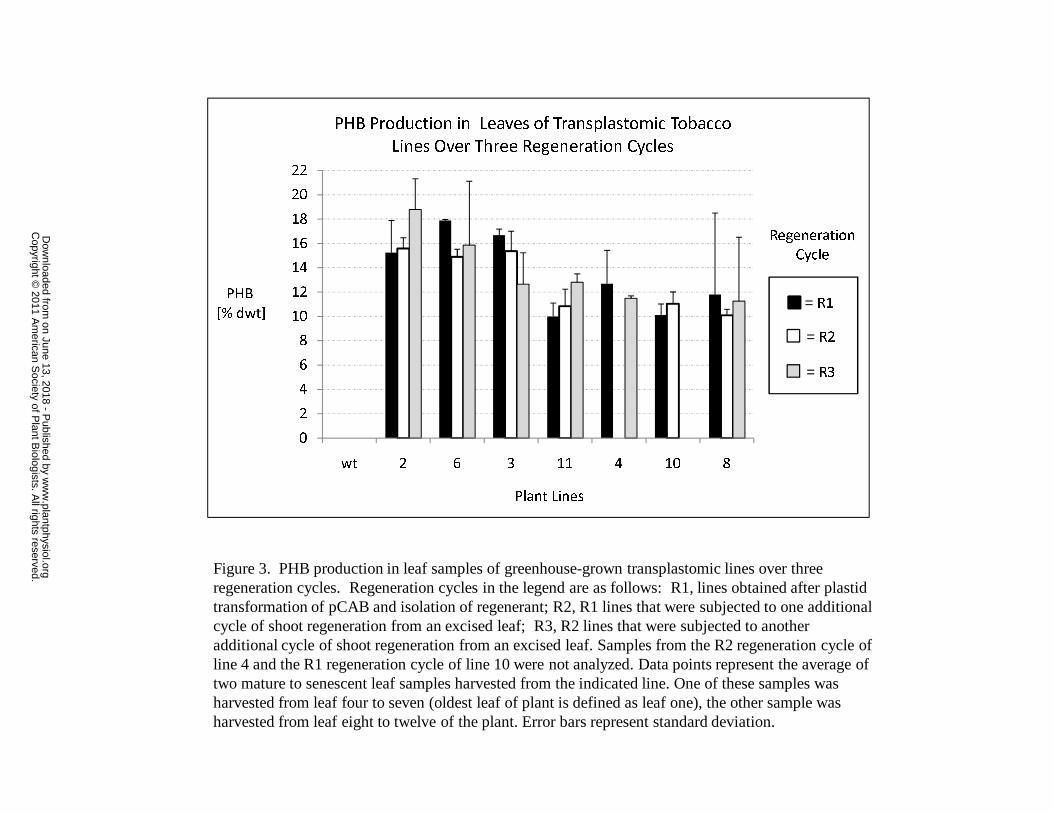
0
2
4
6
8
10
12
14
16
18
20
22
wt 2 6 3 11 4 10 8
PHB
[% dwt]
Plant Lines
PHB Production in Leaves of Transplastomic Tobacco
Lines Over Three Regeneration Cycles
Regeneration
Cycle
= R1
= R2
= R3
Figure 3. PHB production in leaf samples of greenhouse-grown transplastomic lines over three regeneration cycles. Regeneration cycles in the legend are as follows: R1, lines obtained after plastid transformation of pCAB and isolation of regenerant; R2, R1 lines that were subjected to one additional cycle of shoot regeneration from an excised leaf; R3, R2 lines that were subjected to another additional cycle of shoot regeneration from an excised leaf. Samples from the R2 regeneration cycle of line 4 and the R1 regeneration cycle of line 10 were not analyzed. Data points represent the average of two mature to senescent leaf samples harvested from the indicated line. One of these samples was harvested from leaf four to seven (oldest leaf of plant is defined as leaf one), the other sample was harvested from leaf eight to twelve of the plant. Error bars represent standard deviation.
w
ww
.plantphysiol.orgon June 13, 2018 - P
ublished by D
ownloaded from
C
opyright © 2011 A
merican S
ociety of Plant B
iologists. All rights reserved.
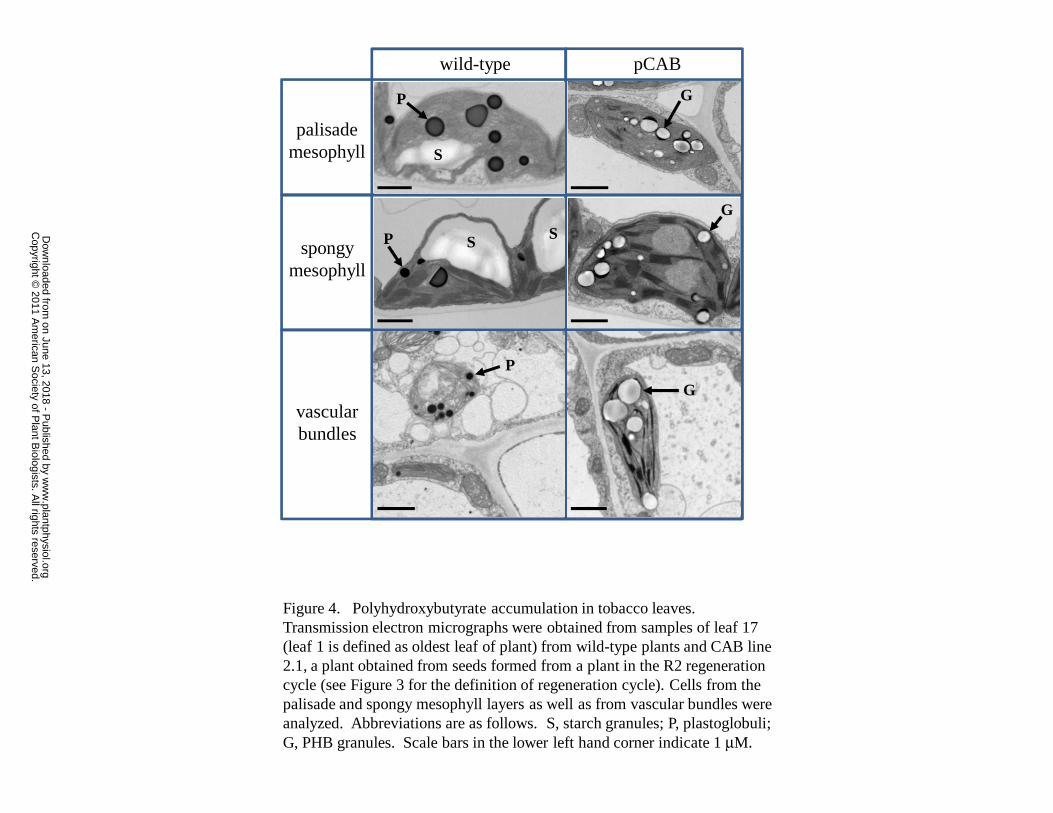
wild-type pCAB
palisademesophyll
spongymesophyll
vascular bundles
S S
S
P
P
G
G
Figure 4. Polyhydroxybutyrate accumulation in tobacco leaves. Transmission electron micrographs were obtained from samples of leaf 17 (leaf 1 is defined as oldest leaf of plant) from wild-type plants and CAB line 2.1, a plant obtained from seeds formed from a plant in the R2 regeneration cycle (see Figure 3 for the definition of regeneration cycle). Cells from the palisade and spongy mesophyll layers as well as from vascular bundles were analyzed. Abbreviations are as follows. S, starch granules; P, plastoglobuli; G, PHB granules. Scale bars in the lower left hand corner indicate 1 μM.
P
G
w
ww
.plantphysiol.orgon June 13, 2018 - P
ublished by D
ownloaded from
C
opyright © 2011 A
merican S
ociety of Plant B
iologists. All rights reserved.

0
2
4
6
8
10
12
14
16
18
20
WT 2.8 2.7 2.3 2.2 2.5 2.6 2.4 2.1 6.2 6.3 6.5 6.8 6.6 6.4 6.7 6.1
PHB
[% dwt]
Plant Lines
PHB Production in T1
Plants of pCAB Lines
one month
2-3 months
Figure 5. PHB production in T1 progeny of CAB lines 2 and 6. Seeds obtained from plants in the R2 regeneration cycle from CAB lines 2 and 6 (Figure 3) were germinated on tissue culture medium in the presence of spectinomycin as described in Materials and Methods. Plantlets were transferred to soil and grown in the green house. Leaf tissue samples were taken after 1 and 2-3 months of growth. WT, wild-type line. Lines 2.8, 2.7, 2.3, 2.2, 2.5, 2.6, 2.4, and 2.1 are T1 progeny from parental CAB line 2. Lines 6.2, 6.3, 6.5, 6.8, 6.6, 6.4, 6.7, and 6.1 are T1 progeny from parental CAB line 6. Each data point is an average of two different leaf tissue samples with the error bars representing the standard deviation. One of these samples was harvested from leaf three to five (oldest leaf of plant is defined as leaf one),the other sample was harvested from leaf eight to thirteen of the plant.
w
ww
.plantphysiol.orgon June 13, 2018 - P
ublished by D
ownloaded from
C
opyright © 2011 A
merican S
ociety of Plant B
iologists. All rights reserved.

M wt 1 2 3 4 6 7 8 C
250150
100
75
50
kDa M wt 1 2 3 4 6 7 8 C
75
50
37
100
150250
kDaA B
M wt 1 2 3 4 6 7 8 C C D25015010075
5037
252015
kDaM wt 1 2 3 4 6 7 8 25015010075
5037
252015
kDa
10
M wt 1 2 3 4 6 7 8 C 25015010075
5037
252015
E kDa
10
Figure 6. Expression of transgenes in leaf tissue of T1 plants. Synthase (A, B), thiolase (C, D), and reductase (C, E) enzymes were detected in extracts prepared from leaf tissue of T1 lines obtained from seed of parent line CAB 6 from the R2 regeneration cycle (Figure 3). (A) SDS-PAGE gel of whole SDS solubilized cell lysates prepared from tobacco leaf tissue. Samples are as follows: M, molecular weight marker; wt, wild-type line; 1, 2, 3, 4, 6, 7, and 8, T1 lines obtained from parent line CAB 6. Lane C contains 268 ng of purified Acinetobacter sp. PHA synthase mixed with 30 μg of whole lysate obtained from a wild-type plant. (B) Western blot of whole SDS solubilized cell lysates probed with polyclonal antibodies prepared against the PHA synthase protein from Ralstonia eutropha. For line designations, see (A). Lane C contains 268 ng of purified Acinetobacter sp. PHA synthase mixed with 30 μg of whole lysate obtained from a wild-type plant. (C) SDS-PAGE gel of soluble protein extracts (15 μg) prepared from tobacco leaf tissue. For line designations, see (A). (D) Western blot of soluble extracts (15 μg) probed with polyclonal antibodies prepared to the β-ketothiolase protein from Acinetobacter sp. For line designations, see (A). Lane C contains 108 ng of purified Acinetobacter sp. β-ketothiolase protein. Antibodies to thiolase were diluted 1:5000 before use. (E) Western blot of soluble extracts (15 μg) probed with polyclonal antibodies prepared to the acetoacetyl-CoA reductase protein from Bacillus megaterium. For line designations, see (A). Lane C contains 331 ng of purified Acinetobacter sp. reductase protein. Antibodies to reductase were diluted 1:250 before use.
www.plantphysiol.orgon June 13, 2018 - Published by Downloaded from Copyright © 2011 American Society of Plant Biologists. All rights reserved.
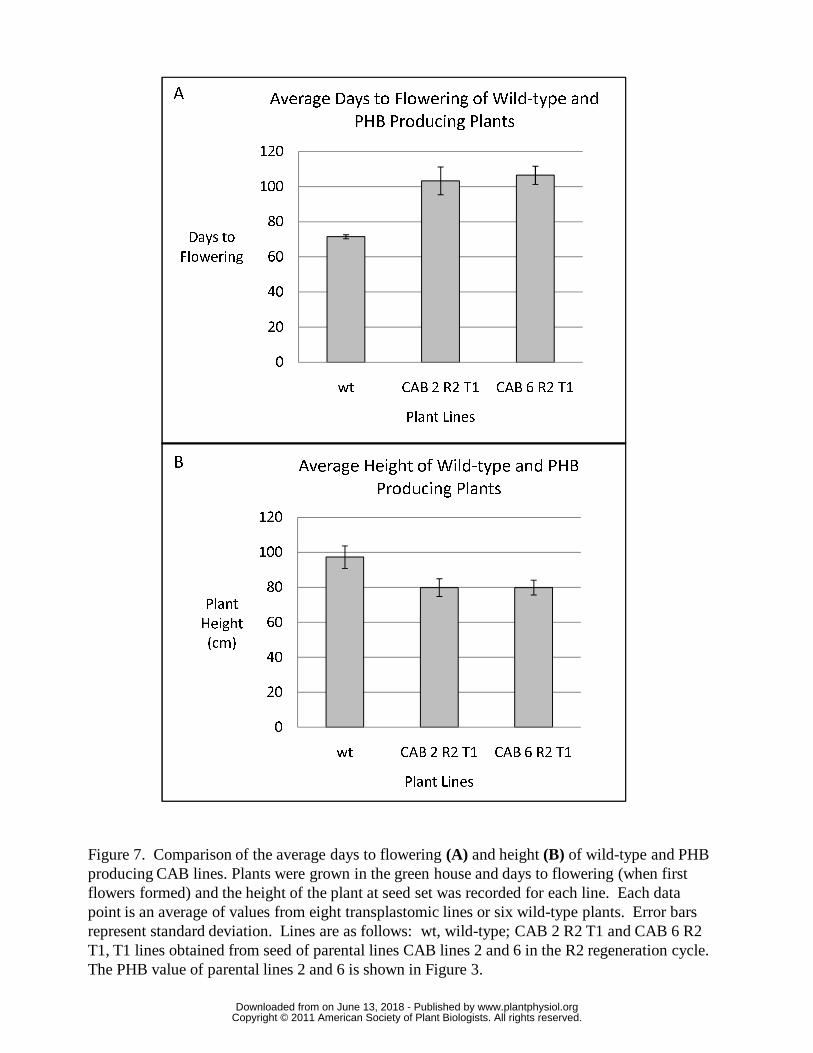
A
B
0
20
40
60
80
100
120
wt CAB 2 R2 T1 CAB 6 R2 T1
Days to
Flowering
Plant Lines
Average Days to Flowering of Wild-type and
PHB Producing Plants
0
20
40
60
80
100
120
wt CAB 2 R2 T1 CAB 6 R2 T1
Plant
Height
(cm)
Plant Lines
Average Height of Wild-type and PHB
Producing Plants
Figure 7. Comparison of the average days to flowering (A) and height (B) of wild-type and PHB producing CAB lines. Plants were grown in the green house and days to flowering (when first flowers formed) and the height of the plant at seed set was recorded for each line. Each data point is an average of values from eight transplastomic lines or six wild-type plants. Error bars represent standard deviation. Lines are as follows: wt, wild-type; CAB 2 R2 T1 and CAB 6 R2 T1, T1 lines obtained from seed of parental lines CAB lines 2 and 6 in the R2 regeneration cycle. The PHB value of parental lines 2 and 6 is shown in Figure 3.
www.plantphysiol.orgon June 13, 2018 - Published by Downloaded from Copyright © 2011 American Society of Plant Biologists. All rights reserved.
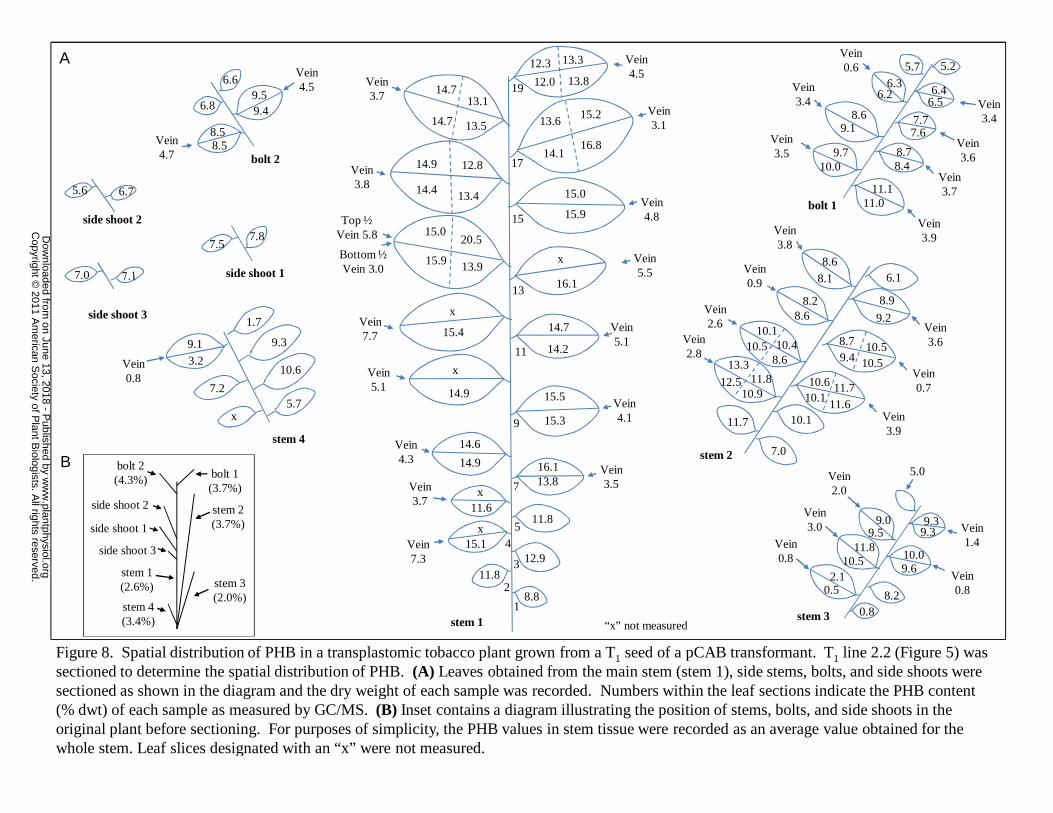
bolt 1 (3.7%)
bolt 2 (4.3%)
side shoot 2
side shoot 1
side shoot 3
stem 4 (3.4%)
stem 1 (2.6%)
stem 2 (3.7%)
stem 3 (2.0%)
7.0
side shoot 3
7.87.5
5.6 6.7bolt 1
11.111.0
Vein 3.9
10.09.7
Vein 3.5
8.48.7
9.18.6 7.7
7.6
Vein 3.7
Vein 3.4
Vein 3.6
6.36.2
Vein 0.6
6.46.5 Vein
3.4
5.7 5.2
8.8
12.915.1Vein
7.3
“x” not measured
11.811.6
Vein 3.7
13.816.1 Vein
3.5
Vein 4.3
15.3
15.5Vein4.1
1
11.82
3
4
5
7
9
14.9
14.6
Vein5.1
14.2
14.7
Vein5.5
13
Vein7.7
Top ½ Vein 5.8
Bottom ½ Vein 3.0
Vein4.815.9
15.0
15
Vein3.8
17
Vein5.1
11
Vein3.7
Vein4.5
19
x
x
14.9
x
15.4
x
15.0
15.9
20.5
13.9
14.9
14.4
12.8
13.4
Vein3.1
15.2
16.8
13.6
14.1
14.7
14.7
13.1
13.5
13.3
13.8
12.3
12.0
16.1
x
8.58.5
9.49.5
6.8
Vein 4.7
Vein 4.5
6.6
bolt 2
stem 2 7.0
11.7 10.1
12.5
13.3
Vein 2.8
11.810.9
Vein 3.9
10.610.1
11.711.6
10.510.1
Vein 2.6
10.48.6
Vein 0.7
8.79.4
10.510.5
8.68.2
Vein 0.9
8.9
9.2Vein 3.6
8.6
8.1
Vein 3.8
6.1
stem 3
8.20.52.1
10.09.6
Vein 0.8
Vein 0.8
10.5
Vein 3.0 9.3
9.3 Vein 1.4
5.0
0.8
11.8
9.09.5
Vein 2.0
10.6
x
stem 4
5.77.2
9.3
Vein0.8
9.1
3.2
1.7
stem 1
side shoot 1
side shoot 2
A
B
Figure 8. Spatial distribution of PHB in a transplastomic tobacco plant grown from a T1 seed of a pCAB transformant. T1 line 2.2 (Figure 5) was sectioned to determine the spatial distribution of PHB. (A) Leaves obtained from the main stem (stem 1), side stems, bolts, and side shoots were sectioned as shown in the diagram and the dry weight of each sample was recorded. Numbers within the leaf sections indicate the PHB content (% dwt) of each sample as measured by GC/MS. (B) Inset contains a diagram illustrating the position of stems, bolts, and side shoots in the original plant before sectioning. For purposes of simplicity, the PHB values in stem tissue were recorded as an average value obtained for the whole stem. Leaf slices designated with an “x” were not measured.
w
ww
.plantphysiol.orgon June 13, 2018 - P
ublished by D
ownloaded from
C
opyright © 2011 A
merican S
ociety of Plant B
iologists. All rights reserved.

B
D
psbA
CDS
phaC
5’UTR
T7g10
rps19/
rpl22 spacer
phaA
psbD/C
spacer
phaB
5’UTR
rbcL
aadA
3’UTR
psbA
trnH
LF RF
P/
5’ UTR
rpl2
Pst I Pst I4.12 kb Pst I3.04 kb
C
psbA
CDS
phaC
5’UTR
T7g10
rps19/
rpl22 spacer
phaA
5’UTR
rbcL
aadA
3’UTR
psbA
trnH
LF RF
P/
5’ UTR
rpl2
Pst I 6.37 kb Pst I
psbA
CDS
aadA
3’UTR
psbA
trnH
LF RF
P/
5’ UTR
rpl2
Pst I 3.28 kb Pst I
A
psbA
CDS
3’UTR
psbA
trnH
LF RF
P/
5’ UTR
rpl2
Pst I 2.40 kb Pst I
Probe 1
Probe 1
Probe 1
Probe 1
M wt
PB1
R2
CA4
R2 4 6 2 3 6 8 10 114
CAB R2 CAB R1
kb
8.58
3.642.80
1.951.881.521.48
0.72
0.99
1.16
E
LSC IR-A
Junction
LSC IR-A
Junction
5’UTR
rbcL
LSC IR-A
Junction
LSC IR-A
Junction
4.90
7.436.11
Probe 4
Probe 4
Probe 4
Figure 9. Genetic analysis of CAB lines. Diagrams illustrating the genetic arrangement of (A) the wild-type psbA locus and the expected loci after plastid transformation with (B) pUCaadA, (C) pCA, and (D)pCAB. The annealing sites of Probe 1 (5’ end of the psbA gene) and Probe 4 (aadA gene) as well as the expected size of southern fragments when genomic DNA is digested with Pst I are shown. The junction point of the large single copy region (LSC) and the inverted repeat region A (IR-A) of the tobacco plastome(44) are shown. Gene abbreviations can be found in Table I. Other abbreviations are as follows: UTR, untranslated region; CDS, coding sequence. (E) Southern blot of Pst I digested genomic DNA from transplastomic and wild-type lines probed with Probe 1. Genomic DNA was isolated from the following lines: wt, wild-type; PB1 R2, line obtained after plastid transformation of pUCaadA in the R2 regeneration cycle; CA 4 R2, line obtained after plastid transformation of pCA in the R2 regeneration cycle; CAB R1 lines 4 and 6 obtained after plastid transformation of plasmid pCAB in the R1 regeneration cycle; CAB R2 lines 2, 3, 4, 6, 8, 10, and 11, lines obtained after plastid transformation of pCAB in the R2 regeneration cycle. Arrow shows expected 4.12 kb band for expected integration event for CAB lines.
www.plantphysiol.orgon June 13, 2018 - Published by Downloaded from Copyright © 2011 American Society of Plant Biologists. All rights reserved.

psbA
CDS
phaC
5’UTR
T7g10
rps19/
rpl22 spacer
phaA
psbD/C
spacer
phaB
5’UTR
rbcL
aadA
3’UTR
psbA
trnH
LF RF
P/
5’ UTR
partial
rpl2
Pst I Pst I4.12 kb
Apr
pUC19 vector
trnH
rpl2
Pst I
3’UTR
psbA
psbA
CDS
Probe 1
Pst I 2.40 kb
Probe 3
5.43 kb
G
LF
Probe 1
LSC IR-A
RF
Junction
psbA
CDS
phaC
5’UTR
T7g10
rps19/
rpl22 spacer
phaA
psbD/C
spacer
phaB
5’UTR
rbcL
aadA
3’UTR
psbA
trnH
LF RF
rpl2
Pst I Pst I4.12 kb
Apr
pUC19 vector
Probe3
3.04 kb
C
Pst I3.9 kb
Probe 1
psbA
CDS
phaC
5’UTR
T7g10
rps19/
rpl22 spacer
phaA aadA
3’UTR
psbA
trnH
LF RF
rpl2
Pst I
Apr
pUC19 vector
Probe3
B
Pst I3.9 kb
Probe 1
6.37 kb
5’UTR
rbcL
KMB 157 KMB 158
IR-BLSC
Junction
D
F
4.90
1.95
1.881.52
1.48
1.16
0.99
2.80
3.64
6.107.438.59
M wt
PB1
R2
CA4
R2 4 6
CAB R1
kb Mwt v 15 10 7 11 10 8 6 4 3 2
0.5
1.0
1.52.03.0
kb CAB R1 plant line CAB3 R1 Leaf #E
M wt 6 7 2 3 6 8 10 114
CAB R1CA R1
4kb
1
2.803.644.906.10
8.597.43
partial
rpl2
Pst I
Probe 2
rps19rpl22
partial
RF
partial
rpl2
Pst I
rps19rpl22
partial
RF
Probe 2
rpl23
rpl23
IR-BLSC
Junction
rpl2
Pst IPst I
rps19 rpl23
Junction
LSC IR-B
1.58 kb
rpl22
A
Probe 2
partial
RF
H
psbA
CDS
phaC
5’UTR
T7g10
rps19/
rpl22 spacer
phaA
psbD/C
spacer
phaB
5’UTR
rbcL
aadA
3’UTR
psbA
trnH
LF RF
partial
rpl2
Pst I Pst I4.12 kb
Apr
pUC19 vector
Probe 3
5.43 kb
Probe 1
Pst I
LF
Probe 4
Probe 4
Probe 4
Probe 4
Probe 1
partial
RF
0.7 kb
rpl2rps19rpl22 rpl23
Loop-out recombination
via partial right flank
wild-type
plastome
5.43.9
www.plantphysiol.orgon June 13, 2018 - Published by Downloaded from Copyright © 2011 American Society of Plant Biologists. All rights reserved.
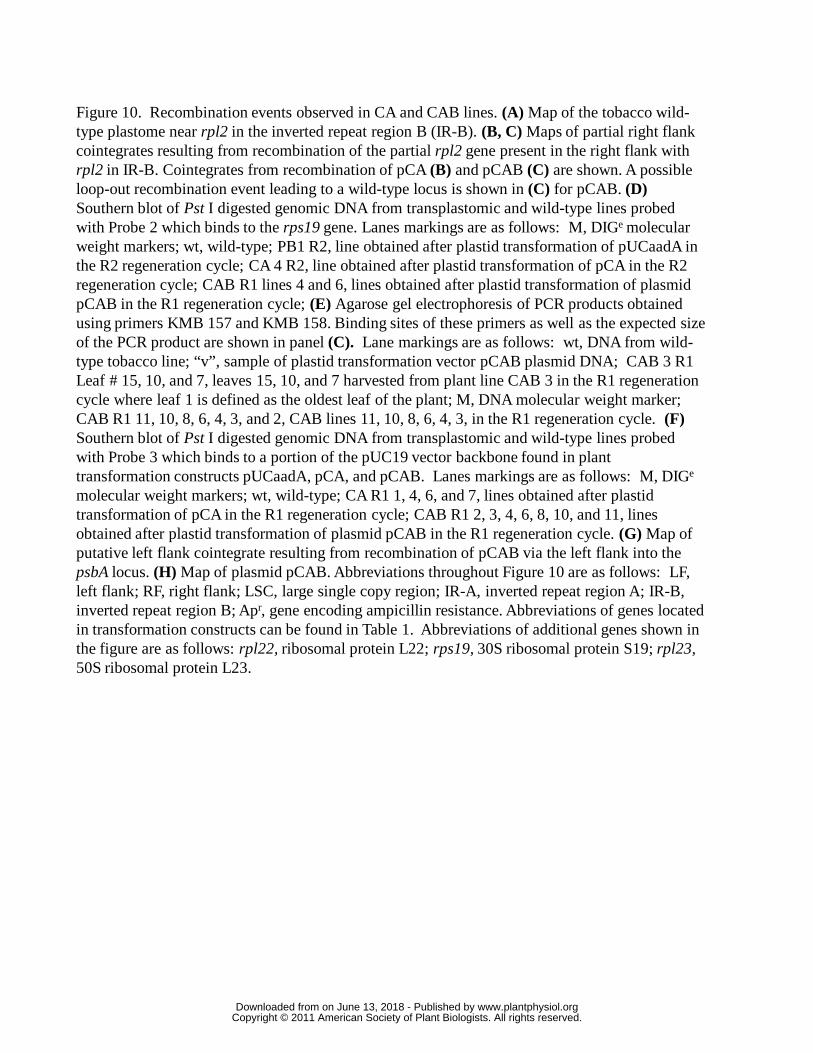
Figure 10. Recombination events observed in CA and CAB lines. (A) Map of the tobacco wild-type plastome near rpl2 in the inverted repeat region B (IR-B). (B, C) Maps of partial right flank cointegrates resulting from recombination of the partial rpl2 gene present in the right flank with rpl2 in IR-B. Cointegrates from recombination of pCA (B) and pCAB (C) are shown. A possible loop-out recombination event leading to a wild-type locus is shown in (C) for pCAB. (D) Southern blot of Pst I digested genomic DNA from transplastomic and wild-type lines probed with Probe 2 which binds to the rps19 gene. Lanes markings are as follows: M, DIGe molecular weight markers; wt, wild-type; PB1 R2, line obtained after plastid transformation of pUCaadA in the R2 regeneration cycle; CA 4 R2, line obtained after plastid transformation of pCA in the R2 regeneration cycle; CAB R1 lines 4 and 6, lines obtained after plastid transformation of plasmid pCAB in the R1 regeneration cycle; (E) Agarose gel electrophoresis of PCR products obtained using primers KMB 157 and KMB 158. Binding sites of these primers as well as the expected size of the PCR product are shown in panel (C). Lane markings are as follows: wt, DNA from wild-type tobacco line; “v”, sample of plastid transformation vector pCAB plasmid DNA; CAB 3 R1 Leaf # 15, 10, and 7, leaves 15, 10, and 7 harvested from plant line CAB 3 in the R1 regeneration cycle where leaf 1 is defined as the oldest leaf of the plant; M, DNA molecular weight marker; CAB R1 11, 10, 8, 6, 4, 3, and 2, CAB lines 11, 10, 8, 6, 4, 3, in the R1 regeneration cycle. (F) Southern blot of Pst I digested genomic DNA from transplastomic and wild-type lines probed with Probe 3 which binds to a portion of the pUC19 vector backbone found in plant transformation constructs pUCaadA, pCA, and pCAB. Lanes markings are as follows: M, DIGe
molecular weight markers; wt, wild-type; CA R1 1, 4, 6, and 7, lines obtained after plastid transformation of pCA in the R1 regeneration cycle; CAB R1 2, 3, 4, 6, 8, 10, and 11, lines obtained after plastid transformation of plasmid pCAB in the R1 regeneration cycle. (G) Map of putative left flank cointegrate resulting from recombination of pCAB via the left flank into the psbA locus. (H) Map of plasmid pCAB. Abbreviations throughout Figure 10 are as follows: LF, left flank; RF, right flank; LSC, large single copy region; IR-A, inverted repeat region A; IR-B, inverted repeat region B; Apr, gene encoding ampicillin resistance. Abbreviations of genes located in transformation constructs can be found in Table 1. Abbreviations of additional genes shown in the figure are as follows: rpl22, ribosomal protein L22; rps19, 30S ribosomal protein S19; rpl23, 50S ribosomal protein L23.
www.plantphysiol.orgon June 13, 2018 - Published by Downloaded from Copyright © 2011 American Society of Plant Biologists. All rights reserved.