Embed Size (px)
Citation preview
1
Running head: Herbivore-induced callose deposition and host resistance
Corresponding author
Guangcun He
College of Life Sciences
Wuhan University
Wuhan 430072
People’s Republic of China
Tel: +86 27 87641314
Fax: +86 27 68752327
E-mail: [email protected]
Research area: Plants Interacting with Other Organisms
Plant Physiology Preview. Published on February 1, 2008, as DOI:10.1104/pp.107.111484
Copyright 2008 by the American Society of Plant Biologists
www.plantphysiol.orgon May 21, 2018 - Published by Downloaded from Copyright © 2008 American Society of Plant Biologists. All rights reserved.
2
Herbivore-induced callose deposition on the sieve plates of rice: an important
mechanism for host resistance
Peiying Hao, Caixiang Liu, Yuanyuan Wang, Rongzhi Chen, Ming Tang, Bo Du, Lili
Zhu, Guangcun He*
Key Laboratory of Ministry of Education for Plant Development Biology, College of
Life Sciences, Wuhan University, Wuhan 430072, People’s Republic of China
www.plantphysiol.orgon May 21, 2018 - Published by Downloaded from Copyright © 2008 American Society of Plant Biologists. All rights reserved.

3
This research work was supported by grants from the National Natural Science
Foundation of China (30730062, 30671287), and the National Special Key Project on
Functional Genomics and Biochips (2006AA10A103).
Corresponding author: Guangcun He, E-mail: [email protected]
www.plantphysiol.orgon May 21, 2018 - Published by Downloaded from Copyright © 2008 American Society of Plant Biologists. All rights reserved.

4
ABSTRACT
The brown planthopper (Nilaparvata lugens Stål, BPH) is a specialist herbivore
on rice (Oryza sativa L.) that ingests phloem sap from the plant through its stylet
mouthparts. Electronic Penetration Graphs (EPGs) revealed that BPH insects spent
more time wandering over plants carrying the resistance genes Bph14 and Bph15, but
less time ingesting phloem than they did on susceptible plants. They also showed that
their feeding was frequently interrupted. Tests with [14C]sucrose showed that insects
ingested much less phloem sap from the resistant than the susceptible plants. BPH
feeding up-regulated callose synthase genes and induced callose deposition in the sieve
tubes at the point where the stylet was inserted. The compact callose remained intact in
the resistant plants, but genes encoding β-1,3-glucanases were activated, causing
unplugging of the sieve tube occlusions, in susceptible plants. Continuing ingestion led
to a remarkable reduction in the susceptible plants’ sucrose contents and activation of
the Ramy3D gene, leading to starch hydrolysis and ultimately carbohydrate deprivation
in the plants. Our results demonstrate that BPH feeding induces the deposition of
callose on sieve plates in rice, and that this is an important defense mechanism that
prevents the insects ingesting phloem sap. In response, however, the BPH can unplug
sieve tube occlusions by activating β-1, 3-glucanase genes in rice plants.
Keywords: Oryza sativa �rice–BPH interaction �phloem transport �callose �
beta-1, 3-glucanase
Abbreviations: BPH, Brown planthopper; EPG, Electrical Penetration Graph
www.plantphysiol.orgon May 21, 2018 - Published by Downloaded from Copyright © 2008 American Society of Plant Biologists. All rights reserved.

5
INTRODUCTION
Globally there is an enormous diversity of herbivorous insects that attack and
damage plants. However, long-term co-evolution of herbivorous insects and plants has
led to the development of an array of constitutive and induced defenses that enable
plants to protect themselves from herbivore attack (Rausher, 2001; Becerra, 2007).
Constitutive defense mechanisms include physical barriers (such as cuticles, thorns,
trichomes, and cell walls) and preexisting metabolites that are harmful or even toxic to
insects (Mithöfer et al., 2005). Induced plant defenses involve the activation of
mechanisms that directly or indirectly deter herbivores (Walling, 2000). Some
secondary metabolites (Baldwin et al., 2001; Benderoth et al., 2006) and induced
proteins, such as lectins, chitinases, proteinase inhibitors and enzymes (Zavala et al.,
2004; Chen et al., 2005; Harfouche et al., 2006), often play direct defense roles by, for
example, repelling insects, inhibiting their feeding, or damaging their digestive or
neural systems. Indirect defenses include the release of volatiles that signal the location
of insects on infested plants to parasitoids and predators (De Moraes et al., 2001;
Schnee et al., 2006; Kempema et al., 2007). When attacked by insects, plants can also
produce endogenous signal molecules, such as stress hormones, including jasmonic
acid (JA), ethylene, abscisic acid (ABA) and salicylic acid (SA) that regulate signal
transduction cascades in plant cells, leading to the activation and modulation of
defense-related genes (Li et al., 2002; Schmelz et al., 2006).
Plants show varied responses to herbivores that are strongly correlated with the
mode of herbivore feeding. Chewing insects and cell-content feeders, such as
caterpillars and beetles, cause extensive tissue damage and activate wound-signaling
pathways in which JA plays a central role (Kandoth et al., 2007). In contrast, attacks by
phloem feeders, such as aphids, planthoppers and whiteflies, elicit only weak wound
responses, but induce the transcription of SA and pathogen-signaling pathways, which
may mirror responses to virus vectors, or insect-associated bacterial endosymbionts.
Alternatively, this “transcription signature” may be due to similarities between
intercellular fungal hyphae growth and stylet penetration, and hence may produce
similar responses (Baldwin et al., 2001; Li et al., 2006). Limitations associated with
JA-mediated defense responses may arise from antagonistic crosstalk with SA and
ethylene signaling, or be due to stealthy feeding behavior, which minimizes the amount
of tissue damage (Voelckel et al., 2004).
The Brown planthopper (Nilaparvata lugens Stål, BPH) is an insect that feeds on
www.plantphysiol.orgon May 21, 2018 - Published by Downloaded from Copyright © 2008 American Society of Plant Biologists. All rights reserved.

6
the leaf sheath of rice (Oryza sativa L.) plants, ingesting nutrients specifically from the
rice phloem using its piercing mouthparts (stylet), forming a stylet sheath during the
feeding process. Feeding by numerous BPHs on a single plant generally results in the
susceptible plants yellowing, browning and drying. In the last decade, the BPH has
frequently caused widespread destruction of rice crops and heavy losses of yields (Shi
et al., 2003; Park et al., 2007).
The main methods used to control BPH pests are to apply chemical insecticides
and/or develop and grow resistant varieties in an integrated pest management strategy..
However, the cost of chemical control is often very high, and the chemicals can destroy
the natural balance of BPH-predators that help to keep the BPH population in check.
The misuse of chemical pesticides may also cause a resurgence of the insect. Therefore,
the most economic and efficient method for controlling the BPH is to exploit the host
resistance to attack (Renganayaki et al., 2002). To date, 19 BPH-resistance genes in rice
have been reported, and several have been used in rice breeding programs (Yang et al.,
2004; Jena et al., 2006; Zhang, 2007). Various molecular techniques, including
suppression subtractive hybridization, northern blotting and cDNA array analysis, have
been used to study rice responses to BPH feeding (Zhang et al., 2004; Wang et al.,
2005; Yuan et al., 2005; Park et al., 2007, Wang et al., 2008). BPH feeding is thought to
result in a re-organization of the gene expression profile of rice and most of the
strongly-regulated genes are associated with metabolism, cell defense, cellular
transport, cellular communication or signal transduction and the biogenesis of cellular
components. In contrast, the expression of genes related to the flavonoid pathway,
aromatic metabolism and the octadecanoid pathway are mostly unchanged or
down-regulated. This indicates that BPH feeding induces plant responses associated
with a JA-independent pathway and crosstalk with responses related to abiotic stress,
pathogen invasion and phytohormone signaling pathways (Zhang et al., 2004; Wang et
al., 2005; Yuan et al., 2005, Wang et al., 2008). Many studies have reported the effects
of BPH feeding on physiological properties and metabolic changes in rice plants
(Cagampang et al., 1974; Qiu et al., 2004). However, the mechanism of rice resistance
to BPH attack still remains largely unknown.
The aim of this study was to further explore the interactions between the BPH
insects and rice plants, in an attempt to elucidate the mechanisms involved in rice
resistance to the BPH. We used a susceptible rice plant variety (TN1) as a control, and
first studied the feeding behavior of the BPH on rice plants carrying the BPH-resistance
www.plantphysiol.orgon May 21, 2018 - Published by Downloaded from Copyright © 2008 American Society of Plant Biologists. All rights reserved.

7
genes Bph14 and Bph15 using the Electronic Penetration Graph (EPG) technique. We
then examined the anatomical features of the punctured phloem cells, especially the
induced callose, by observing and counting the number of sieve plates with callose
deposition. Real-time PCR was performed to examine the expression of genes coding
for callose synthases and degrading enzymes. To our knowledge, this is the first
targeted callose analysis of rice resistance to BPH feeding. Our results suggest that the
induced callose sealing in sieve tubes plays an important role in the inhibition of BPH
feeding. However, the BPH can unplug the sieve tube occlusions by activating β-1, 3-
glucanase genes in rice plants.
RESULTS
EPG Monitoring the Feeding Behavior of BPH
Brown planthoppers ingest phloem sap from rice plants through their narrow
piercing-sucking mouthparts, which are called stylets. During the feeding process, the
stylet transiently punctures the epidermis, making the first probing, then penetrates the
plant cell walls, the insect subsequently salivates into the cells, and ingests the phloem
sap. In this study, the feeding activities of the BPH on different varieties of rice, with
varying levels of resistance, were monitored electrically using a real-time EPG
technique (Tjallingii, 2006). Five types of waveform were identified, representing
different types of insect feeding behavior: non probing (Type 1), pathway (Type 2),
phloem puncture (Type 3), xylem ingestion (Type 4), and phloem sap ingestion (Type
5) (Fig. 1 and Supplemental Fig. S1).
Waveform Type 1 appeared when the stylet was outside the plant tissue and the
electronic circuit remained open. Type 1 behavior can be divided into two sub-types:
(a) BPH insects resting on plants; (b) BPH insects walking or searching for feeding
sites (Supplemental Fig. S1A). In an 8-hour recording period, the total duration of Type
1 behavior on the resistant variety B5 (carrying Bph14 and Bph15 genes) was 168.2
min; much longer than that on the susceptible rice variety TN1 (19.7 min, carrying no
BPH-resistance gene). Two moderately resistant varieties, RI35 (carrying Bph14) and
YHY15 (carrying Bph15), showed similar results to B5, with total durations of Type 1
behavior of 110.4 min and 120.5 min, respectively (Table I A). Type 1 behavior
occurred 35 times on a resistant B5 plant, and only 14 times on a susceptible TN1 plant
(Table I B). The mean duration for Type 1 behavior per feeding event on the three
www.plantphysiol.orgon May 21, 2018 - Published by Downloaded from Copyright © 2008 American Society of Plant Biologists. All rights reserved.

8
resistant varieties (5.5–8.7 min) was significantly longer than on the susceptible TN1
variety (1.5 min; Table I C). These findings indicate that BPHs spent more time resting
or moving about on resistant plants than on susceptible ones, probing more frequently
on resistant plants; the data also show that feeding was often interrupted on resistant
plants.
Waveform Type 2 occurred when the BPH insects used their stylets to search for
the target cells in plant tissues, in a series of activities including penetrating plant cells,
salivating, tasting, and forming branches of the stylet sheath (Supplemental Fig. S1A).
The total duration of this waveform type on the resistant B5 plant was 114.6 min;
significantly longer than that on the susceptible TN1 plant (33.3 min). This suggests
that the insects spend more time searching for suitable target feeding cells in the
resistant plant tissue (Table I A). The frequency of this behavior over the 8-hour
recording period showed a general tendency to increase with higher levels of plant
resistance (Table I B).
Waveform Type 3 occurred when the stylet penetrated the vascular bundle of the
rice plant (Supplemental Fig. S1B). Overall, the total duration of Waveform Type 3 was
correlated with the plants’ level of resistance, but there was a significant difference
between the two moderately resistant varieties (RI35 and YHY15) and the difference
between TN1 and YHY15 was insignificant (Table I A). Such differences in Type 1
behavior of BPHs on these moderately resistant varieties might be attributable to the
differences in resistance genes of the plants.
Waveform Type 4 represented xylem ingestion by the BPHs (Supplemental Fig.
S1C). We assumed that the xylem was not the resistant element within the plant
because of the irregular duration of this behavior on the B5 (75.5 min), YHY15 (125.9
min), RI35 (123.9 min) and TN1 (58.2 min) varieties. There was no clear relationship
between resistance level and total duration of this type of behavior (Table I A).
Waveform Type 5, representing phloem ingestion, gave a better indication of
resistance, since it reflected the relative quantity of phloem sap ingested by the BPHs
(Supplemental Fig. S1D). During the 8-hour recording period, the total duration of
Type 5 behavior on the resistant variety B5 was 33 min, approximately one-tenth of that
on the susceptible variety TN1 (340.2 min) (Table I A). Moreover, the mean duration of
each period of phloem sap ingestion was much shorter on the resistant varieties than on
the susceptible control TN1 (Table I C). These findings suggest that the BPHs spend
less time ingesting phloem sap from resistant plants than from susceptible plants.
www.plantphysiol.orgon May 21, 2018 - Published by Downloaded from Copyright © 2008 American Society of Plant Biologists. All rights reserved.

9
Use of [14C]sucrose to Quantify Phloem Sap Ingestion by BPH
Sucrose is the main carbohydrate that is transported long distances through the
phloem and ingested by the BPH. By culturing rice plants in a [14C]sucrose solution, 14C can easily be introduced into the phloem. The quantity of phloem sap ingested by
the BPHs can then be estimated by monitoring the radioactivity of 14C in the insects.
We used the ratio of radioactivity (14C) in the insect to that in the plant, designated the
I/P index, as an indicator of the relative quantity of phloem sap ingested by BPHs. The
results showed that the I/P ratio for BPHs that had fed on resistant B5 plants was very
low (0.02, compared with 0.85 for insects feeding on susceptible TN1 plants) over a
20-hour period (Fig. 2). The I/P ratios for BPHs that fed on the moderately resistant
varieties YHY15 and RI35 were 0.54 and 0.28, respectively. These results strongly
indicate that the BPH insects ingested less phloem sap from the resistant rice plants
than they did from the susceptible control (TN1).
Callose Deposition on the Sieve Plates of BPH-infested Plants
To investigate the mechanisms that prevent BPHs from continuously ingesting
phloem sap from resistant rice plants, the leaf sheaths of BPH-infested and BPH-free
resistant and susceptible plants were sectioned and examined histopathologically. The
sections were stained with 0.1% aniline blue and examined under a fluorescence
microscope. In the BPH-free untreated rice plants, there was little or no callose
deposition on the sieve plates in the leaf sheaths (Fig. 3 E and F). When the plants were
infested with the BPH, more callose was deposited on the sieve plates of the target
sieve tubes, where the stylets had been inserted – the sieve plates were obviously
thickened and emitted strong fluorescence (Fig. 3 A to D). Counts of the bright callose
plugs revealed that callose deposition increased during the first three days of
infestation in both B5 and TN1 plants, but there were more callosic sieve plates in the
former (13.7 callosic sieve plates in 50 sections) than the latter (5.8). Moreover, with
prolonged BPH feeding, the callose deposition decreased quickly in TN1 plants, to
only 2.4 callosic sieve plates in 50 sections after four days, but a high level of callose
deposition remained in the B5 plants (12.7) (Fig. 3 G). Further analysis revealed that
there were strong fluorescence signals from callose in almost all the sieve tubes
penetrated by stylet sheaths in the resistant B5 plants, but a large proportion of the
target sieve tubes did not have bright callose depositions in the susceptible TN1 plants
www.plantphysiol.orgon May 21, 2018 - Published by Downloaded from Copyright © 2008 American Society of Plant Biologists. All rights reserved.
10
(Fig. 4 D and H).
Expression of Callose Synthase and β-1, 3-Glucanase in Rice Plants
Callose deposition is a dynamic process coordinated through the activities of
callose synthase and the callose-hydrolyzing enzyme β-1, 3-glucanase. To investigate
the mechanisms responsible for the differential callose deposition in the resistant and
susceptible rice plants, the expression of ten callose synthase-encoding genes were
investigated using semi-quantitative RT-PCR. We detected transcripts of four of these
genes, namely OsGSL1, OsGSL3, OsGSL5 and OsGSL7 (Supplemental Fig. S2). Three
of the detected genes, OsGSL1, OsGSL3, and OSGS5, were further analyzed by
real-time PCR. These genes were clearly up-regulated after the B5 and TN1 plants
were treated with BPH for 6 h, reaching high levels after 12 h (2 to 4 fold of uninfested
plants). The expression levels remained high in the following 72 to 96 h, generally over
three fold higher than those in uninfested plants. (Fig. 3H to J). These observations
suggest that the callose synthase genes were up-regulated and consequently callose
synthesis was enhanced in both the resistant and susceptible plants attacked by the
BPH.
The expression patterns of six β-1, 3-glucanase genes were also investigated. The
patterns of four of them were found to differ between BPH-infested B5 and TN1 plants.
Osg1 was up-regulated by 1.2 fold within 3 h in susceptible TN1 plants, and kept
increasing from 6 h to 48 h, with a decline after 72 h. The highest expression level
occurred after treatment for 48 h, about 5 fold increased in comparison to the untreated
control (Fig. 4 J). Gns5 showed an increase both in TN1 and B5 plants, but the increase
in TN1 was much higher than in B5 plants. The greatest increase in TN1 was more 9
fold relative to the uninfested control (Fig. 4I). Gns4 was constitutively expressed in
B5, but was induced in TN1 plants. Gns6 shared similar expression patterns with Gns5.
Little or no expression of either Gns2 or Gns3 was detected in the leaf sheath of the
rice plants (Supplemental Fig. S2). The expression of β-1, 3-glucanase genes, such as
Osg1 and Gns5, was clearly up-regulated in the susceptible rice plants, in contrast, the
expression level of these genes was up-regulated much less (Gns5) or even absent at
detectable level (Osg1) in resistant ones.
Decomposition of Starch in Compensation for Sugar Losses in Susceptible plants
To investigate the anatomical effects of BPH feeding on rice plants, leaf sheaths
www.plantphysiol.orgon May 21, 2018 - Published by Downloaded from Copyright © 2008 American Society of Plant Biologists. All rights reserved.
11
of plants representing the most resistant and most susceptible varieties (B5 and TN1,
respectively) were sectioned, stained in 3% KI-1% I2 solution, and examined under a
microscope. We found abundant starch granules in the leaf sheaths of the uninfested
plants, and there appeared to be more in the B5 than in the TN1 plants (Fig. 5A, upper
two sections). In the BPH-infested plants, starch granules were rapidly consumed after
one day in the susceptible TN1 variety, and most were exhausted after three days of
infestation (Fig. 5A, right sections). In contrast, the starch granules disappeared much
more slowly in the resistant variety (B5; Fig. 5A, left sections).
The starch content of leaf sheaths was also determined. Results showed that the
starch content decreased much more quickly in TN1 than in B5, under the stress of BPH
infestation. However, it should be noted that there was much more starch in B5 (22.7
mg g-1 FW) than in TN1 (16.7 mg g-1 FW) plants that were not infested by BPHs (Fig.
5B, lower panels). The sucrose content varied in a similar way to that of the starch
content (Fig. 5B, upper panels). In the BPH-infested TN1 plants, sucrose contents fell
to ca. 56% and 30% of the untreated control plant levels after one day and four days,
respectively (Fig. 5B), showing that susceptible TN1 plants can be rapidly and
seriously deprived of carbohydrates during infestation by these insects.
The expression of nine α-amylase and three β-amylase genes in the leaf sheaths of
rice plants was investigated using semi-quantitative RT-PCR. We found that RAmy3D
(Os08g0473900), one of the genes examined, was strongly induced in the BPH-infested
TN1 plants, but was only weakly expressed in the B5 plants (Supplemental Fig. S2).
This indicates that RAmy3D plays a role in the response of susceptible rice plants to
BPH feeding by breaking down the starch.
DISCUSSION
Enhancing host resistance is an important component of integrated pest
management. However, the mechanism of rice’s resistance to BPH is still uncertain. In
the past, researchers considered that it might be governed by the presence of chemicals
confined to the phloem (Sogawa and Pathak, 1970). Bph1 was the first BPH resistance
gene identified and is associated with the production of: flavonoids, including salicylic
acid; amino acids such as aspartic acid, glutamic acid, alanine, serine, leucine,
asparagine and valine; and organic acids such as succinic acid, malic acid, oxalic acid
and transaconitic acid (Sogawa and Pathak, 1970; Sogawa, 1976). There is now
considerable evidence to suggesting that induced defenses are effective and have low
www.plantphysiol.orgon May 21, 2018 - Published by Downloaded from Copyright © 2008 American Society of Plant Biologists. All rights reserved.
12
fitness costs. Several studies have revealed that gene expression profiles in rice are
reorganized in response to BPH feeding (Zhang et al., 2004; Yuan et al., 2005; Park et
al., 2007; Wang et al., 2008). Such reorganization has been well documented in other
plant-herbivore systems, supporting the hypothesis that inducible defenses contribute
to rice’s resistance to the BPH. The data gathered in this experiment show that BPH
feeding affects the expression of genes associated with the synthesis and hydrolysis of
callose, and starch decomposition in rice plants, resulting in the deposition of callose
plugs on the sieve plates. This prevents BPH insects from continuously ingesting
phloem sap and allows normal carbohydrate levels to be maintained in resistant plants,
as described below.
Phloem, the target of BPH feeding, mainly consists of sieve tubes and companion
cells. The functional units of sieve tubes are series of sieve elements that have porous
sieve plates at their abutting ends, allowing the phloem sap to flow continuously (Will
et al., 2007). The sieve element/companion cell modules are highly sensitive to biotic
and abiotic disturbance, and elaborate sealing mechanisms, such as protein plugging
and callose formation, have evolved (McNairn and Currier, 1967; Will and Bel, 2006).
Callose has several functions in the normal development of plants (Chen et al., 2007),
and its formation and deposition can be induced by either biotic or abiotic stress
(Jacobs et al., 2003; Ueki and Citovsky, 2005). We found more callose deposits on
sieve plates in both the resistant and susceptible rice plants infested by BPH than in the
uninfested controls (Fig. 3). However, in the resistant B5 plants almost all the target
sieve tubes showed strong fluorescence, indicating that abundant, compact callose had
been deposited within them. In contrast, the callose signals were fainter in the
susceptible TN1 plants, and there were no compact callose deposits in many of their
sieve tubes where BPH insects had fed.
It has been reported that callose synthesis is Ca2+ dependent (King and Zeevaart,
1974), and phloem-feeding insects seem to induce the release of Ca2+ stored in the
reticulum or the apoplasm, thereby activating callose synthesis (Arsanto, 1986; Volk
and Franceschi, 2000). It has also been demonstrated that large amounts of callose on
sieve plates reduce the rate of phloem translocation, and can even block it completely
(McNairn and Currier, 1967). Our results strongly suggest that the BPHs had little
chance to ingest phloem sap continuously from the B5 plants. EPG data confirmed that
the BPHs spent more time searching for, and tasting, cells for feeding on resistant
plants than on susceptible plants, and that their feeding was often interrupted on the
www.plantphysiol.orgon May 21, 2018 - Published by Downloaded from Copyright © 2008 American Society of Plant Biologists. All rights reserved.

13
former (Table I, waveform types 1 and 2). The total duration of phloem sap ingestion
on resistant plants was approximately one tenth of that on susceptible plants (Table I,
waveform type 5). The 14C labeling data also support the conclusions that phloem
feeding was inhibited on B5 plants, and that the BPHs sucked only small amounts of
sap from them (Fig. 2). Therefore, we conclude that callose deposition plays an
important role in preventing BPHs from ingesting phloem sap, and thus contributes to
the resistance of rice to these insects. This is the first time that callose has been
implicated in the interaction between rice plants and the BPH. However, sieve tube
occlusion, in response to biotic and abiotic stress, has been previously reported (Will
and Bel, 2006). Cagampang et al. (1974) showed that the rate of upward sap transport
in rice plants infested by BPHs was only 60% of the rate in their uninfested
counterparts, and Nielson et al. (1990) found evidence that the acropetal movement of
photosynthates in alfalfa was seriously disrupted by potato leafhopper feeding. In
cotton, basipetal phloem translocation was completely inhibited by callose deposition
in a 14CO2 labeling trial (McNairn and Currier, 1967). Furthermore, forisomes
(spindle-like protein bodies in the sieve tubes) have been shown to inhibit aphid
feeding in the broad bean, Vicia faba (Will et al., 2007).
Since callose synthase genes were up-regulated and callose deposition occurred in
both the resistant and susceptible rice plants a short time after BPH feeding commenced
(Fig. 3), the insects had to overcome the physical barriers imposed by callose in order to
obtain sufficient food even from susceptible varieties. In the aphid/broad bean system,
aphid saliva can prevent sieve tube plugging by forisomes (Will et al., 2007), which.
have only been found in the Fabaceae. Our results, in contrast, indicate that BPH
feeding induced the expression of genes encoding β-1, 3-glucanases, causing
decomposition of the callose barriers in the susceptible rice plants (Fig. 4A-H). These
enzymes play important roles in plant defense and development.
Beta-glucanase-encoding genes have been classified into four subfamilies, based on
their structure and function. Two tandem gene clusters, Gns2–Gns3–Gns4 and
Gns5–Gns6, have been identified in the defense-related subfamily A (Romero et al.,
1998). In addition, the novel Osg1 gene of rice has also been assigned to this subfamily
(Tomoya et al., 2002). Isozymes belonging to the Gns subfamily A differ widely in
their requirements, needing 1, 6-β-glucan branch linkages nearby in the polymer chain
for activity. Polymers of β-1, 3- glucan are found in both plants and fungi, but polymers
of 1, 3; 1, 6-β-glucan are found only in fungi. Thus, GNS4 (which specifically
www.plantphysiol.orgon May 21, 2018 - Published by Downloaded from Copyright © 2008 American Society of Plant Biologists. All rights reserved.
14
hydrolyzes 1, 3; 1, 6-β-glucans) is likely to play an important role in anti-fungal
defense, rather than callose decomposition (Akiyama et al., 1997; Tomoya et al., 2002);
so high levels of β-1,3- glucanase may not be directly correlated with reductions in
callose levels. However, isozymes that mainly hydrolyze 1, 3-β-glucans, such as OSG1
and GNS5, have been presumed to play important functions in the breakdown of
callose, as well as in defending against pathogen attack (Takashi et al., 1997). The Osg1
and Gns5 genes were clearly induced by BPH attack, and are likely to play important
roles in callose decomposition, which ultimately facilitates ingestion of phloem sap by
BPHs from susceptible rice plants. Therefore, the absence of expression (or limited
expression) of these genes allows the sieve tube occlusions to be maintained in the
resistant plants, and this is probably the key reason for their resistance. This conclusion
is further supported by the findings that the expression of Osg1 is up-regulated in
Hejiang19, another variety that is susceptible to the BPH, but cannot be detected in the
moderately resistant varieties RI35 and YHY15, either in the control or BPH-treated
plants (Supplemental Fig. S3).
Starch is a major end-product of photosynthesis; it is produced in chloroplasts
and is the main energy storage substance in cereal grains and leaf sheaths. In the
chloroplast and amyloplast, starch metabolism is closely related to other metabolic
processes in the cytosol, such as sucrose metabolism, glycolysis, and glyconeogenesis,
so starch content is indicative of the dynamic transformation of carbohydrates. In
treated susceptible TN1 plants, a large amount of phloem sap was ingested by BPHs,
and the plants’ sucrose contents rapidly declined. In contrast, photosynthesis was
suppressed in the BPH-infested susceptible plants (Yuan et al., 2005). Consequently,
these plants had to up-regulate genes such as RAmy3D to decompose the starch stored
in leaf sheaths, in order to meet their carbohydrate and energy requirements
(Supplemental Fig. S2). This decomposition process may continue until the stored
starch has been exhausted. In this aspect,, starch is also important in resisting (or
tolerating) the BPH, by providing sugars for the plants. Greater starch storage would
allow the plant to tolerate BPH feeding for a longer period of time. In this study, we
found there was more starch in the uninfested plants of resistant variety B5 than in the
uninfested susceptible TN1 plants, indicating that B5 plants were capable of surviving
feeding stress for a longer period than TN1. Under the stress imposed by BPH, the
resistant B5 plants, also faced the threat of losing phloem sap, but ingestion was
inhibited by the synthesis of callose, which effectively blocked the target sieve tubes.
www.plantphysiol.orgon May 21, 2018 - Published by Downloaded from Copyright © 2008 American Society of Plant Biologists. All rights reserved.
15
In such cases, the plant only needs to provide carbohydrate for itself and, consequently,
less sucrose loss and less starch decomposition will occur. Therefore, the resistant
plants can survive a long period of stress from BPH, even when the phloem
transportation is affected to some extent; eventually the BPH will die of starvation.
Competition for sugar, as well as other nutrients, plays an important role in the
interaction between the herbivore and the plant. However, mechanisms allowing plants
to resist (or tolerate) herbivore attack may differ widely between phloem-sucking
insects and chewing insects. For example, in response to foliar herbivore, the
allocation of sugars to roots increased in the annual Nicotiana attenuate, so that plants
better tolerate herbivore (Schwachtje et al 2006).
Our understanding of the resistance mechanism can be encapsulated in the
following model of interactions between the BPH and the rice plant (Fig. 6). First, the
BPH acts on the plant by penetrating its tissues, ejecting saliva into its cells and
sucking up phloem sap. In response to BPH feeding, the plant up-regulates expression
of its callose synthase and β-1, 3-glucanase genes. Consequently, callose deposition
occludes the sieve tubes, and prevents the BPH from ingesting the phloem sap.
However, β-1, 3-glucanases that decompose the deposited callose and thereby
facilitate the BPH’s continued feeding from the phloem are strongly induced in
susceptible plants, but much more weakly induced in resistant plants. Thus, differential
expression of β-1, 3-glucanases can account for between-plant differences in resistance
levels.
CONCLUSION
We have demonstrated that feeding by the BPH can induce callose synthesis and
deposition on the sieve plates of rice plants. Callose deposition affects phloem
transportation and plays an important role in preventing the BPH from ingesting the
phloem sap. Our results show not only that callose deposition is sufficient for resistant
plants to defend themselves against the BPH, but also that some specific β-1,
3-glucanases are: active callose-decomposing enzymes, induced by BPH activity and
responsible for the susceptibility of TN1 plants. The differential expression of these
enzymes may result in different resistance levels in rice plants.
MATERIALS AND METHODS
Plants and Insects
www.plantphysiol.orgon May 21, 2018 - Published by Downloaded from Copyright © 2008 American Society of Plant Biologists. All rights reserved.

16
Five rice (Oryza sativa L.) varieties were used in this study. B5 is an line carrying
BPH resistance genes Bph14 and Bph15 from wild rice (O. officinalis) and exhibits
high resistance to BPH with the severity score below 3.0 in the seedling bulk test
(Huang et al., 2001). RI35 (carrying Bph14) and YHY15 (carrying Bph15) are progeny
lines of B5, and are moderately resistant to BPH with the severity score about 5. TN1
and Hejiang 19 are conventional varieties susceptible to BPH and their severity scores
is 9.0. All experiments were carried out on rice plants at the 3- to 5- leaf stage.
Unless otherwise stated, the brown planthopper (Nilaparvata lugens Stål, BPH)
insects were 3- to 4-instar nymphae, and the insects were maintained on TN1 plants in
the Genetics Institute, Wuhan University.
EPG Waveform Characterization and Quantification
To link the EPG waveforms with the feeding behavior patterns of the BPH, a
microscope was coupled to EPG equipment, as follows. Special plastic slides, each with
a 1-cm diameter hole in the center, were prepared and covered with stretched Parafilm.
Sucrose solution or tap water (each with a small amount of active carbon powder to
trace the water flow) was dropped onto the Parafilm, to serve as an artificial food
source, and mounted under a cover slip. BPH insects with a gold wire (length 3 to 5 cm,
diameter 20 µm) attached to the dorsum by conductive silver glue were then allowed to
probe the food through the Parafilm. The gold wire from each insect and a copper wire
(diameter 0.1 mm) immersed in the food were linked to a Giga 4 model DC-EPG
amplifier (Wageningen University, the Netherlands). The EPG setup was housed in a
climate-controlled room (25 ± 2°C) and shielded from electrical noise by an earthed
Faraday cage. The EPG was also linked to a computer running PROBE 3.1 software
(attached to the EPG equipment). The electronic signals from the different channels
were converted into digital data using a DI-710 data logger (DATAQ) and transformed
into waveforms displayed on the computer screen in real-time. By ralating the feeding
behavior of BPH insects under the microscope with the real-time EPG waveforms
displayed on the screen, we were able to categorize the waveform types (Supplemental
Fig. S1).
For EPG recordings of BPH insects feeding on rice plants, adult brachypterous
females (two days after the final molt) were collected at 9:00 am, and attached to a gold
wire, as described above. After being starved (but provided with water) for 1h, each
insect was placed on the leaf sheath of the plant to be tested and the gold wire from its
www.plantphysiol.orgon May 21, 2018 - Published by Downloaded from Copyright © 2008 American Society of Plant Biologists. All rights reserved.
17
dorsum was connected to the EPG. Before acquiring and processing data, WINDAQ
Waveform Browser software (DATAQ) was run for 30 minutes to pre-test the activity
of the insect. Data were acquired at 100 Hz sample frequency, stored on the computer’s
hard disk, and simultaneously displayed on a screen. The data were analyzed using
ANA3.0 software (Wageningen University, the Netherlands). EPG recordings were
carried out for 8 hours/insect/plant, with at least seven replicates for each variety, using
fresh seedlings and insects in each case. In a single experiment, all four genotypes were
examined simultaneously, one channel for each genotype, then the experiment was
repeated. Data were compared using Kruskal-Wallis one way analysis of variance
ranking, and Scheffe’s post-hoc pairwise comparisons (P<0.05).
Isotope 14C-labeling and Determination
For 14C-labeling, rice seedlings at the 3-leaf stage were transferred to a vial
containing a 1 mL solution of [14C]sucrose from Sigma and non-labeled sucrose (4 µCi
and 15 mg per vial, respectively). Each seedling was held in place with a sponge and
pushed into the neck of the vial so that the root was immersed in the solution. Each
plant, together with ten insects, was placed in a test tube (30 mm×200 mm) and covered
with gauze to prevent the insects from escaping. Seedlings were allowed to take up the
sucrose solution at 25±2 °C in darkness. Twenty hours later, the seedlings were
removed from the tubes, their roots were discarded and their remaining parts were cut
into 1 cm-long segments. Insects and plant segments were then plunged into 5 mL of
80% ethanol:water solution (v/v), boiled for 10 minutes and then centrifuged at 4000 g
for 5 min at 4°C. The supernatants containing the extracted soluble fractions were
collected and concentrated to 500 µL, 100 µL of which was used to determine their 14C
content, using a Beckman LS6500 liquid scintillation spectrometer (Beckman). The I/P
index (ratio of 14C radioactivity in the insects and plants) was used to evaluate the
distribution of 14C between the insects and plants, reflecting the proportion of soluble 14C ingested by the insects from the phloem.
Histochemistry and Microscopy
Rice plants were each infested with ten BPHs. Leaf sheaths were collected, fixed
in FAE (formaldehyde:acetic acid:70% ethanol=5:5:90, v/v/v), dehydrated, embedded
in paraffin, and cut into 10-µm thick sections using a microtome. The sections were
mounted on microscope slides, dewaxed, and rehydrated for staining at room
www.plantphysiol.orgon May 21, 2018 - Published by Downloaded from Copyright © 2008 American Society of Plant Biologists. All rights reserved.

18
temperature.
To highlight starch and saliva sheaths, the rehydrated sections were stained in 3%
(w/v) KI-1% I2 solution for 1 min, then examined under a light microscope. For callose
observations, 10-µm thick sections were mounted on glass slides (50 sections per slide).
Callose staining was performed as described by Dietrich et al. (1994) with some
modifications. Rehydrated sections were stained with 0.1% (w/v) aniline blue in 0.15 M
K2PHO4 for 5 min, and examined under a UV epifluorescence microscope (Olympus
BX51, Japan). Callose on individual sieve plates was classified as either ‘faint’ or
‘bright’: ‘faint’ types included clearly visible plates with a thin, green-yellow
appearance, while ‘bright’ was used to describe all thickly callosed sieve plates with
bright blue fluorescence (McNairn and Currier, 1967). The amount of callose
deposition in each plant examined was evaluated by counting the number of sieve
plates that had ‘bright’ callose. At least 400 sections were examined for each treatment.
Photographs were taken with a Coolpix 995 Digital Camera (Nikon).
Determination of Sucrose and Starch Contents
Fresh leaf sheaths (approximately 1 g) were powdered in liquid nitrogen,
homogenized in 4 mL of 80% (v/v) ethanol, heated in a water bath at 80°C for 40 min,
and centrifuged at 4000 g for 10 min. The supernatant fraction was collected, and the
solid fraction was washed with 80% ethanol and centrifuged; this procedure was
repeated twice. The supernatants collected from each sample were combined, and then
active carbon was added and filtered for sucrose analysis, while the pellet was dried for
starch determination.
Sucrose was measured using the anthrone-sulfuric acid method (Trevelyan and
Harrison, 1952) with modifications. For colorimetric determination, 0.5 mL of the
80% ethanol extract was added to 1 mL of water and digested with 1 mL 10% (w/v)
aqueous KOH in a water bath at 100 °C for 3 min. The cooled reaction mixture was
placed immediately in an ice-water bath, then 4 mL of anthrone reagent (1 g anthrone
dissolved in 500 mL 98% H2SO4) was added to the cooled mixture. The mixture was
again incubated in a 100°C water bath for 1 min, then placed for 90 sec in an ice-water
bath. The mixture was transferred by pipette into a 1 cm diameter spectrophotometer
cup, and its absorbance at 625 nm was measured using a UV-1601 spectrophotometer
(Shimadzu).
The dried pellet was added to 5 mL of 80% Ca (NO3)2 (w/v), placed in a 100 °C
www.plantphysiol.orgon May 21, 2018 - Published by Downloaded from Copyright © 2008 American Society of Plant Biologists. All rights reserved.

19
water bath for 10 min, and then centrifuged at 4000 g for 4 min. The supernatant
fraction was collected, and the solid fraction was washed with 80% Ca (NO3)2 and
centrifuged; this procedure was repeated twice. All the supernatants from each sample
collected were combined and added to 20 mL of water to prepare the starch solution.
One mL of starch solution was mixed with 2 mL of 80% Ca (NO3)2 and 100 µl solution
of 0.01 N I2-KI (1.3 g I2 and 4.0 g KI in water, final volume 1 L). The mixture was
transferred by pipette into a 1 cm diameter spectrophotometer cup, and its absorbance
at 620 nm was measured using a UV-1601 spectrophotometer.
Semi-quantitative RT-PCR
Total RNA was extracted from the leaf sheaths (approximately 200 mg fresh
weight) with Trizol Reagent (Invitrogen), and the remaining DNA was degraded using
a Turbo DNA-free kit (Ambion). cDNA was synthesized from the total RNA (4 µg)
using a Thermoscript RT-PCR system (Invitrogen), with oligo(dT)20 primers,
following the manufacturer’s instructions. RT-PCR was performed using Taq DNA
polymerase (MBI Fermentas) in 10 µL reaction mixtures with the gene-specific
primers listed in Supplemental Table S1, which were either directly synthesized
according to previously published information (Tomoya et al., 2002; Fukao et al., 2006;
Tomoya et al., 2006), or designed using the PCR primer design tool primer3
(http://frodo.wi.mit.edu) according to cDNA sequences obtained from NCBI
GeneBank (http://www.ncbi.nlm.nih.gov). Actin1 control primers were used as
standards for mRNA expression, all the templates for RT-PCR of different genes are
from the same individual cDNA samples. The amplification program consisted of an
initial denaturation step at 94°C for 5 min, followed by 28-40 cycles of 94°C for 30 sec,
58°C for 30 sec, 72°C for 1 min, and a final extension at 72°C for 5 min. This
procedure was repeated at least three times.
Real-Time PCR Analysis
Genes for real-time PCR analysis were screened based on the results of
semi-quantitative RT-PCR, the genes which showed obvious variation were chose for
real-time PCR, whereas, the genes that could not be detected or showed no obvious
variation were not chose for further study. The primers (Table II) for real-time PCR
were re-designed using primer premier 5.0 software according to cDNA sequences
obtained from NCBI GeneBank (see above). Reactions were carried out on the ABI
www.plantphysiol.orgon May 21, 2018 - Published by Downloaded from Copyright © 2008 American Society of Plant Biologists. All rights reserved.

20
PRISM 7300 Real-Time PCR System (Applied Biosystems) using three-step cycling
conditions of 95°C for 1 min, followed by 40 cycles of 95°C for 15 s, 55-60°C for 15 s,
and 72°C for 28 s. After the amplification steps, the melting curve was determined for
each primer pair, at a final stage of 15 s at 95°C, 15 s at 60°C, and 15 s at 95°C to
verify the presence of only one specific product. The reaction mixture (20 µL)
contained 2 µL of cDNA solution, 10µL SYBR Green Real-Time PCR Master Mix
(QPK-201; TOYOBO), about 5 pmol of each primer. The reactions were performed in
triplicate, and the results were averaged. A standard curve was prepared using 5µL of
cDNA solutions, in which serially diluted samples (original, 5-, 25-, 125-diluted) were
included. The slopes of Ct and dCt (target gene)-(reference gene) and R2 values of each
sample were calculated by the ABI PRISM 7300 SDS vl.X and Microsoft Excel 2003.
Relative quantification was performed with the 2–ddCt method (Livak and Schmittgen
2001). Actin1 were used as reference for mRNA expression.
SUPPLEMENTAL MATERIAL
Supplemental Figure S1. Details of the EPG waveforms shown in Fig. 1.
Supplemental Figure S2. Results of semi-quantitative RT-PCR for callose synthases,
β-1, 3-glucanases, and amylases.
Supplemental Figure S3. Results of RT-PCR analysis of Osg1.
Supplemental Table S1. Sequences of primers for semi-quantitative RT-PCR.
ACKNOWLEDGMENTS
We thank Freddy Tjallingii (Wageningen University) for valuable technical
advice about EPG. We thank Jie Zhao and Yingtang Lu (Whan University) for their
valuable help with the epifluorescence microscope and liquid scintillation
spectrometer. We also thank Hongyu Yuan (Xingyang Normal University) for the
valuable advice and assistance with Real-Time PCR System. Yanchang Wang (Wuhan
Institute of Botany, Chinese Academy of Sciences) and members of our laboratory are
acknowledged for their assistance with this project.
LITERATURE CITED
Akiyama T, Shibuya N, Hrmova M, Fincher GB (1997) Purification and
characterization of a (1→3)-β-d-glucan endohydrolase from rice (Oryza sativa)
bran. Carbohydr Res 297:365–374
www.plantphysiol.orgon May 21, 2018 - Published by Downloaded from Copyright © 2008 American Society of Plant Biologists. All rights reserved.

21
Arsanto JP (1986) Ca2+-binding sites and phosphatase activities in sieve element
reticulum and P-protein of chick-pea phloem. A cytochemical and X-ray
microanalysis survey. Protoplasma 132:160–171
Baldwin IT, Halitschke R, Kessler A, Schittko U (2001) Merging molecular and
ecological approaches in plant-insect interactions. Curr Opin Plant Biol
4:351–358
Becerra JX (2007) The impact of herbivore–plant coevolution on plant community
structure. Proc Natl Acad Sci USA 104:7483–7488
Benderoth M, Textor S, Windsor AJ, Mitchell-Olds T, Gershenzon J, Kroymann
J (2006) Positive selection driving diversification in plant secondary metabolism.
Proc Natl Acad Sci USA 103:9118–9123
Cagampang GB, Pathak MD, Juliana OB (1974) Metabolic changes in the rice plant
during infestation by the brown planthopper, Nilaparvata lugens Stål
(Atemiptera: Delphacidae). Appl Entomol Zool 9:174–184
Chen H, Wilkerson CG, Kuchar JA, Phinney BS, Howe GA (2005)
Jasmonate-inducible plant enzymes degrade essential amino acids in the
herbivore midgut. Proc Natl Acad Sci USA 102:19237–19242
Chen RZ, Zhao X, Shao Z, Wei Z, Wang YY, Zhu LL, Zhao J, Sun MX, He RF,
He GC (2007) Rice UDP-glucose pyrophosphorylase1 is essential for pollen
callose deposition and its cosuppression results in a new type of thermosensitive
genic male sterility. Plant Cell 19:847–861
De Moraes CM, Mescher MC, Tumlinson JH (2001) Caterpillar-induced nocturnal
plant volatiles repel conspecific females. Nature 410:577–580
Dietrich RA, Delaney TP, Uknes SJ, Ward ER, Ryals JA, Dangl JL (1994)
Arabidopsis mutants simulating disease resistance response. Cell 77:565–577
Fukao T, Xu K, Ronald PC, Julia BS (2006) A variable cluster of ethylene response
factor–like genes regulates metabolic and developmental acclimation responses to
submergence in rice. Plant Cell 18:2021–2034
Harfouche AL, Shivaji R, Stocker R, Williams PW, Luthe DS (2006) Ethylene
signaling mediates a maize defense response to insect herbivory. Mol
Plant-Microbe Interact 19:189–199
Huang Z, He GC, Shu LH, Li XH, Zhang QF (2001) Identification and mapping of
two brown planthopper resistance genes in rice. Theor Appl Genet 102:929-934
Jacobs AK, Lipka V, Burton RA, Panstruga R, Strizhov N, Paul SL, Fincher GB
www.plantphysiol.orgon May 21, 2018 - Published by Downloaded from Copyright © 2008 American Society of Plant Biologists. All rights reserved.
22
(2003) An Arabidopsis callose synthase, GSL5, is required for wound and
papillary callose formation. The Plant Cell 15:2503–2513
Jena KK, Jeung JU, Lee JH, Choi HC, Brar DS (2006) High-resolution mapping of
a new brown planthopper (BPH) resistance gene, Bph18(t), and marker-assisted
selection for BPH resistance in rice (Oryza sativa L.). Theor Appl Genet
112:288–297
Kandoth PK, Ranf S, Pancholi SS, Jayanty S, Walla MD, Miller W, Howe GA,
Lincoln DE, Stratmann JW (2007) Tomato MAPKs LeMPK1, LeMPK2, and
LeMPK3 function in the systemin-mediated defense response against
herbivorous insects. Proc Natl Acad Sci USA 104:12205–12210
Kempema LA, Cui X, Holzer FM, Walling LL (2007) Arabidopsis transcriptome
changes in response to phloem-feeding silverleaf whitefly nymphs. Similarities
and distinctions in responses to aphids. Plant Physiol 143:849–865
King RW, Zeevaart JAD (1974) Enhancement of phloem exudation from cut petioles
by chelating agents. Plant Physiol 53:96-103
Li Q, Xie QG, Smith-Becker J, Navarre DA, Kaloshian I (2006) Mi-1-mediated
aphid resistance involves salicylic acid and mitogen-activated protein kinase
signaling cascades. Mol Plant-Microbe Interact 19:655–664
Li X, Schuler MA, Berenbaum MR (2002) Jasmonate and salicylate induce
expression of herbivore cytochrome P450 genes. Nature 419:712–715
Livak KJ, Schmittgen TD (2001) Analysis of relative gene expression data using
real-time quantitative PCR and the 2−∆∆CT Method. Methods 25:402–408
McNairn RB, Currier HB (1967) Sieve plate callose. A factor in blockage of axial
phloem transport. Naturwissenschaften 54:591
Mithöfer A, Wanner G, Boland W (2005) Plant resistance towards insect herbivores:
a dynamic interaction. Plant Physiol 137:1160–1168
Nielson GR, Lamp WO, Stutte GW (1990) Potato leafhopper (Homoptera:
Cicadellidae) feeding disruption of phloem translocation in alfalfa. J Econ
Entoml 83:807–813
Park DS, Lee SK, Lee JH, Song MY, Song SY, Kwak DY, Yeo US, Jeon NS, Park
SK, Yi G, Song YC, Nam MH, Ku YC, Jeon JS (2007) The identification of
candidate rice genes that confer resistance to the brown planthopper (Nilaparvata
lugens) through representational difference analysis. Theor Appl Genet
115:537–547
www.plantphysiol.orgon May 21, 2018 - Published by Downloaded from Copyright © 2008 American Society of Plant Biologists. All rights reserved.
23
Qiu HM, Wu JC, Yang GQ, Dong B, Li DH (2004) Changes in the uptake function
of the rice root to nitrogen, phosphorus and potassium under brown planthopper,
Nilaparvata lugens (Stål) (Homoptera: Delphacidae) and pesticide stresses, and
effect of pesticides on rice-grain filling in field. Crop Prot 23:1041-1048
Rausher MD (2001) Co-evolution and plant resistance to natural enemies. Nature
411:857–864
Renganayaki K, Fritz AK, Sadasivam S, Pammi S, Harrington SE, McCouch SR,
Kumar S M, Reddy AS (2002) Mapping and progress toward map-based cloning
of brown planthopper biotype-4 resistance gene introgressed from Oryza
officinalis into cultivated rice, O. sativa. Crop Sci 42:2112–2117
Romero GO, Simmons C, Yaneshita M, Doan M, Thomas BR, Rodriguez RL
(1998) Characterization of rice endo-β-glucanase genes (Gns2–Gns14) defines a
new subgroup within the gene family. Gene 223:311–320
Schmelz EA, Carroll MJ, LeClere S, Phipps SM, Meredith J, Chourey PS,
Alborn HT, Teal PEA (2006) Fragments of ATP synthase mediate plant
perception of insect attack. Proc Natl Acad Sci USA 103:8894–8899
Schnee C, Köllner TG, Held M, Turlings TCJ, Gershenzon J, Degenhardt J
(2006) The products of a single maize sesquiterpene synthase form a volatile
defense signal that attracts natural enemies of maize herbivores. Proc Natl Acad
Sci USA 103:1129–1134
Schwachtje J, Minchin PEH, Jahnke S, van Dongen JT, Schittko U, and Baldwin
IT (2006) SNF1-related kinases allow plants to tolerate herbivory by allocating
carbon to roots. Proc Natl Acad Sci USA 103:12935-12940
Shi ZY, Ren X, Weng QM, Li XH, He GC (2003) Construction of a genomic library
from a brown planthopper resistant rice line using a transformation-competent
vector and identification of clones spanning the Qbp1 locus. Plant Sci
165:879–885
Sogawa K (1976) Studies on the feeding habits of the brown planthopper, Nilaparvata
lugens (Stål) (Hemiptera: Delphacidae). V. Probing stimulatory effect of rice
flavonoid. Appl Entomol Zool 11:160–164
Sogawa K, Pathak MD (1970) Mechanisms of brown planthopper resistance in
Mudgo variety of rice (Hemiptera: Delphacidae). Appl Entomol Zool 5:145–158
Tjallingii WF (2006) Salivary secretions by aphids interacting with proteins of
phloem wound responses. J Exp Bot 57:739–745
www.plantphysiol.orgon May 21, 2018 - Published by Downloaded from Copyright © 2008 American Society of Plant Biologists. All rights reserved.
24
Tomoya Y, Katsuhiro N, Takami H, Yoshiyuki Y, and Setsuo K (2002) Molecular
cloning and characterization of a novel β-1, 3-glucanase gene from rice. Biosci.
Biotechnol. Biochem 66:1403-1406
Tomoya Y, Takami H, Katsuhiro N, Setsuo K (2006) Expression analysis of genes
for callose synthases and rho-type small GTP-binding proteins that are related to
callose synthesis in rice anther. Biosci Biotechnol Biochem 70:639–645
Trevelyan WE, Harrison JS (1952) Studies on yeast metabolism 1. Fractionation and
microdetermination of cell carbohydrates. Biochem J 50:298–303
Ueki S, Citovsky V (2005) Identification of an interactor of cadmium ion-induced
glycine-rich protein involved in regulation of callose levels in plant vasculature.
Proc Natl Acad Sci USA 102:12089–12094
Voelckel C, Weisser WW, Baldwin IT (2004) An analysis of plant-aphid interactions
by different microarray hybridization strategies. Mol Ecol 13:3187–3195
Volk GM, Franceschi FR (2000) Localization of a calcium-like in the sieve element
plasma membrane. Australian J Plant Physiol 27:779–786
Walling LL (2000) The myriad plant responses to herbivores. J Plant Growth Regul
19: 195–216
Wang XL, He RF, He GC (2005) Construction of suppression subtractive
hybridization libraries and identification of brown planthopper-induced genes. J
Plant Physiol 162:1254–1262
Wang YY, Wang XL, Yuan HY, Chen RZ, Zhu LL, He RF, He GC (2008)
Responses of two contrasting genotypes of rice to brown planthopper. Mol
Plant-Microbe Interact 21: 122-132
Will T, Bel A (2006) Physical and chemical interactions between aphids and plants. J
Exp Bot 57:729–737
Will T, Tjallingii WF, Thönnessen A, Bel A (2007) Molecular sabotage of plant
defense by aphid saliva. Proc Natl Acad Sci USA 104:10536–10541
Yang HY, You AQ, Yang ZF, Zhang FT, He RF, Zhu LL, He GC (2004)
High-resolution genetic mapping at the Bph15 locus for brown planthopper
resistance in rice (Oryza sativa L.). Theor Appl Genet 110:182–191
Yuan HY, Chen XP, Zhu LL, He GC (2005) Identification of genes responsive to
brown planthopper Nilaparvata lugens Stål (Homoptera: Delphacidae) feeding in
rice. Planta 221:105–112
Zavala JA, Patankar AG, Gase K, Baldwin IT (2004) Constitutive and inducible
www.plantphysiol.orgon May 21, 2018 - Published by Downloaded from Copyright © 2008 American Society of Plant Biologists. All rights reserved.

25
trypsin proteinase inhibitor production incurs large fitness costs in Nicotiana
attenuate. Proc Natl Acad Sci USA 101:1607–1612
Zhang FT, Zhu LL, He GC (2004) Differential gene expression in response to brown
planthopper feeding in rice. J Plant Physiol 161:53–62
Zhang QF (2007) Strategies for developing Green Super Rice. Proc Natl Acad Sci
USA 104: 16402-16409
www.plantphysiol.orgon May 21, 2018 - Published by Downloaded from Copyright © 2008 American Society of Plant Biologists. All rights reserved.
26
FIGURE LEGENDS
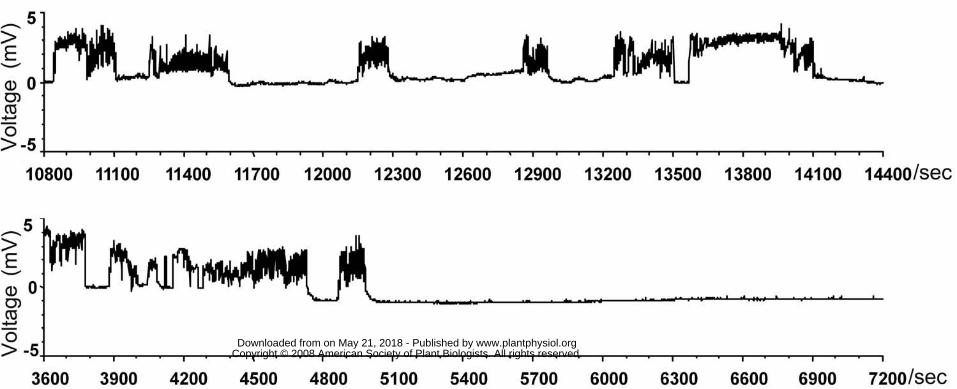
Figure 1. Overview of the EPG waveforms that occurred over 1 hour. In the resistant
variety B5 (upper), Waveform Type 5 (phloem sap ingestion) was interrupted at least
five times, and lasted no longer than 10 min uninterrupted. In the susceptible variety
TN1 (lower), Waveform Type 5 occurred twice, and was interrupted after 2 min (at
about 4850 sec) on one occasion, while the other occurrence lasted for more than 35
min (from 5000 sec to 7200 sec).
Figure 2. I/P indices (ratio of 14C radioactivity in feeding insects to 14C radioactivity in
host plants) for each of the rice varieties. The results suggest that the BPHs took up
more phloem sap from the susceptible variety TN1 than from YHY15 or RI35, and
extremely little from the resistant variety B5. Rice variety B5 carries BPH-resistance
genes Bph14 and Bph15; RI35 and YHY15 carry Bph14 and Bph15, respectively; TN1
has no BPH-resistance gene.
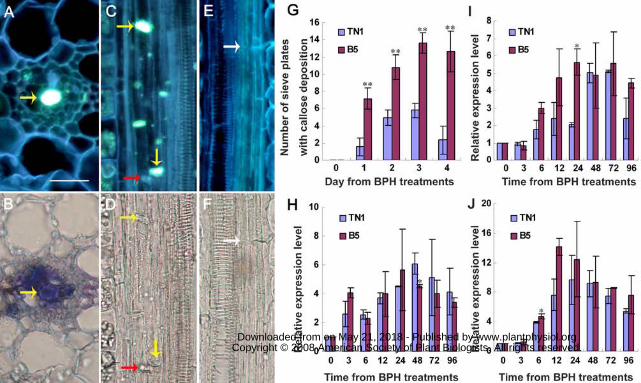
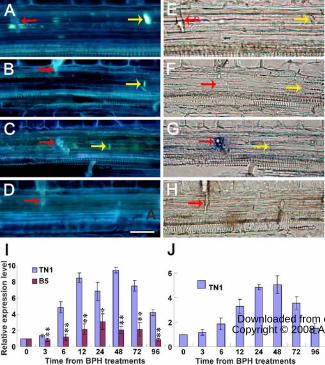
Figure 3. Induced callose deposition and the expression of callose synthase genes. (A
to D) Induced callose deposition (yellow arrows) on the sieve plates with bright blue
fluorescence, in the resistant variety B5 plant infested by BPH. (B) and (D) Light
microphotographs of (A) and (C), respectively. (E and F) Longitudinal sections of an
uninfested control leaf sheath showing no accumulated callose on the sieve plate
(white arrows). Red arrows indicate stylet sheaths. Scale bar = 20 µm. (G) Numbers of
sieve plates with callose deposition in BPH-infested leaf sheaths, counted under the
microscope. Standard error bars (SBs) indicate the numbers of sieve plates with callose
deposition observed in 50 cross-sections, and vertical bars on the SBs indicate standard
errors. (H to J) Results of real-time PCR expression analysis of the callose synthase
genes in each of the rice varieties in response to BPH feeding. (H), OsGSL3; (I),
OsGSL1; (J), OsGSL5. Total RNA was extracted from rice leaf sheaths after different
BPH feeding times (h); Expression of genes was quantified relative to the value
obtained from 0 (h) samples (BPH-free plants). Each bar represents the mean values ±
standard error of three replicates. Each RNA sample was extracted from approximately
200 mg fresh leaf sheaths of 10 rice plants. Rice Actin1 gene was used as reference
control. Significant differences in gene expression was indicated with * (P < 0.05) or
** (P < 0.01), Student's t-test.
www.plantphysiol.orgon May 21, 2018 - Published by Downloaded from Copyright © 2008 American Society of Plant Biologists. All rights reserved.
27
Figure 4. Callose decomposition and expression of related genes. (A-H) Deposited
callose decomposing in longitudinal sections of leaf sheaths from susceptible TN1
plants. (A) and (E) Deposited callose (yellow arrows) in sieve tubes on the sieve plates
and embedding of the stylet sheath. (B), (C), (F) and (G) Callose in various stages of
decomposition. (D) and (H) Target sieve tubes with no bright callose deposition. Red
arrows indicate stylet sheaths. Scale bar = 20 µm. (I) and (J) Results of real-time PCR
expression analysis of Gns subfamily genes. (I) for Gns5, (J) for Osg1. Total RNA was
extracted from rice leaf sheaths after different BPH feeding times (h); Expression of
genes was quantified relative to the value obtained from 0 (h) samples (BPH-free
plants). Each bar represents the mean values ± standard error of three replicates. Each
RNA sample was extracted from approximately 200 mg fresh leaf sheaths of 10 rice
plants. Rice Actin1 gene was used as reference control. Significant differences in gene
expression was indicated with * (P < 0.05) or ** (P < 0.01), Student's t-test.
Figure 5. Starch and sucrose variation in leaf sheaths of rice varieties infested with
BPH. (A) Cross-sections of leaf sheaths stained with KI-I2, showing starch granules. In
control plants with no BPH, leaf sheaths of both B5 and TN1 plants had large numbers
of dark starch granules in their parenchyma cells (upper images). After the plants had
been infested with BPH for 1 day (middle images) and 3 days (lower images), most of
the starch granules still remained in the resistant B5 plants (left), but had disappeared
in the susceptible TN1 plants (right). Pc-parenchyma cells, Xy-xylem, Ph-phloem. (B)
Contents of sucrose (upper) and starch (lower) after different BPH-infestation times
(days) in leaf sheaths of different rice varieties. Standard bars (SBs) indicate mean
contents from six replicates and vertical bars on the SBs indicate standard errors.
Figure 6. Model of the interaction between the BPH and rice plants. The BPH first
acts on a plant by penetrating its tissues, ejecting saliva into its cells and sucking up
phloem sap. In response to feeding by the BPH, the plant up-regulates genes encoding
callose synthases and β-1, 3-glucanases. Consequently, callose deposition occludes the
sieve tubes, and prevents the BPH from ingesting the phloem sap. Then, specific β-1,
3-glucanases decompose the deposited callose in susceptible plants (but little in
resistant plants), allowing the BPH to resume feeding from the phloem. Thus,
differential expression of β-1, 3-glucanases accounts for the differences in their
resistance levels. Arrows indicate promotion or positive modulation of the process;
www.plantphysiol.orgon May 21, 2018 - Published by Downloaded from Copyright © 2008 American Society of Plant Biologists. All rights reserved.

28
vertical bars indicate inhibition or negative modulation of the process.
www.plantphysiol.orgon May 21, 2018 - Published by Downloaded from Copyright © 2008 American Society of Plant Biologists. All rights reserved.
29
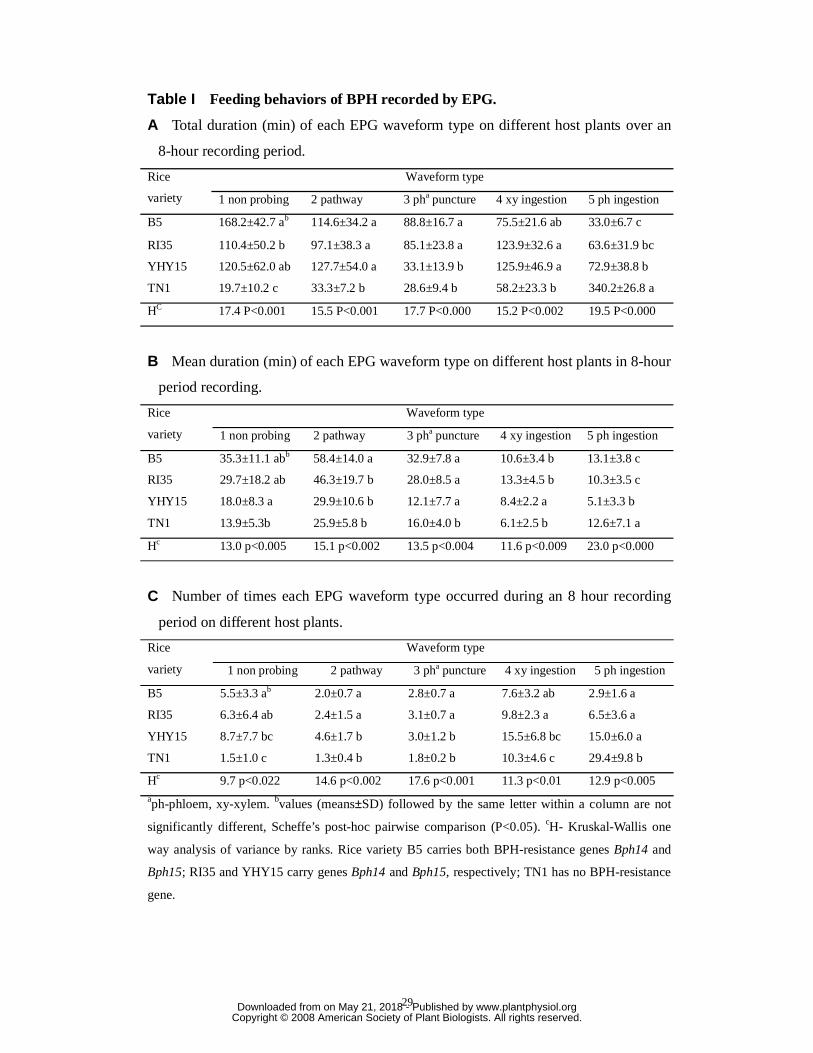
Table I Feeding behaviors of BPH recorded by EPG.
A Total duration (min) of each EPG waveform type on different host plants over an
8-hour recording period.
Waveform type Rice
variety 1 non probing 2 pathway 3 pha puncture 4 xy ingestion 5 ph ingestion
B5 168.2±42.7 ab 114.6±34.2 a 88.8±16.7 a 75.5±21.6 ab 33.0±6.7 c
RI35 110.4±50.2 b 97.1±38.3 a 85.1±23.8 a 123.9±32.6 a 63.6±31.9 bc
YHY15 120.5±62.0 ab 127.7±54.0 a 33.1±13.9 b 125.9±46.9 a 72.9±38.8 b
TN1 19.7±10.2 c 33.3±7.2 b 28.6±9.4 b 58.2±23.3 b 340.2±26.8 a
HC 17.4 P<0.001 15.5 P<0.001 17.7 P<0.000 15.2 P<0.002 19.5 P<0.000
B Mean duration (min) of each EPG waveform type on different host plants in 8-hour
period recording.
Waveform type Rice
variety 1 non probing 2 pathway 3 pha puncture 4 xy ingestion 5 ph ingestion
B5 35.3±11.1 abb 58.4±14.0 a 32.9±7.8 a 10.6±3.4 b 13.1±3.8 c
RI35 29.7±18.2 ab 46.3±19.7 b 28.0±8.5 a 13.3±4.5 b 10.3±3.5 c
YHY15 18.0±8.3 a 29.9±10.6 b 12.1±7.7 a 8.4±2.2 a 5.1±3.3 b
TN1 13.9±5.3b 25.9±5.8 b 16.0±4.0 b 6.1±2.5 b 12.6±7.1 a
Hc 13.0 p<0.005 15.1 p<0.002 13.5 p<0.004 11.6 p<0.009 23.0 p<0.000
C Number of times each EPG waveform type occurred during an 8 hour recording
period on different host plants.
Waveform type Rice
variety 1 non probing 2 pathway 3 pha puncture 4 xy ingestion 5 ph ingestion
B5 5.5±3.3 ab 2.0±0.7 a 2.8±0.7 a 7.6±3.2 ab 2.9±1.6 a
RI35 6.3±6.4 ab 2.4±1.5 a 3.1±0.7 a 9.8±2.3 a 6.5±3.6 a
YHY15 8.7±7.7 bc 4.6±1.7 b 3.0±1.2 b 15.5±6.8 bc 15.0±6.0 a
TN1 1.5±1.0 c 1.3±0.4 b 1.8±0.2 b 10.3±4.6 c 29.4±9.8 b
Hc 9.7 p<0.022 14.6 p<0.002 17.6 p<0.001 11.3 p<0.01 12.9 p<0.005 aph-phloem, xy-xylem. bvalues (means±SD) followed by the same letter within a column are not
significantly different, Scheffe’s post-hoc pairwise comparison (P<0.05). cH- Kruskal-Wallis one
way analysis of variance by ranks. Rice variety B5 carries both BPH-resistance genes Bph14 and
Bph15; RI35 and YHY15 carry genes Bph14 and Bph15, respectively; TN1 has no BPH-resistance
gene.
www.plantphysiol.orgon May 21, 2018 - Published by Downloaded from Copyright © 2008 American Society of Plant Biologists. All rights reserved.
30
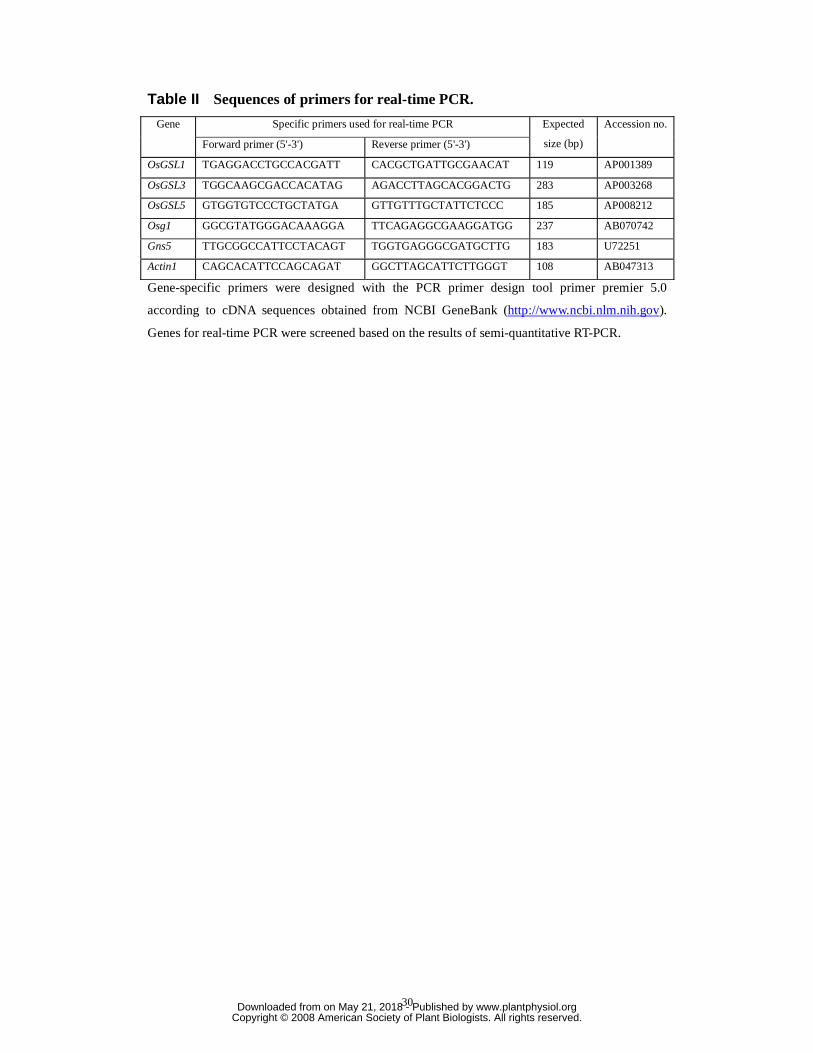
Table II Sequences of primers for real-time PCR.
Specific primers used for real-time PCR Gene
Forward primer (5'-3') Reverse primer (5'-3')
Expected
size (bp)
Accession no.
OsGSL1 TGAGGACCTGCCACGATT CACGCTGATTGCGAACAT 119 AP001389
OsGSL3 TGGCAAGCGACCACATAG AGACCTTAGCACGGACTG 283 AP003268
OsGSL5 GTGGTGTCCCTGCTATGA GTTGTTTGCTATTCTCCC 185 AP008212
Osg1 GGCGTATGGGACAAAGGA TTCAGAGGCGAAGGATGG 237 AB070742
Gns5 TTGCGGCCATTCCTACAGT TGGTGAGGGCGATGCTTG 183 U72251
Actin1 CAGCACATTCCAGCAGAT GGCTTAGCATTCTTGGGT 108 AB047313
Gene-specific primers were designed with the PCR primer design tool primer premier 5.0
according to cDNA sequences obtained from NCBI GeneBank (http://www.ncbi.nlm.nih.gov).
Genes for real-time PCR were screened based on the results of semi-quantitative RT-PCR.
www.plantphysiol.orgon May 21, 2018 - Published by Downloaded from Copyright © 2008 American Society of Plant Biologists. All rights reserved.
www.plantphysiol.orgon May 21, 2018 - Published by Downloaded from Copyright © 2008 American Society of Plant Biologists. All rights reserved.

www.plantphysiol.orgon May 21, 2018 - Published by Downloaded from Copyright © 2008 American Society of Plant Biologists. All rights reserved.
www.plantphysiol.orgon May 21, 2018 - Published by Downloaded from Copyright © 2008 American Society of Plant Biologists. All rights reserved.
www.plantphysiol.orgon May 21, 2018 - Published by Downloaded from Copyright © 2008 American Society of Plant Biologists. All rights reserved.

www.plantphysiol.orgon May 21, 2018 - Published by Downloaded from Copyright © 2008 American Society of Plant Biologists. All rights reserved.

www.plantphysiol.orgon May 21, 2018 - Published by Downloaded from Copyright © 2008 American Society of Plant Biologists. All rights reserved.


![MRI of Arthritisthritis [AS], enteropathic arthropathies, and psoriatic arthritis), septic arthritis, crystal-deposition and other deposition-induced arthropathies, and synovium-based](https://img.pdfslide.us/doc/110x75/5e46b77456173108910fd237/mri-of-arthritis-thritis-as-enteropathic-arthropathies-and-psoriatic-arthritis.jpg)
![A Comparative Study of Iron-Based Film Deposition from Iron ......In particular, deposition of iron from Fe(CO)5 was obtained by W laser excitation [5,6] and by laser- induced thermal](https://img.pdfslide.us/doc/110x75/60ed256742a0b709a95b26a3/a-comparative-study-of-iron-based-film-deposition-from-iron-in-particular.jpg)