Embed Size (px)
Citation preview
Running head: First-year students’ time use in college 1
First-year students’ time use in college:
A latent profile analysis
Kevin Fosnacht
Alexander C. McCormick
Rosemarie Lerma
Indiana University
Paper presented at the annual meeting of the
Association for the Study of Higher Education, Columbus, OH, November 2016.
First-year students’ time use in college 2
Abstract
Students’ time expenditures influence their learning and development. This study used latent
profile analysis to identify a typology of how first-year students spend their time using a large,
comprehensive sample. It identified four time usage patterns by first-year students titled
balanced, involved, partiers, and parents. Sex, expected major field, on-campus residency, age,
Greek-life membership, and standardized test scores were predictive of students’ time use
patterns. Implications for policy and practice are discussed.
First-year students’ time use in college 3
First-year students’ time use in college: A latent profile analysis
Recent popular accounts of the undergraduate experience suggest that students learn little
and spend considerable time partying and on other leisure activities (e.g., Armstrong &
Hamilton, 2013; Arum & Roksa, 2011; Babcock & Marks, 2011). While these accounts have
captured the media’s and public’s attention, it is not clear that these portrayals reflect reality for
all undergraduates and other explanations have been put forward (McCormick, 2011). Time
usage is a critical component of student learning and development (Pace, 1980); consequently, it
is imperative to better understand how students utilize their time and its relationship to student
learning and development. In this study, we analyzed first-year students’ time-use patterns to
subject these narratives to careful scrutiny. While others have previously attempted to classify
students into discrete groups (e.g., Armstrong & Hamilton, 2013; Brint & Cantwell, 2010; Hu &
McCormick, 2012; Quadlin & Rudel, 2015; Rau & Donald, 2000), these efforts have used data
from a single or particular type of college or use older, non-probabilistic frameworks. In this
paper we seek to overcome these limitations by classifying students based on their time-use
patterns using data from a variety of institution types using latent profile analysis.
Undergraduates’ Time Use
Students make varying choices in how they allocate their time to a range of activities,
such as class attendance, studying, working, leisure and recreation, personal care, and so on. This
variation in time use can have important implications for the student experience. The way
students use their time has implications for their level of engagement, learning and development.
As Kuh and colleagues (2005) have argued, “what students do during college counts more in
terms of desired outcomes than who they are or where they go to college” (p. 8).
First-year students’ time use in college 4
Time use among college students is a surprisingly underexplored concept. The available
data suggests that students’ time use patterns have changed over time (Babcock & Marks, 2011).
It is estimated that full-time students spent 40 hours per week studying and attending class in
1961, but only 27 hours per week in 2003. In their analysis, Babcock and Marks (2011)
challenge the suggestion that the decline is attributable to changes in technology, student
demographics, or the extent of work for pay. Using more recent time use data, it is estimated that
undergraduates expend approximately 14% of their time or roughly 3.2 hours per day, on
average, attending class and studying (Pell Institute, 2015). However, there is some suggestive
evidence that low-income students, specifically those receiving Pell grants, spend more time
studying than the average student (Goldrick-Rab, 2016; Pell Institute, 2015);
While Babcock and Marks (2011) speculate that the declining amount of time spent
studying has resulted in less learning and development, the existing literature is mixed on how
study time allocations relates to formal academic performance. Lahmers and Zulauf (2000)
estimate that meaningful GPA increases would require substantial changes in the time allocated
to studying, a finding replicated by Brint and Cantwell (2010). In contrast, Stinebrickner and
Stinebrickner (2004) found substantial effects on GPA when the amount of study time increased
from 1 to 2 hours per day, but diminishing returns for additional hours.
There is some evidence to suggest that working during college, particularly off campus,
negatively impacts students’ academic performance (Brint & Cantwell, 2010; Ehrenberg &
Sherman, 1987; Stinebrickner & Stinebrickner, 2003). Two studies found that receiving a
scholarship alters students’ time use and activities (DesJardins, McCall, Ott, & Kim, 2010;
Harris & Goldrick-Rab, 2012). Additionally, student loan debt has been correlated with time use
(Quadlin & Rudel, 2015). Thus, it appears that undergraduate time use is malleable and a
First-year students’ time use in college 5
function of the students’ personal circumstances. However, much of the available research has
focused on students attending a single institution or type of institution. Consequently, it is
difficult to generalize these relationships to the broader student population. Furthermore, there
has been little investigation of how various combinations of time use relate to outcomes.
Student Typologies
Compared to the study of time use, more effort has been devoted to identifying student
typologies. An early example is Cowley and Waller’s (1935) work. They examined college life,
from student traditions to lifestyles, in order to analyze the cultural complexities, processes, and
defined patterns of human behavior to explain student life in America. A more prominent
example is Clark and Trow’s (1966) two-dimensional model of college student subcultures that
classified students by their identification with the institution and involvement with ideas. This
model was partially validated quantitatively by Terenzini and Pascarella (1977), but they noted
that the involvement with ideas dimension was problematic in distinguishing between students.
Astin (1993) developed an empirical student typology using factor analysis with
Cooperative Institutional Research Program data that identified 7 student subcultures: Hedonists,
Status Strivers, Scholars, Leaders, Social Activists, Artists, and Uncommitted. Not surprisingly,
these typologies were associated with a variety of college outcomes. However, an important
implication of Astin’s typology is the finding that the student-type composition of a student’s
peer group was the most important environmental influence on students during college.
Since Astin’s (1993) work, postsecondary researchers have continued to develop
typologies to help improve and guide practice (see Hu, Katherine, & Kuh, 2011 for a
comprehensive literature review). While the typologies use different labels, many substantially
overlap with Astin’s (1993) subcultures and have been derived from student engagement data.

First-year students’ time use in college 6
Kuh and colleagues (2000) used factor and cluster analysis to develop a typology using measures
of student effort in educationally beneficial activities. They identified 10 distinct types of
students: disengaged, recreator, socializer, collegiate, scientist, individualist, artist, grind,
intellectual, and conventional. Zhao, Gonyea, and Kuh (2003) found eight types of students
using NSSE data: unconventionals, collegiate, vocationals, conventionals, grinds, academics,
maximizers, and disengaged. A notable finding by Zhao and colleagues (2003) is the emergence
of the unconventional group which included students with lower levels of engagement in social
and academic activities, but who frequently engaged with individuals from diverse backgrounds.
They partially attribute the unconventional group to the increasing number of part-time and non-
traditional students.
Hu and McCormick (2012) used NSSE data to identify seven types of students, which
substantially overlapped with Zhao and colleagues’ (2003) work. However, Hu and
McCormick’s study is distinguished by its focus on how their student types correlated with
directly assessed learning gains, self-reported gains, GPA, and persistence. They found that
compared to grinds, unconventionals, maximizers, and conventionals had higher scores on a
direct assessment of student learning gains, while disengaged students scored lower, after
controlling for other factors. Additionally, academics, unconventionals, collegiates, maximizers
and conventionals were more likely to persist than grinds, holding other variables constant.
Using data from students attending the University of California, Brint and Cantwell
(2010) classified students into the following five categories based upon their time-use patterns:
scholars, scholar actives, actives, workers, and passives. They found a variety of student
characteristics were correlated with membership in the five time-use categories. In particular,
major field, race/ethnicity, first-generation status, SAT I score, and academic conscientiousness
First-year students’ time use in college 7
were predictive of category membership. Quadlin and Rudel (2015) also classified students by
their time usage using latent class analysis, based on data from the National Longitudinal Survey
of Freshmen. Roughly 40% of their sample was classified as serious students, 25% as inactives,
and a third were labeled socially engaged. They found that sex, race/ethnicity, parental financial
contributions, student loan debt, major choice, and institution type were predictive of group
membership.
Most of the existing research classifies students according to their psychological profiles
or participation in specific activities, not based on their general patterns of time use.
Additionally, this research typically uses older, more descriptive techniques that may not
properly describe the latent distribution (Magidson & Vermunt, 2002). The exception, Quadlin
and Rudel (2015), utilized a sample from students attending highly selective institutions,
therefore, it is unclear how their findings generalize to the broader population of undergraduate
students. Consequently, we sought to fill in these literature gaps by examining how students use
their time using a diverse sample of first-year students attending a variety of institution types.
Additionally, we employed latent profile analysis which allowed us to describe the latent
distribution of how students spent their time, which improves upon the methods employed by
most previous typology researchers studying bachelor’s-seeking undergraduates.
Theoretical Framework
Student engagement theory guided this inquiry. The current understanding of student
engagement theory has been informed by previous work including Pace’s (1980) “quality of
effort” concept, wherein student learning is related to the quality and quantity of effort, and
Astin’s (1984) student involvement theory, in which student involvement in academic and co-
curricular activities promotes retention. Additionally, the work of Chickering and Gamson
First-year students’ time use in college 8
(1987) highlighted a range of effective educational practices that institutions can use to promote
students’ learning and development. The current understanding of student engagement theory
was conceptualized by Kuh and colleagues (1991) and combines these concepts, but also
considers how institutions can promote learning outside of the classroom (McCormick, Kinzie,
& Gonyea, 2013). Consequently, we do not view student learning and development as solely
occurring in a classroom environment, but take a more holistic approach and view student
learning as taking place in the classroom, through formal and informal co-curricular activities,
and via interactions with students, faculty, peers, and the surrounding community.
In the student engagement paradigm, students’ time allocation is viewed as an input into
their learning and development. However, institutions are believed to play an important role in
how students decide to spend their time. Institutions can influence students’ time allocations
through curriculum structure (e.g., courses offered, timing of courses, modes of delivery),
pedagogical practices, physical space (e.g., residence halls, study spaces), support services,
expectations for students, co-curricular activities, and institutional culture (interactions with
faculty, staff, and peers). Consequently, we regard students’ time usage to be influenced by both
students’ decisions and the environment experienced by students.
Research Questions
Guided by student engagement theory, we sought to investigate and identify patterns in
first-year students’ time use and how these patterns are related to student and institutional
characteristics. We investigated the following research questions:
1. How do first-year students allocate their time?
2. What homogenous time usage patterns exist among first-year students?
3. How do time usage patterns correlate with student and institutional characteristics?
First-year students’ time use in college 9
Data and Methods
Data
Our data come from the 2014 and 2015 administrations of the National Survey of Student
Engagement (NSSE). NSSE is a large multi-institutional survey that assesses students’
engagement in educationally beneficial activities, time use, perceptions of the campus
environment, perceived institutional contribution to their educational gains, and academic and
demographic characteristics. NSSE is annually administered in the winter and spring to first-year
and senior students attending bachelor’s-granting institutions in the US and Canada. Our initial
sample included 233,164 first-year students attending 958 bachelor’s-granting U.S. institutions.
The response rate for the initial sample was 22%. Due to the computational intensity of our
analyses, we extracted an analytic sample of 3,000 students from this larger sample. Students
were selected into the analytic sample through a weighted random selection approach that
accounted for differential rates of non-response by sex, enrollment status (full/part-time) and
institution size.
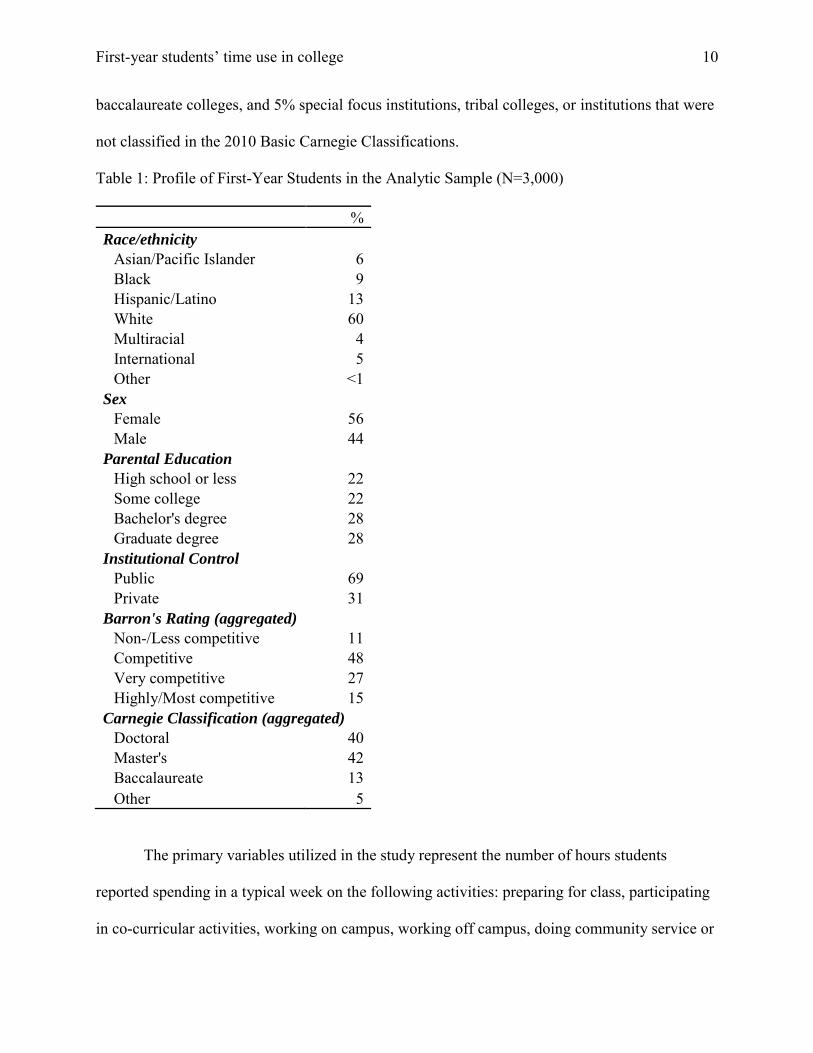
Table 1 presents the characteristics of the analytic sample. About three out of five
students were White. Asian/Pacific Islander, Black, and Hispanic/Latino students accounted for
6%, 9% and 13% of the sample, respectively. About three-fifths (56%) of the sample was
female. The sample was roughly evenly divided between students with a parental education of
high school or less, some college, bachelor’s degree, and graduate degree. About 7 in 10 students
were enrolled at a public institution. Half of the sample attended an institution with a Barron’s
selectivity rating of competitive, with another 42% attending more selective institutions. About
40% of the sample attended doctoral universities, 42% master’s colleges and universities, 13%
First-year students’ time use in college 10
baccalaureate colleges, and 5% special focus institutions, tribal colleges, or institutions that were
not classified in the 2010 Basic Carnegie Classifications.
Table 1: Profile of First-Year Students in the Analytic Sample (N=3,000)
% Race/ethnicity
Asian/Pacific Islander 6 Black 9 Hispanic/Latino 13 White 60 Multiracial 4 International 5 Other <1
Sex Female 56 Male 44
Parental Education High school or less 22 Some college 22 Bachelor's degree 28 Graduate degree 28
Institutional Control Public 69 Private 31
Barron's Rating (aggregated) Non-/Less competitive 11 Competitive 48 Very competitive 27 Highly/Most competitive 15
Carnegie Classification (aggregated)
Doctoral 40 Master's 42 Baccalaureate 13 Other 5
The primary variables utilized in the study represent the number of hours students
reported spending in a typical week on the following activities: preparing for class, participating
in co-curricular activities, working on campus, working off campus, doing community service or
First-year students’ time use in college 11
volunteer work, relaxing and socializing, providing care for dependents, and commuting to
campus. Students reported time use in discrete ranges on the NSSE instrument which were
recoded to their midpoints for this analysis. (The unbounded upper choice was assigned a fixed
value slightly above the cut point.) We combined the two work variables into a single variable,
and did the same with co-curricular activities and volunteering/community service.
The other variables used in the analyses were various student and institutional
characteristics previously correlated with student engagement (National Survey of Student
Engagement, 2016). Student characteristics included sex, race/ethnicity, parental education,
educational expectations, SAT I or ACT equivalent, part-time status, nontraditional age (24 or
older), distance education status, Greek-life member, on-campus resident, student athlete status,
and expected major field. These variables were primarily reported by respondents, except for
sex, race/ethnicity, part-time status, and standardized test score which were institution-reported.
Institutional characteristics included 2010 Basic Carnegie Classification (aggregated), Barron’s
rating, urbanicity, proportion of women students, proportion of white students, total
undergraduate enrollment, and institutional control. These data were assembled from IPEDS
(National Center for Educational Statistics, n.d.), the Carnegie Classifications (Carnegie
Foundation for the Advancement of Teaching, 2010), and Barron’s Educational Series (2012).
Analytic Methods
We began our analyses by examining the descriptive statistics of the time expenditure
data. Next, we analyzed the time expenditure data using latent profile analysis (LPA), a type of
finite mixture model. LPA identifies unobserved groups of individuals from observed data
through a probabilistic framework (Lazarsfeld & Henry, 1968). LPA is closely linked to the
more common latent class analysis; however unlike latent class analysis, LPA permits the use of
First-year students’ time use in college 12
continuous variables. LPA has methodological advantages over other approaches such as cluster
and discriminant analysis as it uses a probabilistic framework that describes the latent
distribution, rather than simply analyzing the distance between individuals (Magidson &
Vermunt, 2002).
As the correct number of classes or groups was not known a priori, we used an iterative
process to identify the best fitting LPA model and thereby the appropriate number of latent
classes (Clark, Muthén, Kapri, D’Onofrio, Viken, & Rose, 2013). This process entailed fitting a
series of latent profile models starting with 2 classes. We estimated models with up to 6 classes,
and would have fit additional models, if needed. To identify the best candidate models, we
examined the Akaike information criterion (AIC), Bayesian information criterion (BIC), and
adjusted Bayesian information criterion (aBIC) for each model. Next, we performed the Lo–
Mendell–Rubin (LMR) test and the parametric bootstrapped likelihood ratio test (BLRT) to
compare the candidate models. These tests provide significance tests on the probability that a k
versus k-1 class model fits better. If the p value is less than .05, the k model is preferable,
otherwise the k-1 model is a better fit for the data. Simulation studies have shown that the BIC is
the best predictor of the information criterion tests, but that the BLRT is the best overall
indicator of the correct number of classes (Nylund, Asparouhov, & Muthén, 2007). However, the
BLRT is not always the most reliable indicator in practice (Muthén, 2009).
After identifying the model with the best characteristics, we examined that model’s
results. We used the parameter estimates to create an item-profile plot, which visually displays
the average amount of time spent in each activity by members of the identified latent classes.
Additionally, we examined the proportion of the sample in each latent class identified.
First-year students’ time use in college 13
Next, we developed a multinomial logistic regression model to examine how various
student and institutional characteristics were related to the latent classes identified. As LPA
provides probability estimates of latent class membership, we estimated a multinomial logistic
regression model via a multiple imputation framework. This allowed us to use multiple pseudo-
class draws to account for the uncertainty of latent class membership. A total of twenty imputed
datasets were created as recommended by Wang, Hendricks Brown, and Bandeen-Roche (2005).
For each imputed dataset, we first generated a random number for each student ranging from 0 to
1. Next, we assigned the student to the class where the random number fell in the posterior class
distribution for that student. For example, a student with a 25%, 50%, and 25% estimated
probability of being a member of latent classes 1, 2, and 3, would be assigned to the first class if
the random number was .15 (as it falls between 0 and .25) or the third class if the random
number was .80 (as it falls between .75 [.25+.50] and 1). Additionally, we took the opportunity
to impute other covariates using predictive mean matching for continuous variables (from a pool
of 10 nearest neighbors; Morris, White, & Royston, 2014) and the appropriate form of logistic
regression for binary, ordinal, and nominal variables. After creating the imputed datasets which
contained a student ID, the class membership pseudo-class draw, and the imputed covariates, we
estimated a multinomial logistic regression using the covariates described above using each
dataset. The coefficients were averaged across the models and the standard errors were
calculated as recommended by Rubin (1987). Finally, we converted the coefficient estimates to
relative risk ratios (RRR) by exponentiating the coefficients. The RRRs represent the change in
relative risk of being a member of a given group relative to the comparison group for a unit
change in the independent variable, holding other factors constant.
First-year students’ time use in college 14
Results
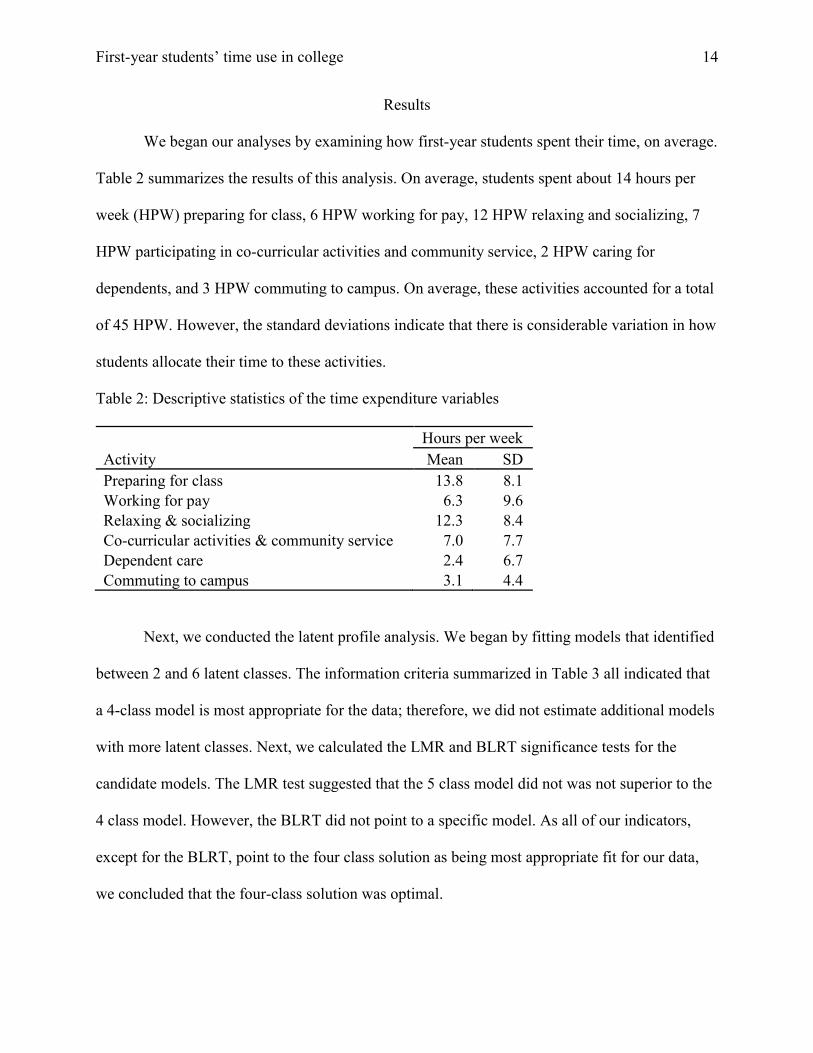
We began our analyses by examining how first-year students spent their time, on average.
Table 2 summarizes the results of this analysis. On average, students spent about 14 hours per
week (HPW) preparing for class, 6 HPW working for pay, 12 HPW relaxing and socializing, 7
HPW participating in co-curricular activities and community service, 2 HPW caring for
dependents, and 3 HPW commuting to campus. On average, these activities accounted for a total
of 45 HPW. However, the standard deviations indicate that there is considerable variation in how
students allocate their time to these activities.
Table 2: Descriptive statistics of the time expenditure variables
Hours per week Activity Mean SD Preparing for class 13.8 8.1 Working for pay 6.3 9.6 Relaxing & socializing 12.3 8.4 Co-curricular activities & community service 7.0 7.7 Dependent care 2.4 6.7 Commuting to campus 3.1 4.4
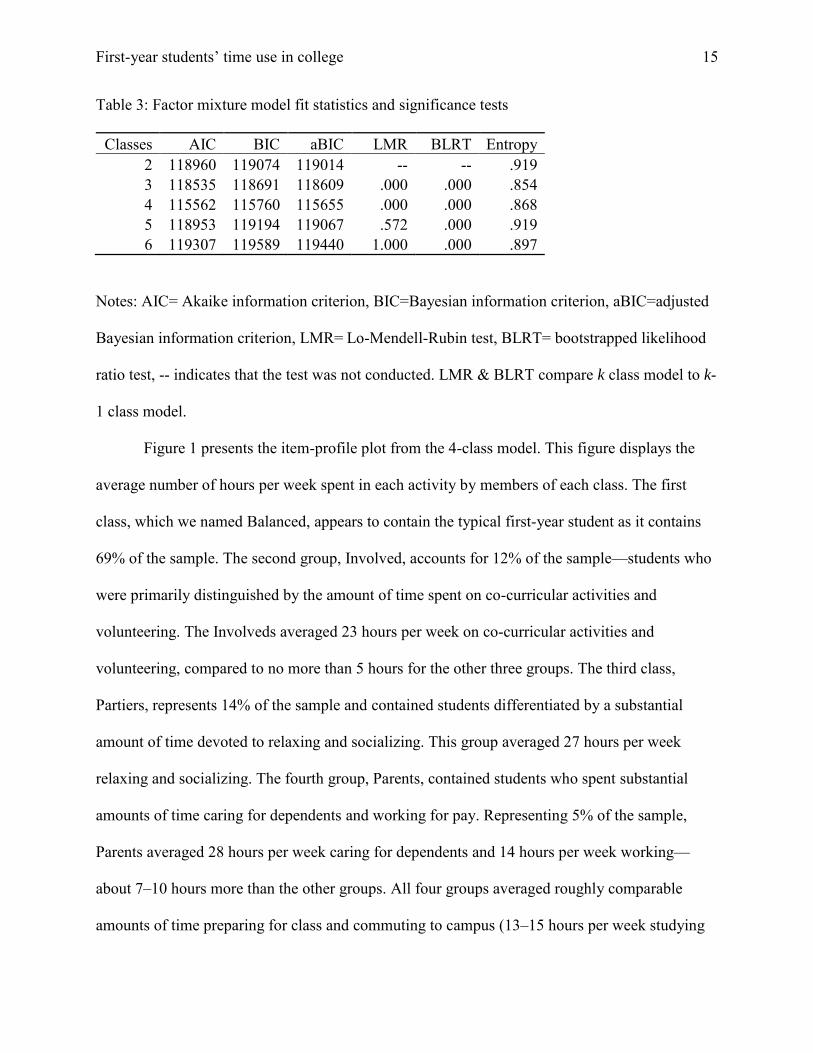
Next, we conducted the latent profile analysis. We began by fitting models that identified
between 2 and 6 latent classes. The information criteria summarized in Table 3 all indicated that
a 4-class model is most appropriate for the data; therefore, we did not estimate additional models
with more latent classes. Next, we calculated the LMR and BLRT significance tests for the
candidate models. The LMR test suggested that the 5 class model did not was not superior to the
4 class model. However, the BLRT did not point to a specific model. As all of our indicators,
except for the BLRT, point to the four class solution as being most appropriate fit for our data,
we concluded that the four-class solution was optimal.
First-year students’ time use in college 15
Table 3: Factor mixture model fit statistics and significance tests
Classes AIC BIC aBIC LMR BLRT Entropy 2 118960 119074 119014 -- -- .919 3 118535 118691 118609 .000 .000 .854 4 115562 115760 115655 .000 .000 .868 5 118953 119194 119067 .572 .000 .919 6 119307 119589 119440 1.000 .000 .897
Notes: AIC= Akaike information criterion, BIC=Bayesian information criterion, aBIC=adjusted
Bayesian information criterion, LMR= Lo-Mendell-Rubin test, BLRT= bootstrapped likelihood
ratio test, -- indicates that the test was not conducted. LMR & BLRT compare k class model to k-
1 class model.
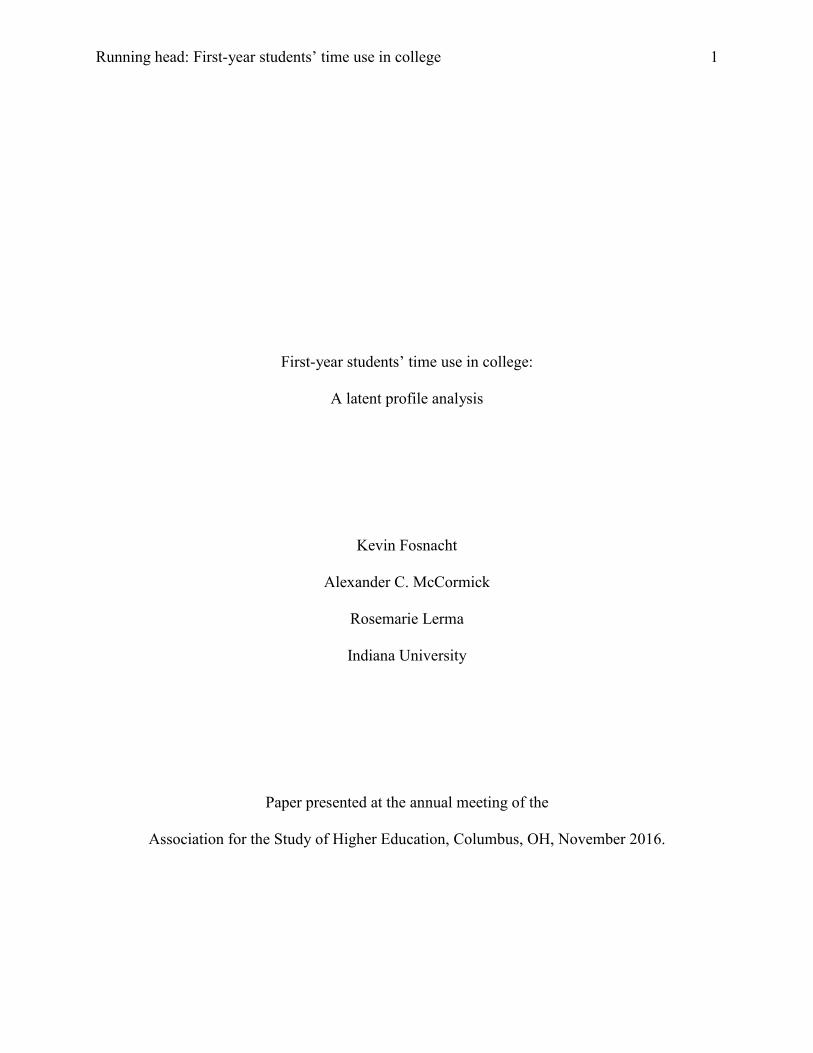
Figure 1 presents the item-profile plot from the 4-class model. This figure displays the
average number of hours per week spent in each activity by members of each class. The first
class, which we named Balanced, appears to contain the typical first-year student as it contains
69% of the sample. The second group, Involved, accounts for 12% of the sample—students who
were primarily distinguished by the amount of time spent on co-curricular activities and
volunteering. The Involveds averaged 23 hours per week on co-curricular activities and
volunteering, compared to no more than 5 hours for the other three groups. The third class,
Partiers, represents 14% of the sample and contained students differentiated by a substantial
amount of time devoted to relaxing and socializing. This group averaged 27 hours per week
relaxing and socializing. The fourth group, Parents, contained students who spent substantial
amounts of time caring for dependents and working for pay. Representing 5% of the sample,
Parents averaged 28 hours per week caring for dependents and 14 hours per week working—
about 7–10 hours more than the other groups. All four groups averaged roughly comparable
amounts of time preparing for class and commuting to campus (13–15 hours per week studying

First-year students’ time use in college 16
and 2–4 hours per week commuting). However, the four groups differed notably with respect to
the total number of hours per week accounted for by these six activities, with Balanced and
Partiers averaging the lowest time commitment (39 and 51 hours per week, respectively) and
Involved and Parents averaging the highest (62 and 73).
Figure 1: Item Profile Plot
0
5
10
15
20
25
30
Hou
rs p
er w
eek
Balanced Involved Partiers Parents
Share of sample: 69% 12% 14% 5%
First-year students’ time use in college 17
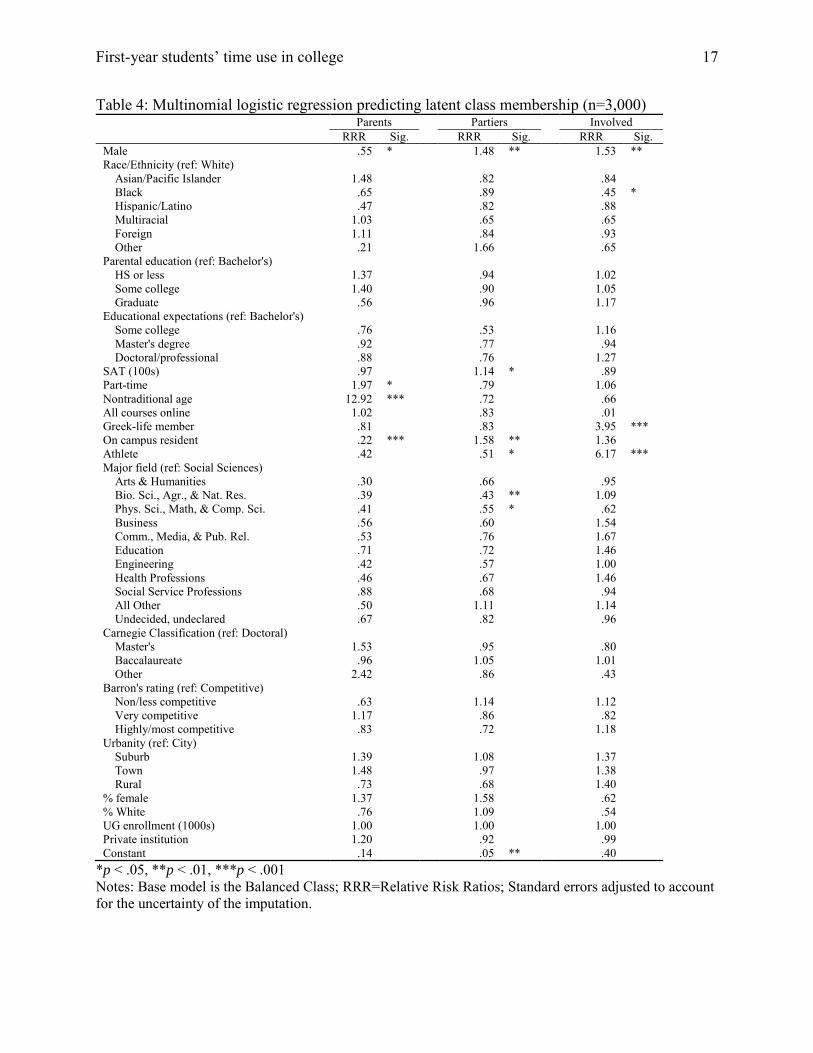
Table 4: Multinomial logistic regression predicting latent class membership (n=3,000) Parents Partiers Involved RRR Sig. RRR Sig. RRR Sig. Male .55 * 1.48 ** 1.53 ** Race/Ethnicity (ref: White)
Asian/Pacific Islander 1.48 .82 .84 Black .65 .89 .45 * Hispanic/Latino .47 .82 .88 Multiracial 1.03 .65 .65 Foreign 1.11 .84 .93 Other .21 1.66 .65
Parental education (ref: Bachelor's) HS or less 1.37 .94 1.02 Some college 1.40 .90 1.05 Graduate .56 .96 1.17
Educational expectations (ref: Bachelor's) Some college .76 .53 1.16 Master's degree .92 .77 .94 Doctoral/professional .88 .76 1.27
SAT (100s) .97 1.14 * .89 Part-time 1.97 * .79 1.06 Nontraditional age 12.92 *** .72 .66 All courses online 1.02 .83 .01 Greek-life member .81 .83 3.95 *** On campus resident .22 *** 1.58 ** 1.36 Athlete .42 .51 * 6.17 *** Major field (ref: Social Sciences)
Arts & Humanities .30 .66 .95 Bio. Sci., Agr., & Nat. Res. .39 .43 ** 1.09 Phys. Sci., Math, & Comp. Sci. .41 .55 * .62 Business .56 .60 1.54 Comm., Media, & Pub. Rel. .53 .76 1.67 Education .71 .72 1.46 Engineering .42 .57 1.00 Health Professions .46 .67 1.46 Social Service Professions .88 .68 .94 All Other .50 1.11 1.14 Undecided, undeclared .67 .82 .96
Carnegie Classification (ref: Doctoral) Master's 1.53 .95 .80 Baccalaureate .96 1.05 1.01 Other 2.42 .86 .43
Barron's rating (ref: Competitive) Non/less competitive .63 1.14 1.12 Very competitive 1.17 .86 .82 Highly/most competitive .83 .72 1.18
Urbanity (ref: City) Suburb 1.39 1.08 1.37 Town 1.48 .97 1.38 Rural .73 .68 1.40
% female 1.37 1.58 .62 % White .76 1.09 .54 UG enrollment (1000s) 1.00 1.00 1.00 Private institution 1.20 .92 .99 Constant .14 .05 ** .40
*p < .05, **p < .01, ***p < .001 Notes: Base model is the Balanced Class; RRR=Relative Risk Ratios; Standard errors adjusted to account for the uncertainty of the imputation.
First-year students’ time use in college 18
Next, we estimated a multinomial logistic regression that predicted students’ time use
class membership (Table 4). The results of this analysis are presented for membership in the
Parents, Partiers, and Involved groups compared to the Balanced group. The model results
indicate that with all controls entered, membership in these three groups relative to Balanced
group membership is not signficantly related to institutional characteristics. The following
discussion therefore focuses on the student characteristics related to group membership net of all
controls.
Parents. Part-time and nontraditional-aged students were more likely to be in the Parents
rather than the Balanced group, controlling for other factors (the age effect being quite large).
Male and campus-resident students were less likely to belong to the Parents group compared to
the Balanced group, net of other factors.
Partiers. After controlling for other factors, being male students and residing on campus
was positively related to membership in Partiers relative to the Balanced group. Standardized test
scores were also positively related to being a member of the Partier rather than the Balanced
group. However, student-athletes were less likely to be Partiers relative to the Balanced group.
Furthermore, majors in various physical and life science fields as well as mathematics and
computer science were less likely than social science majors to be Partiers rather than members
of the Balanced group, net of other factors.
Involved. Male students were more likely than female students to be members of the
Involved group relative to the Balanced group, after controlling for other factors. As would be
expected, being a student-athlete and Greek membership were strongly related to being in the
Involved rather than Balanced group, net of other characteristics. Black students were less likely
than White students to be in the Involved group relative to the Balanced group.
First-year students’ time use in college 19
Discussion and Implications
The popular and media narrative on the college student experience suggests that students
learn little and party to excess. We subjected this narrative to empirical scrutiny by examining
first-year students’ time-use patterns using a comprehensive multi-institutional sample. Using a
latent profile analysis, we identified four quite distinct time-use patterns that characterize first-
year students, focusing specifically on the allocation of time to six activities: class preparation,
co-curriculars and volunteering, working for pay, relaxing and socializing, caring for dependents,
and commuting to campus. The groups identified—Balanced, Partiers, Involved, and Parents,
indicate the various patterns of student time use during the first college year. The Balanced group
contains about two out of three students and thus appears to represent the normative first-year
college experience—one showing the lowest overall time commitment to the six activities (about
39 hours per week on average). The other three groups are characterized by distinctive forms of
specialization with regard to time use that also correspond to increasing total time commitments.
Partiers—about 14% of first-year students—averaged 27 hours per week relaxing and
socializing, about 2–3 times as much as the other groups. On average, Partiers devoted about 51
hours per week to the six activities. Accounting for about 12% of first-year students, Involved
students averaged 23 hours per week on co-curricular activities and volunteer work, about 4–6
times as many hours as the other groups, with a total of 62 hours per week on the six activities.
The remaining 5% of first-year students were in the Parents group, and demonstrated higher
levels of involvement to both working (14 hours per week on average, or 2–3 times more than
the other groups) and caring for dependents (28 hours per week), with a total of 73 hours per
week on average devoted to the six activities—nearly twice the time commitment of the
Balanced group.
First-year students’ time use in college 20
We found no evidence of a relationship between institutional characteristics and student
types, suggesting that the four types exist across a wide range of institutional contexts. Several
student characteristics were predictive of group membership. Sex, on-campus residence, and
student-athlete status were predictive of membership in at least two groups relative to Balanced,
while several other student characteristics were related to membership in one group relative to
Balanced. Neither parental education nor educational expectations were predictive of group
membership net of the other variables in the model.
Important next steps in this research will involve examining the relationship between
group membership and a number of educational processes and outcomes, including engagement
in other educationally purposeful activities, perceptions of the campus environment, college
grades, perceived gains, and satisfaction with the college experience.
While our results did identify a distinctive “Partier” time-use pattern, they nonetheless
refute the popular narrative that college students trade studying for partying. In addition to class
attendance, the normative first-year student devoted about 25 hours per week to a combination of
studying, working, participating in co-curricular activities, and volunteering, plus 10 hours per
week relaxing and socializing. With regard to the amount of time spent preparing for class, only
about two hours per week separated the lowest and highest groups (Partiers and Involved,
averaging 13 and 15 hours per week respectively). Indeed, Partiers spent nearly as much time
engaged in educationally beneficial activities as the Balanced students, and higher entrance
examination scores were associated with an increased likelihood of Partier membership. We
therefore conclude that there is little support for the “trading studying for partying” narrative.
However, the large differences in total time allocation across the four groups raise a
number of important questions. What are the consequences for student engagement and student
First-year students’ time use in college 21
learning for the different overall time commitments of the four groups? If relationships exist,
what can or should institutions do to influence students’ time allocation choices? Are there other
consequences of these differences, such as variation in the amount of time available for sleep?
The categories of time use asked about on the NSSE survey exclude a number of other activities,
such as class attendance, work in the home other than dependent care, personal care, and sleep.
Future research should strive for a more complete accounting of student time use so we can more
fully understand both the choices and consequences of how different students spend their time
and the consequences for learning and development.
First-year students’ time use in college 22
References
Armstrong, E. A. & Hamilton, L. T. (2013). Paying for the Party: How College
Maintains Inequality. Cambridge, MA: Harvard University Press.
Arum, R. & Roksa, J. (2011). Academically adrift: Limited learning on college
campuses. Chicago: University of Chicago Press.
Astin, A. W. (1984). Student involvement: A developmental theory for higher education.
Journal of College Student Personnel, 25, 297–308.
Astin, A. W. (1993). What matters in college?: Four critical years revisited. San
Francisco: Jossey-Bass.
Babcock, P. & Marks, M. (2011). The falling time cost of college: Evidence from half a
century of time use data. Review of Economics and Statistics, 93(2), 468-478.
Barron’s Educational Series (2012). Profiles of American colleges 2013 (30th ed.).
Hauppauge, NY: Author.
Brint, S. & Cantwell, A. M. (2010). Undergraduate time use and academic outcomes:
Results from the University of California Undergraduate Experience Survey 2006.
Teachers College Record, 112(9), 2441-2470.
Carnegie Foundation for the Advancement of Teaching (2011). The Carnegie
Classification of Institutions of Higher Education, 2010 edition. Stanford, CA:
Author.
Chickering, A. W. & Gamson, Z. F. (1987). Seven principles for good practice in
undergraduate education. AAHE Bulletin, 3–7.
First-year students’ time use in college 23
Clark, B. R. & Trow, M. (1966). The organizational context. In T. M. Newcomb & E. K.
Wilson (eds.), College peer groups: Problems and prospects for research (pp. 17-
70). Chicago: Aldine Publishing Co.
Clark, S. L., Muthén, B., Kaprio, J., D'Onofrio, B. M., Viken, R., & Rose, R. J. (2013).
Models and strategies for factor mixture analysis: An example concerning the
structure underlying psychological disorders. Structural equation modeling: A
multidisciplinary journal, 20(4), 681-703.
Cowley, W. H. & Waller, W. (1935). A study of student life. Journal of Higher
Education, 6, 132–142.
DesJardins, S. L., McCall, B. P., Ott, M., & Kim, J. (2010). A quasi-experimental
investigation of how the gates millennium scholars program is related to college
students’ time use and activities. Education Evaluation and Policy Analysis, 32,
456-475.
Ehrenberg, R. G. & Sherman, D. R. (1987). Employment while in college, academic
achievement, and postcollege outcomes: A summary of results. Journal of Human
Resources, 22, 1-23.
Goldrick-Rab, S. (2016). Paying the price: College costs, financial aid and the betrayal
of the American dream. Chicago: University of Chicago Press.
Harris, D. N. & Goldrick-Rab, S. (2012). Improving the productivity of education
experiments: Lessons from a randomized study of need-based financial aid.
Education Finance and Policy, 7(2), 143-169.
Hu, S., Katherine, L., & Kuh, G. D. (2011). Student typologies in higher education. New
Directions for Institutional Research, 2011(S1), 5-15.

First-year students’ time use in college 24
Hu, S. & McCormick, A. C. (2012). An engagement-based student typology and its
relationship to college outcomes. Research in Higher Education, 53(7), 738-754.
Kuh, G. D., Hu, S., & Vesper, N. (2000). “They shall be known by what they do”: An
activities based typology of college students. Journal of College Student
Development, 41(2), 228–244.
Kuh, G. D., Kinzie, J. I., Schuh, J. H., Whitt, E.J., & Associates. (2005). Student success
in college: Creating conditions that matter. San Francisco, CA: Jossey-Bass.
Kuh, G. D., Schuh, J. H., Whitt, E. J., & Associates. (1991). Involving colleges:
Successful approaches to fostering student learning and personal development
outside the classroom. San Francisco: Jossey-Bass.
Lahmers, A.G. & Zulauf, C. (2000). Factors associated with academic time use and
academic performance of college. Journal of College Student Development, 41, 5,
544-556.
Lazarsfeld, P. F. & Henry, N. W. (1968). Latent Structure Analysis. Boston: Houghton
Mifflin.
Magidson, J. & Vermunt, J. K. (2002). Latent class models for clustering: A comparison
with K-means. Canadian Journal of Marketing Research, 20, 37-44.
McCormick, A. C. (2011). It’s about time: What to make of reported declines in how
much college students study. Liberal Education 97(1), 30-39.
McCormick, A. C., Kinzie, J., & Gonyea, R. M. (2013). Student engagement: Bridging
research and practice to improve the quality of undergraduate education. In M. B.
Paulsen (Ed.), Higher education: Handbook of theory and research, vol. 28 (pp.
47-92). Dordrecht, The Netherlands: Springer.
First-year students’ time use in college 25
Morris, T. P., White, I. R., & Royston, P. (2014). Tuning multiple imputation by
predictive mean matching and local residual draws. BMC Medical Research
Methodology, 14(1).
Muthén, B. O. (2009, July 31). Diverging LMR and BLRT p-values [Msg 2]. Retrieved
from http://www.statmodel.com/discussion/messages/13/4529.html?1249068377
National Center for Educational Statistics. (n.d.) Integrated Postsecondary Education
Data System. Retrieved from http://nces.ed.gov/ipeds/.
National Survey of Student Engagement. (2016). Known-Groups Validity. Manuscript in
preparation.
Nylund, K. L., Asparouhov, T., & Muthén, B. O. (2007). Deciding on the number of
classes in latent class analysis and growth mixture modeling: A Monte Carlo
simulation study. Structural equation modeling, 14(4), 535-569.
Pace, C. R. (1980). Measuring the quality of student effort. Current Issues in Higher
Education, 2, 10–16.
Pell Institute. (2015). Time use of full-time college students ages 18 to 24- 2003 to 2014.
Postsecondary Education Opportunity, 276.
Quadlin, N. Y. & Rudel, D. (2015). Responsibility or Liability? Student Loan Debt and
Time Use in College. Social Forces, 94(2), 589-614.
Rau, W. & Durand, A. (2000). The academic ethic and college grades: Does hard work
help students to" make the grade"?. Sociology of education, 19-38.
Rubin, D. B. (1987). Multiple imputation for nonresponse in surveys. New York: Wiley.
Stinebrickner, R. & Stinebrickner, T. R. (2003). Working during school and academic
performance. Journal of Labor Economics, 21(2), 473-491.
First-year students’ time use in college 26
Stinebrickner, R. & Stinebrickner, T. R. (2004). Time-use and college outcomes. Journal
of Econometrics, 121(1), 243-269.
Terenzini, P. T. & Pascarella, E. T. (1977). An assessment of the construct validity of the
Clark Trow typology of college student subcultures. American Educational
Research Journal, 14, 225–248.
Wang, C.-P., Hendricks Brown, C., & Bandeen-Roche, K. (2005). Residual diagnostics
for growth mixture models: Examining the impact of a preventive intervention on
multiple trajectories of aggressive behavior. Journal of the American Statistical
Association, 100(471), 1054-1076.
Zhao, C., Gonyea, R. M., & Kuh, G. D. (2013, May). The psychographic typology:
Towards higher resolution research on college students. Paper presented at the
annual forum of the Association for Institutional Research, Tampa, FL,