Embed Size (px)
Citation preview
Running Head: COMPARATIVE ANALYSIS OF VEHICLE MILES TRAVELED
Comparative Analysis of Vehicle Miles Traveled:
Amazon Prime Now Versus Private Shopping Trips
Caitlin E. Smith
Senior Project for Bachelor of Science
Department of Applied Economics
Oregon State University
August 25, 2016
ENVIRONMENTAL ASSESSMENT OF SAME-DAY SHIPPING ii
Table of Contents
Abstract……………………………………………………………………………………...........1
Introduction……………………………………………………..................................................... 3
Literature Review ........................................................................................................................... 4
Project Statement ......................................................................................................................... 10
Approach ...................................................................................................................................... 10
Results .......................................................................................................................................... 12
Sensitivity Analysis ………………………………………………………………………….… 13
Discussion .................................................................................................................................... 15
Conclusion ................................................................................................................................... 20
References .................................................................................................................................... 22
Appendix I ................................................................................................................................... 25
Table 1 ……………………………………………………………………………...………….. 25
Table 2 ………………………………………………………………………………...……….. 26
Table 3 ………………………………………………………………………………..….…….. 28
Table 4 …………………………………………………………………………………...…….. 30
Table 5 ………………………………………………………………………………….…..….. 31
Table 6 ………………………………………………………………………………….…….... 33
Table 7 …………………………………………………………………………………………. 33
Table 8 …………………………………………………………………………………………. 33

1
COMPARATIVE ANALYSIS OF VEHICLE MILES TRAVELED
Abstract
According to the Environmental Protection Agency (2016), carbon dioxide emissions
from travel make up about 14 percent of global carbon emissions. Same-day shipping services
have gained popularity and support rapidly over the past five years, and is likely to impact the
amount of carbon dioxide emitted from shopping transportation. This paper estimates Vehicle
Miles Traveled (VMT) per order for Prime Now and compares them to VMT for personal
shopping trips in the Phoenix, Arizona metropolitan area. A model was created with 30 randomly
selected delivery points from within a 300 square mile delivery area in Phoenix’s city center. The
distances between all 30 delivery points and the Prime Now warehouse were measured and a
matrix was created. Excel Evolutionary Solver was used to find the shortest linear delivery route.
The most efficient route was compared to a model that summed the round trip distances of
private shopping trips to each delivery point’s nearest Walmart Supercenter. Ten more models
were derived from the original matrix and a sensitivity analysis was conducted to determine the
customer density necessary for a delivery route to result in an average reduction of VMT per
order. After examining 11 delivery routes, the results revealed that a customer density of 0.05
customers per square mile increased the average VMT by 0.48 miles compared to shopping trips
to brick and mortar locations. A density of 0.1 customers per square mile results in an average
VMT reduction of 0.58 miles per order. An examination of the averages of all 11 models
suggests that the threshold that equilibrates VMT for Prime Now and private shopping trips is a
density of 0.073 customers per square mile. Same-day shipping services like Prime Now on
average produce fewer or comparable VMT compared to private shopping trips, and subsidizing
these services for low-income families can help eliminate food deserts and reduce the number of
undernourished Americans.

ENVIRONMENTAL ASSESSMENT OF SAME-DAY SHIPPING 2
I wanted to study the effects of online shopping and its impact on the environment
because I am an avid online shopper and have been known to purchase the majority of my
household items from Amazon as a Prime member. I was interested if my personal shopping
habits were in alignment with my desire to be an environmentally conscious consumer. In many
cases, a service that is highly sought after and convenient typically has an adverse effect on the
environment, and I wanted to see if that philosophy held true in this case. I learned that in the
case of Prime Now versus individual shopping trips, I can reduce my carbon footprint and
minimize my VMT by having Amazon bring my products to me rather than getting them myself.
With that knowledge in mind, I intend to substitute more of my private shopping trips for
Amazon Prime Now, when possible, and I will enjoy the convenience of same-day delivery guilt
free. I also like the idea of supporting a business that may one-day help feed low-income families
healthy food that they may not otherwise have had access to. In the past I have lived in food
deserts and survived off of food stamps during several transitional periods in my childhood and
adulthood. I understand the difficulties these families face firsthand and how beneficial access to
a grocery delivery service like Prime Now would have been.

ENVIRONMENTAL ASSESSMENT OF SAME-DAY SHIPPING 3
Introduction
The American people have less free time and work more hours now than any time period
since statistical data has been recorded (Schabner, 2006). They are taking fewer vacations,
retiring later, and working longer hours than any other industrialized nation (Schabner, 2006).
This deficit of leisure time has created a demand for services that offer convenience for a bargain.
Eliminating mundane trips to the store is not the only reason Americans may be excited about the
expansion of online shopping. In the past, it was common to receive your order in three to five
business days unless you paid for overnight shipping. That is no longer the case. Same-day
delivery is now a reality with a variety of products being delivered within hours by companies
like Amazon, Google, and Walmart. Same-day delivery is not a new concept; pizza franchises
and grocery stores have been offering this service for years, decades in some cases (Sheffi, 2014).
However, same-day delivery did not offer over 25,000 items across 25 categories until now
(Amazon Prime Now, n.d.). The ability to order almost anything online and receive it within
hours may do more for American families besides eliminating nuisance shopping trips and
subsequently creating more leisure time. Services like Amazon Prime Now can consolidate many
short private shopping trips into one longer delivery route which has the potential to reduce
carbon emissions and decrease the impact consumerism has on the environment. It may also help
disadvantaged families gain access to healthy food and eliminate food deserts.
Lack of transportation and residing beyond reasonable walking distance to the
supermarket creates the problem commonly referred to as a food desert. It is estimated that 11.5
million low-income Americans live more than one mile from a grocery store and 2.3 million of
which do not have access to a vehicle to use for grocery shopping (Premack, 2016). Maricopa
County, Arizona is home to 55 food deserts, and the residents who live there make up more than

ENVIRONMENTAL ASSESSMENT OF SAME-DAY SHIPPING 4
half of the state’s population (Askar, 2014). At least 700,000 residents have to make a 100-mile
trip to procure fresh produce because they have no other way to feed their families fresh healthy
foods (Askar, 2014). Individual round trips like these to the store emit a lot of carbon dioxide
which is detrimental to the environment and contributes to climate change. Residents in food
deserts often must decide between buying foods that effectively nourish their family or have a
long shelf life. One prime example of how a food desert can affect a community can be seen in
Ajo, located in Pima County, Arizona. Ajo is home to just under 4,000 people, has one local
grocery store, and is roughly 100 miles away from any the next closest supermarket. Ajo
produces very little of its own produce so it must be imported. “‘But what happens when the
prices of gas and trucking goes up?’ said Gayle Weyers, a community gardener. ‘Ajo might just
pass away, it might die’” (Askar, 2014).
The research in this paper evaluates if utilizing Amazon Prime Now same-day delivery in
the Phoenix metropolitan area reduces the average VMT per order on average compared to
private shopping trips to brick and mortar stores. Prime Now and Walmart Superstores sell the
same categories of products for comparable prices, therefore shopping trips to the nearest
Walmart Superstore will be used as a base for comparison between same-day delivery and
individual shopping trips. The focus of this study is limited to the last mile, which is defined as
the final leg in the transportation of goods from a warehouse or retail location to a consumer’s
home. Ideally, the results of this study will help spread awareness of the environmental impact
same-day shipping has on the environment and the benefits it can offer to disadvantaged
American families.
Literature Review
ENVIRONMENTAL ASSESSMENT OF SAME-DAY SHIPPING 5
Amazon Prime Now launched in December 2014, which means there is very little
research about the environmental impact of same-day delivery services that deliver a variety of
products (Meola, 2016). Amazon Prime has an estimated 40 million members in the United
States, and at least 10 million of those have used Prime now at least once (Meola, 2016). Seventy
percent of Prime Now users place an order more than once a month, and almost a quarter use it at
least once a week (Meola, 2016). The top purchase categories on Prime Now are: media,
electronics, household products, apparel, personal care, toys, and groceries (Neiger, 2016).
About thirty-six percent of Prime Now goods are purchased from local grocery stores and resold
to Prime Now users. Online Grocery services are increasingly becoming a normal channel, $33
billion is expected to be spent on food online this year which is roughly four percent of total
money spent on food and beverages (Premack, 2016). Prime Now offers free two-hour delivery
for orders over $20 to customers with a Prime membership which costs $99 annually or $10.99
per month (Amazon Prime Now, n.d.). Grocery shopping accounts for 40 percent of shopping
travel and five percent of personal travel overall in the UK and 50 percent of households have a
major food shop at least once a week (Cairns, 2005). Even 30 percent of non-car-owning
households procure a car for their weekly grocery shops which means a lot of miles are driven
exclusively to buy groceries (Cairns, 2005). This is why carbon emissions and VMT for services
that deliver groceries and other household items are of particular interest to environmental
researchers. There will always be a demand for groceries and household products, and the
logistics involved in their procurement offers many opportunities for reducing greenhouse gas
emissions.
Carbon dioxide (CO2) emissions are the primary reason environmentalists are concerned
about the rapid growth experienced by same-day shipping services. CO2 is most easily estimated

ENVIRONMENTAL ASSESSMENT OF SAME-DAY SHIPPING 6
by VMT because of their strong correlation. For every mile driven in a gas powered passenger
vehicle built after 2011, an average of 0.89 lbs. of carbon dioxide is emitted into the atmosphere.
This was calculated using the average fuel economy for passenger vehicles in 2011 which was
22.4 miles per gallon (Plumer, 2013). Each 6.3 lb. gallon of gas that is burned can produce 20 lbs.
of carbon dioxide according to the U.S. Department of Energy (n.d.). When gasoline burns, the
carbon and hydrogen atoms separate, the hydrogen atom combines with oxygen to form water,
and carbon and oxygen combine to form CO2 (U.S Department of Energy, n.d.). Carbon’s
atomic weigh is 12, and oxygen’s atomic weight is 16, giving each molecule of carbon
dioxide an atomic weight of 44 (U.S Department of Energy, n.d.). To calculate the amount of
CO2 produced from a gallon of gasoline, the weight of the carbon in the gasoline is multiplied by
44/12 or 3.7 (U.S Department of Energy, n.d.). Gasoline is about 87 percent carbon and 13
percent hydrogen by weight which means the carbon portion of a gallon of gasoline weighs 5.5
lbs. (6.3 lbs. x .87) (Department of Energy, n.d.). Multiply 5.5 lbs. of carbon by 3.7, which
equals 20 lbs. of CO2 per gallon. Then divide 20 lbs. of CO2 by 22.4 miles per gallon making
the grand total 0.89 lbs. of CO2 emitted per mile driven in an average passenger vehicle built
after 2011. VMT is easier to visualize than CO2 emissions which is why it often the metric
observed in research, and as you can see, reductions in VMT will result in a reduction in CO2
emissions.
Some of the main areas of interest for this research are the effects of customer demand
and density, public transportation, and time window length on VMT. Sally Cairns focused her
research on the impact of customer demand on VMT for home delivery. She examined the
effects of customer demand by creating several hundred simulations using GIS TransCAD and
its algorithms to estimate the shortest routes for both private shoppers and delivery drivers. The

ENVIRONMENTAL ASSESSMENT OF SAME-DAY SHIPPING 7
traffic network was modeled after a simplified version of the city Witney, UK. This city was
chosen because it only had one supermarket and available data about customer shopping habits
(Cairns, 2005). The models Cairns evaluated varied delivery vehicle capacity, quantities of
delivery vehicles, number of customers, patterns of demand, and the nature of the road network.
It was discovered that if delivery vehicles are direct substitutes for personal car trips it is likely
that there will be a 60-80 percent decrease in VMT per order with the use of grocery delivery on
average (Cairns, 2005). The more the service is utilized the greater the mileage savings will be.
Anne Goodchild and Erica Wygonik (2014) studied if there was a difference in CO2
emissions when grocery delivery services were utilized in urban and rural areas within King
County, Washington. Seattle, Sammamish, and Black Diamond were selected because of their
high, medium, and low address densities per square mile. They compared three scenarios within
each city, passenger vehicles for personal grocery shopping trips, local depot delivery from
selected storefronts using small delivery trucks, and regional warehouse delivery using big box
trucks. All distances were calculated using routing tools within ArcGIS. Their research
concluded that there are more CO2 savings when delivery services are used in rural communities
resembling Black Diamond, but there were still some CO2 savings in less densely populated
urban communities resembling Sammamish (Goodchild and Wygonik, 2014). All three scenarios
evaluated offered reductions in VMT but not necessarily in pollutants. NOx and PM10 are
lowest in all regions when passenger vehicles are used, but the lowest generation of CO2 varied
in the three municipalities (Goodchild & Wygonik, 2014). In Seattle, personal travel produced
the smallest CO2 emissions but the highest VMT of the three delivery options (Goodchild &
Wygonik, 2014). In Black Diamond, regional truck delivery produced the fewest CO2 emissions,
but local depot truck delivery produced the lowest VMT by 0.1 miles per order (Goodchild &

ENVIRONMENTAL ASSESSMENT OF SAME-DAY SHIPPING 8
Wygonik, 2014). In Sammamish, local depot truck delivery produced the fewest CO2 emissions
and the lowest VMT of the three delivery options (Goodchild & Wygonik, 2014). VMT
reductions through home delivery were greatest in rural areas at between 70 and 85 percent, and
VMT reductions were smallest in the city at about 20 percent (Goodchild & Wygonik, 2014).
Wygonik and Goodchild (2012) studied the significance of larger service areas on CO2
emissions. They discovered that larger service areas are limited in practicality by delivery
window length, but home deliveries in larger service areas, or areas with low customer density,
produce fewer CO2 emissions compared to private shopping trips (Wygonik & Goodchild, 2012).
The larger the delivery area, the larger the VMT savings are when using delivery trucks filled to
capacity (Wygonik & Goodchild, 2012).
Anne Wiese, Waldemar Toporowski, and Stephen Zielke (2012) designed a model that
focused on comparing CO2 emissions between two channels of the same clothing store, online
and brick and mortar store locations. To examine whether the results were different in alternate
urban settings two stores were selected for analysis: one in a city center and one located in the
warehousing district of another city (Wiese, Toporowski, & Zielke, 2012). Online shopping
created ten times fewer CO2 emissions than private shopping trips on average per article of
clothing, and six times fewer per transaction for the store in the heart of the city (Wiese et al.,
2012). The results for the second store showed similar results, however it was discovered that
when travel distances are smaller, private shopping trips are more environmentally friendly than
home delivery (Wiese et al., 2012). This advantage for conventional shopping trips increases in
radius when customer returns and increased public transportation utilization are factored in to the
models (Wiese et al., 2012).
ENVIRONMENTAL ASSESSMENT OF SAME-DAY SHIPPING 9
Julia Edwards, Alan McKinnon, and Sharon Cullinane (2010) also studied the effects of
public transportation on CO2 emissions using models pieced together using average distances
between locations rather than actual mapped routes. Personal shopping trips were assumed to
have an average roundtrip of 12.8 miles, and roundtrips using public transportation were
assumed to be an average of 8.8 miles (Edwards, McKinnon, & Cullinane, 2010). Edwards et al.
(2010) discovered that utilizing public transportation for shopping in person may produce the
same, or fewer CO2 emissions in urban settings. For example, a bus containing 30 passengers
would only need each passenger to purchase five items to generate less than half the CO2 emitted
from home delivery (Edwards et al., 2010). The findings of this research shows that on average,
when a shopper buys fewer than 24 items per shopping trip, or fewer than seven items when
utilizing public transportation, it is likely that home delivery will emit less CO2 per item
(Edwards et al., 2010).
The research conducted by Hanne Silkavirta, Mikko Punakivi, Mikko Karkkainen, and
Lassi Linnanen (2002) examined the effect delivery windows have on Vehicle Kilometers
Traveled (VKT) per order for grocery home delivery. The average VKT per order was shortest at
0.6 km per order when time constraints were nonexistent and orders were split up evenly
throughout the week, followed by 0.9 km for same-day delivery with open availability, 1.6 km
for same-day delivery with two-hour delivery windows, 3.2 km for same-day delivery with one-
hour delivery windows, and finally 6.9 km for private shopping trips to brick and mortar
locations (Siikavirta, Punakivi, Kärkkäinen, & Linnanen, 2002). All methods of home delivery
cut VKT in half or better than private shopping trips, but longer delivery windows produced the
most savings. Wygonik and Goodchild (2012) also examined how time windows, affected CO2
emissions in urban delivery systems. Routes that were randomly selected to mimic customers

ENVIRONMENTAL ASSESSMENT OF SAME-DAY SHIPPING 10
selecting their own delivery times showed significant reductions in VMT, between 17 and 75
percent (Wygonik & Goodchild, 2012). Routes that were grouped by proximity to one another
and mimicked provider selected delivery windows showed the greatest VMT reductions at 80-90
percent compared to customer selected delivery windows (Wygonik & Goodchild, 2012). When
providers select customer delivery windows, rather than the customers, there is the greatest
potential for VMT reductions.
Project Statement
The research in this paper evaluates if utilizing Amazon Prime Now same-day delivery
service in the Phoenix metropolitan area reduces the average vehicle miles traveled per order
compared to private shopping trips. To analyze whether Prime Now will reduce the average
vehicle miles traveled per order, first, I need to assess how Prime Now delivers packages. Then I
will model a delivery route within the Prime Now delivery area that closely resembles the Prime
Now delivery system. Finally, I must model individual customer shopping routes. Once these
steps are complete I can compare the average VMT for home deliveries versus individual
shopping trips and conduct a sensitivity analysis.
Approach
According to Amazon Prime Now's information sessions, Prime Now currently employs
independent contractors that utilize private passenger vehicles which are mid-size sedans or
larger (J.O., personal communication, April 20, 2016). Prime Now delivers to customers who
live within a 40-mile radius of the distribution warehouse. For the purposes of this study, I
limited the delivery area to heart of Phoenix which is encircled by the AZ-101 loop on the north,
east, and west sides, and Interstate 10 and the AZ-202 loop E on the south side. Drivers deliver
packages to customers in blocks that are four or eight hours long, but actual delivery times may
ENVIRONMENTAL ASSESSMENT OF SAME-DAY SHIPPING 11
vary (J.O., personal communication, April 20, 2016). Each delivery block consists of multiple
two-hour delivery windows, and during a four hour block the courier needs to deliver anywhere
from 40-70 packages to an average of 30 homes (J.O., personal communication, April 20, 2016).
The model analyzed in this paper examines one route that originates at Phoenix's Prime Now
warehouse located near the Phoenix Sky Harbor International Airport and stops at 30 randomly
selected delivery points which are listed in Table 1 in the appendix. The delivery route examined
in this paper is not circular because drivers are not required to return to the warehouse after the
completion of their delivery route unless a package was undeliverable (J.O., personal
communication, April 20, 2016).
A list of 520 available and recently sold homes was obtained from Zilliow.com. Each
house was assigned a number, and a random number generator was used to select a number
between 1 and 520 to create a sample size of 30 homes from those listings. The distances
between each selected address was optimized by selecting the fastest route between two points
on Google Maps. Traffic conditions were assumed to be normal. Once all possible routes
between each of the 30 delivery points and their distance from the warehouse was measured,
Excel Evolutionary Solver was used to determine which route resulted in the shortest number of
miles driven. The total miles driven for the delivery route was divided by the number of delivery
points to determine the average number of vehicle miles traveled per order. To model the
corresponding individual shopping trips, the addresses of the selected delivery points were input
into the Store Finder on Walmart.com to locate the closest Walmart Superstore. Once the
distances from the residences to the nearest stores were measured, the distances were doubled to
mimic a roundtrip scenario. The values of each individual trip was summed to determine the total

ENVIRONMENTAL ASSESSMENT OF SAME-DAY SHIPPING 12
vehicle miles traveled to brick and mortar locations, then the sum was divided by the number of
addresses to determine the average VMT per shopping trip.
There were a number of assumptions made in the development of my model. The first
assumption is that all trips in this study did not utilize trip chaining which means that traveling to
the store was the primary reason for each trip, and no other stops were made on the journey. Next
it was assumed that all private shopping trips to the store were made by private passenger
vehicles. Public transportation, walking, biking, and all other modes of transportation are omitted
from this study. All customers were assumed to live in a single-family home, apartments and
condos were omitted from this study. Walmart Neighborhood Markets were excluded from this
study as well due to dissimilarities in the stock offered by Prime Now. Prime Now delivery
vehicles are assumed to be comparable in make, model, and age to those utilized in the private
shopping trips and are assumed to be able to carry packages for up to 30 delivery points. The
delivery route was assumed to take no longer than four hours to complete from start to finish
with 30 stops along the way. This ensures that the route can be completed within a four-hour
delivery block.
Results
Initial examination of the 30 delivery points revealed that the total distance driven during
the modeled private shopping trips was 141.6 miles compared to 113.7 miles driven by the Prime
Now delivery driver. The average VMT per personal shopping trip was 4.72 miles versus 3.79
miles for home delivery which is an average savings of approximately one mile per order. As
expected, VMT is greater when everyone makes an individual trip to the store rather than having
one person deliver items to many people. There is a difference of 27.9 miles between the two
shopping methods which is equivalent to approximately one and a quarter gallons of gas using
ENVIRONMENTAL ASSESSMENT OF SAME-DAY SHIPPING 13
the average fuel economy for cars and light trucks sold in the United States in 2011 (Plummer,
2013). Over the course of one shopping trip this may seem insignificant, but if you consider that
four percent of food shopping is completed online, and that there are just over half million
occupied homes in Phoenix, Prime Now users can save about 900 gallons of gas per week if they
opt to use Prime Now rather than shop themselves (suburbanstats.org, n.d.).
Sensitivity Analysis
To more accurately represent how a variety of different scenarios, routes, and customer
densities affect the average VMT per order, 10 more models were created to further analyze the
data. See Tables 6-8 in the appendix for detailed results pertaining to these models. All 10
models for the sensitivity analysis include 15 delivery points, and all of the model’s delivery
points were selected from the initial 30 delivery points
The first sensitivity analysis evaluates models 1-6 and tests how often VMT reductions
occur when the customer density is low. The customer density in these models is 0.05 customers
per square mile. The density was calculated by dividing the number of delivery points by the
number of square miles in the delivery area. The 15 delivery points in each of the models 1-6
were randomly selected from the 300 square mile delivery area. The evaluation of these models
revealed that only model 4 offered a reduction in VMT for Prime Now delivery, it saved nearly a
half a mile per order relative to private shopping trips. The other five models increased VMT
relative to private shopping trips anywhere from 0.45 miles to 1.03 miles per order. At a
customer density of 0.05 customers per square mile, on average Prime Now increased VMT in
models 1-6 by 0.48 miles per order.
For the second sensitivity analysis, models 7-10 evaluated whether doubling the customer
density to 0.1 customers per square mile impacted the average VMT per order. This was

ENVIRONMENTAL ASSESSMENT OF SAME-DAY SHIPPING 14
achieved by restricting the dispersal of delivery points and confining them to approximately 150
square miles rather than allowing them to span the 300 square mile delivery area that was
analyzed. The delivery points in models 7-10 were assigned geographically by dividing the 30
points into roughly northern and southern halves, and then eastern and western halves.
Predictably, models 8 and 9, which examined points in the eastern and southern halves of the
examined delivery area, reduced VMT by approximately 0.31 and 1.7 miles per order
respectively. The delivery points in both of these models were located closer to the warehouse
which resides less than two miles southeast of the examined delivery area. Model 7 examined
points in the northern half of the city also yielded VMT savings of 0.59 miles per order.
However, Model 10 examined points primarily located on the western half of the city and
increased VMT by 0.64. Even though Model 10 had the same customer density as models 7-9,
all of the customers lived relatively far from the Prime Now warehouse preventing home
delivery from reducing VMT in this scenario. Model 10 highlights that warehouse location may
have some impact on VMT, although to what degree is unclear. Overall, using Prime Now rather
than making individual shopping trips to brick and mortar locations resulted in an average
decrease of 0.49 miles per order across models 7-10. An average of all models with a customer
density of 0.1, including my initial model, resulted in an average decrease of .58 miles per order.
Discussion
There has been extensive research covering same-day grocery delivery and slower
delivery methods, but there is no research that evaluates a same-day delivery service that delivers
a variety of goods. This is significant because Amazon Prime Now is a hybrid service that
delivers both groceries and various other items to customers. The variety makes it easier to fill
delivery vehicles to capacity and increase the number of delivery points. For example, an
ENVIRONMENTAL ASSESSMENT OF SAME-DAY SHIPPING 15
average passenger vehicle is estimated to be able to hold at most four weekly grocery shop
orders, this scenario may result in VMT savings provided the delivery points are close in
proximity. Instead, dividing the four grocery orders amongst four vehicles and filling the
remaining capacity of each vehicle with orders containing only a few items each will extend the
delivery route and increase the number of delivery points thereby reducing the average VMT per
order. Increasing the number of stops on a route within a confined delivery area increases the
customer density which explains why an increase in delivery points per route will decrease
average VMT per order. The most prominent gap in research my paper fills concerns delivery
services that use passenger vehicles for delivery rather than delivery trucks or vans. None of the
other models examine scenarios where passenger vehicles are used as delivery vehicles. This
difference is crucial because the direct substitution of vehicles used for private shopping trips
and vehicles used for home delivery maximizes carbon dioxide emission reduction. All VMT
reductions translate directly into CO2 reductions whereas less fuel efficient delivery vehicles
lose a percentage of the savings to inefficient fuel economy.
I hypothesized that utilizing the Amazon Prime Now same-day delivery service in the
Phoenix metropolitan area would reduce the average VMT per order compared to private
shopping trips because Prime Now uses passenger vehicles rather than delivery trucks or vans.
Based on the results of my initial model, I fail to reject my hypothesis. The sensitivity analysis
finds that an increase in customer density reduces VMT per order for Prime Now delivery
relative to private shopping trips and produces carbon emission reductions as long as increasing
the number of delivery points in each delivery route does not exceed the capacity of passenger
car or light truck. Exceeding the capacity of private passenger delivery vehicles will force Prime
drivers to utilize delivery trucks or vans, the use of which is outside of the scope of this study.

ENVIRONMENTAL ASSESSMENT OF SAME-DAY SHIPPING 16
This sensitivity analysis suggests that increasing population and customer density in the Phoenix
metropolitan area, which is a reasonable assumption given recent growth rates, would result in
higher reductions in VMT per order for Prime Now delivery than for private shopping trips.
My results are consistent with the research conducted by Cairns, Silkivirta et al., and
Edwards et al., but inconsistent with all the work of Wygonik and Goodchild, and Weise et al.
The three studies my work agrees with all have one thing in common: the home delivery vehicles
examined in the models are diesel delivery vans. Delivery vans emit less carbon dioxide than
large delivery trucks which may explain why my results agree with Cairns, Silkivirta et al., and
Edwards et al., but disagree with the body of work conducted by Wygonik and Goodchild. (The
research conducted by Weise et al. fails to specify which delivery vehicles are utilized.) The
entirety of the customer density research conducted by Wygonik and Goodchild exclusively
evaluates models where home delivery vehicles are single unit and combination short haul diesel
delivery trucks. Shifting the use of large delivery trucks to smaller delivery vehicles where
customer density is relatively high, and utilizing larger delivery vehicles in areas where customer
density is relatively low may be what makes the difference between whether private shopping
trips or home delivery produces the lowest VMT and carbon emissions per order, but more
research is needed to support this statement. However, if this statement is true, it may provide an
opportunity for the federal government to reduce carbon emissions without penalizing
disadvantaged Americans.
There has been an ongoing debate in the United States about whether or not a carbon tax
would be an economically wise choice for reducing carbon emissions, but the country is at a
standstill, and no one can agree on when or if we should institute these taxes. Communities like
Ajo would suffer a great deal if a carbon tax was implemented because the best ways to offset
ENVIRONMENTAL ASSESSMENT OF SAME-DAY SHIPPING 17
price increases from a carbon tax are to either reduce fuel consumption by driving less, or buying
locally grown produce (Askar, 2014). Neither of those options are viable for low-income
families in a food desert. Food deserts exist by definition because there is no locally grown
produce to purchase, or any at all. This absence of fresh produce may be due to a lack of
education on effective agricultural techniques, a lack of fertile land to grow food, or a lack of
free time to invest in growing food for the community. Implementing a carbon tax could
irreparably damage low-income communities like Ajo and cause them to wilt away while upper
and middle class communities brush off price increases with relative ease. The results of this
study may help encourage congress to reconsider the importance of equity in the availability of
services and products purchased online.
American families who do not rely on the Supplemental Nutrition Assistance Program
(SNAP) and live in a food desert can effortlessly order groceries online through services
comparable to Prime Now. However, the 14 percent of Americans who do rely on SNAP, like
some in Ajo, cannot utilize these services because food stamps or Electronic Benefit Transfers
(EBT) are often not an accepted method of payment (Premack, 2016). This Fall, the USDA is
recruiting online retailers to begin testing out a pilot program that may eventually lead to
acceptance of SNAP online thereby removing one obstacle for low-income families (Premack,
2016). There is still a lot more work that needs to be done to make online grocery shopping a
viable solution to the food desert problem. According to Rachel Premack (2016), there are a
number of federal regulations and policies that have thus far prevented most online retailers from
obtaining approval to accept SNAP. One of which is the inane way that SNAP transactions are
processed using an encrypted pin designed to help prevent fraudulent EBT transactions (Premack,
2016). This convoluted system is not compatible with online credit card forms most retailers use

ENVIRONMENTAL ASSESSMENT OF SAME-DAY SHIPPING 18
to process payments, and must be redesigned in order for widespread EBT acceptance to be
feasible (Premack, 2016). To circumvent this issue, some Safeway locations have begun to
accept EBT for disabled customers (Premack, 2016). Fresh Direct is also accepting SNAP in a
few areas by having delivery drivers carry card readers with them and accepting payment upon
delivery (Premack, 2016). These creative solutions are the first step of many that need to be
taken to create equity in the availability of services and products purchased online.
Expanding access to online grocery delivery services to all levels of income will help
bring healthy food and household items to all different types of disadvantaged American families.
Low-income disabled Americans can choose to have their food delivered rather than navigate the
long convoluted maze of grocery aisles. Poor non-English speaking families won’t have to
struggle with language barriers at checkout. And poverty-stricken carless families will no longer
be forced to shop exclusively at stores that are within walking distance of their homes. Giving
SNAP dependent families who do not have access to a car the ability to order groceries online
enables them to compare prices and take advantage of sales rather than limiting them to the
stores they can walk to. It is the government’s job to provide opportunities to struggling families
to put themselves in a better position, and it is the government’s responsibility to make sure that
consumerism harms the environment as little as possible.
Under certain circumstances it appears that ecommerce is better for the environment than
traditional shopping methods because it reduces VMT per order, but there are no policies in
place that encourage buyers to utilize home delivery services. I believe that the best way to
encourage consumers, especially low-income Americans, to use these services is to eliminate
sales tax on all items purchased online. Consumers who are on a tight budget will turn to online
shopping if it means everything is tax-free, and with the convenience of same-day shipping many
ENVIRONMENTAL ASSESSMENT OF SAME-DAY SHIPPING 19
middle class shoppers are likely to follow suit. Groceries are already tax-free in many states, to
encourage food stamp recipients to use grocery delivery services the federal government should
subsidize providers that accept SNAP so they can offer free delivery and eliminate minimum
purchase requirements on EBT orders. Reducing or eliminating these extras costs will help low-
income Americans feed their families more and feed them well.
Widespread availability of same-day shipping may make online shopping the norm rather
than the exception sooner rather than later, and removing obstacles preventing low-income
families from enjoying this service will not only improve their health, but also the heath of the
environment. Prime Now offers reductions in VMT, especially for densely populated
communities, and can eliminate inner city food deserts with the help of better technology,
government subsidies, and tax exemptions. Food deserts in rural communities will benefit from
these policies as well, and VMT reductions can be maximized if Prime Now or other grocery
delivery services adopt the delivery strategies modeled by Wygonik and Goodchild.
Conclusion
Consumers are spending valuable leisure time running errands and emitting excessive
carbon dioxide when instead they could be enjoying the convenience of same-day delivery.
Utilizing a service like Prime Now has the potential to reduce carbon emissions by decreasing
the vehicle miles traveled per order. This paper analyzed whether utilizing the Amazon Prime
Now same-day delivery service in the Phoenix metropolitan area reduces the average vehicle
miles traveled per order compared to private shopping trips. This was evaluated by measuring
the distances between 30 randomly selected delivery points using Google Maps and creating 11
models that tested the impact customer density had on the average VMT per order. I found that
Amazon Prime Now same-day delivery service in the Phoenix metropolitan area would reduce
ENVIRONMENTAL ASSESSMENT OF SAME-DAY SHIPPING 20
the average VMT per order compared to private shopping trips. The sensitivity analysis suggests
that increasing population and customer density in the Phoenix metropolitan area, which is a
reasonable assumption given recent growth rates, would result in higher reductions in VMT per
order for Prime Now delivery than for private shopping trips. Increasing the availability of same-
day shipping by adding EBT as a method of payment can help reduce carbon emissions by
reducing VMT and decrease the impact food deserts have on low-income American families. In
addition, accepting SNAP for online grocery delivery can help mitigate the burden a carbon tax
would place on families who live in extremely isolated food deserts like the residents of Ajo,
Arizona.
The research in this paper was limited by the region that was studied and the small
number of models that were evaluated. In order to gain a more accurate and representative idea
of how Prime Now can reduce carbon emissions through an increase in VMT it is important to
study a variety of locations such as rural or suburban communities. It would also be prudent to
study a larger sample of delivery routes and to better estimate the threshold customer density
needed to equalize VMT per order for Amazon Prime Now and private shopping trips. In
addition, further exploration of the relationship between customer density and delivery vehicle
choice is necessary to discern whether carbon emissions can be further reduced by selecting the
appropriate vehicle for the appropriate customer density. Finally, it would be helpful to evaluate
the entire supply chain to see if there are any notable differences that may affect total VMT and
carbon emissions from same-day delivery compared to brick and mortar shopping as this
analysis is restricted to the last mile.

ENVIRONMENTAL ASSESSMENT OF SAME-DAY SHIPPING 21
References
Amazon Prime Now. (n.d.). Retrieved July 17, 2016, from
https://primenow.amazon.com/onboard?sourceUrl=%2F
Askar, Y. (2014). Arizona communities fighting food desert | Arizona Sonora News Service. (n.d.).
Retrieved from http://arizonasonoranewsservice.com/arizona-communities-fighting-food-
desert/
Cairns, S. (2005). Delivering supermarket shopping: More or less traffic? Transport Reviews, 25(1),
51–84. Retrieved from http://doi.org/10.1080/0144164042000218391
Edwards, J.B., McKinnon, A.C., & Cullinane, S.L. (2010), Comparative analysis of the carbon
footprints of conventional and online retailing, International Journal of Physical Distribution
& Logistics Management, 40(1), 103-123. Retrieved from
http://dx.doi.org/10.1108/09600031011018055
Goodchild, Anne Wygonik. (2014). Changing retail business models and the impact on CO2
emissions from transport: E-commerce deliveries in urban and rural areas. Retrieved July 16,
2016, from
http://citeseerx.ist.psu.edu/viewdoc/download?doi=10.1.1.685.3412&rep=rep1&type=pdf
Meola, A., Mar. 3, 2016, 3, 975, & 1. (n.d.). You might be surprised by how many people are using
Amazon Prime Now. Retrieved July 27, 2016, from http://www.businessinsider.com/amazon-
prime-now-reaches-25-of-customers-2016-3
Neiger, C. (n.d.). 7 things you probably don’t know about Amazon Prime Now -. Retrieved August 3,
2016, from http://www.fool.com/investing/general/2016/03/03/7-things-you-probably-dont-
know-about-amazon-prime.aspx
ENVIRONMENTAL ASSESSMENT OF SAME-DAY SHIPPING 22
Plumer, B. (2013, December 13). Cars in the U.S. are more fuel-efficient than ever. Here’s how it
happened. Retrieved August 11, 2016, from
https://www.washingtonpost.com/news/wonk/wp/2013/12/13/cars-in-the-u-s-are-more-fuel-
efficient-than-ever-heres-how-it-happened/
Premack, R. (2016, July 15) A simple change that could help solve one of the biggest problems
facing poor people. (n.d.). Retrieved from
https://www.washingtonpost.com/news/wonk/wp/2016/07/15/the-simple-change-that-could-
get-affordable-food-to-the-poor-people-who-need-it/
Schabner, D. (2006, January 7). Americans: Overworked, overstressed. News, A. B. C. Retrieved July
23, 2016 from http://abcnews.go.com/US/story?id=93604&page=1
Siikavirta, H., Punakivi, M., Kärkkäinen, M., & Linnanen, L. (2002). Effects of e-commerce on
greenhouse gas emissions: A case study of grocery home delivery in Finland. Journal of
Industrial Ecology, 6(2), 83–97. Retrieved from http://doi.org/10.1162/108819802763471807
Suburbanstats.org. (n.d.). Current Phoenix, Arizona Population, Demographics and stats in 2016,
2015. Retrieved August 20, 2016, from https://suburbanstats.org/population/arizona/how-many-
people-live-in-Phoenix
U.S. Department of Energy. (n.d.). Retrieved August 22, 2016, from
https://www.fueleconomy.gov/feg/contentIncludes/co2_inc.htm
Wiese, A., Toporowski, W., & Zielke, S. (2012). Transport-related CO2 effects of online and brick-
and-mortar shopping: A comparison and sensitivity analysis of clothing retailing.
Transportation Research Part D: Transport and Environment, 17(6), 473–477. Retrieved
from http://doi.org/10.1016/j.trd.2012.05.007

ENVIRONMENTAL ASSESSMENT OF SAME-DAY SHIPPING 23
Wygonik, E., & Goodchild, A. (2012). Evaluating the efficacy of shared-use vehicles for reducing
greenhouse gas emissions: A U.S. case study of grocery Ddelivery. Journal of the
Transportation Research Forum, 51(2), 111–126.
Yossi Sheffi (interviewee). (2014). Who can beat Amazon on same-day delivery? Wal-Mart. (n.d.).
Retrieved July 23, 2016, from http://www.bloomberg.com/news/videos/b/8442a9f0-083a-
4ccd-9cb4-3b9417ce2579

ENVIRONMENTAL ASSESSMENT OF SAME-DAY SHIPPING 24
Appendix
Below is a table assigning a number to the delivery points used in the data analysis.
Table 1
Address Number
Warehouse-500 South 48th St, Phoenix, AZ 1
8305 N Ridgeview Dr, Paradise Valley, AZ 2
6342 N Cattle Track Rd, Scottsdale, AZ 3
4726 W Cochise Dr, Glendale, AZ 4
1221 E Monte Cristo Ave, Phoenix, AZ 5
3607 W Palo Verde Dr, Phoenix, AZ 6
4038 E Round Hill Dr, Phoenix, AZ 7
3037 W Campo Bello Dr, Phoenix, AZ 8
915 E Keim Dr, Phoenix, AZ 9
2626 N 72nd Dr, Phoenix, AZ 10
6135 W Surrey Ave, Glendale, AZ 11
4814 W Phelps Rd, Glendale, AZ 12
2234 E Glenrosa Ave, Phoenix, AZ 13
7326 W Cypress St, Phoenix, AZ 14
3415 W Sierra Vista Dr, Phoenix, AZ 15
6918 E Kathleen Rd, Scottsdale, AZ 16
7025 W Tonopah Dr, Glendale, AZ 17
937 E Fairmount Ave, Phoenix, AZ 18
3925 E Coronado Rd, Phoenix, AZ 19
3216 E Colter St, Phoenix, AZ 20
528 E Osborn Rd, Phoenix, AZ 21
18201 N 41st Dr, Glendale, AZ 22
4001 W Alice Ave, Phoenix, AZ 23
8321 E San Salvador Dr, Scottsdale, AZ 24
2637 N 29th St, Phoenix, AZ 25
12955 N 75th Dr, Peoria, AZ 26
1213 E Highland Ave, Phoenix, AZ 27
5014 N 87th Way, Scottsdale, AZ 28
1632 W Thunderbird Rd, Phoenix, AZ 29
5364 N 31st Pl, Phoenix, AZ 30
8610 W Minnezona Ave, Phoenix, AZ 31
ENVIRONMENTAL ASSESSMENT OF SAME-DAY SHIPPING 25
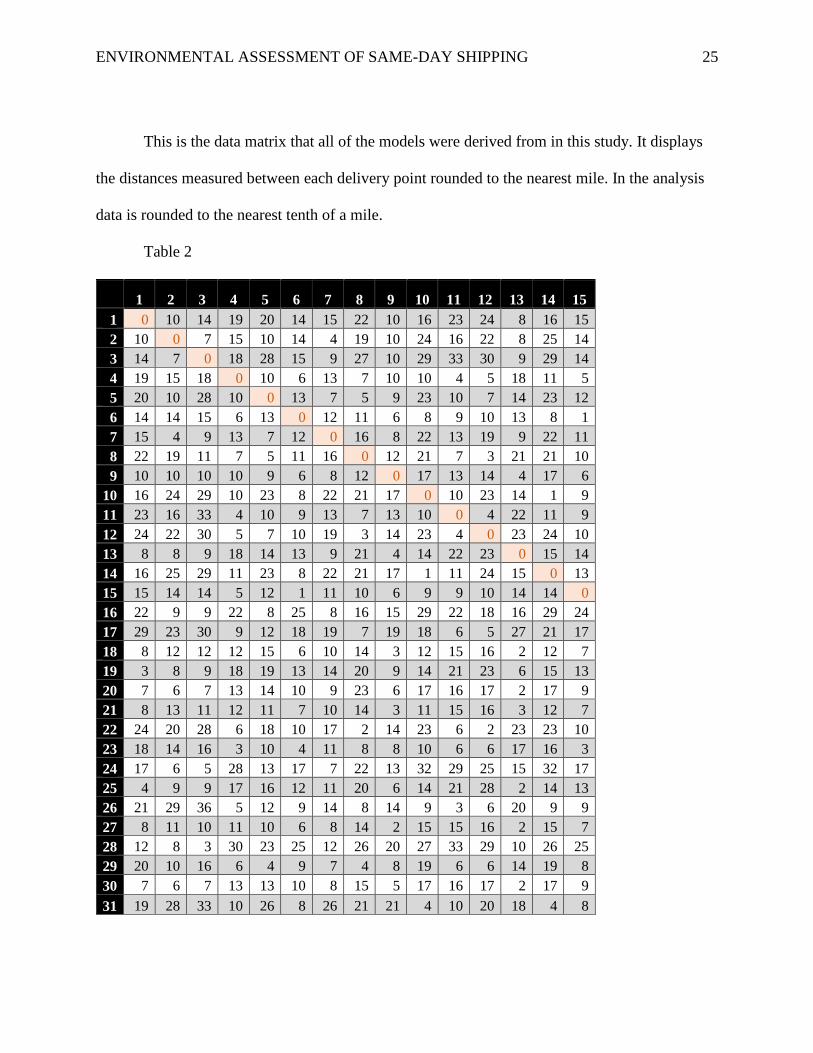
This is the data matrix that all of the models were derived from in this study. It displays
the distances measured between each delivery point rounded to the nearest mile. In the analysis
data is rounded to the nearest tenth of a mile.
Table 2
1 2 3 4 5 6 7 8 9 10 11 12 13 14 15
1 0 10 14 19 20 14 15 22 10 16 23 24 8 16 15
2 10 0 7 15 10 14 4 19 10 24 16 22 8 25 14
3 14 7 0 18 28 15 9 27 10 29 33 30 9 29 14
4 19 15 18 0 10 6 13 7 10 10 4 5 18 11 5
5 20 10 28 10 0 13 7 5 9 23 10 7 14 23 12
6 14 14 15 6 13 0 12 11 6 8 9 10 13 8 1
7 15 4 9 13 7 12 0 16 8 22 13 19 9 22 11
8 22 19 11 7 5 11 16 0 12 21 7 3 21 21 10
9 10 10 10 10 9 6 8 12 0 17 13 14 4 17 6
10 16 24 29 10 23 8 22 21 17 0 10 23 14 1 9
11 23 16 33 4 10 9 13 7 13 10 0 4 22 11 9
12 24 22 30 5 7 10 19 3 14 23 4 0 23 24 10
13 8 8 9 18 14 13 9 21 4 14 22 23 0 15 14
14 16 25 29 11 23 8 22 21 17 1 11 24 15 0 13
15 15 14 14 5 12 1 11 10 6 9 9 10 14 14 0
16 22 9 9 22 8 25 8 16 15 29 22 18 16 29 24
17 29 23 30 9 12 18 19 7 19 18 6 5 27 21 17
18 8 12 12 12 15 6 10 14 3 12 15 16 2 12 7
19 3 8 9 18 19 13 14 20 9 14 21 23 6 15 13
20 7 6 7 13 14 10 9 23 6 17 16 17 2 17 9
21 8 13 11 12 11 7 10 14 3 11 15 16 3 12 7
22 24 20 28 6 18 10 17 2 14 23 6 2 23 23 10
23 18 14 16 3 10 4 11 8 8 10 6 6 17 16 3
24 17 6 5 28 13 17 7 22 13 32 29 25 15 32 17
25 4 9 9 17 16 12 11 20 6 14 21 28 2 14 13
26 21 29 36 5 12 9 14 8 14 9 3 6 20 9 9
27 8 11 10 11 10 6 8 14 2 15 15 16 2 15 7
28 12 8 3 30 23 25 12 26 20 27 33 29 10 26 25
29 20 10 16 6 4 9 7 4 8 19 6 6 14 19 8
30 7 6 7 13 13 10 8 15 5 17 16 17 2 17 9
31 19 28 33 10 26 8 26 21 21 4 10 20 18 4 8

ENVIRONMENTAL ASSESSMENT OF SAME-DAY SHIPPING 26
Table 2 continued…
Below is a list of all of the addresses used in each model for my analysis.
16 17 18 19 20 21 22 23 24 25 26 27 28 29 30 31
1 22 29 8 3 7 8 24 18 17 4 21 8 12 20 7 19
2 9 23 12 8 6 13 20 14 6 9 29 11 8 10 6 28
3 9 30 12 9 7 11 28 16 5 9 36 10 3 16 7 33
4 22 9 12 18 13 12 6 3 28 17 5 11 30 6 13 10
5 8 12 15 19 14 11 18 10 13 16 12 10 23 4 13 26
6 25 18 6 13 10 7 10 4 17 12 9 6 25 9 10 8
7 8 19 10 14 9 10 17 11 7 11 14 8 12 7 8 26
8 16 7 14 20 23 14 2 8 22 20 8 14 26 4 15 21
9 15 19 3 9 6 3 14 8 13 6 14 2 20 8 5 21
10 29 18 12 14 17 11 23 10 32 14 9 15 27 19 17 4
11 22 6 15 21 16 15 6 6 29 21 3 15 33 6 16 10
12 18 5 16 23 17 16 2 6 25 28 6 16 29 6 17 20
13 16 27 2 6 2 3 23 17 15 2 20 2 10 14 2 18
14 29 20 12 15 17 12 23 16 32 14 9 15 26 19 17 4
15 24 17 7 13 9 7 10 3 17 13 9 7 25 8 9 8
16 0 19 17 21 16 17 17 22 7 18 26 15 12 13 15 34
17 19 0 21 28 26 21 5 15 26 28 5 26 30 11 26 15
18 17 21 0 6 4 1 17 10 15 3 14 1 18 10 4 16
19 21 28 6 0 4 7 23 17 19 2 19 7 13 19 5 18
20 16 26 4 4 0 5 24 11 10 3 18 3 8 13 0 20
21 17 21 1 7 5 0 17 10 16 3 14 2 18 10 5 15
22 17 5 17 23 24 17 0 7 23 23 8 16 29 6 18 20
23 22 15 10 17 11 10 7 0 17 16 7 10 28 6 11 10
24 7 26 15 19 10 16 23 17 0 16 33 14 6 13 10 31
25 18 28 3 2 3 3 23 16 16 0 19 4 15 15 3 17
26 26 5 14 19 18 14 8 7 33 19 0 16 36 8 18 8
27 15 26 1 7 3 2 16 10 14 4 16 0 18 9 3 18
28 12 30 18 13 8 18 29 28 6 15 36 18 0 19 8 30
29 13 11 10 19 13 10 6 6 13 15 8 9 19 0 13 22
30 15 26 4 5 0 5 18 11 10 3 18 3 8 13 0 20
31 34 15 16 18 20 15 20 10 31 17 8 18 30 22 20 0

ENVIRONMENTAL ASSESSMENT OF SAME-DAY SHIPPING 27
Table 3
Model 1 Model 2
3607 W Palo Verde Dr, Phoenix, AZ 1221 E Monte Cristo Ave, Phoenix, AZ
3037 W Campo Bello DR, Phoenix, AZ 915 E Keim Dr, Phoenix, AZ
2626 N 72nd Dr, Phoenix, AZ 4814 W Phelps Rd, Glendale, AZ
6135 W Surrey Ave, Glendale, AZ 2234 E Glenrosa Ave, Phoenix, AZ
2234 E Glenrosa Ave, Phoenix, AZ 7326 W Cypress St, Phoenix, AZ
7326 W Cypress St, Phoenix, AZ 3415 W Sierra Vista Dr, Phoenix, AZ
3415 W Sierra Vista Dr, Phoenix, AZ 6918 E Kathleen Rd, Scottsdale, AZ
7025 W Tonopah Dr, Glendale, AZ 937 E Fairmount Ave, Phoenix, AZ
528 E Osborn Rd, Phoenix, AZ 528 E Osborn Rd, Phoenix, AZ
18201 N 41st Dr, Glendale, AZ 8321 E San Salvador Dr, Scottsdale, AZ
8321 E San Salvador Dr, Scottsdale, AZ 2637 N 29th St, Phoenix, AZ
2637 N 29th St, Phoenix, AZ 1213 E Highland Ave, Phoenix, AZ
1213 E Highland Ave, Phoenix, AZ 5014 N 87th Way, Scottsdale, AZ
5364 N 31st Pl, Phoenix, AZ 1632 W Thunderbird Rd, Phoenix, AZ
8610 W Minnezona Ave, Phoenix, AZ 8610 W Minnezona Ave, Phoenix, AZ
Model 3 Model 4
3037 W Campo Bello DR, Phoenix, AZ 7025 W Tonopah Dr, Glendale, AZ
2626 N 72nd Dr, Phoenix, AZ 937 E Fairmount Ave, Phoenix, AZ
6135 W Surrey Ave, Glendale, AZ 3925 E Coronado Rd, Phoenix, AZ
2234 E Glenrosa Ave, Phoenix, AZ 3216 E Colter St, Phoenix, AZ
7326 W Cypress St, Phoenix, AZ 528 E Osborn Rd, Phoenix, AZ
3415 W Sierra Vista Dr, Phoenix, AZ 18201 N 41st Dr, Glendale, AZ
7025 W Tonopah Dr, Glendale, AZ 4001 W Alice Ave, Phoenix, AZ
528 E Osborn Rd, Phoenix, AZ 8321 E San Salvador Dr, Scottsdale, AZ
18201 N 41st Dr, Glendale, AZ 2637 N 29th St, Phoenix, AZ
8321 E San Salvador Dr, Scottsdale, AZ 12955 N 75th Dr, Peoria, AZ
2637 N 29th St, Phoenix, AZ 1213 E Highland Ave, Phoenix, AZ
1213 E Highland Ave, Phoenix, AZ 5014 N 87th Way, Scottsdale, AZ
5364 N 31st Pl, Phoenix, AZ 1632 W Thunderbird Rd, Phoenix, AZ
8610 W Minnezona Ave, Phoenix, AZ 5364 N 31st Pl, Phoenix, AZ
3607 W Palo Verde Dr, Phoenix, AZ 8610 W Minnezona Ave, Phoenix, AZ
Model 5 Model 6
915 E Keim Dr, Phoenix, AZ 8305 N Ridgeview Dr, Paradise Valley, AZ
2626 N 72nd Dr, Phoenix, AZ 1221 E Monte Cristo Ave, Phoenix, AZ
6135 W Surrey Ave, Glendale, AZ 3607 W Palo Verde Dr, Phoenix, AZ
4814 W Phelps Rd, Glendale, AZ 915 E Keim Dr, Phoenix, AZ
2234 E Glenrosa Ave, Phoenix, AZ 2626 N 72nd Dr, Phoenix, AZ
7326 W Cypress St, Phoenix, AZ 3415 W Sierra Vista Dr, Phoenix, AZ
3415 W Sierra Vista Dr, Phoenix, AZ 6918 E Kathleen Rd, Scottsdale, AZ
6918 E Kathleen Rd, Scottsdale, AZ 7025 W Tonopah Dr, Glendale, AZ
7025 W Tonopah Dr, Glendale, AZ 937 E Fairmount Ave, Phoenix, AZ
937 E Fairmount Ave, Phoenix, AZ 3925 E Coronado Rd, Phoenix, AZ

ENVIRONMENTAL ASSESSMENT OF SAME-DAY SHIPPING 28
This table shows the distance measured from each delivery point to the nearest Walmart
Supercenter which was used to calculate the average VMT per order for private shopping trips.
Table 4
3925 E Coronado Rd, Phoenix, AZ 8321 E San Salvador Dr, Scottsdale, AZ
3216 E Colter St, Phoenix, AZ 2637 N 29th St, Phoenix, AZ
528 E Osborn Rd, Phoenix, AZ 12955 N 75th Dr, Peoria, AZ
18201 N 41st Dr, Glendale, AZ 1213 E Highland Ave, Phoenix, AZ
3037 W Campo Bello DR, Phoenix, AZ 5014 N 87th Way, Scottsdale, AZ
Model 7 Model 8
8305 N Ridgeview Dr, Paradise Valley, AZ 3607 W Palo Verde Dr, Phoenix, AZ
6342 N Cattle Track Rd, Scottsdale, AZ 915 E Keim Dr, Phoenix, AZ
4726 W Cochise Dr, Glendale, AZ 2626 N 72nd Dr, Phoenix, AZ
1221 E Monte Cristo Ave, Phoenix, AZ 2234 E Glenrosa Ave, Phoenix, AZ
4038 E Round Hill Dr, Phoenix, AZ 7326 W Cypress St, Phoenix, AZ
3037 W Campo Bello DR, Phoenix, AZ 3415 W Sierra Vista Dr, Phoenix, AZ
6135 W Surrey Ave, Glendale, AZ 937 E Fairmount Ave, Phoenix, AZ
4814 W Phelps Rd, Glendale, AZ 3925 E Coronado Rd, Phoenix, AZ
3216 E Colter St, Phoenix, AZ 3216 E Colter St, Phoenix, AZ
528 E Osborn Rd, Phoenix, AZ 528 E Osborn Rd, Phoenix, AZ
18201 N 41st Dr, Glendale, AZ 4001 W Alice Ave, Phoenix, AZ
4001 W Alice Ave, Phoenix, AZ 2637 N 29th St, Phoenix, AZ
2637 N 29th St, Phoenix, AZ 5014 N 87th Way, Scottsdale, AZ
1213 E Highland Ave, Phoenix, AZ 5364 N 31st Pl, Phoenix, AZ
5364 N 31st Pl, Phoenix, AZ 8610 W Minnezona Ave, Phoenix, AZ
Model 9 Model 10
8305 N Ridgeview Dr, Paradise Valley, AZ 4726 W Cochise Dr, Glendale, AZ
6342 N Cattle Track Rd, Scottsdale, AZ 1221 E Monte Cristo Ave, Phoenix, AZ
4038 E Round Hill Dr, Phoenix, AZ 3607 W Palo Verde Dr, Phoenix, AZ
915 E Keim Dr, Phoenix, AZ 3037 W Campo Bello DR, Phoenix, AZ
2234 E Glenrosa Ave, Phoenix, AZ 2626 N 72nd Dr, Phoenix, AZ
6918 E Kathleen Rd, Scottsdale, AZ 6135 W Surrey Ave, Glendale, AZ
937 E Fairmount Ave, Phoenix, AZ 4814 W Phelps Rd, Glendale, AZ
3925 E Coronado Rd, Phoenix, AZ 7326 W Cypress St, Phoenix, AZ
3216 E Colter St, Phoenix, AZ 3415 W Sierra Vista Dr, Phoenix, AZ
528 E Osborn Rd, Phoenix, AZ 7025 W Tonopah Dr, Glendale, AZ
8321 E San Salvador Dr, Scottsdale, AZ 18201 N 41st Dr, Glendale, AZ
2637 N 29th St, Phoenix, AZ 4001 W Alice Ave, Phoenix, AZ
1213 E Highland Ave, Phoenix, AZ 12955 N 75th Dr, Peoria, AZ
5014 N 87th Way, Scottsdale, AZ 1632 W Thunderbird Rd, Phoenix, AZ
5364 N 31st Pl, Phoenix, AZ 8610 W Minnezona Ave, Phoenix, AZ

ENVIRONMENTAL ASSESSMENT OF SAME-DAY SHIPPING 29
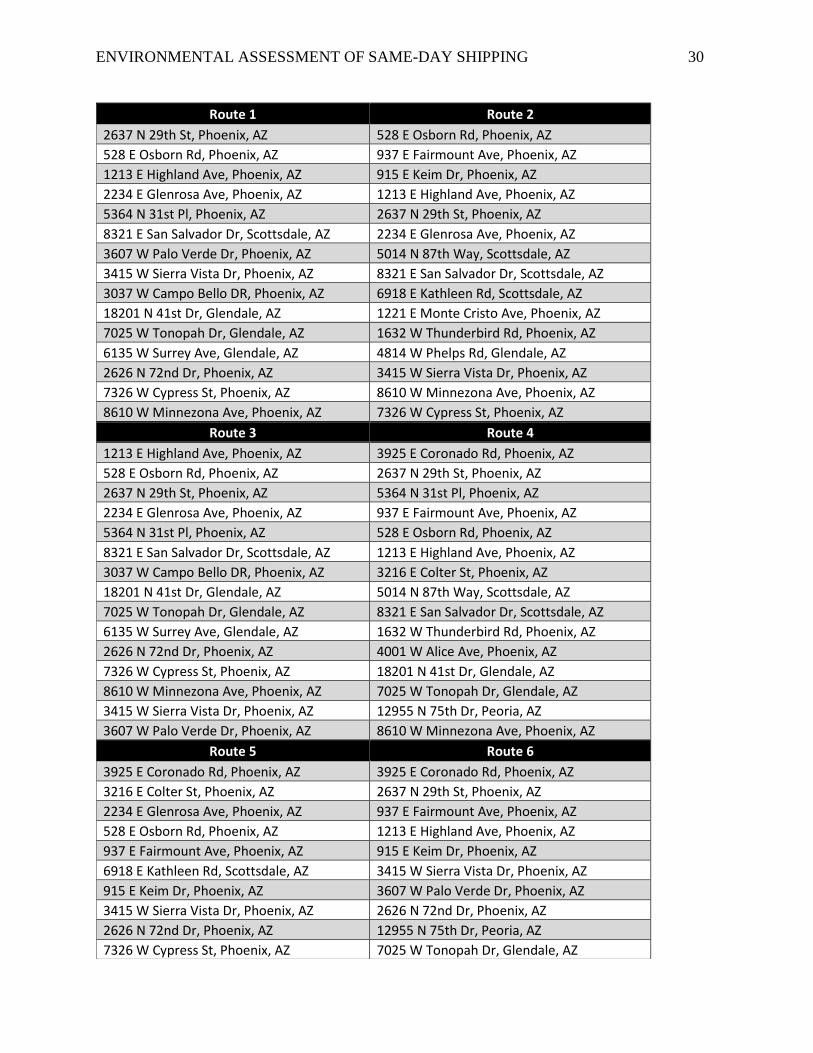
These tables list the shortest delivery route as determined by Excel Evolutionary Solver.
All of the routes begin at the warehouse and do not return to their origin.
Table 5
Address One-Way Trip Round Trip
8305 N Ridgeview Dr, Paradise Valley, AZ 3.30 6.60
6342 N Cattle Track Rd, Scottsdale, AZ 2.70 5.40
4726 W Cochise DR, Glendale, AZ 1.40 2.80
1221 E Monte Cristo Ave, Phoenix, AZ 3.40 6.80
3607 W Palo Verde Dr, Phoenix, AZ 0.50 1.00
4038 E Round Hill Dr, Phoenix, AZ 1.80 3.60
3037 W Campo Bello DR, Phoenix, AZ 1.90 3.80
915 E Keim Dr, Phoenix, AZ 2.00 4.00
2626 N 72nd Dr, Phoenix, AZ 1.00 2.00
6135 W Surrey Ave, Glendale, AZ 2.10 4.20
4814 W Phelps Rd, Glendale, AZ 1.30 2.60
2234 E Glenrosa Ave, Phoenix, AZ 3.20 6.40
7326 W Cypress St, Phoenix, AZ 0.40 0.80
3415 W Sierra Vista Dr, Phoenix, AZ 0.50 1.00
6918 E Kathleen Rd, Scottsdale, AZ 3.00 6.00
7025 W Tonopah Dr, Glendale, AZ 3.90 7.80
937 E Fairmount Ave, Phoenix, AZ 4.00 8.00
3925 E Coronado Rd, Phoenix, AZ 1.40 2.80
3216 E Colter St, Phoenix, AZ 3.10 6.20
528 E Osborn Rd, Phoenix, AZ 4.20 8.40
18201 N 41st Dr, Glendale, AZ 3.00 6.00
4001 W Alice Ave, Phoenix, AZ 3.00 6.00
8321 E San Salvador Dr, Scottsdale, AZ 4.90 9.80
2637 N 29th St, Phoenix, AZ 1.30 2.60
12955 N 75th Dr, Peoria, AZ 2.30 4.60
1213 E Highland Ave, Phoenix, AZ 3.40 6.80
5014 N 87th Way, Scottsdale, AZ 0.20 0.40
1632 W Thunderbird Rd, Phoenix, AZ 2.60 5.20
5364 N 31st Pl, Phoenix, AZ 3.30 6.60
8610 W Minnezona Ave, Phoenix, AZ 1.70 3.40
ENVIRONMENTAL ASSESSMENT OF SAME-DAY SHIPPING 30
Route 1 Route 2
2637 N 29th St, Phoenix, AZ 528 E Osborn Rd, Phoenix, AZ
528 E Osborn Rd, Phoenix, AZ 937 E Fairmount Ave, Phoenix, AZ
1213 E Highland Ave, Phoenix, AZ 915 E Keim Dr, Phoenix, AZ
2234 E Glenrosa Ave, Phoenix, AZ 1213 E Highland Ave, Phoenix, AZ
5364 N 31st Pl, Phoenix, AZ 2637 N 29th St, Phoenix, AZ
8321 E San Salvador Dr, Scottsdale, AZ 2234 E Glenrosa Ave, Phoenix, AZ
3607 W Palo Verde Dr, Phoenix, AZ 5014 N 87th Way, Scottsdale, AZ
3415 W Sierra Vista Dr, Phoenix, AZ 8321 E San Salvador Dr, Scottsdale, AZ
3037 W Campo Bello DR, Phoenix, AZ 6918 E Kathleen Rd, Scottsdale, AZ
18201 N 41st Dr, Glendale, AZ 1221 E Monte Cristo Ave, Phoenix, AZ
7025 W Tonopah Dr, Glendale, AZ 1632 W Thunderbird Rd, Phoenix, AZ
6135 W Surrey Ave, Glendale, AZ 4814 W Phelps Rd, Glendale, AZ
2626 N 72nd Dr, Phoenix, AZ 3415 W Sierra Vista Dr, Phoenix, AZ
7326 W Cypress St, Phoenix, AZ 8610 W Minnezona Ave, Phoenix, AZ
8610 W Minnezona Ave, Phoenix, AZ 7326 W Cypress St, Phoenix, AZ
Route 3 Route 4
1213 E Highland Ave, Phoenix, AZ 3925 E Coronado Rd, Phoenix, AZ
528 E Osborn Rd, Phoenix, AZ 2637 N 29th St, Phoenix, AZ
2637 N 29th St, Phoenix, AZ 5364 N 31st Pl, Phoenix, AZ
2234 E Glenrosa Ave, Phoenix, AZ 937 E Fairmount Ave, Phoenix, AZ
5364 N 31st Pl, Phoenix, AZ 528 E Osborn Rd, Phoenix, AZ
8321 E San Salvador Dr, Scottsdale, AZ 1213 E Highland Ave, Phoenix, AZ
3037 W Campo Bello DR, Phoenix, AZ 3216 E Colter St, Phoenix, AZ
18201 N 41st Dr, Glendale, AZ 5014 N 87th Way, Scottsdale, AZ
7025 W Tonopah Dr, Glendale, AZ 8321 E San Salvador Dr, Scottsdale, AZ
6135 W Surrey Ave, Glendale, AZ 1632 W Thunderbird Rd, Phoenix, AZ
2626 N 72nd Dr, Phoenix, AZ 4001 W Alice Ave, Phoenix, AZ
7326 W Cypress St, Phoenix, AZ 18201 N 41st Dr, Glendale, AZ
8610 W Minnezona Ave, Phoenix, AZ 7025 W Tonopah Dr, Glendale, AZ
3415 W Sierra Vista Dr, Phoenix, AZ 12955 N 75th Dr, Peoria, AZ
3607 W Palo Verde Dr, Phoenix, AZ 8610 W Minnezona Ave, Phoenix, AZ
Route 5 Route 6
3925 E Coronado Rd, Phoenix, AZ 3925 E Coronado Rd, Phoenix, AZ
3216 E Colter St, Phoenix, AZ 2637 N 29th St, Phoenix, AZ
2234 E Glenrosa Ave, Phoenix, AZ 937 E Fairmount Ave, Phoenix, AZ
528 E Osborn Rd, Phoenix, AZ 1213 E Highland Ave, Phoenix, AZ
937 E Fairmount Ave, Phoenix, AZ 915 E Keim Dr, Phoenix, AZ
6918 E Kathleen Rd, Scottsdale, AZ 3415 W Sierra Vista Dr, Phoenix, AZ
915 E Keim Dr, Phoenix, AZ 3607 W Palo Verde Dr, Phoenix, AZ
3415 W Sierra Vista Dr, Phoenix, AZ 2626 N 72nd Dr, Phoenix, AZ
2626 N 72nd Dr, Phoenix, AZ 12955 N 75th Dr, Peoria, AZ
7326 W Cypress St, Phoenix, AZ 7025 W Tonopah Dr, Glendale, AZ

ENVIRONMENTAL ASSESSMENT OF SAME-DAY SHIPPING 31
The tables below list the average VMT per model and averages per customer density
Table 6
6135 W Surrey Ave, Glendale, AZ 1221 E Monte Cristo Ave, Phoenix, AZ
7025 W Tonopah Dr, Glendale, AZ 6918 E Kathleen Rd, Scottsdale, AZ
4814 W Phelps Rd, Glendale, AZ 8305 N Ridgeview Dr, Paradise Valley, AZ
18201 N 41st Dr, Glendale, AZ 8321 E San Salvador Dr, Scottsdale, AZ
3037 W Campo Bello DR, Phoenix, AZ 5014 N 87th Way, Scottsdale, AZ
Route 7 Route 8
8305 N Ridgeview Dr, Paradise Valley, AZ 3925 E Coronado Rd, Phoenix, AZ
6342 N Cattle Track Rd, Scottsdale, AZ 2637 N 29th St, Phoenix, AZ
4038 E Round Hill Dr, Phoenix, AZ 3216 E Colter St, Phoenix, AZ
1221 E Monte Cristo Ave, Phoenix, AZ 5364 N 31st Pl, Phoenix, AZ
3037 W Campo Bello DR, Phoenix, AZ 5014 N 87th Way, Scottsdale, AZ
18201 N 41st Dr, Glendale, AZ 2234 E Glenrosa Ave, Phoenix, AZ
4814 W Phelps Rd, Glendale, AZ 937 E Fairmount Ave, Phoenix, AZ
6135 W Surrey Ave, Glendale, AZ 528 E Osborn Rd, Phoenix, AZ
4726 W Cochise Dr, Glendale, AZ 915 E Keim Dr, Phoenix, AZ
4001 W Alice Ave, Phoenix, AZ 4001 W Alice Ave, Phoenix, AZ
1213 E Highland Ave, Phoenix, AZ 3415 W Sierra Vista Dr, Phoenix, AZ
528 E Osborn Rd, Phoenix, AZ 3607 W Palo Verde Dr, Phoenix, AZ
2637 N 29th St, Phoenix, AZ 2626 N 72nd Dr, Phoenix, AZ
3216 E Colter St, Phoenix, AZ 7326 W Cypress St, Phoenix, AZ
5364 N 31st Pl, Phoenix, AZ 8610 W Minnezona Ave, Phoenix, AZ
Route 9 Route 10
3925 E Coronado Rd, Phoenix, AZ 3607 W Palo Verde Dr, Phoenix, AZ
2637 N 29th St, Phoenix, AZ 3415 W Sierra Vista Dr, Phoenix, AZ
6342 N Cattle Track Rd, Scottsdale, AZ 4001 W Alice Ave, Phoenix, AZ
5014 N 87th Way, Scottsdale, AZ 4726 W Cochise Dr, Glendale, AZ
8321 E San Salvador Dr, Scottsdale, AZ 1632 W Thunderbird Rd, Phoenix, AZ
6918 E Kathleen Rd, Scottsdale, AZ 1221 E Monte Cristo Ave, Phoenix, AZ
8305 N Ridgeview Dr, Paradise Valley, AZ 3037 W Campo Bello DR, Phoenix, AZ
4038 E Round Hill Dr, Phoenix, AZ 18201 N 41st Dr, Glendale, AZ
915 E Keim Dr, Phoenix, AZ 4814 W Phelps Rd, Glendale, AZ
1213 E Highland Ave, Phoenix, AZ 7025 W Tonopah Dr, Glendale, AZ
528 E Osborn Rd, Phoenix, AZ 6135 W Surrey Ave, Glendale, AZ
937 E Fairmount Ave, Phoenix, AZ 12955 N 75th Dr, Peoria, AZ
2234 E Glenrosa Ave, Phoenix, AZ 2626 N 72nd Dr, Phoenix, AZ
3216 E Colter St, Phoenix, AZ 7326 W Cypress St, Phoenix, AZ
5364 N 31st Pl, Phoenix, AZ 8610 W Minnezona Ave, Phoenix, AZ

ENVIRONMENTAL ASSESSMENT OF SAME-DAY SHIPPING 32
Table 7
Table 8
Model Prime Now Private Shop Difference
Initial 3.79 4.72 -0.93
1 3.98 3.53 0.45
2 5.69 4.81 0.88
3 4.34 3.80 0.54
4 5.10 5.64 -0.54
5 5.70 4.67 1.03
6 4.02 3.51 0.51
7 (North) 4.64 5.23 -0.59
8 (South) 3.67 3.97 -0.31
9 (East) 3.87 5.57 -1.70
10 (West) 4.51 3.87 0.64
Average VMT 0.00
Average Customer Density = 0.073
Model Difference
Set 1 0.45
Set 2 0.88
Set 3 0.54
Set 4 -0.54
Set 5 1.03
Set 6 0.51
Average VMT 0.48
Customer Density= 0.05
Customer Density = 0.1
Model Difference
Initial -0.93
Set7 -0.59
Set 8 -0.31
Set 9 -1.70
Set 10 0.64
Average VMT -0.58