Embed Size (px)
Citation preview

© 2015 Enroll America and Get Covered America EnrollAmerica.org | GetCoveredAmerica.org
How to Run a Low Resource Data Driven Program John Malloy, Na<onal Partner Data Manager, Enroll America Andy Perry, California Data Manager, Enroll America Meaghan Hardy, Regional Data Manager, Enroll America

Introduc<ons

• Provide Answers! • What is Data? • How can it be used in your program? • What is the difference between Data & Metrics? • Why do Repor<ng and Planning maKer?
• Provide Tools & Tac<cs! • Case Study of using Google Docs to track Data • Debrief and discussion of Google Docs as a data tool • More resources to learn about
Objec<ves

• Objec<ves & Agenda • The What & Why of Data • Data vs. Metrics • The value of planning and repor<ng • Free Tool Case Study on Data Management • Ques<ons • Addi<onal Resources
Agenda
5
Why Data?

6
What Is Data?

What Is Data AUer All?

• 1’s & 0’s? Like the Matrix?
What Is Data AUer All?

What Is Data AUer All?

• 1’s & 0’s? Like the Matrix?
• Complex Regression Graphs?
What Is Data AUer All?

What Is Data AUer All?

• 1’s & 0’s? Like the Matrix?
• Complex Regression Graphs? • Really cool heat maps?
What Is Data AUer All?

13
Data can be used to create all of those things….
However,
14
Running a Data Driven Program
just means tracking the conversa<ons your program
has with its intended audience

15
Why Should I Care About Data?

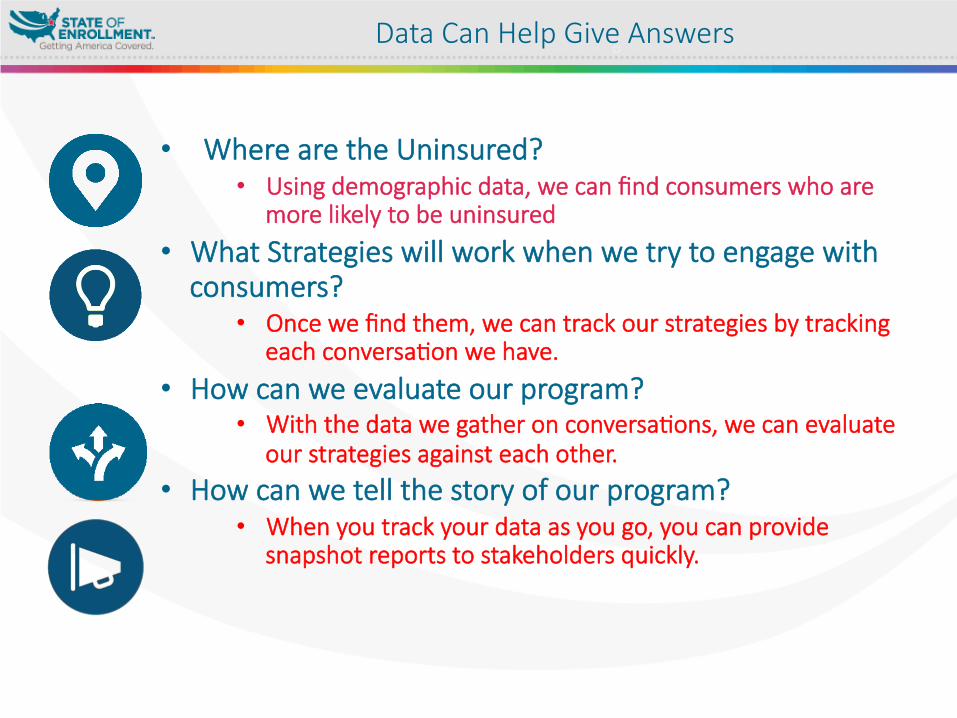
• Where are the Uninsured? Using demographic data, we can find consumers who are more likely to be uninsured
• What Strategies will work when we try to engage with consumers?
Once we find them, we can track our strategies by tracking each conversa<on we have.
• How can we evaluate our program? With the data we gather on conversa<ons, we can evaluate our strategies against each other.
• How can we tell the story of our program? When you track your data as you go, you can provide snapshot reports to stakeholders quickly.
We All have Big Ques<ons
• Where are the Uninsured? • Using demographic data, we can find consumers who are
more likely to be uninsured
• What Strategies will work when we try to engage with consumers?
• Once we find them, we can track our strategies by tracking each conversa<on we have.
• How can we evaluate our program? • With the data we gather on conversa<ons, we can evaluate
our strategies against each other. • How can we tell the story of our program?
• When you track your data as you go, you can provide snapshot reports to stakeholders quickly.
Data Can Help Give Answers

What makes up data?
Name & Demographics Contact Information Conversations Questions People Answer
… And other data points that are vital to your program

19
What types of Data do you care about?
20
How we use data
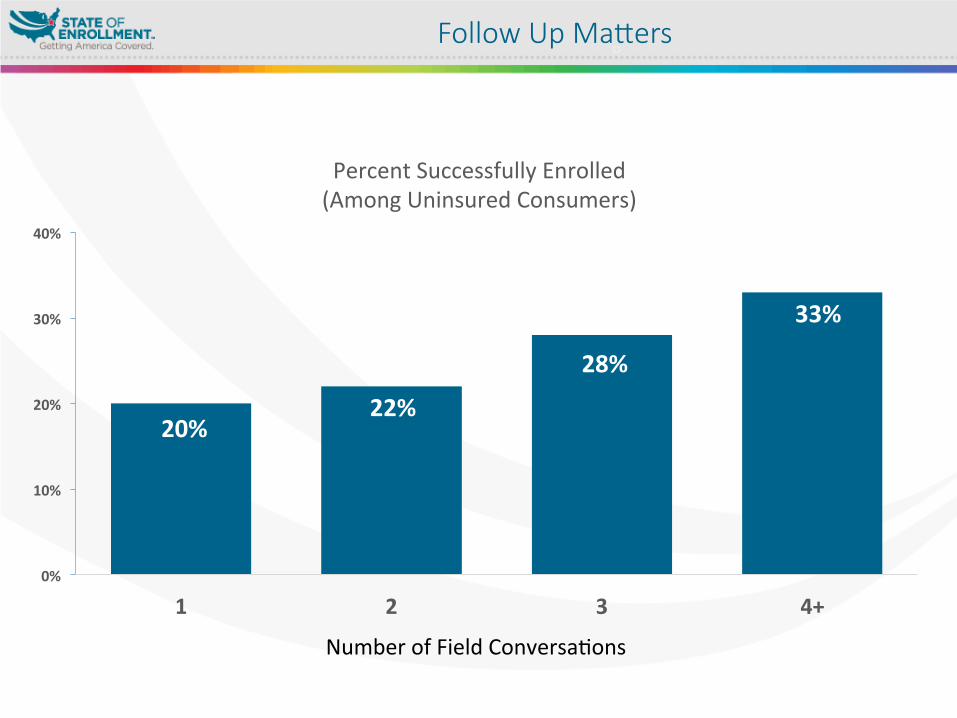
Follow Up MaKers
0%
10%
20%
30%
40%
1 2 3 4+
Percent Successfully Enrolled (Among Uninsured Consumers)
Number of Field Conversa>ons
20% 22%
28%
33%
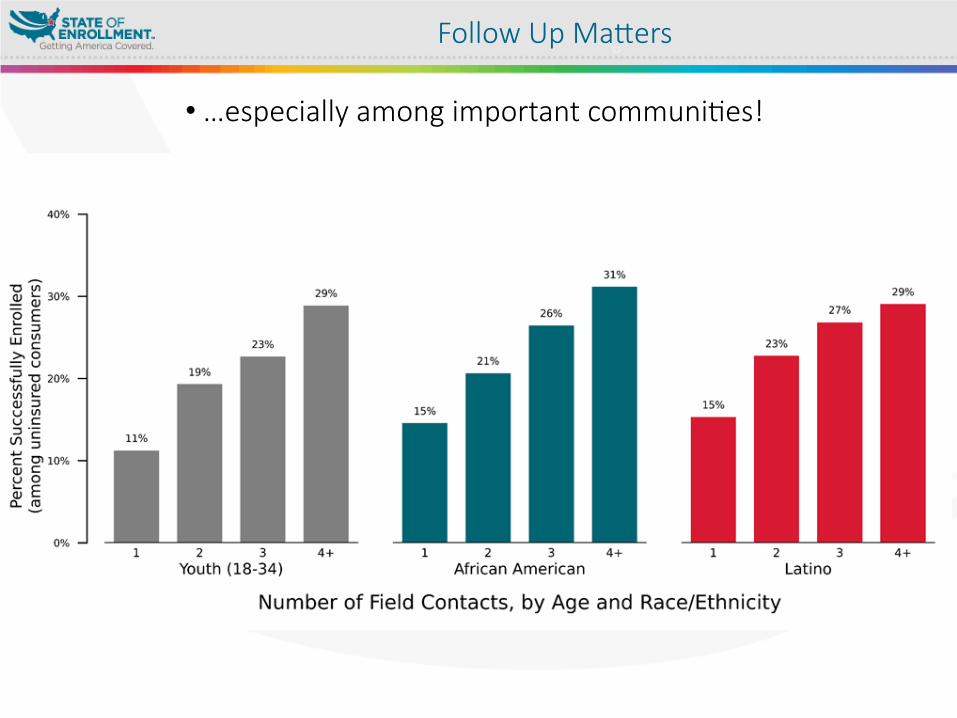
• …especially among important communi<es!
Follow Up MaKers

• What is Data?
• Informa<on – quan<ta<ve (numbers-‐based) or qualita<ve (quality-‐based) that you collect.
• You don’t need a fancy database to collect data – you just need a structure!
• You can use excel or free sources like google docs.
Data v. Metrics

• What are metrics?
• The specific types of data you choose to track.
Data v. Metrics

• In other words, data is what informa<on you collect and metrics are what you choose to count and how you choose to count it.
Data v. Metrics

The more specific and granular data you collect, the more flexibility you have in defining and tracking metrics! Let’s say two organiza<ons are asked to see what percentage of the people they’re speaking to about their insurance primarily speak Spanish. Both have a list of consumers in an excel spreadsheet that they use for follow-‐up.
Data v. Metrics
Organiza<on 1: • Records the number of people they spoke to who primarily spoke Spanish.
Organiza<on 2: • Records the individual people who speak Spanish.
Both organiza,ons are collec,ng data to answer this ques,on…

Organiza<on 1 can only answer the ques<on: what percentage of the people they’re speaking to primarily speak Spanish? Organiza<on 2 can answer that ques<on and can also do individualized follow-‐up, if they’re interested in doing that in the future, or they can answer other ques<ons about that popula<on – what’s the gender breakdown? How many do we have email addresses for?
Data v. Metrics

• Accountability
• Consistency
• Ins<tu<onal Memory
• Analysis
• Repor<ng to Stakeholders
• Telling Your Story
What Is Data Good For???

• Accountability: Sehng internal benchmarks for yourself and then tracking your progress can help you evaluate what is working, what isn’t, and how
Examples:

• Ins<tu<onal Memory Crea<ng an organiza<on that is sustainable and doesn’t rely on one person or group of people to keep going!
Examples:
• Telling your story
• Data helps you iden<fy the larger narra<ve and get addi<onal buy-‐in from volunteers and funding organiza<ons!
• Telling your story helps you grow!
Examples:

• Metrics allow you to report on the data you’ve collected in a consistent way.
• Repor<ng creates a structure for dissemina<ng informa<on, evalua<ng work, and making use of the data you’ve collected.
What Are Metrics Used For?

Define Metrics
• What is important to track in your program? • How will you track it?
Set Goals
• Using the metrics you’ve set, define and set goals for your program. • Create benchmarks and
Collect Data
• Collect granular data that allows you to track the metrics you’re interested in and gives the flexibility to poten>ally redefine metrics in the future and to do effec>ve follow-‐up on individual data points.
Report
• Evaluate your program’s progress to the goals you’ve set. • Part of this evalua>on may mean redefining metrics, seSng new goals, or changing the way you collect data!
Metrics, Data, and Repor<ng
• How do you know what metrics to track?
What you choose to track should reflect your priori<es and needs as an organiza<on at that <me.
They may change over <me as your needs or objec<ves change. Your list of metrics can be small – start with one that is important to your program!
Suggested Metrics to Track

35
Title: Subtitle
WHY PLANNING MATTERS

36
• Planning is a constant
• But the earlier you start, the happier you’ll be.
Why Planning MaKers

37
• Metrics live in containers • Not all metrics can be contained easily • Not all containers can hold all metrics
Why Planning Matters
38
• Program planning and data planning should go hand in hand
• Ini<al steps • Determine the lay of the land • What do you want to accomplish? • What is quan<fiable? • What isn’t? • What is non-‐nego<able (e.g. grant obliga<ons)?
Why Planning Matters

• Have you ever set goals or determined metrics for an organiza<on or campaign?
• Have you ever realized midstream that there was something else you wanted to track?
Quick Discussion

40
• Benchmark Goals
• Monthly, weekly, daily
• By geography
• By staff
• Distribute rationally, NOT evenly!
• Ramp up over time • More need in some places
Planning Your Program
• Determine Metrics • What are the important steps to achieve your goals?
• How can you measure progress toward each step?
• Different steps can have different metrics!
• What are you responsible for reporting?

BEST PRACTICES
• Track only what you care about
• Be willing to re-‐evaluate not just goals, but metrics
• Have a plan to do so!
• Always have benchmark goals
• Set goals that will be met about half the >me
• Connect each person’s goal to the big picture

PUTTING PRINCIPLES INTO ACTION

HOW CAN THIS WORK FOR YOU?

Ques<ons

Addi<onal Resources

• Using Data to Support Partner Coordination • Thursday – 2:15PM – 3:15PM • Congressional A (Ballroom Level)
• What We Know & How We Learned It • Friday – 10:15AM – 11:45AM • Mt. Vernon B (Meeting Room Level)
• Know Your Numbers: How to Quantify Qualitative Data on Media Outreach
• Friday – 2:15PM – 3:15PM • Mt. Vernon A (Meeting Room Level)
Other Data & Analytics Workshops

• Getting Started with Google Docs • Friday – 10:15AM – 11:45AM
• Get Covered Data Interactive Demonstration • Thursday – 2:15PM – 3:15PM • Friday – 2:15PM – 3:15PM
Get Covered Academy Learning Lab Meeting Room 16
Data & Analytics Interactive Trainings
48
• Highly customized, ac<on-‐oriented • New suite of training services
• Goal-‐sehng • Planning • Coaching • In-‐person training
• FOR MORE INFO – [email protected]
New training resources