Embed Size (px)
Citation preview

Ruddlesden-Popper type phases in the Ln-Sr-Fe-O
(Ln = La, Nd; n = 3) system
Synthesis & Characterization
Junshan Li
Master Thesis in Materials, Energy and Nanotechnology
Faculty of Mathematics and Natural Sciences
UNIVERSITY OF OSLO
August 2013


I
Preface
This thesis is the review of my master work and experiments, as an essential part of a two-
year MSc program at the University of Oslo. The work was conducted from September 2011
to August 2013 under the NAFUMA (Nanostructure and Functional Materials) research group
at the center for Materials Science and Nanotechnology (SMN), Department of Chemistry.
Acknowledgments
Pursuing a MSc degree in Norway has proved a definite choice. Considerable support and
help have been given to make this research possible by those extraordinary people and I
cherish this precious opportunity to express my gratitude to them.
First, I would like to show my deepest gratitude to my supervisor prof. Helmer and prof. Anja
for their wonderful guidance, patience and support on the experiment as well as comments on
the thesis. I really benefited a lot in many aspects.
Here, I am also very grateful to these fantastic guys who are in the NAFUMA research group,
Chris, Pushpaka, Eirini, Per, Marius, Hanyan Song, Yang Hu and David for teaching and
helping me, and your advice was helpful especially when I was confused.
Many thanks, of course, I want to give to Sindre, Hanne, Østain, Ammun, Jon magnus and
Carla, it was so nice to share office and work with you. Your jokes, stories… made my life in
Norway more colorful.
I would like to thank all my friends who have made these two years of my life unforgettable.
Yet, most of all, I want to thank my parents and sister for their spiritual and financial support,
which ensure I can finish my study here. I still could feel their love and care even I was very
far away from home.
University of Oslo, Norway
22 August 2013

II

III
Abstract
In our modern society, the consumption and demand for energy is increasing rapidly. Fuel
cells (FCs) provide renewable energy by electrochemically converting chemical energy into
electrical energy and heat without direct combustion as an intermediate step. Solid oxide fuel
cells (SOFCs) have some advantages over other types of fuel cells. Here, the cathode
materials have a large impact on the performance of SOFCs. The Ruddlesden-Popper (RP)
types oxides, such as the RP3 phase Ln(Sr,Ca)3(Fe,Co)3O10, are promising cathode materials
due to their good mixed ionic and electronic conductivity (MIEC).
The objective of this master work has been to synthesize RP3 phase LnxSr4xFe3O10δ (Ln =
La, Nd; 0 < x < 4.0) via citric acid method. In addition, the investigation of the crystal
structure, thermal behavior and magnetic property of this RP3 type compounds represents a
main task.
A large number of compositions were attempted synthesized. The crystal structure of the RP3
products consists of a triple perovskite slabs separated by rock salt layer. A novel finding is
that certain compositions with 0 < x ≤ 1.0 are phase-pure, hence representing a heterovalent
substitution that simultaneously changes the average oxidation state for the iron atoms. The
unit cell parameters for the as-synthesized RP3 type compounds are consistent with a
tetragonal, space group I4/mmm and with dimensions a = b ≈ 3.85 Å, c ≈ 28.00 Å.
The main focus has been on samples with x = 1.0. Among the obtained phase-pure
compounds, LnSr3Fe3O10δ (Ln = La, Nd) was selected for preparing derivate materials
through tuning the concentration of oxygen vacancies (0 < δ < ~1.5), applying methods of full
oxidation at low temperatures, quenching and an oxygen-getter method.
Conventional powder X-ray (XRD) as well as Synchrotron radiation X-ray diffraction
(SRXRD) data were collected and used as input to Rietveld refinement in order to describe
the atomic arrangement of these oxygen deficient samples. The oxygen vacancies are located
to the equatorial layer of the central octahedra in the triple perovskite block. The length of the
c-axis varies linearly with oxygen vacancy concentration, increasing in length upon
decreasing the oxygen content. The Fe-O and La/Sr-O bond length and their bond valence
sum (BVS) calculated from the Rietveld refinement are evaluated and discussed to present
changes connected with oxygen deficiencies.

IV
Thermogravimetric analysis (TGA) was carried out from 30 oC to 1200
oC with a rate of 10
oC/min in air. For the oxidized samples, oxygen is lost upon heating. However, reintercalation
of oxygen occurs reversibly as a function of temperature. The oxygen deficient samples are
found to be kinetically stable until some 200 oC, thereafter followed by a dramatic oxygen
intercalation until 400 oC. Then a mass loss starts and continues up to elevated temperature of
1200 oC. Reversible weight gain is observed upon cooling due to oxygen intercalation.
The magnetization as a function of temperature (M(T)) and field (M(H)) was measured for
these two series compounds LnSr3Fe3O10δ (Ln = La, Nd). With different Fe state,
ferromagnetic and antiferromagnetic exchange interactions are present in LnSr3Fe3O10-δ and
hysteresis loop shows that this series compounds are of paramagnetic at high temperatures ,
and probably quite generally antiferro- or ferrimagnetic at 5K.

V
List of abbreviations
RP Ruddlesden-Popper phase
RPn Ruddlesden Popper phase with n perovskite layers alternating AO layer
FCs Fuel Cells
SOFCs Solid Oxide Fuel Cells
MLCCs Multi-Layer Ceramic Capacitors
MIEC Mixed Ionic and Electronic Conductor/Conductivity
HTS High Temperature Superconductor
LTS Low Temperature Superconductor
RT Room Temperature
TGA Thermogravimetric Analysis
XRD X-ray Diffraction
SRXRD Synchrotron Radiation X-ray Diffraction
D Dimension/Dimensional
HS High Spin
LS Low Spin
JT John-Teller
CD Charge Disproportionation
CO Charge Ordering
CN Coordination number
NPD Neutron Powder Diffraction
PM Paramagnetic
FM Ferromagnetic
AFM Anti-Ferromagnetic
SG Spin Glass
ap The dimension of a primitive perovskite cubic cell
VI
PPMS Physical Properties Measurement System
MPMS Magnetic Properties Measurement System
SNBL Swiss-Norwegian Beam Line
ESRF European Synchrotron Radiation Facility
TOPAS TOtal Pattern Analysis Solutions
GSAS General Structure Analysis System
FC Field Cooling
ZFC Zero Field Cooling
M(T) Magnetization as a function of temperature
M(H) Magnetization as a function of external applied field
χ Magnetic susceptibility
χ-1
Inverse magnetic susceptibility
ueff effective paramagnetic moment
B.M. Bohr magneton
A/B/X Atomic site/cation in Ruddlesden-Popper and perovskite
Ln Rare earth element
δ Overall oxygen nonstoichiometry per formula unit
10δ Overall oxygen content per formula unit
ICSD Inorganic Crystal Structure Database
SQUID Superconducting Quantum Interface Device

VII
Contents
Preface ......................................................................................................................................... I
Abstract .................................................................................................................................... III
List of abbreviations .................................................................................................................. V
Contents ................................................................................................................................... VII
Chapter 1 .................................................................................................................................... 1
Introduction and background ..................................................................................................... 1
1.1 Introduction to perovskite type compounds ..................................................................... 1
1.2 Perovskite related structures ............................................................................................. 5
1.2.1 Simple related perovskites ........................................................................................ 5
1.2.2 Layered perovskite related compounds ..................................................................... 6
1.3 Defective perovskites ....................................................................................................... 9
1.3.1 Background of defects ............................................................................................. 10
1.3.2 Thermodynamics of defects .................................................................................... 11
1.3.3 Defect situations in perovskite type compounds ..................................................... 12
1.4 Possible applications ...................................................................................................... 13
1.5 Literature review ............................................................................................................ 15
1.5.1 The structure of LnSr3Fe3O10δ ............................................................................... 15
1.5.2 The thermal investigation ........................................................................................ 19
1.5.3 The topotactics involving in the NdSr3Fe3O10δ (0 < δ ≤ 1.5) ............................... 21
1.5.4 Electrical properties ................................................................................................. 23
1.5.5 Magnetic properties ................................................................................................. 24
1.5.6 Other properties ....................................................................................................... 25
1.6 Objective of the thesis .................................................................................................... 25
Chapter 2 .................................................................................................................................. 27

VIII
Theory and methods ................................................................................................................. 27
2.1 Synthetic methods .......................................................................................................... 27
2.2 Large oxygen deficiencies .............................................................................................. 28
2.3 Phase identification and structure refinement ................................................................ 30
2.3.1 X-ray Diffraction ..................................................................................................... 30
2.3.2 Synchrotron Radiation X-ray Diffraction ............................................................... 33
2.3.3 Rietveld refinement ................................................................................................. 33
2.4 Cerimetric titration ......................................................................................................... 36
2.5 Thermal Analysis ........................................................................................................... 39
2.6 Magnetic properties ........................................................................................................ 40
Chapter 3 .................................................................................................................................. 44
Experimental ............................................................................................................................ 44
3.1 Synthetic experimental ................................................................................................... 44
3.1.1 Chemicals used in the experimental study .............................................................. 44
3.1.2 Pretreatment of rare earth oxides Ln2O3 (Ln = La and Nd) .................................... 46
3.1.3 Procedure for determination of formula weights .................................................... 46
3.1.4 Synthetic procedure ................................................................................................. 47
3.1.5 Preparation of oxygen deficient samples ................................................................ 48
3.2 Samples characterization ................................................................................................ 49
3.2.1 X-ray diffraction ...................................................................................................... 49
3.2.2 Thermogravimetric analysis .................................................................................... 50
3.2.3 Cerimetric titration .................................................................................................. 52
3.2.4 Magnetic properties ................................................................................................. 53
3.3 Errors and uncertainties .................................................................................................. 54
Chapter 4 .................................................................................................................................. 57
Results ...................................................................................................................................... 57
4.1 Synthesis ......................................................................................................................... 57
IX
4.1.1 Determination of formula weight of starting materials ........................................... 57
4.1.2 Synthesis conditions for LnxSr4xFe3O10δ (Ln = La, Nd) ....................................... 58
4.2 Tuning of oxygen content in LnSr3Fe3O10δ (Ln = La, Nd) ........................................... 65
4.2.1 Oxygen content of LnSr3Fe3O10δ (Ln = La, Nd) prepared by the full oxidation and
“quenching” method ......................................................................................................... 66
4.2.2 Oxygen content of LnSr3Fe3O10δ (Ln = La, Nd) prepared by Zr-reduction........... 67
4.2.3 Powder XRD for the series LnSr3Fe3O10δ (Ln = La, Nd) ...................................... 69
4.3 Crystal structure refinement ........................................................................................... 71
4.3.1 LnxSr4xFe3O10δ (Ln = La, Nd; 0 < x ≤ 1.0) series ................................................. 71
4.3.2 LnSr3Fe3O10δ (Ln = La, Nd; 0 < δ < 1.5) series ..................................................... 75
4.4 Thermogravimetric investigation ................................................................................... 90
4.5 Magnetic property .......................................................................................................... 93
4.5.1 LaSr3Fe3O10δ series ................................................................................................ 94
4.5.2 NdSr3Fe3O10δ series ............................................................................................... 99
Chapter 5 ................................................................................................................................ 104
Discussion .............................................................................................................................. 104
5.1 Synthesis ....................................................................................................................... 104
5.1.1 Preparation of LnxSr4xFe3O10δ (Ln = La, Nd) ..................................................... 104
5.1.2 Solid solution range for LnxSr4xFe3O10δ (Ln = La, Nd; x >1.0) ......................... 106
5.1.3 Comparison of synthesis condition LnxSr4–xFe3O10 (Ln = La; x = 1.0) ................ 107
5.2 Oxygen content ............................................................................................................ 109
5.2.1 Comparing oxygen content from cerimetric titration and TGA ............................ 109
5.2.2 Approaches of higher oxygen content ................................................................... 109
5.3 Rietveld refinement ...................................................................................................... 110
5.3.1 Crystal structure .................................................................................................... 110
5.3.2 Unit cell parameters of Less Ln–content than LnSr3Fe3O10–δ (Ln = La, Nd) ....... 112
5.3.3 Unit cell parameters of LnSr3Fe3O10–δ (Ln = La, Nd) ........................................... 112

X
5.4 Magnetic properties ...................................................................................................... 114
Chapter 6 ................................................................................................................................ 115
Conclusion .............................................................................................................................. 115
Chapter 7 ................................................................................................................................ 118
Perspectives ............................................................................................................................ 118
Reference ................................................................................................................................ 119
Appendix ................................................................................................................................ 125
A Temperature gradient in furnace used for Zr-reduction experiment ............................ 125
B Powder X-ray diffraction of gravimetrically determined chemicals ............................ 126
C Powder X-ray diffractorams of LnxSr4xFe3O10 (Ln = La, Nd; 0 < x < 4) ................... 127
C.1 LaSr3Fe3O10 prepared in air and Ar atmosphere ..................................................... 127
C.2 LaSr3Fe3O10 prepared at various conditions ............................................................ 128
C.3 La1.25Sr2.75Fe3O10 ..................................................................................................... 130
C.4 La1.5Sr2.5Fe3O10 prepared at various conditions ....................................................... 131
C.5 La2Sr2Fe3O10 prepared at various conditions ........................................................... 132
C.6 La3SrFe3O10 prepared at various conditions ............................................................ 133
C.7 NdSr3Fe3O10 prepared at various conditions ........................................................... 134
C.8 Nd1.25Sr2.75Fe3O10 prepared at various conditions ................................................... 135
C.9 Nd2Sr2Fe3O10 prepared at various conditions .......................................................... 136
C.10 Nd3SrFe3O10 prepared at various conditions ......................................................... 137
D Calculations for determining of oxygen content with temperature .............................. 138
E Calculation of oxygen content of reduced LnSr3Fe3O10 (Ln = La, Nd) via
thermogravimetric analysis ................................................................................................ 139
F Calculations of cerimetric titration .............................................................................. 140

XI
路漫漫其修远兮,吾将上下而求索。
Endless is the truth, we shall spare no pains to seek and explore.


Chapter 1 Introduction and background Junshan Li
1
Chapter 1
Introduction and background
Perovskite type compounds and related structures, represent a large family of important
inorganic materials, which have been widely used in industry and comprehensively studied in
laboratory due to their wide variation of useful and also exotic properties. The Ruddlessden-
Popper type oxides, have a kind of layered perovskite crystal structure, and they show
frequently intriguing physical properties. Both these categories of oxides are heavily studied
in the NAFUMA research group at the Department of Chemistry, University of Oslo.
Introducing provskite to chemists, as a master student, is a bit like introducing the Moonlight
Sonata to Beethoven. However, for interested readers, comprehensive textbooks of depth to
pervoskite and its related structures by Mitchell [1], Francis S [2], Alexandra Navrotsky [3]
and Maxim Borowski [4] etc. are available.
Here, the first chapter presents a general introduction to the perovskite and related types of
materials, including descriptions of cation substitutions and oxygen deficiency. Some
technical applications of RP3 (Ln-Sr-M-O) phase oxide, a short literature review and the
objective of this work will be illustrated thereafter.
1.1 Introduction to perovskite type compounds
The mineral perovskite, was named after a Russian mineralogist Count Lev Provski Von, who
firstly discovered it in Ural Mountains in 1839 [5]. Then the term perovskite was used to
describe a class of compounds sharing the same general stoichiometry and connectivity with
CaTiO3 [6], which was the first synthesized perovskite by Goldschmidt in 1926 at the
University of Oslo.
As a versatile inorganic structure, the perovskite structure has the general formula ABX3 with
stoichiometry of 1:1:3, nearly all the stable elements in the periodic table has been studied in
the perovskite framework [7]. As shown in Figure 1, A is an alkali, alkaline earth metal or

August 2013 Chapter 1 Introduction and background
2
rare-earth metal element, B is usually a transition metal element, while X is an anion such as
F, Cl, Br, I and even H, etc. but usually O.
Figure 1. Survey of the chemical elements that are known to be in the A, B and X site [7]
The perovskite structure was established in 1945 by Helen Dick Mcgaw, the Irish
crystallographer, who along with her colleagues systematically studied the structure of
BaTiO3 [8] and determined symmetry and unit cell parameters [9].
Figure 2. The 3D structure of ideal perovskite. Grey: A, Green: B, Red: X
As a matter of fact, there are many ways of presenting the structure of perovskite with A-, B-,
and X- cell setting (referring to A-, B-, and X-site atom situated at the origin of the unit cell,

Chapter 1 Introduction and background Junshan Li
3
respectively). The structure of perovskite is shown in Figure 2 (A-cell setting), the ideal
structure of which is cubic with the space group of Pm-3m. As can be seen from Figure 2, in
the structure, (the grey) A cation accommodates the eight corners of the unit cell and B is
located in the center of the structure (the green one), while the X cation is situated on the face-
centered position (the red one), which is a bridging point, linking two BX6 octahedra. Their
equivalent relative coordinates of the atoms are detailed in Table 1, the size of the X atom
ought to be as large as that of A atom. Thus, in the finite 3D structure, it is a network of
corner-linked octahedra, with the small cation filling the octahedral holes and the large cation
filling the dodecahedral holes.
Table 1. Atomic positions in cubic pervoskite
Site Wyckoff Position Co-ordinates
A 1a (0, 0, 0)
B 1b (1/2, 1/2, 1/2)
X 3d (1/2, 0, 0) (0, 1/2, 0) (0, 0, 1/2)
Until now, just a few compounds of ideal cubic structure were found. Based on the known
compounds of perovskite, Mcgaw and her colleagues pointed out that ion size difference
between A and B atoms may lead to distorted structures [10]. Years earlier, Goldschmidt, at
the University of Oslo, introduced the tolerance factor “t”, which is an indicator for the
stability and distortion of crystal structures [11], and this pioneering work provided a basis for
the further exploration of the structure of the perovskite family.
√ Equation 1
where, is the sum of the A and X ionic radii
is the sum of the B and X ionic radii
Note that the Equation 1 is applicable at certain temperature and pressure to the empirical
ionic radii and the limiting values for the tolerance factor have been determined by
experiment. In most cases, perovskite type structures are distorted from the ideal cubic
symmetry [12].

August 2013 Chapter 1 Introduction and background
4
Since perovskites are not truly ionic compounds and the t values also depend on what values
are taken for the ionic radii, the tolerance factor is only a rough estimate [13]. The tolerance
factor and its distorted structure and examples are briefly illustrated in Table 2, it should be
pointed out that such an analysis works better for 2+, 4+ perovskites than for the 3+, 3+
perovskites [14].
Table 2. Tolerance factor and its structure and examples [1, 15]
Tolerance factor Possible structure Examples
> 1 Hexagonal/rhombohedral BaFeO3
0.95 ~ 1.0 Cubic BaTiO3/CaTiO3
0.75 ~ 0.9 Orthorhombic GdFeO3
< 0.75 Other structures Ilmenite, FeTiO3
In general, t is unity for ideal structure, however, many compounds have been found to adopt
perovskite structure of lower symmetry for the value 0.75 < t < 1.13 (this limiting value
varies). It is noticeable that this value is not applicable for every case, e.g. MgTiO3 with t =
0.81 as reported, shows ilmenite type structure for which the value of the A site ion is smaller
than ideal, and the TiO6 octahedra will tilt in order to fill space [1].
If tolerance factor less than 0.9, the B-X bonds are under a compressive strain causing the
BX6 octahedron to rotate, tilt or expand, in order to adopt an orthorhombic type structure (e.g.
PbZrO3, CaFeO3x). A series of notation developed by Glazer [16] to describe octahedral
tilting distortions in perovskite has become popular. The Glazer notation is used to specifying
the rotations of the octahedral about each of the three Cartesian axes [17].
If the t-value drops below 0.75, the compound can adopt a hexagonal ilmenite type structure
for A and B ion have the similar radii. e.g. FeTiO3 (t = 0.723, where
) adopts the ilmenite type structure at low pressures [18]. This
compound is an extremely distorted perovskite derived from archetypal structure and then is
not a stable perovskite type structure because of extensive polyhedral rotation [1].

Chapter 1 Introduction and background Junshan Li
5
On the basis of the tolerance factor v, if t is larger than 1(usually1 < t < 1.13), the BX6
octahedra are stretched from B-X bond lengths, making the B site cations distort to create
spaces for the B cations to move from the center, thereby resulting in
hexagonal/rhombohedral type structure. e.g. BaFeO3, PbTiO3 [19].
The distortions of perovskite type structures are not only determined by the value t, but also
influenced by the degree of covalency, metal-metal interaction, Jahn-Teller distortion and the
lone pairs on the A cations [1]. It is rare that the distortion can be assigned to a single effect,
in other words, several factors interact on the space group and structure adopted [1]. BaTiO3,
widely used in the Multi-Layer Ceramic Capacitors (MLCCs) due to its excellent dielectricity,
is such a good example for which has five phase existing, hexagonal, cubic, tetragonal,
orthorhombic, and rhombohedral from high to low temperatures [20, 21].
In addition, such structural deformations in the perovskite type compounds may give an
enlargement of the cubic cells to the presence of super ones [22]. These distortions have some
specific effects on the properties, especially on the magnetic property. The spin alignment of
magnetic cations and its ordering would be influenced by the Jahn-Teller (JT) deformations,
charge disproportionation (CD) with charge ordering (CO) [15, 17].
1.2 Perovskite related structures
There exists a large number of structures that are related to the perovskite type, due to the
compositional versatility of the ABX3δ structures. These related perovskite phases range
from anti-/ hybrid perovskites to intergrowth of perovskites.
Since the classification to the related perovskite type structures is out of the main aim of this
thesis, only some examples are sorted into different groups with similarity.
1.2.1 Simple related perovskites
Here, some examples are given to demonstrate the simple perovskite phases according to
textbook [1].
August 2013 Chapter 1 Introduction and background
6
Briefly, A1+
B5+
O3, A2+
B4+
O3 and A3+
B3+
O3 are the simple examples of perovskite type,
while A(B1-xBx)O3, (A1-xAx)BO3, (A1-xAx)(B1-yBy)O3 are the complicated ones,
i.e. representing solid solution derivatives.
BAX3 inverse perovskite: this kind of structure contains Li+
ion and alkaline earth
elements, EuLiH3 and BaLiH3 were the first discovered ones, in this kind of structure,
Li+ is located at the center of LiF6 polyhedron.
Anti-perovskite structure, A3BX or XBA3 perovskite inversely with the general
composition ABX3 where the anion occupies the center of the octahedra, Na3OCl [23],
Ga3GeO [24] etc. belong to such kind of structures.
AB3X or AXB3 Anti-perovskite: this structure of which can be regarded as the
derivatives of AuCu3, the network links by sharing the Cu6 octahedrals while the Au
locates in the cubo-octahedral holes, so this compound can be written as □AuCu3,
where □ donates the A site. E.g GaSc3C belongs to this structure.
1.2.2 Layered perovskite related compounds
There exist a large number of perovskite-related compounds beyond the distorted derivatives
described above. If perovskite structure elements are separated by rock salt layer,
superstructures will be formed. The compounds of this type structure are called layered
perovskites. Layered perovskites consist of infinite 2D slabs of ABX3 type structure which are
separated by certain motif. The two differentiating characteristics for the layered perovskites
are 1) the motif separating the layers, and 2) the offsetting of the layers from each other. In
this case, three widely studied structure families are found and usually named after their first
researchers.
The general formula of these three phases is as follows:
The Ruddlesden–Popper phase (A’X)(ABX3)n
The Dion–Jacobson phase A’(An-1BnX3n+1)
The Aurivillius phase (A’2X2)(An-1BnX3n+1)
Where n indicates the size of the 2D slabs, e.g. n = 1 means the slab is one BX6 octahedron
thick. n = 2 presents two BX6 octahedral thick, etc.

Chapter 1 Introduction and background Junshan Li
7
Figure 3 shows the structure (n = 3) for each of these three variants.
Figure 3. Schematic crystal structures of layered perovskites, n = 3 [25]. (a) Ruddlesden–Popper
phase. (b) Dion–Jacobson phase. (c) Aurivillius phase.
1.2.2.1 Aurivillius type of compounds
The (Bi2)(An1BnX3n+3) series of related perovskites named after Aurivillius who first
introduced this structure in 1949 for discovering Bi4Ti3O12 (n = 3) [26]. The compounds are
structurally related to Dion-Jacobson (DJ) and Ruddlesden-Popper (RP) phases and to
emphasize the relationship the formula is better to expressed as (Bi2O2)(An1BnX3n+1), where n
indicates the perovskite-like slabs in thickness with (Bi2O2) sheet occupying the inter-slab
regions [1]. Simple and coupled cation substitution in this structure might involve at: the B-
site by Ti, Nb, Ta, Fe, W, Mo, Ga and Cr, the cubooctahedral site of the perovskite slab by Bi,
Ba, Sr, K etc. The replacement of anion by halogens is synthesized to a limited extent.

August 2013 Chapter 1 Introduction and background
8
Numerous Aurivillius phases (n = 1~8) have layers defined by Bi2O2, and substitution of Bi
by Pb, Tl, Sb and Sn in the separating layer has been reported [27].
1.2.2.2 Dion–Jacobson type of compounds
In the Dion-Jacobson phase, with general formula of A’(An1BnX3n+1), where the
(An1BnX3n+1) term represents the common unit of 2D perovskite slabs. A usually
accommodates alkaline earth or rear earth elements and B site is typically occupied by some
transition metals. This type of superstructure, which consists of n perovskite-like layers with a
monovalent cation A’ occupying the interlayer space, was firstly discovered by Dion [28] and
then Jacobson [29] developed its range by introducing the number “n” of the stacked
perovskite unit cells. Compouds with n values of 2 to 7 have been synthesized [30]. This type
compounds have been intensively studied because of their interesting ionic, ion-exchange,
intercalation and luminescence properties.
1.2.2.3 Ruddlesden–Popper type of compounds
Ruddlesden and Popper investigated the structure of Sr3Ti2O7 (n = 2) [31] and Sr4Ti3O10 (n =
3) [32] in 1958, although the n = 1 of this series (K2NiF4 [33]) has been reported years earlier.
Similar to Aurivillius phases, Ruddlesden-Popper (RP) phase has the separating rock salt
layer with A/B ration of 1:1. However in RP phases, the unity A/B ratio is preserved within
the perovskite slabs, the total cation to anion ratio is smaller and its general formula is
An+1BnX3n+1. In this formula, “n” indicates the size of the 2D corner-sharing slabs that are
stacked along c axis. For these phases, A and B are the cations, the separating motif is a rock
salt layer of AX and the “n” perovskite slabs (ABX3)n are offset by a (1/2, 1/2) translation
along a and b axis. It is possible, and perhaps another way to think Ruddlesden Popper phases
as A2(An-1BnO3n+1), where the separating motif is a layer of A2 and the perovskite slabs
(An1BnX3n+1) are also offset by a (1/2, 1/2) displacement.
For the RP phases, the A site contains usually alkaline earth or lanthanide, Y, Bi
etc…whereas 3d and 4d transition metal elements accommodate on the B site, some elements
like group XIII and XIV and even carbonates have been reported. As displayed in Figure 4, it
illustrates the crystal structure of RP (n = 1, 2, 3, respectively) phases in comparison with the
ideal cubic perovskite, which can be regarded as the RP∞ phase.

Chapter 1 Introduction and background Junshan Li
9
Figure 4. Crystal structure of An+1BnO3n+1 Ruddlesden-Popper phase oxide [34]. (a)n = 1, RP1
phase, e.g. Sr2TiO4. (b)n = 2, RP2 phase, e.g. Sr3Ti2O7. (c) n = 3, RP3 phase, e.g. Sr4Ti3O10. (d) n
= ∞, ideal perovskite, e.g. SrTiO3.
Since the first discovery of RP phases, a very large number of RP compounds have been
synthesized. Until now, most of RP phases are for n = 1, 2, 3, but also some of higher
ordering number (n = 4, 5, 6 ……) [35] have been reported.
These three categories of RP-phases exhibit higher flexibility in terms of oxygen content and
cation composition. As such they are promising candidates for studying the effect of cation
composition and oxygen content on various physical properties.
1.3 Defective perovskites
The ideal crystalline solids repeat the specific position of atoms or molecules in 3D structures
at fixed distances, which are determined by the unit cell parameters. As a matter of fact, it is

August 2013 Chapter 1 Introduction and background
10
impossible to find a perfect crystal theoretically above 0 K, which means that the arrangement
of atoms or molecules is not in perfect repeatment, and then it comes to the term “defect”.
As stars make our universe more beautiful, defects are the star to make the “whole materials”
have fantastic properties. Many of them, such as electronic or ionic conductivity, the color,
the luminescence, and the magnetic susceptibility may be determined to larger or less extent
by the presence of defects [36].
1.3.1 Background of defects
In a wide sense, defects can be either stoichiometric or non-stoichiometric. The former one
means the defect in the crystal lattice which does not change or have any effect on the
molecular formula of the crystal while non-stoichiometric defects affects the ratio of cation to
anion which then becomes different from that indicated by the ideal chemical formula.
According to the dimensionality of the defects, they can be classified as point defects, line
defects, planar defects as well as bulk/volume defects.
Point defects can only occur at or around a single position in a structure, which can be a
vacancy, an electron, an interstitial atom or a substitutional atom, typically these defects
involves a few atoms or vacancies as a “single point”. Kröger and Vink developed a notation
to describe the charge, electron, vacancy and lattice point for point defect species in a crystal
[36] as shown in Table 3.
Table 3. Kröger-Vink notation
Defects Notation
Defect electron
Electron hole
Hole/vacancy V
Interstitial site i
Neutral charge ×
Elements defect Element itself

Chapter 1 Introduction and background Junshan Li
11
By using the above notations, it is particularly useful to describing various defect reactions in
crystals. Additionally, one more notation should be defined:
where, M corresponds to the species, which can be atoms, vacancies, electrons, or electron
holes; S illustrates the lattice site that the species occupies; C is the electronic charge of the
species relative to the site that occupies.
As can be imagined, a number of zero dimensional point defects can compose 1D line defects
and 2D planar defects, further 3D defects maybe formed. All the above-mentioned defects
may exist simultaneously in any crystal compounds.
1.3.2 Thermodynamics of defects
In thermodynamics, the existence of defects with a specific concentration will result in an
increase of enthalpy and a reduction of Gibbs free energy, in other words, it take energy to
create defects in crystals.
The thermodynamics of defects are closely related to the thermodynamic of basic chemical
reactions and can be explained through Gibbs free energy equation:
Equation 2
In a chemical reaction, the energy of forming defects in solids can be treated in a statistical
way. As specified in defect chemistry, there are two types of entropy, and ,
which describles the vibrational and configurational entropy respectively. If nv mole
vacancies are formed in a solid, the total change of the enthalpy is . Thus, the total
Gibbs energy of formation numbers of nv new sites is:
( ) Equation 3
where the total configurational entropy can be calculated by thermodynamic probability W:
Equation 4
W describes the nv vacancies distributing on all the possible sites of , in the
mathematical way, which gives:

August 2013 Chapter 1 Introduction and background
12
( )
Equation 5
By using Stirling’s approximation ( for ), Equation 4 can be simplified
as:
(
) Equation 6
At equilibrium, the derivative of Equation 3 by nv should be zero, combining Equations 5
and 6 gives:
( )
Equation 7
The term
, expressing the concentration of the vacancies in the crystal lattice, is as a
function of the enthalpy change, the vibrational entropy and temperature. Thus the expression
of the vacancy concentration gives:
(
) Equation 8
is the equilibrium constant in the vacancy formation reaction.
1.3.3 Defect situations in perovskite type compounds
Solid solution of aliovalent impurities and deviations from stoichiometry lead to the presence
of point defects in crystalline inorganic compounds [37]. As a compound of perovskite
structure, besides the radii requirements, another condition should also be fulfilled is
electroneutrality [22], e.g. the sum of charge of A and B equals to the total charge of X anion
in perovskite, this can be obtained in, such as Aa+
Bb+
O3 (a + b = 6) as presented in section 1.2.
Because of the large accommodation and substitution of the anions, a little bit more or less
partial substitution of A and B site ion are allowed, which lead to a deficiency in the
compound but preserving the perovskite structure. Generally speaking, nonstoichometry in
perovkites can arise from A-/B-cation sites deficiency or O-anion site deficiency and excess.
This kind of defects is comprehensively discussed in several reviews[38] and books [39].
In most cases, the oxygen defects are more common than that of cationic ones. For the oxygen
defects in provskite structure, the oxygen vacancies are nonstoichometry is more common
than the oxygen excess nonstoichometry for the latter one would introduce interstitial oxygen

Chapter 1 Introduction and background Junshan Li
13
on the A-/B- sites in this structure is thermodynamically unfavorable. Some compounds have
oxygen excess in the structure, for instance LaMnO3+δ, which is well exemplified. Tofield et
al. [40] reported that a proved composition of LaMnO3.12, the Neutron diffraction shows that
the oxygen do not enter the A-/B- sites, while the O-sublattice remains perfect. Thus the real
chemical formula can be written as La0.94□0.06Mn0.98□0.02O3 (where □ indicates cation
vacancies). The interstitial oxygen atoms enter into RP3 phase e.g. La4Co3O10 within LaO
rock salt layer [41, 42].
In many circumstances, the oxygen vacancies can be found in perovskite and related
perovskite type phases. Bringley et al. [43] has synthesized a stable LaCuO3δ over a large
oxygen vacancy range of 0 < δ < 0.5. In RP oxides, an oxygen deficiency was found in many
cases. Lee et al. [44]
reported that the LaSr3Fe3O10δ sample is able to adopt a large amount of
oxygen vacancies (δ~0.8 per formula unit) in central perovskite slabs of the crystal structure
without any degradation.
Cation nonstoichometry can be achieved by oxygen excess, which means that the structure is
in oxygen deficiency [7]. B-site vacancies are not common, for which are not
thermodynamically favored because of the small size and large charge of B ion. These
vacancies are available among h-h (hexagonal stacking layers of AO3) layers, where the BO6
octahedra share faces. On the contrary, A-site vacancies are exhibited in some perovskites,
where large A ion can be partially missing for the BO3 that forms a stable network. The RO3
type structure is the limiting case of A-site vacancies.
1.4 Possible applications
Since perovskite structure can accommodate a wide variety of ions, this type compounds have
various technologically applicable properties, dependent on the composition, defects and
structural distortions. This makes them to be widely used in diverse fields, such as
dielectricity, ionic conductivity, superconductivity, magnetism, luminescence, photocatalys,
catalysis etc.
RP-type oxides, exhibiting ion conduction, electronic conduction and catalysis, are very
promising for the use in many electrochemical applications. For instance, they are currently
used as cathode materials for Solid Oxide Fuel Cells (SOFCs) [45] and oxygen separation

August 2013 Chapter 1 Introduction and background
14
membrane [46, 47]. What’s more, these RP family compounds have been extensively
investigated for the new potential applications such as high temperature superconductivity
(HTS) [48] or colossal magnetoresistance (CMR) [49].
In the following paragraphs, one possible application of this kind of RP3 phase oxide will be
demonstrated.
Figure 5. Schematic of Hydrogen-Oxygen Fuel Cells [50]
Figure 5 demonstrates the schematic of the Hydrogen-Oxygen Fuel Cell, the procedure of
which is as follows:
Hydrogen gas is splited into protons and electrons on the anode side after it goes
through the channel of the flow field plate.
The electrons travel through the external circuit to the cathode, at the same time, and
the protons travel through the proton exchange membrane and arrive at the cathode,
forming the electrical current of the cell.
The hydrogen protons and electrons are caused by the catalyst at the cathode side to
combine with oxygen to form water vapor.

Chapter 1 Introduction and background Junshan Li
15
The RP series of intergrowth oxides are found to be able to demonstrate this role for they are
good Mixed Ionic and Electronic conductors (MIECs), such as high electronic and oxide-ion
conductivities and good structural and chemical stabilities at intermediate operating
temperatures (500 oC - 800
oC) and under low or high oxygen partial pressures. In addition to
the requirements to the cathode materials function as the cathode site for the electrochemical
reduction of oxygen in SOFCs were comprehensively documented [51, 52]. The MIEC oxides
for SOFCs, including the series of RP phase oxides, have been fully investigated in a few
reviews [34, 44, 51, 53, 54] etc.
1.5 Literature review
Since Ruddlesden and Popper discovered the RP materials, the Ln-Sr-M-O (M = Fe, Co, Mn,
Al…) systems have attracted increasing attentions. However, RP3 phases are less investigated,
compared with RP1 and RP2 compounds. Thanks to many research groups all over the world,
the results (structure, electric and magnetic properties) and possible applications of this series
of interesting oxide have been studied using both classical and new methods of synthesis and
characterization. These studies have been carried out independently by each group with
certain aspects of their interests.
After a comprehensive search of the related literatures, a short summary of the earlier study of
Ln-Sr-M-O and its related oxygen deficient oxides relating to my investigation will be made.
This section focuses on the crystal structures, physical properties with respect to the materials
in this work.
1.5.1 The structure of LnSr3Fe3O10δ
Undistorted A4B3O10 Ruddlesden-Popper compounds with n = 3 adopt the space group of
aristotype I4/mmm, e.g. Sr4Fe3O10 [32], as the parent structure, is such an example. Numerous
structures have been derived from this RP3 patent compounds by the replacement of Ti with
lower valent transition metals (e.g. Fe, Co) and charge compensation by higher valent ions on
the A site. Thus, this derived series of compounds with n = 3 have not been extensively
studied. Brisi et al. [55] investigated the Sr-Fe-O system and reported an oxygen deficient
Sr4Fe3O10δ, which has the oxygen vacancies to charge compensation for substitution of Ti4+
by lower variable valence Fe ion.

August 2013 Chapter 1 Introduction and background
16
Lee et al. [56] has investigated the crystal chemistry of LaSr3(Fe,Al)3O10δ with δ < 0.8 in the
phase LaSr3Fe3O10δ.
Figure 6. Crystal structure and their atom sites in the structure for LnSr3Fe3O10δ series (Ln =
La, Nd). (a) Crystal structure of LaSr3Fe3O10δ (δ < 0.8), the oxygen atoms at the front side of the
octahedral sites (O1 and O4) are omitted for simplicity in the expanded view [53]. (b) Crystal
structure and their atom sites in the structure of NdSr3Fe3O9 [57].
The crystal structure of LaSr3Fe3O10δ, as illustrated in Figure 6, consists of a triple layer of
La/Sr-Fe-O octahedral separated by La/Sr-O layers. The sample is able to adopt a large
amount of oxygen vacancies (0.1 < δ < 0.8) in the lattice without any structural degradation
[56]. From the Rietveld refinement of neutron powder diffraction in addition to the X-ray
study, the oxygen vacancies have been found to be localized on the central FeO6 octahedral
with three consecutive FeO6 octahedral along the c axis, corresponding to the O2 and O4 sites
in Figure 6.a. With the decreasing oxygen stoichiometry, the value of c-axis parameter shows
a linear increase from 28.04 Å for the phase LaSr3Fe3O9.9 to 28.52 Å for the phase containing
9.2 oxygen atoms, while a and b parameter nearly stay stable at 3.87 Å [56]. The atomic
coordinates for this RP3 phase (LaSr3Fe3O9.9) are illustrated in Table 4.

Chapter 1 Introduction and background Junshan Li
17
Table 4. Atomic coordinates for LaSr3Fe3O10δ refinement
Site Multiplicity Wyckoff Atom OX X Y Z Occupancy
A1 4 e La La+3 0 0 0.569 0.25
A1 4 e Sr Sr+2 0 0 0.569 0.75
A2 4 e La La+3 0 0 0.701 0.25
A2 4 e Sr Sr+2 0 0 0.701 0.75
B1 2 a Fe Fe+3.67 0 0 0 1
B2 4 e Fe Fe+3.67 0 0 0.139 1
O1 8 g O O-2 0 0.5 0.138 1
O2 4 e O O-2 0 0 0.069 1
O3 4 e O O-2 0 0 0.211 1
O4 4 c O O-2 0 0.5 0 0.97
Moreover, in this series, the possibility of higher oxygen deficiency was demonstrated in
NdSr3Fe3O9 [57]. In this compound, the atomic coordinates (see Table 5) is illustrated as
Bbmm space group with the unit cell parameters a = 5.54 Å, b = 5.50 Å and c = 28.81 Å
respectively.
Table 5. Atomic coordinates for NdSr3Fe3O9
Site Multiplicity Wyckoff Atom OX X Y Z Occupancy
A1 8 g Nd Nd+3 -0.253 0.75 0.203 0.25
A1 8 g Sr Sr+2 -0.253 0.75 0.203 0.75
A2 8 g Nd Nd+3 -0.242 0.75 0.078 0.25
A2 8 g Sr Sr+2 -0.242 0.75 0.078 0.75
B1 8 g Fe Fe+3 0.251 0.75 0.145 1
B2 4 e Fe Fe+3 0.306 0.75 0 1
O1 8 e O O-2 0 0.5 0.139 1
O2 8 e O O-2 0.5 1 0.135 1
O3 8 g O O-2 0.258 0.75 0.214 1
O4 8 g O O-2 0.213 0.75 0.058 1
O5 8 c O O-2 0.378 0.127 0 0.5
As shown in Figure 6.b, the crystal structure can be described as an intergrowth of a
brownmillerite-type layer (Sr2Fe2O5) and a K2NiF4-type layer (NdSrFe3O4) along the c-axis

August 2013 Chapter 1 Introduction and background
18
direction. The resulting Fe3O9 framework is built of a central sheet of parallel chains of FeO4
tetrahedral and parallel rows of oxygen running along b axis. In this way, this compound can
be considered as an ordered oxygen-deficient RP3 phase with the formula of NdSr3Fe3O9□,
where □ represents the one oxygen vacancies per formula unit. This tetrahedral sheet is
sandwiched between two octahedral FeO3 perovskite-like slabs. Along c axis, two successive
Fe3O9 blocks are offset by (1/2, 1/2) translation in the direction of a and b axis as viewed in
the RP3 phase.
Figure 7. Variations of the unit cell volumes, Fe-O bond length and O-(Fe2/Co2)-O bond angles
in the various Ln(Sr,Ca)3(Fe,Co)3O10 phases [44]. LaSr3Fe3O10 (LSF) and NdSr3Fe3O10 (NSF).
Figure 7 was plotted with the (Fe,Co)-O bond lengths, calculated from the Rietveld
refinement. The equatorial (Fe1/Co1)-O4 and (Fe2/Co2)-O1 bond lengths in the series show
close values in the range of 1.91~1.94 Å. However, the apical (Fe, Co)1-O bond length is
strongly influence by the different chemical compositions and oxygen stoichiometry of the
sample [44].

Chapter 1 Introduction and background Junshan Li
19
1.5.2 The thermal investigation
Figure 8. TG/DTA of the gels with nominal compositions LaSr3Fe3O10 [58]
As displayed in Figure 8, Velinov et al. [58] presented the TG and DTA curves of the gel of
the RP (La-Sr-Fe-O system with n = 1, 2, 3 using citric acid method) oxide. The measurement
was conducted with 10oC/min in the temperature range 15
oC and 1000
oC after preheat
treatment being dried at 200oC for 2h. The initial weight loss occurs at about 200
oC due to the
removal of the water. A more significant loss of weight is observed after 300 o
C due to a
stepwise burning out of the organic matter in the gel. With the increasing temperature, a
strong endothermic effect appears at around 700 o
C mainly because of the formation of
perovskite phase, no obvious weight loss and thermal effects in the sample were involved.
The thermogravimetric analysis of solid solution LnSr3M3O10 (Ln = La, Nd, Gd; M = Fe, Co)
is conducted under different atmosphere by several research groups, as displayed in Figure 9.

August 2013 Chapter 1 Introduction and background
20
Figure 9. Thermal analysis of Ln-Sr-M-O (RP3) phase.(a)TG and DTA of LaSr3Fe3O10δ [59]. (b)
TGA plots of Ln(Sr,Ca)3(Fe,Co)3O10δ 3oC/min from RT to 900
oC, in air [44].
As shown in Figure 9, the thermal analysis of Ln-Sr-M-O RP3 compounds shows that the
oxygen losses begin between 300oC to 400
oC upon heating and continue loss lattice oxygen
at elevated temperatures, reaching different values at maximum temperature conducted.
Figure 10. Oxygen content as a function of temperature [56]. (a) Plot of oxygen content of the
sample calculated from the thermogravimetric data of LaSr3Fe3O9.45 in air. (b) The variation of
oxygen content with temperature for fully oxidized LaSr3Fe3O10δ.
For oxygen deficient compound LaSr3Fe3O9.45, as displayed in Figure 10.a, the
thermogravimetric curves show that oxygen is reversibly lost and reintercalated upon heating
and cooling. Lee et al. [56] in his article, reported the variations of oxygen stoichiometry in
air as a function of temperature for LaSr3Fe3O10δ. Figure 10.b shows the oxygen content per

Chapter 1 Introduction and background Junshan Li
21
formula unit as a function of quenching temperature. The fully oxidized with a oxygen
stoichiometry of O9.9 and then cooled down to and kept at the temperature ranging from 500
oC to 1000
oC with a interval of 100
oC for 4 hours and then quenched into liquid N2
immediately and directly.
Armstrong et al. [60] performed this series samples under different atmosphere, showing that
all this series has larger oxygen deficiency in N2 than that of air when the oxygen begin to
loss upon heating, by calculating from the TGA data.
1.5.3 The topotactics involving in the NdSr3Fe3O10δ (0 < δ ≤ 1.5)
Stabilization is an important issue for any solid materials. From previous study, the RP phase
oxides are somewhat unstable in presence of water, O2 and CO2. Some reviews are available
to demonstrate this property.
Figure 11. XRD of NdSr3Fe3O8.5 in the air as a function of time [57]
Pelloquin et al. [57] synthesized Nd-Sr-Fe-O phase and obtained high oxygen deficient, RP3
ferrite, with nominal composition of NdSr3Fe3O8.5. The XRD shows this reactivity is very
quick as shown in Figure 11 by the growth of a peak at 2θ~5.5o.

August 2013 Chapter 1 Introduction and background
22
Figure 12. The different phases of the NdSr3Fe3O8.5 dehydrooxylation mechanism involved [57].
(a) Experimental XRD pattern of different phases. (b) Structural mechanism and stacking mode
of the different phases. Water molecules and hydroxyl groups are idealized as black and gray
circles, respectively.
Figure 13. TGA pattern of the oxy-hydroxyl hydrate NdSr3Fe3O7.5(OH)2·H2O collected under
nitrogen flow [57].

Chapter 1 Introduction and background Junshan Li
23
This highly oxygen deficient (n = 3) RP phase reacts at room temperature in the presences of
humidity (H2O) and transforms into a layered oxyhydroxide NdSr3Fe3O7.5(OH)2·H2O, in
which no carbonates have been found. The X-ray powder diffraction (as shown in Figure 12)
and the thermogravimetric analysis (as displayed in Figure 13) show a second phase of which
can be dehydrated topotactically by hearing to 250 o
C, giving rise to first NdSr3Fe3O7.5(OH)2
at around 90 oC. Then followed by NdSr3Fe3O8.5, a second water molecule departure at about
250 oC, suggesting that a dehydrooxylation mechanism is involved.
For the homologous series Srn+1FenO3n+1 RP phase oxide, Lehtimaki et al. [61] investigated
their tendency to accept additional layers of water in their crystals. In the paper, it is revealed
that the RP1, 2, 3 phase readily accommodate one or two layers of water between the adjacent
SrO layers while SrFeO3 remains intact in the presence of water because of lacking the
SrOSrO double layers. When increasing the layers, the water intercalation is found to
decrease.
1.5.4 Electrical properties
There are many literatures reports demonstrating the electrical properties of the RP-series of
compound.
Figure 14. Temperature dependence of the total conductivity of (La,Sr)n+1FenO3n+1 series.
(a)Conductivity of LaSrFeO4, La2SrFe2O7 and LaSr3Fe3O10 samples [58]. (b)Conductivity of
La3SrFe3O10δ under different atmosphere.
August 2013 Chapter 1 Introduction and background
24
Velinov et al. [58] measured the total conductivity of (La,Sr)n+1FenO3n+1 (n = 1, 2, 3) as
displayed in Figure 14.a. At the temperatures over 140 oC, it shows that the triple layered
LaSr3Fe3O10 perovskite, reaching its maximum of 58 S/m at 580 oC over the range 140
oC and
800 o
C. The conductivity of triple layered phase is not only significantly higher than that of
the single and double layered compounds, but also possess potentially applicable mixed ion
conductivity and catalytic activity. The macrostructure of these compounds was investigated
by Scanning Electric Microscopy (SEM), a uniform distribution and size of the grains and
pores was observed in LaSrFeO4 and La3SrFe3O10 compounds.
As displayed in Figure 14.b, the temperature dependent conductivity of RP3 phase oxide
(LaSr3Fe3O10δ) was measured by Cui et al. [62] under air, O2 and N2 atmosphere between
200 o
C and 800 o
C. It is revealed that a semi-conductor metal transition behavior due to the
significant amount oxygen loss at high temperatures, the conductivity increased gradually
before reached its maximum at around 400 o
C, followed by a stable decrease when elevating
the temperature.
1.5.5 Magnetic properties
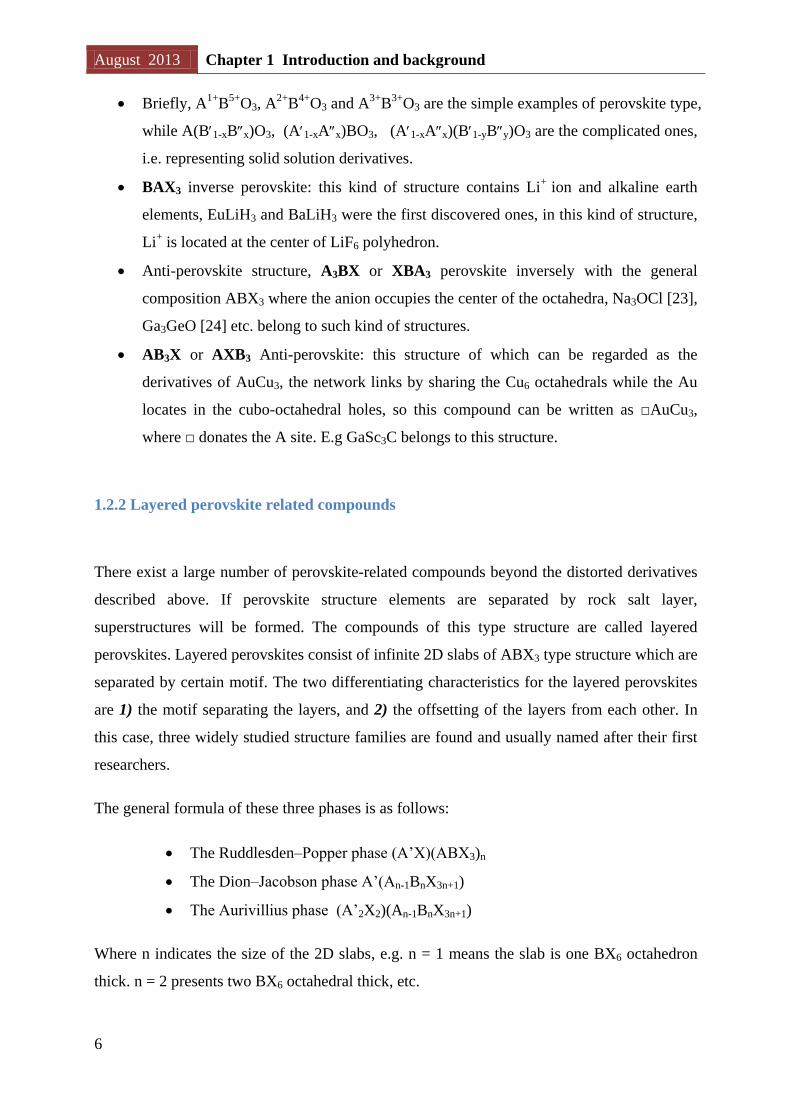
Figure 15. Magnetic properties of La3SrFe3O10δ series. (a) The inverse magnetic susceptibility as
a function of temperature for La3SrFe3O9.05, La3SrFe3O9.45, La3SrFe3O9.88 respectively [56]. (b)
Temperature independence of the magnetic susceptibility of La3SrFe3O10 [63].
As shown in Figure 15.a, magnetic susceptibilities of LaSr3Fe3O10-δ series show that the
inverse molar susceptibility nearly increases from 5 K to 300 K and the more oxygen
vacancies in the sample, the larger inverse molar susceptibility. In Figure 15.b, it shows a

Chapter 1 Introduction and background Junshan Li
25
broad hump near 200 K and where temperature dependent susceptibility is not typically from
the antiferromagnetic materials, the author suspected the impurity substance attribute to this
behavior.
1.5.6 Other properties
The properties of RP series have been widely investigated, such as the thermal expansion
coefficient [44], conductivity as a function of partial pressure at various temperatures and
Seeback coefficient [62], current density [44, 64], bulk density [64], Mössbauer spectra [65],
etc.
Investigating of these properties is not included in this master’s work, so which are not
presented here.
1.6 Objective of the thesis
Complex oxides exhibit several chemical and physical properties that may open up for
applications ranging from energy technologies to microelectronics. There is often a strong
link between chemical composition, crystal structure and properties. In order to develop
improved technologies for society, both theoretical and experimental studies for finding novel
materials with optimized properties are needed.
The Ruddlesden-Popper type oxides, which is the focus of this Master thesis, is a less
explored oxide class, but still have candidates that are quite promising as e.g. cathode
materials for solid oxide fuel cells (SOFCs) and oxygen separation membranes. The
Ruddlesden-Popper (RP) phases, named after their discovers, are (quasi) layered transition
metal oxides described by the general formula An+1BnO3n+1 (A = alkaline earth; B = 3d
element. Ln = rare earth enter on A site). This work focus on Fe-based Ruddlesden-Popper
phases with Sr(II) and Ln(III) (Ln = La, Nd) as A-site cations. Iron has the interesting feature
that it can exhibit several oxidation states, such as Fe(II), Fe(III) and Fe(IV). The huge
flexibility in the iron oxidation state open up for tuning the oxygen deficiency that eventually
may lead to interesting physical properties.
This thesis focus on investigate developing synthesis routes and sample handling that give
phase pure products described by the formula this triple layerd perovskites with a composition

August 2013 Chapter 1 Introduction and background
26
of LnxSr4xFe3O10δ (Ln = La, Nd; 0 < x < 4.0). The goal is to achieve a wide range of oxygen
contents (8.5 < 10δ < 10) for some selected phase pure RP3 type samples by using different
methods approaches; i.e. full oxidation, quenching and Zr-reduction. The oxygen content of
these obtained compounds together with as-synthesized samples will be determined by
cerimetric titration. Synchrotron and conventional X-ray diffraction along with Rietveld
refinements will be used to refine the crystal structure and unit cell parameters. In addition,
thermal analyses together with magnetic measurements for some selected samples will be
carried out to fulfill a detailed investigation of their structural behavior and properties under
certain conditions.

Chapter 2 Theory and methods Junshan Li
27
Chapter 2
Theory and methods
In this chapter are the methods and instrumentation used to synthesize and characterize RP3
phase oxides presented.
2.1 Synthetic methods
A rich variety of solids, including perovskites and its related phases, can be synthesized using
a wide range of methods. There are abundant scientific reports regarding available methods
[38, 66].
Generally, some typical methods of choice are available for the synthesis of perovskites and
its related compounds as bulk:
Solid-state/Ceramic methods (Shake and bake)
Precipitation/Co-precipitation methods
Sol-gel/Citric acid methods
The solid-state methods is one of the most frequently used routes for preparing mixed oxides
using binary oxides, hydroxides, carbonates etc as starting materials. The procedure is based
on that stoichiometric quantities of the starting materials are mixed and pelletized from the
finely grinded powder and subsequently fired at very high temperatures to obtain complete
reaction. Even though this method is popular because of simplicity, it has its important
drawbacks as lack of full homogeneity in the complex solids due to incomplete reaction
between the mixed precursors [38]. To achieve good sample quality repeated grinding,
pelleting and heating circles are required. Further, the high firing temperatures may cause
undesired impurities to be incorporated from e.g. the crucible material.
The last two methods are solution based techniques allowing mixing of the different cations
on atomic level rather than being mixed by grinding. The fine powders obtain from the drying
of the solution require and have shorter diffusion lengths. Thus these two methods can

August 2013 Chapter 2 Theory and methods
28
stabilize single phases at lower temperatures than ceramic route.
In this work, all samples were prepared using the so-called citric acid route. This method
starts with dissolving all starting materials in diluted acid (typically HNO3) to create a
solution. All the cations are distributed uniformly on atomic level. Citric acid is added into the
solution to form a sol of cation complexes. A drying process at moderate temperature (i.e.
160200 oC) is required to start dehydroxylation and decarboxylation of the citric acid and a
3D net-work is starting to form. This gelling process is typically accompanied by a significant
amount of shrinkage. In this work, the resulting gel is subsequently calcined at 450 o
C in an
oxidative environment to burn off the organic residues. The last step is repeating steps of
grinding, pelletizing and annealing of the obtained amorphous powders at certain
temperatures until desired single phases are obtained. Choice of atmosphere sintering (i.e. O2,
N2, Ar) during the annealing process is also an essential parameter. The experimental details
used in this work can be found in the experimental section (see subchapter 3.1.3, Page 46).
2.2 Large oxygen deficiencies
Complex oxides with presence of the multivalent cations as for instance Fe, Mn and Co opens
up for preparation of oxygen deficient oxides. For RP3 phases, depending on the valence of
the larger A-cation (A3+
), the B-cation can take valence B+2.5
to B+3.67
as for instance in the
PrSr3Fe1.5Co1.5O10δ system, corresponding to the oxygen content of O8.25 and O10.00
respectively [67].
In order to create samples with large oxygen deficiency, some methods of choice exist for
reducing the oxygen content in RP3 phase oxides-Lattice oxygen can be removed from the
oxides by annealing it in a reductive atmosphere (H2, or a mixture of H2 and N2 or another
inert diluting gas) [67] at suited temperature. Alternatively, as oxides are more oxygen
deficient at high temperatures, the samples can be quenched from high temperature by putting
it directly into liquid N2 [62], or using an oxygen-getter as Zr [42]. An oxygen-getter is a
metal that easily oxidize.
In this work, we used quenching and the oxygen-getter approach. The sample was quenched
at different temperatures and allowed to cool down to ambient temperature in the desiccator.
The pellet was crushed into powder right after and then three batches of ~50 mg powder were
Chapter 2 Theory and methods Junshan Li
29
taken to determine its real oxygen content. Meanwhile, the powder was well kept in glove box
(pO2 < 6 ppm; pH2O < 1 ppm).
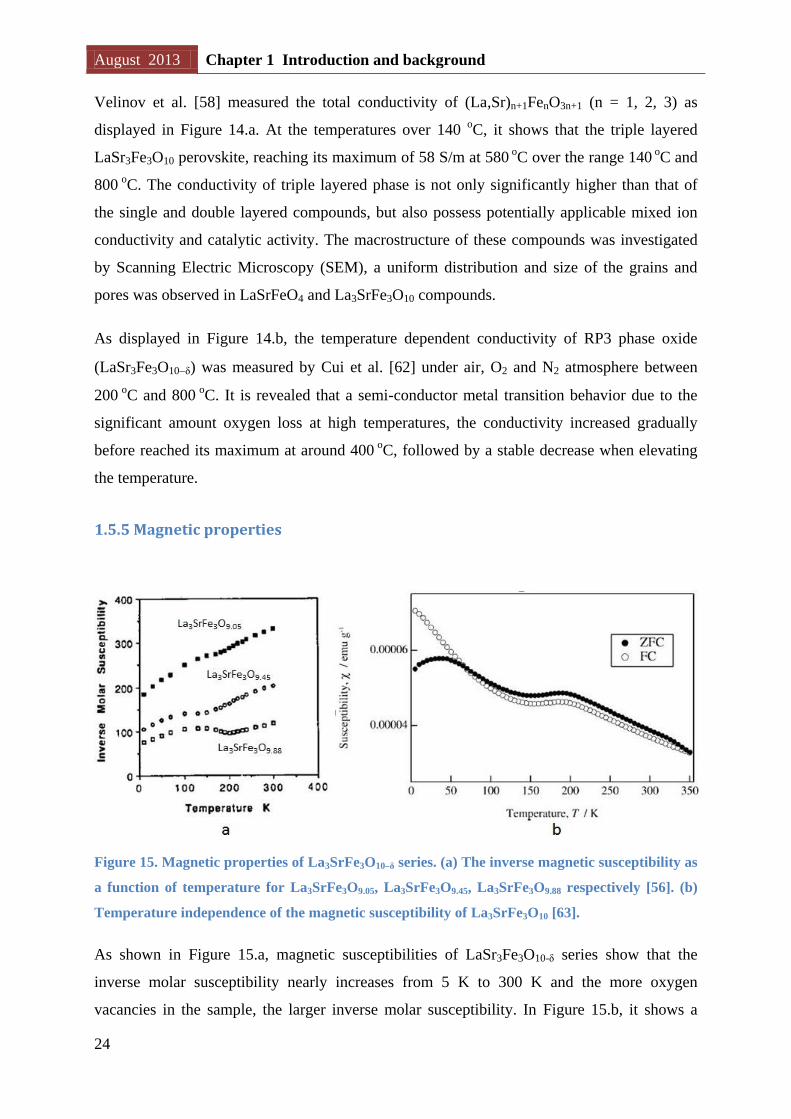
Zr-reduction involve in principle a chemical transport reaction (CTR) [68]. The principle
behind this approach is:
a) RP3 phase will naturally release or take up oxygen depending on pO2 and temperature
⇔ Equation 9
b) Correspondingly will a metal as Zr be oxidized/reduced depending on the pO2 and
temperature conditions
⇔ Equation 10
c) By controlling temperature conditions for oxide and metal so metal want to be in oxidized
form and oxide want to release oxygen, one can controlled “pick out” or remove oxygen from
the oxide’s oxygen lattice by adding a known quantity of metal to the oxide. A schematic
drawing of a possible set-up is given in Figure 16.
Figure 16. The schematic of the reactor used to tune oxygen content of RP3 phases. The oxygen-
getter (Zr) is physically separated from the oxide it is reducing inside an evacuated sealed quartz
tube.
The oxide and metal are physically separated by being located in different crucibles. The two
crucibles may be located at the same or different temperatures in the reactor depending on
their red-ox properties. Normally the metal is located at a higher temperature than the oxide.
August 2013 Chapter 2 Theory and methods
30
The reactor is located in a furnace with a known temperature gradient (see Appendix A, Page
125), and the length of the reactor is decided based on desired temperature at oxide and metal
(refer to Chapter 3 – experimental, Page 46). The reactor is put under vacuum so all oxygen
the metal take up is originating from the oxide.
d) It is critical to choose crucible material that does not react with the metal. Ellingham
diagrams show that Zr will be able to reduce SiO2 but not Al2O3 up to approximately 600 oC
[69]. For this reason Zr is located in dry Al2O3 crucibles.
e) After ended experiment the reactor is opened in a glove box (pO2 < 6 ppm; pH2O < 1 ppm).
Oxygen content of the RP3 phase is then verified through cerimetric titration. And the Zr
metal is carefully inspected to check if it is fully oxidized.
Assuming that the oxygen nonstoichiometry of the sample LnSr3Fe3O10δ1 is δ1 before
reducing, while δ2 is the oxygen deficiency we aim to obtain (δ2 > δ1). During the process,
the following chemical equation will take place:
Equation 11
After each sample is reduced, the practical oxygen content will be subsequently determined
by cerimetric titrations. Care is taken to avoid any oxidization of the sample prior to the
cerimetric titration (see section 2.4 and 3.2.3 for details for cerimetric titration)
2.3 Phase identification and structure refinement
In this work, some typical and essential methods are used to characterize the RP3 phase oxide
and the most important step characterizing a solid-state material is to determine its crystal
structure.
2.3.1 X-ray Diffraction
The RP phase oxides, we are aimed to get, are crystalline materials, in which the atoms and
molecules are arranged in a regular pattern. The diffraction technology is not only designed
for the basic phase determination but also for the further analysis, including cell parameters,
structures etc.

Chapter 2 Theory and methods Junshan Li
31
X-ray, a form of electromagnetic radiation with a wavelength of 0.01 to 10 nanometers, was
discovered by Wilhelm Conrad Röntgen while experimenting with Lenard and Crookes tubes
and began studying them in 1895. Nearly at that time, it was strongly believed that crystals
are consisted of many repeating blocks and each block has the same number of different
atoms with the same pattern. Until now, these are well described in crystallography and
classified into 7 lattice systems, 14 Bravais Lattice, 32 point groups and 230 space groups.
The diffraction will occur when the repeat distances in a crystal are of the order of magnitude
of the wavelength of the radiation. Friedrich and Knipping performed the x-ray diffraction for
the first time by using copper sulfate to study its crystal structure [70]. Bragg diffraction was
first proposed by William Lawrence Bragg in 1912, he along with his father William Henry
Bragg developed this relationship to explain the cleavage faces of crystals appear to reflect X-
ray beams at certain angles of incidence. Several years later, Albert W. Hull pointed out that
“every crystalline substance gives a pattern; the same substance always gives the same pattern;
and in a mixture of substances each produces its pattern independently of the others” [71].
The discovery of the phenomenon of X-ray diffraction in crystals paved a way to the
understanding of its structure. Many solid materials, around 95%, can be described as crystals,
each of which produces a unique “X ray” fingerprint of diffracted X-ray intensities versus
scattering angle that is becoming a possible characterization of an unknown material by
comparing with the known patterns.
Now, the secrets behind it have become clear. When an x-ray electron beam hits an atom, the
electrons around the atom start to oscillate with the same frequency as the incident beam.
Destructive interference would occur in almost all directions while we only have the
constructive interference occurring in crystals in a few directions. The X-ray we talked about
reflects from a series of parallel planes inside the crystal, the set of the orientation and
interplannar of atoms are defined by three integers donating as hkl which are called diffraction
indices.

August 2013 Chapter 2 Theory and methods
32
Figure 17. Princeple of X-ray diffraction. (a) Possible examples of equidistant atomic planes. (b)
Constructive interference upon diffraction at two subsequent atomic planes.
Actually, many planes can be expected in a lattice, as seen from Figure 17.a, each of which
would produce an X-ray reflection, the varied intensity of a spatial pattern of many reflections
can be collected as a function of the glancing angle, illustrated in Figure 17.b.
Equation 12
Where the variable d is the distance between a set of atomic planes in a crystal, is the
wavelength of the incident X-ray beam, n is an integer, θ is the angle between the plane and
incident beam.
A crystal consists of many sets of planes and these planes are characterized by interplannar
distances dhkl, which are a function of the size and the shape of the unit cell. And also other
factors, including atomic numbers and the positions of the atoms in the unit cell, influence the
powder pattern. In other words, a powder pattern has two characteristic features, the d
spacings of the lines and their intensities.
A unit cell contains some specific atoms j of scattering factors fj and coordinates xj, yj and zj,
the amplitude of a wave diffracted by an hkl plane set is given by the structure factor Fhkl:
∑ [ ( ( )) ( ( ))]
Equation 13
The intensities of a pattern peak are proportional to the square of Fhkl and also related chiefly

Chapter 2 Theory and methods Junshan Li
33
to variations of electron and atomic scattering, interference effects, anomalous scattering and
thermal motion of atoms. The intensity scattered by electrons is given by:
[
] ( )
Equation 14
Where, n is the number of electrons of an atom, is the intensity of the incident beam; e is
the electron charge; is the mass of the electron; c is the light speed and r is the distance
from the scattering electron to the detector.
2.3.2 Synchrotron Radiation X-ray Diffraction
With the same principle of conventional X-ray diffraction, an experimental technique utilizing
synchrotron radiation has been developed, offering more advantages [72]. Many orders of
magnitude stronger than conventional x-rays, the intense form of radiation is the result of the
deflection of highly energetic, charged particles, traveling at nearly the speed of light,
accelerated in a strong magnetic field [73]. This resulting electromagnetic radiation emitted
by these particles is passed through auxiliary components such as magnetic poles, called a
wiggler or undulator, to further increase the x-ray intensity. This obtained electromagnetic
radiation is of wide spectrum, which can be either used or monochromated to desired
wavelengths for the experiments. These features made this so-called Synchrotron Radiation
X-ray Diffraction (SRXRD) experiments as a highly valued research tool.
2.3.3 Rietveld refinement
When the data were collected via (SR)XRD, the next and probably the most important step is
the completion of structure determination, which is the so-called Rietveld refinement. This
method was named after Rietveld, who introduced and developed in late 1960s. The following
paragraphs briefly demonstrate this method according to textbook [74] and review [75], by
Robot Alan Young and Rietveld, H. M respectively.
The least squares approach is carried out to refine the theoretical and observed profile until
the difference is minimized. This method is originally designed for neutron data due to simple
peak shape by the relatively coarse resolution of neutron diffractometers [76], but now it is
also widely used in both synchrotron and laboratory X-ray data.

August 2013 Chapter 2 Theory and methods
34
However, if more factors are taken into consideration, the calculated intensities will be
employed by the following equation.
∑ [ ] ( ) Equation 15
where, s is the scale factor, K is the Miller indices, hkl for Bragg reflection, LK presents the
Lorentz, polarization and multiplicity factors, is the reflection profile function, PK is the
preferred orientation function, A is an absorption factor, FK is the structure factor for the K th
Bragg reflection, is the background intensity at the i th step.
The weighted difference in a Rietveld refinement between the observed and the
calculated diffraction patterns called Rietveld residual, donated as Sy.
∑ ( ) Equation 16
where,
, indicates the observed intensity at i th point, which is the raw data in
the diffraction pattern.
The least squares minimization leads to a set of equations involving derivatives of the
calculated intensities with some adjustable parameters , .
∑ [( )
(
) (
)] Equation 17
After deletion the first term ( ), an m by m matrix would be solved, where m is the
number of parameters being refined. Because the residual function is not linear, the solution is
found with an iterative procedure in which the shifts , is gived by:
∑
Equation 18
The calculated shifts are subsequently used to produce an improved model and the procedure
is then repeated. The relationships between the adjustable parameters and the intensities are
not linear, thus the starting model must be as close as possible to the correct model or the non-
linear least squares procedure will not give rise to the global minimum.
The atom positional, thermal, and site-occupancy parameters may be refined, what’s more,
parameters for the background, lattice, instrumental features, specimen displacement and
transparence, crystallite size and microstrain are also available to be refined.

Chapter 2 Theory and methods Junshan Li
35
In the Equation 19, for the background, a simple phenomenological function is used to
calculate the curve:
∑ [( ⁄ ) ] Equation 19
Where BKPOS is the origin that is to be user-specified in the input control file.
For the angle dispersive data, the dependence of the breadth H of the reflection profiles,
which is measured as full-width-at-half-maximum (FWHM), will be typically modeled as:
Equation 20
Here U, V and W are refinable parameters, can be written in terms of the angular divergence
of the incoming neutrons to the monochromator, the angular aperture of a monochromator-to-
sample collimator and the collimation between sample and detector.
Analytical reflection profile functions, in most programs, include two different Pseudo-Voigt
functions, the Pearson VII function, Gaussian and Lorentzian function. There exist some
refinement programs available, i.e. GSAS [77], TOPAS [78], and Fullprof [79] etc. using the
above mentioned model of principles and methods.
Among these popular refinement programs, in this work, the refinement is carried out by
TOPAS (TOtal Pattern Analysis Solutions) [78]. This software is a graphic based profile
analysis program within a general non-linear least squares fitting system.
Typically, a refinement starts with the background and scale factors, followed by the unit cell
and profile parameters. The Rietveld refinement will proceed by adjusting parameters until
the residual is minimized, in other words, a best fit will be obtained. In the process, several R-
values, detailed in Table 6, are developed to make the judgments of the fit. From the
mathematical point of view, Rwp, as the most meaningful among these R-values, which best
reflects the progress of the refinement.

August 2013 Chapter 2 Theory and methods
36
Table 6. Some R-values of the fitting [74]
R-related funcions Name
∑ | ( )
⁄ ( )
⁄ |
∑ ( ) ⁄
R-structure factor
∑| ( ) ( )|
∑ ( ) R-Bragg factor
∑| |
∑ R-pattern
{∑ ( )
∑
}
⁄
R-weighted pattern
Here, IK is the intensity of the K th Bragg reflection.
The goodness of the fit (GOF), x2, is perhaps the most popular indicator.
⁄ Equation 21
Rexp is the expected R value, reflecting the quality of the collected data.
[
∑
] ⁄
Equation 22
Where N is the number of observations and P is the number of parameters. For a good fit, the
x2 should be between 1.3 and 1.7, and Rwp and Rp are as low as possible.
2.4 Cerimetric titration
Cerimetric titration is a well established method to determine the oxygen content of certain
complex oxides containing high valent cation as iron in LnSr3Fe3O10δ (Ln = La, Nd).
LnSr3Fe3O10δ occurs over a wide range of specific oxygen contents.
Cerimetric titration is of volumetric chemical analysis and was first proposed by Lange in 19th
century and the systematic works started in the 1920s, while methods based on Ce (IV) sulfate
as titrant were developed by Furman et al. [80] at the same time. In 1957, Kolthoff et al.
described detailed procedures for cerimetric titration based on his classic work [81].
Chapter 2 Theory and methods Junshan Li
37
Cerimetric titration is a quantitative re-dox method where a colour change is observed at the
endpoint of the titration due to complete consumption of the Fe2+
-1,10 phenanthroline
complex (Ferroin) according to:
( ) ( ) Equation 23
Since cerimetry is linked to Fe2+
/Fe3+
/Fe4+
red-ox pairs, it can be used for determining
oxidation state of iron in oxides by either oxidizing Fe2+
to Fe3+
or reducing Fe4+
to Fe3+
. Fe3+
will not react with Ce4+
. It should be pointed out that Fe(IV) not is a stable aqua species, but
exists in solid oxides as perovskites and Ruddlesden-Popper phases. Cerimetry for
determining oxidation states of nickel and cobalt in oxides as are also reported in the literature
[82]. The indicator is the same, making coloured complexes with cobalt and nickel.
In this work we have focused on determining the valence of iron in LnSr3Fe3O10 (RP3 phase)
to determine the oxygen content. Valence of La, Sr and O are fixed to +3, +2 and 2,
respectively. We base the cerimetric titration on adding excess Fe2+
cations from an external
salt (Fe2+
Mohr-salt) to the RP-type oxide, and dissolve the mixture in an acidic solution under
inert conditions. Iron in Mohr salt will react with iron from the oxide according to:
Fe2+
sample + Fe2+
Mohr-salt 2Fe2+
solution Equation 24
Fe3+
sample + Fe2+
Mohr-salt Fe3+
solution + Fe2+
solution Equation 25
Fe4+
sample + Fe2+
Mohr-salt 2Fe3+
solution Equation 26
Fe(II) in the acidic solution, after being completely dissolved and fully reacted with Mohr salt,
is subsequently titrated with a Ce4+
solution with known molarity (equation x). Based on
consumed Ce4+
, quantity of added Mohr salt and dissolved oxide, the valence of iron in the
dissolved oxide can be extracted.
Iron has average valence 3.67 in LnSr3Fe3O10.00 ( = 0), 3.00 in LnSr3Fe3O9.00 ( = 1) and
2.67 in LnSr3Fe3O8.50 ( = 1.5). According to Equations 24-26, amount of Fe (II) titrated will
be:
less than added mole Mohr salt for < 1
equal to added mole Mohr salt for = 1

August 2013 Chapter 2 Theory and methods
38
larger than added mole Mohr salt for > 1
Since we with Mohr salt only reduce iron in the RP oxide to Fe (III) we define iron as having
valence 3+x; or Fe3+x
. We set up the calculations according to this to find x (and ) in Fe3+x
in
LaSr3Fe3O10-:
mol Fe3+x
in sample = C = Mohr salt added – consumed mole Ce4+
Equation 27
mol Fe3+x
= 3x*(masssample/(FWLaSr3Fe3O9 + 3x/2*FWO)) Equation 281
x = C*FW LaSr3Fe3O9 / (3masssample – 3/2*C*15.999) Equation 29
= 5.5 (3/2)*(3+x) Equation 302
In order to obtain accurate measurements it is critical to perform some few tests prior to the
titration. These are:
Find good experimental conditions to dissolve the oxide. It is optimal to dissolve the
oxide in 1-3 M HCl within some minutes; however stronger acid may be necessary.
Experience also show that some oxides need several hours and heating to be fully
dissolved.
Dimension/scale the experiment so you during the titration consume approximately
80% of the volume of the buret (mole Mohr salt, mole oxide versus mole Ce4+
).
Determine exact formula weight of Mohr salt by gravimetry (see Chapter 3.1.3 and
4.1.1).
Standardize the 0.1 M Ce(SO4)2 solution by titrating it with Mohr salt with known
exact formula weight.
For the calculations of cerimetric titrations, see Appendix F (Page 140).
1 3x = 3x Fe atoms per x LaSr3Fe3O10- units; 3x/2*FWO 3x Fe per formula unit + valence of O = -2, We need ½
O to reduce 1 Fe4+ to 1 Fe3+. 2 Note < 0 imply average valence of iron > 3.67.

Chapter 2 Theory and methods Junshan Li
39
2.5 Thermal Analysis
Thermal analysis is a tool of studying changes in materials properties as function of
temperature. Some frequently used methods are: differential thermal analysis (DTA) for
temperature differences, differential scanning calorimetry (DSC) for heat differences,
dilatometry (DIL) for volume changes, thermo-mechanical analysis (TMA) for change of a
dimension or a mechanical property, thermo-optical analysis (TOA) for change in optical
properties and thermogravimetric analysis (TGA) for mass changes [83].
As TGA is used in this work, a more detailed overview of this technique will be given in the
following.
Thermogravimetric analysis (TGA), also called thermogravimetry (TG), is a technique where
the mass of a sample is measured as a function of temperature (with constant heating/cooling
rate) or at constant temperature (isothermally) in a well-defined atmosphere. Typically, the
sample is exposed to an inert gas as N2 or Ar, or a gas or gas-mixture containing reactive
species as O2, H2 and CO2.
The sample may lose or gain mass depending on the specific chemical reaction taking place in
the applied atmosphere. TGA is not only a basic tool of providing information about physical
phenomena, including vaporization, sublimation, absorption, and adsorption and desorption,
but also a useful technique for study the chemical properties, such as chemisorption,
dehydration, decomposition or oxidation and reduction etc. Typically TGA instruments are
operated up to 1100-1200 oC, but certain designs allows temperatures as high as 2000
oC.
Duval, Keattch and Dollimore have fully demonstrated the origin of this method [83]. The
core of the apparatus, the balance, has been through a tremendous development from the
lever-arm balance to the electronic microbalance giving increasing degrees of precision. Up to
now, this method allows smaller samples (~ 50 mg) to be used [83].
The design of the TGA instruments is different from supplier to supplier by means of the
construction of the balance, how the gas is flowing over the sample as well as furnace system
including location of the thermocouple. Figure 21 is the TG instrument used in this work,
Experimental part (Page 50).

August 2013 Chapter 2 Theory and methods
40
2.6 Magnetic properties
Magnetic property is a physical phenomenon that includes forces exerted by magnets. Modern
study on transition metal oxide dated from the 1930s by Pauling. The magnetic susceptibility,
x, is a dimensionless proportionality constant that indicates the degree of magnetization of a
material response when placed in a magnetic field. These magnetic responses differ greatly in
strength.
In general, materials may be classified by the response to externally applied magnetic fields.
Diamagnetism is a weak property of all materials and opposes the applied magnetic fields.
Paramagnetism is larger than diamagnetism and exhibits proportional magnetization in the
same direction of the applied field. In addition to that, some paramagnetic materials at a
certain temperature have interactions that exist in a more ordered state, can be either
ferromagnetic or antiferromagnetic. Ferromagnetic effects are very large, producing
magnetizations sometimes orders of the magnitude greater that the applied field and as such
are much larger than either diamagnetic or paramagnetic effects. More complex behaviors can
arise from the existence of locally ordered spins (FM or AFM) in a certain structural
arrangement; these magnetically frustrated systems are spin glasses. These are presented
schematically in Figure 18.
Figure 18. Schematic representations of magnetic arrangement of spins. (a) Paramagnetism. (b)
Ferromagnetism. (c) Antiferromagnetism. (d) Ferrimagnetism. (e) Spin glass, the area of short-
range order are highlighted by red boxes.
When perovskites incorporate magnetic transition metals, they may exhibit any of these four
interaction schemes. If more additional influence of internal or/and external stimuli, such as
substitution, deficiencies, temperature, impurities or pressure allow to switch between these
five aforementioned magnetic states.

Chapter 2 Theory and methods Junshan Li
41
The magnetization M of a material is expressed in terms of density of net magnetic dipole
moments in the material.
Equation 31
Then the total magnetic field in the materials is gived by
( ) Equation 32
Where is the vacuum permeability, H is the applied magnetic field. The quantity is
called magnetic polarization.
And the magnetic susceptibility is defined as:
Equation 33
A volume-independent magnitude is the molar susceptibility xmol, which can be deduced from
the dimensionless proportionality factor x:
Equation 34
Vmol is the molar volume, Mmol the molar mass and ⁄ is the so-called specified mass
susceptibility.
Figure 19. The reverse susceptibility as a function of temperature for magnetic materials.

August 2013 Chapter 2 Theory and methods
42
The susceptibilities of a magnetic material are distinguished by their magnitude and
temperature dependence. A plot of the reciprocal of the measured susceptibility x-1
mol as a
function of T is of a straight line with a slope of 1/C, and the intersect of the x axis is at T =
and this temperature is called Weiss temperature. Curie law is applied in ideal paramagnets,
, when there is a predisposition between the adjacent spins due to a certain interaction,
then the Curie-Weiss law
, where is called the Neel temperature. As shown in the
above Figure 19, the reverse susceptibility versus temperature for an antiferromagnets, < 0,
for a ferromagnet, > 0, means ferromagnet, in comparison an ideal paramagnet = 0.
In Curie law, the quantitative relation is given by the Curie constant:
Equation 35
R = gas constant, NA is the Avogadro number and uo is the magnetic field constant.
The term effective paramagnetic moment ueff is defined as division of u by uB, yielding the
experimentally determined value of a sample, expressed as:
√
( ) Equation 36
By considering 1 mole per unit volume, n = nA, and the molar susceptibility, we obtain:
√ Equation 37
In the case of spin-only paramagnetic materials, we can obtain the number of unpaired
electrons:
√ Equation 38
S is the spin quantum number in Equation 38.
The magnetization still exists in the materials after the sample is treated with external field.
Moreover, a hysteresis curve shows this kind of behavior, see Figure 20.

Chapter 2 Theory and methods Junshan Li
43
Figure 20. Typical hysteresis loop for ferromagnetic materials [84]
An increasing external field is applied to an untreated sample, causing a rising magnetization
of the sample until saturation is reached (O → a). After turning off the field, the
magnetization decrease to a remnant magnetization, also called Retentivity (a → b). The spin
will experience a reorientation by applying opposite magnetizing force (b → c), the minimum
of this is called coercivity. If the magnetizing force increases continuously, the saturation will
be observed in opposite direction (c → d).By switching off the field and then reversing the
force, the magnetization of the sample would experience reorientation again (d → e → f → a).
Thus, the hysteresis loop is obtained.
Depending on the application, materials with large remnant magnetization are called hard
ferromagnets while substances with small magnetization are called soft ferromagnets.
The magnetic behavior as a function of temperature M(T) and field M(H) will be measured by
Magnetic Properties Measurement System (MPMS) and/or Physical Properties Measurement
System (PPMS), Quantum design. The experimental details together with the instrument are
presented in section 3.2.4.

August 2013 Chapter 3 Experimental
44
Chapter 3
Experimental
In this chapter are the experimental work done in this Master’s project is described. The
experimental work includes procedures relative to sample preparation and various apparatuses
for property measurements and characterization.
Firstly, all samples were synthesized using the citric acid method. Sample purity was
investigated by means of powder X-ray diffraction (XRD). Phase pure powders of
LnSr3Fe3O10δ (Ln = La, Nd) were subsequently transformed to series of oxygen deficient
samples by performing different oxygen content sensitive post-treatments. The valence of the
B site (Fe ion) was determined by the cerimetric titration which in turn allows us to calculate
the oxygen content of these samples. In addition, thermogravimetry was utilized to study the
oxygen stoichiometry as a function of heating and cooling condition in air. Synchrotron
radiation X-ray diffraction (SRXRD) was carried out for some selected samples for crystal
structure evaluations, and magnetic properties were investigated by MPMS and PPMS.
3.1 Synthetic experimental
3.1.1 Chemicals used in the experimental study
In order to avoid the influence of impurities, very high-purity starting materials are used, most
of the main starting materials are listed in table 7.
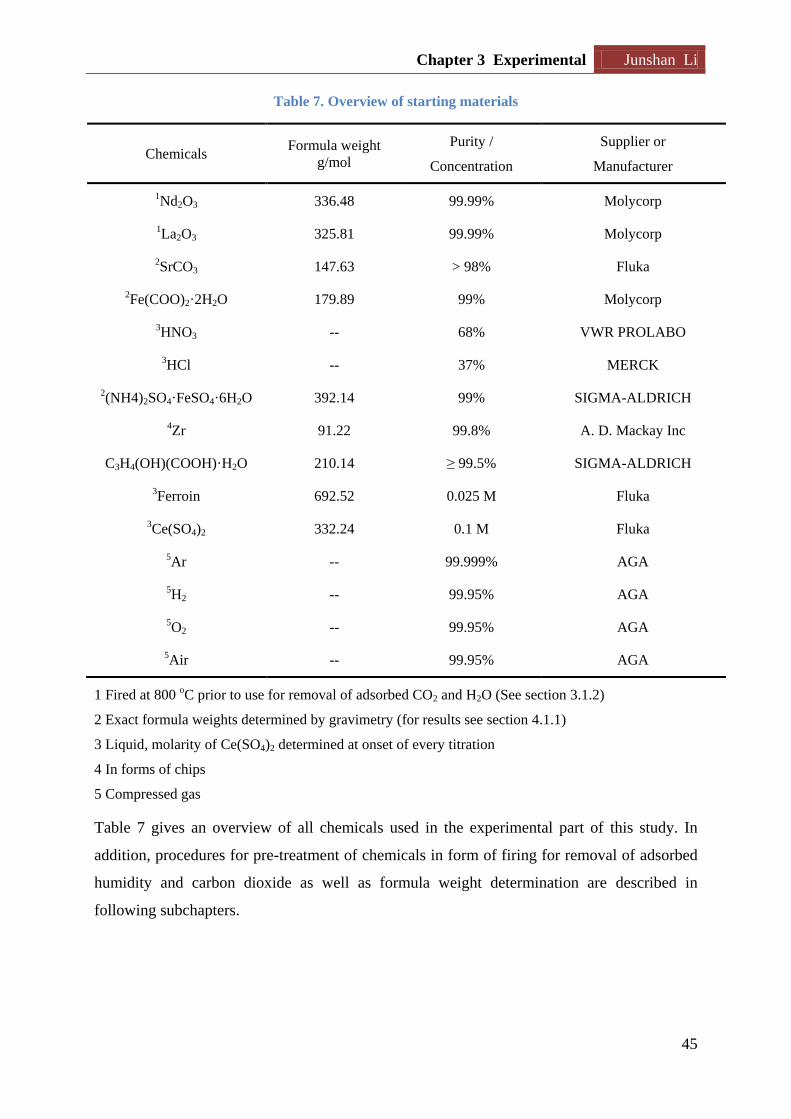
Chapter 3 Experimental Junshan Li
45
Table 7. Overview of starting materials
Chemicals Formula weight
g/mol
Purity /
Concentration
Supplier or
Manufacturer
1Nd2O3 336.48 99.99% Molycorp
1La2O3 325.81 99.99% Molycorp
2SrCO3 147.63 > 98% Fluka
2Fe(COO)2·2H2O 179.89 99% Molycorp
3HNO3 -- 68% VWR PROLABO
3HCl -- 37% MERCK
2(NH4)2SO4·FeSO4·6H2O 392.14 99% SIGMA-ALDRICH
4Zr 91.22 99.8% A. D. Mackay Inc
C3H4(OH)(COOH)·H2O 210.14 ≥ 99.5% SIGMA-ALDRICH
3Ferroin 692.52 0.025 M Fluka
3Ce(SO4)2 332.24 0.1 M Fluka
5Ar -- 99.999% AGA
5H2 -- 99.95% AGA
5O2 -- 99.95% AGA
5Air -- 99.95% AGA
1 Fired at 800 oC prior to use for removal of adsorbed CO2 and H2O (See section 3.1.2)
2 Exact formula weights determined by gravimetry (for results see section 4.1.1)
3 Liquid, molarity of Ce(SO4)2 determined at onset of every titration
4 In forms of chips
5 Compressed gas
Table 7 gives an overview of all chemicals used in the experimental part of this study. In
addition, procedures for pre-treatment of chemicals in form of firing for removal of adsorbed
humidity and carbon dioxide as well as formula weight determination are described in
following subchapters.

August 2013 Chapter 3 Experimental
46
3.1.2 Pretreatment of rare earth oxides Ln2O3 (Ln = La and Nd)
La2O3 and Nd2O3 were fired in a muffle furnace at 800 oC over night to prior to synthesis in
order to remove water (e.g. Ln(OH)3, Ln = La, Nd) and carbon dioxide (e.g. Ln2O2CO3, Ln =
La, Nd) absorbed by the powder. The fired oxides were transferred directly from 800 oC into a
desiccator and cooled down to room temperature. To ensure completely dry starting materials,
this procedure was repeated at least once per month.
3.1.3 Procedure for determination of formula weights
To determine the exact formula weights of SrCO3, Mohr salt ((NH4)2SO4·FeSO4·6H2O) and
Fe(COO)2·2H2O, the following procedure was followed.
Generally, label four crucibles and fire them with some quartz wools overnight at 800 oC, and
transfer crucibles and quartz wool into a desiccator and allow them to equilibrate to ambient
conditions (room temperature). Weigh the crucibles, repeat the firing until constant weights of
crucibles are obtained. Weight out approximately 2 g materials to each crucible and add
known quantity of quartz wools as a blanket covering the chemicals.
Table 8. Chemicals and their maximum temperature and decomposed phases
Chemicals Maxi. Temp. Decomposed phases
SrCO3 1100 oC SrO
Fe(COO)2·2H2O 800 oC Fe2O3
(NH4)2SO4·FeSO4·6H2O 800 oC Fe2O3
Anneal the crucibles following the program: Ramp: 2 oC/min → temperature higher enough
for the materials to be decomposed completely (see Table 8 for detail) for approximately 20
hours. Transfer hot crucibles into desiccators and allow them to equilibrate to ambient
temperature.
→ ( ) ( ) Equation 39
( ) ( ) → ( ) ( ) ( ) Equation 40

Chapter 3 Experimental Junshan Li
47
( ) ( ) → ( ) ( ) ( ) ( ) ( )
Equation 41
Weigh the four crucibles, and repeat until constant weights are obtained. Run XRD of
obtained oxides to confirm phase content (see Equations 39-41). After each step is done, the
mean data of the real formula weight will be taken from the four parallel measurements (for
results see section 4.1.1, Page 57).
3.1.4 Synthetic procedure
In this work, we used the citric acid method for the preparation of all RP3 oxides. The RP3
oxides can be described by the general formulas:
LaxSr4xFe3O10δ; 0 < x < 4.0
NdxSr4xFe3O10δ; 0 < x < 4.0
In short, the procedure starts with weighing out stoichiometric amounts of pre-treated
reactants on a five digits analytical balance from Mettler Toledo. The starting materials (rare
earth oxides, iron-oxalate and strontium carbonate) were dissolved in nitric acid (approx. 6M)
in separate beaker until the solution became clear. Then the solutions were mixed in a large
beaker together with citric acid (~100 g citric acid per 2 gram product). The obtained solution
was then heated under stirring conditions for removal of water and nitrous gases. The
temperature was throughout this step kept below 170 oC.
When the nitrous gases have boiled off, the clear melt was transferred to a porcelain bowel.
An Al-foil was wrapped around the bowel and small holes were made in the foil to allow
water and carbon dioxide from the dehydration and decarboxylation process to disappear.
Dwell time of the first heating step was for 1224 hours in an oven holding 180 oC.
The obtained crust was thereafter crushed and transferred to a muffle furnace for removal of
carbon species at 450 o
C for 1824 hours giving a fine brownish powder, which in next step
was pressed into 1.0 cm diameter tablets using a hydraulic tablet press (100 bar). The pellets
were fired in a furnace at 1000 oC for 12 hours before increasing the temperature to 1250
oC

August 2013 Chapter 3 Experimental
48
and annealed for another 12 hours (in air). To ensure full homogeneity, the pellets were
crushed to powder again and pressed into new pellets. The second annealing were done at the
temperature in the range 1200-1450 oC for 12 hours in air, depending on the desired chemical
composition of the Ruddlesden-Popper oxide. Details regarding the final annealing step are
given in the result part, section 4.1.2 (Page 58).
To ensure fully oxidized RP3 phases, the tablets from the final annealing step were crushed
and the obtained fine powder was post annealed in a 100% oxygen flow at 350 oC for 3 days.
On the contrary, different oxygen deficient samples were obtained by 1) Quenching, taking
the sample out at different temperatures and allow it to cool down in desiccator, or 2) reduce
as-synthesized samples by oxygen-getter Zr via chemical transport reaction method, see
section 3.1.5.
3.1.5 Preparation of oxygen deficient samples
Oxygen content of some selected phase pure RP3 phases (as-synthesized LnSr3Fe3O10δ, Ln =
La, Nd) was selectively tuned to create series of RP3 oxides with variable oxygen
stoichiometry. To carefully control the oxygen content of the reduced variants, the exact
oxygen content of the corresponding as-synthesized RP3 samples were determined by
cerimetric titration (see details in section 2.4). This allowed us in the next step to load the
reduction reactor with exact quantities of the oxygen-getter Zr (see Figure 16, Chapter 2, Page
29).
In this study the RP3 oxides were kept at 500 oC and Zr at 750
oC. The oxide and Zr were
loaded in stoichiometric quantities into quartz and Al2O3 crucibles, respectively (see Figure
16 Chapter 2). Distance between the oxide and Zr in the reduction reactor is given by the
actual gradient in the applied furnace. Figure A-1 (refer to Appendix A, Page 125) shows a
typical temperature gradient for the furnace used for these experiments. The quartz reactor
was carefully evacuated after it was loaded with both the oxide and Zr using a vacuum pump
before it was sealed in a H2/O2 torch. Vacuum was confirmed using a vacuum indicator,
which gives a purple color for the pressure below 20 Torr. The reduction reactor was then
located inside a furnace with a known temperature gradient.
Finally, the furnace was heated to desired temperature and kept there for 3 days. After ended
experiment the furnace was switched off and the reduction reactor carefully slided out of the

Chapter 3 Experimental Junshan Li
49
furnace and cooled down to ambient temperature. The reduction reactor was opened in the
glove box and the Zr was inspected to check if it had become fully oxidized (white chips). For
each reduced oxide, three ~50 mg batches were taken for determining oxygen content by
means of cerimetric titration (refer to section 3.2.3).
3.2 Samples characterization
The crystal structure and phase purity were confirmed by (Synchrotron Radiation) X-ray
diffraction.
3.2.1 X-ray diffraction
Phase assemblages were ascertained from powder X-ray diffraction. These data were obtained
from Bruker Advanced D8 X-ray diffractometer running in Bragg-Brentano geometry with
Cu Kα1 radiation ( = 1.540598 Å). The diffraction pattern covers a 2θ range from 2o to 90
o
with 1s count per step length of 0.021o.
Here, there are two ways of preparing sample for the XRD.
Powders from as-synthesized and fully oxidized samples were mixed uniformly
together with a small amount of a silicon NIST standard. A very thin layer of vacuum
grease was wiped on a sample holder, and then a small amount of these mixed
powders was dispersed on it with sheet glass.
The reduced sample was stored in the glove box. After the sample was prepared on the
holder as described above, it would be covered by a very thin plastic foil to avoid any
oxidization and hydration. The XRD will be carried out right after it is taken out from
the glove box.
For this work, high resolution data from SRXRD experiments were collected with a 2-
dimensional detector at Swiss-Norwegian Beam Line (SNBL) at the European Synchrotron
Radiation Facility (ESRF) in Grenoble, France. The sample was loaded into a quartz-glass
capillary with an outer diameter of 0.5 mm and then closed with a length of around 2 cm. The
wavelength used was 0.504856 Å, and the data was collected from 2θ = 0.003o to 36.841
o
using a step length of 0.00615o.

August 2013 Chapter 3 Experimental
50
The experimental diffraction data were analyzed with the software DIFFRACplus
EVA to
confirm the phase identification with known fingerprints in the database. Further, TOPAS was
used to conduct the refinement with the unit cell parameters, atomic coordinates and crystal
structure of the specimen. The data will be compared with previous published literatures.
3.2.2 Thermogravimetric analysis
A Netzsch STA449 F1 Jupiter instrument was used to conduct the thermogravimetric analysis
(TGA) measurements.
Figure 21. schematic drawing of a Netzsch STA449 F1 TG instrument [85]
In Figure 21, is a schematic drawing of a TGA presented, showing its main components. This
instrument consists of an evacuating system, a high water vapor pressure furnace and a
hoisting device. As shown in Figure 21, there are three gas paths (purge 1, 2 and protective
path) linking to the chamber. In this work, purge 2 allows air to flow into the TG because
measurement is carried out in constant atmosphere. The protective gas path flushed by the

Chapter 3 Experimental Junshan Li
51
dried N2 into the instrument has the function of protecting the system, especially when it is
operated at high temperatures.
Around 50 mg sample was evenly distributed in a clean Pt crucible. The measurements were
conducted using a 50 ml/min synthetic air-flow above the sample, and a N2 flow of 25 ml/min
over the balance. Measurements were done in temperature range from 30 oC to 1200
oC with a
heating and a cooling rate of 10 o
C/min. An isothermal step of 10 minutes at 1200 oC was
included between the heating and cooling steps. See flow diagram of the used temperature
program in Figure 22.
Figure 22. Temperature profile in TG measurement
To correct for the buoyancy effect, all experiments were run with a so-called background. The
background curve was obtained running an empty Pt crucible at exactly the same conditions
as the experiments. In addition, the instrument is routinely calibrated with respect to
temperature and weight by instrument responsible.

August 2013 Chapter 3 Experimental
52
3.2.3 Cerimetric titration
The experimental procedure used in this work started with preparing degassed acidic solution
of HCl (1 M, adaptable to the solvability of the sample). Degassing was performed by
bubbling inert gas (He) through boiling water, which subsequently was used to dilute the HCl.
Further, the diluted HCl was kept under an inert N2/Ar blanket throughout the procedure.
Next step was to add a known amount (~0.35 g, depending on the composition) of Fe2+
(in
excess to the amount of high valent cations in the sample) in the form of
(NH4)2·Fe(SO4)2·6H2O (known as “Mohr’s salt”) into 100 ml 1 M HCl. Then the stable Fe2+
salt was allowed to dissolve before the fixed amount (~50 mg) of oxide sample was added to
the solution. The solution with the salt and sample was throughout the procedure kept under
an inert atmosphere to avoid O2 from air to oxidize Fe2+
in the solution to Fe3+
, giving false
high valence of iron in the oxide (see the color as Figure 23.a).
Figure 23. Color changes within titration. (a) The color of fully dissolved LnSr3Fe3O10-δ sample.
(b) The color change to light red when Ferroin added into the solution. (c) The color returns to
light green after titrating.
Finally, before titrating the mixture by the standardized solution of Ce(SO4)2 (the color of
mixed Fe3+
and Ferroin, see Figure 23.b), the red-ox indicator (Ferroin) was added to the
solution (one drop was enough, the color of the solution is as shown in Figure 23.c).
Ce(SO4)2 was standardized against Mohr salt, and the exact formula weight of the Mohr salt is
achieved from gravimetry (see section 3.1.2 for more details).

Chapter 3 Experimental Junshan Li
53
3.2.4 Magnetic properties
The low-to-room temperature (5K~300K) magnetic properties of RP3 oxides were
determined using a “Magnetic Property Measurement System” (MPMS). This Quantum-
designed instrument is based on a “Superconducting Quantum Interference Device” (SQUID).
Measurements included in this work were: Magnetization Vs Temperature (particularly zero
field cooled (ZFC) and field cooled (FC)); Magnetization Vs Field.
Figure 24. Cutaway view of PPMS-16, Quantum Design[86].
Figure 24 is a cutaway drawing of a PPMS presented, showing its main components. Moving
a magnetized sample (up and down) through a coil of superconducting wire induces a voltage

August 2013 Chapter 3 Experimental
54
in the detection coil set. The amplitude of this signal is proportional to the magnetic moment
and can be detected by the SQUID.
In the zero field-cooled experiment, the sample is cooled at low temperatures, usually 5K, and
then the magnetization is monitored under an applied magnetic field as a function of
temperature. In the field-cooled measurement, the sample is cooled down under an applied
field from room temperature to low temperature and magnetization is monitored as the sample
is warming up in field.
For the Magnetization-Field measurement, it is conducted at fixed temperature, ranging from
5 K to room temperature.
There are two ways of preparing the samples:
For the high oxygen content samples (δ < 0.1), the preparation starts with weighing
around 50 mg powders. And filled around 50 mg powders in a capsule and tried to
keep it fixed. Moreover, this capsule was loaded inside a plastic straw. To make it
100% fixed, some tapes were wound around the capsule to increase the diameter.
Caution must be taken for the preparation of the oxygen deficient samples (δ > 0.1).
These samples were stored in glove box (pO2 ≤ 6 ppm, H2O ≤ 1 ppm). Loaded known
amount of about 50 mg into a glass tube and used enough quartz wools to make the
powders fixed at the bottom of the tube. Kept the tube airtight and took it outside of
glove box. The tube was evacuated using a vacuum pump carefully. Vacuum was
ascertained with a vacuum indicator, purple color was given for the pressure below 20
Torr. Then then tube was sealed in a H2/O2 torch. Same procedure was taken to load
the closed tube inside a plastic straw.
3.3 Errors and uncertainties
Inevitably some errors and uncertainties are introduced more or less in the current
experimental work. Thus it is necessary to reveal the main factors and if possible find
measures to reduce or even eliminate errors and uncertainties.
During the synthesis, introduction of slight contamination of the samples might happen, as
well may errors be introduced that affects the actual stoichiometry of the aimed products.
When using the analytical balance, slight errors are estimated to ±0.0001g of weighing of the

Chapter 3 Experimental Junshan Li
55
starting materials [87]. When transferring the weighed materials into the beaker, a very small
amount may be lost due to stickiness to the weighing boat. However, these uncertainties are
considered negligible.
There are several systematic errors in the XRD characterization. Firstly, there could be minor
error in determination of each peak position over the entire measuring angles owing to zero
point and height errors for the sample [88]. In addition, preferred orientation of the specimen
may lead to some errors in the intensities for the XRD pattern. An internal Si standard was
added into the specimen to minimize the systematic errors with respect to peak positions.
There exists variable factors attributing to errors in the cerimetric titration. Some treatments
are carried out to minimize the errors, such as determining the practical formula weight of
Mohr’ salt (see chapter 4.1) and the real molarity of Ce(SO4)2. Considering these factors
together with the obtained results from each group of three parallel measurements, it is
estimated that the real value of the oxygen content (10δ) of the sample with a standard
deviation ± 0.05 for LnSr3Fe3O10δ (Ln = La, Nd) series.
The obtained crystallographic data from the Rietveld refinement have certain errors limited by
the quality of collected pattern. The obtained results were found to vary slightly with the
refinement setting, such as 2θ range, presence of impurities etc. There exist larger challenges
in fitting of SRXRD than lab XRD due to low background as well as a highly improved signal
to noise ratio. This is of course beneficial with respect to quality of derived crystallographic
data, however, it appeard more challenging to describe observed peak profiles correctly for
the synchrotron XRD data.
For the thermogravimetry measurement, the buoyancy varies under different atmosphere and
at different temperatures. The uncertainties of the thermo balance are ±0.05 mg that is too
small to represent any real source of error. The weight and the style of amounting the sample
could also be a source of error. Therefore, around 50 mg specimen are weighed and amounted.
It is therefore necessary to measure a blank background of the crucible prior to the targeted
measurement. However, such crucible calibration runs were not performed for all experiments.
The oxygen content is calculated via TGA method assuming that the oxygen stoichiometry of
the post-TGA sample is O9.90. This anticipated value is, however, quite rough due to many
possible factors, i.e. the sample weight and how the sample is distributed in the crucible etc.

August 2013 Chapter 3 Experimental
56
Some magnetization FC and ZFC curve were found to quite noisy. This is most likely due to a
slight shift in sample position during measurement, i.e. on approaching room temperature. A
given data point represent an average of 3-6 measurements, with typically a standard
deviation σ ≈ 0.0005 emu for the measured magnetization. The calculated Curie-Weiss
temperature, ueff and number of unpaired electrons depend on the quality of the fit of the
temperature dependence of the inverse magnetic susceptibility to straight line in the
paramagnetic region.
Chapter 4 Results Junshan Li
57
Chapter 4
Results
In this chapter will experimental results obtained in this study be presented and explained. In
the first section are the results from the exact formula weight determinations of some of the
starting materials used in the synthetic work and the cerimetric titration reported. The
following section describes the compounds we attempted to obtain in this study together with
their synthesis conditions. For the two phase-pure compounds LaSr3Fe3O10δ and
NdSr3Fe3O10δ, a wide series of oxygen deficient compositions were obtained by means of full
oxidation at low temperatures, quenching from high temperatures and Zr-reduction. The
oxidation state of the B-site cation (Fe) of fully oxidized-, as-synthesized- and reduced
samples was thereafter determined by cerimetric titration and thermogravimetric analysis.
Structural aspects of the fully oxidized and reduced samples were also evaluated with basis in
collected XRD and SRXRD data using Rietveld refining programs as TOPAS. Finally, in the
last subchapter are the magnetic susceptibility M(T) and hysteresis M(H) data of
LaSr3Fe3O10δ and NdSr3Fe3O10δ presented.
4.1 Synthesis
4.1.1 Determination of formula weight of starting materials
In order to carefully control the exact addition of certain elements to a synthesis or as a
titrant/reducing agent in the cerimetric titration, accurate formula weights of the starting
materials must be determined. The real formula weights of specific starting materials were for
the reason determined at the onset of the experiments by means of quantitative gravimetry.
Other starting materials were used “as-received” or after a firing at high temperatures. Table 9
shows the experimentally determined formula weights of SrCO3, Fe(COO)2·2H2O and
(NH4)2SO4·FeSO4·6H2O. The reported values are the mean value of four parallels.

August 2013 Chapter 4 Results
58
Table 9. Experimentally determined formula weights of some starting chemicals
Chemicals Decomposed
Oxides
Theoretical
formula
weight g/mol
Purity
%
Determined
formula
weight g/mol
1Comparative
ratio
%
SrCO3 SrO 147.63 ˃ 98 145.9 ± 0.3 98.80
Fe(COO)2·2H2O Fe2O3 179.89 99 178.2 ± 0.6 99.04
(NH4)2SO4·FeSO4·6H2O Fe2O3 392.14 99 391.8 ± 0.4 99.91
1Comparative ratio = Mean determined value / Theoretical number
The formula weight determinations were only conducted at the onset of usage. Each
decomposed chemical listed in Table 9 were confirmed from XRD to only contain their
expected corresponding oxides SrO and Fe2O3. (for equations and firing temperature, see
section 3.1.3, Page 46). The powder X-ray diffraction patterns of the calcination products are
presented in Appendix B (Page 126).
Experimental formula weights of each chemical show values similar to the theoretical values
(obtained directly from the product information, as shown in Table 9). The XRD pattern of
decomposed SrCO3, only show presence of SrO. As the experimental formula weight of
SrCO3 is lower than the theoretical one it may imply that it contains small quantities of SrO2
or Sr(OH)2 (not detectable with XRD), which would lead to a lower formula weight.
The formula weight of Fe(COO)2·2H2O is also slightly lower than the theoretical one, and this
is assumed to be due to loss of some crystal water. For the Mohr salt, the experimental
formula weight is the same as the theoretical within uncertainty of the work. The values used
in this work are the mean determined formula weights, reported in Table 9.
4.1.2 Synthesis conditions for LnxSr4xFe3O10δ (Ln = La, Nd)
Synthesis of new materials has long been recognized as the most essential element for
chemists within the field of materials science. The discovery of new compounds have mostly
happened serendipity, especially for the “first-discovery-structure” phases. However, the
same methods make it possible to synthesize similar compounds taking same/similar crystal
structure as the “first-discovery-structure” phases.

Chapter 4 Results Junshan Li
59
All the RP3 compounds being defined by the formulas LaxSr4xFe3O10δ and NdxSr4xFe3O10δ,
were made with the citric acid method. The heat treatment started with drying the sol-gel
solution from the wet synthesis step at 180 oC overnight resulting in a fine powder that
subsequently was calcined at 450 oC for 18-24 hours for every synthesis.
Figure 25. Powder X-ray diffraction pattern of fine LaSr3Fe3O10 powder calcined at 450 oC for
18-24 hours. Powder X-ray diffraction pattern was collected using monochromatic Cu Kα1 (λ =
1.540598 Å) radiation. Phase attribution: red vertical bars SrCO3.
Figure 25 displays the XRD pattern of the fine powder obtained for LaSr3Fe3O10, after being
calcined at 450 oC overnight. The resulting compound shows presence of a large amount of
strontium carbonate SrCO3 together with a mixture of La-Sr-Fe-O and La2O2CO3. The other
samples synthesized in this work , most likely also contain carbonate containing phases after
the step of calcining at 450 oC. Nature of the carbonates will most likely depend on x in the
composition LnxSr4xFe3O10δ (Ln = La, Nd). The presence of SrCO3 or other carbonates
phases (e.g. Ln2O2CO3, Ln = La, Nd) could make it difficult to form the desired RP3 phase,
see section 5.1.1 on Page 104, discussion part.
The following annealing programs for LnxSr4xFe3O10δ (Ln = La, Nd) powders calcined at
450 oC are reported in Tables 10 and 11. The most common approach to develop optimal
conditions for preparing phase pure compounds is to try different temperature-time-
atmosphere firing condition. The annealing programs reported in Tables 10 and 11 are the
recipies that gave the most well defined samples for the two series.

August 2013 Chapter 4 Results
60
Table 10. Best conditions for synthesizing compounds in the LaxSr4xFe3O10δ series
Compounds and its synthesis conditions1 Confirmation from XRD
x = 0.25 1000
oC×12 h
followed by 1150 oC × 12 h × 22
Close to pure phase
RP2 phase and perovskite
( see Figure 26 and Table 14)
x = 0.50 1000 oC × 12 h
followed by 1150 oC × 12 h × 2
Close to pure phase
RP2 phase and perovskite
( see Figure 26 and Table 14)
x = 0.75 1000 oC × 12 h
followed by 1200 oC × 12 h × 2
Pure phase
( see Figure 26 and Table 14)
x = 1.0
1000 oC × 12 h
followed by 1250 oC × 12 h × 2
Pure phase
(See Figure 26 and Table 14
Appendix C.1 for details) 1100 oC × 12h (Ar)× 2
x = 1.25 1000 oC × 12 h
followed by 1300 oC × 12 h × 2
Close to pure phase
perovskite
(See Appendix C.3 for details)
x = 1.5
1100 oC × 12 h (Ar) × 2 RP3 phase
RP1 and Perovskite
(See Appendix C.4 for details)
1000 oC×12 h
followed by 1150oC × 12 h × 2
x = 2.0
1100 oC × 12 h (Ar) × 2 RP3 phase
RP1 or RP2
Perovskite
(See Appendix C.5 for details)
1000 oC × 12 h
followed by 1200 oC × 12 h × 2
or 1250 oC × 12 h × 2
or 1300 oC × 12 h × 2
x = 3.0
1000 oC × 12 h
followed by 1200 oC × 12 h × 2
or 1250 oC × 12 h × 2
or 1300 oC × 12 h × 2
RP3 phase
RP1 or RP2
Perovskite
(See Appendix C.6 for details)
1All starting materials are pellets of the powders calcined overnight at 450 oC. The heating and cooling
speed is 5 oC/min. For the pure-phase (and close to) compounds, only successful synthesis conditions
are shown.
2E.g. 1150 oC × 12 h × 2 means that the sample was fired in air at 1150 oC for 12 hours twice within
one intermediate grounding and pelletizing.

Chapter 4 Results Junshan Li
61
Table 11. Best conditions for synthesizing compounds in the NdxSr4xFe3O10δ series
Compounds and its synthesis conditions1 Confirmation from XRD
x = 0.25 1000 oC × 12 h
followed by 1300 oC × 12 h × 22
Pure phase
( see Figure 27 and Table 15)
x = 0.50 1000 oC × 12 h
followed by 1300 oC × 12 h × 2
Close to pure phase
RP2 phase and perovskite
( see Figure 27 and Table 15)
x = 0.75 1000 oC × 12 h
followed by 1300 oC × 12 h × 2
Pure phase
( see Figure 27 and Table 15)
x = 1.0 1000 oC × 12 h
followed by 1350 oC × 12 h × 2
Pure phase
( see Figure 27 and Table 15)
x = 1.25
1000 oC × 12 h
followed by or 1200 oC × 12 h × 2
or 1250 oC × 12 h × 2
or 1300 oC × 12 h × 2
or 1350 oC × 12 h × 2
RP3 phase
RP1
Perovskite
(See Appendix C.8 for details)
x = 2.0
1050 oC × 15 h
followed by 1250 oC × 25 h
or 1350 oC × 25 h
or 1400 oC × 25 h
or 1450 oC × 25 h
or 1350 oC × 25 h and 1350oC × 24 h
RP3 phase
RP1
Perovskite
(See Appendix C.9 for details)
x = 3.0
1000 oC × 12 h
followed by 1250 oC × 12 h × 2
or 1300 oC × 12 h × 2
or 1350 oC × 12 h × 2
RP3 phase
RP2
Perovskite
(See Appendix C.10 for details)
1All starting materials are pellets of the powders calcined overnight at 450 oC. The heating and cooling
speed is 5 oC/min. For the pure-phase (and close to) compounds, only successful synthesis conditions
are shown.
2E.g. 1300 oC × 12 h × 2 means that the sample was fired in air at 1300 oC for 12 hours twice within
one intermediate grounding and pelletizing.

August 2013 Chapter 4 Results
62
Our synthesis strategy was to start with LaSr3Fe3O10δ and NdSr3Fe3O10δ (i.e. x = 1.0
compositions), as recipes for these two phases already are reported in the literature [44, 56,
59]. Some of initial trial synthesis of LnSr3Fe3O10–δ (Ln = La, Nd) was hydrated to some
degree, most of these compounds were not phase pure, see Appendix C.2 (Page 128) and C.7
(Page 134). Ln-Sr-Fe-O RP3 phases tend to undergo hydration or carbonization reactions at
ambient condition. The reactivity toward water and carbon dioxide is more aggressive for
oxides with higher oxygen vacancy concentration δ ~ 1 as water and carbon dioxide occupy
the vacant sites in the structure [67].
Some measures were taken to conquer this trouble, i.e. pellets put into and/or taken out of
furnace at annealing temperatures. These resulting as-synthesized and “quenched” samples
produced in this work cover a range of oxygen vacancies (δ < 0.5), see Table 13. This
measures would accelerate the hydration or carbonization. Therefore, a dry preparation
instead of using isopropanol for the XRD measurement was developed, see subchapter 3.2.1
on Page 49. The measurement was conducted right after finishing the preparation. In order to
avoid further hydration or carbonization, the as-synthesized powder was stored in Schlenk
tubes filled with Argon. The reduced powder was well kept in glove box (pO2 < 6 ppm, pH2O
< 1 ppm).
Optimal synthesis conditions for LaSr3Fe3O10δ and NdSr3Fe3O10δ were found to be
pelletizing powders (calcined at 450 oC overnight) and firing them at 1000
oC for 12 hours,
followed by twice 12-hour annealings at 1250 oC (LaSr3Fe3O10δ) and 1350
oC
(NdSr3Fe3O10δ) in air, respectively with intermediate grinding and pelleting. In addition,
LaSr3Fe3O10δ was also successfully prepared as single phase was in an Ar atmosphere at
1100 oC (two firing steps of 12 hours periods each with intermediate grindings), refer to
Appendix C.1 on Page 127 for XRD. Based on the optimized conditions and experience for
the two x = 1.0 phases, the solid solution series were tried to be expanded in both directions;
i.e. 0 < x < 4.0.
Figures 26 and 27 are the powder X-ray diffractograms of the nominal compositions of the
two series presented (0 < x ≤ 1.0) together with its annealing temperature. The powder X-ray
diffraction patterns present in both figures represent the most successful samples of these two
series.

Chapter 4 Results Junshan Li
63
Figure 26. XRD patterns of the series LaxSr4xFe3O10 for x = 0.25, 0.5, 0.75 and 1.0. Powder X-
ray patterns were collected using monochromatic Cu Kα1 (λ = 1.540598 Å) radiation.
Figure 26 displays the XRD patterns of LaxSr4xFe3O10 (x = 0.25, 0.5, 0.75, 1.0) series
compounds synthesized at different temperatures (for the refined data including phase fraction
and evaluation factor, see Table 14 section 4.3). For x = 0.25 and 0.5, there is observed one
small unidentified peak marked with “?” in the diffractograms. This small peak does not fit
the diffraction pattern of any of RP phases and it also seems that the peak not can be ascribed
to any other known phase. In EVA, there is not a PDF-card (Powder diffraction file) for 0 < x
≤ 1.0 in LaxSr4xFe3O10. Specifically, the LaSr3Fe3O10 and La0.75Sr3.25Fe3O10 crystallize in the
RP3 structures (Sr4Fe3O10x). A large amount secondary phase (RP2, Sr3Fe2O7 and
perovskite) was found from the two XRD patterns in La0.5Sr3.5Fe3O10 and La0.25Sr3.75Fe3O10
compounds synthesized at 1150 oC.

August 2013 Chapter 4 Results
64
Figure 27. XRD patterns of the series NdxSr4xFe3O10 series for x = 0.25, 0.5, 0.75 and 1.0.
Powder X-ray patterns were collected using monochromatic Cu Kα1 (λ = 1.540598 Å) radiation.
The collected powder X-ray diffraction patterns of NdxSr4-xFe3O10 series are shown in Figure
27 (for the refined data including phase fraction and evaluation factor, see Table 15, section
4.3). Powder X-ray analysis indicate that x = 0.25, 0.75, 1.0 members are phase pure.
However, using the same sintering program as for the other members, the powder X-ray
diffractogram of Nd0.5Sr3.5Fe3O10 sample includes some unexpected peaks of SrFeO3
(perovskite) and Sr3Fe2O7 (RP2 phase). The amount of the RP2 phase is most likely higher
than that of perovskite, see Table 15 on Page 73, section 4.3.

Chapter 4 Results Junshan Li
65
To the best to our knowledge, recipies for making phase pure samples La0.75Sr3.25Fe3O10,
Nd0.75Sr3.25Fe3O10 and Nd0.25Sr3.75Fe3O10 are reported for the first time in this study.
Attempt for expanding LnxSr4xFe3O10δ (Ln = La, Nd) series for x > 1.0 was conducted.
Unfortunately, no single phase compounds were only proved. The synthesis conditions we
used in this study and the results from the phase content analyses for these two series are
summarized in Tables 10 and 11. For XRD and phase content analysis, see Appendixes C.36
(Pages 130-133) and C.810 (Pages 135-137). For both series, powder X-ray diffraction
always showed presence of a RP2 (Ln,Sr)3Fe2O7δ or RP1 (Ln,Sr)2FeO4δ type phases
together with small quantities of a perovskite type phase (Ln,Sr)FeO3δ. The main
contaminants depend on the composition as well as annealing condition.
In the following experiments, we focused on the two phase-pure compounds LaSr3Fe3O10δ
and NdSr3Fe3O10δ.
4.2 Tuning of oxygen content in LnSr3Fe3O10δ (Ln = La, Nd)
To fill up the RP3 oxygen lattice to a value as close as possible to 10.00, the as synthesized
powders were oxidized under a flow of oxygen at approximately 350 oC for 3 days. On the
other hand, in order to obtain compounds with large oxygen deficiency (~0.5 < δ < ~1.5), the
following two methods were applied in this work:
“Quenching” method, by taking the sample out of the furnace at high temperature and
allow it to cool down to ambient temperature in the desiccator.
Reduction by Zr via the “chemical transport reaction” method.
The oxygen content of these obtained powders was subsequently determined with cerimetric
titration method. The obtained oxygen contents are reported in Tables 12 and 13, where each
reported value is the mean value obtained from the 3 parallel measurement. In addition,
oxygen content of some selected compounds were checked by TGA, see Table 22 on Page 93,
section 4.4.
An evaluation of the obtained oxygen contents of La and Nd (LnxSr4xFe3O10δ) are described
in section 4.2.1 and 4.2.2 whereas the results of corresponding evaluation of the XRD data is
presented in section 4.2.3.

August 2013 Chapter 4 Results
66
4.2.1 Oxygen content of LnSr3Fe3O10δ (Ln = La, Nd) prepared by the full oxidation and
“quenching” method
The oxygen contents of fully oxidized- and as-synthesized LnSr3Fe3O10δ (Ln = La, Nd) as
well as the powders obtained by quenching from high temperatures are reported with its
quenching temperature (200, 1250 and 1350 oC) in Table 12.
Table 12. Oxygen-content of fully oxidized, as-synthesized and quenched sample
Post treatment Fully
oxidized
1As-
synthesized
2200 oC
21250 oC for La series
21350 oC for Nd series
Oxygen
content
10δ
LaSr3Fe3O10δ 9.96
± 0.01
9.93
± 0.02
9.92
± 0.01
9.76
± 0.01
NdSr3Fe3O10δ 9.98
± 0.01
9.87
± 0.01
9.67
± 0.02
9.55
± 0.03
1As-synthesized samples were cooled down in the muffle furnace to ambient temperature with a rate of
5 oC/min. The pellets were crushed into powder and the cerimetric titrations were carried out right
after.
2200 oC, 1250 oC and 1350 oC means that the pellets were taken out of furnace at given temperature
and cooled down to ambient temperature in desiccator where the pellets were crushed into powder
immediately.
As illustrated in Table 12, cerimetric titration gave an oxygen content of 10δ = 9.96 ± 0.01
and 9.98 ± 0.01 for the fully oxidized LaSr3Fe3O10δ and NdSr3Fe3O10δ respectively. The
obtained results are quite close to what Jantsky et al. published results (10δ = 9.910(4) for
the fully oxidized PrSr3Co1.5Fe1.5O10δ) [67]. The cerimetric titration of the former oxidized
sample LaSr3Fe3O10δ was also conducted by Boklund [89], and she reported a similar result
10δ = 9.96 ± 0.03. For the as-synthesized LaSr3Fe3O10δ under Ar atmosphere, whose
oxygen content was determined to be 9.92 ± 0.01 (not included to Table 12). This value is
quite close to the as-synthesized sample cooling down (5 oC/min) in air.
Concerning as-synthesized sample and the sample being quenched to ambient temperature
from 200 oC or even higher temperatures, NdSr3Fe3O10δ series shows larger oxygen

Chapter 4 Results Junshan Li
67
deficiencies than that of LaSr3Fe3O10δ compounds. The range of oxygen content obtained
from full oxidized-, as-synthesized and quenching methods lies in 10δ > 9.5.
4.2.2 Oxygen content of LnSr3Fe3O10δ (Ln = La, Nd) prepared by Zr-reduction
LnSr3Fe3O10δ (Ln = La, Nd) do exist over a wide range of oxygen stoichiometries [15, 56].
Thus, the reduced oxides with lower oxygen content ~8.5 < 10δ < ~9.5 were prepared by the
chemical transport reaction as described in detail in subchapter 2.2 (Page 2.2) and 3.1.5 (Page
48). Size of δ was tuned from added quantities of Zr and RP3 oxide (as-synthesized samples,
the phase contents were conformed as phase pure RP3 by powder X-ray diffraction). In the
reduction reactor, Zr and RP3 oxide were kept at 750 oC and 500
oC, respectively for 3 days.
The reactor was opened in the glove box and the oxygen content of each reduced sample was
subsequently determined by cerimetric titration.
Table 13. Oxygen content of LnSr3Fe3O10δ produced by Zr reduction
Sample Oxygen content 10δ
LaSr3Fe3O10δ 8.68 ± 0.01 8.81 ± 0.02 9.00 ± 0.03 9.25 ± 0.01 9.46 ± 0.02
NdSr3Fe3O10δ 8.78 ± 0.01 9.00 ± 0.02 9.21 ± 0.01 9.39 ± 0.01
According to Table 13 the oxygen content of LaSr3Fe3O10δ and NdSr3Fe3O10δ were found to
be in the range 0.54 ≤ δ ≤ 1.32 and 0.61 ≤ δ ≤ 1.22, respectively.
Figure 28 displays the mean value, maximum and minimum (calculated from titration) of
each reduced oxide, in comparison with the theoretical value (calculated in advance assuming
that Zr reacts completely with RP3 oxides).

August 2013 Chapter 4 Results
68
Figure 28. Maximum, minimum, average and theoretical value of the titration data
As shown, this method worked very well when the oxygen content was reduced to the range
~9.00 < 10δ < 9.50. For the lower oxygen content (~8.50 < 10δ < ~9.00), the real value
deviated the calculated value for the oxide and Zr did not react completely (86.8% and
78.34% Zr were consumed to reduce as-synthesized LaSr3Fe3O9.92 and NdSr3Fe3O9.87 to O8.69
and O8.78 respectively). The approaches to higher oxygen deficiencies in RP3 oxides are
presented in section 5.2.2 on Page 109, discussion.
For the following expression of the composition, the mean titrated data are donated the “real”
value of the oxygen content. A discussion of the titrated values and the data calculated from
TGA (section 4.4) is presented in section 5.2.1 (Page 109).
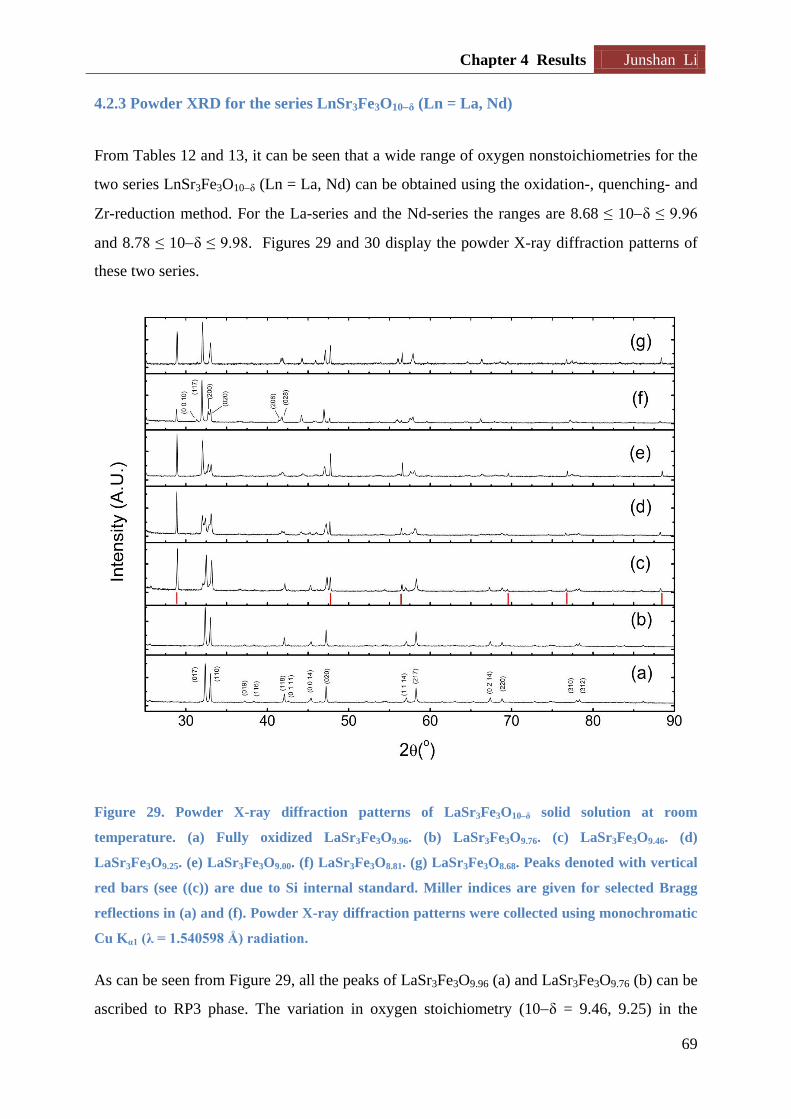
Chapter 4 Results Junshan Li
69
4.2.3 Powder XRD for the series LnSr3Fe3O10δ (Ln = La, Nd)
From Tables 12 and 13, it can be seen that a wide range of oxygen nonstoichiometries for the
two series LnSr3Fe3O10δ (Ln = La, Nd) can be obtained using the oxidation-, quenching- and
Zr-reduction method. For the La-series and the Nd-series the ranges are 8.68 ≤ 10δ ≤ 9.96
and 8.78 ≤ 10δ ≤ 9.98. Figures 29 and 30 display the powder X-ray diffraction patterns of
these two series.
Figure 29. Powder X-ray diffraction patterns of LaSr3Fe3O10δ solid solution at room
temperature. (a) Fully oxidized LaSr3Fe3O9.96. (b) LaSr3Fe3O9.76. (c) LaSr3Fe3O9.46. (d)
LaSr3Fe3O9.25. (e) LaSr3Fe3O9.00. (f) LaSr3Fe3O8.81. (g) LaSr3Fe3O8.68. Peaks denoted with vertical
red bars (see ((c)) are due to Si internal standard. Miller indices are given for selected Bragg
reflections in (a) and (f). Powder X-ray diffraction patterns were collected using monochromatic
Cu Kα1 (λ = 1.540598 Å) radiation.
As can be seen from Figure 29, all the peaks of LaSr3Fe3O9.96 (a) and LaSr3Fe3O9.76 (b) can be
ascribed to RP3 phase. The variation in oxygen stoichiometry (10δ = 9.46, 9.25) in the

August 2013 Chapter 4 Results
70
composition LaSr3Fe3O10δ leads to growth and disappearance of some peaks, these growth
Bragg reflections comes from a NdSr3Fe3O9 type phase. If the oxygen content in the samples
are less than O9.0 (10δ = 9.00, 8.81, 8.68), the structure is the same as NdSr3Fe3O9 [57]. For
more details regarding the crystal structural analysis see section 4.3.
Figure 30. Powder X-ray diffraction patterns of NdSr3Fe3O10δ solid solution at room
temperature. (a) Fully oxidized NdSr3Fe3O9.98. (b) As-synthesized NdSr3Fe3O9.87. (c)
NdSr3Fe3O9.39. (d) NdSr3Fe3O9.21. (e) NdSr3Fe3O9.00. (f) NdSr3Fe3O8.78. Peaks donated with
vertical red bars are due to Si internal standard. Miller indices given for selected Bragg
reflection in (a) and (e). Powder X-ray diffraction patterns were collected using monochromatic
Cu Kα1 (λ = 1.540598 Å) radiation.

Chapter 4 Results Junshan Li
71
As shown in Figure 30, powder Xray diagrams for the NdSr3Fe3O10δ series are almost
unchangeable for the composition 9.21 ≤ 10δ ≤ 9.98 and these peaks were indexed with a
tetragonal cell and space group I4/mmm, normally used for describing the tetragonal RP3
phases. NdSr3Fe3O9.00 and NdSr3Fe3O8.78 were found to be well described in an orthorombic
supercell (√ ap × √ ap × 28 Å3) crystallizing in the Bbmm space group. For more details
regarding the crystal structural analysis see section 4.3
4.3 Crystal structure refinement
The lattice parameters of each of the fully oxidized, as-synthesized as well as reduced
compounds were carefully determined by means of Profile fitting or by the Rietveld method
of conventional X-ray diffraction and Synchrotron radiation X-ray diffraction data using the
program TOPAS. Among the various possibilities of RP3 phases found in ICSD database, the
LaSr3Fe3O9.9 (Ccode: 72608), LaSr3Fe3O9.52 (Ccode: 72609) and NdSr3Fe3O9 (Ccode:
172509) were considered as the best choice staring parameters on the basis of atomic structure
considerations.
4.3.1 LnxSr4xFe3O10δ (Ln = La, Nd; 0 < x ≤ 1.0) series
It is highly relevant to calculate how the lattice parameters vary with different A-site cations
in the RP3 compounds. These parameters were obtained by Rietveld refinements of the
conventional X-ray diffraction data of the as-synthesized samples (without silicon as
standard) using the software TOPAS.
As earlier works show, the LnxSr4xFe3O10δ (Ln = La, Nd; 0 < x ≤ 1.0) series most probably
adopt the space group I4/mmm as LaSr3Fe3O9.9 with lattice parameters, a = b ≈ 3.86 Å, c ≈
28.00 Å for as-synthesized compounds [56]. The Rietveld refinements were carried out with
the atomic positions of previously studied LaSr3Fe3O9.9 [56]. For the A and B site, the
occupancy of each atom was in accordance with the chemical formula. Based on the results
from the titrated as-synthesized LaSr3Fe3O10δ with O9.92, the oxygen content of each as-
synthesized sample was fixed as O9.9 per formula unit. The refined unit cell parameters
together with their refinement evaluation factor (R-factors) are given in Tables 14 and 15 for
these two series LaxSr4xFe3O10δ (0 < x ≤ 1.0) and NdxSr4xFe3O10δ (0 < x ≤ 1.0) respectively.

August 2013 Chapter 4 Results
72
Table 14. Refined lattice parameters, phase fraction and reliability factor of LaxSr4xFe3O10 (x =
0.25, 0.5, 0.75, 1.0) series
LaxSr4xFe3O10 Space group Phase
fraction
Unit cell
parameters GOF Rexp Rwp Rp
a = b c
x = 0.25
I4/mmm (RP3) 7.51% 3.868 28.271
1.77 3.19 % 5.65 % 3.82 % I4/mmm (RP2) 68.41% 3.870 20.170
Pervoskite 24.08% 3.873 3.873
x = 0.5
I4/mmm (RP3) 69.33% 3.863 27.985
1.26 3.74% 4.72% 3.63% I4/mmm (RP2) 18.17% 3.867 20.181
Pervoskite 12.50% 3.872 3.872
x = 0.75 I4/mmm (RP3) 100 % 3.865 27.999 1.73 3.71% 6.43% 4.55%
x = 1.0 I4/mmm (RP3) 100 % 3.867 28.059 1.32 3.76% 4.97% 3.83%
Published
results
LaSr3Fe3O9.91 3.886 28.041 - - - -
LaSr3Fe3O102 3.87 28.03 - - - -
LaSr3Fe3O9.93 3.865 27.996 - - - -
Note: The refinement was carried with 2θ ranging from 15o to 90o.
1 Lattice parameters for LaSr3Fe3O9.9 are taken from Lee et al. [56]
2 Lattice parameters for LaSr3Fe3O10 are taken from K. Kuzushita et al. [65]
3 Lattice parameters for LaSr3Fe3O9.9 are taken from Cui et al. [90]

Chapter 4 Results Junshan Li
73
Table 15. Refined lattice parameters, phase fraction and reliability factor of NdxSr4xFe3O10 (x =
0.25, 0.5, 0.75, 1.0) series
NdxSr4xFe3O10 Space group Phase
fraction
Unit cell
parameters (Å) GOF Rexp Rwp Rp
a = b c
x = 0.25 I4/mmm (RP3) 100 % 3.855 27.998 1.25 5.03 % 6.27% 4.80%
x = 0.5
I4/mmm (RP3) 12.14% 3.875 26.990
1.28 4.83% 6.19% 4.60% I4/mmm (RP2) 70.54% 3.868 20.158
Pervoskite 17.31% 3.868 3.868
x = 0.75 I4/mmm (RP3) 100 % 3.853 28.044 1.27 5.59% 7.09% 5.35%
x = 1.0 I4/mmm (RP3) 100 % 3.856 28.046 1.16 4.20 % 4.87 % 3.84 %
Note: The refinement was carried with 2θ ranging from 15o to 90o.
As can be seen in these two tables, the evaluation factor GOF, Rexp, Rwp and Rp suggest that
the result is valid. The calculated unit cell parameters for LaSr3Fe3O9.92 are a = b = 3.867 Å, c
= 28.059 Å, these values agree with previously reported data, which depending on the
synthesis conditions and the oxygen content of the sample lie in the range: a = b = 3.865 –
3.886 Å, and c = 27.996 – 27.041 Å [56, 65, 90].
More specifically, graphs were plotted with RP3 phase unit cell parameters as a function of x
in the composition (see Figure 31) being in accordance with Tables 14 and 15, and for the
powder X-ray diffraction patterns for these two series, see Figures 26 and 27 (Pages 63 and 64
respectively), in section 4.1.2.

August 2013 Chapter 4 Results
74
Figure 31. Unit cell parameter of the LnxSr4xFe3O10 (x = 0.25, 0.5, 0.75, 1.0) series. (a)
LaxSr4xFe3O10 (x = 0.5, 0.75, 1.0) series. (b) NdxSr4xFe3O10 (x = 0.25, 0.75, 1.0) series. Red filled
square dots present the corresponding compound contains secondary phases.
As plotted in Figure 31, for phase pure compounds, a and b axis parameters of La and Nd
series are in the range 3.850 – 3.870 Å while c axis parameters of these two series are in the
range 27.999 – 28.059 Å and 27.998 – 28.046 Å respectively.
It should be pointed out that the real phase fraction of a mixture probably is not as the value
given by TOPAS, there are many peaks overlapping thus it is not certain. For LaxSr4xFe3O10
(x = 0.5), the refined lattice parameters of the RP3 phase are quite close to the value for x =
0.75, 1.0 composition, see red dots in Figure 31.a. TOPAS suggests that the main phase of
sample La0.5Sr3.5Fe3O10 is RP3 structure with 18.17% RP2 phase and 12.50% perovskite
phase as contaminant.
Large variation exists in the sample with high amount of secondary phase. As for
NdxSr4xFe3O10 (x = 0.5), the synthesized sample is a mixture of 12.14% RP3 phase, 17.31%
perovskite phase and the main phase is RP2 (Nd,Sr)3Fe2O7 phase. The calculated lattice
parameter (see Table 15) for RP3 phase Nd0.5Sr3.5Fe3O10 deviates strongly with that of other

Chapter 4 Results Junshan Li
75
phase-pure sample in NdxSr4xFe3O10 (x = 0.25, 0.75, 1.0). The same phenomenon is observed
in LaxSr4xFe3O10 (x = 0.25), see Table 14 on Page 72. One reason is that the sample
containing more than 50% secondary phases, the unit cell information seems less reliable.
Moreover, the most likely reason is that these phases are of other structures.
4.3.2 LnSr3Fe3O10δ (Ln = La, Nd; 0 < δ < 1.5) series
The focus has been given to the composition LnSr3Fe3O10δ (Ln = La, Nd). Among these
oxygen deficient LnSr3Fe3O10δ RP3 phases (~8.5 < 10δ < 10), it is reported that the
I4/mmm symmetry (ap × ap × ~28 Å3, ap is the parameter of the perovskite unit cell) of the
LaSr3Fe3O10δ is retained for the reduced samples (~9.2 < 10δ < 9.9) [56]. With larger
oxygen deficiencies (δ~1), the phases have a reduced symmetry and are well described with
NdSr3Fe3O9 as an example from literature, with a distorted orthorhombic lattice [57]. The
variation in the unit cell dimensions was currently evaluated for a supercell (√ ap × √ ap × 28
Å3) crystallizing in the Bbmm space group.
4.3.2.1 Conventional XRD analysis
4.3.2.1.1 LaSr3Fe3O10δ (8.68 ≤ 10δ ≤ 9.96) series
The XRD patterns for LaSr3Fe3O10δ series (~8.68 ≤ 10δ ≤ 9.96) were plotted in Figure 29.
Meanwhile the Rietveld refinement was first carried out with fixed atomic positions according
to the previous study (LaSr3Fe3O9.9 [56] and NdSr3Fe3O9 [57]). These two published atomic
data were used to refine LaSr3Fe3O10-δ (~9.2 < 10δ < 9.9) and LaSr3Fe3O10δ (8.68 ≤ 10δ <
~9.2), respectively.
The refinement is in very good agreement with expected results, especially when the oxygen
stoichiometry is close to that of the earlier studied compounds (see Figure 32). The refined
unit cell parameters and the reliability factors are illustrated in Table 16.

August 2013 Chapter 4 Results
76
Figure 32. Refined pattern of the LaSr3Fe3O10δ. The refinement was conducted in the 2θ range
2690o. (a) LaSr3Fe3O9.96. The vertical blue bars mark the Bragg peaks according to the I4/mmm
space group. (b) Reduced sample LaSr3Fe3O9.00. The vertical bars mark the Bragg peaks
according to the Bbmm space group and the vertical blue ones mark the Silicon (internal
standard) peaks. The grey line is the difference between the calculated pattern (red line) and
observed pattern (blue line in a and black line in b).

Chapter 4 Results Junshan Li
77
Table 16. Refined lattice parameters and reliability factors for LaSr3Fe3O10δ
Oxygen
content
10-δ
Space group Phase
fraction
Unit cell parameters (Å)
GOF Rexp Rwp Rp
a b b
9.96 I4/mmm 100 % 3.867 3.867 28.059 1.32 3.76% 4.97% 3.83%
9.76 I4/mmm 100 % 3.866 3.866 28.122 1.48 3.99% 5.9% 4.44%
9.00 Bbmm 100 % 5.541 5.485 28.835 1.83 4.52% 8.25% 6%
8.81 Bbmm 100 % 5.537 5.495 28.935 1.26 11.28% 1.42% 11.08%
8.68 Bbmm 100 % 5.501 5.501 28.946 1.09 8.76% 9.58% 7.61%
Note: Some patterns used Silicon as internal standard and the refined phase fraction only show the
refined phases.
It is reported that LaSr3Fe3O10δ is of ideal I-type tetragonal RP3 structure without distortions
even though the oxygen nonstoichometry is as high as δ~0.8 [56]. When the I4/mmm
(RP3phase) was used to refine the LaSr3Fe3O9.46 and LaSr3Fe3O9.25, the refined pattern
contains some extra peaks. As can be seen from the XRD pattern, some peaks grow (see
Figure 29.c and d on Page 69) when the oxygen stoichiometry decrease to ~O9.46 and ~O9.25.
These peaks can be ascribed to the reduced structure (NdSr3Fe3O9), thus two structures were
required to refine the two compounds two phases coexisting, see Table 17.
Table 17. Refined lattice parameters and reliability factors for LaSr3Fe3O9.46 and LaSr3Fe3O9.25
Sample LaSr3Fe3O9.46 LaSr3Fe3O9.25
Space
group I4/mmm Bbmm I/4/mmm I4/mmm Bbmm I/4/mmm
Unit cell
parameters
(Å)
a = b
= 3.878
c = 28.301
a = 5.497
b = 5.512
c = 28.838
a = b=
3.878
c = 28.307
a = b
= 3.883
c = 28.367
a = 5.497
b = 5.513
c = 28.838
a = b =
3.888
c = 28.651
Phase
fraction 79.19% 20.81% 100% 55.84% 44.16% 100%
GOF 1.3 1.52 1.48 2.12
Rexp 11.48% 11.50% 11.37% 11.40%
Rwp 14.96% 17.49% 16.86% 24.12%
Rp 11.82% 13.80% 13.34% 18.59%

August 2013 Chapter 4 Results
78
The evaluation factors (R-values) show a major improvement for the refinement when these
two compounds being refined with two phases. This is further obvious from visual inspection
of observed, calculated and difference curve of the Rietveld refined fit, i.e. LaSr3Fe3O9.46 see
Figure 33.
Figure 33. Refined XRD patterns for LaSr3Fe3O9.46, silicon as internal standard. (a) The XRD
pattern is the phase LaSr3Fe3O9.46 refined by one structure (LaSr3Fe3O9.9). (b) The XRD pattern
is the phase LaSr3Fe3O9.46 refined by two structures, LaSr3Fe3O9.9 and LaSr3Fe3O9.

Chapter 4 Results Junshan Li
79
The trend of lattice parameters for LaSr3Fe3O10-δ as a function of oxygen content 10-δ is
plotted in Figure 34 according to the data listing in Tables 16 and 17 on Page 77.
Figure 34. Lattice parameters for LaSr3Fe3O10δ as a function of oxygen content 10δ. Red lines
are unit cell parameters obtained by refining with Bbmm space group while black lines are from
I4/mmm space group. Blue triangle dots are obtained via being refined this compound only
using I4/mmm space group.
The unit cell parameters a and b for LaSr3Fe3O10δ series is slightly changing (less than 1.5%
for single RP3 phase) with the oxygen stoichiometry. As it shows that Bbmm structure has the
a and b axis parameters √ times more than that of I4/mmm space groups, thus the red data in
a and b unit cell dimensions is ~√ times over the black data in Figure 34.a and b. A linear
relationship between the c-axis parameter and oxygen content is obtained if the c parameter
was obtained from the RP3 phase (see blue dashed line). This trend of c axis parameters
matches the published results well.
Therefore, it is certain that the reduced compounds with oxygen content ranging from ~O9.10
to ~O9.50 (as yellow area shows in Figure 34) are two phases coexisting.
4.3.2.1.2 NdSr3Fe3O10δ (8.78 ≤ 10δ ≤ 9.98) series
As shown in Figure 30, the XRD diagram for the NdSr3Fe3O10δ series are almost
unchangeable, adopting the I4/mmm space group even when the oxygen stoichiometry was
reduced as low as O9.21. Single-phase structure was used to refine unit cell dimensions from
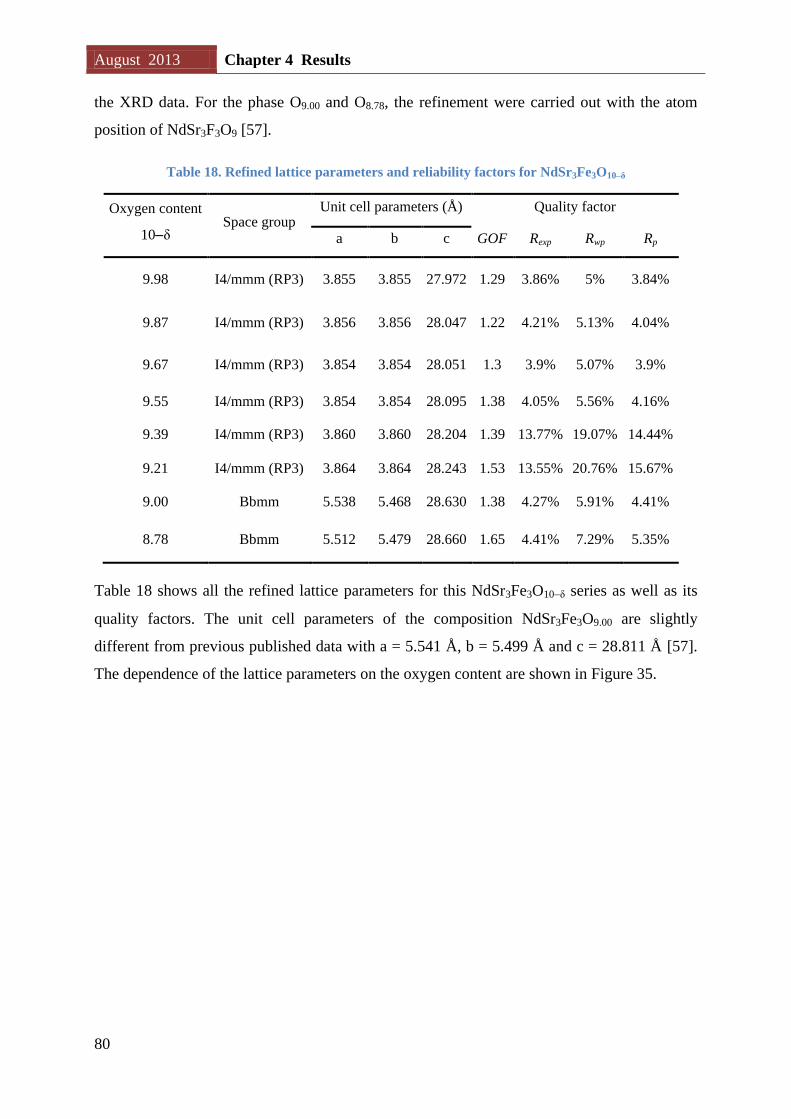
August 2013 Chapter 4 Results
80
the XRD data. For the phase O9.00 and O8.78, the refinement were carried out with the atom
position of NdSr3F3O9 [57].
Table 18. Refined lattice parameters and reliability factors for NdSr3Fe3O10δ
Oxygen content
10δ Space group
Unit cell parameters (Å) Quality factor
a b c GOF Rexp Rwp Rp
9.98 I4/mmm (RP3) 3.855 3.855 27.972 1.29 3.86% 5% 3.84%
9.87 I4/mmm (RP3) 3.856 3.856 28.047 1.22 4.21% 5.13% 4.04%
9.67 I4/mmm (RP3) 3.854 3.854 28.051 1.3 3.9% 5.07% 3.9%
9.55 I4/mmm (RP3) 3.854 3.854 28.095 1.38 4.05% 5.56% 4.16%
9.39 I4/mmm (RP3) 3.860 3.860 28.204 1.39 13.77% 19.07% 14.44%
9.21 I4/mmm (RP3) 3.864 3.864 28.243 1.53 13.55% 20.76% 15.67%
9.00 Bbmm 5.538 5.468 28.630 1.38 4.27% 5.91% 4.41%
8.78 Bbmm 5.512 5.479 28.660 1.65 4.41% 7.29% 5.35%
Table 18 shows all the refined lattice parameters for this NdSr3Fe3O10δ series as well as its
quality factors. The unit cell parameters of the composition NdSr3Fe3O9.00 are slightly
different from previous published data with a = 5.541 Å, b = 5.499 Å and c = 28.811 Å [57].
The dependence of the lattice parameters on the oxygen content are shown in Figure 35.

Chapter 4 Results Junshan Li
81
Figure 35. Lattice parameters for NdSr3Fe3O10δ as a function of oxygen content 10-δ. Red dot
data in figure (a) and (b) are the value
√ and
√ , where a and b are the refined value for the
phase NdSr3Fe3O9.00 and NdSr3Fe3O8.78, while red data in figure (c) are the volume
,
where unit cell parameter are for the phase NdSr3Fe3O9.00 and NdSr3Fe3O8.78.
It is shown that a- and b- axis parameters slightly increase in the range 3.8553.905 Å with
less oxygen content in these two phases. However, it shows a linear relationship between c
parameters and oxygen stoichiometry in the I-type structure (see red trend line in Figure 35.c).
Specifically, c-axis parameters decrease linearly from 28.243 Å to 27.972 Å when the phase
containing O9.21 is oxidized to O9.98. The c parameter of ideal I-type RP3 structure is smaller
than that of distorted orthorhombic lattice.
The calculated volume of this series also increases with less oxygen content (10δ) in the
composition NdSr3Fe3O10-δ. This phenomenon is expected since the oxidation state is higher
for I-type than for the reduced orthorhombic.

August 2013 Chapter 4 Results
82
4.3.2.2 Synchrotron XRD analysis
Some selected samples were analyzed with Synchrotron radiation XRD to investigate the
atomic position, oxygen vacancies as well as interatomic bond lengths as a function of the
oxygen stoichiometry.
4.3.2.2.1 LaSr3Fe3O10δ (10δ = 9.96, 8.68) series
It is found that some weak peaks near 10.4o (see Figure 36, red circle) and 13.5
o (see Figure
36, blue circle) in the SRXRD pattern due to the second phases. K.Kuzushita [65] ascribed
these peaks correspond to SrFeO3 and RP1 phase (LaSrFeO4), respectively. Thus, perovskite,
RP1, RP2 as well as other possible phases in composition (La-Sr-Fe-O) were attempted
included in order to refine this pattern. No single phase could fit all these observed peaks.
However, intensities of these two peaks were so weak that they were ignored for the structure
analysis.
Figure 36. SRXRD pattern of Rietveld refinement of LaSr3Fe3O9.96. The refinement was carried
out in the range 2θ = 835o. Powder X-ray patterns were collected using monochromatic Cu Kα1
(λ = 1.540598 Å) radiation. Space group I4/mmm, a = b = 3.872 Å, c = 28.063 Å, GOF = 0.88, Rexp
= 14.12%, Rwp = 12.37%, Rp = 8.42%.
The atomic positions, occupancy and thermal parameters for LaSr3Fe3O9.92 and LaSr3Fe3O8.68
obtained from the Rietveld refinement are summarized in Table 19.

Chapter 4 Results Junshan Li
83
Table 19. Refined atomic coordinates and thermal parameters from SRXRD data for
LaSr3Fe3O9.96 and LaSr3Fe3O8.68 at room temperature
Site Atom x y z Occupancy Beq
LaSr3Fe3O9.96
B1 Fe+3.67 0 0 0 1 0.002
B2 Fe+3.67 0 0 0.1406 1 0.002
A1 La+3 0 0 0.5692 0.25 0.323
Sr+2 0 0 0.5692 0.75 0.323
A2 La+3 0 0 0.7007 0.25 0.323
Sr+2 0 0 0.7007 0.75 0.323
O1 O-2 -0.5 0.0661 0.1362 1 1.171
O2 O-2 0 0 0.0646 1 1.171
O3 O-2 0 0 0.2110 1 1.171
O4 O-2 0.1291 0 -0.0178 0.91 1.171
Space group I4/mmm, a = b = 3.872 Å, c = 28.063 Å
GOF = 0.88, Rexp = 14.12%, Rwp = 12.37%, Rp = 8.42%
LaSr3Fe3O8.68
B1 Fe+2.79 0.2700 0.7504 0.1469 1 0.015
B2 Fe+2.79 0.2635 0.7376 0.0102 1 0.015
A1 La+3 -0.2493 0.7139 0.2009 0.25 0.885
Sr+2 -0.2493 0.7139 0.2009 0.75 0.885
A2 La+3 -0.2506 0.71560 0.0794 0.25 0.885
Sr+2 -0.2506 0.7160 0.0794 0.75 0.885
O1 O-2 0.1799 0.3515 0.1489 0.90 0.212
O2 O-2 0.4108 0.9685 0.1320 0.67 0.212
O3 O-2 0.2153 0.8316 0.1977 1 0.212
O4 O-2 0.2246 0.7827 0.0570 1 0.212
O5 O-2 0.3543 0.1368 0 1 0.212
Space group: Bbmm, a = 5.515 Å, b = 5.503 Å, c = 28.905 Å
GOF = 0.84, Rexp = 14.12%, Rwp = 11.89%, Rp = 8.64%

August 2013 Chapter 4 Results
84
These data agree well with those published LaSr3Fe3O9.96 (Ccode: 72608) [56] and
NdSr3Fe3O9 (Ccode: 172509) [57] respectively, see Tables 5 and 6 on Page 17, subchapter
1.5.1. Nevertheless, it should be noted that the result from the Rietveld refinement reveal
information about the crystal structure, but limited by the quality of SRXRD pattern. In
practice, the uncertainty of thermal parameters might be large, i.e. Fe ion on the B site. For
the LaSr3Fe3O8.68 specimen, the oxygen vacancies in the distorted orthorhombic structure are
mainly located on the O2 site of the equatorial layer between the perovskite slabs.
4.3.2.2.2 NdSr3Fe3O10δ (9.00 ≤ 10δ ≤ 9.87) series
The unit cell parameters, oxygen occupancy, bond length and bond valence sum (BVS) in the
series NdSr3Fe3O10δ (10δ = 9.00, 9.21, 9.39, 9.67, 9.87) were investigated by means of
SRXRD. Some weak extra peaks exist in the SRXRD patterns in this series; however,
endeavor of ascribing these low intensity peaks failed.
Table 20. Refined data for NdSr3Fe3O10δ series obtained from SRXRD patterns
Oxygen content
10-δ
Lattice parameters Quality factor
a = b (Å) c (Å) V (Å3) GOF Rexp Rwp Rp
9.87 3.857 27.980 416.235 0.64 15.49% 9.92% 6.9%
9.67 3.860 28.073 418.285 0.71 14.97% 10.58% 7.25%
9.39 3.865 28.215 420.927 0.89 13.97% 12.46% 8.6%
9.21 3.862 28.243 421.144 1.42 13.66% 19.45% 11.74%
Space group I/4mmm
9.00 a = 5.539
b = 5.471 28.637 867.812 0.49 14.32% 6.96% 5.01%
Space group Bbmm
The refinement was carried out in the range 2θ = 8 - 36o
The lattice parameters and quality factors for NdSr3Fe3O10δ (10δ = 9.00, 9.21, 9.39, 9.67,
9.87) are listed in Table 20. When compared these data being refined with XRD and SRXRD
data, in Tables 18 (Page 80) and 20 respectively. They both show the same unit cell
parameters apart from that SRXRD have larger qualify factor.

Chapter 4 Results Junshan Li
85
It is evidenced that the oxygen vacancies in these tetragonal phases are predominantly located
to the FeO2 layers in the middle of the triple perovskite block [56, 91]. The occupancy of O1,
O2 and O3 site as well as B site was fixed at 1.0. Due to similar scattering lengths for La Nd
and Sr, the composition ratio was not refined and was fixed to 0.25/0.75 as the known
composition.
Figure 37. Refined O4 occupancy as function of oxygen content (9.21 ≤ 10δ ≤ 9.87). The
occupancy of O1, O2 and O3 site was fixed at 1.0.
The refined occupancy of O4 site is decreasing stably from 85% to 59% for the phase O9.87
and O9.21, as shown in Figure 37. It is noticeable that the TOPAS software has certain errors.
With lower oxygen occupancy on the O4 site, the hypothetical compound LnSr3Fe3O9 might
have a structure in which two octahedral layers are connected by a tetrahedral layer.

August 2013 Chapter 4 Results
86
Table 21. Selected interatomic bond length (Å) and angles (o) resulting from Rietveld refinement
of SRXRD data of various NdSr3Fe3O10δ compounds
Composition NdSr3Fe3O10δ
Oxygen content
10-δ 9.87 9.67 9.39 9.21 9.00
Space group I4/mmm
Bbmm
Bond Bond length (Å)
Bond
Bond
length
(Å)
(Fe1-O2) × 2
(Fe1-O4) × 2
(Fe1-O4) × 2
1.892
1.854
2.012
1.855
1.952
1.963
1.768
1.753
2.113
1.778
1.626
2.283
Tetrahedra
(Fe2-O4) × 2
Fe2-O5
Fe2-O5
1.736
1.875
2.101
(Fe2-O1) × 2
(Fe2-O1) × 2
Fe2-O2
Fe2-O3
1.930
1.931
2.026
2.016
1.925
1.939
2.096
1.993
1.904
1.970
2.241
2.005
1.933
1.937
2.243
1.959
Octahedra
(Fe1-O1) × 2
(Fe1-O2) × 2
Fe1-O3
Fe1-O4
1.956
1.960
1.979
2.495
(La/Sr1-O1) × 2
(La/Sr1-O1) × 2
(La/Sr1-O2) × 4
(La/Sr1-O4) × 2
(La/Sr1-O4) × 2
2.694
2.728
2.728
2.615
2.664
2.693
2.694
2.731
2.507
2.548
2.651
2.689
2.744
2.748
2.752
2.655
2.675
2.744
2.601
2.695
(La/Sr1-O1) × 2
(La/Sr1-O2) × 2
La/Sr1-O3
La/Sr1-O3
La/Sr1-O3
(La/Sr1-O3) × 2
2.674
2.735
2.383
2.726
2.848
2.753
(La/Sr2-O1) × 2
(La/Sr2-O1) × 2
(La/Sr2-O3) × 4
La/Sr2-O3
2.623
2.658
2.743
2.419
2.643
2.643
2.744
2.435
2.633
2.671
2.751
2.410
2.651
2.675
2.749
2.399
(La/Sr2-O1) × 2
(La/Sr2-O2) × 2
La/Sr2-O4
(La/Sr2-O4) × 2
La/Sr2-O4
(La/Sr2-O5) × 2
2.584
2.559
2.591
2.805
3.078
2.472
Bond Bond angle (o)
O2-Fe1-O2
O4-Fe1-O4
O4-Fe1-O4
180
87.64
93.96
180
86.79
93.21
180
87.47
92.52
180
87.88
92.12
O1-Fe2-O1
O1-Fe2-O1
O2-Fe2-O3
88.48
91.52
180
89.82
93.13
180
88.18
91.24
180
88.93
90.55
180
The bond lengths and bond angles from the SRXRD refinement are shown in Table 21, these
data are in agreement with published results [56]. The bond length and angle between cation
(La/Sr, Fe) and O4 site anion significantly changes and strongly depends on the oxygen
content. The apical Fe1-O2 bond lengths are significantly shorter than the equatorial values
(Fe2-O2/O3).

Chapter 4 Results Junshan Li
87
Along the stacking direction c, the Fe1-O2 bond length of the apical octahedra decrease from
1.892 Å to 1.778 Å for the phase O9.87 and O9.21, and the Fe2-O2 bond length of the equatorial
octahedra increase from 2.026 Å to 2.243 Å respectively for the two phases. Interestingly, the
other bond length of Fe2-O3 in the equatorial octohedra is stable around 2 Å.
The (La/Sr)1 is in a dodecahedral site with relatively stable values except the bond with O4
site, depending on the oxygen vacancies. The other (La/Sr)2 is in ninefold coordination, a
monocapped square antiprism with oxygen bond distances varying from 2.410 to 2.751 Å.
Figure 38. Variation of z fractional coordinates with oxygen content. Fe1 is fixed at the origin
(0,0,0).

August 2013 Chapter 4 Results
88
As shown in Figures 34 and 35 (Pages 79 and 81 respectively), the variation of c-axis
increases linearly with the oxygen nonstoichometry of the sample. This phenomenon can be
evidenced by the fact that the z fractional coordinates of cation increase slightly with the
nonstoichometry.
Brown and Altermatt proposed the term Bond Valence Sum (BVS) [92, 93], which can be
calculated by the following equation for all the cation sites:
(
) Equation 42
Rij is the empirically determined distance for a given cation-anion pair, Dij is a function of
atomic coordinates (x, y, z) and unit cell parameters (a, b, c, α, β, γ) and b is an empirical
constant 0.37. Values of Rij that give bond valence sums of its oxidation state and its anion
have been tabulated.
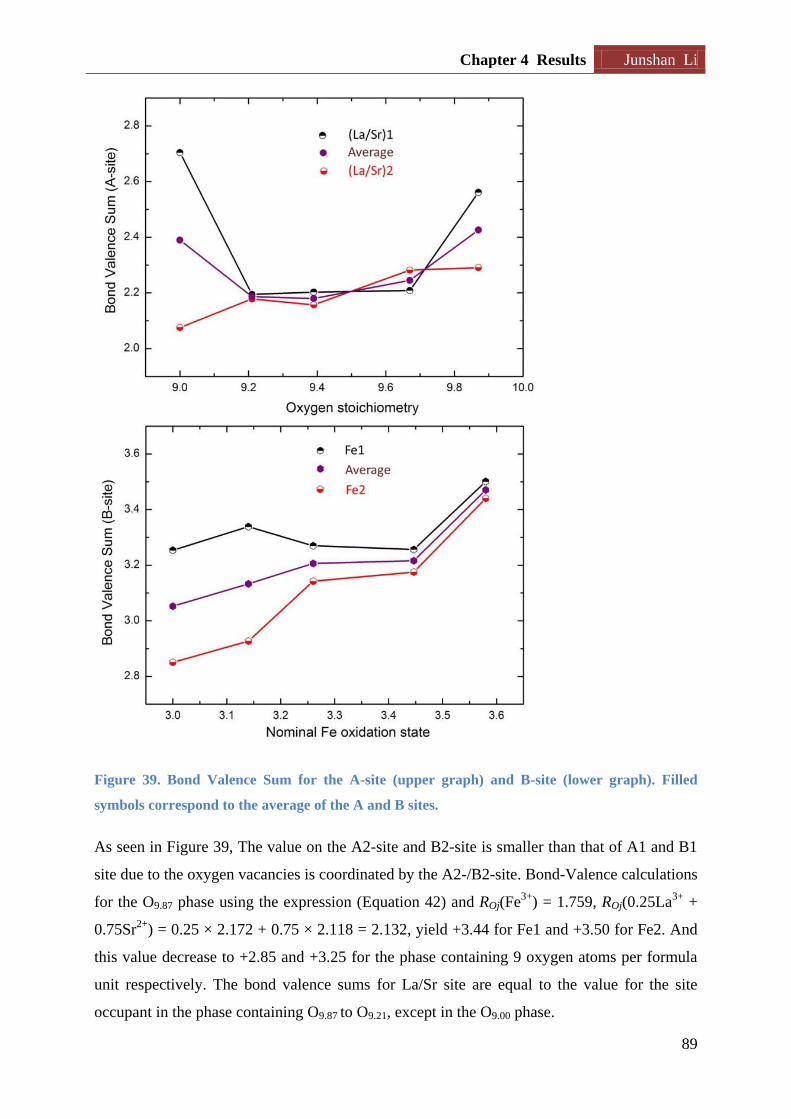
Chapter 4 Results Junshan Li
89
Figure 39. Bond Valence Sum for the A-site (upper graph) and B-site (lower graph). Filled
symbols correspond to the average of the A and B sites.
As seen in Figure 39, The value on the A2-site and B2-site is smaller than that of A1 and B1
site due to the oxygen vacancies is coordinated by the A2-/B2-site. Bond-Valence calculations
for the O9.87 phase using the expression (Equation 42) and ROj(Fe3+
) = 1.759, ROj(0.25La3+
+
0.75Sr2+
) = 0.25 × 2.172 + 0.75 × 2.118 = 2.132, yield +3.44 for Fe1 and +3.50 for Fe2. And
this value decrease to +2.85 and +3.25 for the phase containing 9 oxygen atoms per formula
unit respectively. The bond valence sums for La/Sr site are equal to the value for the site
occupant in the phase containing O9.87 to O9.21, except in the O9.00 phase.

August 2013 Chapter 4 Results
90
4.4 Thermogravimetric investigation
Some selected samples were investigated by monitoring the relative weight change by
thermogravimetric (TG) measurements as a function of temperature in the range from 30 oC
to 1200 oC in air. Previous work shows that the weight change of the moisture-free samples in
air attributes to oxygen loss and gain upon heating and cooling. In this work, the oxygen
content of the RP3 compound is plotted versus temperature assuming that all mass changes
are due to loss and gain of/from to the oxygen lattice of the RP3 compounds (for calculation
see Appendix C). In the TGA measurements, the flow speed of air is 50 ml/min while the
protective gas N2 is 25 ml/min, thus the calculated pO2 is 14% (Air is of 21% oxygen and
78% Nitrogen).
4.4.1 Oxidized samples
The thermal behavior of the oxidized sample with LaSr3Fe3O9.96 and NdSr3Fe3O9.98 were
investigated in air, as displayed in Figure 40.
Figure 40. Oxygen content of fully oxidized LnSr3Fe3O10δ (Ln = La, Nd) series as a function of
temperature.

Chapter 4 Results Junshan Li
91
The TGA results clearly show that these two samples display the same behavior under the
same heating and cooling condition. Upon heating, no net mass change was observed from
room temperature to around 300 oC. Above 300
oC, both LaSr3Fe3O9.96 and NdSr3Fe3O9.98
start to release oxygen gradually, reaching O9.15 and O9.18 at 200 oC. Cooling the same
samples in air reversibly intercalates oxygen into the structure with final composition of O9.92
and O9.96 at room temperature.
4.4.2 Reoxidation of reduced samples
For the LaSr3Fe3O10δ series, the nominal composition with LaSr3Fe3O9.46, LaSr3Fe3O9.00 and
LaSr3Fe3O8.68 were reoxidized in the TGA in air. As TOPAS gives, nominal composition
LaSr3Fe3O9.46 is of 79.19% RP3 LaSr3Fe3O10δ phase and 20.81% LaSr3Fe3O9 type structure.
The oxygen content of each measured sample is consistent with titrated data and then this
value is change with elevated temperature due to mass loss and gain, for calculations see
Appendix D.
Figure 41. Oxygen content of some oxygen deficient LaSr3Fe3O10δ series as a function of
temperature. Closed symbols are the data being obtained by heating, while open symbols are
from cooling.
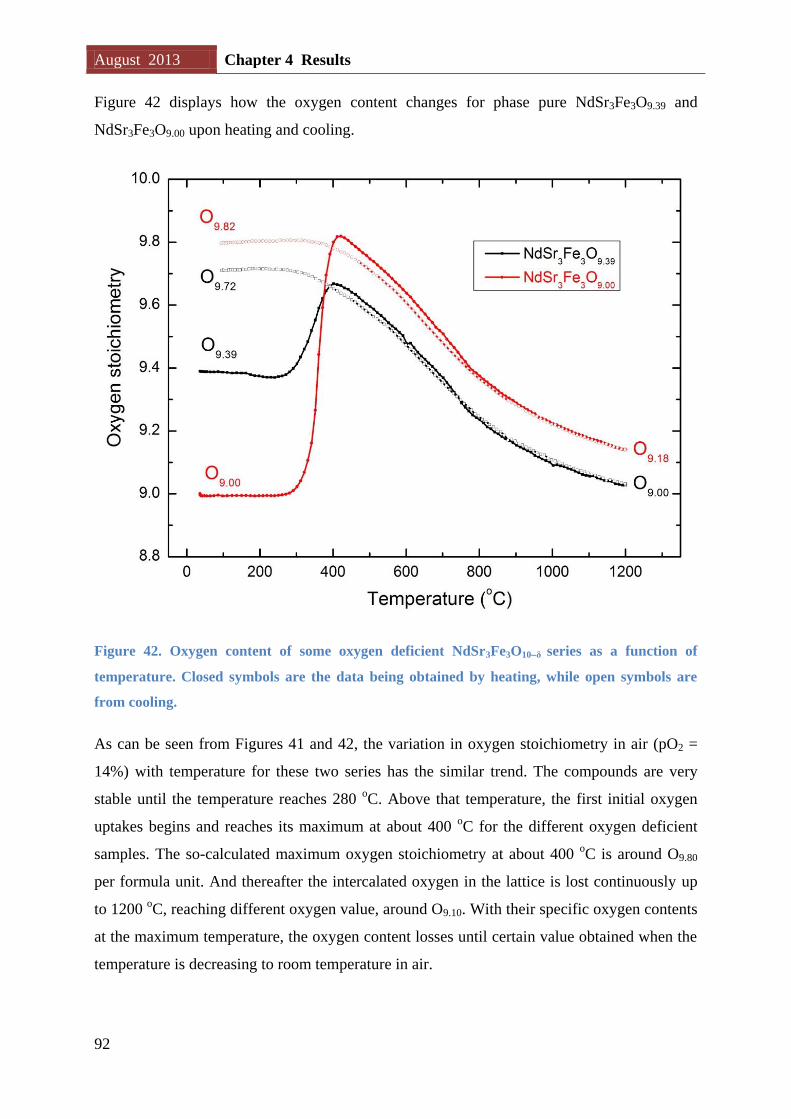
August 2013 Chapter 4 Results
92
Figure 42 displays how the oxygen content changes for phase pure NdSr3Fe3O9.39 and
NdSr3Fe3O9.00 upon heating and cooling.
Figure 42. Oxygen content of some oxygen deficient NdSr3Fe3O10δ series as a function of
temperature. Closed symbols are the data being obtained by heating, while open symbols are
from cooling.
As can be seen from Figures 41 and 42, the variation in oxygen stoichiometry in air (pO2 =
14%) with temperature for these two series has the similar trend. The compounds are very
stable until the temperature reaches 280 oC. Above that temperature, the first initial oxygen
uptakes begins and reaches its maximum at about 400 oC for the different oxygen deficient
samples. The so-calculated maximum oxygen stoichiometry at about 400 oC is around O9.80
per formula unit. And thereafter the intercalated oxygen in the lattice is lost continuously up
to 1200 oC, reaching different oxygen value, around O9.10. With their specific oxygen contents
at the maximum temperature, the oxygen content losses until certain value obtained when the
temperature is decreasing to room temperature in air.

Chapter 4 Results Junshan Li
93
The calculated oxygen content of these samples via TGA together with titration are listed in
Table 22, see calculation in Appendix E on Page 139.
Table 22. Calculated oxygen content obtained by cerimetric titration and TGA
LaSr3Fe3O10δ NdSr3Fe3O10δ
Cerimetric titration 9.46 9.00 8.68 9.39 9.00
TGA 9.53 9.13 8.67 9.55 9.09
It can be seen that some difference exist in these two methods, especially for these
compounds whose oxygen stoichiometry higher than O9.0. The discussion is presented in 5.2.1
on Page 109.
4.5 Magnetic property
The magnetic properties of low temperature ranging from 5 K to 300 K were measured with
an MPMS (Magnetic Property Measurement System) and PPMS (Physical Property
Measurement System), Quantum Design. Magnetization measurements were carried out with
the DC-extraction method for both Field-Cool (FC) and Zero-Field-Cool (ZFC) samples
between 5 and 300 K, while M(H) data were measured at 5 K or 300 K.

August 2013 Chapter 4 Results
94
4.5.1 LaSr3Fe3O10δ series
4.5.1.1 M(T) behavior
Figure 43. Zero Field Cooled (ZFC, open symbols) and Field Cooled (FC, filled symbols)
evolution of the gram susceptibility (black symbols) and inverse gram susceptibility (red symbols)
collected by MPMS (a) and PPMS (b→g) in the LaSr3Fe3O10δ series for the oxygen content 10δ
= a) 9.92, b)9.76, c)9.46, d) 9.25, e)9.00, f)8.81, g)8.68.

Chapter 4 Results Junshan Li
95
The temperature dependences of the magnetic gram susceptibility and also the inverse gram
susceptibility measured under ZFC and FC conditions are plotted in Figure 43. The FC and
ZFC susceptibilities for the fully oxygen enriched LaSr3Fe3O9.92 was measured in a field of
0.05 T, as shown in Figure 43.a. The ZFC curve shows an anomaly around 200 K and that
indicates onset of antiferromagnetic order below some 200 K. This results is good agreement
of previous study [65]. At high temperatures, the inverse susceptibility follows the Curie
Weiss law.
Once small amount of oxygen deficiencies (δ = 0.24) are introduced the FC-ZFC curves for
LaSr3Fe3O9.76 samples increase monotonously and exhibit Curie-Weiss behavior at high
temperatures.
Concerning LaSr3Fe3O9.46, the M(T) behavior suggests paramagnetism at temperature higher
than 250 K. The FC curve is quite noisy, most likely due to a slight shift in sample position
during measurement. The ZFC curve indicates a transition temperature from one AF to
another AF structure or a spin glass transition around 50 K. More detailed studies are required,
and measurements using AC-option on the PPMS would be helpful for clarifying the possible
existence of a spin-glass state.
For the more oxygen deficient LaSr3Fe3O9.25, a jump at 220 K is indicative of an AF to PM
transition. The M(T) curve is consistent with Curie-Weiss paramagnetism above that ordering
temperature.
The observed behavior for LaSr3Fe3O9 appears to be antiferromagnetic with an ordering
transition at 250 K. For the samples with a nominal Fe oxidation state lower than +3, i.e.
LaSr3Fe3O8.81 and LaSr3Fe3O8.68, the M(T) curve is close to temperature independent. The
latter sample shows the higher susceptibility.
Based on a fit of the best straight line of the data at high temperatures for the various
LaSr3Fe3O10δ (10δ = 9.96, 9.75, 9.46, 9.25, see blue line) as shown in Figure 43, values of
Curie-Weiss temperature, ueff and unpaired electrons per iron atom are derived. The derived
results are summarized in Table 23.

August 2013 Chapter 4 Results
96
Table 23. Magnetic parameters for LaSr3Fe3O10δ (10δ = 9.96, 9.75, 9.46, 9.25) series
Oxygen content
10δ Weiss temperature (K) ueff (B.M.)
Number of unpaired
electrons
O9.96 -204.75 6.26 5.34
O9.75 -189.03 5.95 5.04
O9.46 -31.76 2.47 1.66
O9.25 -476.13 5.58 4.67
However, it is still seen that the Weiss temperature and the unpaired electrons per Fe decrease
with less oxygen stoichiometry in the composition with O9.46. Concerning that there are two
phases coexisting in the phase containing O9.25 and O9.25, it is not feasible to obtain the precise
magnetic parameters for each phase. The effective moments of O9.96, O9.75 and O9.25 phase are
close to the value for high spin (HS) Fe.

Chapter 4 Results Junshan Li
97
4.5.1.2 M(H) behavior
The field dependency of the magnetization for LaSr3Fe3O10δ at 5 K is shown for six
compositions in Figure 44.
Figure 44. Molar magnetization as a function of applied field (-9 T ~ 9 T) for the LaSr3Fe3O10δ
series (10δ = 9.75, 9.46, 9.25, 9, 8.81, 8.68) at 5 K. Figure b is the enlargement of Figure a
between -2 T and 2 T.

August 2013 Chapter 4 Results
98
As can be seen from Figure 44, LaSr3Fe3O8.81 and LaSr3Fe3O8.68 both have an S-form at low-
to-moderate fields (T < 1 T, see Figure 44.b) where a ferromagnetic component appears to
saturate. Thereafter their magnetization increase linearly with applied field (1 < T < 9 T),
indicating antiferromagnetism. These two samples may possibly approach a saturation value
at higher fields. The calculated magnetization saturation is calculated by extrapolating the
linear M(H) part to where it crosses the y-axis. The derived values are 0.19 and 0.29 uB for
LaSr3Fe3O8.81 and LaSr3Fe3O8.68 respectively. These ordered components are small and the
samples are probably best described as ferrimagnetic at 5 K.
Most of these samples, LaSr3Fe3O10δ (10δ = 9.76, 9.46, 9.25) have a hysteresis, indicating
that these have a ferromagnetic component at 5 K. For LaSr3Fe3O9, the M(H) curve is quite
linear which would be consistent with antiferromagnetism.
Among these samples, LaSr3Fe3O8.68 was selected to measure its M(H) behavior at room
temperature. The field dependence of the magnetization is shown for temperature 5 K and 300
K respectively.
Figure 45. Field dependency of the magnetization for LaSr3Fe3O8.68 at 5 K and 300 K
As shown in Figure 45, no complete saturation of the sample was observed for the fields of 9
T either at 5 K or 300 K. At 5 K, the saturation magnetization of LaSr3Fe3O8.68 is higher than

Chapter 4 Results Junshan Li
99
that of 300 K, corresponding values are 0.29 uB and 0.26 uB per unit of transition metal,
respectively. These data are important due to either 1) ordering is well above room
temperature and the magnetic properties of the material remain rather constant or 2) there are
small amounts of magnetic impurities i.e. magnetite introduced during the reduction.
4.5.2 NdSr3Fe3O10δ series
4.5.2.1 M(T) behavior
FC and ZFC susceptibility vs temperature measurements were performed on the series of
NdSr3Fe3O10δ (8.78 ≤ 10δ ≤ 9.98) from 5 K to 300 K, as displayed in Figure 46.

August 2013 Chapter 4 Results
100
Figure 46. Zero Field Cooled (ZFC, open symbols) and Field Cooled (FC, filled symbols)
evolution of the gram susceptibility (black symbols) and inverse gram susceptibility (red symbols)
collected by MPMS (a) and PPMS (b→g) in the NdSr3Fe3O10-δ series for the oxygen content 10δ
= a) 9.98, b)9.87, c)9.67, d) 9.39, e)9.21, f)9.00, g)8.78.

Chapter 4 Results Junshan Li
101
Most of the samples with oxygen content 10δ ≥ 9.39 are found to be antiferromagnetic at
low temperatures and a Curie-Weiss paramagnetic region is observed at high temperatures
(Figure 46.ad). The ZFC and FC curves of NdSr3Fe3O9.21 and NdSr3Fe3O9.00 are identical;
both are paramagnetic above some 250 K and exhibit Curie-Weiss behavior (Figure 46.e and
f). For the more oxygen deficient compound NdSr3Fe3O8.78, a temperature independent M(T)
curve is observed.
For the Nd– series, the FC gram susceptibility has no obvious difference for the compositions
(9 ≤ 10–δ < 10) except that NdSr3Fe3O8.78 has a much larger value.
Certain errors exist in the measurement of NdSr3Fe3O9.39 and NdSr3Fe3O9.00 due to a slight
movement of the sample during measuring (refer to respective Figure 46.d and f). A linear fit
of inverse gram susceptibility for the composition NdSr3Fe3O10δ (9.00 ≤ 10δ ≤ 9.98, see
blue line in Figure 46) was performed in the paramagnetic region. The obtained negative
value for the Weiss temperature and the Curie constant per iron atom along with the
corresponding effective paramagnetic moment are listed in Table 24.
Table 24. Magnetic parameters for NdSr3Fe3O10δ (10δ = 9.98, 9.87, 9.67, 9.39, 9.21, 9.00)
Oxygen content 10δ Weiss temperature (K) ueff (B.M.) Number of unpaired
electrons
O9.98 -167.93 7.05 6.12
O9.87 -158.58 5.58 4.67
O9.67 -243.06 6.55 5.63
O9.39 -300.11 5.42 4.51
O9.21 -168.33 4.88 3.98
O9.00 -56.02 3.41 2.55
It is seen that ueff (B.M.) decreases with increasing amounts of oxygen vacancies of the
samples from c.a 7 to 3.5 uB except for NdSr3Fe3O9.67 with a value of 6.5 uB. The calculated
Weiss temperatures decrease for the phase O9.98 to O9.39 but an increase is seen for further
more oxygen nonstoichiometry. It should be pointed out that the phase O9.00 is ordered-
different crystal structure and magnetism is expected to be somewhat different, e.g. as seen in
Weiss temperature.

August 2013 Chapter 4 Results
102
4.5.2.2 M(H) behavior
Figure 47. Molar magnetization as a function of applied field (-9 T ~ 9 T) for the NdSr3Fe3O10δ
series (10δ = 9.87, 9.67, 9.39, 9.21, 9.00, 8.78) at 5 K. Figure b is the enlargement of Figure a
between -2 T and 2 T.
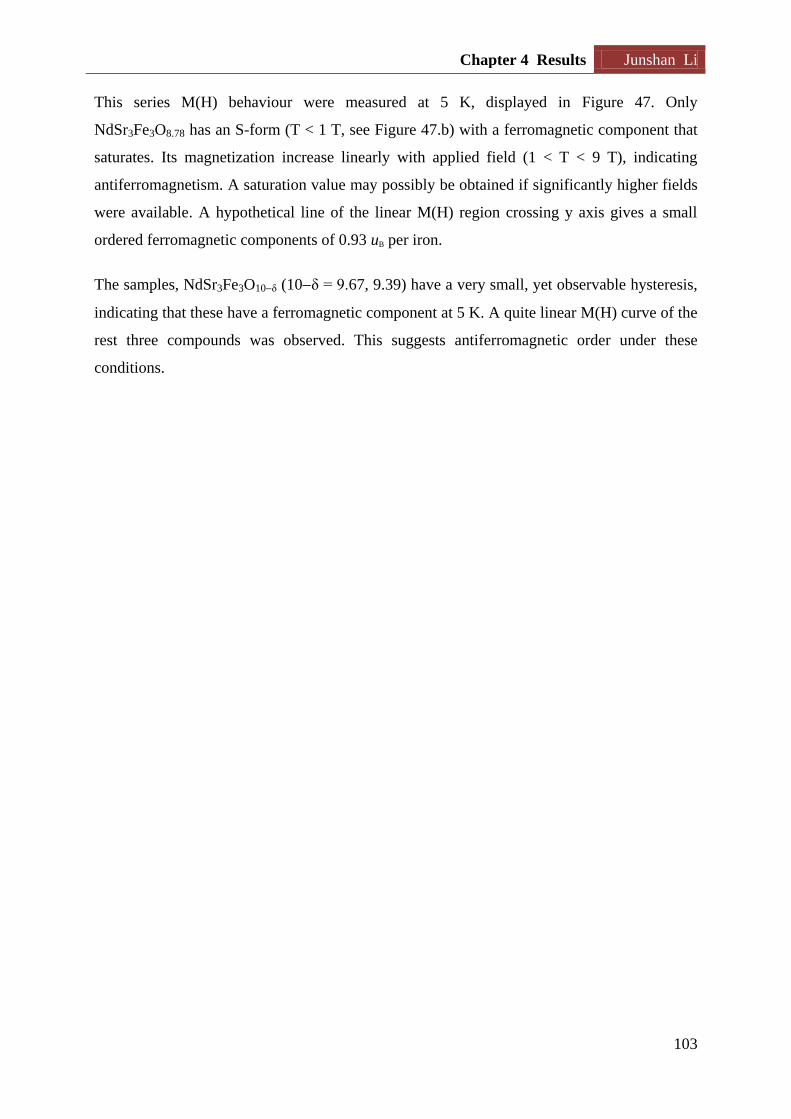
Chapter 4 Results Junshan Li
103
This series M(H) behaviour were measured at 5 K, displayed in Figure 47. Only
NdSr3Fe3O8.78 has an S-form (T < 1 T, see Figure 47.b) with a ferromagnetic component that
saturates. Its magnetization increase linearly with applied field (1 < T < 9 T), indicating
antiferromagnetism. A saturation value may possibly be obtained if significantly higher fields
were available. A hypothetical line of the linear M(H) region crossing y axis gives a small
ordered ferromagnetic components of 0.93 uB per iron.
The samples, NdSr3Fe3O10δ (10δ = 9.67, 9.39) have a very small, yet observable hysteresis,
indicating that these have a ferromagnetic component at 5 K. A quite linear M(H) curve of the
rest three compounds was observed. This suggests antiferromagnetic order under these
conditions.

August 2013 Chapter 5 Discussion
104
Chapter 5
Discussion
In this section, the experimental results presented in chapter 4 are discussed in view of the
published literature. The main discussion covers the results obtained from synthesis,
cerimetric titration, TGA, crystal structure refinement as well as magnetic properties.
5.1 Synthesis
Successful synthesis recipes for obtaining phase pure RP3 (Ln-Sr-Fe-O, Ln = La, Nd) were
obtained after careful consideration of the annealing conditions and subsequent handling of
the samples at ambient conditions after completed synthesis. The former factor is of great
importance to obtain the single phases while the latter parameter is essential to avoid
degradation of the formed samples due to wrong storing conditions or post treatment during
e.g. sample preparation for powder X-ray diffraction.
5.1.1 Preparation of LnxSr4xFe3O10δ (Ln = La, Nd)
The gels obtained after the complexation step were dried at 180 oC overnight, followed by a
calcination done at 450 oC in a muffle furnace for approximately 18-24 hours. As Figure 25
(Page 59) displays, the XRD pattern of the LaSr3Fe3O10-precursor after calcining at 450 oC
overnight, the compounds show presence of a large amount of carbonate i.e. SrCO3,
Ln2O2CO3 (Ln = La, Nd) together with La-Sr-Fe-O mixture.
Velinov et al. [58] investigated the TG and DTA of a LaSr3Fe3O10 precursor after drying at
200 oC for 2 hours (see Figure 8 on Page 19, section 1.5.2). It is observed several exothermal
effects together with significant mass loss due to a stepwise burning off the organic matter
between 400 oC and 600
oC. Considering that we calcined the LaSr3Fe3O10 precursor at 450
oC and it stabilizes SrCO3, may make complicate the formation of the desired RP3 phase. At
the end of experimental work of this Master thesis we discovered in a different project that
applying a much shorter calcination time (2-3 hours) at 450 oC is preferred, followed by a fast

Chapter 5 Discussion Junshan Li
105
heating to 800 - 850 oC for 1 hour to fully remove
without crystallizing to binary
oxides.
The role of annealing condition plays the most important role in obtaining the phase pure
product in every synthesis. Atmosphere (e.g. O2, N2, Ar etc) annealing is often used. There is
a clear trend of lower annealing temperature if atmosphere is involved.
In this work, LaSr3Fe3O10 was successfully synthesized in air and a Ar atmosphere, with
annealing temperatures of 1250 oC and 1100
oC, respectively. Specifically, for the pellets of
the fine powder (after calcining at 450 oC), good conditions for annealing in air was found to
be 12 hour annealing at 1000 oC and then twice 12 hours annealing at 1250
oC with
intermediate grounding and pelletizing. On the other hand, the same compound could be
synthesized in an Ar atmosphere at 1100 oC (2 repeating 12 hours annealing steps). Annealing
in an Ar atmosphere could be of help to remove of the pellets with temperature
increasing from room temperature to 1100 oC of the first annealing. As the TGA data of
LnSr3Fe3O10 (Ln = La, Nd) show large oxygen deficient with O9.1 at 1200 oC. The use of
atmosphere is also a helpful tool to “pick out” oxygen at lower temperatures thereby forming
RP3 phases.

August 2013 Chapter 5 Discussion
106
5.1.2 Solid solution range for LnxSr4xFe3O10δ (Ln = La, Nd; x >1.0)
In this work, higher Lncontent than LnSr3Fe3O10 (Ln = La, Nd) phase pure compounds were
not observed due to a large amount of RP1, RP3 and perovskite phase as main contaminants.
Figure 48. Phase transition schemes. (a) Phase transition schemes of La2O3, SrO and Fe2O3
mixtures [94]. (b) Isothermal section of the La2O3–SrO–Fe2O3 system at 1100 oC and 1300
oC.
Triangles are given as solid lines and bold lines correspond to solid solutions [95].
Figure 48 displays the phase transition schemes of a La2O3–SrO–Fe2O3 mixture. Tugova et al.
[94] aimed to synthesize RP2 La2SrFe2O7 phase as shows in Figure 48.a. A traditional solid
state method was applied for both synthesises with La2O3 or La(OH)3, Fe2O3 and SrCO3 as
initial reactants.
Figure 48 clearly shows that it is rather difficult to obtain phase pure RP3 compounds, due to
formation of RP2, RP1 and perovskite phase. Further, according to the presented phase

Chapter 5 Discussion Junshan Li
107
diagram, making RP3 phases with x > 1.0 LnxSr4–xFe3O10 (Ln = La, Nd) is possible. This may
then very well explain why we in this study not were able to prepare any phase pure LnxSr4–
xFe3O10 (Ln = La, Nd) for x > 1.0. The stability scheme of RP phases in binary SrO-Fe2O3 is
retained at low La levels. Intermediate or higher La level RP1 phase are more stable than RP2
phase.
It is reported that RP1 and RP3 phase for Srn+1FenO3n+1 only are stable at lower temperatures
than n = 2 members [61, 96]. Considering the presence of RP1, PR2 and perovskite phase, the
annealing temperature was not the right to form RP3 phases for x > 1.0 in LnxSr4–xFe3O10 (Ln
= La, Nd). On the other hand, the solid solution range in LnxSr4–xFe3O10 is narrow, especially
for x > 1.0. These may be reasons why we successfully obtained some phase pure compounds
in 0 < x ≤ 1.0 LnxSr4–xFe3O10 (Ln = La, Nd) but failed in x > 1.0.
For further synthesis of LnxSr4–xFe3O10 (Ln = La, Nd; x > 1.0), more careful and critical
annealing conditions e.g. 1050-1200 oC, N2 or O2 atmosphere sintering than that of involved
sintering programs will preferably be tried to get RP3 form.
5.1.3 Comparison of synthesis condition LnxSr4–xFe3O10 (Ln = La; x = 1.0)
Solid-state method of synthesizing the series LaSr3Fe3O10 series are reported in some
scientific reports [44, 56,]. Of course, citric acid method has been successfully used to
synthesize LnSr3Fe3O10 (Ln = La; x = 1.0) series compounds. The following Table 25
summarizes this method with their specific experimental details.
Table 25. Experimental detail in synthesis LaSr3Fe3O10 using citric acid method
Experimental details Velinov et al. [58] Zhang et al. [62] In this study
Starting materials
La2O3
Sr(NO3)2
Fe(NO3)3·9H2O
La(NO3)3·6H2O
Sr(NO3)·H2O
Fe(NO3)3·9H2O
La2O3
SrCO3
Fe(COOH)2·2H2O
Gelation 200 oC 120 oC 180 oC over night
Calcination Self-combustion Sand bath 450 oC over night
Annealing 1100 oC × 2 h 1000 oC × 12 h
1200 oC × 8 h
1000 oC × 12 h
1250 oC × 12 h × 2

August 2013 Chapter 5 Discussion
108
Velinov et al. [58] used the experimental detail as described in Table 25 to synthesize
LaSrFeO4, La2SrFe2O7 and LaSr3Fe3O10. He claimed that the formation of LaSrFeO4 phase
begins at 900 oC and after treatment at 1000
oC for 2 hours there are no additional phases in
the sample. La2SrFe2O7 was calcined at 700 oC, 800
oC, 900
oC, 1000
oC and 1100
oC for 2 h,
at 1250 oC for 5 hours and at 1400
oC for 1 hour respectively. The powder X-ray diffraction
patterns show that a formation of the single layer LaSrFeO4 perovskite occurs at 1100 oC and
at 1250 oC begins to form double layer La2SrFe2O7 phase. The sample calcined at 1400
oC for
1 hour is a mixture of 80% La2SrFe2O7 phase and 20% RP1 LaSrFeO4 phase. For
LaSr3Fe3O10, the precursor powders were calcined at 700 oC, 800
oC, 900
oC, 1000
oC and
1100 oC for 2 hours. The author believed that a thermal treatment at temperature not lower
than 1100 oC is necessary for synthesis LaSr3Fe3O10 phase [58].
Figure 49. Powder X-ray diffraction patterns of LaSr3Fe3O10 phase. (a) LaSr3Fe3O10 precursor
powder calcined at different temperatures [58]. (b) LaSr3Fe3O10 calcined at 1200 oC [62].
As indicated in Table 25, Zhang et al. [62] also synthesized LaSr3Fe3O10, the precursor
powder was calcined at 1000 oC in oven for 12 hours and then pressed into slabs and sintered
again at 1200 oC for 8 hours [62].
By comparing Figure 49.a and b as well as Figure 26 on Page 63 (refer to XRD pattern for
LaSr3Fe3O10 in this work), it is highly suspected that the obtained compound calcined at 1100
oC (Figure 49.a) for 2 hours has a large amount of RP1 LaSrFeO4 and perovskite phase.
In this study, the obtained LaSr3Fe3O10 compound annealed at 1100 oC for 48 hours and
followed by 24-hour firing at 1100 oC (refer to Appendix C.2 on Page 128), is a mixture of

Chapter 5 Discussion Junshan Li
109
about 70% RP3 phase and 30% perovskite. When the temperature is elevated at 1350 oC, RP2
occurs as a new secondary phase.
5.2 Oxygen content
5.2.1 Comparing oxygen content from cerimetric titration and TGA
The oxygen content differs in the value obtained from direct cerimetric titration and TGA data.
It is noticeable that there were errors and uncertainties in the cerimetric titration, especially
for the oxygen deficient samples. As discussed in subchapter 3.3 (Page 55), some factors may
contribute to the errors in cerimetric titration; on the other hand, O9.90 is only an assumption
for all samples being cooled down to room temperature with thermal program (50 ml/min Air,
10 oC/min), see Appendix E on Page 139. In addition, the possible impurities may also
contribute this problem.
The real oxygen content is the value slightly higher than the titrated value and lower than
TGA results for the compound with expressed oxygen higher than O9.0. The result of the
oxygen content lower than O9.0 is in good agreement in these two methods.
In this work, we use the oxygen content calculated from cerimetric titration as its “real” value
of its oxygen stoichiometry.
5.2.2 Approaches of higher oxygen content
There are some ways that have been tried in this project to obtain large range oxygen content
in the sample, including 1) fully oxidized 2) quenching 3) oxygen-getter Zr method. The
obtained oxygen content of the reduced sample is as low as O8.68 for La- series and O8.78 for
Nd- series.
Thus, there are some methods to obtain larger oxygen deficiencies e.g. δ > 1.5:
Excessive amount of Zr (due to the fact that Zr reacted partially than calculating).
By elevating the temperature of Zr site is another route.
In the results section, we used excessive Zr approach instead of modifying temperature on Zr
site to control the oxygen content despite the latter approach would give better control.

August 2013 Chapter 5 Discussion
110
Jantsky et al. [67] reduced PrSr3Co1.5Fe1.5O10δ with composition as low as 10δ = 8.20 under
a 12 hours flow of H2 atmosphere at 500 oC. Motivated by this method, carefully selected
atmosphere and thermal treatment would give larger oxygen deficiencies than that of RP3
phase obtained in this project. It should be pointed out that this method does not allow to
make a series of samples with variable oxygen content.
5.3 Rietveld refinement
When dealing with Rietveld analysis, it is of great importance to realize that the information
about the crystal structure is limited by the quality of SRXRD pattern. By comparing the
refined data from XRD and SRXRD, they both show the same unit cell parameters, as
expected. The higher R-factors for the refined SRXRD data is due to the low background, and
the excellent signal to noise ratio as well as larger challenges in fitting the profiles of the
peaks.
5.3.1 Crystal structure
The (SR)XRD diagrams show that LaSr3Fe3O10–δ (δ < 0.5) and NdSr3Fe3O10–δ (δ < 0.8)
crystallize in the RP3 structure, adopting the I4/mmm space group. SRXRD Rietveld results
confirm that oxygen vacancies are located to the O4 site in the RP3 structure, see Figure 50.a.
This result is consistent with reported scientific report [56, 91].
With increasing amounts of oxygen vacancies at the O4 site, the structure is distorted
gradually. At half oxygen occupancy for the O4 site, an ordering process takes place. This
structure is described in space. The LnSr3Fe3O9 (Ln = La, Nd) is an oxygen deficient RP3
phase than can be considered as the intergrowth of brownmillerite-type (Sr2Fe2O5) and
K2NiF4-type layers (LnSrFeO4 ; Ln = La, Nd).

Chapter 5 Discussion Junshan Li
111
Figure 50. Crystal structure of LnSr3Fe3O10–δ (0 < δ < 1.5). (a) RP3 phase, space group I4/mmm
(0 < δ < 0.5 for LaSr3Fe3O10–δ and 0 < δ < 0.8 for NdSr3Fe3O10–δ) (b) Oxygen deficient RP3 phase
LnSr3Fe3O9, space group Bbmm.
The oxygen migration in the RP3 phase leads to the concentration of the vacancies in the
central perovskite layer (O4 site as shown in Figure 50.a). The process has earlier been
described to involve the following successive steps [91]:
1) Vacancies are initially located in the O3 site, the most labile oxygen atoms of the rock
salt layer.
2) Then these vacancies will be filled by the nearest oxygen on the O1 site.
3) The oxygen atom on the O2 site will move to the vacant O1 site.
4) Finally, these vacancies will be occupied by the oxygen atoms on the O4 site, thus the
vacancy will concentrate in the equatorial plane of the central perovskite block.
The samples of NdSr3Fe3O10–δ (0.5 < δ < 0.8) are single phase. On the other side two phases
coexist in LaSr3Fe3O10–δ in the range 0.5 < δ < 0.8. By considering the above process of
creating oxygen vacancies on the O4 site, this phenomenon may possibly be explained as: the

August 2013 Chapter 5 Discussion
112
oxygen atoms on the O1, O2 and O4 site are more labile in LaSr3Fe3O10–δ (0.5 < δ < 0.8) than
that of NdSr3Fe3O10–δ (0.5 < δ < 0.8).
Further, increased amounts of oxygen vacancies beyond δ ≈ 1 are found to mainly locate at
the O2 site, see Figure 50.b.
5.3.2 Unit cell parameters of Less Ln–content than LnSr3Fe3O10–δ (Ln = La, Nd)
According to Figure 31 (Page 74), the refined unit cell parameters of phase pure LnxSr4–
xFe3O10 is slightly decreasing when the lanthanide content at the A-site in the RP3 phase
decreases, especially for the c axis parameter. This could be explained that the size of
lanthanide element (La3+
= 1.032 Å and Nd3+
= 0.983 Å [97]) is smaller than the alkaline
earth element at the A-site cation (Sr2+
= 1.18 Å [97], in this case). The number of perovskite
slabs is largest along the c direction. This leads to a more significant decrease in the c axis
than that for the a and b axis.
Comparing the two series, the Nd series has smaller unit cell dimensions than the La series
for any given value of x for LnxSr4–xFe3O10. This is consistent with the smaller size of Nd3+
compared to La3+
.
5.3.3 Unit cell parameters of LnSr3Fe3O10–δ (Ln = La, Nd)
As the refined unit cell parameters and the figures above (Figure 34, Page 79; Figure 35, Page
81) shown, the a and b axes of the structure in the of Bbmm space group are √ times longer
than for the tetragonal I4/mmm structure.
Figure 51. Lattice parameter in a and b direction for two type of structures in space group
I4/mmm and Bbmm.

Chapter 5 Discussion Junshan Li
113
The unit cell parameters increase with decreasing oxygen stoichiometry at room temperature.
This phenomenon can be explained as follows:
Larger size of B-site cations upon reduction. It is reported that B-site cations consist of
mixed Fe3+
and Fe4+
ions . Upon an oxygen content decrease from 10 to 9 per formula
unit, the average valence of Fe decreases from +3.67 to +3 according to the titrated Fe
valence state. The radius radii Fe3+
is larger than that of Fe4+
whether being High Spin
(HS) or Low Spin (LS) [97].
Less efficient packing. The packing of all atoms become less efficient if vacancies
present in the structure, and also structural distortion makes a contribution.
The current data for the c-axis as a function of oxygen content LaSr3Fe3O10–δ (δ < 0.8) is
somewhat inconsistent with the literature (see Figure 52).
Figure 52. c axis parameters as a function of oxygen stoichiometry in LaSr3Fe3O10–δ at room
temperature. (a) Published data are from Lee [56]. (b) c-axis parameters refined from powder
X-ray patterns of LaSr3Fe3O10–δ. LaSr3Fe3O9.46 and LaSr3Fe3O9.25 in the yellow zone were only
refined using RP3 structure despite that some peaks were not indexed.
Lee et al. found that LaSr3Fe3O10–δ is able to adopt a larger amount of oxygen vacancies (δ <
0.8) without structural degradation [56]. However, the current XRD data show that there two
phases (LaSr3Fe3O10–δ RP3 structure and LaSr3Fe3O9 deficient RP3 structure) coexists in
LaSr3Fe3O10δ (~0.5 < δ < 0.8, see yellow zone in Figure 52.b). If LaSr3Fe3O10–δ (~0.5 < δ <
0.8) was refined assuming a single RP3 phase, these erroneous data (see green line in Figure
52.b) would be in good agreement with Lee’s result (Figure 52.a [56]).
August 2013 Chapter 5 Discussion
114
5.4 Magnetic properties
The paramagnetic parameters as listed in Tables 23 and 24 (Pages 96 and 101 respectively)
are unfortunately strongly dependent on how the data is fitted assuming a straight line at
higher temperatures (~200 K → 300 K) for a Curie-Weiss regime. There are errors caused by
noisy data in some measurements. On the other hand, the Curie-Weiss law fit would be more
reliable if the data were measured at temperatures considerably exceeding than 300 K. The
derived values of Curie-Weiss temperature, ueff and unpaired electrons should therefore be
considered as rough values rather than precise ones.
For the gram susceptibility of these two series, the Nd– series have lager gram susceptibility,
especially in the paramagnetic region. This can be explained by the fact that the electron
configuration of Nd+3
is 4f3 while La
+3 is 4f
0. In addition the mixed Fe
3+/Fe
4+ would
contribute to the paramagnetizaion.
For oxygen deficient samples, the mixed Fe3+
/Fe4+
are anticipated to be randomly located in
Fe1 and Fe2 site of the structure. This implies that the iron in the octahedral and tetrahedral
are all mixed valent state. With less oxygen in the structure, the B-site in the equatorial
perovskite slabs are not truly octahedral but more like tetrahedra. In addition, the magnetic
behavior could be influenced by many aspects, such as electron delocalization and unequal
bond distances.
If the A- and/or B- site cation were substituted, a different magnetically ordered state was
observed, i.e. Sr4Fe3O10 or PrSr3(Fe1–xCox)O10–δ system. Jantsky et al. [15] investigated the
magnetic interactions in PrSr3(Fe1–xCox)O10–δ, under field cooled (FC) and zero field cooled
(ZFC) condition over the temperature range 5-300 K in a high field of 0.5 T. The ZFC curve
for the parent compound x = 0, shows a horizontal inflection point at 124 K, a local minimum
at 160 K and a local maximum at 180 K. A Curie-Weiss fit is observed at high temperatures.

Chapter 6 Conclusion Junshan Li
115
Chapter 6
Conclusion
In this study we report for preparation of phase pure LnxSr4xFe3O10 (0 < x ≤ 1.0) compounds
for Ln = La and x = 0.75-1.0 for Ln = Nd and x = 0.25 and x = 0.75-1.0. Pure phase members
in the compositional range 0 < x < 1.0 are reported to be synthesized for the first time.
LaSr3Fe3O10 (x = 1.0) was synthesized both in air and Ar atmosphere. The unsatisfactory
products for 0 < x < 1.0 (Ln = La, x = 0.25, 0.5; Ln = Nd, x = 0.5) were poorly crystalline
RP3 phases containing significant quantities of the corresponding RP2 analouge
(Ln,Sr)3Fe2O7 and perovskite (Ln,Sr)FeO3. We expect that all compositions for x ≤ 1.0 will
exist as x = 1.0 and x = 0 are reported [44, 53, 89], and some selected compositions are made
phase pure in that range in this study.
Attempts to synthesize LnxSr4xFe3O10 (Ln = La, Nd; x > 1.0) with citric acid method were
unsuccessful. All powder X-ray analyses proved that all samples contained in addition to a
RP3 phase significant quantities of (La,Sr)FeO3 and (La,Sr)2FeO4 RP1 or (La,Sr)3Fe2O7 RP2
as main contaminant. However, it is expected that x slightly can be expanded beyond 1.25 as
x = 1.25 members for La is close to phase pure. Larger x-values appear to be less promising
relative to finding reported in this study and the work by Fossdal et al [95].
Rietveld refinements of Powder X-ray diffraction data show that a decrease in size of Ln3+
is
accompanied by a slight decrease in the unit cell parameters for corresponding La and Nd
variants of the RP3 phase. Further, for a given Ln3+
in LnxSr4xFe3O10, the unit cell parameters
also decrease with decreasing x for 0 < x ≤ 1.0.
A series of compounds of LnSr3Fe3O10δ (Ln = La, 0 < δ ≤ 1.32; Ln = Nd, 0 < δ ≤ 1.22) were
obtained with δ interval of ~ 0.2. The oxygen content of the products depend on the cooling
temperature. Single-phase LnSr3Fe3O10δ (Ln = La) annealed at high temperatures and cooled
down slowly (5 oC/min in air) to room temperature gives highly oxygen generated phases
with ~O9.9. Oxygen content of ~O10.0 per unit formula were obtained under a O2 flow at 350
oC for 3 days. Samples with δ ~0.5 oxygen vacancies per formula unit were obtained by

August 2013 Chapter 6 Conclusion
116
quenching the sample from high temperature in air. What’s more, chemical transport reaction
with oxygen-getter Zr gave larger oxygen deficiencies (0.5 < δ < ~1.5).
For the LnSr3Fe3O10δ (Ln = La, Nd) series, (SR)XRD and Rietveld refinement show that
these compounds (Ln = La, δ < ~0.5; Ln = Nd, δ < ~ 0.8) take the tetragonal RP3 structure,
adopting I4/mmm space group. The unit cell parameters are a = b = 3.867 Å, c = 28.059 Å,
for the fully oxidized LaSr3Fe3O9.96 and a = b = 3.855 Å, c = 27.972 Å for the highly oxygen
enriched NdSr3Fe3O9.98. The c-axis parameter is a linear function of the oxygen stoichiometry
and decreases with increasing oxygen content. It varies from 28.059 Å for LaSr3Fe3O9.96 to
28.367 Å for the sample with O9.25. On the lowering size of the lanthanide element, i.e. Nd
substituting La in the composition, a similar behavior was seen. The c-axis parameter increase
from 27.972 Å for nominal composition NdSr3Fe3O9.98 to 28.243 Å for the sample containing
9.2 oxygen atoms per unit formula. SRXRD shows that these oxygen vacancies occur in the
site situated in the equatorial plane of the central perovskite block.
The bond length and bond angles depend on the oxygen stoichiometry and on the element and
site in question. The apical Fe1-O2 bond lengths are shorter than equatorial ones. The Fe1-O2
bond lengths of NdSr3Fe3O10δ decrease with decreasing oxygen deficiencies. An increase in
the Fe2-O2 bond lengths from 2.026 Å to 2.243 Å was observed for the O9.87 and O9.21
samples. The (La/Sr)2 is in ninefold coordination, a monocapped square antiprism with
oxygen bond distances varying from 2.410 to 2.751 Å. The (La/Sr)1-O is in a dodecahedral
site with a less changing value 2.548 to 2.752 Å.
This study show that at high concentrations of oxygen vacancies (δ ≈ 1, occupancy of O4 site
is half) in the RP3 phase, the distorted structure crystallize in the orthorhombic Bbmm space
group. Increased amounts of oxygen vacancies beyond δ ≈ 1 are found to mainly locate at the
O2 site.
According to TGA done in air, the oxidized LnSr3Fe3O10δ (Ln = La) samples (δ < 0.1) start to
loose oxygen at around 300 oC and they maintain loosing oxygen until maximum temperature
is reached giving LnSr3Fe3O9.15 (Ln = La, Nd). Oxygen is reversibly intercalated into the
structure upon cooling, and the oxides nearly return to the original oxygen composition at
room temperature. This shows that oxygen reversibly enters and leaves the oxygen lattice.
TGA analyses show further that the oxygen deficient compounds (δ > 0.5) are very stable in
air until the temperature is raised to some 200 oC. This observation shows that the oxygen

Chapter 6 Conclusion Junshan Li
117
deficient samples are quite resistant to oxygen but CO2 and H2O at ambient temperature.
Above 200 oC oxygen absorption is observed and the oxidation reaches its maximum at about
400 oC, followed by continuous oxygen loss to 1200
oC. Cooling in air reversibly intercalates
oxygen with final composition of ~O9.9 at room temperature
M(T) data collected in ZFC and FC mode and M(H) data at 5 K of the two series of
compounds LnSr3Fe3O10δ (Ln = La, Nd) were carried out. The Curie-Weiss temperature is
negative based on rather sparse data derived from a temperature limited paramagnetic region.
The value of ueff per transition metal decrease with decreasing oxidation state > 3+. The gram
susceptibility of LnSr3Fe3O10δ (10δ < 9) is higher than that of (10δ ≥ 9). The M(H) curves
for the samples with largest oxygen deficiencies in these two series (10δ < 9) have an S-form
that indicate a small ferromagnetic component at 5 K. A quite linear M(H) curve of some
composition (10δ = 9.00 for La series, 10δ = 9.87, 9.21 and 9.00 for Nd series ) suggests
that these samples are antiferromagnetic. A small hysteresis loop in some compositions was
observed, indicating a ferromagnetic component.

August 2013 Chapter 7 Perspectives
118
Chapter 7
Perspectives
This mater thesis work focused on the synthesis, structure evaluations, thermal analysis as
well as magnetic measurements of selected members in the series LnxSr4xFe3O10δ (Ln = La,
Nd; 0 < x < 4.0; 8.5 < 10δ < 10).
Optimize synthesis conditions so we can control sample prepare for all compositions within
range for x ≤ 1.0. Should be doable as Sr4Fe3O10 also exist. Also focus on expanding the
range for x > 1.0 maybe not feasible if findings by Fossdal et al. [95] are correct.
Zr reductions for large δ find conditions that not require adding Zr in excess.
For the two series of samples, high temperature magnetic measurements up to 1000 K using
i.e. Faraday balance to clarify whether Curie-Weiss paramagnetism occurs at high
temperatures, as well use this as a tool to look for indications of phase transitions.
Interesting direction to move into is controlled intercalation of H2O and CO2 in these oxides.
Refer to work of Laurent. Then full characterization regarding structure and properties will be
included.
As reported this series are promising cathode materials in SOFCs. Their conductivity at high
temperatures should be explored by impedance spectroscopy. For the magnetic order and its
Fe valence state Mössbauer spectroscopy and powder neutron diffraction will be most helpful.
RP3 oxides in this work studied as bulk interesting to try to prepare these oxides as thin film
using atomic layer deposition (ALD). Correlate properties films-bulk.
From the viewpoint of composition, substitution of the A-site and B-site cations as well as the
ratio of cations in A-/B- site should be further explored in order to understand the family of
RP3 phases.

Reference Junshan Li
119
Reference
1. Mitchell, R.H., Perovskites: Modern and Ancient. Almaz Press, 2002.
2. S, F., Structure, properties, and preparation of perovskite-type compounds. Pergamon
Press in Oxford, New York 1969.
3. Navrotsky, A., Perovskite: A Structure of Great Interest to Geophysics and Materials
Science Amer Geophysical Union, 1989.
4. Borowski, M., Perovskites: Structure, Properties and Uses. Nova Science Pub Inc,
2011.
5. Rose, G., Poggendorffs Annalen der Physik und Chemie. 1839. XXXXVIII: p. 558-
560.
6. Wenk, H.-R.B., Andrei, Minerals: Their Constitution and Origin. Cambridge
University Press, 2004: p. 413.
7. Tejuca, L. G., J. L. G. Fierro, and J. M. D. Tascón, Structure and Reactivity of
Perovskite-Type Oxides. 1989. 36: p. 237-328.
8. Megaw, Crystal structure of Barrium Titanite. Nature, 15.4.1945. 155.
9. Megaw, H. D., Temperature changes in the crystal structure of barium titanium oxide.
1947: p. 261-283.
10. Megaw, H. D., Proceedings of the Physical Society. 1946. 58: p. 133-152.
11. M, G. V., Die Naturwissenschaften. 1926. 21: p. 477.
12. Woodward, P. M., Octahedral tilting in Perovskite. II. Structure stabilizing forces.
acta crystallographics, 1996. B53: p. 44-46.
13. Muller, U., Inorganic structural chemistry. WILEY, 2007: p. 203-204.
14. http://abulafia.mt.ic.ac.uk/publications/theses/levy/Chapter3.pdf.
15. Jantsky, L., Novel oxides with interesting ionic, electronic and/or magnetic properites.
University of Oslo, 2012.
16. Glazer, A. M., The classification of tilted octahedra in perovskites. Acta
crystallographica, 1972. B28: p. 3394-3392.
17. Woodward, P. M., Octahedral tilting in Perovskites. I. Geometrical considerations.
acta crystallographics, 1996. B53: p. 32-43.
18. Ishikawa, Y., The Study on Substances having the Ilmenite Structure I. Physical
Properties of Synthesized FeTiO3 and NiTiO3 Ceramics. Journal of the Physical
Society of Japan, 1956. 11(5): p. 496-501.
19. Frazer, X-Ray and Neutron Diffraction Study of Ferroelectric PbTiO3. Physical
Review, 1955. 97(4): p. 1179-1180.
20. W. D. Kingery, H.K.B., D. R. Uhlmann, Introduction to ceramics. 1976: p. 926-927.
21. G. Shirane, H. D., R. Pepinsky, Neutron Diffraction Study of Orthorhombic BaTiO3.
Phys. Rev., 1957. 105(3).
22. Fierro, M. A. P. a. J. L. G., Chemical Structures and Performance of Perovskite
Oxides. American Chemical Society, 2001. 101: p. 1981-2017.
23. HIPPLER, K., STRUCTURE OF NA3OCL. Acta crystallographica, 1900. 46(5): p.
736-738.
24. Roehr, C., Crystal structure of calcium germanium oxide, Ga3GeO. 1995. 210: p. 798.

August 2013 Reference
120
25. Tezuka, H., Search for new superconductors by the Li-intercalation into layered
perovskites of the Aurivillius phase. Physica C: Superconductivity, 2008. 468(15-20):
p. 1152-1154.
26. AURIVILLIUS, B., MIXED BISMUTH OXIDES WITH LAYER LATTICES .2.
STRUCTURE OF BI4TI3O12. 1950. 1: p. 499-512.
27. A., I. B., Cation disorder in the ferroelectric Aurivillius phase PbBi2Nb2O9: an
anomolous dispersion X-ray diffraction study. solid State ionics, 1998. 112: p. 281-
289.
28. DION, M., The new phase families M(I)M2(II)Nb3O10 with perovskite sheets. Materials
research bulletin, 1981. 6: p. 1429-1435.
29. A. J. Jacobson, J. W. J., Interlayer chemistry between thick transition-metal oxide
layers: synthesis and intercalation reactions of K[Ca2Nan-3NbnO3n+1]. Inorganic
Chemistry, 1985. 24: p. 3727-3729.
30. Bao-Wen Li, M. O., Yasuo Ebina, Tadashi C. Ozawa, Renzhi Ma,, Impact of
perovskite layer stacking on dielectric responses in KCa2Nan−3NbnO3n+1(n=3–
6)Dion–Jacobson homologous series. APPLIED PHYSICS LETTERS, 2010. 96.
31. RUDDLESDEN, S. P., P, The compound Sr3Ti2O7 and its structure. ACTA
CRYSTALLOGRAPHICA, 1958. 11(1): p. 54-55.
32. Popper, S. N. R. a. P., New compounds of the K2NiF4 type. ACTA
CRYSTALLOGRAPHICA, 1957. 10(8).
33. PLIETH, K. B., D, DIE STRUKTUR DES KALIUMNICKEL-FLUORIDS. Acta
crystallographica, 1954. 7(10): p. 637.
34. Arumugam Manthiram, J.-H.K., Young Nam Kim, Ki-Tae Lee, Crystal chemistry and
properties of mixed ionic-electronic conductors. J Electroceram, 2011. 27: p. 93-107.
35. Lei Yan, H. N., Craig A. Bridges, Paul A. Marshall, Joke Hadermann, Unit-Cell-Level
Assembly of Metastable Transition-Metal Oxides by Pulsed-Laser Deposition.
Angewandte Chemie, 2007. 46.
36. Kröger, F. A. and H. J. Vink, Relations between the Concentrations of Imperfections
in Crystalline Solids. Solid State Physics, 1956. 13: p. 307-435.
37. Smyth, D. M., DEFECTS AND ORDER IN PEROVSKITE-RELATED OXIDES. Ann.
Rev. Mater., 1985. 15: p. 329-357.
38. Smyth, D. M., Defects and order in Perovskite-related oxides. Ann. Rev. Mater. Sci,
1985. 15: p. 329-357.
39. L .G. Tejuca, J. L. G. F., Properties and Applications of Perovskite-Type Oxides. CRC
Press, 1992.
40. Tofield, B. C. S., W. R, Oxidative notstochiometry in perovskites. An experimental
survery - Defect structure of an oxidized Lanthanum manganite by powder Neutron
deffraction. Solid State Chemistry, 1974. 10: p. 183-194.
41. Ole Henrik Hansteen, Helmer F., Synthesis, Crystal Structure, and Magnetic
Properties of La4Co3O10-δ (0.00 ≤ δ ≤ 0.30). Journal of Solid State Chemistry, 1998.
141(1): p. 212-220.
42. Ole Henrik Hansteen, Helmer F., Bjørn C. Hauback, Crystal structure, thermal and
magnetic properties of La4Co3O9. Phase relations for La4Co3O10-δ (0.00 ≤ δ ≤ 1.00) at
673 K. Journal of Materials Chemistry, 1998. 8: p. 2089-2093.
43. BRINGLEY, J. T., MCELFRESH, MW, SYNTHESIS AND CHARACTERIZATION
OF A NEW LACUO3-Y PEROVSKITE. American Chemical Society, 1990. 199: p.
359.

Reference Junshan Li
121
44. Kim, J. H., Lee, K. T, Kim, Y. N, Manthiram, A, Crystal chemistry and
electrochemical properties of Ln(Sr,Ca)3(Fe,Co)3O10 intergrowth oxide cathodes for
solid oxide fuel cells. Journal of Materials Chemistry, 2011. 21(8): p. 2482.
45. Lee, K. T . B., D M; Manthiram, A, Sr3-xLaxFe2-yCoyO7-δ (0.3 ≤ x ≤ 0.6 and 0 ≤ y ≤ 0.6)
intergrowth oxide cathodes for intermediate temperature solid oxide fuel cells.
JOURNAL OF THE ELECTROCHEMICAL SOCIETY, 2006. 153(7): p. A1255-
A1260.
46. Yutie Liu, X. T., and K. Li, Mixed Conducting Ceramics for Catalytic Membrane
Processing. Catalysis Reviews, 2006. 48: p. 145-198.
47. Tong Jianhua, Y.W., Methods for selection perovskitetype oxides used as mixed-
conducting membranes for oxygen separation. Membrane Science and Technology,
2003. 23: p. 33.
48. B. Raveau, C. M., M. Hervieu, D. Groult, Crystal chemistry of High Tc
superconducting Copper Oxides. Springer Verlag, 1991.
49. C N R Rao, B.R., Colossal Magnetoresistance, Charge ordering and related
properties of manganese oxides. World Scientific, Singapore, 1998.
50. http://www.hk-phy.org/energy/commercial/cell_phy/flash/fuel_cell_e.swf.
51. Sun, C., R. Hui, and J. Roller, Cathode materials for solid oxide fuel cells: a review.
Journal of Solid State Electrochemistry, 2009. 14(7): p. 1125-1144.
52. Jorg Richter, P.H., Materials design for perovskite SOFC cathodes. Monatsh Chem,
2009. 140: p. 985-999.
53. Kim, Y. N. and A. Manthiram, Electrochemical Properties of
Ln(Sr,Ca)3(Fe,Co)3O10 + Gd0.2Ce0.8O1.9 Composite Cathodes for Solid Oxide Fuel
Cells. Journal of The Electrochemical Society, 2011. 158(10): p. B1206.
54. Kim, J. H., Y. I. Park, and H. Kim, A bi-layer cathode based on lanthanum based
cobalt- and iron-containing perovskite and gadolinium doped ceria for thin yttria
stabilized zirconia electrolyte solid oxide fuel cells. Ceramics International, 2012.
38(8): p. 6303-6310.
55. C. Brisi, P. R., Studies on system SrO-Fe2O3-O. Annali di chimica, 1969. 59(5): p. 385.
56. Lee, J. Y., The Crystal chemistry and physical properties of the triple layer perovskite
intergrowths LaSr3Fe3O10–δ and LaSr3(Fe3-xAlx)O10–δ. Journal of Solid State Chemistry,
1993. 103: p. 1-15.
57. D. Pelloquin, J. H., M. Giot, V. Caignaert, C. Michel, M. Hervieu, B. Raveau, Novel,
oxygen-deficient n=3 RP-Member Sr3NdFe3O9-δ and its topotactic derivatives. Chem.
Mater., 2004. 16: p. 1715-1724.
58. NIKOLAY VELINOV, N.B., VLADIMIR KOZHUKHAROV, SYNTHESIS,
STRUCTURE AND CONDUCTIVITY OF LAYERED PEROVSKITES. Ceramics, 2005:
p. 29-33.
59. Cui Mingjie, Z. G., Li Qin, Liu Ting, Studies on the structure and oxygen
nonsotichometry of LaSr3Fe3O10-δ mixed conductor. Journal of Nanchang Hangkong
University (Natural Science), 2007. 21(3).
60. T. Armstrong, F. P., A. Manthiram, Synthesis, crystal chemistry, and oxygen
permeation properties of LaSr3Fe3-xCoxO10(0 < x < 1.5). Solid State Ionics, 2001: p.
89-96.
61. Lehtimäki, M., Water-containing derivative phases of the Srn+1FenO3n+1 series.
Journal of Solid State Chemistry, 2007. 180(11): p. 3247-3252.

August 2013 Reference
122
62. ZHANG Guoguang , L. Q., CAO Jingqian, CUI Mingjie, Defect structure and
electrical properties of LaSr3Fe3O10–δ. JOURNAL OF RARE EARTHS, 2010. 28(2):
p. 270.
63. K. KUZUSHITA, S. M., The Mössbauer Study of LaSr3Fe3O10 with a Triple Layer of
FeO6 Octahedra. Hyperfine Interactions, 2002. 141: p. 199-205.
64. Takahashi, H., Watanabe, Hiroshi, Solid Alkaline Fuel Cell Composed of Layered
Perovskite-Type Oxide LaSr. 2011: p. 267-272.
65. K. Kuzushita, S. M., S. Nasua, S. Kawasaki, M. Takano, Charge disproportionation
and magnetic order of Fe in LaSr3Fe3O10. Solid State Communications, 2002. 123.
66. Ana Ecija, K.V., Advances in Crystallization Processes. 2012.
67. Laurent Jantsky, H. O., Tuning of water and hydroxide content of intercalated
Ruddlesden-Poper type oxides in the PrSr3Co1.5Fe1.5O10-δ. Inorganic Chemistry, 2012.
51(17): p. 81-91.
68. Van Arkel, A.E.d.B., J. H, Darstellung von reinem Titanium-, Zirkonium-, Hafnium-
und Thoriummetall. Zeitschrift für anorganische und allgemeine Chemie, 1925. 148: p.
345-350.
69. C. Barry Carter, M.G.N., Ceramic Materials: Science and Engineering. 2007. chapter
15 Phase boundaries, particles and pores: p. 269-288.
70. W. Freidrich, P.K., M. Laue, Interference appearances in X-rays. Proceedings of the
Bavarian Academy of Sciences, 1912: p. 303-322.
71. Hull, A.W., A New Method of Chemical Analysis. Chem. Soc., 1919. 41(8): p. 1168–
1195.
72. G. Rosenbaum, K.C.H., Synchrotron radiation as a source for X-ray diffraction.
Nature, 1971: p. 434-437.
73. J. W. Elmer, T.A.P., Advanced Techniques for In-Situ Monitoring of Phase
Transformations During Welding Using Synchrotron-Based X-Ray Diffraction. 7th
International Trends in Welding, 2005.
74. Young, R. A., The Rietveld Method. Oxford University Press, 1993.
75. Rietveld, H. M., A profile refinement method for nuclear and magnetic structures.
CRYSTALLOGRAPHY, 1969. 2.
76. Rietveld, H. M., Line profiles of neutron powder-diffraction peaks for structure
refinement. Acta crystallographica, 1967. 22.
77. GSAS, http://www.ccp14.ac.uk/solution/gsas/.
78. TOPAS, http://www.topas-academic.net/.
79. Fullprof, http://www.ill.eu/sites/fullprof/.
80. Furman, N., Applications of ceric sulfate in volumetric analysis. THE AMERICAN
CHEMICAL SOCIETY, 1928.
81. KOLTHOFF, I., VOLTAMMETRIC BEHAVIOR OF THE IRON(II)-(III) AND
CERIUM(III)-(IV) COUPLES IN POTENTIOMETRIC TITRATIONS AT CONSTANT
CURRENT AND AMPEROMETRIC TITRATIONS WITH 2 INDICATOR
ELECTRODES. Analytica Chimica Acta, 1957. 17: p. 329-338.
82. Rao, G. G., Nickel phthalocyanine sulphonic acid as a redox indicator in cerimetry.
FRESENIUS ZEITSCHRIFT FUR ANALYTISCHE CHEMIE, 1962. 190(3): p. 213-
222.
83. Haines, P. J., Thermal methods of analysis principles, applications and problems.
1995.
Reference Junshan Li
123
84. Hysteresis loop,
http://www.ndted.org/EducationResources/CommunityCollege/MagParticle/Physics/H
ysteresisLoop.htm.
85. Schematic of TGA instrument.
http://www.netzschthermalanalysis.com/uploads/tx_nxnetzschmedia/files/STA_449_F1
_E_0413.pdf.
86. PPMS, http://www.qdusa.com/sitedocs/productBrochures/16TPPMS7.pdf.
87. http://balance.balances.com/scales/40.
88. http://www.bruker.com/products/x-ray-diffraction-and-elemental-analysis/single-
crystal-x-ray-diffraction/d8-venture/overview.html.
89. Boklund, H., Ruddlesden-Popper phases in the Sr-Fe-O system. KJM2010
Undergraduate Research I, 2013.
90. Mingjie, C., Fabrication of LaSr3Fe3O10–δ and LaSr3(Fe3-xAlx)O10–δ and investigation
of their properties. 2010.
91. Jantsky, L., Temperature dependant X-ray diffraction study of PrSr3Co1.5Fe1.5O10–d;
n= 3 Ruddlesden-Popper phase. Zeitschrift für Kristallographie, 2009. 224(5-6): p.
295-301.
92. Brown, I.D., Bond Valences-A Simple Structural Model for Inorganic Chemistry.
Chem. Soc. Rev., 1978. 7: p. 359-376.
93. O'Keeffe, M., A Method for Calculating Bond Valences in Crystals. Acta
crystallographica, 1990. A46: p. 138-142.
94. Tugova, E.A., A Comparative Analysis of the Formation Processes of Ruddlesden–
Popper Phases in the La2O3–SrO–M2O3(M = Al, Fe) Systems. Glass Physics and
Chemistry, 2009. 35(4): p. 416-422.
95. Anita Fossdal, M.-A.E., Tor Grande, Phase Relations In The Pseudo-Ternary System
La2O3–SrO–Fe2O3. Communications of the American Ceramic Society, 2005. 88(7): p.
1988-1991.
96. A. Fossdal, M.-A.E., T. Grande, Phase Equilibria in the Pseudo-binary System SrO-
Fe2O3. J. Am. Cera. Soc., 2004. 87: p. 1952-1958.
97. Database of Ionic radii. http://abulafia.mt.ic.ac.uk/shannon/ptable.php

124

Appendix Junshan Li
125
Appendix
A Temperature gradient in furnace used for Zr-reduction experiment
To get large oxygen deficient RP3 phases, a quartz reactor with RP3 oxide and Zr were kept
at 500 oC and 750
oC, respectively. A tube furnace was calibrated to find the temperature
gradient of the furnace, to define positions for the Zr and oxide in the quartz reactor.
The calibration procedure started measuring the temperature (T = 750 oC) at a fixed defined
position using two thermocouples. When the furnace temperature had stabilized at 750 oC one
of the thermocouples was manually moved a given distance (2 cm) from the fixed predefined
point. When the temperature controller for the moved thermocouple indicated stable
temperature, the temperature and position was recorded. This procedure was repeated until the
furnace we have reached the position in the furnace that was at some 300 oC.
Figure A-1. Schematic and data of calibrated temperature gradient in furnace. (a) Tube furnace
and its starting point of measurement. (b) Temperature gradient curve for the calibrated tube
furnace.
As shown in Figure A-1, the curve illustrates the temperature gradient of the tube furnace. To
get the temperature of 500 oC and 750
oC, the distance of the oxide and Zr is in the range of 12
cm to 24 cm.

August 2013 Appendix
126
B Powder X-ray diffraction of gravimetrically determined chemicals
Powder XRD diffraction patterns obtained after having calcined SrCO3, Fe(COO)2·2H2O and
(NH4)2SO4·FeSO4·6H2O to its corresponding oxides, SrO and Fe2O3 are reported in Figures
A-2.
Figure A-2. Powder X-ray diffraction patterns of SrO and Fe2O3 formed during the
gravimetrically decomposed SrCO3, Fe(COO)2·2H2O and (NH4)2SO4·FeSO4·6H2O. Black curve
is SrO formed from SrCO3 while blue and red curves are Fe2O3 decomposed from
Fe(COO)2·2H2O and (NH4)2SO4·FeSO4·6H2O respectively. Blue, red and black filled squares
indicate the Bragg reflections of the respective phase of SrO, Si and Fe2O3. Powder X-ray
diffraction patterns were collected using monochromatic Cu Kα1 (λ = 1.540598 Å) radiation.

Appendix Junshan Li
127
C Powder X-ray diffractorams of LnxSr4xFe3O10 (Ln = La, Nd; 0 < x < 4)
Powder X-ray diffraction patterns of some of selected samples in the series LnxSr4xFe3O10
(Ln = La, Nd) obtained via different annealing conditions not presented in the result section.
For all samples, the annealing conditions are described in Tables 10 and 11, result section.
C.1 LaSr3Fe3O10 prepared in air and Ar atmosphere
Figure A-3. Powder X-ray diffraction patterns of LaSr3Fe3O10 annealed in air (1250 oC) and Ar
(1100 oC). Blue filled squares indicate the Bragg reflections of the RP3 phase. A very low
intensity peak (marked with “?”) is unidentified. Powder X-ray diffraction patterns were
collected using monochromatic Cu Kα1 (λ = 1.540598 Å) radiation.

August 2013 Appendix
128
C.2 LaSr3Fe3O10 prepared at various conditions
Table A-1. Refined data for LaSr3Fe3O10 prepared at various conditions
Batch Annealing condition Phase Phase
fraction GOF Rexp Rwp Rp
11
1050 oC × 15 h
1250 oC × 25 h
Perovskite 18.16% 1.13 7.34% 8.27% 6.65%
RP3 80.70%
12
1100 oC × 48 h
1100 oC × 24 h
Perovskite 30.96% 1.2 7.19% 8.66% 6.82%
RP3 69.04%
23
1050 oC × 15 h
1350 oC × 25 h
Perovskite 30.71% 1.48 3.98% 5.87% 4.47%
RP3 69.29%
34
1050 oC × 15 h
1250 oC × 25 h
Perovskite 33.61% 2.22 2.86% 6.36% 4.34%
RP3 66.39%
45
1050 oC × 15 h
1250 oC × 25 h
Perovskite 30.77% 1.52 2.87% 4.38% 3.25%
RP3 69.23%
16
1050 oC × 15 h
1250 oC × 25 h
1350 oC × 12 h
Perovskite 22.19%
1.34 7.38% 9.88% 7.7% RP2 8.48%
RP3 69.33%
1 Pellet taken in and out of furnace at room temperature
2 Pellet put into the furnace at 1050 oC and 1250 oC and taken out at the same temperature, and
allowed to cool down in air
3 Pellet put into the furnace at 1050 oC and 1250 oC and taken out at the same temperature, and
allowed to cool down in a desiccator
4 Pellet put into the furnace at room temperature and taken out at high temperature, and allowed to
cool down in desiccator

Appendix Junshan Li
129
Figure A-4. Powder X-ray diffraction patterns of LaSr3Fe3O10 obtained from different sintering
conditions. Powder X-ray patterns were collected using monochromatic Cu Kα1 (λ = 1.540598 Å)
radiation.

August 2013 Appendix
130
C.3 La1.25Sr2.75Fe3O10
Figure A-5. Powder X-ray diffraction patterns of La1.25Sr2.75Fe3O10 annealed in air at 1300 oC.
Powder X-ray diffraction patterns were collected using monochromatic Cu Kα1 (λ = 1.540598 Å)
radiation. The refined phase fractions are 74.23% RP3 phase and 25.77% perovskite
(La,Sr)FeO3 according to TOPAS. GOF = 1.27, Rexp = 4.17%, Rwp = 5.31%, Rp = 4.1%.

Appendix Junshan Li
131
C.4 La1.5Sr2.5Fe3O10 prepared at various conditions
Table A-2. Attempts for synthesizing La1.5Sr2.5Fe3O10 and refined data
Batch Annealing condition Phase Phase
fraction GOF Rexp Rwp Rp
1 11100
oC × 12 h (Ar)
1100 oC × 12 h (Ar)
Perovskite 78.08%
2.4 3.46% 8.29% 5.54% RP1 7.79%
RP3 14.12%
2
21000
oC × 12 h
1250 oC × 12 h
1250 oC × 12 h
Perovskite 5.83%
3.26 3.87% 12.62% 8.1% RP1 53.88%
RP3 40.29%
1 Pellets were fired at 1100 oC for 12 hours under the Ar flow.
2 Pellets were fired at 1100 oC for 12 hours in air.
Figure A-6. Powder X-ray diffraction patterns of La1.5Sr2.5Fe3O10 obtained from sintering
conditions. Powder X-ray patterns were collected using monochromatic Cu Kα1 (λ = 1.540598 Å)
radiation.

August 2013 Appendix
132
C.5 La2Sr2Fe3O10 prepared at various conditions
Table A-3. Refined data for La2Sr2Fe3O10 under different synthetic condition
Annealing condition Phase Phase
fraction GOF Rexp Rwp Rp
1100 oC (Ar) × 12 h × 2
Perovskite 44.05%
1.63 3.82% 6.21% 4.74% RP1 17.06%
RP3 38.4%
1000 oC × 12 h
1200 oC × 12 h
1200 oC × 12 h
Perovskite 21.37%
2.08 3.2% 6.67% 4.52% RP2 24.61%
RP3 54.02%
1000 oC × 12 h
1250 oC × 12 h
1250 oC × 12 h
Perovskite 44.73%
2.29 3.54% 8.1% 5.48% RP1 16.42%
RP3 38.85%
1000 oC × 12 h
1300 oC × 12 h
1300 oC × 12 h
Perovskite 46.34%
2.34 3.7% 8.67% 5.8% RP1 14.57%
RP3 39.09%
Figure A-7. Powder X-ray diffraction pattern of sintered La2Sr2Fe3O10 series under different
conditions. The inset shows the peak splitting between 2θ = 30.4o and 2θ = 34.7
o. Powder X-ray
diffraction patterns were collected using monochromatic Cu Kα1 (λ = 1.540598 Å) radiation.

Appendix Junshan Li
133
C.6 La3SrFe3O10 prepared at various conditions
Table A-4. Attempts for synthesizing compound La3SrFe3O10 and refined data
Batch Annealing
condition Phase
Phase
fraction GOF Rexp Rwp Rp
1
1000 oC × 12 h
1250 oC × 12 h
1250 oC × 12 h
Perovskite 78.08%
2.4 3.46% 8.29% 5.54% RP1 7.79%
RP3 14.12%
2
1000 oC × 12 h
1300 oC × 12 h
1300 oC × 12 h
Perovskite 5.83%
3.26 3.87% 12.62% 8.1% RP2 53.88%
RP3 40.29%
3
1000 oC × 12 h
1350 oC × 12 h
1350 oC × 12 h
Perovskite 74.19%
1.61 5.66% 9.1% 7.13% RP2 4.78%
RP3 21.03%
Figure A-B. Powder X-ray diffraction patterns of La3SrFe3O10 obtained from sintering
conditions. Powder X-ray patterns were collected using monochromatic Cu Kα1 (λ = 1.540598 Å)
radiation.

August 2013 Appendix
134
C.7 NdSr3Fe3O10 prepared at various conditions
Table A-5. Attempts for synthesizing compound NdSr3Fe3O10 and refined data
Batch Annealing condition Phase Phase
fraction GOF Rexp Rwp Rp
1 1100
oC × 48 h
1100 oC × 48 h
Perovskite 35.1%
1.19 6.59% 7.87% 6.21% RP2 3.42%
RP3 61.48%
2 1050
oC × 15 h
1250 oC × 25 h
Perovskite 49.54%
1.12 9% 10.08% 7.92% RP2 4.25%
RP3 46.21%
3 1050
oC × 15 h
1350 oC × 25 h
Perovskite 36.89% 1.24 9.34% 11.56% 8.99%
RP3 63.11%
4
1050 oC × 15 h
1250 oC × 25 h
1350 oC × 24 h
Perovskite 37.34% 1.17 9.48% 11.1% 8.81%
RP3 62.66%
5
1050 oC × 15 h
1250 oC × 25 h
1350 oC × 25 h
Perovskite 19.31%
1.52 2.87% 4.38% 3.25% RP1 3.04%
RP3 77.65%
6
1000 oC × 12 h
1350 oC × 12 h
1350 oC × 12 h
RP3 100% 1.29 3.86% 5% 3.84%
Figure A-9. Powder X-ray diffraction patterns of NdSr3Fe3O10 obtained from different sintering
conditions. Powder X-ray diffraction patterns were collected using monochromatic Cu Kα1 (λ =
1.540598 Å) radiation.

Appendix Junshan Li
135
C.8 Nd1.25Sr2.75Fe3O10 prepared at various conditions
Table A-6. Attempts for synthesizing compound Nd1.25Sr2.75Fe3O10 and refined data
Batch Annealing
condition Phase
Phase
fraction GOF Rexp Rwp Rp
1
1000 oC × 12 h
1250 oC × 12 h
1250 oC × 12 h
Perovskite 81.8%
1.27 5.83% 7.4% 5.62% RP1 15.60%
RP3 2.59%
2
1000 oC × 12 h
1300 oC × 12 h
1300 oC × 12 h
Perovskite 83.69%
1.10 12.36% 13.56% 10.65% RP1 15.62%
RP3 0.69%
3
1000 oC × 12 h
1350 oC × 12 h
1350 oC × 12 h
Perovskite 80.15%
1.36 5.39% 7.33% 5.39% RP1 4.71%
RP3 15.14%
4
1000 oC × 12 h
1400 oC × 12 h
1400 oC × 12 h
Perovskite 79.85%
1.27 5.71% 7.27% 5.37% RP1 14.6%
RP3 5.54%
Figure A-10. Powder X-ray diffraction patterns of Nd1.25Sr2.75Fe3O10 obtained from sintering
conditions. Powder X-ray diffraction patterns were collected using monochromatic Cu Kα1 (λ =
1.540598 Å) radiation.

August 2013 Appendix
136
C.9 Nd2Sr2Fe3O10 prepared at various conditions
Table A-7. Attempts for synthesizing compound Nd2Sr2Fe3O10 and refined data
Batch Annealing
condition Phase
Phase
fraction GOF Rexp Rwp Rp
1 1050
oC × 15 h
1350 oC × 25 h
Perovskite 76.21%
1.23 8.42% 10.33% 8.06% RP1 11.34%
RP3 12.45%
2 1050
oC × 15 h
1400 oC × 25 h
Perovskite 84.52%
1.99 3.06% 6.09% 4.45% RP1 11.89%
RP3 3.59%
3 1050
oC × 15 h
1450 oC × 25 h
Perovskite 80.12%
1.24 9.34% 11.56% 8.99% RP1 15.99%
RP3 3.89%
4
1050 oC × 15 h
1250 oC × 25 h
1350 oC × 24 h
Perovskite 81.41%
1.19 9.76% 11.56% 8.95% RP1 17.26%
RP3 1.33%
5 1050
oC × 15 h
1250 oC × 25 h
Perovskite 73.09%
1.49 7% 10.44% 7.37% RP1 20.34%
RP3 6.57%
Figure A-11. Powder X-ray diffraction patterns of Nd2Sr2Fe3O10 obtained from sintering
conditions. Powder X-ray diffaction patterns were collected using monochromatic Cu Kα1 (λ =
1.540598 Å) radiation.

Appendix Junshan Li
137
C.10 Nd3SrFe3O10 prepared at various conditions
Table A-8. Attempts for synthesizing compound Nd3SrFe3O10 and refined data
Batch Annealing
condition Phase
Phase
fraction GOF Rexp Rwp Rp
1
1000 oC × 12 h
1250 oC × 12 h
1250 oC × 12 h
Perovskite 71.37%
2.32 3.42% 7.94% 5.15% RP2 6.62%
RP3 22.01%
2
1000 oC × 12 h
1300 oC × 12 h
1300 oC × 12 h
Perovskite 69.45%
2.1 3.76% 7.91% 5.91% RP2 24.3%
RP3 6.25%
3
1000 oC × 12 h
1350 oC × 12 h
1350 oC × 12 h
Perovskite 74.19%
2.18 3.63% 7.93% 5.27% RP2 4.78%
RP3 21.03%
Figure A-12. Powder X-ray diffraction patterns of Nd3SrFe3O10 obtained from sintering
conditions. Powder X-ray diffraction patterns were collected using monochromatic Cu Kα1 (λ =
1.540598 Å) radiation.

August 2013 Appendix
138
D Calculations for determining of oxygen content with temperature
The TGA raw data of mass change between 30 oC and 1200
oC in an air atmosphere was read
from the TGA curves (see Table A-9). It is assumed that only oxygen was lost and
intercalated upon heating and cooling. LaSr3Fe3O10δ is taken as an example in the
calculations. Cerimetric titration gave the oxygen content as 10δ1.
Table A-9. Raw data obtained from TGA
Temperature
oC
Mass
g
T1 30.059 M1 100
T2 35.54524 M2 99.99148
T3 36.885 M3 99.98549
T4 39.59652 M4 99.98517
T5 43.95576 M5 99.98694
T6 50.15571 M6 99.9847
…… …… …… ……
The formula weight of LaSr3Fe3O10-δ1 is denoted as FW1 and calculated using following
procedure:
Assume that the initial sample mass is 100 g, so the mole of the sample at T1 was:
Equation A-1
When temperature is increased to T2, the mass change of the sample is M2-100 g, and
therefore the change of the mole of oxygen (denated as ) involved is:
Equation A-2
where FWO is the relative atomic mass of oxygen.
Thus the calculated oxygen content at T2 is
Equation A-3
Likewise, the oxygen content at other temperatures can also be calculated.

Appendix Junshan Li
139
E Calculation of oxygen content of reduced LnSr3Fe3O10 (Ln = La, Nd)
via thermogravimetric analysis
For the reduced sample, the oxygen content can be calculated using the thermogrametric data
under the assumption that the sample not re-oxidizes before the TGA experiments is started
and the final oxygen stoichiometry is O9.90.
Table A-10. Raw data obtained from TGA
Temperature
oC
Mass
g
T1 30.06 M1 100
T2 35.45 M2 99.99148
T3 36.85 M3 99.98549
…… …… …… ……
Tn/2 1200 Mn/2 100.31149
…… …… …… ……
Tfinal 30.02 Mfinal 101.77123
LaSr3Fe3O10-δ1 is taken as an example. The formula weight of LaSr3Fe3O9.9 is denated as
FWO9.9, and the mole of sample at Tfinal is of
Equation A-4
The formula weight of LaSr3Fe3 is FW1 and the mass of this part keeps stable as
Equation A-5
As a result, the oxygen content of the sample at T1 is
Equation A-6
where FWO is the relative atomic mass of oxygen.
The oxygen content at other temperatures can be calculated using the same procedure.

August 2013 Appendix
140
F Calculations of cerimetric titration
The principle of cerimetric titration together with some equations involved are presented in
section 2.4. Since Mohr salt only reduce iron in the RP oxide to Fe (III) we define iron as
having average valence 3+x; or Fe3+x
. We set up the calculations according to this to find x
(and ) in Fe3+x
for LnSr3Fe3O10:
FWLnSr3Fe3O10 = FWLnSr3Fe3O9 + 3 × x/2 FWo Equation A-7
Known amounts of RP3 oxide (50 mg) and Mohr salt (in excess to reduce all the high valent
cations and consume around 8 mL 0.1 M Ce(SO4)2) were put in a beaker with Ar flowing as a
protecting blanket. Both the oxides and Mohr salt were dissolved simultaneously in diluted
HNO3, Fe3+x
would be released from the oxide and react with Fe2+
.
x Fe2+
(Mohr) + Fe3+x
(oxide) → (1+x) Fe3+
Equation A-8
After the reaction is completes, there were only Fe2+
and Fe3+
left in the solution, as shown in
Equation A-9. Consumed Mohr salt depends on x.
n Fe2+
(left) = n Fe2+
(Mohr) 3n x Fe3+x
(oxide) Equation A-9
One drop of Ferroin was added to the solution, giving a light red color. Then 0.1 M Ce(SO4)2
were used to titrate the solution until critical point arrives where the color changes to light
green.
Ce4+
+ Fe2+
→ Ce3+
+ Fe3+
Equation A-10
The consumed Ce4+ oxidized the remaining Fe2+ in the solution as Equation A-10 illustrates:
n Ce4+
= n Fe2+
(left) Equation A-11
Combining Equation A-9 and A-11 gives:
n Ce4+
= n Fe2+
(Mohr) 3n x Fe3+x
(oxide) Equation A-12
Then the calculated mole of oxide is:
n Fe3+x
(oxide) = (n Fe2+
(Mohr) n Ce4+
)/3x Equation A-13
The mole of oxide can also be derived as mass (m(oxide)) divided by formula weight
(FWLnSr3Fe3O10).
n Fe3+x
(oxide) = m(oxide)/ (FWLnSr3Fe3O9 + 3 × x/2 FWo) Equation A-14

Appendix Junshan Li
141
Equation A-13 and A-14 gives
(n Fe2+
(Mohr) n Ce4+
)/3x = m(oxide)/ (FWLnSr3Fe3O9 + 3 × x/2 FWo) Equation A-15
Find x in Equation A-15
[ ( ) ]
( )
[
( ) ] Equation A-16
where FWLnSr3Fe3O9 is the formula weight of LaSr3Fe3O9, see equation A-7.
FWO is the formula weight of oxygen.
m(oxide) is the weight of RP3 oxide in this case (read from the balance).
nFe2+
(Mohr) is the mole of Mohr salt, can be calculated as the mass (read from the
balance) divided by its formula weight (this value would be determine gravimetrically prior to
use, for results see section 4.1.1 on Page 58).
nCe4+
is the mole consumed Ce(SO4)2 obtained from the molarity times volume (read
from the buret). The real molarity of Ce(SO4)2 would be determined from three parallel
measurements at the onset of every titration.
Ruddlesden-Popper phases LnSr3Fe3O10 with Sr(II) and Ln(III) (Ln = La, Nd) as A-site
cations and oxygen has 2 state valence. As assumed, Iron has the average oxidation states
3+x. A simple Equation A-17 is established based on the electroneutrality principle.
3 + 2 × 3 + 3 × (3 + x) = 2 × (10δ) Equation A-17
The oxygen nonstoichiometry δ is (11.5x), and the oxygen content 10δ in the sample is
(9+1.5x), where x can be calculated using Equation A-16.

![Popper Bee&koven/ David Popper: Suite '1m Walde' / Anton ...€¦ · Popper Bee&koven/ David Popper: Suite '1m Walde' / Anton von Webern: 3 StiickeJìir Vidlonçello K7avier Op.]](https://img.pdfslide.us/doc/110x75/5f9c43259ad7976520145adf/popper-beekoven-david-popper-suite-1m-walde-anton-popper-beekoven.jpg)