Embed Size (px)
Citation preview

Coping, Adapting and Resisting: A Critical Analysis of Risk Management during Armed Conflicts
Silvia Jarauta Bernal

University of Alicante Faculty of Economics and Business Administration
Department of Applied Economic Analysis
Coping, Adapting and Resisting: A Critical Análisis of Risk Management during Armed Conflicts
PhD. Thesis Silvia Jarauta Bernal
Supervisor: Dr. Moisés Hidalgo Moratal

2
2009
Acknowledgments This study would not have been possible without the support of all the people that have
helped me during these years of research.
First of all, I would like to express my deepest gratitude to all the people in the Occupied
Palestinian Territories (oPt) who encouraged this research and helped me to understand the
complex realities of the conflict. Particularly, I would like to thank Fadi Hadeeb, the
translator, Jawad Saleh from the Palestinian Centre Bureau of Statistics (PCBS), Francine
Pickup from the United Nations Office for Coordination of Humanitarian Affairs, Rana
Hanoun from the Ministry of Planning, Silvia Asensio from Paz y Tercer Mundo, Veronique
Stalmans from the office of the European Union in Jerusalem and the people who provided
me with the information and data to anchor the theoretical debate on risk management to
the facts on the ground.
Next, I would like to thank my parents, who have provided me with two of the most
essential aspects to carry out this investigation: passion for learning and a solid commitment
to engaging with the collective. Without them, these years of studying would have been
superficial.
Then, I would like to thank Dr. Moisés Hidalgo for his supervision and for unconditionally
believing in my research. He analysed my research arguments and transmitted the confidence
to me to think freely. From the University of Alicante, I also would like acknowledge the
generous help of Dr. Alfonsa Denia, who despite being an econometrician had no doubts
about guiding me in descriptive analysis.
I am also thankful to MICROCON for its financial support and primarily to the director of
this research programme, Patricia Justino for motivating this investigation in the early stages.
Also from the Institute of Development Studies, where I spent several months collecting
literature and discussing the research with fellows and friends, I would like to thank, Robin

3
Luckham, Marzia Fontana, Lizbeth Navas-Navarro, Steven Devereux, Angela Dowman,
Collete Harris, Zander Navarro, and all the team in the Library.
Last, but of course not least, this work would not have been achieved without the support
and understanding of my companion David, my brother Pablo, and my friends Loles, Yeyo,
Elena and Juan, who have listened to my worries and helped me to find the way to keep
going. And to Erica, Sofia, Ana and Silvia, who shared with me their views on the
Palestinian-Israeli conflict and particularly on what should be the development policy
framework. Finally, I would like to thank Ana Julieta, my dearest friend, who despite the
distance, always stayed close, reminding me of the reasons why I decided to embark in this
investigation.
This whole thesis could not have looked like it is without the help of Paddy Mahony, who
not only proof-read the entire dissertation, but also provided many stylistic suggestions and
substantive challenges to help me clarify my arguments.

4
TABLE OF CONTENTS
INTRODUCTION 7
CHAPTER 1: THE ISRAELI OCCUPATION OF THE PALESTINIAN TERRITORIES 20
1.1 The Dimensions of the Conflict 20
1.2 The Israeli Occupation of the Palestinian Territories 24 1.2.1 The Israeli Occupation during 2000-2004 29
1.2.2 The Impact of the Israeli Occupation on the Palestinians 42
CHAPTER 2: RISK MANAGEMENT IN CONFLICT-AFFECTED HOUSEHOLDS 49
2.1 Introduction 49
2.2 Risk Management Theory 52 2.2.1 The Strategies 54
2.2.2 The Determinants of Risk Management 61
2.2.2.1 Market- and Household-related Determinants of Risk Management 64
2.2.2.2 The Risk-related Determinants of Risk Management 77
2.3 Understanding Armed Conflict and Conflict-produced Shocks 91 2.3.1 Causes of Armed Conflicts 95
2.3.2 The Socio-economic Costs of Conflicts 99
2.3.3 The Source-related Characteristics of Armed Conflicts 106
2.4. Risk Management in Conflict-affected Households 113 2.4.1 Household Strategies to Conflict-produced Shocks 114
2.4.2 Risk-related Determinants of Risk Management Strategies 123
2.4.3 Everyday Forms of Resistance 143
2.5 Conclusions 152

5
CHAPTER 3: METHODS OF RESEARCH 158
3.1. Non-formal Collaborative Research 158 3.1.1. The Identification Phase 159
3.1.2 The Engagement Phase 161
3.2 Primary Data 164
3.3 Secondary Data 165
CHAPTER 4: DATA AND ANALYSIS 182
4.1 Palestinian Expenditure and Consumption Survey in 2004 183 4.1.1 Description of the Survey 184
4.1.2 Descriptive Analysis of PECS 186
4.2 Conflict Data 198 4.2.1 The Conflict Data Set 198
4.2.2 Understanding the Occupation Instruments 211
4.2.2.1 Descriptive Analysis of Conflict across Time and Space 211
4.2.2.2 Correlation Analysis between Israeli Occupation Instruments 217
4.3 Palestinian Responses to the Crisis: PECS and Beyond 222 4.3.1 Households Responses to Conflict-produced Shocks 222
4.3.2 The Risk Management Distribution in PECS 2004 228
4.4 Conflict Correlates of Risk Management 236 4.4.1 Conflict Correlates of Income Smoothing Strategies 237
4.4.2 Conflict Correlates of Risk-sharing Strategies 254
CONCLUSIONS: FINDINGS AND IMPLICATIONS 267
BIBLIOGRAPHY 288
APPENDICES 305
SPANISH SUMMARY 359

6
ACRONYMS AND ABBREVIATIONS ACSUR Asociación para la Cooperación con el Sur. AECID Agencia Española de Cooperación Internacional para el Desarrollo. AFF Obtained assistance from Family and Friends. AHLS Adjusting Household Labour Supply. ACH Acción contra el Hambre. AIC Alternative Information Centre. ANOVA Analysis of Variance. B’Tselem Israeli Information Centre for Human Rights. CE Complex Emergencies. EU European Union. FAO United Nations Food and Agriculture Organization. FSA Food Security Assessment. GDP Gross Domestic Product. GNP Gross National Product. HDIP Health Development Information Project. HEPG Humanitarian Emergency Policy Group. ICHAD Israeli Committee against House Demolitions ICJ International Court of Justice. ICRC International Committee of the Red Cross. IDF Israel Defence Forces. ILO International Labour Organization. IPC Israeli Policy of Closure. IPYL International Palestinian Youth League. IUED Institute Univesitaire d’études du Développement. JPS Journal of Palestinian Studies. LCT Life-cycle theory. LFS Palestinian Labour Force Survey. NGO Non-governmental Organization. NIS Israeli New Shekel. OCHA United Nations Office for the Coordination of the Humanitarian Affairs. ODI Overseas Development Institute. oPt Occupied Palestinian Territories. PNA Palestinian National Authority. PASSIA Academic Society for the Study of International Affairs. PCBS Palestinian Centre Bureau of Statistics. PECS Palestinian Expenditure and Consumption Survey PIH Permanent Income Theory. PRCS Palestinian Red Crescent Society. PTM Paz y Tercer Mundo. RUF Revolutionary United Front of Sierra Leone. SI Solidaridad Internacional. UN United Nations. UNCTAD United Nations Conference for Trade and Development. UNDP United Nations Development Programme. UNSCO United Nations Special Coordinator Office for the Middle East. UNWRA United Nations Relief and Works Agency for Palestinian Refugees in the Near East. USAID United States Agency for International Development. VCI Village Closure Index. WFP World Food Programme.

7
INTRODUCTION
The objective of this research is to contribute to the understanding of risk management in
the context of armed conflicts, i.e. to help understand how people deal with the anticipated
and actual losses associated with the uncertain events and outcomes produced by socio-
political risk events such as armed conflicts. This is an infant area of research and the
investigation aims to participate in the emerging debate by providing a conceptual
framework for the analysis of risk management of conflict-affected households.
This investigation relies in a great extent on analyses framed in the Israeli-Palestinian
conflict. Out of the many different dimensions of the conflict1, this research is interested in
the Israeli occupation of the Palestinian Territories2. Given the different realities of the three
territories comprising the Occupied Palestinian Territories (oPt) – the Gaza Strip, the West
Bank and Jerusalem – this research focuses solely on the West Bank. The period of analysis
refers to 2000-2004, the years immediately following the onset of the Al-Aqsa Intifada in
September 2000, the largest sustained Palestinian uprising against Israeli occupation. This
crisis was characterised by the redeployment of the Israeli Defence Forces (IDF) in the West
Bank, the tightening up of the Israeli Policy of Closure and the construction of the Wall3.
During this period in the West Bank, the real Gross Domestic Product (GDP) suffered a
decrease of 38%, unemployment increased 10%, reaching an unprecedented 40% in 2002; the
1 As it is argued by many authors, the Israeli-Palestinian conflict is composed of four main aspects; the refugee issue, the situation of the Palestinians of Israel, the status of the city of Jerusalem and the Israeli occupation of the Palestinian Territories (Escudero, 2006; Al-Haq, 2005; Pappe, 1997). 2 As Article 42 of The Hague Regulations stipulates: a ‘territory is considered occupied when it is actually placed under the authority of the hostile army’, and that the occupation extends ‘to the territory when such authority has been established and can be exercised’ (Regulations Annexed to the Fourth Hague Convention Respecting the Laws and Customs of War on Land, 1907). Furthermore, the Tribunal of the Nuremberg Trials detailed, in the Hostage Case, that a territory is occupied even when the occupying forces have partially evacuated certain parts of the territory or lost control over the population, as long as it could at any point in time re-assume physical control of that territory (Case number 7, Nuremberg Proceedings, May 10, 1947). 3 The Wall has been differently defined. The UN Secretary General and the donor community in the field talk about the ‘Separation Barrier’; the Israelis refer to it as the ‘Security Fence’; and the Palestinians, the UN General Assembly and the International Court of Justice use the term ‘Wall’. This research refers to it as the Wall. In the Palestinian-Conflict there is often more than one term to describe the same reality. This essentially reflects the different and conflicting Palestinian and Israeli historical and national narratives as well as the attempt by other parties not to take a position in either way, thus often creating a third, alternative expression. While the high level of political sensitivity surrounding the Israeli-Palestinian conflict makes it necessary to abide by the highest standards of accuracy and impartiality, terms should be considered and selected in full knowledge of their meaning and implications or their usage.
8
percentage of population under a poverty line of 2.1$ per day per capita double from 20% to
48%4. The Al-Aqsa Intifada, far from representing a break with the, then recent past, was a
logical and inevitable extension of it. The Al-Aqsa Intifada did not emerge in a vacuum but
emanated from a context of dispossession that characterized the entire Oslo peace process
and its impact on Palestinians5.
This dissertation is conceptually anchored within the literature of risk management and the
studies of the causes and effects of conflict. Although both strands of literature - conflict and
risk management – have been independently studied, their interaction remains an unexplored
arena. While the research on risk management in developing countries is mostly drawn from
situations affected by economic-, natural- or health-related risk events, the study of armed
conflict, particularly the issues related to the notions of conflict, participants, and causes and
effects are mostly addressed from macro- and meso-perspectives.
Regarding the literature on risk management, social scientists have been long concerned with
how people deal with fluctuations in their income and particularly on the factors influencing
the vulnerability of households to risk6. Risk is a central feature and factor of life of all
communities and its management has been one of the most challenging preoccupations of
mankind. It could be said that the risk management debate was firstly motivated by
discussions on rational behaviour in pre-market societies. During the 1960s, this was an issue
of debate among anthropologists, whether substantivists or formalists. While the former
argued that choices of behaviour in pre-market societies were not economically rational as
individuals were motivated by the principles of reciprocity and redistribution (Dalton, 1961;
Cook, 1966), the latter argued that individuals in pre-market societies are capable of rational-
maximizing behaviour and that conventional economic theory is fully applicable to such
4 The source of the data is the Palestinian Centre Bureau of Statistics (PCBS). Poverty data are World Bank estimations. 5 The consequences of Oslo have been widely studied. A great number of scholars agreed that the Oslo peace process, rather than encouraging the establishment of a balance of interests, accentuated and skewed the balance of power and created a dysfunctional environment for negotiations. See, for example, Keating et al. (2005), Álvarez-Ossorio (1999, 2003), Said (1996, 2001), Roy (2001b, 2007), Rabbani (2001) and Pacheco (2001). 6 Risk is a commonly-used term, applied to nearly every human action, yet it remains poorly understood and poorly defined because the analysis of risk management hinges crucially on its definition (Beck, 1998). Risk is fundamentally composed of a cause, about which there may be some uncertainty, and an effect or impact about which there may also be some uncertainty. Economists have referred to risk as uncertain events (probability of occurrence) and outcomes (expected utility) with a known or an unknown probability distribution (Sinha and Lipton, 1999).
9
societies (Posner, 1980). It was this unsettled debate that stimulated further research within
the different disciplines. As we will describe next, numerous studies have been carried out in
the last two decades investigating whether risk management depends on risk preferences,
market opportunities, and the characteristics of the risk events (spread, predictability and
intensity) as well as on the household’s asset base.
In order to assess rational allocation decisions, some economists have carried out studies to
assess risk aversion and preferences towards risk in these types of societies7. Although there
are divergent views, the majority of the studies concluded that farmers do take rational
choices, mostly determined by moderate risk aversion. This was later criticized by Alderman
and Paxson (1992), who argued that the studies ignored other factors such as market
imperfections, particularly asymmetric information, that may overestimate or underestimate
the level of risk aversion. According to Alderman and Paxson, the well-known problems of
information asymmetries and deficiencies in the ability to enforce contracts as a result of
incomplete or absent insurance and credit markets may explain why households in
developing countries will not effectively manage risk8.
Parallel to this discussion, and mostly in the context of famines, social scientists joined the
debate and carried out extensive research exploring household responses to drought9. They
found that households are not irrational or passive victims but rational actors taking
proactive short and long term responses to deal with adverse events, even in the context of
imperfect credit and insurance markets. In contexts of famine, Sen formalized the
entitlement approach and put forward an issue relevant for the debate of risk management in
developing countries (Sen, 1981). He challenged the importance of supply-side aspects, such
as the existence of credit and insurance schemes, and gave significant relevance to demand
failure in the causes of famine. The main argument of this entitlement approach is that
vulnerability to famine is largely attributable to one’s ability to command food through all
7 Some examples of studies in development economics assessing risk aversion and preferences towards risk in pre-market societies can be found in Binswanger (1980), Hazell (1982) and Antle (1987). 8 A great part of the studies on risk management have been interested in the relationship between the structure of financial markets and the effectiveness of risk management strategies, particularly measured in terms of consumption smoothing. Some examples are Alderman (1996), Deaton (1991, 1992), Zeldes (1989) and Morduch (1995). 9 Early research about households’ responses to drought has been carried out by Jodha (1975), De Waal (1989), Watts (1983).

10
legal means, and that such an ability is determined by one’s ownership of tangible assets and
the rate at which one can exchange these for food.
This emphasis on demand-failure argued by Sen’s entitlement approach opened a big window
for exploring household responses to crisis in the context of developing countries over the
following decade. During the 1990s, great efforts were dedicated to understanding why
households in developing countries are still prone and vulnerable to risk events and there
were important contributions about the strategies, processes and determinants of risk
management. Regarding the strategies, a large body of research has illustrated the wealth of
behavioural and institutional responses that emerge to fill the holes left by market failures
(credit and insurance) and at least partially manage to smooth consumption and income if
not by formal by informal means. Households, far from being impassive, adopt proactive
short- and long-term responses to deal with adverse risk events. They embark on informal
risk management strategies, which range from inter-temporal consumption smoothing10 (e.g.
informal credit and the accumulation and de-accumulation of assets; so-called buffer-stock
behaviour), risk-sharing11 (community-based credit and saving schemes, share-cropping,
family- and community-based transfers and charity) and income-smoothing strategies12
(income diversification, adjusting household labour supply and investment in low-income
activities). As for the process of risk management, the food security approach is interested in
when and why households adopt certain strategies to deal with uncertain risk events and
outcomes and has identified important characteristics of the risk management process, such
as its dynamic, comprehensive and forward-looking nature13.
Vis-à-vis the determinants, i.e. the factors influencing risk management, its research is
intrinsically linked with the studies on household vulnerability. While the term
10 Examples of Investigations about inter-temporal consumption-smoothing strategies in developing countries can be found in Rosenzweig and Wolpin (1993), Dercon (1998), Alderman (1996), Udry (1995), Paxson (1992), Hulme and Mosley (1996) and Deaton (1991). Particular attention has been given to these strategies in times of famine (e.g. Dessalegn, 1991; Corbett, 1989; Davies, 1996; De Waal, 1989; Devereux, 1992, Kinsey et al., 1998). 11 Accounts of spatial consumption smoothing strategies in developing countries can be found for example in Carter (1991), Ravallion and Dearden (1988), Townsend (1994, 1995), Besley (1995), Dercon and Krishnan (2000b), Coate and Ravallion (1993), Morduch (1991) and Fafchamps (1992). 12 Research on income-smoothing strategies in developing countries has been carried out by Morduch (1990), Dercon (1996, 1998), Jacoby and Skoufias (1997), Kochar (1999), Jalal and Ravallion (1998), Rosenzweig and Binswanger (1993) and Ellis (2000). 13 Key contributions to the process of coping during drought are the research of Corbett (1989), Davies (1996) and Devereux (1992, 1993, 1999).

11
‘vulnerability’ has been used with a variety of related but different meanings, in most of the
writings on poverty and risk management, vulnerability refers to exposure to risk events and
the household’s capacity to confront these risk events. In the late eighties, Chambers (1989)
defined vulnerability as a function of exposure to risk (susceptibility), the intensity with
which the risk event is experienced (sensitivity), and the capacity to resist downward
movement in well-being as a result of the occurrence of a risk event (resilience). Eleven years
later in 2000, the World Bank, motivated by the findings of studies on inter-temporal welfare
dynamics14, dedicated its World Development Report to poverty, highlighting its dynamic
dimension and defining vulnerability as a function of risk, risk management strategies and
the welfare outcomes, which measure the likelihood that a shock will result in a decline in
well-being (World Bank, 2000). However, the definition of vulnerability varies depending on
the discipline – economics, medicine, sociology, anthropology, etc. – and on the focus on the
vulnerability components – risk events, outcomes, or strategies (Alwang et al., 2001). For
example, within the field of economics, while the asset- and food-security approaches mostly
focus on the responses, risk management and poverty dynamics centre on the outcomes.
Despite the fact that one of the central motivating factors in the dynamics of poverty and
risk management is the risk event, the risk event itself has largely remained on the periphery
(Dercon, 2005). As noted by the complex emergency approach about the food security and
entitlement approach one of the reasons explaining this and the focus on the risk outcomes
is the common portrayal of risk as exogenous. This assumption comes from the general
perception that while the risk events are beyond human influence, their effects, i.e. the
outcomes, can be influenced. Thus, by focusing on the outcome component of vulnerability,
the risk management approach centres on measuring a household’s ability to smooth
consumption and income. Given the wide range of responses observed in the context of
absent or imperfect credit and insurance markets, the focus can not anymore be placed on
the problems of information asymmetries and deficiencies in the ability to enforce contracts;
instead, consumption and income-smoothing are mostly explained by household poverty15.
14 A good number of studies have found large fluctuations in income over relatively short periods, adding a dynamic dimension to poverty. The central motivating ‘fact’ in the poverty dynamics literature is that some of the poor are not poor all the time and in fact there is evidence that most of the poor are not ‘always poor’ but ‘sometimes poor’. See Baulch and Hoddinott (2000) for a collection of papers about economic mobility and poverty dynamics in developing countries. 15 Understanding the household-related factors influencing consumption smoothing is an area of research that attracted my attention during my MPhil studies at the Institute of Development Studies. Based on household-survey data, I researched into the role of microfinance in reducing household vulnerability in Bangladesh, the factors explaining pastoralist seasonal consumption fluctuations in Ethiopia as well as the determinants of

12
As for the risk events themselves, because of the exogeneity assumption, their integration
into the analysis of consumption and income smoothing in developing countries is made
not via its causes but by the characteristics of spread, predictability and intensity16.
Regarding the literature of risk mangement, this research relied on the contributions of the
food security approach to understanding the process of risk management and the
contributions of risk management theory to the determinants of risk management. Although
the findings are purely drawn from context, where the sources of risks events are economic-,
nature- or health-related, it provides a wealth of information about how households deal with
risk. Therefore, it constitutes the reference framework for understanding risk management.
The question about whether it can be applied to the context of armed conflict will be
answered by this research.
The study of armed conflicts is the second strand of literature this research relies on17.
Generally, its examination has been characterized, over a long time, by a kind of ‘mental
block’, which has viewed war as development malaise; as an irrational eruption of violence or
its background (Keen, 1998). It was with these concepts of war that the famines in the Horn
of Africa during the decade of the 1980s were approached. War and violence were basically
marginalized from the study and the attention was paid to the risk welfare outcomes18.
Similar omissions can be found in the thinking on development. Stewart (1993) makes the
consumption smoothing in Pakistan. Most of the work in the references to footnotes 10, 11, 12 explain risk sharing, consumption and income smoothing to a great extent by household poverty, as it determines the households asset base, access to credit and insurance schemes, access to high-return income activities, ability to take up particular activities (in terms of skills and capital), etc. 16 Research on the limitations imposed by economy-wide shocks can be found, for example, in Townsend (1994), Devereux, (1993a), Fafchamps et al. (1998) and Udry (1995). Studies on the influence of the intensity (and repetition) of risk events on consumption smoothing have been carried out by numerous authors such as Bisnwanger and Rosenzweig (1993), Deaton (1997), Morduch (1995), Webb and Reardon (1992) and Alderman (1996). The implications of unpredictable shocks have been studied by the buffer-stock model (Deaton, 1991; Zeldes, 1989; Morduch, 1990) and the theories of life cyle and permanent income hypothesis (Romer, 1996; Carroll, 1990). 17 Violent conflict is a ‘struggle, between individuals or communities over values or claims of status, power and scarce resources, in which the aims of the conflicting parties are to assert their values or claims over those of others’ (Goodhand and Hulme, 1999: 14). Since violent conflict occurs in all societies at all times, we are interested in armed conflicts, i.e. ‘mass violence instigated through collective action’ (Brück et al., 2005 cited in Justino, 2007: 2). Generally, armed conflicts are defined depending on their magnitude (scale, duration and intensity), geographical scope (international and internal) and the nature and extent of foreign intervention and the technology adopted (Stewart and FitzGerald, 2001). 18 In Drèze and Sen’s words ‘it would be a particular mistake to relate the causation of famine to violations of legality’ (Drèze and Sen, 1989: 22).
13
important point that the World Bank and the IMF have failed to design policies that take
full account of the realities of war.
Over the last two decades, there have been important contributions to the understanding of
armed conflict. On the one hand, analytical work has been carried out in different
disciplines on how conflict impacts upon politics, economies and societies19. On the other
hand, the complex emergency (CE) approach has emerged with a focus on the political
economy of war; analysing the production and distribution of power, wealth and destitution
during conflict, in order to explore the motives and responsibilities of those involved20. The
roots of this approach lie in the inadequacies and limitations of the entitlement and food
security approaches in understanding people’s reactions to political conflicts or wars. It is
argued that despite the fact that the literature on risk management has informed policy
debate about proactive responses taken by people exposed to crises, the literature fails to
recognise the underlying power dynamics by assuming risk events as exogenous, i.e. unable to
be influenced by human action.
Accordingly, all disasters have winners and losers and famine results from the conscious
exercise of power in pursuit of gain and advantages, often illustrated in the transfer of assets
from the weak to the politically strong through sectarian and counter-insurgency warfare
activities. Furthermore, once the power dynamics are taken into account, vulnerability to
famine lies less in a lack of purchasing power within the market, as suggested by previous
research, than in a lack of access to the means of power, political representation and
lobbying opportunity (Duffield, 1994; De Waal, 1997). Besides the endogenous nature of
armed conflict, the CE approach unravelled other important characteristics. Conflict does
not occur in a linear manner, where conflict and peace represent opposite ends of a
continuum, but rather coexist in different degrees of intensity (Keen, 1994). Conflict is not
uni-dimensional; it is often an extremely complex, multilayered conflict system in which a
number of different conflicts interact with one another (Duffield, 1994). Conflict is 19 Some examples of this literature are the following. Stewart (1993, 1997), Stewart and FitzGerald (2001), Carbonnier (1998), Cliffe and Luckham (1999), Luckham et al. (2001), Gupta (1990), Harvey (1998), Singer and Small (1994) and Macrae et al. (1997). 20 Complex emergencies – or what later was also called ‘complex political emergencies’ (Duffield, 1994) and ‘situations of chronic political instability’ (Goodhand, 2001) – is not a basic concept to be theorised on or an analytical tool, but simply a convenient heuristic framework to help understand post-Cold War disasters. The most representative scholars of the CE approach are Duffield (1991, 1994), De Waal (1989, 1990, 1997) and Keen (1994, 1998).

14
transformative; once it emerges it transform itself and all around it (Cliffe and Luckham,
2000).
The wide range of research carried out over the last two decades, but particularly during the
1990s, has stimulated other views about the causes of conflict beyond the temporary,
irrational and backward causes that reduced the interest of economists into the causes of war.
Although, within the field of economics, the debate on the causes has since significantly
developed, there are important interlinked issues at stake such as the identification of single-
causes of war (e.g. natural resource scarcity, grievance or greed), the increasingly-accepted
connection between conflict and criminality within aid policies and the emphasis of greed
over grievances as the causes of contemporary civil wars in Africa21.
On a general basis, such debates on the causes, effects and characteristics of conflict have
been dominated by a macro-level perspective. According to some scholars such as Stewart and
FitzGerald (2001) and Justino (2007), there is a need for a micro-level approach, i.e. at the
sub-national, community and household levels. In spite of the usefulness of the macro- and
meso-lenses to distil conflict in terms of its characteristics, causes and costs, they are not able
to capture how conflict affects the community and individual livelihoods. This research is
particularly interested in understanding how conflict-specific characteristics unfold into
household risk management. Micro-level examination of armed conflict has grown
significantly in recent years and evidence is starting to accumulate, for example, on the links
between conflict and poverty22. But it has only been very recently that risk management in
21 Research carried out by the economists at the World Bank led by Paul Collier on the nature of contemporary civil wars in Africa has prompted the need to revisit the fundamental question of whether wars are a simple product of resource scarcity (Homer-Dixon, 1999) or grievancek, i.e. social injustices (Gurr, 1970) and inter-group inequalities (Stewart, 2000). The greed explanation emphasizes the criminal acquisitive desire of individuals and hence the role of lootable rents in producing inter-group rivalry for their control (Collier and Hoeffler, 1998). According to some people, the use of the greed argument as the primary and sometimes only driving force is a contested argument, which is used as an excuse to ignore grievance (Goodhand, 2001) and delegitimate new forms of leadership (Duffield, 2001). 22 For a review of the state of the art of the linkages between conflict and poverty see Goodhand (2001), Luckham et al. (2001), and Justino (2006). Regarding the micro-analysis of conflict, see recent research programmes at MICROCON (www.microconflcit.eu) and Households-in-Conflict Network (HiCN) (www.hicn.org) for a description of the issues under study. While the former adopts a multi-disciplinary perspective, the latter brings together mostly economists interested in the relationship between violent conflict and household’s welfare.

15
the context of armed conflict has started to be addressed23. Although the evidence is starting
to accumulate, it is still scarce and of limited scope as it is mostly approached with the
lenses, theoretical frameworks and tools that have been used to explore risk management in
the context of natural and economic crises.
Indeed, this is the principal motivation of this research. As a consequence of the gap in the
literature on risk management during armed conflicts, the risk behaviour of households
caught up in the conflict is compared with the well-known risk management behaviour of
households during society-wide natural or economic crises. Motivated by the specific
characteristics of the armed conflict and conflict-produced shocks, the research puts forward
the hypothesis that both risk management determinants and household responses to
anticipated and actual losses associated with the risk events and outcomes produced by socio-
political risk events such as wars are not necessarily the same as those produced by natural or
economic society-wide risk events.
This hypothesis is addressed by a discussion on the literature of risk management and armed
conflicts and by an empirical analysis. Concerning the conceptual part, by merging the
literature on risk management in developing countries and the characteristics of armed
conflicts, the investigation firstly discusses the reasons why the standard risk management
framework developed for low-income countries is not suitable to contexts of armed conflict
and secondly analyzes how the specific characteristics of conflicts might unfold into the
analysis of risk management.
Before the empirical analysis is introduced, the overall framework in which the field work
took place is described. The research was conceived as an informal non-collaborative
investigation with the Palestinian Central Bureau of statistics (PCBS) and the United Nations
Food Agriculture Organization (FAO), both of them using the risk management strategies as
predictors of household vulnerability. The idea was to do research as a reflective process led
by individuals working in the same area in order to improve the way we address the subject
of study and also to establish mechanisms linking research with development practice. To do
23 Micro-analysis of househlds responses to conflict-produced shocks have been carried out by Colleta and Cullen (2000), Korf (2004), Verpoorten (2007), Bundervoet (2007), Shemyakina (2006), Deininger (2003), Brück (2004), Deng (2004), UNSCO (2005).

16
this, research was carried out in the oPt for 10 months in the form of intermittent visits
between February 2005 and August 2006. During the first months, over 20 interviews were
carried out with the main stakeholders of Palestinian, Israeli and International organizations
in order to check the relevance of the hypothesis of this research and assess the availability of
secondary data. The following phase of the field work was dedicated, on the one hand, to
building a relationship with the PCBS and FAO through the discussion of collaborative-
research proposals, and on the other hand, to collecting primary data about household
perceptions about conflict-produced shocks and response mechanisms and to obtaining
secondary data on conflict-produced shocks and the Palestinian Expenditure and
Consumption Survey (PECS).
Both primary and secondary data are the bases of a descriptive analysis carried out to
complement the conceptual discussion on risk management of conflict-affected households
and to provide a preliminary illustration of risk management aspects in the oPt. Regarding
the primary data, which was concerned with the way risk management strategies were
addressed in the household surveys and the absence of information on the risk events within
the PECS, approximately 25 interviews were carried out to collect data on household
responses and risk events. As regards the secondary data, while the conflict data set is used to
explore the characteristics of occupation-produced shocks, the merging of the conflict data
with the PECS allows the exploration of the relationship between occupation-produced
shocks and risk management strategies, particularly income smoothing and risk sharing, at
the village level.
It is to be noted that one of the added values of this analysis is the study of the shocks
produced by the Israeli occupation of the Palestinian Territories. Unlike in other conflict
areas, the Israeli-Palestinian conflict is a well-documented reality. Governmental institutions,
Non-governmental Organizations (NGOs) and international organizations continually
monitor its progress, producing a myriad of data. Since the micro-analysis of conflict is

17
highly constrained by the lack of data24, the availability of data about the Israeli-Palestinian
situation offers a great opportunity to understand more about the behaviour of households
in the context of conflict. Furthermore, in line with research conclusions that suggest the
need to give risk a more central place in the current thinking about risk management in the
context of armed conflict, one of the objectives of the research is to make the conflict
operational through the development of a data set which illustrates comprehensively the
conflict-produced shocks.
However, it is important to bear in mind that while the availability of data allows the micro-
analysis of conflict, data is a necessary but not a sufficient condition to integrate the risk
events (i.e. the causes) into the analysis of risk management. For example, in the oPt, despite
the availability of conflict data and the proven causality between the Israeli policy of closure
and the construction of the Wall and the reduction in Palestinian welfare during the period
2000-200425, closure and the Wall have been omitted in the analyses of risk management26.
This absence of the causes has allowed the portrayal of risk events as exogenous and the
understanding of the Palestinians’ inability to manage risk as an economic failure. According
to the CE, bringing in the causes helps to unravel the political dimensions of armed conflict,
and hence the proposition that risk event outcomes may result from the conscious exertion
of power in the pursuit of gain and advantage. However, this type of approach clashes with
the humanitarian perspective, which defines, irrespective of the risk events illustrating the
politics of the conflict, abstract groups of vulnerable people in order to facilitate external
support and the targeting of scarce resources (Duffield, 1994). At a macro-level and related to
the absence of the causes is the observed disconnection in the oPt between the diplomatic
policies of international action, foreign aid policies and programmes and the facts on the
24 Justino (2007) argues that one of the main obstacles in understanding the micro-dimension of conflict is the absence of adequate data sets, which results from the lead taken by state-focussed security studies and also the ethnical and security difficulties and challenges which are associated with researching in areas of conflict. Besides, studies that tackle the micro-level face methodological challenges such as the selection effects, the fact that conflict events tend to be highly clustered geographically, small samples, lack of direct insight into the subjects of interest, poor proxies as well as the difficulties in linking the objects of surveys with contextual information. 25 World Bank (2001, 2003a, 2003b, 2004a, 2004b), UNSCO (2005), OCHA (2005a, 2005b), OCHA and UNRWA (2004, 2005). 26 The reasons explaining this are varied; they can be related to the geopolitical interests of international aid organisations and countries (Le Billon, 2000; Duffield, 2001); the differences between the principles and objectives of humanitarian aid and development aid (Shafer, 2002; Goodhand, 2001); as well as due to a lack of analysis of the impact of aid on the dynamics of conflict.

18
ground (Keating et al., 2005). One of the dimensions of this disconnection is the donors’
lack of recognition of the process of territorial fragmentation as a result of the Israeli policy
of closure, expansion of the settlement structures and the Wall. By ignoring the root causes,
the aid programmes and policies implicitly assume that the risk events cannot be influenced
and mask the collapse of livelihoods by defining the vulnerability as a purely an economic
failure. This locks the Palestinians into a vicious circle of economic subsistence and ex-post
coping, which enables people to stand still by preventing them moving ahead.
This situation in the oPt has stimulated this dissertation, which aims to analyse the risk
management of conflict-affected households by placing the conflict-produced shocks at the
centre of the analysis. By exploring the hypothesis that risk management in contexts of
armed conflict is not necessarily the same as that observed in natural and economic crises,
the research goes on to suggest issues for the adaptation of the risk management framework
developed for contexts of low-income countries to contexts of armed conflicts.
The thesis is divided into four main chapters. After this general introduction, Chapter 1
introduces the Palestinian-Israeli conflict and particularly the specific questions of the
conflict which are analysed in this research, which relate to the Israeli occupation of the
Palestinian Territories. The chapter concentrates on the period 2000-2004 and details the
instruments of occupation – use of violence, land annexation and movement restrictions –
and their impact on Palestinian welfare. Chapter 2 has the overall aims of discussing the
reasons why standard risk management theory is not suitable in the context of armed
conflict and of identifying key aspects for the analysis of conflict-affected household risk
management. Thus, firstly, the chapter reviews the theory of risk management and presents
the literature of conflict, particularly its causes, its effects and the characteristics of political
crisis and conflict-produced shocks. Secondly, it analyzes how the recent literature on risk
management during armed conflict approaches the subject, particularly the analysis of the
risk events, the household responses and the risk-related determinants of risk management.
Chapter 3 describes the methods of research. As regards Chapter 4, the first parts of the
chapter are dedicated to introducing PECS, describing the West Bank population in 2004
from a socio-economic perspective and explaining the construction of the conflict data set
and the selection of variables to represent the occupation-produced shocks during the period
2000-2004. The second part of the chapter presents the results related to the conflict-

19
produced shocks and their relationship with risk management strategies. Regarding the
former, their characteristics are illustrated by analysing them across time and space, their
interactions as well as by household perceptions of the risk events. As for the risk
management strategies, part of the chapter analyses how the strategies have been studied
within the framework of the household surveys in the oPt and compares them with the
households own perception about risk management strategies. The last part of the chapter
describes, at the village level, the relationship between the conflict-produced shocks and the
risk management strategies across different groups of the West Bank population. Finally, the
Conclusion summarises the main findings of this research and their implications on policy-
making.

20
CHAPTER 1
THE ISRAELI OCCUPATION OF THE PALESTINIAN TERRITORIES
This research is set in the West Bank during the period 2000-2004, the years immediately
following the onset of the Al-Aqsa Intifada in September 2000, the largest sustained
Palestinian uprising against the Israeli occupation. Rather than exploring the Israeli-
Palestinian conflict during these years, this investigation focuses on one of the major
dimensions of the conflict: the Israeli occupation of the Palestinian Territories. Given the
different realities of the three territories comprising the oPt – the Gaza Strip, the West Bank
and Jerusalem – this research focuses solely on the situation in the West Bank.
Before the Israeli occupation is explained, particularly its instruments and impact on the
Palestinian welfare during 2000-2004, the chapter starts with a brief description of the
different dimensions of the Israeli-Palestinian conflict.
1.1 The Dimensions of the Conflict
As argued by many authors, the Israeli-Palestinian conflict poses four main questions27 - the
refugee issue, the situation of the Palestinians of Israel, the status of the city of Jerusalem and
the Israeli occupation of the Palestinian Territories since 1967. The interrelationships
between these issues must be addressed for an adequate understanding of the conflict as well
as for the design of an effective solution28.
The Right of Return
The wars of 1948 and 1967 as well as the subsequent Israeli occupation of the Palestinian
territories created the Palestinian refugee problem (Mardam-Bey and Sanbar 2004). The war
of 1948 was triggered by United Nations (UN) General Assembly Resolution 181 of 29
27 For example see Al Haq (2005), Pappe (1997), Escudero (2006), Álvarez-Ossorio (1999) and Said (1994). 28 See Appendix 1 for a historical overview of the conflict.

21
November 1947, which led to the Partition Plan and the allocation of 56% of historic
Palestine to the Jewish state. However, the war resulted in the creation of the state of Israel
over the limits established by the Partition Plan (extending to 78% of the country) and the
uprooting of approximately 800,000 Palestinians from their homelands. While the great
majority of those fled to neighbouring countries and elsewhere, some 32,000 became refugees
internally displaced within the armistice lines. Until this day, and despite the research carried
out by Israeli ‘revisionists’ or ‘new’ historians of the 1948 War (e.g. Pappe, 2007), which
present the Palestinian’s expulsion as a deliberate Israeli goal, Israel’s official position rejects
any responsibility. In December 1949, the UN recognised the plight of the refugees and
established with Resolution 302-IV the UN Relief and Works Agency for Palestinian Refugees
in the Near East (UNRWA). In the course of the 1967 War, the remaining parts of Arab
Palestine, along with the Golan Heights in Syria and Egypt’s Sinai Peninsula, came under
Israeli occupation and another 300,000 Palestinian were displaced from the West Bank and
the Gaza Strip, including around 175,000 UNRWA-registered refugees, who were forced to
flee for a second time (PASSIA, 2004).
Since then, Israeli occupation policies have followed a systematic pattern of land
expropriation and other measures resulting in thousands of Palestinians having to abandon
their homeland (Roy, 2007). Thus, besides the refugees and internally-displaced persons of
the 1947-1949 and 1967 Wars, there is the group of expired-permit holders or ‘latecomers’,
who are residents of the oPt who overstayed their permits while abroad and were denied re-
entry. Today the number of refugees including their descendants has risen to 5.5 million,
constituting two-thirds of the Palestinian population (PASSIA, 2004). UN resolution
194/1948 pays explicit attention to this issue and states the Palestinians right of return as
well as compensation for those that decide not to come back.
The Palestinians of Israel
The Palestinians that stayed within the limits of the 1948-created state of Israel are called
‘Palestinians of Israel’, ‘Israeli Arabs’ and ‘1948 Palestinians’. While they amounted to
150,000 in 1948, today there are approximately 1,000,000 and constitute around 17% of the
22
total population of Israel29. They live predominantly in villages, towns and mixed Arab-
Jewish cities in the Galilee region in the north, the Triangle area in central Israel, the Naqab
(Negev) desert in the south and in the cities of Haifa, Jaffa, Acre and Nazareth. They belong
to three religious communities: Muslim (81%), Christian (10%) and Druze (9%). Under
international agreements to which Israel is a signatory, they constitute an indigenous,
national, ethnic, linguistic, and religious minority.
They hold Israeli citizenship and therefore, theoretically, they should be treated as equal to
Israeli Jews. Whether they actually are in practice is debatable. Israel's Palestinian Arab
citizens can be viewed as being largely cut off from the geographical, cultural, economic and
political mainstream. They enjoy political rights unknown to many in the region but
nonetheless are subject to various forms of what has often been termed as discrimination,
some direct and official, other forms less so. Bishara (2001) identified two distinct types of
discrimination; the first concerns the denial of their identity and the contradictions that
exist between the state and the Palestinian identity and memory, while the second concerns
disparities in the allocation of state budgets. These affect the three most fundamental assets
of a democratic society: resources, rights and representation. Some of the more grievous cases
involve the predominantly Bedouin population of the so-called unrecognised villages. These
are villages – some established before 1948 and some after – that exist in Israel’s midst but
are unrecognised. When the state drafts development plans, it simply ignores these villages.
When planning new roads, for example, or the extension of services like water and electricity,
no effort is made to connect these villages to the expanding infrastructure (International
Crisis Group, 2004). Although Israel does not state that its budget for a certain year will
discriminate against Arabs, in practice, there are the so-called ‘priority areas’ and it could be
argued that the Arab regions are the state’s least priority. Other types of informal
discrimination towards Palestinians of Israel can be seen in public administration and
government corporations. Although the Israeli establishment does not adopt laws that
specifically prohibit Arabs from assuming certain jobs on the basis of their identity, in
practice they have never appointed an Arab to those jobs (Margalioth, 2004). However, since
the late 1970s, Arabs have been allowed to establish political parties (Bishara, 2001).
29 The data sources for the information about the Palestinian of Israel are the Palestinian-Israeli Alternative Information Centre (AIC) and Adalah, the Legal Center for Arab Minority Rights in Israel.

23
The problem of Israel’s Arab minority integration is not easily resolved because it goes to the
heart of Israel's self-definition as both a Jewish and a democratic state. Mutual perceptions
are characterised at best by indifference, at worst by total misunderstanding, mistrust and
hostility (Rouhana and Ghanem, 2004). Many Jewish Israelis question the willingness of their
Arab fellow citizens to come to terms with the existence of the state. The Palestinians of
Israel are often perceived as a security threat and a political/demographic time bomb. With
allegations of cooperation between them and the Palestinian militant organisations since the
Intifada, such perceptions have further solidified. Conversely, Israel's Palestinian citizens
perceive a state that for the most part is unwilling either to respect their individual rights or
to recognise their collective identity and which seeks instead to limit their political weight
and demographic presence. Increased tolerance within Israeli politics for extremist rhetoric,
combined with what could be interpreted as hostile legislation and participation in the
government of parties openly advocating the transfer of Arab citizens beyond Israel's borders
has further heightened tensions.
The Status of the City of Jerusalem
Jerusalem is one of the most extreme points of friction between Israelis and Palestinians,
underlining the need for a just and lasting settlement to the chronic conflict. Despite the fact
that the United Nations Partition Plan within the UN General Assembly Resolution 181 on
the future government of Palestine considers the statute of Jerusalem as ‘corpus separatum
under international mandate and administered by the UN’, in 1967 the east part of the city
was occupied by the Israeli army and in 1989 the Israeli parliament (the Knesset) approved
the Basic Law, which declares the city the capital of the state of Israel. UN resolution 35/169
considers the proclamation of the above-mentioned declaration as a violation of
international law. During the first-round of Camp David, both the Israeli Government and
the Palestinian Authority contemplated for the first time a shared system of control of the
city and possibly a common sovereignty. Both parties agreed to leave the city open, without
physical dismemberment and accessible to both Palestinians and Israelis (Tamari, 2003).
However, since the annexation of East Jerusalem, the Israeli government has actively pursued
policies resulting in the city maintaining a Jewish majority by reducing the Palestinian
population and character of the city (Chesin et al., 1999; Hadi, 2007). Since the natural

24
growth of the Palestinian population is higher than that of the Israeli population, the Israeli
government has taken special measures in order to maintain the ratio of Jerusalem’s citizens
at 72% Jewish and 28% Palestinian, the quantitative relationship that existed between the
communities after the annexation of 1967 (Guediri and Dallasheh, 2004). It has been argued
that the measures used to increase the Jewish population and decrease the number of
Palestinians living in the city violates international law and Palestinian rights. These
measures consist of revoking residency rights and social benefits, restricting building rights,
expropriating land and neglecting infrastructure in Palestinian neighbourhoods, despite the
fact that Palestinians pay the same taxes as their Jewish neighbours (Tamari, 2003). These
measures fit a more general framework. Over the past thirty-seven years, an inter-ministerial
committee for Jerusalem, which includes the Jerusalem municipality, the Ministry of Interior,
the Ministry of Construction and Housing and the Ministry of Police, has coordinated the
‘Israelization’ of ‘united Jerusalem’ through the implementation of five policies: restrictions
of residency rights, ethnic and political city planning, colonization, discrimination and
apartheid, as well as isolation from the rest of the West Bank (Guediri and Dallasheh, 2004).
1.2 The Israeli Occupation of the Palestinian Territories
The last component of the Israeli-Palestinian conflict is the Israeli occupation of the
Palestinian Territories, which started in 1967 during the ‘Six Day’ war. In spite of UN
resolution 242/1967, which asked for the withdrawal of the Israeli military forces from the
occupied territories and the ending of all the features of belligerent occupation, the
occupation has been consolidated and even expanded during the next forty years. This being
the focus of this investigation, the following sections aim to illustrate general characteristics
of the occupation as well as its instruments and impact during the period 2000-2004.
As Article 42 of the Hague Regulations stipulates, a ‘territory is considered occupied when it
is actually placed under the authority of the hostile army’, and that the occupation extends
‘to the territory when such authority has been established and can be exercised’30.
30 Regulations Annexed to the Fourth Hague Convention Respecting the Laws and Customs of War on Land of 1907 (Hague Regulations).

25
Furthermore, the Tribunal of the Nuremberg trial in the Hostage Case31 detailed that a
territory is occupied even when the occupying forces had partially evacuated certain parts of
the territory or lost control over the population, as long as it could at any point in time re-
assume physical control of that territory. This puts forward the notion that the definition of
a legal regime of occupation is not whether the occupying power exercises effective control
over the territory, but whether it has the ability to do so at any point in time.
Sara Roy, among others, has gone beyond the legal definition of occupation and she
describes it as ‘the dispossession and domination of one people by another. It is about the
destruction of their property and the destruction of their soul. Occupation aims, at its core,
to deny Palestinians their humanity by denying them the right to determine their existence,
to live normal lives in their own homes. Occupation is humiliation. It is despair and
desperation’ (Roy, 2007: 22).
One way to illustrate this ‘domination’, as it is termed by Roy, is by the system of control
which Israel has set out since the beginning of the occupation of the West Bank and the
Gaza Strip in 1967. To meet this end, its military authorities had by 2004 issued over 2500
military orders altering pre-existing laws regulating all aspects of the daily life in the oPt (Al
Haq, 2005). Passed by the Area Commander of the Israeli military forces, who assumed all
legislative, executive and judicial powers, they effectively extended military jurisdiction over
the oPt, and continued to apply this following the signing of the Oslo Interim Agreements.
The net effect has been the consolidation of Israeli juridical control over the oPt by creating
two systems of legal bodies - one applying to Israeli Jews, and the other to native Palestinians
- with a gradual transformation of zoning laws, regional planning and the transfer of land
acquisition to the benefit of the former national group, and to the detriment of the latter
(Heiberg and Øvensen, 1997).
The consolidation of Israel juridical control over the oPt during the period 1967-1988 has
been summarized by Raja Shehadeh in his book Occupier’s Law (1989). Four legislative stages
are outlined. In the first stage (1967-1971) the military government established its control
over transactions of immovable property, the use of water and other natural resources, the
power to expropriate land, the authority to operate banks and over the regulation of 31 The Hostage Case is the name given to the case number 7 of the Nuremberg Proceedings on May 10, 1947.

26
municipal and village councils. In this period also the system of control over the movement
of individuals was established (identity cards, travel permits, driving licenses and licenses for
professional practices). The following years from 1971-1979 were primarily aimed at the
transfer of Arab lands to the control of Jewish settlement councils. This involved amending
Jordanian land laws to facilitate zoning ‘public’ lands to the benefit of Israeli bodies and for
acquisition of local land by ‘foreign’ companies. The third phase (1979-1981) involved the
transfer of authority and power from the Israeli Military Government to the newly
established Israeli Civil Administration, and the extension of Israeli law to apply to Jewish
settlers so that they would not be subject to the jurisdiction of the West Bank and Gaza
courts. The last phase highlighted by Shehadeh (1988) is the decade of the 1980s, which
marked the consolidation of Israeli control over expropriated land, which in 1991
constituted more than 60% of the total area of the oPt. Besides, in this period military orders
were issued to regulate fiscal policy governing the oPt, particularly those pertaining to the
collection of taxes and revenues, and of the flow of funds to the territories.
The decade of the 1990s was greatly shaped by the end of the first Intifada and the Oslo
peace process. The Oslo Accords provided a framework for transferring powers and
responsibilities to the Palestinian National Authority (PNA) and for Israel redeployment
from the Gaza Strip and the West Bank. As it is shown in the following map, by virtue of
this agreement, the PNA assumed the powers and responsabilities for internal security and
public order, and the administration of the specific civil spheres in approximately 17% of
the oPt, otherwise knows as Area A. The PNA established central political institutions and
was empowered to provide socio-economic services as well as a security infrastructure. Area B,
containing 24% of the territory, is under Palestinian civil control and Israeli security control
and comprises the majority of the Palestinian rural communities. Finally Area C – around
60% of West Bank – is under full Israel control, except over Palestinian civilians32.
32 Declaration of Principles on Interim Self-Government Arrangements, September 13, 1993; Interim Agreement on the West Bank and the Gaza Strip 24-28 September, 1995

27
Map 1: Oslo peace process geographical demarcation of the oPt

28
This geographical demarcation shown in Map 1 was an interim agreement intended to lead
to a final settlement. However, as no final settlement has yet been agreed, this interim
situation has remained geographical. Thus, since the Oslo Accords, little Palestinian
development has been allowed in Area C. Building permits, for example, are rarely given by
the Israeli authorities and buildings constructed without a permit are frequently destroyed
(United Nations Office for the Coordination of the Humanitarian Affairs (OCHA), 2008).
Palestinian residential areas already have a population density double than that of Israeli
settlements33. Overcrowding is particularly severe in the West Bank’s 19 refugee camps. Much
of the agricultural and grazing land of many Palestinian rural communities lies in Area C.
So too do the remaining large reserves of land for future Palestinian development. The
expansion and development of Israeli settlements, as will be shown in following maps, has
occurred mostly in Area C (OCHA, 2008).
At the end of the ‘interim period’ in 1999, the map of the oPt, as is shown in Map 1,
illustrates the oPt as a sum of non-contiguous Palestinian areas surrounded by a contiguous
area under Israel Authority (areas C), which reached 60% of the total oPt. Furthermore, the
fact that Israel retained control over foreign relations, external security, security for Israelis
(including settlers in the oPt), and territorial jurisdiction over military installations, Israeli
settlements and East Jerusalem enabled Israel to remain an occupant, regardless of whether or
not it has transferred specific parts of the territory to Palestinian self-rule. Throughout the
Oslo Accords, it can be viewed that Israel sought to benefit from all the privileges of an
occupying power under international law without the duties and responsibilities that this
entails towards the oPt or its civilian population34 (Al Haq, 2005). Meanwhile, Palestinians
continued to have every aspect of their daily lives controlled by Israel, which sealed off cities,
arrested Palestinians, and kept, by jurisdictional control of key resources such as land, water,
labour and capital.
33 According to OCHA data, the population density in Israeli settlements is 2.4 persons per dunum. The population density in Palestinian built-up areas is 4.6 person per dunum (1 dunum = 0.01 hectare). 34 Israel’s obligations as the occupying power in the oPt are set out in the Hague Regulations and in the Fourth Geneva Convention Concerning the Protection of Civilian Persons in Time of War (Fourth Geneva Convention, 1949).

29
By the year 2000, after seven years of the Oslo process and more than five years after the
establishment of the Palestinian Authority, per capita income levels in the oPt were estimated
to be about 10% below their pre-Oslo level (Erickson, 2001). Despite considerable external
assistance - valued at approximately $ 3 billion between 1994 and the third quarter of 2000
(Le More, 2008) - living standards were lower than before the process began. Aggravating the
political situation were Israeli policies of land and water confiscation, settlement expansion,
movement restrictions, and numerous violations of important elements of signed agreements
with the Palestinian Authority. Thus, while Israeli forces redeployed outside the Palestinian
populated areas by virtue of the agreements, this was neither a withdrawal, nor did it result
in the relinquishment of Israeli control over the oPt. During the ‘interim period’ that
followed the signature of the Accords, Israel did not withdraw and continued the
expropriation of land and construction of settlements; this was a key factor in the
breakdown of the Oslo process.
According to many authors35, the Olso peace process was neither an instrument of
decolonization nor a mechanism to apply international legitimacy to the Israeli-Palestinian
conflict, but rather a framework that changes the basis of Israeli control over the occupied
territories in order to perpetuate it. The Oslo process, rather than encouraging the
establishment of a balance of interests, accentuated a skewed balance of power that created a
dysfunctional environment for negotiations. As Al-Haq noted, ‘instead of changing the pre-
existing power relations between Israel and the Palestinians, it maintained the status quo and
failed to abolish the power dynamics between occupiers and occupied’ (Al Haq, 2005: 33).
The next sections of the chapter are dedicated to illustrate the instruments of control and its
impact on the Palestinian welfare during 2000-2004.
1.2.1 The Israeli Occupation during 2000-2004
In September 2000, clashes exploded at Al-Aqsa Mosque in occupied East Jerusalem between
Israeli forces and Palestinian worshippers angered by the visit made by the then opposition
leader Ariel Sharon and Israeli forces to the Al-Sharif compound. This event proves to be the
35 Assessments about the Oslo Peace process and its consequences can be found in Keating et al. (2005), Álvarez-Ossorio (1999, 2003), Said (1996, 2001), Roy (2001b, 2001b, 2007), Rabbani (2001) and Pacheco (2001).

30
opening sequence in the largest sustained Palestinian uprising against Israeli Occupation.
This crisis, far from representing a break with the recent past, is a logical and inevitable
extension of it. The Al-Aqsa Intifada did not emerge in a vacuum but emanated from a
context of dispossession that characterized the entire Oslo peace process and its impact on
Palestinians; nowhere is this more visible that in the weakening of the Palestinian economy
and the resulting impoverishment of the Palestinian people.
The period of the current Intifada could be characterized by numerous and inter-related
aspects that have contributed particularly to the deterioration of Palestinian life. However,
illustrating this is a difficult challenge. On the one hand, although the essence and goals of
the occupation do not change much, the set of instruments and rules that shape it vary
significantly across time, mostly depending on the relationships between the two concerned
parties. On the other hand, there is a lack of transparency in the legal framework of the
Israeli occupation instruments. There is little official documentation explaining the rules and
regulations and where they do exist, they appear to be not binding and do not oblige any
person in charge to enforce them as required by regulations. Thus, since a detailed
examination of the range of policies - expropriation, dispossession, integration,
externalization, and deinstitutionalization (Roy, 2007) – which characterized the Israeli
occupation of the oPt is out of the scope of this research, we will describe those instruments
that became particularly relevant for the period 2000-2004. According to various sources,
these are the use of violence, land annexation and movement restrictions36
Use of Violence
Since the outbreak of the Al-Aqsa Intifada, the actions of the IDF in the oPt have often been
characterised by unnecessary or disproportionate use of force against Palestinians. This
manifests itself in the daily lives of Palestinian through specific operations such as arrest
raids, assassinations or incursions. During the period 2000-2004 the violence reached its peak
in 2002. At the beginning in late 2001, Israel imposed widespread sieges on Palestinian
population centers resulting in virtual ‘town arrest’ for most people in the West Bank.
During the spring and summer of 2002, Israeli Forces reoccupied the main cities, towns and
some villages in the West Bank and imposed twenty-four hour curfews on their populations. 36 WFP (2004a), Al Haq (2005), PCBS (2005b), OCHA (2003a).

31
During the period 2000-2004, the villages of the West Bank underwent an average of 1142
hours under curfew37. In spite of curfew being one of the most sweeping and extreme
restrictions of movement, as it imprisons entire communities within the confines of their
homes, it serves many purposes related to the use of violence. It is mostly used to restore
calm and order, to prevent disturbances during house demolitions and to facilitate search
and arrest campaigns, etc.
Force is employed in the repression of public demonstrations, in non-threatening situations
and at checkpoints. It is often used indiscriminately; killing civilians, medical personnel and
children, and damaging medical vehicles and essential infrastructure38. As the Journal of
Palestinian Studies (JPS) has noted in tracking the Al-Aqsa Intifada since the outbreak of
violence on 28 September 2000, figures for casualties and other losses often vary widely from
source to source and sometimes from report to report issued by a single organization39. These
discrepancies have been illustrated by Esposito (2005), who examined a wide range of sources
such as several reputable human rights organizations, the IDF, the PNA and the UN. The
following is an extract of the table compiled by Esposito.
Table 1.1: Losses in the four-year anniversary (2000-2004) of the Al-Aqsa intifada B’Tselem
(Israeli Information Centre for
Human Rights)
Al-Haq (Palestinian
NGO for human rights)
Palestinian Health
Development Information
Project
IDF PNA
Palestinian Red
Crescent Society (PRCS)
UN
Palestinians Killed 2,859 3,044 3,334 3,590 3,437 Assassinated 123 385 238 290 Denied medical treatment
40 41
Injured 27,600 53,000 42,345 27,770 33,770Permanently disabled
2,500
In detention 7,366 8,000 8,000
37 Curfew data has been obtained from UNRWA and OCHA data bases. 38 Such use of force by the Israeli military in the oPt is governed by the complementary legal frameworks of international and human rights law. However, while the application of these two areas of law to the oPt has been established beyond dispute (Al Haq, 2005), their dual applicability and inevitable conflict may at first glance appear to present alternative legal standards for regulating the use of such force. Meron, summarising the difference between these two areas of law, notes: ‘unlike human rights law, the law of war (international humanitarian law) allows, or at least tolerates, the killing and wounding of innocent human beings not directly participating in an armed conflict, such as civilian victims of lawful collateral damage’ (Meron 2000: 240). The purpose of international humanitarian law is to reduce to a strict minimum the human suffering caused by war and military actions, while recognising the context and reality in which this suffering occurs. It is this ability to contend with military realities while protecting to the utmost the human person that sets international and humanitarian law apart from human rights (Al Haq, 2005). 39 See the Journal of Palestinian Studies Peace Monitors no. 118-133.

32
Israelis Killed 919 1,008 942 Injured 1,008 989 6,008 5,961 Physical Damage Houses destroyed 3,700 542 720 Houses and public Buildings damaged
11,553 7,633 2,751
Trees uprooted 1,252,537 Source: Esposito (2005)

33
Annexation of Land
The destruction of property, the construction of the settlements and the Wall are part of the
policy of occupation, aiming to clear land for continued expansion into the land recognised
under international law as territory on which the Palestinian people are entitled to exercise
their rights to self-determination (OCHA, 2007). In order to confiscate land, Israel used a
variety of approaches such as encouraging the private purchase of land; using the principle
of ‘abandoned property’, under which an Israeli body is empowered to take possession and
regulate the use of unoccupied land; and temporarily seizing the land for unspecified
‘military needs’, ‘public purposes’ or because it is ‘state land’40. In the majority of cases
seizure orders can be extended indefinitely, often resulting thereby in land that has
‘temporarily’ been seized by the Israeli army but never being returned to its owners (Al Haq,
2005).
Property Destruction
Israel’s policy of property destruction is as old as the military occupation of the West Bank
and Gaza Strip itself (Halper and Younan, 2005). Since 1967, thousands of homes, vast areas
of agricultural land and hundreds of other properties have been destroyed by the IDF. The
table above reports the physical damages in terms of houses destroyed and public buildings
damaged as well as trees uprooted. The destruction of property besides being a punishment
measure also serves to clear the land for the continued expansion of the Israeli settlements
and the construction of the Wall (OCHA, 2008; Lein, 2002). Thus, for example, the
demolition of private houses or the uprooting of trees affects Palestinians or their relatives
who have carried out attacks against Israeli targets (or are suspected of having done so);
whose properties are proximate to Israeli settlements and bypass roads; homes that have been
destroyed in the course of military operations to meet Israeli strategic and military objectives;
or because they lack construction permits (Margarlit, 2007). In addition to the destruction
of physical structures, there has been an increase in the number of fruit and olives trees
uprooted and/or razing land belonging to the Palestinians. The destruction of the olive trees
has been especially devastating, targeting not only a major sector of the Palestinian economy,
but also a large part of traditional Palestinian culture and life. 40 See Appendix 2 for a visual approximation of the progressive trend on annexation of land since 1948.

34
Settlements and other Structures
Settlements are organized communities of Israeli civilians established in the oPt, with the
approval and direct or indirect support of the Israeli Government. Apart from a few
exceptions in East Jerusalem, residence in these communities is only open to Israeli citizens
and to persons of Jewish descent entitled to Israeli citizenship or residence under the Law of
Return (OCHA, 2007).
The history of the settlements in the oPt started in 1967 and although it firstly aimed to
redraw the borders of Israel in order to make them easier to defend, in 1977 the emphasis
shifted to take over of the land. They also serve to control natural resources, notably land
and water; encourage Palestinians to depart from the land by making their lives there
difficult, and prevent the emergence of a viable Palestinian state by fractioning the territorial
contiguity of the oPt41.
OCHA (2007) analysis based on extensive fieldwork combined with spatial analysis derived
from satellite imagery on the settlements and other structures shows that almost 40% of the
West Bank is now taken up by Israeli infrastructure. Despite the transfer of Israeli civilians
into oPt being illegal under international law42, the Israeli settler population in the West
Bank settlements has continued to grow steadily by around 5.5 % each year. In 2005, after
the Disengagement Plan and the withdrawal of all settlers living in the Gaza Strip,
approximately 450,000 settlers live in 144 settlements in the West Bank (including in East
Jerusalem) covering 16,375 hectares of land. The settlements consist of urban areas
(residential areas, shopping centres and schools) and areas served by roads and industry
infrastructure (outer limits). Parallel to the settlements, there are outposts (illegal settlements),
41 For a comprehensive historical, legal and bureaucratic account of the expansion of Israeli settlements in the oPt see Legrain (1996). Recent accounts of the evolution of the settlements can be found in Etkes and Ofran (2005), Lein (2002) and OCHA (2007). 42 The illegal status of Israeli settlements has been recognised by the international community. There have been resolutions of the United Nations Security Council and General Assembly, the High Contracting Parties of the Fourth Geneva Convention and the International Court of Justice. The following are examples of UN resolutions, statements and reports on Israeli settlements. The UN Security Council adopted the Resolutions 904 (1994), 465 (1980), 452 (1979), 446 (1979). UN General Assembly adopted the Resolutions ES-10/06 (1999), ES-10/14 (2003), 61/118 (2007). The freezing or dismantling of Israeli settlements has been a cornerstone of major peace initiatives including the 2004 Quartet’s Road Map: ‘A performance-Based Roadmap to a Permanent Two-State Solution to the Israeli-Palestinian Conflict’.

35
settler’s agriculture land, military bases and nature reserves which occupy more than 27%
percent of the West Bank (OCHA, 2007). Map 2 show the situation of the Israeli structures
in the West Bank in 2005.
Map 2: The Israeli settlements and other structures in the West Bank 2005

36
Source: OCHA

37
The Wall
In June 2002, the Government of Israel began the construction of the Wall; a complex series
of of ditches, trenches, roads, razor wire, electronic fences and concrete walls within the West
Bank43. The Government of Israel justified the Wall as a direct response to Palestinian
militant actions from across the Green Line, necessary to prevent infiltration by militants
(World Bank, 2003b). However, the Wall has political implications as its construction does
not go along the Green Line but instead it incorporates West Bank areas east of the Green
Line. On 9 July 2004, the International Court of Justice (ICJ) issued an opinion that the
Wall in the West Bank and East Jerusalem, and its associated gate and permit regime,
violated international law44. On 20 July 2004, the majority of UN member states called on
Israel to comply with the ICJ opinion45. However, at the moment of writing this research
Israel has not complied with the ICJ opinion and the Wall construction continues. In
October 2005, the Humanitarian Emergency Group (HEPG) declared that 74% of the length
of the Wall (constructed and projected) is inside the West Bank territory and only 25% is on
the Green Line46 (HEPG, 2005). It further assessed that 10 % of the West Bank land
(including Jerusalem) had been either confiscated for the construction of the Wall or was
trapped between the Wall and the Green Line, the so-called ‘seamed zone’. A number of
Palestinian communities were enclosed in these zones, physically separated by the Wall from
the rest of the West Bank47. The majority of the people affected required specific permits to
continue to reside in their homes on their lands. The Wall isolated the land, water resources
and basic services of a far greater number of Palestinian, who require specific access permits
43 In areas where the Wall has been constructed, military orders are issued creating a new strip averaging 150-200 metres on the West Bank sides of the Wall, where new construction is prohibited (OCHA and UNRWA, 2004). 44 Advisory Opinion of the International Court of Justice (ICJ) on the Legal Consequences of the Construction of the Wall in the Occupied Palestinian Territories, 9 July 2004. For a legal analysis of the Wall see Escudero (2006). 45 The UN General Assembly in resolution ES-10/15 demanded that Israel comply with its legal obligations outlined in the Advisory Opinion, 2 August 2004. 46 Humanitarian Impact of Barrier Updates have been carried out by OCHA and UNRWA since 2003 following a request of the Humanitarian Emergency Policy Group (HEPG) comprising the European Commission. the European Union (EU) President, the World Bank, United States Agency for International Development (USAID), Norway and United Nations Special Coordinator Office for the Middle East (UNSCO). 47 15 communities were located in the seamed zone in 2005. Upon completion of the Wall, 60,000 West Bank Palestinians in 42 villages are expected to be living within the seamed zone (OCHA and UNRWA, 2005).

38
and are subject to the opening hours of the wall gates48. The following map illustrates the
route of the Wall according to the status of the construction in 2003.
Map 3: Status of the Wall construction, December 2003
48 Out of the 63 gates in September 2004, 23 are open for Palestinian use. The crossing of these gates is subject to holding the required permit and opening hours. Although their varying restrictions depend on the type of gate (agricultural, road, school, seasonal, settlements or checkpoint), generally opening hours are limited and erratic as well as the permits being short-term, difficult to get and their allocation is not comprehensive (OCHA and UNRWA, 2004).

39
Source: Palestinian Negotiations Affaire Department (NAD) and Negotiations Support Unit (NSU)

40
Restrictions of Movement
Restrictions on freedom of movement are one of the most pervasive and destructive features
of the Israeli occupation of the West Bank and Gaza Strip, and has had grave consequences
on the lives of the Palestinians in the oPt49. While the IDF states that the closure regime is
necessary to protect Israeli citizens from Palestinian militant attacks, its measures are also
intimately linked to maintaining settler access and their quality of life (OCHA, 2007). As will
be illustrated in the next graph, the impact of the closure regime on the Palestinian life has
been profound. First, Palestinians are restricted from using roads between their key towns
and communities. Second, the roads have become barriers for Palestinian wishing to cross
them and they have fragmented the territory creating isolated Palestinian enclaves. The policy
and mechanisms by which movement is restricted clearly violate numerous provisions of
international human rights and humanitarian law50.
In its most descriptive and sterile way, closure is a recently-coined term referring to the
policy of physical barriers and permit requirements used to control the movement of
Palestinian goods and persons across borders - between the oPt and third countries and
between the oPt and Israel – and within the West Bank and Gaza Strip. Although Israel has
controlled Palestinian movement since the occupation of the Palestinian Territories started in
1967, it was just in 1991 when a restrictive system of control was introduced and enforced
through personal permits and checkpoints placed along the Green Line. During the 1990s,
the policy of closure was consolidated due to the division of the territory into zones of
Palestinian and Israeli control (Roy, 2001b). Most of its implementation took place in the
course of the second Intifada. Thus, within a period of 20 years the closure policy passed
from a set of entry and exit restrictions into Israel, any other third countries as well as
between the Gaza Strip and the West Bank (external closure) to a sophisticated system of
permits, roads and physical obstacles (internal closure) that limit and control the movement
49 For a review of the impact of closure on Palestinian livelihoods see World Bank (2002, 2003a, 2003b, 2004a, 2004b), UNSCO (2005), OCHA (2005a, 2005b), Al-Haq (2005), Roy (2001a, 2001b), Aranki (2004), Brown (2004), Lein (2001) and Bornstein (2001). 50 The rights violated by movement restrictions are primarily expressed in International Human Rights Law and International Humanitarian Law. Humanitarian and human rights organizations have condemned closure as collective punishment against the Palestinian civilian population, which denying them basic human rights such as freedom of movement and the right to work and have access to health services and education.

41
of goods and people within the West Bank (World Bank, 2002). In order to give account of
this internal closure, the following OCHA map is presented.
Map 4: Closure policy in the West Bank 2004

42
Source: OCHA
The grey roads in Map 4 refer to the 1,661 kilometers of road reserved primarily for Israeli
use that connect the settlements, military areas and other infrastructure in the West Bank
with Israel51. Palestinian access on to this network is restricted by a closure regime consisting
of checkpoints, roadblocks and a permit system for Palestinian vehicles. Although their
number has varied in time and space, at the time of this research (field work in Summer
2006), there were approximately 60 checkpoints and more than 460 physical obstacles such as
roadblocks, road-gates, earth-mounds, roadblocks and trenches52. Since nearly all the physical
obstacles and checkpoints are located along the primary and secondary roads, Palestinians
require a permit or are compelled to use an alternative road network of secondary and more
circuitous roads. During the first four years of the Intifada, the permits to work in Israel and
in the settlements decreased by 59% in the West Bank; in July 2004 just 1% of the West
Bank Palestinians and 7% of the licensed cars hold the ‘Special Movement Permit at Internal
Checkpoints in Judea and Samaria’ (Lein, 2004).
1.2.2 The Impact of the Israeli Occupation on the Palestinians
Sara Roy summarizes the overall impact of the Israeli occupation as a process of ‘de-
development’, which she defines as the following: ‘the deliberate, systematic and progressive
dismembering of an indigenous economy by a dominant one, where economic – and by
extension, societal – potential is not only distorted but denied. De-development therefore
deprives an economy of the mechanisms to pursue rational structural transformation and
prevents the emergence of any self-correcting measures. De-development is shaped and
advanced by a range of policies, which are themselves, a reflection of the ideological
imperatives of the Zionist movement: expropriation and dispossession; integration and
externalization, and deinstitutionalization. These policies have contributed to de-
development by dispossessing Palestinians of critical economic resources or factors of
production needed to create and sustain productive capacity, by creating extreme dependency
51 See Appendix 3 for a map of the road network in the West Bank 52 OCHA Movement and Access Report (OCHA 2003-2004b) and the Weekly Briefing Notes (OCHA, 2003-2004a) monitor on a monthly and weekly basis respectively the movement restrictions in the oPt.

43
on employment in Israel as a source of Gross National Product (GNP) growth, and by
restricting the kind of indigenous institutional development that could lead to structural
reform that is economic, social and political’ (Roy, 2007: 33).
This section illustrates the process of de-development by describing the impact of the Israeli
occupation on the Palestinian economy during the period 2000-2004. To start with we would
like to present Map 5, which illustrates the state of the West Bank in 2004 in terms of the
territorial fragmentation.. The closure policy sustained by the geographical demarcation of
the Oslo interim agreements, the expansion of the settlement structures and the construction
of the Wall have produced a territorial, social-economic and political fragmentation. This
process of ‘bantustanization’, whereby the West Bank, East Jerusalem and Gaza Strip as well
as the West Bank itself as the map shows have become a collection of isolated areas and
enclaves separated from one another stands in sharp contradiction to the sine qua non of
territorial contiguity as the basis for an economically and politically viable state. It is
believed that although the confiscation and destruction of property and agricultural land
together with the high number of fatalities has contributed hugely to the Palestinian crisis,
the fragmentation, notable the Israel’s closure policy has catastrophic socio-economic
consequences, precluding the possibility of meaningful economic development in the period
to 2000 and resulting in a fully-fledged humanitarian crisis after 200253.
53 For a general review of the socio-economic situation in the oPt after the onset of the Al-Aqsa Intifada see the following assessments carried out by international organizations: UNCTAD (2006), FAO (2003, 2007), ILO (2005), UNSCO (2005), Sletten and Pederson (2003), World Bank (2002, 2003a, 2004a, 2004b) and OCHA (2005a),

44
Map 5: The fragmentation of the West Bank
Source: OCHA

45
As a result of the fragmentation the Palestinian economy in the oPt has sustained significant
losses. Before we present the table with various socio-economic indicators it is to be note that
in a context of war there are difficulties when attempting to ascertain what might have
happened had there not been an armed conflict. Many variables which appear to be a direct
product of conflict, such as extreme income inequality, slow economic growth and
agriculture production and little economic development have also been strongly linked to
the actions of the other actors in this dispute (e.g. PNA and the international donor
community) and to on-going political, economic and social processes. The following table
contains some of the output indicators for the period 1999-2004.
Table 1.2: Socio-economic indicators 1999 2000 2001 2002 2003 2004 GDP real per capita change in the oPt (accumulated from 1999)
9.6 -26.5 -37.3 -36.8 -38
Budget deficit (in percentage) 6 8.6 Trade balance (% GDP) -63.6 -55.4 -43.3 -61.1 -53 -64.4 Total PNA trade with Israel/total PNA trade (%) 67.1 71.12 78.6 53.4 75.1 66.8 Population (in millions) 3.08 3.12 3.33 3.45 3.73 3.637
In the West Bank 1.97 2.04 2.12 2.19 2.367 2.33 In the Gaza Strip 1.12 1.16 1.21 1.26 1.37 1.37
Total employment (thousand) 588 597 508 486 591 607 In public sector 103 115 122 125 128 131 In Israel and Settlements 127 110 66 47 53 48
Unemployment rate (% of labour force) 21.7 24.6 36.2 41.2 33.4 32.6 % Households under poverty (2.1$ per person per day) 20 27 37 51 47 48 Sources: PCBS. The Poverty data are World Bank estimations
Since 2000 there has been a strangulation of the Palestinian economy with an overall loss
and declining income. Overall economic growth has been negligible and at points negative.
High population growth rates outpaced real GDP growth, leading to a solid decline in per
capita GDP. Unemployment rates increased steadily, reaching an unprecedented level in
2002. These rates have levelled off, but remain more than double compared to pre-Intifada
levels. Compared to pre-Intifada levels, in 2004 there were 67% less Palestinians working in
Israel or Israeli settlements; the unemployment produced accounted for nearly 40% of the
current unemployment. It is interesting to note how this employment shock was partially
absorbed by the Palestinian domestic economy, which created approximately 30,000 new jobs
(UNCTAD, 2006).

46
Furthermore, the situation since 2000 has aggravated deep-seated structural weaknesses and
vulnerability to external shocks arising from prolonged occupation, as manifested by volatile
economic growth, persistent, high unemployment rates and chronic internal and external
imbalances. As shown, the PNA budget deficit increased from 6% in 1999 to 8.6% in 2004.
During this period, the trade deficit was maintained at around 64% of GDP. As UNCTAD
further noted with depleted production capacity, both the internal and external deficits can
hardly be expected to improve as Palestinians are forced to produce less and rely more on
imports. While the structural weaknesses imposed additional challenges to the private sector54
and shifted the major sources of employment to the agricultural and service sectors
(including PNA institutions), the continuous confiscation of Palestinian lands by Israel and
the restriction of movement undermined the agricultural sector’s absorptive capacity (PCBS,
2004b). Other changes in the nature of employment has been an increase of 63% in the
proportion of part-time jobs in the oPt as well as an increase in family business and self-
employment, mostly in subsistence agriculture and in the trade sector, where incomes are low
and intermittent (World Bank, 2004a). The breakdown of relations with Israel but also
between West Bank districts and between urban and rural communities produced by the
fragmentation of the territory as shown in the previous maps has produced localization of
the economy within the enclosed areas. Localization refers to those activities – production,
trade and services-related - that prior to 2000 did not take place in rural and small-town
communities (UNSCO, 2005).
Against all odds, the Palestinian economy continues to function and defies the devastating
conditions of those four years. Three main factors explain why the economy and society as a
whole was able to withstand such conditions (UNCTAD, 2006; World Bank, 2004b), namely:
i) the reliance and cohesiveness of Palestinian society and the informal safety nets and
innovative responses developed by enterprises; ii) the ability of the Palestinian Authority to
continue functioning and employing at least 30 per cent of those who are currently in work;
iii) the increase in disbursements of donor support for budgetary solvency, relief and
development efforts.
54 By 2004, 16% of pre-2000 services and industrial sector enterprises had permanently closed. In construction and internal trade, this figure was 14% (PCBS, 2004b).

47
However, the price to pay for continuing to defy the Israeli occupation is a profound decline
of living conditions. Household expenditure has decreased dramatically; food consumption
has fallen by around one third since 1999. According to the FAO Food Security Assessment
carried out in 2003, 40% of the oPt Palestinians was food insecure55 and another 30% was
under threat of becoming food insecure. Based on World Bank estimates, poverty more than
doubled, reaching almost 50% of the population. In addition to this, 16% of Palestinians
live on less than 1.6 US$ per person per day.
Decades of restless efforts to improve the educational system had been lost through the
closures and increased mobility restrictions imposed on Palestinian students during the then
current Intifada. There were over one million students and over 44,000 teachers in 2000
schools that were affected by movement restrictions (PCBS, 2005b). The net enrolment in
primary education fell every year since 2000 (OCHA, 2005a). The problems generated by
movement restrictions are experienced more acutely in universities than in primary and
secondary schools as universities draw their students from a wider geographical area within
the oPt. The need for the students to travel further distances to reach their selected
institutions is therefore greater, as is greater the possibility of finding a physical obstacle to
passage.
Movement restrictions have also negatively affected other essential areas such as the provision
of health services. Checkpoints and curfews have lowered health standards by preventing
access to hospitals and clinics, impeding health care programs and leading to untreated
psychological trauma arising from the physical, economic and social consequences of
occupation. The PCBS stated that during the then current Intifada over 50% of Palestinian
households reported difficulties in accessing healthcare due to checkpoints and closures
(PCBS, 2005b). Further, OCHA recorded that during the first nine months of 2004, there
were 461 access incidents where the provision of first aid and/or medical evacuation was
prevented by Israeli authorities (OCHA, 2005a).
Extended exposure to violence and dangerous living conditions has short- and long-term
effects on the physiological well-being of humans, especially on children. The lives, behaviour
55 A family is said to be food insecure ‘if the family does not at all times have physical and nutritious food which meets their dietary needs for an active and healthy life’ (FAO, 2003: 29)

48
and attitudes of Palestinian children had changed dramatically since the onset of the then
current Intifada. Sleep-related problems were the most common form of physiological
distress among children reporting problems (PCBS, 2004c). These include nightmares, bed-
wetting, insomnia, and irregular sleeping patterns. Fear was also common. Children found it
difficult to concentrate. Some were anxious and irritable. Some withdrew from family and
friends, rebelling and becoming aggressive themselves. According to OCHA 48% of
Palestinian children reported personal experience of conflict-related violence or had witnessed
violence affecting a family member. On a general account of the population, reports from
hospitals indicated that there was an increase of admission rates for people with
psychological problems and nervous breakdowns. The number of mental health patients
receiving treatment at community health centres increased by 39% within the period between
2000-2004 (OCHA, 2005a).
In summary, the impact of the Israeli occupation during these years of conflict is
multidimensional and covariate as it affected every single aspect of the individual and
collective livelihood of a wide range of the population. All actions – working in a nearby
town, access to education, marketing farm production, obtaining medical treatment, visiting
relatives, etc. - were subject to heavy bureaucratic procedures, arbitrary application of the
norms, humiliation, degradation, violence and long waiting hours at the checkpoints. The
lack of transparency of the occupation measures produced a sense of arbitrariness and
uncertainty, which permeated the tempo of daily life. At the individual level it creates a sense
of powerlessness; at the family level, it obstructs the ability of households to chart a
purposeful existence for their members; and at the community and national levels, it
prevents systematic planning for the future.

49
CHAPTER 2
RISK MANAGEMENT IN CONFLICT-AFFECTED HOUSEHOLDS
‘Famine here is a special case…We can be starving one day because there is no supply of food, and we can have more food than we even need another day because we can
freely fish and cultivate our lands and go to work…Food security to us is mostly related to the political situation….We are food secure if the Israelis leave us alone and stop trying to make our lives a nightmare. If they do that, then we can be food secure because we can earn a living, cultivate our land, raise our animals, eat fish and import
food as we desire.’
A Palestinian, Ash-Shaate Refugee Camp, the Gaza Strip, 2007
2.1 Introduction
The overall objective of this chapter is to discuss the analysis of household risk management
in the situation of armed conflict. Although the subjects of risk management and armed
conflict have been studied independently, their interactions remain unexplored. On the one
hand, research on risk management in developing countries is mostly drawn from situations
affected by economic-, natural- or health-related risk events. On the other hand, the study of
armed conflict, particularly the issues related to the notions of conflict, participants, and
causes and effects are mostly addressed by a macro-perspective.
As a consequence of this gap in the research, the risk behaviour of households caught up in
the conflict is compared with the well-known risk management behaviour of households
during natural or economic crises, where risk events are considered exogenous and the
vulnerability of households is viewed as an economic failure. Although there are emerging
studies of conflict-affected household risk management, development policies and
programmes are still influenced by the equation of behaviours regardless of the type of crisis.
In the context of armed conflict by assuming risk as exogenous, the development and
humanitarian policies and programmes may have masked the collapse of the livelihood

50
system by presupposing that people cope, and locked people into the vicious circle of
subsistence and coping, which enforces people to stand still and prevents them moving
ahead.
Risk is a central feature and factor of life of all communities and its management has been
one of the most challenging preoccupations of mankind. In development research the study
of risk has gained relevance due to the findings of studies on inter-temporal welfare
dynamics, which show large fluctuations in income over relatively short periods of time,
suggesting substantial short-term movements into and out of poverty56. One of the central
motivating factors in the dynamics of poverty is the risk event, whose characteristics in terms
of spread, predictability, intensity and nature largely contributes to explaining the fact why
most of the poor are ‘not always poor’ but ‘sometimes poor’. Many development
practitioners and researchers have long recognised that individuals, households and
communities face a large number of risks related to natural, economic, health and socio-
political factors. However, in much analysis on development and in the design of anti-
poverty policies, it has largely remained on the periphery; as Dercon (2005b) notes, ‘an add-
on in more general analyses’. This research aims to give risk a more central place in current
thinking about poverty in the context of armed conflict.
Risk is a commonly-used term, applied to nearly every human action, yet it remains poorly
understood and poorly defined because the analysis of risk management hinges crucially on
its definition (Beck, 1998). Risk is fundamentally composed of a cause, about which there
may be some uncertainty, and an effect or impact about which there may also be some
uncertainty. Economists have referred to risk as uncertain events (probability of occurrence)
and outcomes (expected utility) with a known or an unknown probability distribution (Sinha
and Lipton, 1999). Since risk is considered exogenous to the person (Dercon, 2005), the main
ingredients of risk definitions are uncertainty and impact. Regarding the difference between
risk and uncertainty, there is a distinction depending on whether the probability distribution
is known or unknown. Despite this difference, economists studying behaviour with
incomplete knowledge tend to assume a world of risk, rather than a world of uncertainty and
use the term ‘risk and ‘uncertainty’ interchangeably.
56 For a review of economic mobility and poverty dynamics in developing countries see Baulch and Hoddinott (2000).

51
Another related term to the events of risk is that of shock. Shock combines four issues
related to risk: the source, the stress they impose on systems, the resulting strain on persons
and the resulting damage (Payne and Lipton, 1994). Thus shock connotes risk events that are
unexpected and exogenous and are of high magnitude, and produce high damage due to
their concentration on persons of high vulnerability and low resilience. Based on the
characteristics of the risk events produced during armed conflict (see Section 3 of this
chapter for a discussion on this point), this investigation uses both terms, shock and risk
event, interchangeably.
Of the attributes of risk events, this investigation pays particular attention to the common
portrayal of risk as exogenous. The assumption of exogeneity comes from the general
perception that while the risk events are beyond human influence, their effects, i.e. the
outcomes, can be influenced. However, if this proposition may be applied in some contexts
it may not be in others; for example during armed conflicts. The conflict-produced risk are
produced and influenced by human actions, and therefore they need to be portrayed as
endogenous.
As it will be shown in Section 3 of this chapter, one of the inadequacies and limitations of
the different approaches to risk management in explaining the phenomenon of survival
during armed conflict lies in their neglect of the issue of power and their focus on the
victims of famine. Having said this, one could ask why we are using risk management theory
as the reference framework to understand the risk management of conflict-affected
households when there seems to be a gap in the risk management literature on such
households. As is described in Section 4 of this chapter, there have been recent attempts to
identify such households’ risk management determinants and strategies in different conflict
settings. However, its exploration is scarce. In order to contribute to this infant area and
identify the key elements to adapt the risk management framework to contexts of armed
conflict, this research addresses the risk management of conflict-affected households by
merging strands of literature concerning risk management and armed conflict. On the one
hand, there is a wealth of information on how households deal with income fluctuations.
The evidence discussed in Section 2, although mostly drawn from context affected by
covariate economic and natural risk events, it is the reference framework and point of

52
departure of any exploration about household risk management. On the other hand, there
are analytical studies of the causes and effects of armed conflict; particularly relevant have
been the contribution of the political economy of conflict addressed by the complex-
emergency approach. In spite of the lack of micro-analysis that explains how conflict-
produced shocks unfold and are responded to by households, its analysis is key in
unravelling the unique and intrinsic characteristics of political crisis and conflict-produced
shocks.
With the overall aim of understanding the risk management of conflict-affected households,
this chapter discusses the reasons why the standard risk management theory is not suitable in
the context of armed conflict, and identifies key aspects for the analysis of conflict-affected
household risk management. In order to do so, the chapter is structured as follows; Section 2
reviews the theory and evidence of risk management in development countries; Section 3
presents, from an economic perspective, the causes and effects of armed conflicts to bring
forward the unique and intrinsic characterises of political crisis and conflict-produced
shocks. Section 4 illustrates the relevance of previously-presented arguments to the analysis of
risk management during armed conflict by a critical exploration of the scarce micro-analysis
of conflict-affected household risk management, which in turn allows the identification of
the weaknesses and strengths of this emerging debate.
2.2 Risk Management Theory
The objective of this section is to review the theory and empirical evidence of risk
management in developing countries in order to understand how households deal with
anticipated or actual losses associated with uncertain events and outcomes.
Within the debate on risk management, we are interested in both its strategies and
determinants. Household risk management strategies are those actions adopted to reduce,
mitigate or cope with risks (Sinha and Lipton, 1999). The determinants of risk management
are those factors influencing the choice and effectiveness of risk management strategies. Over
the last forty years, researchers have asked whether the ability to manage risk depends on the
maximization of rational behaviour, risk preferences, the existence of both formal and
53
informal insurance and finance markets, the asset base as well as external economic, social
and political conditions.
Discussion on risk management strategies and determinants is important because it
influences people’s vulnerability by determining the extent of the impact shock and the
ability to bounce back. However, the term ‘vulnerability’ has been used with a variety of
related but different meanings57. In most of the writings on poverty and risk management,
vulnerability is often used to refer to exposure to risk events and the household’s capacity to
confront these risk events. In the late eighties, Chambers (1989) defined vulnerability as a
function of exposure to risk (susceptibility), the intensity with which the risk event is
experienced (sensitivity), and the capacity to resist downward movement in well-being as a
result of the occurrence of a risk event (resilience). Eleven years later, in 2000, the World
Bank World Development report dedicated to poverty referred to vulnerability as a function
of risk, risk management strategies and the welfare outcomes which measure the likelihood
that a shock will result in a decline in well-being (World Bank, 2000). Alwang et al. (2001)
present a number of different definitions found among different disciplines such as
economics, medicine, sociology, anthropology and environmental studies. They explain the
differences across the approaches by their focus on the vulnerability components, i.e. risk
events, strategies and outcomes. On the one hand, environmentalists (including those
concerned with disaster management), sociologists and health practitioners focus on the
outcomes, which, depending on the approach, vary for species survival, rather than focus on
income-poverty or anthropometric measures. On the other hand, within the field of
economics it varies depending on the approach. While the asset and food security58
approaches focus mostly on the responses, risk management and poverty dynamics centre on
the outcomes.
Risk management focuses on the outcome components of vulnerability by measuring the
households’ ability to smooth consumption or income. This emphasis on outcomes, leaving
the risk events to a second stage, is one of the constraints identified by this research for its
application to the context of armed conflict. As is discussed in Sections 3 and 4 of this 57 For a comprehensive review of the different approaches to vulnerability see Deng (2004) and Alwang et al. (2001). For a discussion of vulnerability in the context of natural disasters see Perez de Armiño (1997). 58 The food security approach is understood as an application of consumption theory to the context of famine and is narrowed down to food consumption.

54
chapter, the characteristics of the risk events produced by political or social events such as
armed conflicts are endogenous and are therefore key in the understanding of conflict-
affected household risk management. But before discussing the specificities of such risk
events, it is necessary to review in detail how risk management theory and evidence explain
the process of risk management. In order to do so, this discussion has been structured in
two parts. Section 1 gives an account of the different mechanisms households use to deal
with fluctuations in their incomes. Section 2 reviews the state of the art of the determinants
of risk management and pays particular attention to those imposed by the markets (credit
and insurance markets availability), households (asset base) and risk event characteristics
(spread, intensity, predictability).
2.2.1 The Strategies
According to the World Bank (2000), strategies can be broadly classified as risk reduction,
mitigation and coping depending on whether the action is adopted ex-ante (before the risk
event occurs) or ex-post (after the risk event). Thus, on the one hand, ex-ante strategies
include risk-reduction actions decreasing the households’ susceptibility to risk (e.g.
permanent migration, investment in pest-resistant crops, the adjustment of asset portfolios
and income-generating activities); and risk mitigation behaviour by actions that moderate or
offset the potential welfare losses before the risk event occur (e.g. formal and informal credit
and insurance or holding assets as precautionary savings). On the other hand, ex-post
strategies are coping actions, i.e. those that deal with outcomes after they occur in a manner
that moderates or offsets the loss of household welfare (e.g. drawing down assets, borrowing,
depending on charity, etc.).
For heuristic purposes, one of the most general delineations of risk management strategies
among economists is the one proposed by Alderman and Paxson (1992), who distinguish
between risk management and risk coping strategies. Risk management strategies aim to
reduce the ex-ante riskiness of the income-process. Risk coping strategies seek to reduce ex
post the impact of the shock. However, due to the focus on the outcomes of the risk
management approach, the most common classification of the strategies is based on their
objectives, whether they aim to smooth consumption or income.

55
Income smoothing strategies are adopted in response to repeated exposure to the same risk
and they aim to affect the ex-ante riskiness of the income process by reducing income
variability through actions that change the asset base or change the mix of income-generating
activities from a given asset base (Morduch, 1995). Reallocations occur among assets whose
returns are less than perfectly correlated, or into assets with less variable returns.
Theoretically, as long as the different income sources are not perfectly covariate, then there
will be a reduction in total income risk from combining two income sources with the same
mean and variance or through income-skewing, i.e. resources are allocated towards low risk-
low return activities. Income-smoothing strategies can also be ex-post strategies, adopted
when a crisis looms and are particularly important when the shock is economy-wide. When a
large negative shock or risk event occurs, both the usual household activities and the local
income earnings are unlikely to be sufficient and households need to intensify the usual
income-based strategies and adopt additional actions to prevent destitution such as labour
supply adjustments, increased labour force participation, temporary migration, longer
working days, etc.
Consumption smoothing strategies are usually adopted when the principal source of
production and insurance strategies have failed and aim to cope with a unusually severe or
unexpected shock (Morduch, 1995). Consumption smoothing is classified into those that
smooth consumption inter-temporally, through saving behaviour and those that smooth
consumption through risk-sharing. The primary distinction between the two strategies is that
inter-temporal smoothing enables a household to spread the effects of income shocks on
consumption forward through time. Risk sharing, by contrast, spread the effects of income
shocks across households at any point in time. Inter-temporal smoothing may be
accomplished through borrowing and lending in formal and informal markets, accumulating
and selling assets and storing goods for future consumption. Risk-sharing arrangements may
be accomplished through formal institutions (such as insurance and futures markets, and
forward contracts) and informal mechanisms including state-contingent transfers and
solidarity transfers between friends, neighbours and relatives.
Consumption and income smoothing strategies can be formal (market- and state-based) and
informal as well as individual, household or community based. The following table presents
56
examples of consumption- and income-smoothing strategies. The table is an adaptation of
the Holzmann and Jorgensen’s (2000) broad classification of risk management strategies into
risk reduction, mitigation and coping.
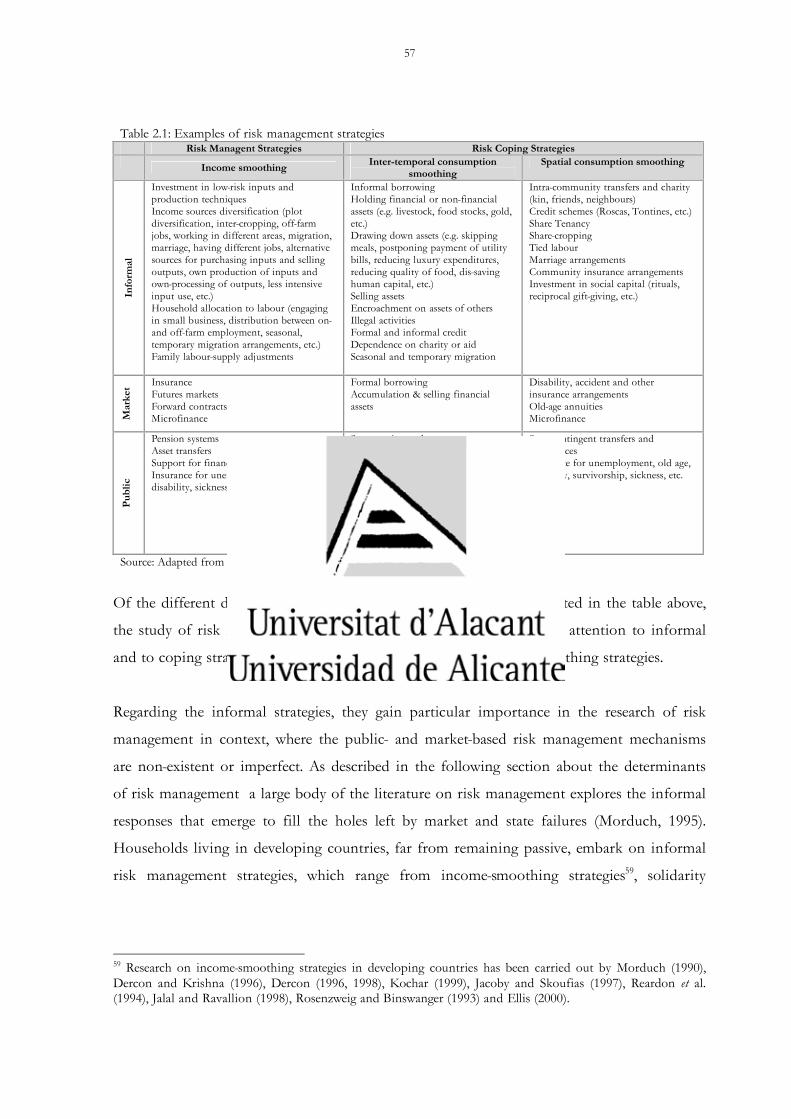
57
Table 2.1: Examples of risk management strategies
Risk Managent Strategies Risk Coping Strategies Income smoothing Inter-temporal consumption
smoothing Spatial consumption smoothing
Info
rmal
Investment in low-risk inputs and production techniques Income sources diversification (plot diversification, inter-cropping, off-farm jobs, working in different areas, migration, marriage, having different jobs, alternative sources for purchasing inputs and selling outputs, own production of inputs and own-processing of outputs, less intensive input use, etc.) Household allocation to labour (engaging in small business, distribution between on- and off-farm employment, seasonal, temporary migration arrangements, etc.) Family labour-supply adjustments
Informal borrowing Holding financial or non-financial assets (e.g. livestock, food stocks, gold, etc.) Drawing down assets (e.g. skipping meals, postponing payment of utility bills, reducing luxury expenditures, reducing quality of food, dis-saving human capital, etc.) Selling assets Encroachment on assets of others Illegal activities Formal and informal credit Dependence on charity or aid Seasonal and temporary migration
Intra-community transfers and charity (kin, friends, neighbours) Credit schemes (Roscas, Tontines, etc.) Share Tenancy Share-cropping Tied labour Marriage arrangements Community insurance arrangements Investment in social capital (rituals, reciprocal gift-giving, etc.)
Mar
ket Insurance
Futures markets Forward contracts Microfinance
Formal borrowing Accumulation & selling financial assets
Disability, accident and other insurance arrangements Old-age annuities Microfinance
Publ
ic
Pension systems Asset transfers Support for financial markets for the poor Insurance for unemployment, old age, disability, sickness, etc.
State-contingent loans Safety nets (transfers, public works, etc.) Dependence on charity or aid from national or international organizations Disaster relief Drawing down community assets (e.g. reduction of maintenance, mining natural resources, etc.)
State-contingent transfers and remittances Insurance for unemployment, old age, disability, survivorship, sickness, etc.
Source: Adapted from Holzmann and Jorgensen (2000)
Of the different dimensions of risk management strategies as highlighted in the table above,
the study of risk management in developing countries pays particular attention to informal
and to coping strategies, particularly inter-temporal consumption smoothing strategies.
Regarding the informal strategies, they gain particular importance in the research of risk
management in context, where the public- and market-based risk management mechanisms
are non-existent or imperfect. As described in the following section about the determinants
of risk management a large body of the literature on risk management explores the informal
responses that emerge to fill the holes left by market and state failures (Morduch, 1995).
Households living in developing countries, far from remaining passive, embark on informal
risk management strategies, which range from income-smoothing strategies59, solidarity
59 Research on income-smoothing strategies in developing countries has been carried out by Morduch (1990), Dercon and Krishna (1996), Dercon (1996, 1998), Kochar (1999), Jacoby and Skoufias (1997), Reardon et al. (1994), Jalal and Ravallion (1998), Rosenzweig and Binswanger (1993) and Ellis (2000).

58
networks60 and inter-temporal consumption smoothing mechanisms such as informal credit,
savings and insurance as well as the accumulation and de-accumulation of assets61. During
serious crises such as in contexts of famine, households adopt additional actions or intensify
the ‘usual’ coping income- and assets-based strategies62.
Vis-à-vis the coping strategies, there are two reasons for the interest shown within risk
management research towards inter-temporal consumption smoothing actions. The first has
to do with the great interest in consumption-smoothing behaviour of poor households63.
Although one can not simply look at the smoothness of consumption and know which type
of smoothing – consumption or income – is at work (Morduch, 1995), the theories of
consumption have dominated the analysis and these are constructed on the assumption of a
perfect market and hence the lack of need to reduce risk ex ante. The second reason behind
the interest paid to inter-temporal consumption-smoothing strategies has to do with the great
bulk of the research on risk management that is interested in monitoring household
responses to drought as indicators of food insecurity. However, in spite of the relevance
given to coping strategies, food security research has found that the risk management process
is dynamic and forward-looking, in which a combination of risk coping and management
strategies are simultaneously and continuously adopted.
Risk Management is Comprehensive, Dynamic and Forward-looking
Risk management was initially conceived as a sequence of discrete responses, which were
adopted and exhausted before the household moved on to the next one. A typical sequence
of ex-post responses to crisis in a rural setting might involve: i) the pursuit of new sources of
income (diversification); ii) drawing on reciprocal obligations (social capital); iii) reducing
the size of the resident household by temporary migration; iv) the selective sale of movable
assets such as goats; and v) the sale or abandonment of fixed assets such as land, households, 60 Accounts of spatial consumption smoothing strategies in developing countries can be found in Carter (1991), Cashdan (1985), Townsend (1994, 1995), Dercon and Krishnan (2000b), Coate and Ravallion (1993), Morduch (1991), Jalal and Ravallion (1997), Ravallion and Dearden (1988), Besley (1995) and Fafchamps (1992). 61 Investigations about inter-temporal consumption-smoothing strategies in developing countries can be found in Rosenzweig and Wolpin (1993), Dercon (1998), Alderman (1996), Udry (1990, 1994, 1995), Paxson (1992, 1993), Hulme and Mosley (1996), Deaton (1991), Fafchamps et al. (1998). 62 A lot of attention has been paid to these strategies in times of famine. See for example Dessalegn (1991), Corbett (1988), Davies (1996), De Waal (1989) and Devereux (1992). 63 For a good review on the literature on risk and consumption see Alderman and Paxson (1992). Deaton (1992) provides a comprehensive understanding about consumption and saving at the individual level.

59
grain stores and so on. Thus, in the late 1980s, Corbett (1989) reviewed the strategies of
different communities facing food deficit64 and although the strategies differed, she observed
a common pattern among the responses. Based on the principle of asset disposal and
determined by its effectiveness in bridging the food gap, its costs or commitment to
domestic resources and irreversibility, Corbett managed to condense the risk management
process into a three-stage sequence of discrete ex-post actions: insurance mechanisms, disposal
of productive assets and destitution.
However, although this way of conceiving risk management opened a big window for its
operational usage as indicators of household vulnerability, it can be misleading as it can be
viewed as over-simplifying risk management. First of all, Devereux (1999) observed that risk
coping strategies are not just a set of discrete events as Corbett suggested; instead the
activities can range from discrete, once-only events (e.g. distress migration) to a series of
discrete events (e.g. animal sales) and continuous processes (e.g. consumption reduction or
food rationing). Furthermore as Davies (1996) points out, the sequence model ignores, on the
one hand, that households juggle between different activities simultaneously and in response
to the seasonal options available as well as taking into account the locational specificity of
ecological and economic aspects. The sequence proposition fails to account for more than a
one-time horizon and changes over time, which means that with each cycle of drought and
partial rehabilitation, the range of options will change and the rate of take-up of particular
coping strategy will vary.
This idea of sequence, despite all its criticism, has been employed to give new value to coping
strategies. Although previously used in anthropological ‘shanty town’ ethnographies (Lewis,
1966 and Perlman, 1976 cited in Davies, 1996), coping strategies were given an operational
usage as predictors of food stress or more generally household vulnerability. Given the
implications for monitoring and subsequent policy-making design, great efforts were devoted
to developing more precise definitions and sophisticated categorizations, which can
differentiate between one strategy and the other and transform the risk management process
into a sequence of measurable indicators. However, as Davies (1996) noted, the complexity of
human livelihoods and the multiple interactions between all factors interplaying in
64 The communities researched were: the Red Sea region in Sudan, the Wollo region in Ethiopia and the Darfur region in Sudan and Nigeria (Corbett, 1989).

60
livelihoods makes it very difficult to establish clear-cut categories and indicators and hence
makes any classification somewhat artificial. Therefore, since the mere fact of using a
particular strategy can indicate nothing about household vulnerability, the use of coping
strategies as indicators of household vulnerability requires other type of information such as
the causes, household’s motivation to choose a specific set of strategies portfolio, the costs
and benefits, the household strategy dependency and sustainability. If these remain unknown,
then coping strategies cannot provide more than contextual information about people’s trade
offs.
An example of how misleading it could be to use the strategies as indicators of vulnerability
while disregarding the above-mentioned factors of risk management is provided by the early
studies on coping strategies, which can be said to misunderstand the strategies of the
voluntary rationing of food consumption. Despite the fact that rationing of food
consumption was observed in the first stages of a crisis, well before households had
exhausted all the means open to them, rationing was interpreted more as a signal of coping
strategy failure and not as one of its costs, within the belief that the first concern of hungry
people is to raise or protect their consumption. However, De Waal’s (1989) and Jodhas’
(1975) observation of people “choosing hunger” rather than selling their key productive
assets suggests a routine austerity measure, where smaller portions and cheaper diets are
routinely used by the people as an effective and relatively costless way of making limited
resources last longer (Devereux, 1999). This ‘contingency planning’ or the ‘desire to retain
assets for alternative use’ shows an awareness of a future beyond the current crisis, when
assets would be needed for a more important purpose than to bridge the food gap. This
awareness of a future beyond the current crisis suggests that people’s priorities and choices
include a time horizon and therefore a trade off between competing sets of objectives (short
term consumption and long term sustainability), where the first concern of hungry people
isn’t just to avoid hunger or starvation by protecting their consumption but to prevent
destitution by preserving assets (Devereux, 1999).
As the ‘choosing hunger’ strategy exemplifies, one needs to look at the risk management
portfolio in a comprehensive manner because households juggle between different risk
management strategies simultaneously and the choice of the mechanisms depends on the
relative costs and benefits of each strategy within a competing set of short-term consumption
61
actions and long-term sustainability (Devereux, 1999). Related to this is the growing savings
research that has moved beyond bi-variable analysis focused on consumption and income to
explore savings behaviour through the inter-linkages between consumption, income, liquidity
constraints and production65.
To sum up, we could say that households in developing countries living on short-term
consumption and long-term sustainability objectives adopt a forward-looking, dynamic and
comprehensive portfolio of risk management and coping strategies to deal with the riskiness
of the income process and to reduce the impact of the shock.
2.2.2 The Determinants of Risk Management
Based on the type of the strategies and on the characteristics of the process of risk
management, this section discusses how risk management theory explains why households
adopt certain risk management mechanisms. Prior to the examination of key risk
management determinants, the evolution and key contributions to the debate on risk
management is presented.
Within the field of economics, there are two main reasons to be interested in risk
management (Deaton, 1997). One is to understand the link between risk and growth. The
capacity to manage risk and with it the appetite to take risk and make forward-looking
choices are key elements of the energy that drives forward the economic system (Berstein,
1996). The second reason for examining risk management is to understand how people deal
with fluctuations in their incomes. As mentioned in the introduction to this section, this
research is particularly concerned with this second objective of risk management because the
ability to manage risk particularly influences people’s vulnerability by determining the extent
of the impact shock and the ability to bounce back, so-called ‘sensitivity’ and ‘resilience’,
65 For example, the existence of informal risk-sharing schemes may discourage households from precautionary saving, since idiosyncratic shocks are insured via risk-sharing agreements; or if income-smoothing strategies exist, then households do not need to rely on costly ex-post measures such as the de-accumulation of productive assets. See the following studies on the relationship between consumption, income, liquidity consttrainsts and production: Dercon (1996), Jacoby and Skoufias (1997), Morduch (1990, 1995), Rosenzweig and Wolpin (1993), Paxson (1992), Alderman (1996), Fafchamps et al. (1998) and Deaton (1991).

62
respectively. Within this body of research and as it will be shown next, numerous studies
have been carried in the last decades investigating outcome determinants.
It could be said that the risk management debate was firstly motivated by discussions on
rational behaviour in pre-market societies. During the 1960s this was an issue of debate
among anthropologists, whether substantivists or formalists. While the former argued that
choices of behaviour in pre-market societies were not economically rational as individuals
were motivated by the principles of reciprocity and redistribution (Dalton, 1961; Cook,
1966), the latter argue that individuals in pre-market societies are capable of rational-
maximizing behaviour and that conventional economic theory is fully applicable to pre-
market societies (Posner, 1980). It was this unsettled debate that stimulated further research
within the different disciplines.
On the one hand, economists carried out studies to assess households’ rational allocation
decisions and the aversion and preferences towards risk in developing countries66. Although
there are divergent views, the majority of the studies concluded that farmers do take rational
choices, mostly determined by moderate risk aversion. Alderman and Paxson (1992) did not
agree with the findings as they ignored other factors such as asymmetric information that
may overestimate or underestimate the level of risk aversion. According to them, the well-
known problems of information asymmetries and deficiencies in the ability to enforce
contracts as a result of incomplete or absent insurance and credit markets may explain why
households in developing countries will not effectively manage risk.
On the other hand, social scientists have joined the debate and carried out extensive research
exploring household response to drought67. They have found that households are not
irrational or passive victims but rational actors taking proactive short and long term
responses to deal with adverse events even in the context of imperfect credit and insurance
markets. Paralell to these studies, Sen formalized the ‘entitlement’ approach and put forward
important aspects for the debate of risk management in developing countries (Sen, 1981).
The main argument of the entitlement approach is that vulnerability to famine is largely 66 With the exception of Antle (1987), who found evidence on risk neutrality, Binswanger (1980) and Hazell (1982) among others observed ‘moderate’ risk aversion when measuring risk preference in developing countries. 67 Early work of household’s responses in context of famine was carried out by Jodha (1975), Watts (1983) and De Waal (1989).

63
attributable to one’s ability to command food through all legal means, and that such ability
is determined by one’s ownership of tangible assets and the rate at which one can exchange
these for food. This approach challenged the view of supply-side aspects such as the existence
of credit and insurance schemes and gave significant relevance to demand failure in the
causes of famine.
This emphasis on demand-failure opened a big window for exploring household responses to
crisis in the following decade. During the 1990s, the debate on risk management had
important contributions regarding its outcomes but also on the processes. Thus, to start
with, and based on the entitlement approach, more comprehensive approaches were
developed to address household vulnerability68. Their focus was the asset base of the
household; but rather than focusing on the tangible assets as Sen’s entitlement approach
argued, they expanded this view to include intangible assets (Swift, 1989). Another
important contribution came from a new body of micro-econometric studies using data from
developing agrarian economies, which looked into the effects of rainfall variability and other
income risks on the flow of consumption or savings (including asset transactions) as well as
on the activities portfolio69. A final piece of research adding to the understanding of risk
management is the already-mentioned food security research, which observed that the
households’s risk management is a dynamic, comprehensive and forward-looking process70.
Regarding these three relevant contributions, this research notes that none of the three
strands of work on risk management focuses on the risk events. This could be because the
calculation of risk had not entered the normative economic analysis of poverty until fairly
recently (Dercon, 2005); the lack of information about the risk events or the assumption of
exogeneity as argued by the CE approach. However, this does not mean that risk events are
completely ignored. Risk management theory integrates risk events into the analysis of the
determinants by its characteristics in terms of spread, intensity and predictability. The
68 Based on the food security and the entitlement frameworks addressing households vulnerability other approaches where developed such as the assets approach (Swift, 1989; Moser 1998), livelihoods approach (Scoones, 1998), social risk management approach (Holzmann and Jorgensen, 2000). For a good review on different approaches to vulnerability see Deng (2004) and Alwang et al. (2001). 69 Paxson (1992), Rosenzweig and Binswanger (1993), Rosenzweig and Wolpin (1993), Alderman (1996), Dercon (1996), Fafchamps et al. (1998). For reviews on past research on risk and savings see Alderman and Paxson (1992) and Besley (1995) 70 Devereux (1992, 1993, 1999), Corbett (1989) and Davies (1996).

64
following section focuses on understanding how risk management theory explains the main
factors influencing the ability of households to manage the risk events.
In order to review the frameworks explaining the main determinants, the following sections
have been developed. While Section 1 is dedicated to the determinants imposed by the
markets (credit and insurance) availability and the households’ asset’s base, Section 2 reviews
the determinants related to the risk event characteristics. Note that although the analysis of
market and household determinants of risk management includes discussion on certain
characteristics of the risk events, such as spread and predictability, it is preferred to present
the risk events in a separate section. The reason for this is related to one of the objectives of
this research, which is placing the risk events at the centre of the analysis of risk
management.
2.2.2.1 Market- and Household-related Determinants of Risk Management
A great part of the studies on risk management has been interested in the relationship
between the structure of financial markets and the effectiveness of risk management
strategies71. The main proposition is that the impact of both predictable and unpredictable
income shocks will not be transferred to the household’s consumption pattern as far as
markets provide ex-ante and ex-post insurance, borrowing and saving opportunities.
Subsequently, it is argued that the reasons why households in low-income economies do not
effectively manage risk are related to the problems of information asymmetries and
difficulties in the ability to enforce contractual results of incomplete or absent insurance and
credit markets (Alderman and Paxson, 1992). On the one hand, insurance markets in
developing countries are notably incomplete or imperfect (Hazell et al., 1987). Their absence
can be explained by problems of asymmetric information between the two interested parties,
causing incentive problems such as moral hazard and adverse selection. On the other hand,
informational problems also limit the development of credit markets. As Bell (1988) argued,
while in many developing countries informal credits are thriving, they are typically
71 The relationship between financial markets and the effectiveness of risk management has been particularly explored within the theories of consumption see for example Bhalla (1980), Deaton (1991, 1992, 1997), Zeldes (1989), Morduch (1995), Udry (1990, 1994). For a review of the literature about how households mitigate risk in context of incomplete or absent insurance and credit markets see Alderman and Paxson (1992).
65
fragmented. Insider knowledge seems to be the main barrier of entry; once inside the
community, kinship group, or geographical area, information flows freely and credit is
generally available, but individual credit markets are not integrated with other credit markets
(Bardhan and Udry, 1999). This segmentation in the credit markets implies that only
individual income risks, called ‘idiosyncratic’, can be insured through credit, limiting the
scope for consumption smoothing72.
Nonetheless, in spite of the belief that imperfect or absent insurance and credit markets lead
to ineffective management of risk (Alderman and Paxson, 1992), there is plenty of evidence
to show that risk management, although not complete, is real and significant in developing
countries. A large body of research has illustrated the wealth of behavioural and institutional
responses that emerge to fill the holes left by market failures and at least partially manage to
limit consumption risk if not with formal with informal means73. In low-income economies,
where credit and insurance markets are imperfect, households, far from being impassive,
adopt pro-active short- and long-term responses to deal with adverse events. They embark on
informal risk management strategies, which range from informal credit, savings and
insurance schemes, solidarity networks and self-insurance strategies such as income-
smoothing strategies and the accumulation and de-accumulation of assets, the so-called
‘buffer-stock strategy’. These responses are so varied that it is natural to ask whether real
holes remain in the effective market structure. The emerging consensus is that holes in
ineffective insurance and credit markets exist, especially for the poorest households. But in
general, the holes are a good deal smaller that many had assumed (Morduch, 1995).
This consensus establishes a bridge between supply and demand determinants, i.e. between
market and household constraints. Households operating at near-subsistence income levels
may strengthen the motive for consumption and income smoothing more than anyone else
since the consequences of a bad income in a given year - both in terms of sensitivity and
resilience - would be catastrophic under such circumstances. If market imperfections limit the
possibilities for consumption and income smoothing, poverty restricts even further as it
72 For a detailed description of the effects of risk event spread – generic and individual – on household risk management strategies see Section 2.2.2.2 73 For the empirical evidence about informal risk management strategies such as risk-sharing, credit and savings, income-smoothing strategies and the accumulation and de-accumulation of assets see previous Section 2.2.1

66
controls the household’s ability by influencing market access as well as household
comparative advantage.
The following sections of the dissertation review market and household determinants across
risk management strategies: inter-temporal consumption smoothing, spatial consumption
smoothing and risk-sharing income smoothing. Note that while this research includes the
buffer-stock model to simulate inter-temporal consumption smoothing, it does not use the
models of full-insurance and activity choice to explain risk-sharing or income-smoothing,
which are beyond the scope of this particular research.
Inter-temporal Consumption Smoothing Strategies
Much research in this area has assumed that households primarily use assets to smooth
consumption, and has consequently sought to establish the cost of income uncertainty
through analysing its effects on savings. An example of this is the buffer-stock model, which
sets out clearly the benefits of self-insurance via savings when credit markets are imperfect.

67
The buffer-stock model was developed by Deaton, in 1991, in order to expand modern
theories of consumption into contexts characterized by market imperfections74. The buffer-
stock model basically states that consumption will depend on how income is expected to
behave, assets and on the relationship between time preference and the rate of interest75. In
cases where the situation is already bad enough and the income is independently and
identically distributed, the household will take the risk and consume its cash-in-hand – i.e. all
income and assets – to offset the income fluctuations; if cash-in-hand is above a critical value
close to the mean income, then the household saves a fixed fraction of anything above the
level as precautionary savings. If, on the contrary, income is serially dependent, the
household will not just take into account his cash-in-hand but also his expectations for the
economic period of the following year.
In spite of the difficulties in calculating an analytical solution for the household
consumption rule76, there is good evidence from a variety of studies to show how
households, even if they do not have access to the credit markets, may still be able to achieve
a high degree of inter-temporal consumption smoothing through the use of assets as buffer
stock77. The following graphs simulate consumption behaviour with and without borrowing
constrains78.
Graph 2.1: Consumption with perfect markets Graph 2.2: Consumption under credit constrains
74 This refers to the Life-Cycle Theory and the Permanent Income Hypothesis. See Section 2.2.2.2, which introduces modern theories of consumption in contexts of uncertainty.
75 A consumer with borrowing constraints can be modelled in the same way as in the basic stripped-down models for consumption, but with the additional constraint that assets cannot be negative 0≥tA , which implies that consumption (
tC ) will be at most the cash-in-hand (ttt yAC +≤ ), where
ty is income, tA the
savings or assets and the ( ) ( ) ( )[ ]⎥⎦
⎤⎢⎣
⎡⎟⎠⎞
⎜⎝⎛++
+= +1'''
11,max ttttt CuEryAuCu
δ, r is the interest rate and δ the time
preference rate (Deaton, 1997). 76 Following Deaton (1997), suppose that the farmer’s income (
tY ) is independent and identically distributed, normally variable with a mean of 100 and a standard deviation of 10. If ‘cash-in-hand’ can be written as
ttt YAX += , then the consumption rule is of the form *)(*)( XXlXXXC tttt >−−= α , where l(.) is 1 if the argument is true, and 0 otherwise, X* is the mean income and α is the percentage to be saved. This embodies the simple precept of spending everything when times are bad, and saving a fixed fraction of any excess over the amount required achieving a ‘minimum necessity’. 77 Empirical accounts of buffer-stock behaviour in developing countries can be found in Rosenzweig and Wolpin (1993), Udry (1995), Alderman (1996), Fafchamps et al. (1998), Carrol (1997). 78 Based on the above-mentioned consumption rule and assuming a normal distribution of mean 100, a standard deviation of 10 and α = 0.7, a simulated time series for income, consumption and assets has been obtained from the following equation:
11 ))(1( ++ +−+= tttt YCXrX , where ttt YAX += (‘cash-in-hand’), r = 0.05.
While Graph 2.2 is subject to credit constraints (ttt YAX +≤ ), Graph 2.1 assumes perfect markets (
ttt YAX += ).

68
-20
0
20
40
60
80
100
120
140
1 6 11 16 21
Time
Euro
s consumptionassetsincome
-20
0
20
40
60
80
100
120
140
0 5 10 15 20 25
Time
Euro
s
in com e
co n sump tio n
assets
Unlike Graph 2.1, where consumption is smoothed because credit is available (illustrated in
the graphs by negative assets), Graph 2.2 describes household’s consumption when
households can not borrow; as long as the household has a positive saving, temporary
income shortfalls can be smoothed through assets de-accumulation, also called dis-saving
strategies. However, once the households’ wealth falls to near zero, the possibility of further
smoothing shrinks and consumption becomes quite volatile.
It is the emphasis on the assets and the fact that credit and insurance access are sometimes
related to wealth which shifts the discussion from the market to household determinants
(Morduch, 1995). Since the poor generally lack safe and productive assets, it is said that
being poor limits the potential of buffer-stocking to offset the impact of income shocks. As
it will be explained next, the household asset base matters because of its absolute value and
because of its composition as it enhances the inter-linkage between consumption and income
choices. If poor households own few productive assets, their short-term consumption
decisions are inevitably linked with their future production and investment choices. The
links can be so strong that the household may choose to let the consumption fluctuate
rather than turning to the recourse of selling of productive key assets, which will
compromise the value of the asset base in the future. For example, Rosenzweig and Wolpin
(1993) found how Indian farmers prefer to use alternative non-productive assets as buffer
stock rather than moving on to the selling of bullocks, which are considered key productive
and marketable assets for Indian agriculture. Another example is the previously-mentioned
fact of Ethiopian farmers ‘choosing hunger’ rather than selling their key productive assets
(Jodha, 1975; De Waal, 1989). Although this was firstly interpreted as a coping strategy
failure, it can now be seen as ‘contingency planning’ or the ‘desire to retain assets for

69
alternative use in the future’, when assets would be needed for a more important purpose
than to simply bridge the food gap.
However, in practice assets are much more limited than the buffer-stock model suggests,
particularly when covariate risk events reduce the assets rate of return and terms of trade (see
Section 2.2.2.2); strong or repeated shocks exhaust the asset’s base (see Section 2.2.2.2); and
when assets become risky such as in context of armed conflict (see Section 2.4). Any analysis
oabout the role assets play on households’ consumption smoothing needs to take into
account these other aspects of the risk events.
Risk-sharing Strategies
Risk sharing can be viewed as the cross-sectional equivalent of consumption smoothing. As
described previously, consumption smoothing actions are classified as those that smooth
consumption inter-temporally, through saving behaviour, and those that smooth
consumption spatially, i.e. across households through risk-sharing. Risk can be pooled within
members of a group (state, ethnic group, village, kinship, household) either through formal
or informal means of insurance such as intra-community transfers and charity, share-tenancy
or group-based credit schemes, etc. Like inter-temporal consumption smoothing, risk-sharing
is described as a coping mechanism; it is usually adopted when the principal source of
income and insurance strategies have failed and it aims to cope with a common but severe
shock or an unexpected risk event. However, as happens in the buffer-stock model,
households invest in social capital as an ex-ante strategy.
Risk-sharing can be studied from different angles. First of all, if risk mechanisms are
simplified by the extent of use of social capital then the buffer-stock model can be used to
measure the extent of consumption smoothing. In this sense, as long as households have
social capital, a temporary shortfall can be smoothed through spatial dis-saving behaviour.
However, the buffer-stock model can not disentangle whether the consumption smoothing
observed is due to inter-temporal or spatial actions. Thus, if one wants to pose other
questions such as whether an informal insurance market built around community and family
relationships exists, and it is able to overcome the problems that hinder the development of
formal insurance markets such as moral hazard and contract enforcement, then the buffer-

70
stock model is not enough and risk sharing has to be explored by two different approaches:
the full-insurance model and by the direct observation of methods of risk-sharing.
The second method is the full-insurance model, which regardless of whether it is due to
formal or informal means, measures the extent to which risk-sharing exists by looking if
household income affects household consumption given community consumption (Bardhan
and Udry, 1999). It focuses on the role of information on the possibilities and consequences
of risk-sharing arrangements and especially on the nature and sustainability of risk-sharing
arrangements given the lack of formal enforcement. During the 1990s, there was a growing
body of research that was interested in testing if risk was efficiently allocated across people;
in which case households would face only aggregate shocks since idiosyncratic shocks would
be completely insured by transfers from the members of the group79. Many studies of risk-
sharing, although they did not observe an efficient allocation of risk, did find partial risk-
sharing. Large co-movements in consumption within cohesive communities were observed80.
The fact that household consumption patterns are smoothed, in spite of substantial
idiosyncratic (i.e. household-specific) income variations, suggests the existence of partial risk
sharing. As is later explained, it is often the case that the group can not insure against
common shocks, or in general, shocks in which a large proportion of community members
are affected by a shock.
There are different explanations for the existence of partial risk-sharing in developing
countries. One way to explain the existence of risk-sharing is through the thesis that
insurance markets are notably incomplete or imperfect. Fafchamps (1992) argues that risk-
sharing exists because the information flow in cohesive communities is sufficiently rich so
that the incidence of random shocks to household income is common knowledge, which
permits community-level institutions to insure members against fluctuations in their incomes
without the problems of moral hazard and adverse selection that would plague an outside
insurer. Another explanation is beyond formal enforcement factors and is about the existence
79 The power of this conclusion obviously depends on the relative importance of aggregate and idiosyncratic income risk within the relevant group. This will be discussed in Section 2.2.2.2 about the risk-related determinants of risk management and in Section 2.4.2 about the risk-related determinants of risk management in context of armed conflict. 80 For instance, partial risk-sharing was observed within villages (Townsend, 1994; Jalal and Ravallion, 1997; Udry, 1994; Morduch, 1991), within ethnic groups (Deaton, 1992; Grimard, 1997) and within kinships (Besley, 1995; Dercon and Krishnan, 2000b).

71
of shared norms and values (Platteau, 1997; Scott, 1976) and self-reinforcing mutual
assistance (Coate and Ravallion, 1993), which determined the conditions for the
arragenements to be sustained. These can generate schemes of risk-sharing overcoming the
constraints produced by information and enforcement problems. Risk-sharing does not
necessarily require an arbitrator or a planner; if interactions are repeated then mutual
assistance may be self-reinforcing, which implies that the short term gains of not cooperating
when it is one’s turn to remit rather than receive may not outweigh the expected cost of
forgoing future cooperation (Bardhan and Udry, 1999).
However, like the buffer-stock model, one of the problems of the full insurance model is that
it can not be disentangled if the observed co-movements within cohesive communities are
due to self-insurance via savings, i.e. buffer-stock behaviour, or informal insurance, i.e. risk-
sharing. These limitations have put constraints on a common consensus about the scope and
importance of risk sharing and have encouraged the third type of approach to assess its
importance. This referred to those that directly explore the mechanisms households use for
risk-sharing. Despite problems of interpretation81, there is much evidence illustrating the
importance of risk-sharing in the household process of risk management. For example,
Ravallion and Dearden (1988) found that in rural areas of Java, households that experience
ill health receive greater transfers, even when controlled for income. Rosenzweig and
Binswanger (1985) found that the net transfers a family receive increase when income falls
relative to its average value. Furthermore, households with more kinship connections have
transfers that are more responsive to income shocks. He also observed Indian households
marrying daughters deliberately out over longer-distance space in order for the remittances to
flow between larger areas, depending on where the negative shock is experienced. Other
examples are the system of gift exchange among Baswar farmers in Botswana (Cashdan,
1985), reciprocal credit among fishermen in South India (Platteau and Abraham, 1987) and
the simultaneous participation on both sides of the credit market of Nigerian farmers (Udry,
1990).
81 According to Bardhan and Udry (1999) there are certain problems in interpreting data when looking directly into the methods used by households to share risk. First, many types of risk-sharing arrangements will result in ‘transfers’ that are quite difficult to measure. Second, partial risk sharing may generate very infrequent transfers between households. Few transfers might be recorded in the data in any given year, even if partial risk sharing plays a very important role in buffering consumption. Third, another reason is that transfers and remittances that are observed need not be the result of risk-sharing (altruistic reasons, loans, inheriting assets, paying the family back for the cost of education, etc.).

72
These studies on risk-sharing mechanisms bring in another risk-sharing determinant: the
nature of the group o more generally the type of social capital, which determine the links of
reciprocity and bonds of trust, which decide the ‘insiders’ and the ‘outsiders’ with respect to
the risk-sharing arrangements (Ellis, 2000). The definition of social capital attempts to
include community and wider social claims on which individuals and households can draw
by virtue of their belonging to social groups of varying degrees of inclusiveness in society at
large82. In spite of being a highly-controversial topic83, there is general agreement that the
‘social’ aspect (relationships, institutions, norms) has been under-valued in terms of its
contribution to the achievement of economic prosperity vis-à-vis physical, financial and
natural capital. The incoporatin of such arguments is not appropriate to the main objectives
of this research, which uses the concept in terms of proxy trust, norms of reciprocity and
networks of civic engagement and to illustrate certain differences in ‘social capital’ which
are relevant for argument and analysis.
On the one hand, we are interested firstly in bonding and bridging social capital (Gittel and
Vidal, 1998). While bonding social capital refers to the value assigned to social networks
between homogeneous groups of people and builds up intra-group solidarity, bridging refers
to that of social networks between socially heterogeneous groups and builds up inter-group
solidarity. On the other but related hand, is the distinction between horizontal and vertical 82 For example, Putnam et al. (1993) envisage social capital as features of social organizations, such as trust, norms of reciprocity, and networks of civic engagement that can improve the sufficiency of society by facilitating coordinated actions. He highlights the horizontal social groups, such as associations, clubs and voluntary agencies, which bring individuals together to pursue one or more objectives in which they have a common interest (e.g. farmers associations). Moser (1998) defines social capital as reciprocity within communities and between households based on trust deriving from social ties. She emphasizes localised reciprocity as envisaged in the ideas of moral economy and social insurance (Platteau, 1991; Scott, 1976) and directs attention to personal or family networks, typically comprising near and remote kin, as well as close family friends, that offer spatiality diverse potential means of support when past favours are reclaimed. 83 The term ‘social capital’ came to the fore in 1990 among development practitioners and academics under the sponsorship of the World Bank (Putnam et al., 1993; Narayan, 1999; Moser, 1998). Although the idea that social relations are a constituent part of one’s aggregate capital had been implicit in early definitions of the term from Marx onwards (Fine, 1999; Harriss, 2001), the emerging literature was motivated by the publication of Putnam’s findings on the impact of social relations upon Italian political institutions (Putnam et al., 1993). The concept of social capital is hugely controversial and has generated a large range of literature of a polemical nature. For a review of the main critiques see Fine (1999), Harriss (2001), Woolcock (1998) and Krishna (2002). According to Goodhand et al. (2001), there is a fundamental divide between those who use social capital normatively (i.e. in terms of organizations, norms and networks that are ‘good’) and those who use it analytically (i.e. in terms of organizations, norms and networks that may be ‘good’ or ‘bad’ in terms of the outcomes they generate. Within the latter, there are very different interpretations as to whether social capital, paying little attention to issues of power, inequality and social differentiation, primarily enhances the capabilities of individual groups (classes, age sets, genders, ethnicities) or society as a whole (Fine, 1999; Harriss, 2001).

73
social capital (Putnam et al., 1993) and whether they serve a common interest or are of self-
interest. Putnam argues that this distinction is useful in highlighting that social capital,
though it is always an asset for those individuals and groups involved, may not always be
beneficial for society as a whole. Horizontal networks of individual citizens and groups that
enhance community productivity and cohesion are said to be positive social capital assets
whereas the vertical self-serving exclusive groups and hierarchical patronage systems that
operate at cross purposes to societal interests can be thought of as negative social capital
burdens on society.
Of all the assets of the household asset base – natural, social, financial, physical and human -
social capital is the most difficult to describe in other than broad qualitative terms. As Ellis
(2000) states, a great deal of reciprocity is hidden, or is discovered only by time-consuming
anthropological research, or emerges into the open only at times of serious crisis. The process
that creates ‘insiders’ and ‘outsiders’ with respect to social capital are complex and difficult
to unravel, but clearly such divisions do exist, and they sometimes result in the ‘social
exclusion’ of particular individuals or groups within communities based on economic factors
(e.g. vulnerable households not wanted in risk pool) and social factors (e.g. community
kinship ties and networks might exclude newcomers on the basis of gender, tribe, etc.).
As for social factors, they are inherent in the nature of the group and are believed to limit
effectiveness as they set the basis on selective membership criteria. Social ties and networks
might function well for the ‘insiders’ but others might be excluded from membership based
on social factors on the basis of gender, tribe, being an immigrant or any other aspect of the
individual which is perceived to be a drain on that specific group. For example, there are
cases where certain in-migrants to communities, e.g. individuals that do not accept
traditional customs, the elderly and/or sick, are excluded from social networks (Siegel and
Alwang, 1999).
The importance of economic factors comes into play from the existence of horizontal social
groups, as defined by Putnam et al. (1993). Narayan and Pritchett (1999) found in Tanzania a
high level of this type of associational life - as indicated by membership of religious, social
and economic groups – that is correlated to, at village level, higher than average per capita
income. However, when they tested reverse causation, i.e. income levels leading to higher

74
associative activity, they did not find supporting evidence. Related to this is the work carried
out by Jalal and Ravallion (1997) in China. With a more general approach to risk-sharing
arrangements than Narayan and Pritchett who focused on horizontal social groups, Jalal and
Ravallion observed that what matters for risk-sharing arrangements is the household-specific
wealth rather than village wealth. While they did not find evidence of the poor being less
well insured when they live in generally poor areas ceteris paribus, the partial risk-sharing
arrangements observed in the villages of southern China work considerably less well for the
asset poor. While the poorest may have the highest notional demand for insurance, they are
also more likely to be rationed to its access to the extent that their default for reciprocation
will be deemed more likely than for the non-poor. There is common conjecture that the poor
are less connected and hence more vulnerable to be left out of risk-sharing agreements than
their better-off companions (Townsend, 1994).
Income Smoothing Strategies
The last type of strategies we are looking at are the income-smoothing strategies, which are
adopted in response to repeated exposure to the same risk and they aim to affect the ex-ante
riskiness of the income process by reducing income variability through income
diversification and low-risk investments, which is also called income-skewing. Income-
smoothing strategies can also be ex post; adopted when a crisis looms and are particularly
important when the shock is economy-wide. When a large negative shock occurs, both the
usual household activities and the local income earnings are unlikely to be sufficient and
households need to intensify the usual income-based strategies and adopt additional actions
to prevent destitution such as labour supply adjustments, increased labour force
participation, temporary migration and longer working days, etc. (Kochar, 1999).
As Kochar (1999) noted, since a great deal of risk is already averted in the course of income
generation, income-smoothing strategies are important not just among liquidity-constrained
households, but in their own right. The research emphasis on consumption over income
smoothing strategies comes from a belief that household consumption, despite the absence
of formal insurance and credit markets, appears to be relatively well protected from
household-specific shocks. However, Kochar argues, asset transactions - yielding a high cost
of uncertainty due to both ex-ante portfolio choices that favour more-liquid but less-

75
productive assets and to the ex-post sale of assets at a possible loss (Morduch, 1995) - might
not be needed to mitigate the effects of these shocks if labour markets are flexible enough to
accommodate a reallocation of labour.
It is remarkable that in spite of the relevance and potential of income-smoothing strategies,
in practice relatively little income-smoothing takes place; or at least, income remains highly
variable (Dercon and Krishnan, 1996). As it is explained next, the reasons are diverse; they
relate to factors such as risk preferences, opportunities for inter-temporal consumption-
smoothing, comparative household advantages in terms of ability, access to capital, and
location.
Before the determinants are discussed, it is important to be aware that observing income-
diversification strategies does not necessarily mean income risk is being reduced. On the one
hand, combining different income sources is not necessarily meant to handle risk. For
example, seasonal work may be conducted at different times of the year to smooth labour
over time; others such as inter-cropping increase returns and variability (Carter, 1991). On
the other hand, the extent to which income-source diversification decreases risk may depend
on the covariance of the income sources (Fafchamps et al., 1998). For example, a drought
adversely affects both non-farm and farm income. The fact that the degree of covariance
between income-sources is influenced by the risk-event characteristics – spread, intensity and
nature – is further discussed in Section 2.2.2.2.
For a long time evidence has shown that the extent to which households trade-off average
income for less variable income depends on risk preferences and the opportunities for inter-
temporal consumption smoothing. Firstly, when full markets for consumption smoothing do
not exist, risk aversion can affect how households decide both on the composition and on
the nature of income-generating activities. Thus, risk-adverse households would be expected
to shift production into more conservative, but less profitable, modes, particularly when the
environment becomes riskier (Rosenzweig and Binswanger, 1993). However, the importance
of risk preferences weakens when there is evidence that links the composition and nature of
income-generating activities to the opportunities available for consumption-smoothing.
Secondly, it has been generally observed that credit-constrained households are less willing to
bear the risk than those enjoying perfect markets even if their risk preferences are identical

76
(Morduch, 1995). In the event that something bad occurs, the latter will be covered by ex-
post formal mechanisms, while the former would be exposed completely to the impact of the
shock unless its impact can be offset through informal coping strategies. However, as
Morduch argues (1995), it is difficult to disentangle behaviours that are produced by risk
preferences or market imperfections. For example, if a household can rely on transfers,
remittances or help from the community to smooth consumption, then risk-adverse
households might make decisions as if they were risk-neutral.
Dercon and Krishnan (1996) investigated further the determinants of credit constraints and
looked also into other poverty-related factors determining access. Specifically, they
highlighted three aspects: firstly, the comparative advantages of households who possess
particular skills or endowments of labour which obtain higher returns in some activities;
secondly, access to certain types of actions due to capital, technology and/or the ability of
households to take up particular activities that distinguish the better-off from the households
that are merely getting by; and the last aspect they observed was about access to public
infrastructure such as market places and roads, proximity to towns, common property
resources and other public goods, which is believed to contribute to the different portfolio
patterns across regions.
Related to the household’s access determinants, there is a great deal of evidence showing that
the poor rely on income-diversification and income skewing to a lesser extent than non-poor
households84. In addition to the household comparative advantages, the reduction of income
risk is further hampered in the poor-asset households because mean-income-preserving
diversification is therefore not easily possible since it requires capital. Dercon (2000)
highlighted two main implications to the fact that the poor are less diversified. On the one
hand, many diversification or income-skewing strategies are actually mean-income reducing,
making them less interesting for the households, who have to weigh lower risk against lower
returns. On the other hand, income-based strategies are directly linked to asset-based
strategies, including risk-sharing. Households with considerable savings will choose a
portfolio of income generating activities that are more risky and also have higher expected 84 Morduch (1990), Dercon (1996, 1998), Reardon et al. (1994), Jalal and Ravallion (1997), Dercon and Krishnan (1996) and Ellis (2000).

77
returns than a household with little or no savings, since the former households can deplete
their assets to maintain their consumption when things turn out badly. The households with
no savings, on the contrary, will choose a low-risk and low-return portfolio because they do
not dispose sufficient assets for ex-post risk coping. The consequence is that the asset-poor
can not enter into high-risk activities, since the downside risks are too high. To handle
income risk, asset-poor households will have to enter low-risk, low-return activities, which
lead to lower average incomes and a higher income gap relative to asset-rich households.
To sum up this section, we can say that risk management certainly takes place in developing
countries; households adopt short and long-term responses to deal with risk events. Despite
the influence of research into the relationship between financial markets and the effectiveness
of risk management, there is plenty of evidence to show that risk management, although not
complete, is real and significant in developing countries, characterised among others aspects
by uncertainty and market imperfections. This evidence has shifted the attention away from
determinants constrained by the markets to those constrained by the household. Poverty is
argued to limit the possibilities for consumption and income-smoothing as it determines the
household asset-base composition, access to credit and insurance schemes, access to high-
return income activities, ability to take up particular activities and the link between
consumption and income activities, etc. Before we can say what this conclusion seems to
suggest, i.e. poor households can not manage risk because they do not have the means, it is
necessary to integrate risk events into the analysis. The following section reviews the evidence
and theory of risk management, in particular about the relationship between risk
management strategies and risk event characteristics, in terms of their spread, predictability,
intensity and nature.
2.2.2.2 The Risk-related Determinants of Risk Management
With the overall aim of bringing in the relevance of risk events into the analysis of risk
management, this section reviews risk management theory and the evidence of how risk event
characteristics influence the household’s ability to deal with anticipated or actual losses
associated with uncertain events and outcomes.

78
Risk event characteristics are related to source, spread, predictability and intensity. Regarding
the source, risks are produced by natural, economic, social and political factors. They can
have a covariate or idiosyncratic spread, i.e. they can affect the whole community (e.g. armed
conflict) or be individual or household-specific (e.g. asset theft); they can be partially
predictable (e.g. hungry season) or completely unexpected (e.g. drought); they can totally
affect portfolio-yielding income, consumption or well-being or partially, when they affect
only one source of these, e.g. health or harvests85.
The debate on risk management has been driven by an interest in risk outcomes rather than
in the risk events themselves. Either because of the unavailability of information on risk
events or the assumption of exogeneity, the study of risk management has widely researched
the risk outcomes and its determinants, particularly how households and markets factors
influence the ability to offset the negative outcomes produced by fluctuation in income.
Within this research, risk events have been addressed by their characteristics of predictability,
spread and intensity. However, beyond these characteristics, the cause or source of the risk
event has been not considered despite the fact that it encloses information the household
care about when managing risk. The implications of this in contexts of armed conflict are
notable since it is argued that assuming risk events as exogenous has allowed a focus on
economic failure and not on the concept of risk as an important factor in the analysis of
ineffective risk management causation. Before we discuss risk management in the context of
armed conflict, it is interesting to first analyse how the risk event characteristics have been
integrated in risk management theory and the evidence drawn from developing countries.
The Predictability of Risk Predictability has been one of the most studied characteristics of risk events and it refers to
the extent to which the shock event or its magnitude can be foreseen. For example, while an
earthquake is an unpredictable shock, seasonal fluctuations are predictable events of an
unpredictable magnitude.
85 A discussion on the characteristics of risk events can be found in World Bank (2000) and Sinha and Lipton (1999).

79
Certain theoretical frameworks such as the buffer-stock model state that the fact that
households can predict the occurrence and/or the magnitude of a shock implies that
forward-looking households aiming to protect themselves will adopt ex-ante consumption or
income smoothing measures. The extent of the effectiveness of these ex-ante mechanisms in
offsetting predictable and unpredictable shocks has been mostly approached by the theory of
inter-temporal choice, which can be considered as the inflection point between Keynesian
and modern theories of consumption, such as the Life-cycle theory (LCT) and Friedman’s
Permanent Income Theory (PIH). In fact, these modern theories of consumption precede the
buffer-stock model, which expands the LCT and PIH explanation about consumption with
uncertainty to contexts characterized by market imperfections. It would have been more
appropriate to precede the description of the buffer stock model with the discussion about
modern theories of consumption and uncertainty. Nevertheless, due to the relevance of
uncertainty in contexts of armed conflict, it is interesting to reflect on how uncertainty has
been integrated into consumption theory.
The stripped-down models of modern theories of consumption, which assume certainty and
market availability, propose that consumers do not concentrate exclusively on this year’s
disposable income but also on their predictable disposable income, which will depend on
their future earnings from work, and on their future income from accumulated wealth86
(Romer, 1996). Thus, in contexts of predictability, consumption smoothing takes place by
the adoption of ex-ante measures87. However, if the assumption of certainty is relaxed and the
risk events are taken to be unpredictable, then consumption is said to follow a random walk,
i.e. there is no systematic trend and hence changes in consumption will not be predictable
(Hall, 1978).
86 Integrating a two-time horizon into the consumption equation leads to ⎟
⎠
⎞⎜⎝
⎛+= ∑
=
T
ttt YA
TC
10
1 where T is the total
period that an individual lives and the term in parentheses is the individual’s total lifetime resources or the present value of current and future income (PV), where income includes labour income (
tY ) and property income determined by assets (
0A ). LCT and PIH differ in their treatment of PV. While LCT defines PV as a
function of current income and expected future income∑ ∑= +=
⎥⎦
⎤⎢⎣
⎡+=
T
t
T
tttt YEYY
1 1ττ
, PIH divides income into
transitory and permanent income, i.e. TP YYY += . For a detailed description of the models, see Deaton (1992, 1997). 87 While long-term consumption is explained by the life-cycle needs (savings during productive times and dis-saving during retirement), short-term consumption smoothing is mostly determined by permanent income, i.e. what is expected to be received on a continuous basis.

80
In this sort of scenario, consumption smoothing would be possible because of the existence
of credit and insurance markets; the individual will consume the amount he would if their
future income were certain to equal their present means (the so-called ‘certainty equivalence’)
and the impact of unexpected shocks will be offset through saving and dis-saving behaviour
as was indicated in Graph 2.1 and again in Graph 2.3. Graphs 2.4 and 2.5 illustrate the same
dynamics but from life-cycle- and permanent-income arguments respectively. In a life-cycle
interpretation, where the focus is less on uncertainty than on age, earnings and savings,
consumption can fluctuate temporarily but overall it remains constant over life as the
income fluctuations are offset by asset transactions, i.e. savings during productive times and
dis-savings during years following retirement (in Graph 2.4 retirement starts at year 18).
Hall’s extension of the permanent income hypothesis (Graph 2.5) implies that an unexpected
change in income affects consumption only if it affects permanent income (Romer, 1996). In
this sense, Friedman’s PIH model argues that consumption will depend on the information
associated with the income shock so that those affected can set aside in good years and hence
detach their annual consumption levels form their annual incomes (Deaton, 1997).
Graph 2.3: Consumption & Uncertainty88
Graph 2.4: Life Cycle Theory & Uncertainty 89
Graph 2.5: Permanent Income Hypothesis & Uncertainty90
88 Graph 2.3 simulates the equation
⎟⎟⎠
⎞⎜⎜⎝
⎛⎟⎟⎠
⎞⎜⎜⎝
⎛+
+= ∑=
T
tt
t
rYEA
TC
1101 )1(
1 , for period 2, where T is the total period that an
individual lives, tY is the labour income,
0A refers to the savings and r is the interest rate. The simulation is based on the following aleatory values: random and positive values for savings, r = 0.25 and
tY adopts randomly values between 120 and 80. 89 Graph 2.4 illustrates a life-cycle interpretation of consumption under uncertainty by the following equation
[ ])))(1( ttt YtTmkkAC −++= , where T is the life time; m is a constant; k is a scalar which depends on the interest rate (the return of savings), on the individual tastes shaping the indifference curves, the variability of expected income;
tY is the labour income and tA the savings. The simulation is based on the following aleatory
values: T = 25, m = 0.15, k = 0.12, A= 265, tY adopts random values between 120 and 80; there is an unexpected
shock of – 60 and retirement is introduced at year 16. 90 Graph 2.5 illustrates Hall’s extension of the PIH by the following consumption equation tP
t YYC χβα ++= , where PY is the permanent income and tY the transitory income. The simulation illustrates the equation based on the following values PY = 100, tY has been given a random value from 20 to –20; there is an unexpected permanent shock of –50; α = 10, β = 0.7 and χ = 0.01.

81
0
2 0
4 0
6 0
8 0
1 0 0
1 2 0
1 4 0
0 1 0 2 0 3 0
T im e
Euro
s
c o n s u m p t io nin c o m e
0
20
40
60
80
100
120
140
0 10 20 30
Time
Euro
s
consumptionincome
-40
-20
0
20
40
60
80
100
120
1 6 11 16 21
Time
Euro
s
consumption
transitory income
permanent income
If the household, instead of following certainty-equivalence behaviour, is prudent, i.e. it has a
‘precautionary saving motive’, then its consumption will be determined not just by the
expectations of future income but by uncertainty, which makes the household reduce
consumption and increase its savings91.
Thus, one could say that if households can save and dis-save either through formal channels
or by adopting buffer-stock behaviour, whether the shocks – with respect to occurrence or
magnitude - are predictable or not does not matter. Depending on the time preferences and
interest rates, households will either adopt an ex-ante prudent measure by building
precautionary savings or wait till the risk event happens, and then offset its impact by
borrowing. However, in practice predictability matters much more than the above-mentioned
models, particularly when credit markets are imperfect (see the buffer-stock model), the risk
events affect the whole community (see the following discussion on the spread of the risk
events) and the risk events systematically target the destruction and looting of the assets (see
Section 4 on uncertainty in contexts of armed conflict). Taking into consideration these
other aspects of risk events, any analysis of the effects of uncertain risk events on household
consumption needs to take into account not just the income but also its effects on the assets.
The Spread of Risk
Together with predictability, the spread of the shock is a well-studied characteristic in the
research into risk management. Risk events can have covariate or idiosyncratic spread. While
the former refers to the type of shocks that affect the whole community, the latter submits to
the risk events that occur at the individual or household level. The fact that the risk spread is
covariate or idiosyncratic depends to some extent on the causes of the risk. For example, loss 91 Deaton (1991), Zeldes (1989), Carroll (1990), Morduch (1990).

82
of employment can be idiosyncratic or covariate depending on whether it is due to
individual bad behaviour or whether it is due to an overall disruption of labour markets
because of a war.
Development research normally portrays risk as covariate because most of the shocks are
considered to have large covariate components (Dercon, 2000). However, in spite of the
problems associated with measuring the amount of aggregate risk a community faces92, there
is more and more evidence showing that the income of households in a village or region
moves together less than expected93.
One of the main questions addressed by the economic studies on risk management has been
whether covariate shocks limit consumption smoothing strategies. We have seen in Section
2.1 how in contexts where the credit and insurance markets are imperfect or even absent,
households try to self-insure through the accumulation of savings and through risk-sharing
strategies. The effectiveness of the latter has been widely studied, and as previously
mentioned risk-sharing can only protect households from the effects of idiosyncratic income
shocks94. When the shocks are covariate, risk can not be pooled among members in the
groups as a large proportion of the community members are also affected. Savings on the
contrary, as the buffer-stock model shows, can provide an effective insurance against both
idiosyncratic and covariate risk and can be de-accumulated to smooth consumption in
situations where households are precluded from borrowing because of absent credit markets
or access constraints. However, self-insurance through saving is far less useful during
covariate crisis because of the covariance of asset value and income (Dercon, 2000). A
covariate-negative income shock such as a civil war or a drought will reduce the income as
well as the asset’s rate of return and terms of trade. Since households tend to dispose of
assets based on the asses value – particularly their current selling prices, the stream of future
value the assets can generate and the rate of return (Devereux, 1993) - when there is a
92 Alderman and Paxson (1992) argued that it is difficult to measure income covariance if informal insurance markets are unknown and to discover more about them is normally constrained by data limitations. Many surveys are intended to investigate issues of income covariance of households that live close. Most household surveys select villages as sampling units, and then administer surveys to randomly-selected households within those sampling units. With this type of structure, measuring income co-variation is straightforward. However, there are just a few samples that collect information on the locations as well as on the extended family. 93 See for example Townsend (1995), Deaton (1997), Morduch (1991) and Udry (1991). 94 Jalal and Ravallion (1997), Udry (1994), Morduch (1991), Besley (1995), Dercon and Krishnan (2000b), Ravallion and Dearden (1988), Fafchamps (1992) and Townsend (1994).
83
covariate risk the value of assets drop and hence their disposal is not an attractive or effective
risk management strategy (Udry, 1995).
In the sort of situations where consumption-smoothing strategies are constrained, income-
smoothing strategies gain importance (Ellis, 2000). When a large economy-wide shock or risk
event occurs, both the usual household activities and the local income earnings are unlikely
to be sufficient and households need to intensify the usual income-based strategies and adopt
additional actions to prevent destitution; such as labour supply adjustments, increased labour
force participation, temporary migration and longer working days, etc95.
One of the critical features of diversification is the achievement of an income portfolio with
a so-called low covariate risk between its components (Fafchamps et al., 1998). This means
that the factors that create risk for one income source are not the same as the factors that
create risk for another income source. Thus, in contexts of covariate risk events, the issue is
not so much whether or not risk spreading involves a fall in income, but the covariance of
the income sources. During covariate shocks many income streams are affected
simultaneously, which limit the ability of income source diversification to decrease risk
variability. The risk-reducing effect of income source diversification disappears during
common risk events and does not just affect the poor as previously mentioned, but a wider
group of the population. In addition, depending on the intensity and the nature of the
shock, the income-covariance can affect more than just one sector of the economy or, indeed,
a single segment of the population.
The Intensity of Risk This research addresses the intensity of the risk by looking at the size and frequency of the
risk events and the duration of the crisis. The intensity is important as it determines the
deepness of the impact as well as the time-span of recovery. Generally, when shocks are
intense, but more importantly if they are repeated over time and turn the crisis into a
chronic situation, their management is more difficult since they exhaust the means of risk
management and the strategies available are fewer and less effective.
95 For the empirical evidence about ex post income smoothing strategies see Section 2.2.1

84
Research on the influence of the intensity of risk events on consumption smoothing has
been mostly focused on its repetitive nature (Morduch, 1995). Generally, relatively small but
frequent shocks are more easily managed than large, infrequent and negative shocks.
However, if large negative shocks are repeated over time, then the management of the
situation is more difficult because firstly both self-insurance mechanisms - through the
accumulation of savings or through informal risk-sharing arragments tend to fail under
strong or repeated shocks (Alderman, 1996); and secondly, households intensify their usual
income-smoothing strategies and adopt new ones within a framework of more and more
exhausted labour markets with lower average income and higher income gap between worse-
and better-off (Dercon, 2000).
The buffer-stock model illustrates a household’s propensity to save and how this is
influenced by income uncertainty and variability. Deaton (1997) simulated the impact of
successive negative shocks on consumption with the occurrence of a ‘stock-out’ behaviour,
i.e. the drawing-down of liquid assets to essentially zero. Because of the exhaustion of the
asset base, households exhibit more difficulty in smoothing consumption after successive
shocks than after a single negative shock (Alderman, 1996). This situation has been observed
in the context of famine. According to Webb and Reardon (1992) drought has relatively little
impact on households in Africa unless there are sequential bad years. Coping systems are
strained when shocks are repeated over time due to the exhaustion of the asset base and due
to the dis-accumulation of productive assets, which render the asset base less and less effective
and strengthen the relationship between consumption and production/investments decisions.
Thus, forward-looking households tend to retain key assets for other purposes than to bridge
the food gap and therefore the assets are diposed not just based on the asset’s value but the
rate of return and the stream of future value (Devereux, 1993). There is a wealth of evidence
indicating that while liquid assets are used to deal with fluctuations in reasonably bad years,
when several bad years have followed, one observes more potentially productive assets being
sold96.
96 Dercon (2000), Alderman (1996), Morduch (1995), Deaton (1992), Udry (1995), Jodha (1975), De Waal (1989) and Devereux (1999).

85
If we focus on income-smoothing strategies, we know that when particularly large negative
shocks occur, households need to intensify the usual income-based strategies and adopt
additional actions to prevent destitution. So there are labour supply adjustments, increased
labour force participation, temporary migration and longer working days, etc. In spite of the
need to find alternative income sources, Bisnwanger and Rosenzweig (1993) found that as the
environment becomes riskier, asset-poor (and risk-averse) households expect to shift
production into more conservative, but less profitable modes. In the context of frequent
shocks, the already-mentioned cost that comes from income risk reduction – lower average
income and higher income gap between asset-rich and asset–poor – may become more
explicit.
Thus, if shocks are repeated over time, we could expect that the long-term consequence of
income-skewing would affect a higher number of households over shorter-periods of time.
In addition to the intensity and frequency of the shock, another dimension of the intensity
of the risk event is the duration of the crisis. The importance of the intensity of the shock,
in terms of magnitude and frequency, on risk management needs to be studied within a time
perspective that reflects the temporariness of the situation or, alternatively, a time perspective
in chronic crises that captures the change in the livelihoods.
One can argue in favour of analysis of the time dynamics of risk management for several
reasons. Firstly, risk managmente is a dynamic process. Secondly, when shocks are repeated
over time, there is a need to include the continual process of change with respect to a
household’s livelihood as contributory to its behaviour. Disregarding time and framing the
risk events as temporary shocks may mask the collapse of livelihood systems and the need for
a radical re-appraisal of the genuinely valuable requirements for effective livelihood in these
circumstances.
86
Ideally, the effects of the duration of the crisis would be captured by panel data. However,
this is indeed one of the main limitations for the exploration of the inter-temporal dynamics
of economic dimensions of poverty, often referred to as ‘poverty dynamics’. Panel data are
scarce. Another way to approach this could be to expand the distinction beyond ex-ante (i.e.
risk management) and ex-post (i.e. risk coping) to include different forms of coping such as
long- and short-term coping, transitory- and chronic-coping as well as exceptional- and
normal-coping. According to Davies (1996), variation between these coping behaviours can
be described as the following:
- Short- and long-term: short-term coping refers to the fall-back mechanisms used
during periods when habitual entitlements are disrupted. Long-term coping refers to
the outcomes of fundamental and irreversible changes in local livelihood systems.
- Transitory and chronic: transitory coping involves actions that aim to cope within
the existing rules. Chronic coping requires adaptation to the rules to meet the needs
of livelihood.
- Exceptional and normal: exceptional coping refers to the strategies which are used in
abnormal situations. Normal coping refers to those actions that have become part of
the household regular livelihood strategies.
Davies (1996) distinguishes between coping within the existing rules and adapting to the
rules to meet livelihoods needs:
- Coping is a short-term response to an immediate and unusual decline in access to the
basic needs such as food; it is an action of survival within the prevailing rule system.
They are reserved for periods of unusual stress, which permit people to cope with
disruptions in their normal bundle of entitlements, such that they can minimize the
degree of disruption (i.e. household’s sensitivity) and maximize bounce-back (i.e.
household’s resilience) to their habitual patterns of activities once the period of stress
is over

87
- Adapting is a permanent change in the mix of activities required for subsistence
irrespective of the year in question; it occurs when the rule system itself change and
when the coping strategies fail to permit houesholds to bounce back and they become
part of the normal cycle of activities. Their use is reduced – but not totally – and
suspended in abnormally-good years; and in abnormally-bad years, where the only
option is to intensify the normal activities and not to resort to coping strategies,
which are reserved as safety nets. Household data indicate that the scope for
intensifying the use of coping strategies is itself limited, as they already account for a
significant proportion of household labour in a normal year.
Thus, the distinction between coping and adapting is particularly relevant for the
understanding of risk management in the context of chronic crises. Since armed conflicts are
often perpetuated over long periods of time, the analysis of risk management requires a
continuous and dynamic risk managmenet appraoch, that naturally, takes into account the
effect of the risk on households’ livelihood.

88
The Nature of Risk
According to the World Bank (2000), the nature or source of the risk can be natural (floods,
earthquakes, droughts, etc.), health related (illness, disabilities, death, etc.), social (domestic
violence, crime, gangs, riots, wars, etc.), economic (inflation, exchange rate crises, job loss,
harvest failure, etc.), political (wars, riots, coups d’etat, etc.) and environmental (pollution,
deforestation, nuclear disasters, etc.). However, despite the implication the source of the risk
event may have on risk management, the analysis of risk management places less attention to
the sources of the risk events, and instead addresses the nature of the risk events via its
characteristics of spread, intensity and predictability.
As it is explained in the present section as well as in Sections 2.3.3 and 2.4.2, the nature of
the risk is important as it influences the wideness of exposure, the intensity of the impact as
well as the capacity to deal with its consequences. However, beyond a general account of the
importance of risk nature, its effects into household vulnerability and household risk
management are not explicitly approached. This investigation is concerned with the
implications a lack of attention towards the nature of the risk may have on the
understanding of risk management.
There are two interconnected reasons that may explain why the nature of the risk events lies
on the periphery of risk management analysis and other related topics, such as household
vulnerability. The first reason concerns is about the lack of information on risk events as it
is difficult to collect and therefore scarce. This lack of available information has led
researchers to proxy shocks by factors other than their causes. Risk events are often proxied
by residuals obtained from actual income and some measure of permanent income (e.g.
Kochar, 1995; Jalal Ravallion, 1998 ); and also from the variability of change of impact
indicators such as earnings, income, assets, returns to labour, yields per unit of land, prices,
labour, etc. (e.g. Townsend, 1994, 1995; Kinsey et al., 1998). At other times, when information
is available, the shocks are proxied either by year and location dummies that estimate the
distribution of village level shocks, differentiating between bad and good years, or by the
shocks themselves, crop failure, rainfall variability, etc. (e.g. Dercon and Krishnan, 2000a;
Paxson, 1992). However, even in these cases where there is detailed information about the

89
shocks, the analysis does not distil information about the cause-related issues households care
about when they are exposed to a particular risk event.
The second reason explaining the lack of relevance of the nature of the risk events has to do
with a general portrayal of risk events as exogenous (Duffield, 1994). This assumption comes
from the general perception that while the causes of the risk are beyond human influence,
their effects, i.e. the outcomes, can be influenced. However, if this proposition may apply in
some contexts, it may not in others, for example during armed conflicts. According to the
complex emergency approach, the conflict-produced risk are produced and influenced by
human actions, and therefore they need to be portrayed as endogenous. Prior to the
discussion about the implications of this into the analysis of risk management in the context
of armed conflict (see Sections 2.3.3 and 2.4.2), it is interesting to consider how much the
risk management framework for developing countries is shaped by this assumption of
exogeneity. The following three aspects describes that:
- The lack of relevance given to the risk event nature, particularly its source, has
allowed equating risk management behaviour of households in different context
settings, such as natural, economic or political crises. Since most of the knowledge on
risk management is drawn from the context of natural or economic crises, this is
used as the standard framework to understand risk management. For instance, the
consequence of the dearth of understanding of risk-related behaviours in conflicts has
made existing studies into risk and livelihood equate these behaviours with risk-
related behaviours in the context of other risk events, or has even ruled out any
rational risk management behaviour in the context of conflict. The implications of
this can be well illustrated in the policy making during armed conflict. For instance,
in the situation of the oPt, as if it were an economic or a natural crisis, researchers
and policy-makers portray risk events as transitory and exogenous shocks and
emphasize the ex-post over the ex-ante risk management mechanisms and use the
former as predictors of households’ vulnerability. This type of approach contributed
to the lack of recognition of the process of territorial fragmentation (Le More, 2005).
The aid programmes and policies, in spite of the proven causality between the
occupation instruments, particularly movement restrictions and the Wall, and the
90
raising poverty rates in the oPt, leave the causes out of the picture and instead define
households vulnerability as a purely economic failure.
- In certain contexts, for example during armed conflicts, addressing the nature of the
risk event by its spread, predictability and intensity may not reflect some aspects
related to the causes of the risk event which the households care about when dealing
with risk such as the timing, avoidance margin, competing set of objectives to trade-
off, options available, etc. As the CE approach well notes, despite the fact that studies
on risk management, particularly those on coping strategies, has informed policy
debate on proactive responses taken by people exposed to armed conflict, the studies
fail to recognise the underlying power dynamics; as some coping strategies may
involve the transfer of assets away from those in distress (Duffield, 1994). Simply
portraying risk as exogenous allows to set aside the causes and address the strategies
from symptoms.
- Assuming risk events to be exogenous favours a restrictive view of risk. For example,
famine is viewed as an ‘economic disaster’ that imputes the root causes of its
vulnerability to a decline in income and purchasing power of the rural communities
without apportioning any cause to the risk events themselves. The exogeneity
explanation was firstly implicitly raised by Sen in his understanding of the famine in
Ethiopia The entitlement approach of Sen (1981) states that vulnerability to famine is
largely attributable to one’s ability to command food through all legal means, and
that such ability is determined by one’s ownership of tangible assets and the rate at
which one can exchange these for food. As the determinants of the entitlement are
only confined to economic factors, risk events are implicitly considered exogenous to
the entitlement model and exposure to risk events is generic across households, while
relative poverty is the effective variable that would explain the differential household
vulnerability across households and community groups. By saying that vulnerability
to famine is the result of relative poverty and/or failure of households to use their
ability to avoid it, Sen favours a restrictive view of famine as an economic disaster
(Devereux, 2001; De Waal 1990) that imputes the root causes of vulnerability to
poverty and market forces (Keen, 1994). Influenced by Sen, the different approaches
to risk management explaining the phenomenon of survival during armed conflict
91
neglect the issue of power, as they consider only the victims of famine, and focus
mostly on assets.
Motivated by this debate on the exogenous assumption and in order to assess the importance
of the nature of the risk event on household risk management, this research puts forward the
hypothesis that both risk management determinants and household responses to anticipated
and actual losses associated with the risk events and outcomes produced by socio-political
risk events such as wars are not necessarily the same as those produced by natural or
economic society-wide risk events. The exploration of the hypothesis takes place in three
steps: i) next section on armed conflict analyzes how the specific characteristics of conflicts
might unfold into the analysis of risk management; ii) Section 2.4 discusses the relevance of
these specificitites through an analysis of the emerging literature on risk managmenet in
context of armed conflict; iii) finally this analysis is complemented in Chapter 4 by a
detailed exploration of risk management in the context of the oPt.
2.3 Understanding Armed Conflict and Conflict-produced Shocks
The overall aim of this section is to introduce the issue of study, household risk
management, in the context of armed conflict by illustrating the specific features of such
political-social risk events and identifying the implication of some of these characteristics in
the analysis of risk management. In order to achieve this objective, the causes and effects of
war are discussed and their characteristics portrayed. While the exploration of the causes and
effects of armed conflict is mostly carried out from an economic perspective, the general
characteristics of armed conflict have been drawn from a political economic approach. Prior
to this, this section briefly describes conflict and some aspects of its research.
Violent conflict is a ‘struggle, between individuals or communities over values or claims of
status, power and scarce resources, in which the aims of the conflicting parties are to assert
their values or claims over those of others’ (Goodhand and Hulme, 1999: 14). Since violent
conflict occurs in all societies at all times, wars are distinguished from crime by their
magnitude, the fact of challenging the government’s authority and the motivating factors,
etc. In this sense, we are presently interested in armed conflict or militarised violence, i.e.
92
‘mass violence instigated through collective action’ (Brück et al., 2005 cited in Justino, 2007:
2).
However, beyond this general definition, armed conflict is not a homogenous phenomenon.
Armed conflicts are a multi-dimensional phenomenon varying in magnitude (scale, duration
and intensity), geographical scope (international and internal), the nature and extent of
foreign intervention and the technology adopted (Stewart and FitzGerald, 2001).
International humanitarian law refers to two different types of conflict: international and
non-international. International armed conflict usually refers to any conflict arising between
two or more countries, even if the state of war is not recognised by one of them; it includes
the cases of partial or total occupation of the territory even if the said occupation meets with
no armed resistance and those cases of ‘internalized armed conflicts’, where the state
intervenes with its armed forces on the side of another state in a non-international armed
conflict97. Armed conflicts of a non-international character are, in short, similar to an
international war, but take place within the confines of a single country. This refers to those
armed conflicts where protracted armed violence between governmental authorities and
organized armed groups or between such organized groups themselves occur within a State; it
also includes those where non-state armed groups are engaged in protracted violence with a
state and are operating from across international borders98.
Most of the literature on the causes of armed conflict focuses on non-international armed
conflicts, particularly on civil wars involving significant foreign intervention, because these
have been much more prevalent among poor countries in recent years. Stewart and
FitzGerald (2001) prefer to refer to this type of armed conflict as ‘internal wars’, i.e. ‘any
conflict where there are some groups on different sides within a nation, even though other
nations may also be active participants’. As Duffield (2001) argues, most conflicts and
protracted political crises today do not occur between sovereign states but are of an internal
or regionalized type. In any case, it is difficult to draw a clear line between internal and
international conflict, since foreign countries often take a strong role in internal conflicts
(e.g. Afghanistan, Iraq, oPt, Nicaragua, Vietnam, Korea, Mozambique, etc.). Towards the end
of the Cold War, ‘low-intensity wars’ emerged with strong foreign logistical, financial and
97 General Provision of the Geneva Conventions Article 2. 98 General Provision of the Geneva Conventions Article 3.
93
political support for local opposition groups. The term ‘low intensity’ refers to the decision
of the major powers not to commit their own troops rather than any lack of human
suffering on the ground (Halevi, 2000); indeed it involves the deliberate destruction of the
opponent’s military capacity and, most importantly, the means of livelihood of opposing
forces, i.e. economic and social infrastructure, in order to reduce popular support, which
clearly increases the human cost of conflict. Such wars tend to involve bigger international
divisions, since foreign parties support and enhance local divisions; while nationalist and
liberation objectives are an important motivation among the local population, geopolitical
considerations motivate foreign sponsors (Stewart and FitzGerald, 2001). Thus, taking into
account the great role that foreign countries play in ‘internal wars’, Keen suggests broadening
the definition of war to disregard the issue of states. According to Keen a war is a ‘sustained
infliction of violence between two or more organized groups’ (Keen, 2001).
The study of war has been characterized, over a long period of time, by a kind of ‘mental
block’, which Keen (1998) refers to as a ‘black box’. Wars are not easy to study ‘up close’ and
their study often requires a change in a discipline’s main approaches. For example, as Keen
(1998) argues the analysis of war presents difficulties for economists within a classical
tradition because markets are unlikely to work smoothly in war time, and many of the usual
tools for analysis are of dubious value. The concept of ‘market forces’ may itself be rather
unhelpful in explaining how a particular economy works during the period. Not only are
markets severely disrupted and disintegrated, but the concept of market forces omits the
importance of outright theft, or the transfers of assets away from those in distress as well as
the key role of violence in shaping the way that particular markets work (Keen, 2001).
Regarding the causes of war, two models tend to ‘elbow out’ both political and economic
analysis (Keen, 1994). The first model depicts war as essentially chaotic, in the sense that war
is largely an incomprehensible eruption of violence, where normal life comes abruptly to an
end while anarchy or mindless violence prevails. The second model is bureaucratic99, which
believes that war is declared and the processes of violence follow more or less automatically
with violence largely restricted to the competing military forces and focused on the tactics,
movement of troops, the victors and the defeated.
99 This model is applied particularly, through not exclusively, to inter-state wars.

94
It was with these concepts of war that the famines in the Horn of Africa during the decade
of the 1980s were approached. As has been discussed, war and violence were basically
marginalized from the study. In Drèze and Sen’s words ‘it would be a particular mistake to
relate the causation of famine to violations of legality’ (Drèze and Sen, 1989: 22). Similar
omissions can be found in the thinking about development. Stewart (1993) makes the
important point that the World Bank and the IMF have failed to design policies that take
full account of the realities of war.
During the 1980s and particularly the 1990s there have been important contributions to the
understanding of armed conflict. Firstly, analytical work was carried out in different
disciplines on how conflict impacts upon politics, economies and societies100. Secondly, the
complex emergency approach emerged with a focus on the political economy of war,
analysing the production and distribution of power, wealth and destitution during conflict,
in order to explore the motives and responsibilities of those involved101. Thirdly, these two
trends have encouraged the study of the causes, whose interest was initially minor,
particularly to economists, by the portrayal of the causes of war as development malaise
(temporary), breakdown between groups (irrational) or as a return to ancient animist
behaviours (backward). The debate on the causes of war has significantly developed.
Nowadays, some of the issues at stake are the polarization of the causes of conflict (greed vs.
grievances) as well as the increasingly-accepted connection between conflict and criminality
within aid policies (Duffield, 2001). An illustration of this is the World Bank 1999-created
research programme named ‘The Economics of Civil War, Crime and Violence’.
On a general basis, such debates on the causes, effects and characteristics of conflict are
characterized, as is the rest of the social scientific research on conflict, by a lack of multi-
disciplinary and micro-level analysis. Regarding the former, social scientific research is
founded on unrelated disciplines, which rarely exchange their opinions and experiences.
Since wars are complex phenomena that are extremely difficult to analyse by one discipline,
or to attribute to one or a few factors in isolation from others, Keen (1998) recognises the
need to look at armed conflicts holistically. Secondly, there is a need for sub-national, 100 Some examples of this literature are the following: Stewart (1993, 1997), Stewart and FitzGerald (2001), Carbonnier (1998), Cliffe and Luckham (1999), Luckham et al., (2001), Cliffe and Rock (1997), Singer and Small (1994), Gupta (1990), Harvey (1998), Goodhand and Hulme (1999), Macrae et al. (1997) and Richards (1996). 101 Duffield (1991, 1994), Keen (1994,1998), De Waal (1989, 1990, 1997).

95
community and household level analysis (Justino, 2007; Stewart and FitzGerald, 2001). As is
illustrated in the analysis of the causes and effects of conflict, social scientific studies into
conflict have been dominated by macro- and meso-level. For example despite the usefulness
of the complex emergency approach to distil conflict into terms of the causes and costs, they
are not able to capture the micro-level dynamics, i.e. how conflict affects the community and
individual livelihoods. Micro-level examination of armed conflict has grown significantly in
recent years and evidence is starting to accumulate102.
This research aims to contribute to the micro-level understanding of armed conflict by
focusing on how households deal with the anticipated and actual losses associated with the
uncertain events produced during armed conflict. Before we explore the evidence for this,
this section precedes the discussion on the characteristics of armed conflict and the
implications it may have on risk management by a brief description about the causes and
effects of armed conflict from an economic perspective.
2.3.1 Causes of Armed Conflicts
While economists have long been concerned with the analysis and measurement of the effects
of conflict, their interest in the causes is more recent. As mentioned before the wide range of
research carried out over the last decade has stimulated other views on the causes of conflict
beyond the temporary, irrational and background causes that previously kept economists
uninvolved in the causes of war. This section aims to describe the main views within the
economic discipline on the causes of conflict.
The resource scarcity approach, illustrated by the neo-Malthusian thesis, attributes the causes
of civil war to the pressure of excessive population growth over the environmental resource
base that tends to degrade or even deplete it, with negative impacts on the economy and
social fabric and eventually leading to the destabilization of political structures, which may
lead directly or indirectly to wars (Myers, 1987; Homer-Dixon, 1999). Conflict is caused by
the scarcity of natural resources either by the driving elite to take resources at the expense of 102 For a description of the issues under study see recent research programmes at MICROCON (www.microconflcit.eu) and Conflict-affected households Network (HiCN) (www.hicn.org) for a multi-disciplinary and economic micro-analysis of conflict respectively.
96
the poor, and/or through its debilitating effect on economic and social innovation. However,
this neo-Malthusian view has been challenged by recent evidence. On the one hand, De Soysa
(2000) finds a strong positive correlation between abundance of mineral resources and civil
war. On the other hand, Sachs and Warner (1999) observes that resource abundance leads to
lower economic growth through the so-called Dutch disease103.
A less controversial argument is that of grievance, often referred to as social discontent or
frustration with living conditions. It was first developed by Gurr (1970), who used the
psychological theory of relative deprivation to analyse the physiological and societal causes of
civil wars in the context of the frustration-aggression theory104. According to Gurr, the
primary causal sequence in political violence is first the development of discontent; second
the politicisation of the discontent and finally its actualisation in violent actions against
political objects and actors. Regarding the conditions for ‘grievance formation’, Goodhand
(2001) identified three factors. The first one is historical development patterns: many of
today’s conflict are rooted in the colonial era and failed post-colonial development strategies.
A second factor is the institutional capacity and policies of the state in containing the
grievance and its evolution into violence. Finally, a third factor is international policies as
they contribute to processes which generate exclusion and grievance (political agendas).
A step further in the grievance argument was taken by Stewart (2000) with the introduction
of the notion of horizontal inequalities. This came at a moment where the argument linking
inequality and conflict did not find any consensus105. Stewart argues that rather than vertical
inequalities within groups, it is the horizontal inequalities that exist between groups which
may cause conflict. The inequality, exclusion and poverty produced by uneven development
processes contributes to growing grievances particularly when poverty coincides with ethnic,
religious and territorial inequalities. In fact, countries with a huge majority of small minority
groups have a greater propensity to violent conflict than ethnically diverse countries (Collier,
2000b). In a number of countries, the coincidence of poverty and exclusion from minority 103Dutch Disease implies that endogenous innovation or technical change do not occur in countries with abundant natural resources because these communities become dependent on natural resources and fail to innovate. Abundance of natural resources affects the incentives to allocate capital, labour and technology to other sectors (de Soysa, 2000). 104 According to the frustration-aggression theory, there are three distinguishable psychological assumptions about the origins of human aggression: a manifestation of an innate instinct, an inborn reaction to frustration and a learned social practice responding to particular situation (Gurr, 1970). 105 For a summary of this discussion, see Cramer (1997).

97
groups or majority groups’ boundaries have proved to be a ‘combustible cocktail’
(Goodhand, 2001). Thus, although few have argued that poverty per se, causes conflict,
research points to the extreme importance of horizontal inequalities, as a source for leaders
to mobilize followers and legitimize violence actions (Stewart and FitzGerald, 2001).
However, one of the criticisms of the horizontal-inequalities thesis is that groups are not
homogenous identities and categorizations simply based on ethnicity, religion and other
cultural characteristics fail to capture the complexity and multidimensionality of identity
patterns (Andre and Platteau, 1998).
Research by economists at the World Bank, led by Paul Collier, on the nature of
contemporary civil wars in Africa has prompted a need to revisit the fundamental question
of whether wars are a simple product of grievance and resource scarcity. According to
Collier, wars, ‘cannot be fought just on hopes and hatreds; rebellion is motivated by greed;
the feasibility of predation determines the risk of conflict and therefore war occurs when
rebels can do well out of war’ (Collier, 2000b: 4). The greed explanation emphasises the
‘criminal acquisitive desire’ of individuals and hence the role of lootable rents in producing
inter-group rivalry for their control (Collier and Hoeffler, 1998). Those that support an
economic perspective on the causes of war allege that natural resources provide incentives for
rebel groups to loot and to sustain their activities, hence motivating the greed that causes
civil war. In particular, Collier (2000b) shows through quantitative analysis that proxy-greed
motivated factors outperform the proxy-grievance indicators106. He finds that the causes of
contemporary civil wars are a result of criminal acquisitive desire (greed), triggered by natural
resources and there being many young men and little education, rather than by grievances.
As Duffield (2001) noted, for Collier, even though warring parties usually base themselves on
narratives of grievances, it is greed that is the primary driving force107. Though Collier may
be right to suggest that rebels may be reluctant to acknowledge the degree to which they are
driven by greed, there are equal dangers in suggesting that the expression of grievances tells 106 In Collier (2000b), the economic proxies for greed are the degree to which a country is reliant on the export of primary (i.e. lootable) products; the proportion of young men in the population; and the educational endowment of the society. The economic proxies for grievances are the degree of ethnic or religious fractionalization; the level of economic inequality; the lack of political rights; and the effectiveness of economic management reflected in the rate of economic growth over the preceding five years. 107 ‘I should emphasize that I do not mean to be cynical. I am not arguing that rebels necessarily deceive either others or themselves in explaining their motivation in terms of grievance. Rather, I am simply arguing that since both grievance-motivated and greed-motivated rebels organizations will embed their behaviour in a narrative of grievance, the observation of that narrative does not provide informational content to the researcher as to the true motivation for rebellion’ (Collier, 2000a: 1 cited in Duffield, 2001: 132).

98
us nothing about their real motives. Indeed, as Keen notes, ‘if we do not ask people why they
are resorting to violence or listen to their own accounts of why this might be, we are lost’
(Keen, 2000: 39).
To some, the use of ‘greed’ as the primary and sometimes singular driving force is a moot
point, being used as an excuse to ignore grievance (Goodhand, 2001), delegitimate leadership
(Duffield, 2001) and pay little attention to critical voices from the South. For example,
Islamic groups have been criminalised by having links drawn between them and the drugs
trade (Central Asia) or by having been portrayed as terrorists groups (in the oPt). The policy
response has been to focus on drugs, border control and anti-terrorism rather than by the
conflict-produced poverty and political exclusion. Before legitimising the greed explanation
of conflict, it is a must to study the interactions between greed and grievance. As Keen says
‘we need to investigate how greed generates grievances and rebellion, legitimizing further
greed’ (Keen, 2000: 32). Section 2.4.2 offers a discussion on the links between greed and
grievances at the micro level.
One of the main conclusions of this review of the causes of conflict is that armed conflicts
are complex phenomena that are extremely difficult to analyse by one discipline or to
attribute to one or a few factors in isolation from each other. The divergent views of the
causes of civil war may depend on the level of analysis (macro, meso or micro) and period of
analysis (pre-conflict or during). Most research tends to focus on macro and meso factors
during civil wars. However, there is a risk of ascribing on-going conditions during the civil
war, rather than pre-war conditions, as the causes As Deng (2004) notes, the few studies that
have analysed pre-war situations tend to input the causes to socio-economic and political
grievances that have been generated by the unpopular policies of the elite resulting from
macro and global conditions. Furthermore, during war, it is not surprising to observe
irrational behaviour, economic agendas, ethnicity religious inequalities and greed
determining the period, as a way of sustaining the conflict. In the study of wars, one needs to
be aware that wars are largely caused by various war-producing factors at global, national and
community levels and are equally sustained by various war reproduction factors at macro,
meso and micro levels (Cliffe and Luckham, 2000).

99
It is also possible to remark that these approaches to the causes of war focus on a macro or
quasi-macro perspective, which is not able to deal with individual and group dimensions of
violent conflicts and therefore does not take into account the social dynamics of greed,
grievance or any other inequalities (Justino, 2007). However, as Goodhand (2001) argues,
micro-level analysis is not sufficient unless it integrates a macro-level perspective. Since the
change needs to be systemic, academics and policy-makers have a responsibility to identify
and build synergies between the macro and micro perspectives.
2.3.2 The Socio-economic Costs of Conflicts
Within the economic analysis of conflict in less developed countries, the exploration of the
costs and benefits of conflict are, together with the findings of the political economy of war,
different attempts to fill the vacuum created by the portrayal of armed conflict as irrational,
temporary and backwards. Given our interest in the links between poverty and conflict, this
section focuses on the socio-economic costs of armed conflict at both macro and micro
levels, highlighting the mechanisms through which the costs produce poverty. Generally,
there is some consensus that armed conflict causes poverty. Although this idea is not new,
until very recently, the analysis of the effects of conflict gave mere descriptive accounts of the
overall decline in macro-economic indicators such as reduction in aggregate consumption,
reduction in production, comparative advantages being lost, capital destroyed, etc. Thus, as
we previously mentioned, while during the 1980s and 1990s research contributed
significantly to understanding the impact of conflict on politics, economies and societies, it
was during the late 1990s when the specific links between conflict and poverty were
systematically researched108. Nowadays, it is generally agreed that violent conflict affects the
level of poverty in any given economy. However, there are a number of methodological
issues obstructing the effort to demonstrate this connection. Luckham et al. (2001) identified
three key problems. First, there is a lack of reliable data. When war begins, data is usually
one of the first casualties; and eventually, because of insecurity and uncertainty, data
collection becomes difficult. Second, even where data is available, it tend to be aggregate
country-wide figures but since most conflicts are localized, such data may not provide the
108 For a review of the state of art of the linkages between conflict and poverty see Goodhand (2001), Luckham et al. (2001) and Justino (2007).

100
disaggregation required to analyze the economic and social cost of conflict. Third, is the
problem of establishing the appropriate counterfactuals: What would have been the situation
without conflict? How different are countries torn by war from those without conflict?
In spite of these difficulties, many analysts have clearly demonstrated how conflict is linked
to poverty in a variety of ways. One of the best accounts of the cost of conflict is that of
Stewart et al. (2001) who carried out an analysis of some of the economic and social effects of
war, specifically ‘internal wars’, in 25 countries over the last 25 years. The following table
summaries this work and compares the differences between the expected and the observed
costs.
Table 2.2 : Expected and observed costs
Expected costs Observed costs across 25 countries A fall in GDP per capita
Reduction of export earnings and probably lower inputs
A lower investment ratio and savings ratio
Reduction of government revenue and expenditure
A higher budget deficit and an aacceleration of inflation
A shift from economic & social government expenditure to
the military
A shift from tradable to non-tradable supply
A shift from marketed output to subsistence production
A shift from formal to informal sectors
A reduction in the average level of market and public
entitlements
An increase in direct, extra-legal and civic entitlements
Changes in both vertical and horizontal entitlement
distribution
A fall in GDP
A fall in food production
A fall in exports
A fall in consumption and food availability per capita
Insecurity, migration and deaths deteriorating human
well-being. A severe deterioration in calorie and doctor
availability per head and an increase in infant mortality
produced by the changing entitlements
Migration and/or destruction of existing capital of all
kinds
A deterioration of human capital stock because the
reduced level of investment (public and private), reduced
allocation of government expenditures to economic
services and lower school enrolments
Source: Stewart et al. (2001)
As can be observed from Table 2.2, the effects of war observed across 25 countries over a
period of 25 years do not always match the expected costs. Although it is difficult to
disentangle what is the effect of conflict and what is the result of wider processes of social
change (Cliffe and Rock, 1997), Stewart et al. (2001) argue that the outcomes of conflict are a
combination of the immediate consequences of the conflict and the reactions to these direct
effects at both the macro and micro level. Regarding the former, the differences found
between the expected and real outcomes across countries are the product of the nature of the

101
conflict, government structures and capacity, which are themselves affected by the conflict.
At the micro level the capacity to find alternative activities was important in sustaining
livelihoods. Although the study could not address the extent of household livelihood
activities – e.g. subsistence agriculture and the informal sector – it recognises its importance
in bearing the impact of the conflict. In fact, it is thought that the effects of conflict on
human indicators, being relatively moderate, are a reflection on human resilience in severely
adverse circumstances. However, generalizations about the impact and the implications of
conflict for individuals and livelihoods should be treated with caution as war may cause
some positive effects on society and on certain individuals that accumulate wealth. As a
result of the radical changes in the allocation of resources and activities among sectors and
institutions as well as among households and social groups spurred by war, a small minority
of people, the so-called ‘winners’, often acquire a vested interest in the continuation of
conflict, while the mast majority, the ‘losers’, slide towards poverty109.
The effects of conflict on the structure and performance of the whole society in all the
above-mentioned dimensions contribute to the mechanisms through which conflict produces
economic poverty. The following table adapted from Luckham et al. (2001) based on their
studies of Stewart and Fitzgerald (2001) and Stewart (1997), describes the impact of conflict
on poverty in the context of sub-Sahara Africa countries.
Table 2.3: Impact of conflict on poverty
Loss of public entitlements
Loss of markets/livelihood
entitlements
Loss of civil/social entitlements
Reverse entitlements & new forms of social
Inequality
Dire
ct
Impa
cts Breakdown of public
order (military, police, etc.) and public infrastructure (hospitals, clinics, schools, etc.)
Destruction/decay of physical capital, communication infrastructure; withdrawal of land and labour force from production
Destruction of social capital (institutions, values, networks) through population displacement
Direct appropriation of assets, land, sources of livelihood from vulnerable groups and displaced populations
Indi
rect
impa
cts
Mac
ro
Growing macro-insecurity of states and regimes. Decrease in state capacity to collect revenue, provide public goods and ensure security. Result – small revenue base and little public expenditure and rising military expenditure to secure the collapsing state
Macroeconomic disequilibria: stagnant or falling GNP, exports, imports; trade, balance of payments and budget imbalances; hyperinflation and exchange rate depreciation; capital flight; increased debt
Shrinking of civil society and the resurgence of primordial rather than more inclusive conceptions of nationhood and citizenship
Rent-seeking by those with access to state and military power, reinforcing macro-economic distortions and undermining capacities of state
109 For a general description of the benefits of war see Keen (2000, 2001).

102
Mes
o
Armed groups compete with the state for control. Government limited to the capital and a few urban centres. Distribution of public goods and services skewed on geographical, social and gender basis
Formal economy gradually replaced by regional and local war economies; high risk; market failures; major disparities between war-affected and other regions
Institutions fail to cope with stresses and dislocations induced by conflict (i.e. refugee influx). Heightened competition for resources and conflict between previously cooperating regions/ethnic groups & communities. Self-help becomes the order of the day
New forms of inequality associated with privatization of violence; bribery and corruption by those controlling weapons, transport routes, food distribution, access to aid
Mic
ro
Civilians at risk from violence, rape, crime, seizure of assets (e.g. cattle). Diminished access to public services, including health, education, policing , etc. and hence higher disease, infant mortality, smaller school enrolments, etc.
Worsening economic conditions: unemployment, income, agricultural production, women become breadwinners and men become soldiers
Local communities weakened or destroyed; existing safety nets and coping mechanisms insufficient or broke down. Proliferation of vulnerable groups (refugees, displaced, female-headed households, orphans, HIV victims, etc.)
Heightened insecurity and exploitation of vulnerable groups. Increased gender violence. Emergence of new groups formerly dependent on war for sustenance.
Source: Luckham et al. 2001
Regarding the direct and indirect effects of conflict on poverty Justino (2007) notes that
while the latter have been much studied, there is very little evidence of the former. According
to the table above this includes changes in household composition due to the use of violence
(deaths, injuries, disability, physiological damage, etc.) and changes in economic status due to
the looting and destruction of assets and livelihoods, population forced displacement and
lack of mobility. Using the Table 2.3 and Justino (2007), the following description briefly
details how poverty results from the economic, social and human as well as the displacement
effects of conflict. Understanding these mechanisms is particularly relevant in the analysis of
risk management of households during armed conflicts (see Section 2.4).
Poverty-related Human and Social Effects of Armed Conflicts
One of the primary poverty-related human costs of conflicts is the loss of livelihood
produced by the loss of human lives, injuries, disabilities, traumas, fear and distress
(Goodhand, 2001). Besides the reduction in human capital by these direct effects of war,
human capital is indirectly reduced by the decrease in earning capacity due to the loss and
incapacity of household members of working age (Justino and Verwimp, 2008). As detailed in
Section 2.4, insecurity leads to changes in household preferences; favouring the depletion of
human capital by reduction in the investment in schooling and hence contributing to the
long-term ability of households to escape poverty (Deininger, 2003; Shemyakina, 2006). In
addition, insecurity leads to low-risk low-return investments, which lead to lower average
incomes and a higher income gap relative to asset-rich households (Bundervoet, 2007).

103
Finally, these effects can be accentuated by the impact of conflict on health outcomes such as
injuries, disabilities, severe traumas and distress, which are in turn aggravated by the
breakdown of health and social services (Stewart and Fitzgerald, 2001).
An important effect of conflict is the destruction of social capital; particularly bonds of trust
within communities, relationships of reciprocity, shared social norms and rules and social
networks, which Cliffe and Luckham (1999) refer to as ‘a subtle corrosive impact of
conflict’’. However, at the same time, while civil society is undermined and contested, it is
often simultaneously an important source of support (Harvey, 1998). There are examples at
the macro/meso and micro110 levels of community relations and norms strengthening during
conflict. Despite attacks, and attempts to control and subvert them by warring parties, civil
social institutions and organizations can continue to exist and indeed to thrive at a local
level. Harvey’s study on Somalia summarises this mixed picture by tracing five inter-linked
processes affecting civil society during armed conflicts: i) There is an extreme process of
disengagement of civil society from the state, which has led to a retreat into a parallel
economy (subsistence and/or black market); ii) the traditional structures and authority as
well as primary groups within civil society based on kinship, tribal and religious (the so-
called bonding social capital), as well as traditional political structure has regained force as
familiar bases in which people seek protection from the instability, state collapse or the
arbitrariness of state channels; iii) military strategies, extreme scarcity and displacement serve
to undermine civil society by destroying the social fabric, and more specifically reciprocal
and exchange networks and by creating a vacuum of mistrust; iv) predatory local authorities
continue to contest the space of civil society, moving into the parallel economy and
attempting to create support by drawing on neo-patrimonial ties based on ethnicity; v) there
is continued strength of civil society at a local level, both in the parallel economy and in
traditional institutions.
Poverty-related Economic Effects of Armed Conflicts
110 For a macro-level analysis of community relationships see Wickham-Crowley (1991), Goodhand et al. (2000) and Harvey (1998). Micro-level evidence can be found in the studies by Korf (2004) and Colleta and Cullen (2000).

104
Conflict increases insecurity because of asset loss and livelihood disruption. As it has been
discussed, households living in insecure socio-economic environments have to use their
resource endowments to deal with anticipated and actual losses associated with uncertain
events and outcomes. Frequent and intense negative shocks exhaust the asset base (Deaton,
1997), make them less and less effective (Devereux, 1993a) and strengthen the relationship
between consumption and production/investment choices (Morduch, 1995), what in truns
leads to low-risk low return investments and therefore to lower average income and higher
income gaps relative to asset-rich households (Dercon, 2000). However, unlike other risk
events, armed conflict destroys the household’s asset base and constrains risk management
strategies, which increases the devastating effects of this type of risk events and renders the
population more vulnerable (Le Billon, 2000).
As it is illustrated in Table 3.3, regarding the loss and disruption of assets and livelihoods the
effects of conflict are comprehensive (De Waal, 1999) as both tangible (land, households,
livestock, etc.) and intangible (customary rights and rules of usage, community insurance
arrangements, etc.) are lost or destroyed. At the community level, social services and
infrastructure are destroyed as well as public and private investment reduced. Population
displacement also imposes a heavy burden by cutting off the people from their habitats,
limiting the ability to generate income and to rely on others (Justino, 2007).

105
Furthermore, access to assets is blocked. Loss of human life or displacement, as well as the
increase in insecurity and mobility restrictions, constrain household access to livelihood
(employment, earnings, social networks, religious sites, etc.) and the ability to use risk
management strategies to bounce back. Due to the decline in employment and real wages,
with the losses of production and rising inflation markets, entitlements decline. Public
entitlements to social services generally fall as levels of government expenditure are curtailed
and welfare share decreases. Civic entitlements provided by the community or NGOs may
rise to offset the fall of other entitlements in contexts where civil society remains effective;
but where the society itself disintegrates, they too are sharply reduced (see below). Due to the
decline in market and civic entitlements and the collapse of public services, there is a lack of
options available. This forces households to increase their direct entitlements and return to
self-sufficiency limiting their livelihoods to subsistence (Brück, 2004; Korf, 2004) and
alternative forms of entitlements provided by an informal economy (Young et al., 2002),
emerging social networks (Colleta and Cullen, 2000) as well as humanitarian and
development agencies (Le More, 2008; Hanafi and Tabar, 2005).
To conclude, similar to the differences noted by Stewart and FitzGerald (2001) in a macro
comparative assessment across countries, there are differences in the magnitude of the
deterioration at the household level. The impact of the conflict on the households’ welfare
depends on macro- and micro-level factors such as the structure and performance of the
overall economy111, the level of compensatory action by national governments and/or the
international community112, the nature of armed conflict (Stewart and FitzGerald, 2001) and
conflict-produced shocks as well as the households’ strategies and adaptability (De Waal, 111 According to Stewart et al. (2001) economies are worst affected by war when the average income is low; the tax base is low or dependent on a few key sectors; essential commodities are imported and must be paid from export earnings, which can be badly compromised by devaluation of the local currently, economic sanctions and a drop in the exports prices; there is little flexibility in the economy to substitute for imports and for the destruction of the key productive capacity; there is a high dependence on markets and thus on transport and on financial systems. 112 The state may play a critical role in protecting its citizens from the various economic and social costs of conflict. Much depends on the capacity and commitment of the government to poverty alleviation. Since the government structure and capacity are themselves affected by conflict, the state is reshaped by conflict. In extreme cases, war leads to state collapse. In other cases democratic institutions and processes are corroded as a result of the systematic distribution of power, wealth and status to military action. A failing state may become increasingly criminalised (Goodhand, 2001). External intervention also plays an important role and may aggravate or mitigate conflict and poverty. For example, economic conditions can undermine the capacity and legitimacy of the state, which is forced to cut back on social services (Stewart and FitzGerald, 2001). Aid may undermine social contracts between states and citizens (e.g. De Waal, 1997), fuel the war economy (e.g. Anderson, 1999) or it may exempt the state of its responsibilities and prolong the crisis maintaining people on the edge (e.g. Shearer, 2000).

106
1994). Out of these factors, this research is interested in the relationship between household
risk management strategies and the nature of the armed conflict. A discussion of this
relationship is included in Section 2.4 and Chapter 4. Preceding this exploration is the
identification of the specific characteristics of armed conflict and how they generally unfold
into the analysis of risk management.
2.3.3 The Source-related Characteristics of Armed Conflicts
Unlike the simplistic approximation to risk events carried out by the different approaches to
risk management and household vulnerability to famines in the 1980s and 1990s, armed
conflict is a multi-dimensional and multi-layered dynamic process, which is endogenous,
dynamic and structurally embedded in society. While social scientists have examined the
rationale for armed conflicts and its characteristics, there have been few systematic attempts
to link them to household risk management strategies. Therefore, in order to take the debate
about the characteristics of armed conflict to the micro-level, this section aims to describe
some salient features of armed conflicts and identify general implications for the analysis of
risk management in conflict-affected households.
Political economic analysis of conflict, particularly the complex emergency approach, has
provided a rich understanding of the politics, economics and societies of conflict-affected
countries taking into account the production and distribution of power, wealth and
destitution (Le Billon, 2000). The roots of the CE approach lie in the inadequacies and
limitations of the entitlement and food security approaches in the understanding of
reactions to political conflicts, particularly to complex political emergencies (Duffield, 1994).
The main proposition of this framework states that all disasters have winners and losers, with
famine resulting from the conscious exercise of power in the pursuit of gain or advantage,
often illustrated in the transfer of assets from the weak to the politically strong through
sectarian and counter-insurgency warfare activities. Once power dynamics are taken into
account, we see how the real roots of vulnerability to famine lie less in a lack of purchasing
power within the market, as previously suggested, than in a lack of access to the means of
power, political representation and lobbying opportunity.

107
Based on the findings of the CE, the following discussion illustrates certain aspects of armed
conflicts which may be relevant in the understanding of the effects of armed conflict on risk
management in conflict-afflicted households.
- Conflict is multi-dimensional. From the previous description on the effects and
causes of conflict, we know that conflict-produced shocks are multi-dimensional and
multi-layered. Frequently we are not talking about ‘a conflict’ but an extremely
complex, multi-layered conflict system in which a number of different conflicts
interact with one another (Duffield, 1994). Addressing armed conflicts requires,
according to Keen (1998), on the one hand, analytical work which goes beyond the
identification and isolation of risk factors, e.g. poverty, and tries to understand the
types of configurations and patterns that are more or less likely to lead to violent
conflict. On the other hand, it requires a multi-levelled policy aiming to influence
both short-term and long-term incentives and target structures, actors and conflict
dynamics.
- Conflict is dynamic. Addressing the short and long-term incentives and, in general,
the conflict time dynamics we need to bear in mind that conflict does not occur in a
linear manner, where conflict and peace represent opposite ends of a continuum, but
rather coexist in different degrees of intensity (Keen, 1994). Conflicts are rarely a one-
off shock and often result from slower structural processes of social disintegration
(Justino and Verwimp, 2008). Within the dynamics of conflict, households affected
by conflict often find themselves responding, acting and being affected by stages in
between and must therefore adapt their livelihoods Furthermore, conflict is
embedded in society and cannot be separated from ongoing political, economic and
social processes. It is tempting to believe that war follows the three-stage model of
causes-war-consequences, where its causes and consequences can be separated and
easily attributable. Mainstream analysis often tends to regard or treat conflict as if it
had a concrete or material existence, which can be detached from society and can be
‘impacted upon’ and influenced by external agencies, in isolation from other
processes (Duffield, 2001). Conflict is so much embedded in society that the
economic and political processes that operate in wartime contribute to the course of
the conflict erasing the links with the original motives and effects (Le Billon, 2000).

108
Therefore, Goodhand (2001) argues that an analysis of causality becomes decreasingly
relevant as addressing the original sources of grievance is unlikely to address the
conflict dynamic. In order to address the dynamics of change the transformation of
the effects during the life of the conflict need to be studied.
- Conflict is transformative. Conflict is not the irrational, temporary breaking down of
societies and economies; rather it is the re-ordering of society in particular ways (Keen
1994). Once violent conflict emerges, it transforms itself and all around it – the state,
livelihoods, national economy and social relations (Cliffe and Luckham, 2000). War
doesn’t necessarily lead to either a complete cessation of ‘normal life’ or a complete
breakdown in economic and political systems; rather, it is likely to modify and
distort ways of living (and ways of making a living) that are already in place. Related
to the transformation of society during conflict is the debate about whether conflict
is viewed as a social regression or, in contrast, as a system of social transformation.
Indeed, there is a distinction between seeing conflict in terms of having causes that
lead mechanically to forms of breakdown, as opposed to seeing them as sites of
innovation and reordering, resulting in the creation of new types of legitimacy and
authority.
- Conflict is endogenous. One of the most important and unique characteristics of the
phenomenon is its deliberate threat to self-sufficiency (Duffield, 1991; De Waal, 1990;
Keen, 1994). As Duffield (1994) describes it, like natural disasters, conflicts damage
social services, market networks and agricultural enterprises while at the same time
increasing demands for the essential services they provide. Unlike natural or
economic disasters, armed conflicts violate systematically and deliberately individual
and group rights to reproduce and secure an adequate livelihood by eroding and
destroying the political, economic, social and environmental systems as well as
blocking and manipulating the responses to deal with the anticipated and actual
losses produced by the conflict-produced uncertain events and outcomes.
One immediate consequence of the systematic and deliberate nature of conflict-
produced shocks is the need to portray risk events as endogenous, i.e. they are
produced and influenced by human action. As previously described, the explanation

109
of exogeneity was first implicitly raised by Sen (1981) in his understanding of
vulnerability to a decline in income and purchasing power of rural communities
without apportioning any cause to the risk events themselves. As the determinants of
the entitlement are only confined to economic factors, risk events are implicitly
considered exogenous to the entitlement model and exposure to risk events is generic
across households, while relative poverty is the effective variable that would explain
the differential household vulnerability across households and community groups.
Sen’s exclusion of risk events has been questioned. Watts (1991) argues that this
omission is a deliberate way of avoiding engagement with the highly-politicised
context within which famines invariable occur. However, Devereux (2001) further
notes that the entitlement approach seeks to analyse how famines happen rather than
why they happen; and this focus could explain why Sen excludes the main
characteristics of civil war from the entitlement approach. Indeed, although the
general proposition states that a person starves either because he/she does not have
the ability to command enough food or because she does not uses his/her ability to
avoid starvation, Sen’s approach focuses analysis on the former.
The inadequacy of the entitlement and food-security approaches to explain the
survival of households in the context of armed conflict has been addressed by the CE
approach, whose main initial contributors - Keen, De Waal and Duffield - developed
this alternative with the overall aim of exploring reactions to political conflicts taking
into account the power dynamics inherent in conflict-produced risk events. This
approach was inspired by Rangasami’s definition of famine as ‘an oppressor process
during which pressure or force (economic, military, political, social, psychological) is
exerted upon the victim community, gradually increasing in intensity until the
stricken are deprived of all assets including the ability to labour’ (Rangasami, 1985:
1749).
The CE approach contributed enormously to the unravelling of important characteristics of
armed conflict. As described, armed conflicts are multi-dimensional, complex, dynamic,
transformative, embedded in society and endogenous. However, in spite of the key
contributions of this approach in unpicking the unique and intrinsic characteristics of

110
political crises such as armed conflict and its conflict-produced shocks, CE analysis does not
extend to the micro level and therefore fails to explain how these above-mentioned pressures
unfold and are responded to by households.
A starting point in analysing the characteristics of armed conflict and their effect on
households could be to identify the implications of portraying risk events as endogenous in
the study of risk management. Thus, based on the analysis of risk management of
households living in developing countries and the characteristics of armed conflicts, this
research has identified the following three general implications.
- Risk events are place at the centre of the analysis of risk management. If the assumption
of risk events as exogenous has allowed labelling risk in a generic manner, blurring the
risk dynamics and how it unfolds at community and household levels, then assuming
risk events as endogenous has the reverse effect which is to put them at the centre of the
risk management process. This means that both external and internal sides of the
household vulnerability – risk events and household responses - need to be studied within
the context of their immediate causes.
- Risk events are addressed by their causes. Studying risk events within the context of their
causes means that they cannot be integrated into the analysis only by the characteristics
of spread, intensity and predictability. Addressing the nature of the risk events by these
characteristics does not reflect many source-related aspects, which are important for risk
management in the context of armed conflict. In this sense, the nature of the risk events
needs to be studied beyond the above-mentioned features and be understood by the
specific source (e.g. use of violence, asset looting, movement restrictions, economic
embargoes, etc.) and intrinsic characteristics (endogenous, multi-dimensional, dynamic
and structural factors) taking into account the general objectives of the conflict (ethnic
cleansing, economic subjugation, land occupation, etc). The nature of the risk is
important as it contains information the households care about when managing the risk
- such as the specific causes, the timing, avoidance margin, competing set of objectives to
trade-off, options available, etc. – and also because it influences the breadth of exposure,
the intensity of the impact as well as the capacity and possibilities to deal with its
consequences.
111
- Household responses are understood within their causes. In the context of exogenous risk
events the risk management framework, particularly the food security approach, sets the
vulnerability of households based on the symptoms. If risk is seen as endogenous, a
categorization of household strategies cannot be carried out independently of the causes,
as these provide information about the dynamics of power between the strategies of the
conflict-produced shocks and the strategies of the conflict-affected households. When the
strategies of the conflict-affected households are examined through the strategies of the
conflict-produced risk events, one needs to bear in mind the specific nature of the latter.
Unlike other types of risk events, armed conflicts systematically and deliberately destroy
household and community asset base and block responses. This fact establishes a
particular link between the strategies and the risk events and may make them inter-
dependent. For example, as Harvey notes in Somalia, civil society’s attempts to disengage
from state and retreat into the parallel economy are clearly contested by warring parties,
whose use of military tactics of exemplary terror rather than random brutality and
meaningless violence seems to attack and undermine social capital and civil society
(Harvey, 1998).
- Household vulnerability is a lack of means and a lack of power. Related to the
understanding of the households’ responses via its causes, is the issue of household
vulnerability. It is often the case where the outcomes of a risk event, say poverty or food
insecurity, are often the outcomes of strategies pursued by armed-conflict winners. For
example, as Duffield (1991) noted the Dinka of Barhr el Gazal in Sudan have been
subjected to extensive cattle raiding and looting from the mid 1980s, which resulted in
famine conditions. The Dinka were subject to these raids not because of their poverty,
but because of their natural wealth in cattle. Their vulnerability to these raids has been
described as part of a long-term process of political de-legitimisation. Another example
showing how political vulnerability manifests itself in displacement and appropriation of
property may be that of the occupation of the Palestinian Territories. While in the
context of exogenous risk events, vulnerability is more associated with the level of assets;
in the context of endogenous shocks, the source of risk needs also to be considered since
it impacts people differently according to its target, whether it is ethnic, location, or
welfare related. When looking into the sources of risks and observing the complexity of

112
power relations and the political dimension of the crisis, vulnerability cannot be
attributed to market or poverty failure, nor characterized as a temporary shock if its
continuation is advantageous to the powerful (Duffield, 1994). Thus, in situations of
armed conflict the vulnerability of a community, household or individual is closely
related to powerlessness, i.e. the political and economic process of neglect, exclusion and
exploitation (Le Billon, 2000). During wars, power and powerlessness determine the
distribution of entitlements among and within different groups. Those who lack power
are unable to safeguard their basic, political, economic and social rights and may find it
difficult to protect themselves from conflict-produced shocks.
Integrating a political dimension to household vulnerability in the context of armed
conflict would help to link the symptoms with their immediate cause. Aid agencies often
uses a humanitarian perspective, which addresses abstract groups of people, who
irrespective of the risk are particularly at risk (e.g. displaced persons, the elderly, etc.) in
order to facilitate external support and the targeting of scarce resources. As Duffield
(1994) notes, in an attempt to go beyond this type of approach, a political-vulnerability
approach recognises that there are some groups more at risk than others and focuses on
the institutional crisis within particular societies and the specific causes of particular
forms of vulnerability. By giving more weight to the causes than to the symptoms it takes
into account the structural nature of armed conflict and the need to focus on advocacy
and the support of institutions.
A first step towards the link of causes and symptoms is to recognise the importance that
conflict-produced shocks may have on household vulnerability. Justino and Verwimp
(2008) studied the impact of civil war and genocide on household income and poverty
dynamics in the 1990-2000 period in Rwanda, i.e. who moved into and out of poverty113.
Their findings at the household level indicate a duality of factors influencing
vulnerability. On the one hand, household and community characteristics – e.g. land
ownership, female-heads, and distance to the market – positively influenced the
113 Unlike the different attempts to analyse the impact of economic (e.g. Rosenzweig and Wolpin, 1993; Townsend 1994; Dercon 2005; McCulloch et al., 2001) and weather (e.g. Paxson 1992; Rosenzweig and Binswanger, 1993) shocks on changes in household consumption and income, the work by Justino and Verwimp (2008) is one of the few attempts to measure the determinants of household vulnerability in the context of armed conflict.

113
probability of falling into poverty; on the other hand, conflict-produced shocks –
property destruction and imprisonment - reduced significantly the probability of
escaping poverty. While addressing household- and community-related characteristics may
reduce the probability of falling into poverty, tackling the shocks-related factors is crucial
to allow households to escape of poverty and break the vicious circle of subsistence.
Other step towards linking the causes and symptoms is to expand the determinants of
risk management of households affected by conflict. This research argues that similarly to
household’s vulnerability in context of armed conflict, the determinants of risk
management can not be attributed just to poverty or market failure since household’s
responses are deliberately blocked by warring parties in an attempt to threat the self-
sufficiency.
The implications of the portrayal of risk events as endogenous is the end of this section,
where the analysis of the causes and effects of armed conflict as well as its characteristics have
prepared the path for the analysis of household risk management in the context of armed
conflict. Once we have analysed the characteristics of armed conflicts and some of the
implications that endogenous risk may have on risk management strategies, the following
section aims to illustrate the situation with examples. Fortunately, evidence at the micro-level
is slowly increasing and there are now a few studies that have analysed the risk management
strategies of conflict-affected households. Section 2.4 focuses on analysing how the
relationship between ‘strategies-shocks’ has been addressed and identifies key elements in the
analysis of risk management in armed conflicts. It is felt that more attention needs to be
paid to the context-specific nature of risks, the capacity of households to manage such risks
and the potential for development aid to bolster household responses without promoting
further conflict.
2.4. Risk Management in Conflict-affected Households
With the overall aim of contributing to the understanding of certain aspects and dynamics
of armed conflict from a micro-perspective, this section analyzes the risk management in the
context of armed conflict. Over the last few years, there have been various attempts to study

114
household risk management and livelihood in the context of conflict. Although research is
scarce and most of the findings are yet to be validated, the available studies offer a good
opportunity to discuss risk management of conflict-affected households. Generally, the
explorations indicate important differences between the risk management behaviour of
conflict-affected households and that observed during other covariate crises such as those of
economic or natural crises. This suggests that risk management is risk-nature specific and
therefore efforts are needed to identify the elements for its analysis in the context of armed
conflict. Since this is an infant area of research, this investigation aims to participate in the
emerging debate by discussing how risk management is being approached and by identifying
key elements for its analysis. This investigation argues that in the same manner that risk
management theory has been adapted to the context of developing countries, where there is
uncertainty and the credit and insurance markets are absent or imperfect, risk management
theory needs to be adapted to situations of armed conflict, where the risk events are
endogenous, multi-dimensional, dynamic and structurally embedded in the society.
In order to analyse current accounts on risk management in context of armed conflict and to
bring forward the specificities of risk management in the context of armed conflict, Section 1
reviews the strategies observed in different conflict areas; Section 2 analyzes the links between
these household responses and risk events characteristics; and Section 3 presents a discussion
on why risk management strategies in the context of armed conflict can be understood as
‘everyday forms of resistance’.
2.4.1 Household Strategies to Conflict-produced Shocks
In the study of armed conflict, considerable attention has been paid to the role of warlords,
or war entrepreneurs, in establishing markets of violence and war economies. This has been
an essential element in showing that wars are not zones of anarchy or outpourings of
irrational behaviour, but that such war entrepreneurs have an interest in sustaining warfare114.
However, there has been much less focus on the analysis of livelihood strategies of civilian
populations in conflict. In contrast to a widespread perception, civilian life does not cease in
114 For a description on the markets of violence and war economies see for example Keen (1998, 2000) and Collier and Hoeffler (1998).

115
war-affected areas. Instead people find ways of surviving, adapting and resisting the conflict-
produced shocks. They have done so primarily through their own efforts and using their
own resources via strategies such as subsistence farming, wage labour migration, localization
of production, services, and trade, household labour supply adjustments, strategic family
alliances, accessing social support, negotiations with armed forces, etc.
Based on recent micro-analysis of conflict, particularly that addressing risk management
during armed conflict, this section describes the mechanisms used by conflict-affected
households to deal with the reduction in household income and consumption produced by
the direct and indirect effects of armed conflict. The objective of the following section is not
to present an exhaustive and systematic revision of risk management strategies of conflict-
affected households; the aim is rather to present a set of strategies, which illustrate the
differences from the risk management strategies observed during economic and natural crisis
as reviewed in Section 2.2.1. The strategies here included have been selected based on various
criteria. On the one hand, they have been the primary objective of this research. On the
other hand, particular attention has been paid to studies that have a micro-level perspective,
illustrating the context of the oPt as well as those which present risk management behaviours
which are different to those that have been observed during economic or natural crises. The
strategies have been categorised into three groups: consumption smoothing, income
smoothing and strategies of violence.
Consumption Smoothing Strategies
As in economic and natural crises, during armed conflicts households adopt a series of
strategies such as using savings, selling of assets and risk-sharing, which spread the effect of
unusually severe or unexpected shocks across time and people. Recalling the discussion in
Section 2.2.2.2 about the relationship between risk management strategies and risk events, we
know that when the shocks are intense and frequent, overall risk management becomes more
difficult since they exhaust the means and the strategies available are fewer and less effective.
Regarding the effects of covariate risk events, while it imposes a heavy burden on the
community and therefore risk-sharing is less effective, it reduces the asset rate of return and
terms of trade making self-insurance through savings a less useful strategy. In addition to the
covariate spread and high intensity of the conflict- produced shocks, they increase insecurity

116
further because of the loss of human lives, the destruction of tangible and intangible assets
and the deliberate blockage of households’ access to their livelihoods.
Taking into account the characteristics of the conflict-produced shocks, out of the wide range
of consumption-smoothing strategies, the following three mechanisms are found of
particular relevance:
- Depletion of human capital: the studies of Shemyakina (2006) in Tajikistan,
Deininger (2003) in Uganda and OCHA (2005a) in the oPt observed among
households affected by civil war a particular depletion of human capital beyond the
straight deaths, injuries and disabilities. In the case of Uganda, Deininger calculated
that an increase of 10% in the proportion of households affected by civil strife in a
given community decreased the investment in schooling by about one year per
individual. More specifically in the case of Tajikistan, school enrolment dropped but
exclusively for girls (Shemyakina 2006). In the oPt between 2003 and 2004 the
percentage of households that send student members to work increased from 3% to
8% (OCHA, 2005a).
- Retaining livestock: an example of conflict-affected-household buffer stock behaviour
can be found in the studies of Bundervoet (2007) and Verpoorten (2007) on livestock
and cattle sales among Burundi and Rwanda farmers respectively. Both tested the
widely-held assertion that sales of livestock play a crucial role in maintaining
consumption following an adverse income shock. As previously discussed, self-
insurance through savings, unlike risk-sharing, can provide an effective insurance
against both idiosyncratic and covariate risk. However, it seems that this does not
apply in the context of armed conflict, or more specifically in conflict-affected
households. Thus, in Rwanda and Burundi it has been observed that while the less-
affected households sold their livestock despite low prices, the households most
affected by conflict (targeted by genocide in the case of Rwanda) did not.
- Risk-sharing: The empirical evidence found about risk-sharing of households in
conflict often comes from studies that approach it indirectly from social capital or
117
civil society perspectives115. These studies reported that in spite of the impact that
covariate and intense shocks may have on risk-sharing and the deliberate target of
social capital – and its manifestations in the form of trust, norms of reciprocity and
networks of civil engagement – risk-sharing is an important source of support for the
households during armed conflict. The social capital reactions to conflict vary by
country and nature of the armed conflict. Generally it is observed a fallback on
group-based networks and families ties (the so-called bonding social capital) and on
traditional political structures, which serve as a buffer for the state collapse. Although
it is argued that the most resilient sources of social capital are the bonding social
capital as they are socially embedded, there has been also bridging formal and
sometimes vertical organizations such as religious groups, local governments and
markets. In addition, Korf (2004) further observes the creation of new social capital,
in this case with political and military power holders. While there are households
that prefer not to become politically involved and their strategy is to avoid trouble
and remain unnoticed, others involved in economic activities that involve spatial
mobility are forced to form alliances and networks with power holders and/or satisfy
the claims of armed factors in the form of taxes or bribes.
Income Smoothing Strategies
As is described in Sections 2.2.1 and 2.2.2, income smoothing risk strategies are adopted in
response to repeated exposure to the same risk and they aim to affect the ex-ante riskiness
and hence the income variability or to reduce the probability that a drop in income will
cause welfare loss. Although risk management is dynamic and the mechanisms are adopted
simultaneously, income smoothing strategies become more relevant in situations where the
households cannot reduce further the impact of the shocks on their welfare and therefore
they need to introduce actions that reduce the variability of the income or the probability of
income shock. Two of the most studied strategies are that of diversification and investment
in low-risk activities. However, since the strategy of diversification loses its potentiality to
115 The following studies observe a strengthening or an emergence of different types of social capital: Pain and Lautze (2002) in Afghanistan; Korf (2004) and Goodhand et al. (2000) in Sri Lanka; Harvey (1998) in Somalia and Colleta and Cullen (2000) in Somalia, Guatemala, Rwanda, and Cambodia. Out of the studies, while Harvey (1998) and Richards (1996) address civil society and armed conflict, Goodhand et al. (2000) and Colleta and Cullen (2000) focus on the relationship between social capital and armed conflict.

118
reduce the variability of income during society-wide shocks because of the covariance of
income sources, households invest in low-risk activities. Furthermore, when a large negative
shock occurs, both household activities and local income earnings are unlikely to be
sufficient and households need to intensify the usual income-based strategies and adopt
additional actions to prevent destitution. However, in context of armed conflicts, the options
for a livelihood are dramatically reduced. Economies become increasingly informalised and
peripheral areas may withdraw from the cash economy completely, retreating into subsistence
and bartering. There is likely to be an overall rise in subsistence activities and a decline in
markets as transaction costs increase. Insecurity and lawlessness lead to a shift from market
based to group-based transactions. On the one hand, opportunities for commercial
production and trade may be severely limited in the war economy because of resource
scarcity, damage to infrastructure, and restrictions on transport and market information, etc.
On the other hand, shortages of goods and the low level of trust among traders can create an
opportunity to profit from rapid small-scale trading in the informal economy. In relation to
the decreasing options and the rise in the informal economy, today's conflicts are
characterised by expanding networks of parallel (illegal) and grey (semi-legal) economic
activities116 (Young et al., 2002).
Thus, taking into account income-smoothing behaviour in risky environments and the
effects of conflict on the economy, a wide range of income-smoothing actions have been
observed among conflict-affected households, such as a reduction in diversification, an
increase in self-sufficiency, investment in high- and low-risk activities, adjustments in
household labour supply and spatial mobility.
- Reducing diversification: one of the primary effects of conflict on income-smoothing
strategies is the drastic reduction in the options available to obtain a livelihood,
which forces the households to choose between non-market forms of exchange and
even consider exiting markets entirely (Brück, 2004). Bearing in mind this lack of
choice and the covariance of income sources, farmers in Mozambique (Brück, 2004)
and Sri Lanka (Korf, 2004) instead of diversifying their income sources as they do in
116 Examples of semi-legal and illegal economy activities are growing opium or khat in Afghanistan (Pain and Lautze, 2002) and smuggling in Uganda (Lecoutere and Titeca, 2007).

119
naturally risky environments (Ellis, 2000), adopt the opposite behaviour, which is
reducing the diversification strategies and confine their activities to a key income
source.
- Self-sufficiency: as a result of the economic squeeze and the lack of options for
livelihoods, households turn to self-sufficiency. Households in Mozambique (Brück,
2004), Sri Lanka (Korf, 2004) and in the oPt (UNSCO, 2005) increase their self-
sufficiency by subsistence activities such as farming. An example of the importance of
subsistence agriculture is that reported in the oPt. Agriculture, which was abandoned
twenty years ago by unqualified workers in Israel, has now become a resilient buffer
against closure. Another way of increasing self-sufficiency is by disengaging from the
cash economy. In the oPt, it was observed how households in an effort to reduce
their market dependence increase their reliance on bartering, in-kind payments,
increase non-waged labour as well as their reliance on social networks (UNSCO,
2005).
- Adoption of low-risk activities: another effect of conflict on income-smoothing
strategies is the reduction in risky activities. Minimizing risky activities is probably
the most widely observed effect in times of conflict, in the run-up to a war as well as
in post-war coping strategies (Brück, 2004). As observed in the presence of economic
shocks, households that predict the occurrence of political violence will tend to adopt
precautionary behaviour by holding a lower risk portfolio of activities in order to
minimize the risk of serious income shortfall, even at the price of a lower average
return. There is evidence of this in Sudan (Deng, 2004), Sri Lanka (Korf, 2004) and
Burundi (Bundervoet, 2007). Overall, households avoid investing in easily-targeted
assets such as livestock, land and houses. In addition, as it is further explained in the
next section, it is worth noting that, contrary to standard economic risk theory,
investment in low-risk low-return activities is found not just among the poor but also
among wealthy households.
- Adjusting household labour supply: related to the strategies of diversification and
reducing risky activities is the strategy of household internal re-organization, which is
also referred to as adjusting the household labour-supply. This strategy is particularly
120
important as it clearly illustrates a duality of objectives of conflict-affected
households. On the one hand, in response to political violence households adopt
strategies to manage their security. On the other hand, in the management of
household economics in order to deal with livelihood disruption and loss,
households rely on their assets to secure income and to manage expenditure and
investment. Thus the strategy of internal reorganization is partly a direct response to
high political risk (managing household security) and partly a rearrangement of
household assets in response to economic degradation (managing household
economics). Examples of this double-objective strategy are found in Sri Lanka (Korf,
2004) and in the oPt (UNSCO, 2005). Since men are primarily vulnerable to
detention and thus are fearful of passing checkpoints, particularly in times of
increased political tension, it is common to observe that women, children and the
elderly are used to work in the fields, sell assets in the markets or any other activity
that requires moving around and passing through controls. In addition, women,
children and the elderly may be required to help or replace, in the case of
unemployment, the adult males in their tasks. The previously-mentioned reduction in
schooling investment observed in Uganda (Deininger, 2003), Tajikistan (Shemyakina,
2006) and in the oPt (OCHA, 2005a) during conflict were partially explained by
labour substitution effects and by security concerns which change the households
preferences towards investment in human capital.
- Adoption of high-risk activities: another income-smoothing strategy observed during
armed conflict is the adoption of high-risk activities. Unlike in other risky
environments, during armed conflict not everyone is able to or wants to minimize
the risk in their actions. As mentioned in Section 2.2, investment in high-risk
activities was reserved for those households whose assets can allow a risk-taking effect.
In Mozambique, Brück (2004) observed that households near the absolute survival
threshold are risk-takers in both an implicit and explicit manner. Households
implicitly become risk takers when they reduce diversification strategies and deplete
their asset base. Furthermore, there are households, who explicitly adopt high-risk
actions. However, there are reasons to think that in the context of armed conflict the
adoption of high-risk activities may not be necessarily reserved for the asset-rich or
the households close to the survival threshold. For instance, in the context where

121
livelihood options are dramatically reduced and the risk impregnates life, it can be
difficult to choose a low-risk activity: the only viable options available may be high-
risk activities. In the oPt, there are various examples of this risk-taking behaviour,
which, unlike in Mozambique, is observed among both better and worse-off
households. Thus, Palestinians, at the risk of detention, often access restricted areas or
routes for working, fishing, agriculture and education without the required permit
(World Bank, 2004a; Lein, 2004); at the risk of demolition, Palestinians construct
their habitats without licenses (OCHA, 2008; Margalit, 2007); at the risk of their
residence not being renewed or their re-entrance to Israel being rejected, Palestinians
often leave the oPt for personal and labour reasons (Hanafi, 2008).
The Strategy of Using Violence
During every armed conflict individuals may engage directly in violence for a different range
of reasons such as economic, social and political. The use of violence has rarely been studied
as a risk management strategy. While the reasons behind participation in armed conflict has
been well documented in the literature on collective action (Olson, 1965; Lichbach, 1995),
the use of violence has been recently explored within the studies of the causes of armed
conflict. Regarding the latter, despite the top-down approach of international and national
perspectives in conflict process, there is emerging research which uses a micro-level
perspective to address the conflict dynamics. The questions about who the real actors in
conflicts are and why different individuals and groups participate in rebellions or upheavals
have only very recently been addressed117. It could be said that the study of the reasons
behind armed mobilization has been stimulated by the interest in testing the greed-grievance
hypothesis among those joining the armed groups. Particularly, after the September 11
attacks, the subject became very fashionable; scholars from various disciplines were resolved
to uncover the secrets of one of the forms of violence, ‘the human bomb’.
Based on two aspects of reasoning, this research considers the use of violence as a risk
management strategy. On the one hand, the motives influencing conflict-affected households
117 Berrebi (2003), Khasan (2003), Yom and Saleh (2004a, 2004b), Saleh (2004a, 2004b), Collier and Hoeffler (1998), Keen (1998), Verwimp (2005a), Kruger and Male čková (2003), Humphreys and Weinstein (2004), Richards (1996), Guichaoua (2003), Justino (2008).

122
risk management strategies overlap and are interlinked. Although this issue is analysed in the
next section, it has already been seen that certain strategies, such as depletion of human
capital and adjustments of household labour supply are adopted because of households’
needs to manage both their economic and security aspects. Thus risk management in the
context of armed conflict may not be purely an economic behaviour; instead it responds to
the multi-dimensional effects of armed conflict and security-orientated behaviour may be
significant. Furthermore, based on the definition of risk management strategies118 , we could
say that in the context of armed conflict where the risk-events, often systematically and
deliberately aiming to destroy household assets and block its entitlements and hence its
responses, becoming a fighter is a risk management strategy. A strategy which pursues
through the use of violence the destruction of the other party involved in the conflict and
hence creating a reduction in the probability and the impact of the risk event.
The second reason is drawn from analysis carried out in the oPt and presented in Chapter 4
of this dissertation. In order to explore risk management strategies beyond secondary data,
primary data was collected on household perceptions of risk events, the specific actions
adopted in response to those risk events and the motives behind them. The findings of the
interviews show that use of violence is a household response to deal with the anticipated and
actual losses associated with uncertain events and outcomes produced by the Israeli
occupation of the West Bank since the onset of the second Intifada. As suggested previously,
the motives driving the choice of risk management strategies have to do with the specific
context of vulnerability during the armed conflict, and they are not singular or simple. On
the contrary, different motives coexist and these are not independent but highly correlated.
The reasons behind the use of violence in the context of the oPt are discussed in the
following section.
With the exception of the use of violence, the nature of the rest of the strategies reported by
the studies of risk management in the context of armed conflict are very similar to those
observed during natural or economic crises. However, this needs to be further explored
because it could be that the list of strategies studied in the context of armed conflict have
been taken directly from those observed during natural or economic shocks. This is a
118 As mentioned in Section 2.2.1, risk management strategies are defined as those actions taken to deal with risk.

123
question raised again in the analysis of risk management in the oPt in Chapter 4. In addition
to the nature of the risk management strategies, there is the issue of the motivations behind
households risk management. Unlike households dealing with natural or economic shocks,
in the context of armed conflict households adopt mechanisms to deal with other issues
beyond household economics. Given the multi-dimensional and often deliberate nature of
conflict-produced shocks, it is highly probable that the motives for a particular strategy are
not singular or simple but various and interlinked. The reasons behind the households’
responses could be economic and/or security and/or ideology related. Following section
addresses the issue of the motivations by exploring the relationship between risk
management strategies and risk events.
2.4.2 Risk-related Determinants of Risk Management Strategies
Studies on the choice and effectiveness of the risk management strategies used by conflict-
affected households are scarce. While the analysis of the strategies themselves is a more
straightforward exercise, the identification of the risk management determinants is taking a
step deeper and hence the limited evidence. This gap in the literature favours treating risk
management behaviours independently of their contexts and adopting the risk management
framework used for developing countries to understand risk management in the context of
armed conflict.
This section illustrates some aspects of how recent studies on risk management during armed
conflict have approached the relationship between risk events and risk management
strategies. Although there are other factors explaining risk management in conflict-affected
households, such as the household asset base, community characteristics (access to markets,
infrastructures, proximity to the city, etc.), availability of credit and insurance markets,
development of labour markets, etc., the focus of this research is on the shock-related
determinants of risk management. Thus, bearing in mind the scope of this section, the
following discussion centres on the relationship between risk management strategies and risk-
event characteristics, i.e. on intensity, spread, uncertainty and nature. Since this is an infant
area and the evidence is just starting to accumulate, the analysis of these first attempts to
124
understand risk management in situations of armed conflict aims to contribute to the
emerging debate by providing key elements for its understanding.
The Intensity of Conflict-produced Shocks
One of the factors influencing the effects of a war is its intensity. Specifically, it is said that
the effects of a war depend on a variety of factors including the magnitude, the duration and
the phase of the conflict (Stewart, 1997). The longer the period of conflict, the more likely it
becomes that households liquidate their productive assets or abandon them to become
refugees. However, a short war can also strongly affect household welfare, especially if the
conflict-produced shocks, from violence, asset looting or displacement, are intense,
widespread and if the households were already vulnerable at the outset of the conflict.
As mentioned in Section 2.2.2.2, the intensity of the risk events (its magnitude and the
frequency of the shocks as well as the duration of the crisis) is important because it
determines the depth of shock impact and the time-span to bounce back. If shocks are
repeated over time and the crisis becomes chronic and its effects permanent, management is
more difficult since the crisis exhausts the means – both at the household and community
level - of risk management and the available strategies become less and less effective. In these
sorts of circumstances, since usual household activities are unlikely to be sufficient,
households intensify their usual income-based strategies and adopt additional actions to
prevent destitution.
Within the micro-analysis of risk management in armed conflict, while the risk management
strategies have been mostly explained by the magnitude of the shock, the frequency of the
shock and the duration of the conflict are yet to receive much attention. The magnitude of
the shock seems to be used as a catch-all term that reflects all effects of conflict-produced
shocks. Thus, the magnitude of conflict-produced shocks illustrated by continuous or
dummy variables representing a particular risk event (e.g. death, house damage, detainment,
becoming a refugee, movement restrictions, etc.), is used to indicate the extent of the absence
or presence of armed conflict. Thus, with this type of approach, which often illustrates
conflict as a categorical effect, the studies tend to explain the adoption of risk management
strategies (described in Section 2.4.1) among conflict-affected households. The following table
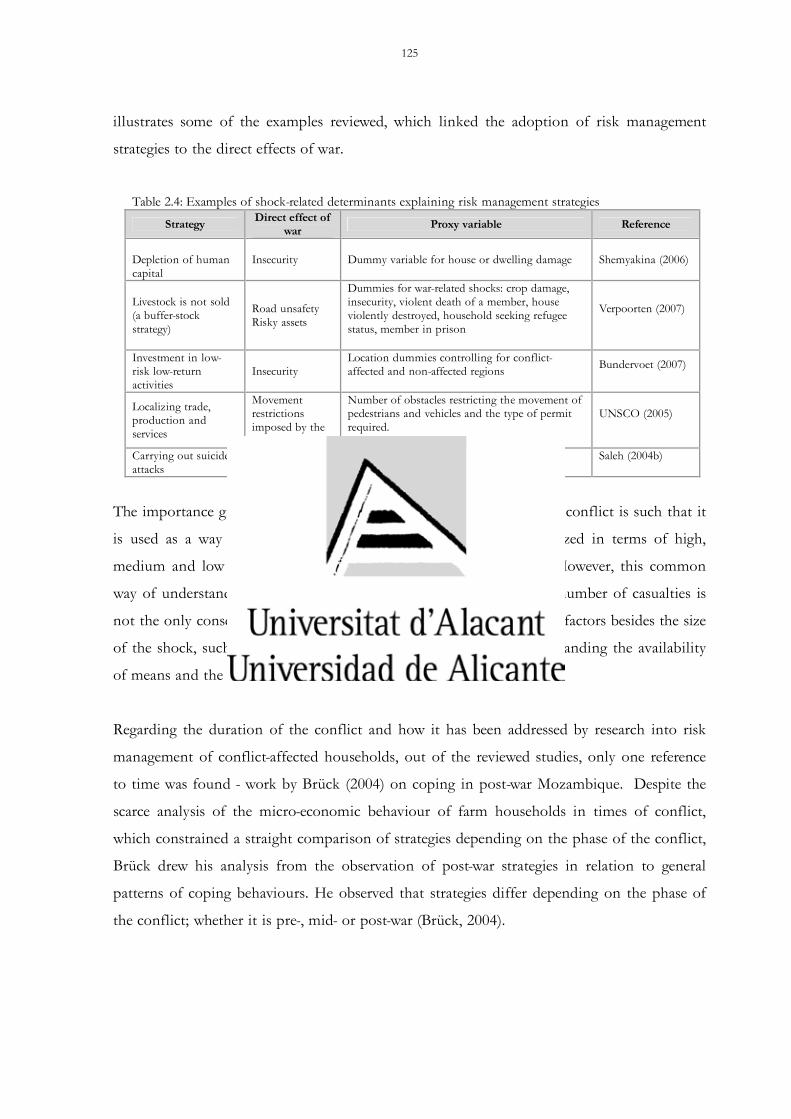
125
illustrates some of the examples reviewed, which linked the adoption of risk management
strategies to the direct effects of war.
Table 2.4: Examples of shock-related determinants explaining risk management strategies
Strategy Direct effect of war Proxy variable Reference
Depletion of human capital
Insecurity Dummy variable for house or dwelling damage
Shemyakina (2006)
Livestock is not sold (a buffer-stock strategy)
Road unsafety Risky assets
Dummies for war-related shocks: crop damage, insecurity, violent death of a member, house violently destroyed, household seeking refugee status, member in prison
Verpoorten (2007)
Investment in low-risk low-return activities
Insecurity Location dummies controlling for conflict-affected and non-affected regions
Bundervoet (2007)
Localizing trade, production and services
Movement restrictions imposed by the policy of closure
Number of obstacles restricting the movement of pedestrians and vehicles and the type of permit required.
UNSCO (2005)
Carrying out suicide attacks Military action Dummies for violence (households members
injured, killed or detained) Saleh (2004b)
The importance given to the magnitude of the shock by the studies of conflict is such that it
is used as a way of categorizing the conflicts. Conflicts are categorized in terms of high,
medium and low intensity depending on the number of casualties. However, this common
way of understanding conflict can be misleading because firstly, the number of casualties is
not the only consequence of war and secondly, because there are other factors besides the size
of the shock, such as the duration of the conflict, which help understanding the availability
of means and the extent of exhaustion.
Regarding the duration of the conflict and how it has been addressed by research into risk
management of conflict-affected households, out of the reviewed studies, only one reference
to time was found - work by Brück (2004) on coping in post-war Mozambique. Despite the
scarce analysis of the micro-economic behaviour of farm households in times of conflict,
which constrained a straight comparison of strategies depending on the phase of the conflict,
Brück drew his analysis from the observation of post-war strategies in relation to general
patterns of coping behaviours. He observed that strategies differ depending on the phase of
the conflict; whether it is pre-, mid- or post-war (Brück, 2004).

126
Besides this absolute differentiation into pre- mid- and post-conflict phases, addressing the
time dynamics within the life of the armed conflict is particularly relevant if we take into
account the great number of conflicts that are chronic, i.e. they are perpetuated over long
periods of time119. In addition, conflict does not occur linearly, where conflict and peace
represent opposite ends of a continuum, but rather coexist in different degrees of intensity.
Conflicts are rarely a one-off shock and shocks may often result from the slower structural
processes of social disintegration. If the start of the conflict introduces a long-term
widespread structural change in the fundamental structure of the economy and society,
unremitting shocks of a variable nature bring about micro-scale or short-term outcomes that
cannot be disregarded. This idea clashes with the general concern about whether chronic
conflict can be treated as shocks. Although this is an issue that has been addressed in the
analysis of conflict-produced shocks in the oPt in Chapter 4, the evidence found by the
recent studies on risk management in context of armed conflict, particularly those addressing
the issue of uncertainty (see later) indicates that structural and dynamic factors, i.e. both
long-term and short-term impacts of conflict, need to be taken into account.
Disregarding the structural changes occurring during long periods of stress allows focusing
on ex-post strategies and using them as catch-all terms to describe everything that households
do over and above primary productive activities. It has simply become synonymous with the
socio-economics of the household or more recently with livelihood security or vulnerability
failing to account for locational specificities and changes over time. In the context of
chronic crises, this focus could be rather speculative because it could imply that people do
cope and that household insecurity is a transitory phenomenon. In contexts of chronic
conflict, for example such as in the oPt, the combination of the conflict and the
impoverishment from repeated crises renders some groups incapable of surviving, irrespective
of the current conditions. In these sorts of situation, presupposing that people cope even in
subsistence economies, which are no longer viable from the point of view of livelihood
security, masks the collapse of livelihood systems and blind policy makers and researchers to
the need for a radical re-appraisal of the requirements of people’s livelihoods in conflict-
affected areas. Reinforcing coping strategies once livelihoods have been eroded could lock the
people into a vicious circle of subsistence and coping.
119 The Overseas Development Institute (ODI) has published a series of papers on Livelihoods in Chronic Conflict.

127
Given the general lack of panel data, a way of reflecting this double time dimension of
conflict – dynamic and structural – and how it unfolds into the risk management process
would be to use Davies (1996) distinction between coping and adapting behaviours, i.e.
between short-term, transitory unusual coping from long-term, chronic usual coping.
Recalling from Section 2.2.2.2, while coping strategies are those activities which are reserved
for periods of unusual stress, which permit people to cope with disruption of the normal
bundle of entitlements within the prevailing rule system, adapting strategies are adopted as a
result of a structural change in the rule system and imply a permanent change in the mix of
activities required for subsistence irrespective of the year in question.
However, these two behaviours are not distinguishable by their activities and one needs to
know the reasons for doing them, the timing of their adoption and their effectiveness
(Davies, 1996). Understanding risk management behaviour with respect to these aspects is by
far a more complex task than simply monitoring whether or not particular activities are
being undertaken and assuming their relationship with household vulnerability. It is, indeed,
argued that a lack of information about these factors is the reason why the complexities of
adaptation have not been fully grasped (Shafer, 2002). It would be useful if the surveys
containing information about the risk management strategies included not just the actions
adopted but also data on the timing of the adoption, the effectiveness, the sustainability, the
household dependence, how often they are used, how long they have been used as well as the
motives and objectives of the strategies.
An example of the strategies of adaptation has been observed in the oPt. UNSCO (2005)
identified patterns of adaptation among Palestinian in the splintered territory of the West
Bank. As described in Chapter 1, the policy of closure has fragmented the territory of the
West Bank into a series of enclaves breaking down the relationship with Israel and between
West Bank districts and between rural and urban communities. Although the policy of
closure was firstly introduced in 1993, the later system of closure, comprising a set of
obstacles (including the Wall), restricted roads and permits has been progressively installed
since the end of 2002. While its installation introduced a structural change into the economy
and in society, it has a dynamic nature as the policy of closure – through its instruments and
procedures - is in continuous change. As mentioned in Section 2.4.1, due to the changes in

128
the system, Palestinians are forced to adapt their livelihoods since they can no longer cope
with the short-term shocks and need to fundamentally alter the ways in which they subsist.
The following are the adaptation patterns observed by UNSCO in the rural communities of
the West Bank (UNSCO, 2005):
- Adaptation strategies to loss of markets access: small shops and services have been
localized by expanding directly into small town and rural communities in order to
reach consumers, unable to purchase goods far from their community. Other
adaptation strategies include engaging in sub-contracting relationships with Israeli
agricultural firms and being intermediaries, such as wholesale traders and other
middlemen, facilitating access to markets throughout the West Bank and Israel.
- Producer adaptation strategies: industrial and agricultural production and marketing
have undergone several geographical and economic re-configurations in order to adapt
to closure-induced fragmentation. Firstly, industry and agricultural operations have
been relocated to minimize travel, therefore reducing transportation costs, securing
cheaper inputs and minimizing risk. However, the communities located near closure
obstacles are drained of economic activity and they re-locate to where there is freer
movement. Secondly, the contraction of the circulation of cash due to growing
unemployment and reduced economic activity is offset by reduced domestic demand
and by finding alternatives to the use of cash as a means of payment, such as increased
non-waged labour, share-cropping, barter and in-kind payments.
- Worker adaptation strategies: in the same manner that patterns of consumption,
production and trade have shifted as a result of closure and the fragmentation that it
has produced, so too have traditional labour patterns. The strategies included are the
following: an increased role of women in the labour force, which substitutes for lost
male income; continuing reliance on employment and markets in Israel in spite of the
closure-imposed constraints for commuters and the conditions of life if they decide to

129
stay in Israel for extended periods120; self-employment, such as opening small-shops,
which enables workers to avoid the obstacles faced by commuters but barely affords
enough income to cover daily necessities; waged work in other parts of the West Bank
such as Rammallah,; and there is a return to agriculture following the decline in rural
industry.
One dilemma that policy makers face is how to support adaptation strategies without
reinforcing the process of economic fragmentation. On the one hand, respondents from
rural and small town communities perceive their own adaptation and coping measures as
positive developments, worthy of support from donors and development/humanitarian
agencies. On the other hand, the Palestinian Authority, in conjunction with its international
supporters, will want to avoid strengthening unsustainable structural changes in the belief
that closure will eventually disappear and access conditions, both internally and across
borders, will steadily improve. Thus, taking into account the context of armed conflict, the
extent to which adaptation is positive or negative does not refer only to whether it is
voluntary or enforced121; instead it is mostly related to the challenging of the perpetuation of
the armed conflict. While negative adaptation involves coping within the status quo and does
not contribute to a lasting reduction in vulnerability, positive adaptation has the potential to
transform the status quo and contribute to a lasting reduction in vulnerability.
The inclusion of the duration of the conflict is a key aspect when analysing the risk
management of conflict-affected households. When shocks are repeated over time, there is a
need to analyse the continuous process of changes in households’ livelihoods. Disregarding
the structural and dynamic nature of the risk events may mask the collapse of the livelihoods 120 Palestinians who hold permits to enter Israel still face delays at barrier gates and checkpoints making it difficult for them to arrive at work on time. Moreover, workers have in many cases been forced to travel longer alternative routes when the barrier gates are closed while their hours of operation are incompatible with the working day in Israel. The Wall also reduces entry to workers and traders without permits into Israel. Those workers without permits who manage to enter Israel find that the social climate – in terms of pay and living conditions – has deteriorated. In addition, entering Israel without permits means higher travel costs due to the need to circumvent closure obstacles. This coincides with the risk of being caught and the reluctance of Israeli employers to hire illegal workers (UNSCO, 2005). 121 Davies (1996), in the context of natural and economic crises, describes positive and negative adaptation. Positive adaptation is by choice, can be reversed if luck changes, and usually leads to increased security and sometimes wealth. It is concerned with risk reduction and is likely to involve an intensification of existing livelihood strategies or a diversification into neighbouring livelihood systems. Negative adaptation is of necessity and tends to be irreversible, and frequently fails to contribute to a lasting reduction in vulnerability. It occurs when the poor are forced to adapt their livelihoods because they can no longer cope with short-term shocks and need to fundamentally alter the ways in which they subsist.

130
systems and ignore the uncertainty produced by micro-scale short-term shocks respectively.
This double time dimension of conflict-produced shocks during chronic armed conflict is
further explored in Chapter 4.
The Spread of Conflict-produced Shocks
The spread of the shock, which mostly relates to its nature, can be covariate and/or
idiosyncratic depending on whether it is society-wide or household-specific. Armed conflicts
are covariate with idiosyncratic components (Justino, 2007). There are households with
characteristics that are salient to the conflict, and which may be particularly badly hit by the
risk events. For instance, In the case of the oPt during the Second Intifada, being a single
man between 16 and 40 years of age, living in Nablus or Hebron, close to a settlement or to
the Wall, are characteristics that increase the individual or household probability of being
targeted for military action by the IDF or movement restrictions because of the policy of
closure (Lein, 2001). Similar examples are those of education during the Cultural Revolution
in China or the Khmer Rouge regime in Cambodia (de Walque, 2006 cited in Justino, 2007).
While a high level of education may be a secure source of income in times of peace, it can
become a liability in times of violence. While the identification of the idiosyncratic
components of armed conflicts may help to understand the conflict dynamics, its relevance
needs to be carefully studied. It would be interesting to study the spread of armed conflicts
and its effects on risk management. For example, how important are these idiosyncratic
components within armed conflicts? To what extent does household income in a community
co-move? How would self-insurance behave during risk events which have such a double
dimension in the spread of armed conflict?
Before the evidence for the effects of the covariate armed conflicts risk events on risk
management strategies is described, I refer you back to Section 2.2.2.2. Present risk
management research in developing countries suggests that risk-sharing is less effective during
society-wide shocks, because when everyone in a community is affected, its members are less
likely to be able to assist others. On the contrary, self-insurance through savings becomes an
effective mechanism against both idiosyncratic and covariate risks although it is affected by
the drop in the asset’s rate of return and terms of trade produced by covariate shocks. Some
aspects of this general proposition on the impact of covariate crisis into self-insurance
131
mechanisms have been tested in conflict-affected countries with conflicting results as it will
be shown next. On the other hand, when income-smoothing strategies are approached,
society-wide shocks tend to force households into intensifying usual income-based strategies
and adopting additional income-based strategies in an effort to deal with the impact of the
shock. Regarding the income-smoothing strategies aiming to reduce the variability of income
ex ante, it is known that during covariate shocks, diversification is not effective because of
the covariance of the income sources and because a great amount of households tend to
invest in low-risk activities.
Bearing in mind these mechanisms above-mentioned, the strategies of risk-sharing, buffer-
stock and diversification observed in context of armed conflict are explained next:
- Firstly, as previously seen in Section 2.3.2 and 2.4.1, risk-sharing among households
takes place and is an important source of support for livelihoods during conflict
despite the fact that social capital is rather ineffective during covariate crisis, and
more specifically, despite the fact that social capital can be seen to be particularly
targeted during armed conflict. This seems to suggest that the limitations imposed by
the covariate spread on risk-sharing could be further conditioned by the nature of the
risk event. For example, unlike in natural disasters, in the case of armed conflicts the
dynamics of civil society are particularly complex and contradictory. As it will be
described later, when the risk events deliberately threaten households self-sufficiency,
such as the armed conflicts, the process affecting civil society and more generally
social capital needs to be looked at taking into account other aspects of the risk
events beyond the spread, more specifically the politics and power that may explain
the social fragmentation and cohesion.
- Another strategy addressed at a micro-level perspective is the buffer-stock behaviour.
Bundervoet (2007) and Verpoorten (2007) studied livestock accumulation in Burundi
and Rwanda respectively. They both found that the effectiveness of buffer-stock
behaviour is severely reduced due to wartime conditions. On the one hand, the
covariate spread of the conflict drives down livestock prices, both the rates of return
and exchange. However, although this was a constraint and in fact prevented some
households from selling their livestock, generally the households were not stopped

132
and they did sell the animals. The decision of whether or not to sell despite the low
prices was observed among the less conflict-affected households. On the other hand,
the most-affected households did not sell livestock at all. As it is discussed next, the
main reason for this is related to the nature of the risk event as it is the conflict-
produced insecurity, which affects access to the markets as well as the livestock’s
riskiness. It seems that the effects of covariate risk events in this buffer-stock
behaviour depend on the uncertainty produced by the assets looting and destruction
during the armed conflict.
- Finally, the relationship between income-smoothing strategies and the spread of the
shock has not been explicitly studied. The strategies of reducing diversification
observed in contexts such as Mozambique (Brück, 2004) and Sri Lanka (Korf, 2004)
could be explained using the arguments of risk management theory for developing
countries. The effects of covariate spread of the risk event reduce the effectiveness of
diversification to decrease income variability because of the covariance of income
sources. However, it is necessary to disentangle whether the reduction of
diversification is because of covariance of income sources or because of the reduction
of options for a livelihood. In order to explore this further as well as the income-
smoothing strategies of conflict-affected households in general, there is a need to
study how the conflict-induced processes of economic informalization, withdrawal
from the monetized economy, self-sufficiency and the overall reduction of options
for livelihoods impact the households’ choice of the strategies portfolio.
The Predictability of Conflict-produced Shocks
Predictability refers to the extent to which an uncertain risk event or outcome can be
foreseen. According to the risk management framework as discussed in Section 2.2.2.2, the
extent to which one can predict risk does not matter so far as the household can save and
dis-save either through formal channels in the credit markets or informally through buffer-
stock behaviour. In the absence of credit markets, as long as the households have positive
savings, temporary income shortfalls can be smoothed through dis-saving strategies. The fact
that households can deplete their savings when things go wrong makes savings a risk-taking
factor allowing the households to engage in high-risk, high return activities.

133
Compared to other type of risk events, armed conflict introduces more uncertainty as it
introduces it in the assets and reduces generally the predictability of risk events and
outcomes. In context of armed conflict, the macro-level studies of the links between conflict
and development have brought up the importance of uncertainty. An increase in uncertainty
is one of the causal factors that explain the two-way causality between conflict and low-
income countries (Stewart, 1997). At the micro level, this research argues that conflict
impregnates everything with uncertainty and lives are filled with a sense of loss of control
and powerlessness. Although there is a general consciousness of the state of war and this
makes you to expect something bad to occur, the predictability of the risk event and its
magnitude is low. However, despite the importance of conflict-produced uncertainty may
have on every single aspect of the lives of societies, sectors, and individuals, it is not a subject
addressed widely by recent micro-analysis of conflict. This opens up a window for its future
research. A good point of departure is the reviewed work of Bundervoet (2007) and
Verpoorten (2007) addressing explicitly the issue of uncertainty in their analysis of the
conflict-affected household buffer-stock behaviour in Rwanda and Burundi respectively.
As Bundervoet (2007) and Verpoorten (2007) noted in the context of conflict, the lack of safe
and productive assets is not just a characteristic of the poor as the buffer-stock model argues
when applied to economic or natural crises; instead it affects the great majority including
both poor and non-poor. Thus, while the model of consumption under liquidity constraints
developed by Deaton (1991) and adapted by Dercon (1996) focused all the uncertainty on
income, in the context of conflict, uncertainty also affects savings, both liquid and physical.
Thus, in the two case studies, in spite of the relevance of accumulation of livestock as a
substitute for savings among Burundi and Rwandan farmers, they were not used as a buffer-
stock. The reason was not because of the fall in selling prices or a contingency planning, i.e.
the desire to retain assets for the future, as has been previously argued in reference to Jodha
(1975) and De Waal (1989); instead animals were not sold because their marketing was unsafe
because of the violence on the roads and most importantly because they were risky assets.
During conflict, assets are looted and destroyed because of predatory behaviour and also
because of symbolism attached to them. For example, in Rwanda, cattle ownership can be
often associated with the Tutsi ethnic identity. Prior the Hutu revolution of 1959, those in
power were identified as Tutsi and acquired wealth in the form of cattle (Des Forges, 1999 in

134
Verwimp, 2005a). In the Israeli-Palestinian conflict, being the land the issue of contention,
the conflict’ targets and impact are largerly space-based (Hanafi, 2008).
The argument concerning risky assets can be used to explain other strategies observed among
conflict-affected households, such as the adjustment of household labour supply and the
depletion of human capital. Although these two strategies are partly a rearrangement of
households’ assets in response to economic degradation, they also are partly a response to the
risk attached to human capital. As we have seen, like other types of assets, human capital is
often targeted during armed conflicts. While human capital was explicitly destroyed in armed
conflicts such as the Cultural Revolution in China or the period of the Khmer Rouge in
Cambodia (De Walque, 2006 quoted in Justino, 2007), it is always an implicit target in any
violent conflict. Armed conflicts are differentiated from other types of risk events because of
the destruction of human lives by killing, injuring and causing disability; and because of the
traumas and distress produced by the creation of fear and long periods of imprisonment.
Therefore, as a response to the high insecurity and the risk of suffering violence in any of its
dimensions, households change their preferences related to the investment in human capital
and the intra-household distribution of work, and favours the depletion of human capital
and low-risk re-allocation of labour within the family.
Bundervoet (2007) studied the consequences of livestock riskiness in the choice of activity.
He estimated the relationship between household livestock holdings (accumulated assets) and
the households’ ‘safe’ income share, being the fraction of income a household earns through
engaging in safe, low-return activities. His findings show the disappearance of the savings
risk-taking effect in conflict-affected regions. While in non-war regions, where risk exposure is
relatively lower, wealthier households significantly reduce the importance of low-risk low-
return activities in their overall activity portfolio, in the more risky war regions, wealthier
households shift their investments to low-risk low-return activities. The reason behind this is
no other than uncertainty. Unlike the standard risk management theory postulates (Deaton,
1991), in the context of armed conflict, savings are not risk-free and therefore they cannot
provide the insurance that investment in high-risk activities requires. It would be interesting
to explore within the specific context of vulnerability the effects of risky assets in risk-sharing
behaviours and in the household attitudes towards risk. Based on examples reviewed in
Section 2.4, we have observed that the risk-sharing strategies as well as the low-risk and high-
135
risk types of activity are being adopted by conflict-affected households and the factors
explaining this behaviour are more related to the nature of the conflict that to the welfare of
the household. The following section explores the high-risk activities, such as the use of
violence and attempts to offer some explanations for the motivating factors.
The Nature of Conflict-produced Shocks
The nature of the risk refers to a wide range of aspects and characteristics of the risk events
and outcomes. However, it has been approached in different ways. When the risk events are
considered exogenous, the nature of the risk is addressed by its spread, intensity and
predictability. When the shocks are considered endogenous, the source of the risk event is
added and subsequently the source-related features become important. In this sense, the
shocks need to be studied comprehensively, addressing the specific source and intrinsic
characteristics taking into account the general objectives of the conflict. The nature of the
risk is important as it contains information the households care about when managing risk
and also because it influences the breath of exposure, the intensity of the impact as well as
the capacity and possibilities to deal with its consequences.
Beyond general accounts for the importance of the nature of risk, its implications on
household vulnerability and household risk management have not been explicitly researched.
The studies on risk management in armed conflict, although they integrated the risk events
via their causes and not by the variability of change of impact indicators, they do not
unpack the intrinsic characteristics of the risk events (multidmensional, endogenous,
structural and dynamic). The following three observations gives account on how the recent
literature on risk management in context of armed conflict integrates the risk events into the
analysis.
First of all, out of the intrinsic characteristics of armed conflict – multidimensional,
endogenous, temporal and dynamic – references are being made to the endogenous nature of
risk events via the analysis of uncertainty. The double time dimension (as discussed in the
description of the intensity of the risk events) and the multidimensionality of risk events (see
later) do not seem to be issues of concerned. Regarding the endogenous character of
conflict-produced shocks, we have seen that it is indeed an important factor explaining the

136
risk management behaviour. Both consumption and income-based strategies seemed to be
partially explained by the riskiness that the strategy of assets looting and destruction
produced in the household’s assets base. While this strategy of destruction is explained by the
predatory behaviour of the powerful sectors and by the symbolism attached to the assets, we
think that it may respond to a wider strategy of domination and dispossession. This ample
approach to the assets riskiness has two major implications. Firstly, it makes explicit the
power dynamics between two belligerent parties with a context of political vulnerability.
Secondly, it leaves room to explain other risk management behaviour such as those related to
the risk-sharing and the adoption of high-risk activities, which do not seem to be motivated
by security concerns but instead by the lack of rights that characterized their context of
vulnerability. For instance, in the context of the oPt, the Palestinians, in response to the
movement restrictions and the annexation of land promoted by the Government of Israel to
maintain the settlement structures within the West Bank, engage in high-risky activities (see
Section 2.4.1.) not only to manage the households economics but also to claim for their
rights of movement and living within the territory as set by 1967 Israeli-Palestinian borders.
The motives behind households’ adoption of risk management strategies are a subject that
needs to be studied in detail. Given the multi-dimensional and often deliberate nature of
conflict-produced shocks, it is highly probable that the motives for a particular strategy are
not unique and they respond to economic, security, ideological-related factors. Regarding the
risk-sharing strategies and the strategy of using violence, one should bear in mind that social
capital is often consciously manipulated by conflict entrepreneurs, who influence the
processes through which social capital is created and mobilized. While a politico-economic
perspective would point to the primary of ‘interest’ rather than ‘passions’, one should not
ignore the ‘emotional economy of violence’, which uses propaganda and violence to nurture
an emotional economy based on a currency of fear, victimhood and a sense of grievance122
(Goodhand et al., 2000). Therefore, given the complex process affecting social capital, the
analysis of the social capital-based risk management strategies needs to integrate analysis of
politics and power, which unravel the configurations of social capital that can lead to social
inclusion, exclusions, fragmentation and cohesion.
122 Pinchotti and Vewimp (2007) analysed the contribution that a strong or strengthened social capital may make to feed the outbreak of violence.

137
All the evidence for a risk management strategies being partially explained by assets riskiness
shows that a lack of safe assets is not just a characteristic of the poor, as the risk management
theory in context of developing countries suggests. Although this is an issue that is further
explored in Chapter 4 for the specific context of the oPt, it seems that by acknowledging the
endogenous nature of risk events, the relationship between household risk management and
risk events strengthened, and the relationship between households risk management and
household poverty weakens.
The second observation has to do with the common simplification of the nature of conflict
by the use of violence. As mentioned before, one of the most common ways of categorizing
conflict is in terms of its intensity - high, medium or low - depending on the number of
casualties. While this could be enough to explain certain armed conflicts or certain periods
of an armed conflict, it can be a misleading simplification for others such as the Israeli-
Palestinian conflict. During the period 2002-2004, while the number of casualties was
reduced significantly compared to the first two years of the Intifada, the conflict may be seen
to be in the process of intensification. The dimensions of the conflict gaining relevance
during these two years were not so much related to violence but to space and land. In fact,
the conflict within these two years has been largely characterised by the construction of the
Wall and the policy of closure which annexed great amounts of land and fragmented the
West Bank territory into a series of enclaves. If we do not take into account the direct effects
on the conflict of land area being annexed and movement restrictions as well as the use of
violence, it would not be possible to reflect the dynamics of land and space, which
characterized the intensification of the conflict during the years 2002-2004. Therefore,
independently of the nature of the direct effect (e.g. whether it is violence or land-related),
the issue is that armed conflicts can not be illustrated by a unique factor if its nature is
multidimensional. The study of conflict requires a deep exploration which would identify
both general and time- and location-specific risk events.
The third and last observation is about the little attention paid to the links between the
indirect and direct effects of war. While some research explicitly recognises their linkage (e.g.
Verwimp, 2005a; Richards, 1996) it is common to ignore the interconnection and present the
indirect effects as the ultimate explanatory factor. However, if it is acknowledged that during
armed conflict, household’s impoversiment is often the goal of strategies pursued by armed

138
conflict winners, then, there is a need to study the interactions between impoverishment and
the conflict-produced shocks. The linkage of direct and indirect effects is related to the
linkage of the causes and symptoms as argued by the CE-defined political vulnerability
approach. According to that, when looking into the nature-related characteristics of the
conflict-produced shocks, households vulnerability can not be attributed to market or
poverty failure (symptom) if it is deliberately produced and if its continuation is
advantageous to the powerful (cause). Thus, in the same manner as vulnerability in the
context of armed conflict requires a political perspective that apportion importance to the
causes of the risk events themselves, the determinants of risk management cannot be viewed
merely from an economic viewpoint; they also need a political dimension.
The study of the determinants of the strategy of the use of violence, offers a good example
which illustrates some of the arguments presented above, such as the implications of
focusing on symptoms rather than the immediate causes and identifying single causes and
disregarding the links between them. Given the wide research coverage that this strategy has
received, unlike the other risk management strategies of conflict-affected households, it is
worth presenting the different views before the analysis of their implications.
- First of all are the profiles of militia as pure, greedy mercenaries. People may join the
armed groups for opportunistic reasons and for survival and the fulfilment of basic
economic needs. Evidence for this comes from, for example, the study by Humphreys
and Weinstein (2004) on combatant profiles based on survey information from a
sample of 1043 combatants involved in the civil war in Sierra Leone. It was observed
that extreme poverty provides the motivation for effective recruitment and
mobilisation of the masses. They reported how while luring candidates for the
Revolutionary United Front fighters were promised jobs, money and/or protection
while others were attracted by the possibility of looting and other material gains, the
chance of obtaining employment and the recognition and sense of becoming
valuable. These types of profiles reflect the original work of Collier and Hoeffler
(1998) on the economic causes of conflicts, based on the micro-economic rationale of
criminal behaviour123.
123 Despite the fact that participation in collective political violence is not necessarily identical to participation in criminal activities - unlike criminals and outlaws, individuals joining insurrectionist political struggles do

139
- Secondly, other evidence nuances the general character of the mercenary assumption.
Highly relevant studies for this research are that of Berrebi (2003) and Krueger and
Male čková (2003) on Hamas and Hezbollah fighters respectively. They found that
the probability of becoming a suicide bomber is positively related to education and
negatively to poverty. By implicitly assuming that the utility function of Palestinian
militants depends only on economic variables such as education and poverty and
nothing else, the authors did not investigate other factors related to economics that
can cause political tensions124. In its place, they argue that ‘instead of viewing
terrorism as a direct response to low market opportunities or ignorance, we suggest it
is more accurately viewed as a response to ideological factors, political conditions and
long-standing feelings of indignity and frustration that have little to do with
economics’ (Krueger and Male čková, 2003: 119).
- Thirdly, there are fighters, who do not fit into the usual binary classification of rebel
groups (predatory-economic or ideological-political) as they are simultaneously
economic, social and political actors in the communities where they operate.
Guichaoua’s (2007) study on the mobilization process of militia fighters in Nigeria
reported other motives – feeling in danger, the social proximity to insiders, the
puzzles associated with leader-follower interactions – and argued in favour of
vulnerability in its wider sense as a more decisive factor of enlistment than poverty
per se. Another example is that of Justino (2008) who analyses whether the
participation of the poor in armed groups is a function of two interdependent
variables. The first is the initial household characteristics which determine the extent
of the household’s vulnerability to poverty. The second is the extent of the exposure
of the household to violence during conflict, i.e. its vulnerability to violence.
In defence of the plurality and interconnection of the reasons behind political violence, this
research is concerned with the identification of single and independent motives. Fortunately, not consider their activities illegal – it is common practice to use the theory of crime to predict the determinants of political violence. Guichaoua (2007) notes that the use of the theory of crime to predict the determinants of political violence is not restricted to those that focus on economic motives; they impregnate the study of the causes of conflict and that of the patterns of cooperation between agents. 124 An explanation of how Kruger and Male čková (2003) arrive at ideological factors, disregarding poverty and education is addressed later in the section.

140
in the context of the oPt, information on the determinants of militia fighters, and
particularly about suicide bombers, is more extensive than in other cases, converting it in a
good ‘laboratory’ to study the different approaches. It could be said that there are two main
narratives: i) the dominant narrative of Berrebi (2003) and Krueger and Male čková (2003)
that analyses suicide attacks by economic variables; and ii) the work of Saleh (2004b) and
other authors125 that explains the strategy of Palestinian suicide bombers through the
strategies of the risk events produced by the Israeli occupation, such as IDF violence and the
Israeli policy of closure.
One of the limitationn of the first type of narrative is that it fails to consider the full range
of stressors – economic, political, social and physiological – and restricts its attention to
economic factors, consigning other factors to a black box. The little direct connection found
between the participation in suicide attacks and poverty or education has been used by
Berrebi (2003) and Krueger and Male čková (2003) to disregard households economics and
to focus, instead, on the ideological motives.
According to Saleh (2004b), the detachment of economic factors from ideological motives, as
implied by Berrebi (2003) and Kruger and Male čková (2003), neglects the nature of the
political struggle and fails to account for the socio-political pressures resulting from it, such
as anger, frustration and alienation as well as the desire for retaliation and revenge on behalf
of the individual’s commitment to nationalist aspirations of freedom and independence.
This detachment has made possible the current international policy against terrorism, which
centres on the use of military violence. Although Kruger and Male čková’s findings could
have been read as there are more factors at play than poverty and education when it comes
to suicide attacks, instead the message that came out was different: since economic
deprivation and ignorance do not cause suicide bombers, fighting terrorism does not require
fighting poverty; a good way to quell insurgent violence is through military violence (Saleh,
2004b).
125 Yom and Saleh (2994), Kashan (2003) and Al-Sarraj (2003).

141
However, as many authors demonstrate in the context of the oPt, economics do matter and
are intrinsically linked to the political environment and frustration126. Generally, Stein (1990)
and Roy (2001a) observed that the periods prior to the first and second Intifada respectively
were characterized by growing and intolerable political frustration in the Palestinian streets
fuelled by economic hardship. Particularly in the decade of the 1990s as the peace efforts
took place during this time. Despite the fact that the Oslo Peace Process brought with it the
promise of a better future for the whole Middle East and Palestinian and Israelis were
optimistic about the economic prosperity that would come from the cessation of hostilities,
the period 1990-2000 was a decade of wide disparity in the achieved rates of economic
growth and prosperity. If the Israel policy of closure caused the Palestinian economy to
stagnate through the 1990s, since 2000 it has produced the fragmentation of the territory
into isolated enclaves preventing any possibility for a viable state. Since the policy of closure
does not separate Palestinians from Israelis but Palestinians from Palestinians, the
Palestinians consider Israel responsible for the protracted closures and mobility restrictions,
which have produced an economic depression with unprecedented levels of poverty and
unemployment. Therefore, if increased stress due to the economic circumstances increases the
incentive to join Palestinian resistance groups or support for them, then unemployment or
poverty is not an economic but a political problem. Since Palestinian unemployment or
overall poverty is a result of the political dispute then they would be pivotal in motivating
attacks against Israel
Taking into account this general context, Saleh (2004b), in order to delineate the importance
of economic variables in the Palestinian political struggle, decided to move beyond poverty
and education and attempted to understand the suicide attacks (suicide shootings and
bombers) by proxying on the one hand, IDF military operations127 through the number of
Palestinian killed; and on the other hand, by proxying the Israeli Policy of Closure128 (IPC)
through per capita income and unemployment.
126 Saleh (2004a, 2004b), Yom and Saleh (2004), Khashan (2003), Bishara (2005), Al Sarraj (2003), Stein (1990), Roy (2001a, 2001b), Andoni (2001). 127 IDF military operations included killings, injuries, home demolitions, detention of suspect Palestinians without charge for prolonged periods of time, collective punishment such as detention of brothers and fathers of a wanted Palestinian, confiscation of land, etc. 128 For details on the Israeli Policy of Closure see Chapter 1 and 4.
142
According to Saleh estimated models suicide Palestinian attacks – shootings and bombings -
will be only reduced if there are changes in the ICP and IDF military operations which
improve the economic, political and social conditions in the oPt. More specifically, regarding
the military operations, the findings of Saleh identified certain differences across the
strategies of violence, whether it was via suicide bombings or shootings: suicide bombings are
a response to Israel military actions that have resulted in the killing of Palestinian political
leaders; shooting attacks, which do not require the involved planning required by suicide
attacks, are a response to Israeli military incursions into Palestinian cities and villages129. As
for the economic determinants of political violence in the oPt, they are highly significant
and their statistical signs conform to the predictions of deprivation theory. Specifically, an
increase in the Palestinian per capita income as well as a reduction in unemployment rate will
reduce Palestinian attacks against Israel, particularly shooting attacks. However, as
mentioned, above, a reduction of the suicide attacks will just take place if Israel halts its
policy of selective targeting of Palestinian political leaders (Saleh, 2004b).
The findings identifying a wide range of factors motivating the individuals in their decision
to join the armed struggle highlight the complexity of the subject. There is a need for a more
holistic approach to the study of the strategies of use of violence, in any of its forms. On a
more general basis, the study of the determinants of risk management strategies needs to
unravel the determinants – e.g. economic, security-based and ideologically-related – in
connection with the risk events. Although the few studies carried out have contributed
significantly to explaining the risk management strategies via the risk events causes, efforts
are still needed to unpack what is behind the risk events, specifically the power dynamics
between the strategies of the conflict-affected households and those of the conflict-produced
shocks. In order to do this, the causes of the risk events need to be analysed taking into
account their intrinsic source-related characteristics (endogenous, dynamic, structural and
multidimensional) and their overall objectives (e.g. ethnic cleansing, economic subjugation,
land occupation, social fragmentation, etc.) illustrating the context of vulnerability. 129 Yom and Saleh’s (2004) data base of suicide attacks – shootings and bombings which occurred during the second Intifada - revealed that out of 87 individuals, 44 of them had been exposed to IDF military measures. Fearon and Laitin (2003) explain that brutal and indiscriminate actions can increase participation in violence by turning ‘local non-combatants into rebel forces’. Along with this view, is the analysis of the psychiatrist Eyad Al Sarraj: ‘the people who are committing suicide bombings in this Intifada are the children of the first Intifada-people, who witnessed so much trauma as children. So as they grew up, their own identify merged with the national identify of humiliation and defeat and they avenge that defeat at both the personal and national levels’ (Al Sarraj, 2003:37).

143
One of the implications of linking the strategies to the risk events taking into account the
intrinsic characteristics and the conflict overall objectives is the portrayal of the response
mechanisms as everyday forms of resistance. If conflict-produced shocks deliberately threaten
self-sufficiency by destroying assets and blocking the households risk management strategies,
the extent of steadfastness, the strength of the parallel economy or social unity can be
considered as acts of resistance addressing the economic strangulation and social
fragmentation pursued by the conflict-produced shocks. This research now moves on to
reflect on the concept of resistance and the extent to which the risk management of conflict-
affected households could be portrayed as ‘everyday forms of resistance’.
2.4.3 Everyday Forms of Resistance
Although resistance has been studied in a wide number of disciplines and been found to
describe a wide variety of behaviours and actions, its definition remains diffuse. We are
particularly interested in one form of resistance, namely ‘everyday forms of resistance’ which
Scott (1985) refers to ‘…any act(s) by member(s) of the class that is (are) intended either to
mitigate or to deny claims (e.g. rents, taxes, deference) made on that class by super-ordinate
classes (e.g. landlords, the state, owners of machinery, moneylenders) or to advance its own
claims (e.g. work, land, charity, respect) vis-à-vis these super-ordinates classes (Scott 1985: 22).
Since a comprehensive examination of the theories of resistance is out of the scope of this
research, this section aims to introduce a point of view and highlight elements for future
analysis.
Resistance has been addressed by a wide number of disciplines - anthropology, women
studies, cultural studies, geography, political science, philosophy, sociology - and describes a
wide variety of behaviours and actions at all levels of human social life - individual,
collective, and institutional. Resistance forms of social action range from traditionally-
ascribed forms such as marches, civil disobedience, picketing, formation of organizations
(Jasper, 1997; McAdam et al., 2001), to less acknowledged ones such as use of violence,
working to rule, embezzlement, etc. (Scott, 1985). Resistance takes places in a number of
144
different settings - including most forms of political systems, entertainment, literature, and
the workplace – and targets individuals, groups, organizations, institutions and social
structures to address political (Howe, 1998) or identity-based actions (Bishara, 2001). The acts
themselves and their scale, targets and goals do not simply appear to us as neat and ready-
made parcels of ideas and practices with clear boundaries ascribing an essential unity and
declared purpose. Instead, resistance must be analysed in specific and context-bound
situations. The parameters are always drawn and re-drawn according to the specific context as
well as to what we understand to be happening in the specific context and how we choose to
look at it.
In spite of its own distinctive characteristics, resistance is often simplified and explained
through power. While the power association is a well-developed yet often contested concept
(Foucault, 1980; Lukes, 1974), resistance is often simplified and reduced to ‘counter-power’,
and characterised as a sporadic reaction to existing realities, a reaction that is either
destructive or unsophisticated130 (Vinthagen and Lilja, 2007). Current accounts of resistance
tend to have their differences located in the specific understanding of what power means,
how it is exercised and what is the nature of politics and political life (Amoore, 2005).
Theorists – Gramsci (1971), Polanyi (1957), Scott (1976, 1985) – acknowledge, implicitly or
explicitly, that resistance, being culturally embedded, arises from and is constitutive of
specific ways of life (Mittleman and Chin, 2000). However, they diverged in their respective
discussions of the forms and dimensions of resistance as well as its modes and targets.
Therefore, regarding the former, Gramsci and Polanyi, focused on the collective level,
whereas Scott drew attention more to the level of individual, as well as class, in everyday life.
Concerning the latter are Gramsci’s wars of movement position against the state, Polanyi’s
counter-movements against market forces, and Scott’s infra-political activities in the face of
everyday domination.
It is at the individual level and in everyday domination we are interested in to explain
Palestinian risk management responses to occupation-produced shocks. We are particularly
interested in this type of resistance because it is believed that the emphasis on Palestinian 130 Vinthagen and Lilja (2007) argue that there is a need to increase research that conceives resistance as multi-dimensional, unstable and a complex social construction in dynamic relations related to differences in context. With a few exceptions, it is rare that any discipline does have an elaborate interest in understanding resistance. Examples of disciplines focusing on resistance in a relevant manner are the post-colonial literature (e.g. Bhabha, 1984), feminists (e.g. Khabeer, 2000) and racial studies (e.g. Marable, 2002).

145
resistance has been misplaced. Despite fact that most “newsworthy” resistance is exceptional
and much of the long wearing process is at the everyday level, the emphasis on armed
struggle has marginalized a thorough discussion on the different forms of Palestinian
resistance131. However, in the context of the oPt, as in any other conflict, it would seem far
more important to understand the livelihoods of the great majority of the Palestinian
population; more specifically what they do if they do not engage in armed struggle while
defending their interest at best they can, i.e. addressing the prosaic but constant struggle of
the occupied. 131 Although the 2000 Intifada made visible the consequences of Israel’s continued occupation and expanded ‘colonization’ of the West Bank and Gaza, an expansion facilitated by the Oslo accords of 1993, under the name of ‘peace process’, the launching of the worldwide war on terror provided a new way of misrepresenting the nature of the Israel-Palestinian conflict. A century-long history of dispossession, expulsion and occupation was reduced, once again, to a series of Palestinian acts of terror. There are two main reasons why it has been decided to refer to the Palestinian struggle as ‘resistance’ and not as acts of terror. First of all, the UN recognised the legitimate right of a people to use armed force to resist a foreign occupation. Ever since the issue of defining terrorism was first brought to the attention of the League of Nations in 1937, the international community has consistently distinguished between illegitimate acts of violent terrorism and the legitimate right of a people living under colonial rule to use force in resisting occupation. UN agreements, such as the Special International Agreement for Civil and Political Rights and the International Covenant on Economic and Social Rights of 1966 and later the UN General Assembly Resolution 287 (December 6, 1971) made the right to self-determination a legal right for those people under colonial and foreign domination. In pursuance of these legal rights, the UN has consistently recognized the legitimacy of the use of armed struggle by national liberation movements. Thirteen international agreements have been concluded by the UN General Assembly recognizing the right of colonized people to use armed force in seeking independence and self-determination. In Recommendation 3103 of 1973, the General Assembly clearly provided those resisting foreign occupation the legal status of those involved in armed conflicts thus covering them under the rules of international law, such as the 1949 Geneva Conventions. In Resolution 3070 of 1974, the UN General Assembly further sanctioned all forms of foreign aid and assistance to those seeking self-determination and resisting foreign occupation. In the particular case of the Palestinian people, the UN General Assembly has consistently recognized both their inalienable legal and political rights as well as the legitimacy of their armed struggle to regain those rights. Examples of such resolutions include article 51 of the UN Charter, Resolution 3236 of 1974, Resolution 49/149 of 1995, Resolution 42/159 (1987), Resolution 1514 (1960), Geneva convention Protocol 1, art. 1. Secondly, there is not an international agreed definition for terrorism. While it is generally agreed that the use of violence or threat of violence constitute inherent characteristics of terrorism, the difficulty lies on agreeing on a basis for determining when the use of violence – directed at whom, by whom and for what ends – is legitimate. The setting of these very broad issues significantly depend on whether one sympathises with or opposes the person/group/cause concerned. If one identifies with the victim of the violence then the act is terrorism. If, however, one identifies with the perpetrator, the violent act is regarded in a more sympathetic, if not positive (or, at worst, as ambivalent) light; and it is not terrorism. Thus, it is often the case that the term ‘terrorism’ is used by states to delegitimate political opponents, and thus legitimize the state’s own use of terror against those opponents, and hence refer to it as ‘defensive violence’ (Vinthagen and Lilja, 2007; Bishara, 2005; Saleh, 2004b). That this usage was one-sided means that there could be no consensus over its definition. In spite of this, terrorism has become a word that people apply almost randomly to others as part of what appears to be an ambitious and almost desperate drive to reach a universal consensus over illegitimate political violence. On the surface the aim may appear humanitarian in that it seeks to establish a common denominator within the state and among different societies, but it has also become a casus belli. In line with Bishara (2005), this research beliefs that any universally-accepted notion of terrorism as an illegitimate form of political violence must presume that i) systematic violence directed against civilians in order to attain a political objective is illegitimate; ii) systematic violence by the state against civilians in order to attain a political objective is illegitimate; iii) extreme form of state terrorism is the systematic, routine violence used by an occupying power in order to prolonged its occupation, iii) resistance against occupation is legitimate, because occupation exists to terrorize, but that targeting civilians even within the framework of resistance is illegitimate.

146
Scott’s resistance framework does not implicitly recognise risk management strategies as
forms of resistance; however, it does unpick crucial aspects - forms of resistance, intentions
and gains – of what are acts of resistance, opening a space where risk management strategies
could be conceived as forms of everyday resistance.
Forms of Resistance
According to Scott, powerless people rarely have the resources or opportunity to openly
resist their super-ordinates, and thus ‘massive protest movements are flashes in the pan’
(Scott, 1985: 16). Instead, they use hidden transcripts, i.e. what subordinate parties say and
do beyond the realm of the public transcript or the observation of the dominant, e.g. theft,
slander, slow-downs in the workplace, playing dumb, etc. Hidden transcripts are particularly
important when the resister’s basic needs and security depends on the regime they resist. It is
those who can afford to lose who wage open battle and dare public challenges. But it is the
grassroots need for household survival, the day-to-day imperatives of earning a living, which
Marx termed ‘the dull compulsion of economic relations’ that is one of the obstacles to
open resistance (Marx, 1970 cited in Scott, 1985: 15). The juxtaposing of ‘hidden’ and
‘public’ transcripts is what Scott refers to as infrapolitics, as everyday forms of resistance
conducted singularly and collectively, but which fall short of openly-declared contestations.
In the context of surveillance structures set up by the dominant classes, hidden transcripts
record infra-political activities that surreptitiously challenge the practice of economic, status,
and ideological domination (Scott, 1990).
According to Scott, when we do see instances of open collective protest or headline-grabbing
demonstrations, these are about ripples on the surface of a deeper and more diffuse pattern
of struggle that may often be about getting by or coping. Even when there is an absence of
openly declared contests, it should not be mistaken for acquiescence. It is in the realm of
informal assemblages such as the parallel market, the workplace, the household and the local
community where people negotiate resources and values on an everyday basis, that ‘counter-
hegemonic consciousness is elaborated’ (Scott, 1990). These acts qualify as genuine resistance
and should not be seen as poor substitutes for the real thing. In this sense, the less visible
practices of resistance are not meaningfully separable from the more overt expressions but
147
rather they may form the language, structures and meanings that make the grand gestures
possible (Amoore, 2005).
Therefore, according to Scott (1985), there is not a unique or predefined set of forms of
resistance; on the contrary, its nature and forms are influenced by the nature of the society,
but overall by the intensity and structure of the system of domination. The better our
recognition and appreciation of agencies and instruments of domination, the better we may
be able to assess whether they are being resisted, or in what ways they are perceived of being
capable of being resisted or not; and the better we may recognise certain actions as being
forms of resistance.
A good way of illustrating the inter-dependent relationship between resistance and
domination is a comparison between the 1987 and 2000 Intifadas. Although both were acts
of resistance against Israeli occupation and a colonial system of control, the ideology, values
and actions employed vary according to the structure being resisted, the form of the power
relationship that was being engaged and the relative size and power of the contending
groups.
Regarding the structure of power and the type of engagement, the differences lie in the
consequences of the Oslo Peace Accords in terms of the creation of the PNA and the
distribution of the territory into different areas – areas A, B and C – where either the Israeli
government or the PNA held military and civil control (Andoni, 2001). During the 1987
Intifada, the Palestinians lacked any representation within the oPt and Israel was the single
authority, which controlled every single aspect of Palestinian life. However, the Oslo interim
agreements created a different environment for the 2000 Intifada. The fact that the PNA was
allowed sovereignty in some areas (aside from control over entrance and exit) and shared
sovereignty in others complicated the context in which the uprising took place. Unlike the
1987 Intifada, the 2000 uprising had to meet the challenges posed by shared authority,
internal borders, and negotiations and security partnerships between the PNA and the Israeli
government. The fact that Israel retained control over key issues - foreign relations, external
security, overall security for Israelis (including settlers in the oPt) - and territorial jurisdiction
over military installations, all Israel settlements and East Jerusalem enabled Israel to remain
an occupant whether or not it had transferred specific parts of the territory to Palestinian
148
self-rule (Keating et al., 2005; Al Haq, 2005). Thus, although Israel was no more the
occupying authority, it was a de-facto authority in the oPt.
Vis-à-vis the power of the contending groups, the existence of the PNA and areas defined as
sovereign allowed the Israelis to portray the conflict as a state of war, as if there was parity
between the two sides (Brynen, 2000). Israel adopted an iron fist policy and mobilized its full
military strength against the Palestinians, something which was unthinkable even during the
most violent episodes of the 1987 Intifada (Esposito, 2005). Besides the use of force, one of
the differences between the two Intifadas was the policy of closure, which since the
installation of the restrictve system in 1991 has passed from a set of entry and exit
restrictions into Israel and third countries (external control) to a sophisticated system of
closure exercised by permits, road controls, physical obstacles, and the Wall itself that limit
and control the movement of goods and people within the West Bank (internal closure). As
Mansour writes, ‘Israel’s exercise of control over the Palestinian deepened and
metamorphosed into an apartheid regime of checkpoints, permits system, settler-by-pass
roads, and settlements, encircling and besieging Palestinian cantons of territoriality’
(Mansour, 2001: 85).
Within these two differing Intifada scenarios, the ends and means of Palestinian resistance,
generally speaking a civil rights movement combined with that of a national struggle for
independence, were distinct phenomena. As Andoni argues (2001), on the one hand, in 1987,
there was a clear separation between the question of occupation and any worries about the
existence of Israel; the main focus was to disengage from the structure of occupation. On the
other hand, the 2000 Intifada arose as a comprehensive movement to reject an imposed
solution on the Palestinian people and to restore honesty and integrity to political discourse.
As mentioned in Chapter 1, the second Intifada revealed the deception and illusions of the
then-present ‘peace process’ and set the region on a course towards reality without disguise.
Given this context, the second Intifada avoided short-term demands, and defending their
rights oriented itself not simply into the general demands of ending the occupation but
around the specific insistence on Palestinian control of East Jerusalem and the right of
return132.
132 Said (2001), Roy (2001b), Rabbani (2001), Pacheco (2001), Le More (2008).

149
As far as the methods are concerned, they generally combine peaceful mass protest, civil
disobedience and armed struggle. According to Andoni (2001), their balance has been subject
to the test of efficiency and has varied according to the status of protesters within society as
well as the level of Israeli control or oppression. As described by Heiberg and Øvensen
(1997), the 1987 Intifada was a spontaneous insurrection characterized by the pragmatic
unity of two separate – religious and secular – units against the occupation, which brought
together Palestinians of diverse and divergent ideologies, class backgrounds and geographic
locations and hence there was massive participation. All segments of Palestinian society were
directly involved in the uprising in one way or another – in protests, setting up popular
committees, civil disobedience, boycotts, strikes, etc. They challenged the occupying regime
by the creation of a parallel system of economic and political institutions competing with
and attempting to replace the foreign power, e.g. through the creation of a ‘parallel
government’. Contrastingly, the 2000 Intifada was orchestrated by politicians and their
armed groups and there was no unity between secular and religious powers; with armed
groups involved, the majority of the population stayed away from direct confrontation and
adopted a role of mostly individual steadfastness (Andoni, 2001). Lacking any realistic
possibility, for the time being, of directly and collectively redressing their situation, they had
little choice but to adjust their livelihoods as best as they could to the circumstances they
confronted daily. In this sense, Palestinian households have used their risk management
strategies to manage the uncertain risk events and outcomes produced by the policy of
closure and the construction of the Wall as well as the personal risk produced by the use of
violence133.
Intentions and Gains
There is a general belief to consider acts of resistance as coming from a conscious body
exercising an intentional act. The issue of conscious or intentional acts has to do with our
tendency to think of resistance as actions that involve at least some short-term individual or
collective sacrifice in order to bring about a longer-term collective gain (Scott, 1985).
However, in certain contexts, such as the in the oPt, where the government of Israel exercises
total control, the goal of resistance is not necessarily to overthrow or transform a system of 133 See Chapter 4 for the risk management strategies as reported by the Palestinian interviewed.

150
domination but rather to survive within it. In spite of this, there is an insistence upon
distinguishing ‘self-indulgent’, individual acts, on the one hand, from, presumably,
‘principled’, selfless, collective actions on the other hand and excluding the former from the
category of real resistance. To insist on such a distinction as a means of comparing forms of
resistance and their consequences is one thing; but to use them as the basic criteria to
determine what constitutes resistance is ‘to miss the very wellsprings of the oppressed
politics’ (Scott, 1985: 26).
Although the intention is important, there is no accord about what is required in order to
ascertain intention or how exactly to differentiate everyday resistance from various survival
or self-help techniques. Appraising intentions is difficult. Even if we are able to directly ask
the actors in question and even if they could reply candidly, it is not all clear that they
would be able to make a distinct determination. Their intentions may be so embedded in
their subculture and in the routine, taken-for-granted struggle to provide for the subsistence
and survival of the household so as to remain impenetrable (Scott, 1985). Besides, as
Mittleman and Chin (2000) argue the fact that superior and subordinate relationships are
embedded in the ways of life and subalterns do not have an unproblematic unitary identity,
constrains the explanation of subaltern behaviours by implicit reference to the economic
model of the self-interested utility maximizer. Infra-political activities are not the mere
product of subaltern decisions to conduct undeclared resistance in the face of surveillance
structures set up by the dominant strata.
Scott (1985) argues that the intentions of the oppressed group are inscribed in the act of
everyday resistance itself. In contexts such as the oPt, where material interests of
appropriating groups are directly in conflict with the oppressed – via land, state and
movement - we can infer the intentions from the nature of the action themselves. It is for
this reason that Scott’s above-mentioned definition of resistance places particular emphasis
on the effort to frustrate material and symbolic claims from dominant groups. It is no
coincidence that the cries of ‘land’, ‘state’ and ‘bread’ that lie at the core of Palestinian
resistance are each joined to the basic material survival needs of the household. Everyday
domination and everyday resistance flows from these same fundamental material needs.
Thus, the understandable desire to survive – by ensuring physical safety, food supply,
income, etc. – identifies the sources of the resistance to the claims of the oppressor (Scott,
151
1985). Consumption, from this perspective, is both the goal and the result of resistance and
counter-resistance. Lifting this argument to the meso and macro level, where causes of
violence are discussed and portrayed as greed vs. grievance, is in line with Duffield’s critique
of Collier’s argumentation (about shifting the causes of violence from grievance to greed).
Duffield states that even though warring parties usually base themselves on narratives of
grievances, it is greed that is the primary force. Greed is both the goal and the result of
grievance-motivated resistance (Duffield, 2001).
After many years of being treated as a secondary actor in the peace process, the Palestinians
have realised their powerless situation within the context of international politics and have
concluded that besides direct confrontation in a context of territorial and social
fragmentation, individual steadfastness is the only choice: remaining still and waiting.
Indeed, as Cheru (1997) argues for those living in acute destitution and imminent danger,
survival considerations are always paramount, and everyone learns the techniques of survival
as part of his/her everyday experience. These techniques may be crude or ingenious,
depending on perception, as is the stock of accumulated knowledge having to do with
production and survival, the resources of the community and the social relations and
communal values existing at a given time. Everyday forms of resistance are not simply spur
of the moment reactions by the marginalized to the problems they confront daily. Rather,
the desire to resist is based on a rational calculation of both risks and gains by the
participant.
Therefore in the Israeli-Palestinian context, as in any other conflict, ignoring the self-interest
element of involvement in the conflict is to ignore the determining context. It is precisely
the fusion of self-interest and collective principles that is the vital force animating the
resistance (Scott 1985). In this sense, Scott’s approach combines the Marxist paradigm of the
class struggle, as the basic organizing principle, with the neoclassical paradigm of the rational
choice of economically motivated individuals. Thus, when the Palestinians react in a
utilitarian and individualistic fashion against the powerful forces destroying their lives, they
are also engaging in their nationalist struggle. In acting to marginally increase their chance of
survival against devastating odds, they are also carrying out acts of resistance. In this line,
Daines and Seddon (1991) argue that coping strategies, although they are essentially
‘defensive’ strategies providing little potential for changing the circumstances, are a form of

152
resistance. Even if there are differences between coping and bounce-back activities and the
former is the primary concern for livelihood security, all struggle involving an active
engagement with the immediate environment has the potential for development into more
extensive forms of struggle with greater capacity of expanding the room for manoeuvre and
for changing the conditions within which the struggle takes places.
Thus, without dismissing the importance of struggle that seeks to change the present political
and socio-economic framework in which they are embedded, and the risks to romanticize the
weapons of the weak that are unlikely to do more than marginally affect the various forms of
exploitation that the oppressed confront, it is believed that the effectiveness of the acts of
resistance cannot be used as a determining factor in deciding whether a behaviour is or not
an act of resistance. Given the endogenous nature of conflict-produced shocks, resistance
cannot just be considered as those acts contributing to a revolutionary consequence and/or
be selfless; the actions that take place at the most basic individual level with the most limited
and immediate of objectives should be recognised as acts of resistance.
2.5 Conclusions
With the overall aim of contributing to the micro-analysis of conflict, this chapter has
identified key aspects for the development of a risk management framework in the context of
armed conflict. In order to do so, the chapter has reviewed risk management theory and
evidence in the context of developing countries, the characteristics of armed conflicts, the
emerging literature on risk management in armed conflict and the Scott’s definition of
everyday forms of resistance.
The risk management framework developed to understand how households in developing
countries deal with anticipated and actual losses associated with uncertain risk events and
outcomes has dominated the understanding of risk management in all types crisis. By
assuming risk events as exogenous, the debate on risk management focuses on the risk
outcomes. Despite the fact that one of the central motivating factors in the risk management
is the risk events, they have been portrayed as exogenous, which allowed placing the causes of
the risk events on the periphery and just integrating risk in the analysis through the

153
characteristics of spread, predictability and intensity. While this type of approach may apply
in some contexts, it may not apply in armed conflicts, which according to the complex
emergency approach are endogenous as they systematically and deliberately destroy the
assets’base and block the households responses. If the assumption of risk events as exogenous
has allowed risk to be labelled in a generic manner blurring a clear understanding of risk
dynamics and how they unfold at community and household levels, the portrayal of risk
events as endogenous has the reverse action, which is to place them at the centre of the risk
management process. The implications of portraying risk events as endogenous in the
analysis of risk management are the following:
1. The risk events need to be studied within the context of their causes. This means that
they cannot be integrated into the analysis just by their characteristics of spread, intensity
and predictability since these do not reflect source-related information - such as the
specific cause, the avoidance margin, the competing set of objectives, etc. - the households
care about when managing risk in the context of armed conflict. In this sense, the nature
of the risk events needs also to be understood by the specific source (e.g. use of violence,
assets looting, movement restrictions, etc.) and the intrinsic characteristics (which are
multi-dimensional, dynamic, structural and endogenous) taking into account the general
objectives of the conflict (e.g. ethnic cleansing, land occupation, economic subjugation,
etc.). Besides providing relevant information for risk management, the nature of the risk
event is important as it influences the breadth of exposure, the intensity of the impact as
well as the capacity and possibilities of dealing with the consequences.
2. Secondly, household risk management strategies need to be addressed by their causes.
Unlike in the context of exogenous risk events, a categorization of household strategies
of conflict-affected households as indicators of vulnerability cannot be carried out
independently of the causes, as these provide information about the dynamics of power
between the strategies of the conflict-produced shocks and the strategies of the conflict-
affected households. The fact that armed conflicts systematically and deliberately destroy
the household and community asset base and block responses establishes a particular link
between the strategies and the risk events, which makes them inter-dependent.
154
3. Thirdly, the last implication of putting these shocks at the centre of the risk management
analysis has to do with the determinants of risk management. Like household
vulnerability in the context of armed conflict, risk management can not be determined
simply by poverty or market failure if these outcomes are a consequence of deliberate
blocking and advantageous to the powerful. Thus, there is a need to shift the attention
from household- (mostly associated with assets and poverty) to risk-related determinants
of risk management in the context of armed conflict.
In order to illustrate these three general implications as well as other aspects related to how
the characteristics of armed conflict unfold into household risk management, the second
part of the chapter focuses on analysing the emerging literature on risk management in the
context of armed conflict. The studies reviewed in this section highlight certain aspects
within the risk management of conflict-affected households that make it risk-source specific
and therefore not necessarily the same as that observed during exogenous covariate shocks of
economic and natural kinds. Despite scarce evidence and the need to cross-check the
findings, the emerging literature provides the first steps in the development of a specific
framework for the analysis of risk management in the context of armed conflict. The
following points summarize the reflections related to the understanding of risk events, the
risk management strategies and their determinants.
1. The research into risk management in conflict has integrated the risk events via their
causes and not by the variability of change of impact indicators. Although the causes are
brought in, the wide range of nature-related characteristics of the risk events – multi-
dimensional, endogenous, dynamic and structural factors - are not always raised in the
analysis and instead the magnitude of the shock seems to be used as catch-all term that
reflects all the effects of conflict-produced shocks. Thus, the magnitude of conflict-
produced shocks, illustrated by continuous or dummy variables representing a particular
risk event (e.g. death, house damage, detainment, becoming a refugee, movement
restrictions , etc.), is used to indicate the extent of the absence or presence of armed
conflict and to partially explain the adoption of risk management strategies among
conflict-affected households.

155
2. In addition to their intensity, risk events are also addressed by their uncertainty and their
effects on savings. In the context of armed conflict, the uncertainty of risk events does
not only affect the income but also the assets which become risky as they are deliberately
targeted. As the complex emergency approach argues, endogenous conflict-produced
shocks aim to threaten self-sufficiency by the destruction of assets and the blocking of
household responses. The integration of the endogenous character of conflict-produced
shocks via the analysis of uncertainty is an important contribution to the understanding
of risk management in the context of armed conflict. Thus, although it is not always
explicitly stated, buffer-stock strategies and income-based mechanisms are partially
explained through their immediate causes, i.e. the looting and destruction of assets.
While this is explained by the predatory behaviour of the powerful sectors and by the
symbolism attached to the assets, we think it respond to a wider strategy of domination
and dispossession, wich makes explicit the power dynamics between two belligerent
parties with a context of political vulnerability.
3. The next observation about how risk events are integrated into the analysis of risk
management in the context of armed conflict has to do with the general simplification of
the nature of conflict into being merely the use of violence. Most of the literature
reviewed in Section 2.4 identified one single direct effect of armed conflicts, which is
proxied either by locational dummies controlling for the affected and non-affected
regions or by the direct-effect of war such as asset looting, violent death of a member,
household seeking refugee, household member in prison, injuries and the number of
obstacles restricting movement. Although violence is the instrument of war most often
illustrated, it is to be noted that other direct effects are also taken into account.
4. Regarding the strategies, there is a tendency to understand these via their symptoms
(indirect effects) and not via their immediate causes (direct effects). While there is some
research that recognises the link despite focusing on the symptoms, i.e. household’s
poverty, others ignore the interconnection and present the indirect effects as the ultimate
explanatory factor. In the context of exogenous risk events, it could be said succinctly
that risk management strategies were generally explained by the spread, predictability and
intensity of the shock and, most importantly, by household-related determinants such as
asset base. Since the poor lack safe, productive and effective assets, it is generally argued

156
that being poor influences the choice of the strategies and limits their effectiveness. This
welfare-based difference between the household strategy portfolio is blurred in the
context of armed conflict. As we have seen, conflict-affected households, regardless of
their welfare, adjust household labour supply, do not sell their livestock as a buffer-stock
behaviour, withdraw children from school, invest in low-risk activities, engage in risk-
sharing arrangements as well as in high-risk activities such as using violence or accessing
restricted areas or routes for work or agriculture. One of the reasons explaining this
common behaviour could be related to the wide ranges of factors motivating risk
management during armed conflict. Conflict-affected households need to manage not
only household economics but also the riskiness attached to the assets. Physical, human
and social capital are deliberately looted and destroyed because of predatory behaviour
and more generally because of the strategy of dispossession and domination. From a
more general perspective, the management of household economics and security cannot
be detached from ideological motives, which acknowledge the political struggle and the
socio-political pressures resulting from it, such as anger, frustration and alienation as well
as the individual commitments to resist the threat to self-sufficiency and advance their
rights and entitlements, which are deliberately targeted by the armed conflict. This does
not mean that the economics do not matter, they do, but they are linked to the political
environment.
Thus, if it is acknowledged that during armed conflict household responses are
deliberately blocked, then one cannot disregard the links, which bring in the political
nature of the armed conflict and conflict-produced shocks. This research has identified
two possible implications. On the one hand, in the same manner as vulnerability in
contexts of armed conflict requires a political perspective (Duffield, 1994), the
determinants of risk management cannot be simply addressed from an economic
perspective but need a political dimension also, which captures the blockage of
household strategies within the general strategy of dispossession and domination. When
looking into the sources of risk and observing the complexity of power relations and the
political dimension of crises, the determinants of risk management strategies - choice and
effectiveness - cannot be attributed to market or poverty failure if their continuation is
advantageous to the powerful. On the other hand, taking into account that conflict-
produced shocks deliberately threaten self-sufficiency by destroying assets and blocking
157
the households risk management strategies, the resilience and therefore the resistance of
the population could be measured by the extent of steadfastness through the strength of
the parallel economy or social unity. Portraying the strategies of both the risk events and
affected-households together in an inter-dependent manner, could lead to the portrayal of
risk management strategies as everyday resistance forms. Scott’s introduction of the term
‘everyday forms of resistance’ has opened up an important discussion on the forms of
resistance and the extent to which there is no unique or predefined set of these; as the
nature and form are influenced by the sociological dimensions of the society concerned
and by the intensity and structure of the system of domination. Therefore, acts of
resistance do not necessarily need to be collective, organized, intentional, principled and
effective; on the contrary, they can be individual, non-intentional, and self-indulgent and
do not necessarily have to lead to revolutionary consequences. Thus, the strategies
adopted by the households to deal with risk events during armed conflict are acts of
everyday resistance as they advance rights and entitlements deliberately targeted by the
conflict-produced risk events. In certain contexts, households, by acting to marginally
increase, in an individualist and utilitarian manner, their chance of survival against the
forces threatening their livelihoods, are carrying out acts of resistance.
In order to explore further some aspects of the specificities of risk management in the
context of armed conflict and to add to the emerging debate, the discussion held in this
chapter is complemented by a descriptive analysis carried out in the oPt. Primary and
secondary data on households and conflict-produced shocks have been used to approach the
characteristics of the shocks, the households responses to deal with conflict-produced shocks
and how these two interact. Preceded by a description of the overall methodological
framework, Chapter 4 presents the empirical analysis.

158
CHAPTER 3
METHODS OF RESEARCH The research was conceived as an informal collaborative investigation with the PCBS as well
as with other stakeholders engaged in the use of risk management strategies as indicators of
vulnerability.
Before the overall framework of the research is described and an account of the research
methods given, it is necessary to clarify the role empirical analysis plays in the research. This
research combines critical analysis of the literature on risk management of households-in-
conflict with preliminary exploitation of primary and secondary data. On the one hand,
informant interviews are used to explore Palestinians’ conceptions of the threats and their
responses; on the other hand, the characteristics of the conflict-produced shocks and their
relationships with risk management strategies are explored through empirical analysis of
conflict and household data. The descriptive analysis of these data is not the primary
objective of this work; it rather aims to complement the research. The primary aim is to offer
an illustration of some of the issues discussed in previous chapters and to prepare the path
for future analysis by highlighting certain characteristics of the data. Based on these two
objectives, the methods of research are based on a descriptive analysis and the limitations of
this are well known.
3.1. Non-formal Collaborative Research
As mentioned, the research was framed as a collaborative investigation with key stakeholders
engaged in the oPt with the use of risk management strategies as indicators of vulnerability.
The objective of this was twofold. First, it was to do research as a reflective process led by
individuals working in the same area to improve the way we address issues. Second, it was to
establish mechanisms linking research with development practice. In order to do so, a great
part of the research was carried in the oPt. The fieldwork was undertaken during 18 months
in the form of intermittent visits between February 2005 and August 2006. The field work
was approached in two phases: identification and engagement.
159
3.1.1. The Identification Phase
The first phase of the field work was undertaken during February and July 2005 and it aimed
to:
1. Map the institutions and organizations engaged in the analysis of household
responses to the crisis
2. Check the relevance of the identified hypothesis
3. Assess the availability of secondary data.
To do so, informal individual and group interviews were carried out with main stakeholders
from the Palestinian Administration and civil society, Israeli NGOs as well as international
organizations and other NGOs134. The selection of the institutions and organizations
followed different criteria as is shown in the table below.
Table 3.1 Organizations interviewed
Criteria Organizations chosen
Organizations or institutions directly involved with the analysis of Palestinian responses to the crisis
World Food Programme (WFP), United Nation Special Coordinator Office for the Middle East (UNSCO), United Nations Food Agriculture Organizations (FAO), Acción contra el Hambre (ACH), Stop the Wall Campaign, Palestinian Central Bureau of Statistics (PCBS), International Palestinian Youth League (IPYL).
Palestinian research institutes carrying out micro-analysis of the conflict
Palestinian Economic Policy Research Institute (MAS), Palestinian Society for Regional Studies, Applied Research Institute Jerusalem (ARIJ), Academic Society for the Study of International Affairs (PASSIA).
Israeli (and Palestinian) Organizations against the occupation of the Palestinian Territories
Alternative Information Centre (AIC), Israeli Information Centre for Human Rights (B`Tselem), Machsom Watch, Beit Salom, Israeli Committee Against House Demolitions (ICHAD).
Donors largely involved in the oPt
The European Union (EU)
The Spanish Development Agency and Spanish NGOS
Agencia Española de cooperación internacional para el desarrollo (AECID), Asociación para la cooperación con el Sur (ACSUR las Segovias), Paz y Tercer Mundo (PTM), Solidaridad Internacional, Movimiento para la paz (MPDL), Cruz Roja
134 See Appendix 4 for a more detailed list of the organizations and persons interviewed

160
The key informant interviews revealed important findings in terms of relevance of
hypothesis, availability of data and partnerships.
1. Relevance of the hypothesis: The interviews confirmed the relevance of exploring the risk
management strategies in the oPt. On the one hand, the then current Palestinian-Israeli
crisis was treated as a short-term crisis uprooted from its historical background and
detached from its original causes. As a consequence of this, vulnerability was understood
to be a lack of a household means as if the conflict-produced shocks were exogenous to
the process of risk management. Subsequently aid was mostly emergency aid and the
linkages to developmental aid were weak. On the other hand, the determinants of risk
management remained unexplored. The analysis of household vulnerability was taken
from the food security approaches, which used household strategies and their frequency
as the only information to determine the degree of household vulnerability.
2. Availability of data: The Israeli-Palestinian conflict is a well-documented reality. There is
a wealth of data monitoring the occupation-produced shocks135. With few exceptions the
data are for public use and have been collected by a wide range of Palestinian, Israeli and
International Organizations. Besides conflict data, the PCBS is responsible for the
household surveys, which are available for public use. Within the PCBS’s household
surveys, the PECS for 2004, which contains information about household socio-economic
characteristics including risk management strategies, was of particular interest for this
research.
3. Partnerships: The PCBS and the FAO were selected as the organizations to work with as
part of this collaborative research. These two organizations were selected because of the
relevance of their work regarding micro-analysis of risk management during the period
2000-2004.
The PCBS is an independent body within the Palestinian National Authority, whose aim
is to provide official and accurate statistics on demographic, social, economic and
environmental states and trends to serve the Palestinian citizenry, and to serve the
instrumental needs of businesses and their organizations for statistical information on 135 See Table 4.3 in Section 4.2.1 for an overview of the data available on the conflict.

161
states and trends136. PCBS is the PNA institution responsible for the Palestinian
household surveys such as the PECS, Palestinian Census, the Palestinian Labour Force
Survey (LFS), as well as other relevant surveys monitoring the impact of the Israeli
measures following the onset of the second Intifada, in September 2000.
Regarding FAO, we were interested in collaborating with them because of its involvement
with the Palestinian food security assessments (FSA). FSA are one of the tools where risk
management strategies are used to assess household welfare. In 2005, at the time of the
identification phase, FAO had already carried out the FSA for 2003 and was preparing
the questionnaire for the FSA to be carried out in 2006. The objective of the
collaborative research was to be part of the discussions about the design of the
questionnaire.
3.1.2 The Engagement Phase
The second phase of the field work, referred to as the engagement phase, took place during
the period August 2005 – August 2006 and was mainly focused on building a relationship
with the PCBS as well as with FAO. After a preliminary phase of getting to know each other,
in May 2006, collaborative-action research proposals were presented to PCBS and a
discussion paper to FAO137.
The PCBS proposal was concerned with the under-exploration of the household coping
strategies in the context of the Israeli-Palestinian conflict, mostly constrained due to the lack
of longitudinal household data as well as the lack of specific risk-event information within
the household surveys. The availability of longitudinal data and risk events information are
of particular relevance to the study of household vulnerability; without them it is not
possible to take into account changes over time and to assess the relationship between risk
management strategies and conflict-produced shocks. As a way of sorting out these
limitations, and giving an account of the amount of sources monitoring the conflict at the
village level, the proposal suggested analysing risk management strategies at the village level
136 For more information see www.pcbs.gov.ps 137 A copy of these can be found in Appendices 5a and 5b
162
by the construction of a panel of villages using the PECS. The construction of the panel of
villages allowed for changes over time and control of conflict information so that coping
strategies could be analysed within their areas of causes and effects.
However, the events that took place during the Spring and Summer of 2006 – the Israeli
incursion of Lebanon, heavy bombardment of the Gaza Strip and the suspension of the
international aid to the Palestinian Authority following the election of the Hamas
government – disrupted the routine of the Palestinian Government including the Palestinian
Central Bureau of Statistics and any formal collaboration was put aside. In spite of this, and
thanks to the relationship built up during that year and half, the PCBS released for the
exclusive use of this research, the 2004 PECS including the variable ‘household village of
residence’. Being the household survey stratified by region, governorate and type of location,
the PECS 2004 official file for public use does not include the village of residence of the
interviewed households since it is not a representative geographical unit.
Regarding the discussion paper presented to FAO, it introduced considerations about the
current use of coping strategies and introduced a number of issues that need to be taken into
account when analysing household vulnerability and coping strategies in situations of
conflict. After a decade of extensive use of coping strategies as indicators of food insecurity,
they are often used as a catch-all term to describe everything that households do over and
above primary productive activities. They have simply become a synonym with the socio-
economic status of the household or, more recently, with the livelihood security. The
monitoring of this concept of coping strategies has masked the collapse of livelihood systems
by presupposing that people cope even in subsistence economies which are no longer viable
from the point of view of either food or livelihood security. If coping strategies are to be
used as indicators of livelihood vulnerability, it is not enough to have a list of the strategies
chosen; on the contrary, one needs to have information about the shocks, motivations and
reasons for selecting one strategy or the other; the intensity, the effectiveness and the
sustainability of the coping strategy adopted.
Although the paper generated discussion among the FSA team, it did not lead to further
collaboration and I was not taken on board in the preparation of the FSA 2006

163
questionnaire. However, when the FSAs for 2003 and 2006 are compared, there are
indications that reflections have taken place around the concept and use of coping strategies.

164
3.2 Primary Data
A great part of the second phase of the field work was dedicated to collecting first-hand
information about illustrations of household and group responses to the crisis.
Complementing the quantitative examination of risk management strategies, the objective of
the qualitative analysis was to get some insights, outside the current frame of household
survey, about the way Palestinians portray conflict-produced shocks and their responses.
Particularly we are interested in the following questions: how do households perceive the
sources of risks, the objectives and the causes of the conflict-produced shocks? What are the
households’ responses to these conflict-produced shocks? Which are the households motives
explaining the adoption of the strategies portfolio?
The method used were interviews. For this purpose Mr. Fadi Hadeeb, a Jerusalemite working
with youth grassroots organizations, was hired as a translator and facilitator.
20 Individual and 5 group interviews were carried out in Jerusalem, Rammallah, Hebron and
Nablus138. The selection of the interviewees did not aim to be representative either
geographically or in terms of household socio-economic characteristics. On the contrary, the
interviewees were selected based on confidence. Thus, Mr. Hadeeb and myself selected the
persons to be interviewed. On the one hand, the sensitivity of the questions in terms of
household finance and position towards Israel, required an atmosphere of confidence and
trust. On the other hand, the objective of the interviews were far from drawing national
inferences or making representative statements; in fact, it aimed at exploring the risk
management strategies beyond the PECS. Concerned with the similarity found between the
strategies included in PECS (as well as in other households surveys) and those adopted
during natural and economic crisis as well as the possibility that the strategies had not been
identified specifically in the context of armed conflict but rather taken from contexts of
economic and natural crises, interviews were carried out in order to ask Palestinians about
their own perceptions of risk management strategies.
138 See Appendix 6 for the questions grid. The transcripts of the interviews are available upon request.

165
3.3 Secondary Data
The second part of the analysis relies on empirical analysis of household and conflict data. A
bivariate analysis was carried out to explore firstly the characteristics of the conflict-produced
shocks and secondly the relationship between the risk events and the risk management
strategies. Although a detailed description of the data sources and its variables is provided in
Chapter 4, this section introduces the main features of the data so that the methods of
research can be properly explained.
An Introduction to the Data and its Characteristics
The data set, on which the quantitative analysis relies, was constructed for the form of this
research. It combined the PCBS PECS for the year 2004 and village and governorate conflict
data for the period 2000-2004.
1. PECS contains information about risk management strategies and others
socio-economic characteristics139 collected during 2004 for a sample of private
households, whose usual residence is the oPt. It is a survey which has been
stratified by region (North, Middle and South West Bank and the Gaza Strip),
governorate and type of locality (urban, rural and refugee camp). Besides these
geographical levels, the village of residence of the household is also available.
The availability of the village is of particular relevance for this research as it is
the furthest geographical unit, where both household and conflict data
converge.
2. The conflict data includes conflict-produced shocks illustrating the three
dimensions of the Israeli occupation: IDF use of violence, annexation of land
and restriction of movement. The data were gathered from secondary sources,
cover the period 2000-2004 and report shocks at the governorate and village
level.
139 It contains the following aspects: i) demographics, education and employment particulars of the household; ii) dwelling; iii) additional information including risk management strategies and household assets; iv) living conditions from one’s own assessment; v) monthly consumption and expenditure by product.

166
The preparation of the data took a considerably-long period of time. On the one hand, for
the PECS data, although no new variables were created, minor transformations were carried
out to accommodate the variables to the needs of this investigation. On the other hand, the
preparation of the conflict data set was more extensive and demanding. Firstly, the data had
to be entered into the computer. Secondly, in order to have the three occupation instruments
– use of violence, land annexation and restrictions of movement – represented at both village
and governorate level, three variables had to be created: the village closure index, village Wall
enclosure and village proximity to the Wall. The construction of these variables is explained
in Section 4.2.1.4. Given the relevance for this research of the holistic illustration of the
conflict-produced shocks, discussion of the conflict data is presented separately in Section
4.2.
The Objectives of the Correlation Analysis
The quantitative examination of the risk management strategies of households in conflict
relies on a correlation or association analysis140. Given the characteristics of the data and the
limitations of the bivariate analysis, one might argue in favour of a multivariate approach.
The choice of this type of analysis is a matter of scope. The nature of this research was not
purely quantitative and its overall aim was not the construction of an empirical model. On
the contrary, this research relied on a combination of tools and methodological approaches
to explore risk management of households in situations of armed conflict. The quantitative
analysis is hence combined with qualitative research methods and theoretical discussion
about the elements of risk management of households in conflict.
Having made this clarification, the objectives of the correlation analysis are twofold. The first
overall objective is to illustrate the system of control that characterised the Israeli occupation
of the Palestinian Territories during the period 2000-2004. In order to do so, the research
had two specific objectives: i) to illustrate the shock intensity by analysing the shocks across
time and space; ii) to illustrate the rationale of the conflict-produced shocks by exploring the
140 Regarding the use of the terms ‘correlation’ and ‘association’, note that the former is used when both explanatory and dependent variables are scale or interval variables. Association is used when one of the variables is categorical (nominal, ordinal). In spite of the difference, this research uses both terms interchangeably.

167
interactions of the shocks and how they fitted within the discourse of the Israeli-Palestinian
conflict. The interest relies on the the following aspects: did the IDF’s use of violence reflect
the intensity of the Israeli occupation of the Palestinian territories during the period 2000-
2004? What was the relationship between the IDF’s use of violence and the movement
restrictions imposed on Palestinian vehicles and pedestrians? What was the relationship
between the IDF’s use of violence and the annexation of land carried out for construction of
settlements and the Wall? What was the relationship between the movement restrictions
imposed on Palestinian vehicles and pedestrians and the annexation of land?
The second overall objective is to explore the risk management strategies behaviour across
different risk events sources and intensities. The merging of the conflict and households data
allows us to analyse the household’s responses within their immediate causes at the village
level. Since the identification of risk management determinants is out of the scope of this
research the correlation analysis aims to illustrate the importance of the risk events on risk
management. In order to do that we have analysed the relationship between the intensity of
the conflict-produced shocks (IDF use of violence, movement restrictions and land
annexation) and the use of risk management strategies (income-smoothing and risk-sharing
strategies) across different groups of the population. These groups of populations have been
set according to those household characteristics that are portrayed as key influential factors
by the risk management framework as well as those factors proxying the geographical
exposure and vulnerability. Therefore, based on the specificities of the oPt and availability of
data, the Palestinian population has been clustered according to aggregate measures of
poverty (poverty line), specific household’s assets endowments - related to the households
demographics (sex, age, household size), head’s employment (status, job location,
employment sector, dependency ratio), head’s education (educational level), land and
livestock ownership – and the characteristics of the residence’s location (population size,
governorate of residence, distance to the city and type of location - urban, rural, refugee
camp).
In the analysis of these conditional associations, rather than being interested in the specific
extent of use of risk management strategies, we were interested in the type of change the
control variable, i.e. household and residence location characteristics, introduce into the
relationship between strategy’ use and shock’s intensity, what we referred from now on as the

168
relationship ‘strategy-shock’. Specifically we are interested in the following questions: how
different is the relationship ‘strategy-shock’ amongst households exposed to different types of
shocks? How different is the relationship ‘strategy-shock’ among households exposed to
similar type of shocks but differentiated by household’s comparative advantages in terms of
consumption poverty, demographics, skills and labour endowments? How different is the
relationship ‘strategy-shock’ among households exposed to similar type of shocks but
differentiated by residence’s location characteristics?
The Tools of Analysis
The first step in our analysis was to determine whether there was an empirically-significant
association between its two component variables, i.e. either between shocks or between risk
management strategies and conflict-produced shocks.
This objective was accomplished by means of bivariate analysis. The three most commonly-
used techniques of bivariate analysis are contingency tables, analysis of variance (ANOVA)
and correlations. The choice of these techniques mostly depends on the nature of the data
collected141. Thus, contingency tables are used for categorical data (nominal and ordinal);
correlation is used for non-categorical data; and ANOVA is used for categorically-
independent variables on an interval-dependent variable. Therefore, and based on the type of
variables included in the analysis, the exploration of conflict-produced shocks was carried out
through correlation analysis. Since the risk management strategies is a nominal variable, its
relationship with the conflict-produced shocks was measured using association means such as
the test of independence and contingency tables.
Testing Independence
The principal question in any association analysis is whether the variables are independent,
i.e. whether their relationship is statistically significant or whether it is the result of chance.
141 Choosing the most appropriate technique is important in order to avoid type-1 and type-2 errors. If a procedure is used which assumes a higher level of data than one has, standard errors will be underestimated and Type I errors will be higher than the significance level. If on the contrary procedures assume a lower level of data than one has, explanatory power will be lower than it should be due to loss of information and type II errors will be increased.
169
For multinomial sampling with probabilities { }jiπ in a I x J contingency table, the null
hypothesis of statistical independence is jiijoH ++ +== πππ for all i and j.
In order to test for independence of categorical data142, the Person chi-square test is most
commonly relied upon143 and evaluates whether multinomial parameters equal certain
specified values (Crammer, 1998) . The first step in the chi-square test is to calculate the
Pearson chi-square statistic, 2χ
∑∑= =
−=
r
i
c
j i
ii
EEO
1 1
22 )(
χ , where
ijO = an observed frequency
ijE = an expected frequency
r are the rows with i categories
c are the column with j categories.
A consideration in the use of Pearson chi-square statistic is that the approximation to the
chi-square distribution breaks down if expected frequencies are too small. The reason for this
restriction is that the distribution of the chi-square statistic, like the normal distribution, is a
smooth, continuous curve. Observed frequencies, however, change in discrete steps, such as
from 1 to 2 and 2 to 3. Discrepancies between the smooth distribution of chi-square and the
step-like distribution of frequencies are likely to be bigger when the frequencies are small
(Crammer, 1998). It has been suggested (Siegel 1954 in Crammer 1998) that with two
categories, the minimum expected frequency in either category should be 5. If one or both of
the expected frequencies is less than 5, the binominal test should be used. In the case of three
142 However, there are differences between nominal and ordinal data. The Pearson chi-square test is thought to be applicable to nominal data. When one of the variables is ordinal, other tests for nominal-ordinal associations are recommended since it is believed that the chi-square test does not capture the information introduced by the ordinal variable (Crammer, 1998). However, since it is largely recommended to choose the test based on the lowest type of data, the association’s significance is tested by the Pearson chi-square statistic. 143 The Pearson chi-square statistic can then be used to calculate a p-value by comparing its value to a chi-square distribution. A chi-squared probability of 0.05 or less is commonly interpreted by empirical researchers as a justification for rejecting the null hypothesis of independence and hence the association is said to be statistically significant.

170
or more categories, chi-square should not be used when any expected frequencies are less than
1 or when more than 20 per cent of the expected frequencies are smaller than 5. In any case,
it may be possible to increase the expected frequencies in a category by combining it with
those of another.
In our specific case, the requirement of the cells size was a particular limitation. Although
the overall sample size of PECS is 1538, the association between the strategies and the
conflict-produced shocks conditioned to the household or location characteristics reduces the
sample considerably, to the extent that for certain cases the expected frequencies are below 5.
The solution provided by Siegel of merging two categories may not be an answer because if
the explanatory variables (conflict or household-related) can be merged, the problem may
persist because of the low observations found in the dependent variable, the risk
management strategies. This variable has three categories – used, not used, not applicable –
which can not be merged (see section 4.3.2) and the low counts can affect a single row or
column, particularly the ‘not applicable’ category or even zeros can be found in the
marginal. Therefore, on the one hand, if the expected frequencies are found to be small
(indicating either a small underlying population probability, or a small number of
observations), the normal approximation of the multinomial distribution can fail. In such
cases it is more appropriate to use the likelihood chi-squared ratio or the Fisher-exact test.
On the other hand, when zeros are found in the marginal or in the rows or columns, the
particular associations will not be further considered as the Pearson chi-square and the
likelihood chi-squared test can not be computed.
Contingency Tables
Once we know that the relationship between two variables is statistically significant, i.e. they
are not independent, we are interested in knowing their joint distribution. Since most of the
data are categorical data, contingency tables were used, also called cross-classification or cross-
tabulations to display the so-called marginal and conditional distributions. By marginal
distribution we are referring to the joint distribution of two variables, in our case, the
strategies type of use across the intensity of the shocks. When this marginal distribution is
conditioned to another variable, often called the control variable, then the distribution is
referred to as conditional distribution. This can be illustrated by two examples.

171

172
The first example is Table 3.2, which is a 3 x 3 contingency table144, where the variable X =
the risk management strategies with three usage categories (used, not used, not applicable),
and Y = no. of Palestinians killed with three intensity categories (low, medium, high). Note
that the intensity categories have been set according to three cut off-points, which divide the
observations according to certain percentages: low (cut off lowest 33% of the data), medium
(from 34% to 66% of the data), high (highest 33% of the data). The cells contained in the
table rather than providing the number of observations provide the frequency percentages by
columns, i.e. the three categories of used, not used and not applicable are the ones adding to
100%. The number of observations are included in brackets in the column totals. Thus, for
example, if the focus of the attention is the use of risk management strategies across violence
intensities, we observe that while 37.1% of the population used farming in villages little
affected by violence, in high-affected villages, the percentage is considerably reduced to
10.54%.
The last part of the table contains the results of the independence test by providing the
Pearson chi-square statistic, which STATA correcting for the survey design converts it into an
144 A contingency table with I rows and J columns is called an I x J table, where I and J denotes the number of categories of the response variables X and Y respectively.
Table 3.2: Frequency distribution of farming and violence (percentage). No. Palestinians killed Farming and breeding
Low Medium High TOTAL
Used
37.1
38.86
10.54
28.9
Not used 51.23 55.48 66.71 56.55 Not applicable 11.67 5.66 22.75 14.55 TOTAL (number of observations, weighted*)
100 (984)
100 (173.1)
100 (532.8)
100 (1690)
Pearson chi-square test: uncorrected chi2 (4) = 829.61 and designed-based F(3. 85, 37174.25) = 27.335, P= 0.000 Note *: difference between the size of the PECS sample (1538) and the total number of observations in the table above (1690) is due to weighting

173
F statistic and in this test provides the probability145. Note that the test is calculated on the
number of observations and not on the percentages. As mentioned, a probability value below
0.05 rejects the null hypothesis of independence and assumes the association to be
statistically significant.
The second example is the study of the conditional association, which examines the initial
association XY, i.e. strategies-shocks, controlling for any covariate (Z) that can influence it.
The idea of introducing a control variable (Z) is to hold a key variable constant, such as
poverty, and see how the association XY behaves in the different categories of the control
variable, for example poor and non-poor. Table 3.3 below illustrates the associations between
farming and violence controlling for the poverty of the household, which has been referred
to as the conditonal associations.
145 Statistical methods for analysing cross-classified categorical data have been extensively developed under the assumption of multinomial hierarchical loglinear models. Researchers in subject matter areas (social, behavioural and health studies) have used these methods to analyse data from complex sample surveys, but most of the commonly-used survey designs involve clustering and stratification, such as PECS, and hence the multinomial assumption is violated. Among others Rao and Scott (1981) have shown that clustering and stratification can have a substantial effect on the distribution of the standard Pearson chi-square test, and that some adjustment to it may be necessary, without which one can get misleading results. Thus, using the second-order correction of Rao and Scott (1984) they corrected the Pearson chi-square statistic for the survey design and converted it into an F-statistic.
Table 3.3: Frequency distribution of the association between farming and violence for poor and non-poor households (percentage)
No. Palestinians killed Control group Farming and Breeding
Low Medium High TOTAL
Used
43.55
40.36
15.15
36.3
Not used 46.09 54.28 56.95 49.93 Not applicable 10.36 5.36 27.87 13.76 POOR TOTAL (no. mber of observations, weighted)
100 (241.7)
100 (60.55)
100 (94.43)
100 (396.6)
Pearson Chi- test: Uncorrected chi2 (4) = 237.25 & designed-based F(3. 88, 10100.75) = 6.5728, P= 0.000
No. Palestinians killed Control group Farming and Breeding
Low Medium High TOTAL
Used
34.99
38.05
9.54
26.63
Not used 52.91 56.12 68.8 58.58 Not applicable 12.1 5.82 21.65 14.79
NON-POOR
TOTAL (number of observations, weighted)
100 (742.4)
100 (112.6)
100 (438.4)
100 (1293)
Pearson Chi-square test: Uncorrected chi2 (4) = 592.35; designed-based F(3.82, 26884. 42) = 665.91, P = 0.000

174
From the table we can firstly observe certain differences in the distribution of farming and
violence between the poor and non-poor. For example, the poor rely on farming to a greater
extent than the non-poor. Secondly, when we look at the association between farming and
violence across the two groups, we note that both poor and non-poor households living in
high violence-affected villages rely on farming to a lesser extent than those living in low
violence-affected villages. However, while the association decreases monotonically for the
poor (approximately from 44% to 40% and finally to 15%), for the non-poor the decrease is
non-linear. This sort of behaviour suggests that if not being poor does not protect you from
the overall impact of violence on farming, at least it enables you to increase farming in
medium violence-affected villages.
In the analysis of conditional associations, rather than being interested in the specific extent
of use of risk management strategies, we were interested in the type of change the control
variable, i.e. household and residence location characteristics, introduce into the relationship
between strategy’ use and shock’s intensity. The change is classified according to three
behaviours:
1. The direction of the association ‘strategy use - shock intensity’
is different across the categories of a control variable. For
example, while poor households reduce the use of farming
when village violence increases, non-poor households increase
farming as village violence increases. This change has been
denoted OT and is said to introduce modifier effects.
2. The direction of the association ‘strategy use - shock intensity’
is similar across the categories of a control variable but
differences are identified in the shape of the relationship. For
example, while the relationship between farming and violence is
linear among the poor (farming decreases with the intensity of
violence), it is non-linear for the non-poor. This is the type of
behaviour observed in the table above and is denoted as WT.
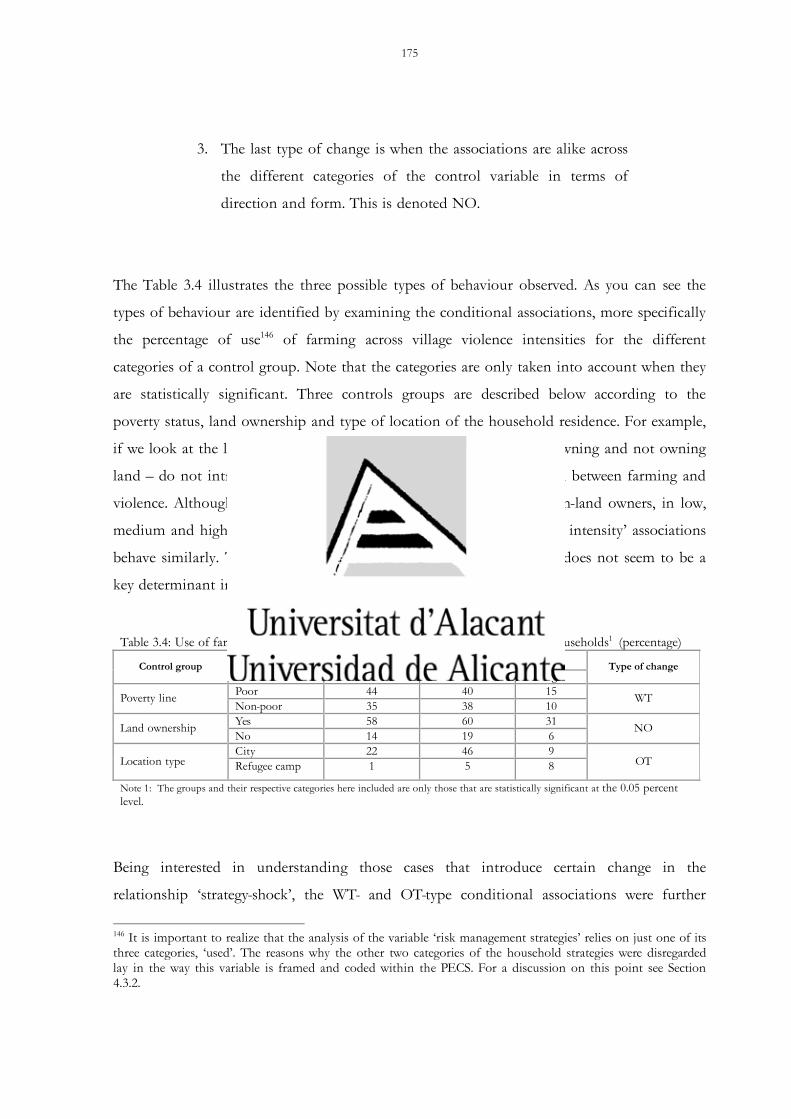
175
3. The last type of change is when the associations are alike across
the different categories of the control variable in terms of
direction and form. This is denoted NO.
The Table 3.4 illustrates the three possible types of behaviour observed. As you can see the
types of behaviour are identified by examining the conditional associations, more specifically
the percentage of use146 of farming across village violence intensities for the different
categories of a control group. Note that the categories are only taken into account when they
are statistically significant. Three controls groups are described below according to the
poverty status, land ownership and type of location of the household residence. For example,
if we look at the land ownership, we see that both of its categories – owning and not owning
land – do not introduce a qualitative change as regards the association between farming and
violence. Although land owners rely on farming much more than non-land owners, in low,
medium and high violence-affected villages, their ‘farming use-violence intensity’ associations
behave similarly. This observation could suggest that land ownership does not seem to be a
key determinant in overcoming the effects of violence on farming.
Table 3.4: Use of farming across village violence intensity for different groups of households1 (percentage) Village violence intensity Control group Category
Low Medium High Type of change
Poor 44 40 15 Poverty line Non-poor 35 38 10
WT
Yes 58 60 31 Land ownership No 14 19 6
NO
City 22 46 9 Location type Refugee camp 1 5 8 OT
Note 1: The groups and their respective categories here included are only those that are statistically significant at the 0.05 percent level.
Being interested in understanding those cases that introduce certain change in the
relationship ‘strategy-shock’, the WT- and OT-type conditional associations were further
146 It is important to realize that the analysis of the variable ‘risk management strategies’ relies on just one of its three categories, ‘used’. The reasons why the other two categories of the household strategies were disregarded lay in the way this variable is framed and coded within the PECS. For a discussion on this point see Section 4.3.2.

176
examined by adding other control variables. While a first-order association variable is one
where the other variable has been controlled, a second-order association is one in which two
other variables have been controlled. As far as possible and always within the limits of the
bivariate analysis, the second order associations would allow us to draw more solid
conclusions about the role that certain household characteristics may play on the association
of study. In order to illustrate the second order associations, the table 3.5 summarizes the
results for one of the above-mentioned cases: households living in refugee camps.
In order to summarize the information from the second-order association analysis, the
following type of table was constructed. It is an excerpt of a 3 x 3 contingency table, which
presents the relationship between the extent of reliance of farming and violence intensity
among camp dwellers (1st order control variable) conditioned to a second factor (2nd order
control variables). For simplification, the cells of the table below contain the percentage of
use of farming across village violence intensities in the form of ‘a, b, c’ representing the
percentage of use of the strategy of farming across the violence intensity ‘low, medium, high’.
For example, looking at the table below, the percentage of farming use across village violence
intensity of poor camp dwellers is ‘0, 12, 17’ which shows that none of the poor households
living in low-violence affected refugee camps use farming, 12% of the poor households living
in medium-violence affected camps use farming and 17% of the poor households living in
high-violence affected camps use farming.
Table 3.5: Use of farming across violence intensities1 for households living in refugee camps conditioned to other characteristics (percentage)
1st order control variable 2nd order control variables2
Employment (hh) Poverty Household
size3 Education
(hh) Sex (hh)
sector status
Land/ livestock owners. Group Category
Poor Non-poor Low
Medium Illiterate Male Government Employed No
Location type
Refugee camp 0, 12, 17 1, 3, 3 0, 0,
5 3, 7, 11 0, 0, 8 1, 6, 9 0, 0, 0 1, 0, 10 1, 5, 8
Note 1 The percentages of farming across village violence intensities are written in the form of ‘a, b, c’, where ‘a’ represents the percentage of use of farming in low violence-affected villages; ‘b’ the percentage of use of farming across medium violence-affected villages; and ‘c’ represents the percentage of use of farming in highly violence-affected villages. The villages conflict intensities have been calculated based on three cut off points: i) Low (cut off lowest 33% of the data), Medium (from 34% to 66% of the data) and High (highest 33% of the data). Note 2: The second-order control variables (and specific categories) included here are just those that are statistically significant at 0.05 % level. Note 3: Low (cut off lowest 33% of the data), Medium (from 34% to 66% of the data) and High (highest 33% of the data).

177
Observing the table we firstly note the low percentages of use of farming. Bear in mind that
6% of the total sample live in refugee camps. We further observe that the positive
conditional association of ‘farming-violence’ of households living in refugee camps noted in
Table 3.4 is overall maintained when we control for other variables. With the exception of
government employees who do not rely on farming at all, the rest of the camp dwellers
(poor, non-poor, small-size households, medium-size households, illiterate, etc.) increase their
reliance on farming with the intensity of village violence. This homogenous behaviour
observed across different groups of camp dwellers has been interpreted as that living in a
refugee camp is a relevant factor, which most probably influences the reliance on farming in
violence-affected villages. In fact if we look back at Table 3.4, while the other households
groups decrease farming with violence, ‘camp dwellers’ is the only group whose reliance on
farming increases with violence. If, on the contrary, the scenario would have been the
opposite, i.e. the observed first-order association (the camp dwellers relationship between
farming and violence) is not maintained when we control for other households
characteristics, then the variable in question ‘living in a refugee camp’ would have been
interpreted as a weak factor, i.e. there is not evidence indicating that it may be a key factor to
take into account when analysing the relationship between farming and violence.
The Correlation or Association Measures
Like any significance test, the chi-square test of independence has a limited usefulness. A
small P-value indicates strong evidence of association but provides little information about
the nature of the strength of the association. Thus, rather than relying solely on the results of
these tests, we investigated the nature of the association by estimating parameters that
describe the strength of the association.
In order to measure the direction and degree of association there is a wide range of tests and
measures available, whose choice depends on the level of measurement of the data and the
distribution of the variables - parametric and non-parametric. When to use a parametric or
non-parametric test is still an unresolved question. Some writers have argued that parametric
tests should only be applied when the data fulfil three conditions (Cramer, 1998): i) the
variables are measured with an equal interval or ratio scale; ii) the samples are drawn from
178
populations whose variances are equal or homogenous; iii) and whose distributions are
normal. Although parametric tests can be run for ordinal data and the effect of the other
two assumptions is believed to be minor on the values of these tests, the fact that most of
our data are nominal obliges the adoption of non-parametric tests.
The following measures of association have been chosen based on the size of our sample (N=
1538), the type of variable (nominal, ordinal, scale) and the size of the contingency tables
(Cramer, 1998).

179
Pearson product moment correlation or r: this is a measure of the linear association
between two interval or scale variables and varies between -1 and +1. It is the ratio of
the variance shared by two variables compared to the overall variance of the two
variables. It is the current analytic tool used to measure the strength of the
correlation between conflict variables.
)()()(
YVarXVarXYCovr×
=
Goodman and Kruskal’s gamma: this is normally used for two ordinals. It is a
symmetric measure ranging from +1 to -1 based on the difference between
concordant pairs (P) and discordant (Q) pairs without taking into account non-tied
pairs. Most of the statistical packages compute its significance level as the computed
phi value, the coefficient of correlation used in the conflict correlation.
)()(
QPQPgamma
+−
=
Crammers’ V: this is based on the Pearson chi-square test and it is used with nominal
variables with more than 2 categories, i.e. contingency tables greater than 2 x 2. V
can be viewed as the association between two variables as a percentage of their
maximum possible variation. It is a symmetrical measure and is the most common
measure of nominal association as it gives good norming from zero to +1. Its
significance can be tested by looking up the statistical significance of the chi-square
value.
( )[ ])1)(1min
2
−−=
crV φ ,
where r is the number of rows, c the number of columns, and N
2χφ = is the
coefficient of phi, where 2χ is the chi-square statistic and N the sample size.

180
Limitations of the Analysis
The research is aware of the limitations of this type of study. First of all, while we can
control for the effects of an additional variable into the relationship, we can not do it
interactively, missing the degree of correlation between groups of variables. This is the
purpose of multivariate analysis. However, in spite of this very important limitation, it is
still very informative to carry out this first level of analysis because it may provide useful
insights into the relationships under study, which may prepare the path for a future
multivariate analysis.
Secondly, one of the immediate consequences of the aggregation of control variables is the
reduction in the sample size and therefore the chi-square independence test can not be
reliably computed. Hence the basis of significant associations is limited. In spite of this, the
findings rely only on those cases, where the Pearson independence test has been computed
and the null hypothesis of independence has been rejected, i.e. the relationship of interest is
statistically significant.
Thirdly, and above all, one of the main limitations of bivariate analysis, either in the form of
contingency tables for categorical data or correlation analysis for scale or interval data, is that
it does not provide evidence of which way causation flows. Despite the fact that we have
assumed the strategies to be the dependent variable and the conflict-produced shocks or the
household characteristics the independent variables, the correlation analysis does not tell you
anything about the direction of cause and effect. It can be that if other variables also cause
risk management strategies, then any covariance they share with the given independent
variable, say conflict-produced shock, in a correlation may be falsely attributed to that
independent.
In principle, in the specific case of the association analysis carried out in this study, there
does not seem to be a problem of endogeneity. If risk management strategies are conceived as
response mechanisms to the crisis, we could assume that the strategies are caused by the
conflict-produced shocks, and not the other way round. However, in context of chronic
conflicts such as the Israeli-Palestinian situation, it is crucial to test for endogeneity between
the strategies and shocks. As has been theoretically argued, conflict-produced shocks are

181
endogenous to the affected livelihoods. Therefore it is crucial to test for the extent to which
shocks are explained by the strategies and indeed the other way round. Being out of the
scope of this research, this is one of our main recommendations for future analysis: to
construct a probabilistic model which would explain the reliance on income-smoothing or
risk-sharing strategies by identifying a group of determinants. Special attention has to be paid
to including the different nature and characteristics of conflict-produced shocks in the
explanatory variables.
To conclude this chapter on the methods of research, one should be reminded of the scope
of this empirical analysis. It is a preliminary exploitation of the data, whose analysis was
conducted on a exploratory basis only. Rather than providing conclusive findings, it aims to
illustrate some of the key aspects discussed in the discussion of households-in-conflict risk
management; and to contribute to future analysis by providing certain knowledge about the
data. Based on these two objectives, empirical analysis uses a descriptive form - both
qualitative and quantitative - and the limitations of this are understood.

182
CHAPTER 4
DATA AND ANALYSIS
This research combines a survey of the literature on risk management of conflict-affected
households with data analysis. This chapter presents the results of descriptive analysis, which
is based on both primary and secondary data. This being a preliminary exploitation of the
data, the objective is to illustrate some of the issues discussed in Chapter 2 and to provide
specific questions for further analysis. The specific objectives are the following:
1. Interviews have been carried out to collect primary data on household responses
and risk events. Secondary data on the oPt, such as PECS and other household
surveys, include information about risk management strategies. However, the list of
responses provided in the surveys has not been purposely configured either in the
specific case of the oPt or more generally in the context of armed conflict. Instead, it
seems to be a blueprint for risk management strategies detached from the type of
crisis they are dealing with. Thus, in order to understand both risk events and
household responses in the context of armed conflict within the framework of the
hypothesis, Palestinians were asked about their own perceptions of risk management.
2. Based on PECS and conflict data, a correlation analysis has been undertaken,
firstly to explore some of the source-related characteristics of conflict-produced
shocks such as multi-dimensionality and the deliberate threat to self-sufficiency; and
secondly to explore the risk management strategies behaviour across risk event
sources and intensities. The merging of the conflict and households data allows us
to analyse the household’s responses within their immediate causes at the village
level. Since the identification of risk management determinants is out of the scope
of this research, the correlation analysis aims to illustrate the importance of the risk
events on risk management. In order to do that we have analysed the relationship
between the intensity of the conflict-produced shocks and the use of risk
management strategies across different groups of the population.

183
One of the main assets of the analysis is the availability of a conflict data set, which has been
constructed for the purpose of this research with the overall aim of illustrating the Israeli
occupation of the Palestinian territories in a comprehensive manner. Thus, it contains
information about the three main instruments of the Israeli occupation; the use of violence,
land annexation and movement restrictions. Unlike other conflict areas, the Israeli-
Palestinian conflict is a well-documented reality. Governmental institutions, non-
governmental organizations (NGOs) and international organizations monitor the progress
giving rise to a great myriad of data. Since the micro-analysis of conflict is highly
constrained by the lack of data, the availability of data that the Israeli-Palestinian case offers
is a great opportunity to understand more about the behaviour of conflict-affected
households.
The chapter is divided into four main parts. Section 1 introduces PECS and describes the
West Bank population in 2004 from a socio-economic perspective. Section 2 considers the
conflict data set and the conflict-produced shocks. The analysis of the conflict data contains
an explanation about the data set construction, a description of the conflict-produced shocks
across time and location and correlation analysis between the occupation instruments.
Section 3 is dedicated to risk management strategies; more specifically to how they have been
studied; the strategy distribution within PECS and the results of interviews about the
Palestinians’ own perceptions of occupation-produced risk and the Palestinians’ responses.
Finally, Section 4 describes the relationship between conflict-produced shocks (use of
violence, land annexation and movement restrictions) and risk management strategies
(income smoothing and risk-sharing) across different groups of the population.
4.1 Palestinian Expenditure and Consumption Survey (PECS) in 2004
This section aims to introduce PECS and to describe the West Bank population in 2004
from a socio-economic perspective, which emphasizes those aspects that, according to the
theory of risk management and the oPt context itself, may play a role in the choice of risk
management strategies.

184
4.1.1 Description of the Survey
The PECS aims to provide information about the standards of living and patterns of
consumption and expenditure among Palestinian households in the oPt. Given the day-to-
day developments in the political realities of the Palestinian situation, PECS provides an
effective basis for analysing the effects of the closure system and other occupation
instruments on the living standards of the population in the oPt.
The PCBS carried out PECS in 1996, 1997, 1998, 2001, 2004, 2005 and 2006147. Despite the
fact that most of these PECS rounds are available for public use, the studies carried out by
international organizations and individuals148 rely mostly on the years 1998 and 2004. One
of the constraints of using the different rounds of PECS is the lack of a homogenous
questionnaire. Although the differences are not great, they are large enough to restrict the
construction of a repeated cross-section, particularly around issues such as assistance and risk
management strategies. Another limitation is found at the stratification level. The PECS
rounds were stratified by different levels and hence certain geographical comparisons are not
possible. For example, while the 1998 PECS is stratified by region and area149, the 2004 PECS
is stratified by region, area, governorate150 and type of location (rural, urban and refugee
camp). In addition, the village of residence of respondents for PECS 2004 was made available
for the purposes of this research.
This research focuses on 2004 because previous PECS’s surveys do not contain questions
about risk management strategies and because subsequent PECS were released after the field
work of this research was carried out and they were not available at the village level.
147 PECS 2001 was withdrawn from public use because of concerns about data collection. 148 Accounts of PECS-based assessments carried out by international organizations and individuals can be found in World Bank (2004a, 2004b), UNSCO (2005), FAO ( 2006), UNCTAD (2006), Astrup and Dessus (2001). 149There are three areas within the oPt: Jerusalem, the Gaza Strip and the West Bank. These are divided into regions: North, South and Middle West Bank, North, Middle and South Gaza Strip, East and West Jerusalem. 150 While Jerusalem is administered by the Government of Israeli, the other two areas are divided in administrative units called governorates. There are 10 governorates in the West Bank (Jenin, Nablus, Qalqilya, Salfit, Tulkarem, Tubas, Rammallah, Bethlehem, Hebron, and Jericho)and 5 in the Gaza Strip (Gaza, Gaza North, Khan Younis, Deil Elbalah and Rafah).
185
The 2004 PECS questionnaire151, which was designed following UN and ILO
recommendations for Household Budget Surveys practiced in most countries since the
Second World War based on the concept of National Accounts (SNA 1993), consists of six
modules: i) The roster, i.e. a statement of the household members, including social,
economic, and demographic particulars of the household; ii) housing characteristics; iii)
assistance information including household coping strategies and ownership of durables and
productive assets such as land and livestock; iv) personal assessment of general living
conditions; v) monthly income of household members according to the source of income;
and vi) monthly household consumption divided into products. Consumption items are
recorded for one month of record keeping and twelve months for consumption of durable
goods.
Of these modules, there are two that have not been used in this research: monthly living
conditions and income of household members. Regarding the latter, PECS put forward
reasons of confidentiality and the data were not released. Vis-à-vis the living conditions, since
objective measures were available in other modules, the use of subjective assessments of the
household living conditions was not addressed
The PECS 2004 sample consists of 3,871 households, of which 3098 completed the interview;
2060 in the West Bank and 1038 in the Gaza Strip. PECS is based on a stratified cluster
systematic random sample selected in two steps. Firstly, a systematic random sample of 299
enumeration areas was selected. These enumeration areas were firstly enumerated in 1997 and
updated in 2003; they consist of building and housing units and have an average of about
150 households in each. These were used as primary sampling units (PSUs). Secondly, a
systematic random sample of 12-18 households from each enumeration area was selected; a
person, 18 years old or above, from each household was then selected for the interview. The
151 A copy of the questionnaire is available in http://www.pcbs.gov.ps/Portals/_PCBS/Pricing/ce_pec_04.pdf

186
target population comprises all private households in the oPt, whose usual residence is the
oPt. The sample has been weighted accordingly152.
The data is subject to both sampling and non-sampling errors. While there is nothing about
sampling errors in the PECS provided methodology description, non-sampling errors are
detailed153. The use of effective training and supervision, and the careful design of questions
have direct bearings on limiting the number of non-sampling errors, and on enhancing the
quality of the resulting data154.
4.1.2 Descriptive Analysis of PECS
The overall goal of this section is to describe certain socio-economic aspects of the West
Bank population in 2004. This description is made from a risk-management perspective, i.e.
emphasising those variables that, according to theory and the specificities of the context, play
a role in the choice of risk management strategies. In this sense, it includes aggregate
measures of welfare, and household and location characteristics. The variables considered
152 There are three different types of weight. Information collected at the household level was weighted by sampling weights (inverse of the probability that the observation is included in the sampling design) to make them representative at the national level as well as to compensate for non-response. In addition there are two others which control for individual age (living conditions and roster files) and for the adjustments made to the poverty measures. However, little is known about these adjustments. Note that the methodological explanations available for PECS are limited to a few lines, most of which are included in this section. See PCBS (2004a) for a detailed description of the methodology used. 153 The following are possible sources of non-sampling errors: errors due to non-response because households were away from home or refused to participate. The overall non-response rate amounted to almost 18%, which is relatively low; a much higher rate is common. The refusal rate was only 10.3%. It is difficult, however, to assess the amount of bias resulting from non-response. There are also errors in data processing such as coding and punching. The data underwent checking and completion of missing information in the office and logical checks were computerized as well as manually, including call-backs if needed. Errors can be found in the responses, which resulted from misunderstanding of the questions, interviewer bias when asking questions and in probing (PCBS, 2004a). 154 According to the PECS methodology, the field operation to collect the data was composed of four teams of female interviewers, three in the West Bank and one in the Gaza Strip. They carried out data collection during a 12-month period, between January 2004 and January 2005. Each team consisted of a supervisor, a field editor, and 7-9 interviewers. Fieldwork teams were distributed to different districts according to sample allocation. An interviewer undertook between 120 and 150 household visits in a month. The households were asked to keep records in a diary. While consumption and expenditure data was recorded daily for one month, durable data was recalled for the last 12 month, so that large variance in estimates is avoided. All field staff received a training session combining general, theoretical and practical components. Interviewers, supervisors and editors for the survey were selected from those who had worked on the previous rounds of PECS. Fieldwork procedures and organization were designed to ensure adequate supervision and the collection of high-quality data. To this end, several quality control measures were used throughout fieldwork (PCBS, 2004a).

187
here are described next155 (note that given the relevance of risk management strategies to this
research, their analysis is not included here but in Section 4.3.1.).
Household Demographics
Within the context of the West Bank, the age and sex of the household head are
determinants of labour capacity as well as of conflict exposure. Particularly, men within an
age range of 14-40 years old are particularly targeted by movement restrictions and the use of
violence (Lein, 2004). Graph 4.1: Age histogram
0.01
.02
.03
.04
Den
sity
0 20 40 60 80 100age
Graph 4.2: Young men histogram (proportional)
01
23
Den
sity
0 2 4 6 8proportional number of men within the age of 14 and 40 per household
In 2004, there was the same
amount of women and men
and 91% of the households
were male headed. As the
histograms show (Graphs 4.1
and 4.2), the Palestinian
population is a young
population, with a mean age of
22 years old and a low
proportion of young men
within the household. This low
proportion, despite the age
distribution, could be
explained by the large sizes of
the households.
The size of the household in the oPt is a human, social and political resource. In the context
of armed conflicts such as the oPt the role of family size goes beyond its contribution to
155 See Appendix 7 for descriptive statistics.
188
labour as it is a safety net and, for some, a symbol of resistance. With an average of 6
members per household, the oPt has one of the highest birth-rates in the Middle East with
rates of 5.64 in Gaza and 4.17 in the West Bank (CIA, 2007). This may come as a surprise. In
spite of the fact that that education is negatively correlated with childbirth (Shultz, 1988), the
education rate in the oPt (see later) is relatively high compared to other countries in a similar
socio-economic situation. One of the reasons explaining this fertility could be related to the
role that religion gives to women. Islam has given great status to mothers and the prophet
Muhammad states that ‘Heaven is under the feet of mothers’. Having a male child, the
carrier of the family name, and the backbone of the society in the Muslim world has
contributed to high birth-rates in Muslim societies. However, looking closely at other Arab
countries in the region, one can observe a steady decline in births whereas this is not the case
in the oPt (CIA, 2007). In the context of the Israeli-Palestinian conflict, the reproductive
policies of Israel156 (affecting Palestinians living in Israel and Jerusalem), the ideology of the
Palestinian leaders and the individual identity of Palestinian women157 (mostly affecting
Palestinians living in the West Bank and the Gaza Strip) are believed to be key contributors
to the so-called ‘demographic war’. Besides the specificities of the Israeli-Palestinian conflict,
the effects of conflict on the reproductive behaviour of affected populations is not well
researched (Verwimp, 2005b). According to McGinn (2000), the evidence on war-affected
populations presents contradictory positions. While high fertility has been observed in times
of economic insecurity and where social or public support networks are unavailable or
uncertain, declines in fertility have been observed in response to short- or long-term
156 The boundaries of Zionist ideology, the dominant ideology of Israeli politicians, are based on being a Jew, which excludes all Arabs living within the border of current Israel and also the oPt. This has led to policies to maximize the number of certain Jews by immigration, displacing Palestinians and selective pro-natal policies (Kanaaneh 2002). The Israeli policies are not based on inclusion of all the citizens but on excluding all those who are not a part of Jewish collectivity..This ‘us’ and ‘them’ boundary, as Yuval- Davis (1997) states, has led to the dual fertility policy of Israel. Thus, while fertility was promoted very selectively and only available to Jews through child and housing allowances, family planning policies targeted Palestinians in Israel. (Kanaaneh, 2002). Despite the depoliticized language of Israel to control the population, political agendas behind the fertility policy and discrimination in childcare and welfare systems between Jews and Arabs has raised great suspicion among Palestinians living in Israel. According to Israeli officials, none of the policies to control population in Third World countries has worked in either ‘modern’ or ‘traditional’ Arab areas in Israel. (Yuval-Davis, 1997). A good illustration of the reactions to the Israeli fertility policies is in the famous poem ‘Identity Card’ by Mahmoud Darwish written in 1964, whose first verse says: ‘Write down/ I am an Arab!/ and my Identify Card is fifty thousand/I have eight children/and the ninth will come next summer/Will you be Angry?’. 157 Within the context of the Palestinian-Israeli conflict, women are not just individuals but are members of the collectiveness, whose body becomes the arena of national struggle with the power to produce and reproduce Palestinians committed to their land. The women’s choice to have many children and the pressure of their community and the fear of being accused of betraying the liberation war are causes and effects of one another and therefore the two notions are inseparable.

189
economic decline, political upheaval, war and famine. Published and unpublished studies on
fertility, desired family size and contraceptive use reveal a mixed response to childbearing
among those affected by war.
Refugee Status
31% of the households surveyed were refugees. It is important to realize that, contrary to
other contexts where being a refugee is normally an indicator of vulnerability, within the oPt,
being a refugee does not necessarily mean that you are worse off than the non-refugee. It
could, indeed, be the opposite as the refugees are under the umbrella of UNRWA, the UN
agency responsible for the welfare of the refugees since 1948, which provides, among other
things, education, health and social assistance. If being a refugee does not necessarily imply
specific welfare conditions, living in a refugee camp does158. Households living in refugees
camps have a slightly higher probability of being poor than those living in rural and urban
areas. Besides, they do not own land or livestock, their heads tend to be less educated and
their employment locations tend to be further than those of the heads living in rural and
urban areas159.
Education
Education is important as it facilitates adaptation to changing circumstances; it makes it
easier and quicker (Shultz, 1988). Palestinians have placed a special emphasis on the value of
education (Hanafi and Tabar, 2005). Education is seen as a durable but moveable asset that
can be used in whatever circumstances a person eventually finds him or herself, in order to
gain social standing and economic well-being. Overall, the level of education in the West
Bank is high for regional standards and for middle-income countries160. According to PECS,
the percentage of adult illiteracy (for persons over 10 years old) is 27% (out of which 18%
158 While most of the persons living at refugee camps are refugees (96%), the majority of the refugees do not live in refugee camps. The frequency distribution of refugee across location type is the following: urban (47%), rural (31%) and refugee camps (22 %). 159 Table 1 in Appendix 9 contains the cross-tabulations between household characteristics and location type (rural, urban, refugee camp). 160 Adult literacy (% age 15 and above) is in the oPt 92.4, in Syria 79.6, in Egypt 71.4, in Jordan 89.9, in Lebanon 86.5, in Tunisia 75 and in Lebanon, 89.9. Gross enrolment ratio (in % combined primary, secondary and tertiary education) is in the oPt 82.4, in Syria 63, in Egypt 76, in Jordan 79, in Lebanon 84 and in Tunisia 74.3 (UNDP, 2007).

190
are functional illiterate), 58% have elementary, primary and secondary education and 15%
have higher education.
Employment
In the oPt, the relevant dimensions of employment towards risk management are
employment status, source and location161. While status may indicate the income situation of
the household, the employment’s location and source could be indicators for conflict
exposure. In 2004, the household heads’ employment distribution was the following: 16%
unemployed, 62% full-time employees, 6% part-time employees, 5 unable to work, 5%
housewife and 6% does not work. Despite the fact that the majority of the heads are
working, the household dependency rate is high; on average 13% of the total family members
are working or its equivalent: 1 working family member supports 4.5 family members.
However, given the age and household size distribution in an Arab context, where children
and women do not normally work, the degree of household employment dependency is
generally high162.
The source or type of employment (national company, foreign company, government, NGO,
international organization, etc.) is important because there are sectors that are more
vulnerable than others. Actually, the main difference is between working in the public sector
and the alternatives. In 2004, there were 14% of households whose heads worked as public
employees. During the period of study, working in the government was a safety net; it was
the sector most immune to the economic degradation163. On the one hand, a great part of
foreign aid was dedicated to covering the payrolls of civil servants (OCHA, 2005a). On the
other hand, during the period 2000-2004, the employment shock produced by the movement
restrictions was partially absorbed by the Palestinian domestic economy. The Palestinian
161 PECS includes other employment variables such as the type of employment (family business, self-employed, salaries and family-business) and the source of income (agriculture, own business, pubic wages, private wages, wages from Israel, remittances from Palestine). However, there is some incongruence on these two variables that have led us to drop them from the analysis. 162 According to the PCBS Labour Force Survey the number of Palestinians supported by each worker was 5 in 1999, 7.2 in 2001 and 6.2 in 2003. These figures are just an indication of the change over time; they cannot be compared to the above-mentioned dependency ratio as they are neither calculated at the household level nor restricted to the West Bank. 163 In 2006, the government employees stopped being less vulnerable to the crisis. The reason for this was the cancellation of foreign aid in the form of budget support mostly targeting civil servants payrolls.

191
Authority created approximately 30,000 new jobs, employing at least 30% of those who are
currently working (UNCTAD, 2006).
In the context of the oPt, another important dimension of the employment characteristics is
the job’s location; due to the system of closure, the further the job, the higher the exposure
to movement restrictions. Although the use of this variable as a proxy of conflict exposure
requires the information about whether the person travelling holds the requirement permit,
the simple fact of travelling (with and without the permit) increases the risk of being trapped
at a checkpoint and transport expenditure (OCHA, 2005b). During 2000-2004 the movement
of Palestinian people and goods was heavily restricted, particularly to enter Israel and the
settlements as well as to move within the West Bank. As a result of this, employment has
been localised increasing the percentage of people working in the same governorate and
reducing the percentage of people working in a different governorate and in Israel and in the
Israeli settlements of the West Bank164. In 2004, 86% of the workforce worked close to
residence, either in the same locality (45%) or governorate (31%). The rest of the workforce
worked in a different governorate (9%), in Israel and the settlements (15%).
Productive and Durable Assets
PECS contains information about land, livestock, houses, cars and household appliances
Productive and durables assets are important because they are either the tools for certain
activities or they can serve as bank guarantees. Regarding productive assets, 41% of the
households own land, which is predominantly used for agriculture and 28% of the
households own livestock, most of it poultry, sheep and goats.
Graph 4. 3: Size of land across households
Within a mean of approximately 10 dunums
164 According to the PCBS Labour Force Survey, the employment distribution in the West Bank, according to the location of employment during 1999-2003, is the following: in 1999, 63% of the employment was within the same governorate, 6% in other governorates and 24% in Israel and the Israeli settlements in the West Bank. In 2001, 64% of the employment was within the same governorate, 5% in other governorates and 22% in Israel and the Israeli settlements in the West Bank. In 2003, 80% of the employment was within the same governorate, 7% in other governorates and 5% in Israel and the Israeli settlements in the West Bank (PCBS Labour Force Survey, 1999, 2001, 2003).
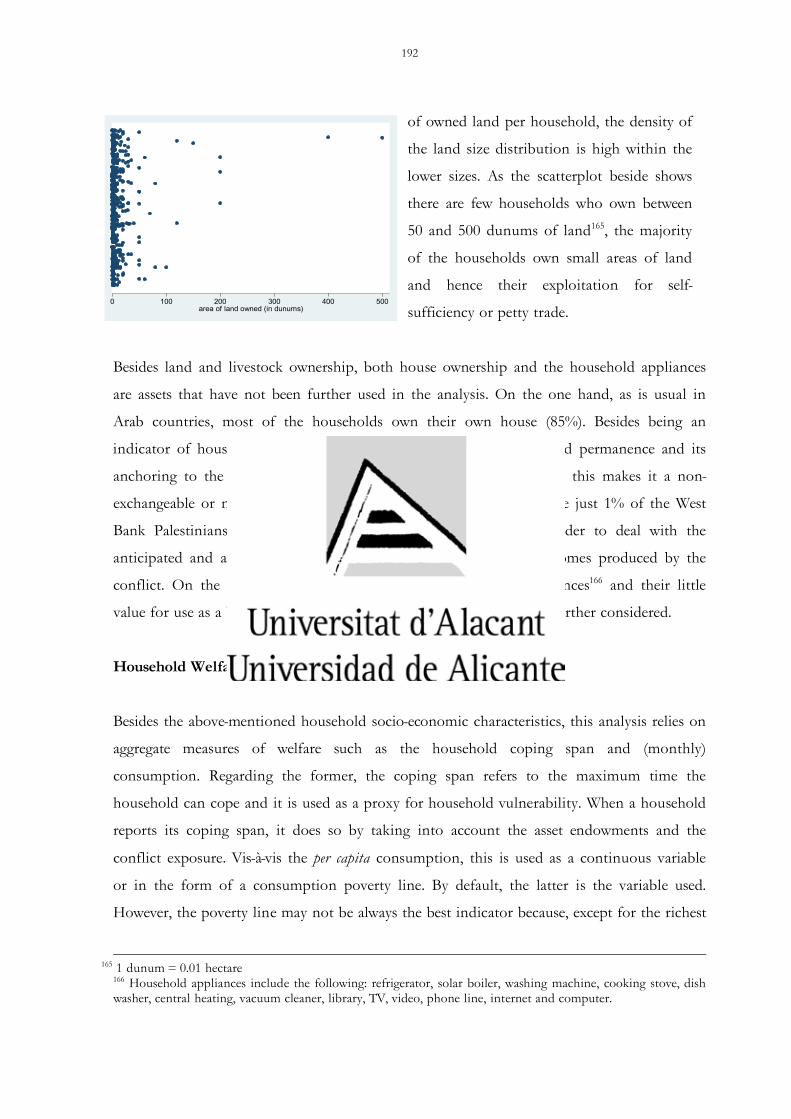
192
0 100 200 300 400 500area of land owned (in dunums)
of owned land per household, the density of
the land size distribution is high within the
lower sizes. As the scatterplot beside shows
there are few households who own between
50 and 500 dunums of land165, the majority
of the households own small areas of land
and hence their exploitation for self-
sufficiency or petty trade.
Besides land and livestock ownership, both house ownership and the household appliances
are assets that have not been further used in the analysis. On the one hand, as is usual in
Arab countries, most of the households own their own house (85%). Besides being an
indicator of household status, the house is an indicator of household permanence and its
anchoring to the local community and to the Palestinian cause, and this makes it a non-
exchangeable or non-saleable asset. As it will be shown later, there are just 1% of the West
Bank Palestinians that have sold or mortgaged their houses in order to deal with the
anticipated and actual losses associated by the risk events and outcomes produced by the
conflict. On the other hand, givent the nature of household appliances166 and their little
value for use as a buffer-stock or bank guarantee, they have not been further considered.
Household Welfare
Besides the above-mentioned household socio-economic characteristics, this analysis relies on
aggregate measures of welfare such as the household coping span and (monthly)
consumption. Regarding the former, the coping span refers to the maximum time the
household can cope and it is used as a proxy for household vulnerability. When a household
reports its coping span, it does so by taking into account the asset endowments and the
conflict exposure. Vis-à-vis the per capita consumption, this is used as a continuous variable
or in the form of a consumption poverty line. By default, the latter is the variable used.
However, the poverty line may not be always the best indicator because, except for the richest
165 1 dunum = 0.01 hectare
166 Household appliances include the following: refrigerator, solar boiler, washing machine, cooking stove, dish washer, central heating, vacuum cleaner, library, TV, video, phone line, internet and computer.
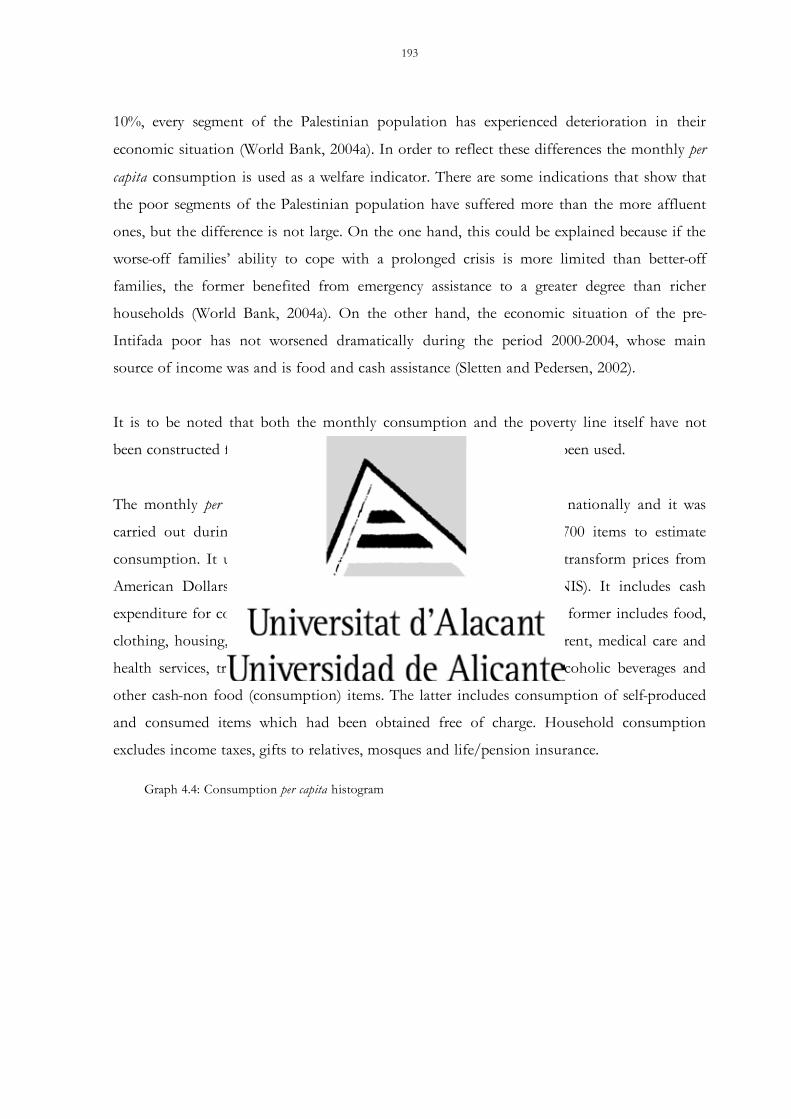
193
10%, every segment of the Palestinian population has experienced deterioration in their
economic situation (World Bank, 2004a). In order to reflect these differences the monthly per
capita consumption is used as a welfare indicator. There are some indications that show that
the poor segments of the Palestinian population have suffered more than the more affluent
ones, but the difference is not large. On the one hand, this could be explained because if the
worse-off families’ ability to cope with a prolonged crisis is more limited than better-off
families, the former benefited from emergency assistance to a greater degree than richer
households (World Bank, 2004a). On the other hand, the economic situation of the pre-
Intifada poor has not worsened dramatically during the period 2000-2004, whose main
source of income was and is food and cash assistance (Sletten and Pedersen, 2002).
It is to be noted that both the monthly consumption and the poverty line itself have not
been constructed for the sake of this research; PCBS calculations have been used.
The monthly per capita consumption has been constructed by PECS nationally and it was
carried out during a 12-month period and it includes more than 700 items to estimate
consumption. It uses real prices and average-yearly exchange rates to transform prices from
American Dollars or Jordanian Dinars into New Israeli Shekels (NIS). It includes cash
expenditure for consumption purposes and consumption in kind. The former includes food,
clothing, housing, furniture, household utensils, house repairs, house rent, medical care and
health services, transport and communication, recreation, tobacco, alcoholic beverages and
other cash-non food (consumption) items. The latter includes consumption of self-produced
and consumed items which had been obtained free of charge. Household consumption
excludes income taxes, gifts to relatives, mosques and life/pension insurance.
Graph 4.4: Consumption per capita histogram

194
05.
0e-0
4.0
01.0
015
.002
Den
sity
0 2000 4000 6000 8000monthly consumption per capita (in NIS)
The histogram in Graph 4.4 plots the
distribution of the monthly per capita
consumption across households. With
a mean monthly per capita
consumption of 649 NIS167, the
consumption distribution is skewed to
the left.
The consumption poverty line has been constructed using the welfare measure of
consumption and estimates the share of the population below the poverty line. It takes into
account economies of scale and household composition by estimating the minimum needs
of a ‘benchmark family’ comprising 2 adults and 4 children. The official poverty line for the
oPt, developed by the National Commission for Poverty Alleviation in 1998, corresponded
to NIS 1,800 per month for the benchmark family. Using a NIS/US$-exchange rate of 4.4,
this translates into a poverty line of US$2.3 per day per member of the family. A narrow
definition of poverty is subsistence poverty, which in the oPt it has been estimated at NIS
205 per capita per month, which translates into US$1.6 per capita per day. According to the
consumption poverty line, in 2004, 24% of the interviewed households were in poverty and
14% in deep poverty168.
The conflict impact assessment carried out in the oPt during the period 2000-2004
investigatd the welfare profiles169. Two types of characteristics are considered, the permanent
or long-term (e.g. demography, education, location, refugee status, etc.) and the transitory
(e.g. employment characteristics - status and type, amount of savings, and strength of social
networks). It was generally found that the poor tend to have larger families and relatively low
167 1 US Dollar = 4.4 NIS (at December 2004). 168 It is interesting to note that the amount of poverty decreases when subjective measures of poverty are used. In this case, 16% of the households are poor. This difference is surprising since normally it is the other way round, i.e. relative poverty estimates being greater than the measures of absolute poverty. However, bearing in mind that there are objective and subjective measures of poverty, their comparison has to be made cautiously. The difference observed could indicate many things; such as Palestinian optimism, the fact that poverty is not only consumption, welfare relativity and differences when poverty is widespread. 169 The studies which carried out quantitative assessments of conflict effects on household welfare are the following: the World Bank series of Economic Assessments (2002, 2003, 2004a, 2004c); the PCBS reports on PECS (PCBS, 2004a); the University of Geneva for the Swiss Development Agency and various UN agencies looks at the Palestinians’ own perceptions on their living conditions (IUED, 2004); the FAO carried out food security assessments (FAO, 2003, 2006).
195
levels of education and that poverty is particularly common in Gaza and in rural areas a well
as in refugee camps. Poverty seems also to be related to unemployment and sporadic jobs (as
opposed to regular, permanent) jobs, working in Israel or Israeli settlements and working in a
foreign company (as opposed to working in the government or in a national company).
Neither refugees nor female-headed households are significantly more likely to be poor than
others. These findings are in line with the poor profiles identified by this PECS-based
research using frequency distributions170.
Although the policy of closure was recognized as being the single most important factor
negatively affecting the Palestinian economy and living conditions, restricting access to
people’s livelihoods171 (e.g. food, employment, health services, education, etc.), the
relationship between shocks (type and intensities) and household welfare has not been
assessed and the importance of the former on the latter is accounted for in general terms.
Besides household characteristics, the conflict impact assessment looking at qualitative
aspects of household welfare carried out in the oPt during the period 2000-2004 paid
particular attention to household location, such as the region and governorate of residence,
the location type (urban, rural, refugee camp) and the employment location (Israel,
settlements, the West Bank). On the one hand, geography matters as it influences the
economic pattern and behaviours172 as well as household poverty (Bigman and Fofack, 2000).
Geography influences these either directly through geographical issues such as transport,
natural resources or agricultural economics, or more indirectly, by the impact of location or
climatic conditions on trade, labour flow and poverty. Regarding the latter, the geographical
conditions that households live in determine access to market places and roads, proximity to
towns, common property resources, access to services, the quality of the soil and climate, etc.
On the other hand, in the context of armed conflict the geography or more specifically the
household’s location (residence and employment) becomes particularly important. Conflict-
produced shocks can target people based on their welfare, ethnic origin but also on their
170 See Appendix 8 for welfare profiles and Appendix 9 for location profiles. 171 For a review of the impact of closure on Palestinian livelihoods see: Roy (2001a, 2001b), Aranki (2004), Brown (2004), Lein (2004), Bornstein (2001), World Bank (2002, 2003, 2004a, 2004b), UNSCO (2005), OCHA (2005a, 2005b; 2007) and Al Haq (2005). 172 See, for instance, Redding and Venables (2000), who suggest that 70 percent of the variation in per capita income across a country can be explained by the geography of access to markets and the source of supply of intermediate inputs.

196
location. In the Israeli-Palestinian conflict, land and space being the issues of contention173,
the geography of the conflict matters profoundly, influencing household exposure and the
ability to bounce back. Firstly, there are significant differences in living standards across
localities within the West Bank due to the large variations in geographical conditions and the
political status conferred to the different areas by the Oslo agreements, which determine
access to markets, urban centres and the quality of services. We did not find any study that
assess households poverty or vulnerability based on the residence’s location according to the
areas A, B and C. Given its importance, this type of research is strongly encouraged.
Secondly, there are great geographical differences in the impact of Israeli occupation across
areas. Both the use of violence, annexation of land and restrictions on the mobility of the
Palestinian population and goods depend on the place of residence. For instance, living in a
major urban centre in the West Bank such as Rammallah compared to a town in the north
east surrounded by settlements and enclosed by the Wall has very different implications in
terms of movement restrictions, use of violence, annexation of land and consequently most
probably on household’s poverty status and risk management strategies. Closer increases if
the village of residence or work is close to the Wall, a military post, settlements and access
roads (OCHA, 2007). Other location determinants are those related to the location
remoteness and dependence on the Israeli economy. As UNSCO (2005) noted in its West
Bank villages study, the impact of closure has been particularly severe on rural and remote
communities that are highly dependent on their links (markets, productive and social
services) to the West Bank as well as to Israel.
Concerned with the geography of conflict and the territorial differences produced across the
West Bank, Astrup and Dessus (2001) explored the geography of poverty in the West Bank in
1998. They constructed a poverty map for 132 localities174 (108 in the West Bank, 24 in the
Gaza Strip) and observed that despite the limited sizes of the West Bank and Gaza Strip,
there existed large and significant differences in the incidence of poverty across localities in
the oPt. First, the incidence of poverty is highest in the southern part of Gaza, northern
Jenin, southern Hebron and northern Jericho. Secondly, the incidence of poverty is lowest 173 Hanafi (2008) calls the dispossession, occupation and destruction of Palestinian living space spacio-cide. 174 The poverty map was constructed using a two-step statistical procedure whereby information on the correlates of poverty extracted from household surveys, specifically 1998 PECS, was combined with information on the characteristics of households as reported in the Census survey from 1997.

197
around urban centres in the West Bank, particularly in the town of Rammallah and in the
city of Nablus. If we compare these results with the frequencies distribution of the poor
according to PECS 2004, we do not observe exactly the same patterns. The incidence of
poverty across governorates and location type175 was the highest in refugee camps and in the
governorates of Jenin, Tubas, Hebron and Bethlehem, where approximately 30% of the
population were poor.
In order to illustrate the importance of exposure-related factors, we have looked at the
frequency distribution of household coping spans, proxied for vulnerability, across poverty
status. Vulnerability seems to be positively related to poverty; as it can be observed in the
Table 4.1, the shorter the period of possible coping, the greater the proability of being poor.
Table 4.1. Relationship between household poverty and vulnerability
Maximum coping period Poverty > 12 months 4-12 months < 4 months In danger Unknown
Chi-square statistic
Poor 14 27 27 19 13 Non-poor 41 25 17 5 12
849.2337*
Note: * = Significant at the 0.1 per cent level
However the relationship between household poverty and vulnerability shows that not all the
vulnerable are poor and not all the poor are vulnerable. Regarding the former, it could
indicate that in the context of political crisis, vulnerability is beyond economic means. As
Justino and Verwimp (2008) found out, in context of armed conflict, the household’s
movements in and out of poverty depend on households and conflict-produced shocks
characteristics. Vis-à-vis the latter – not all the poor are vulnerable -, there are poor
households, which have not been affected that much since 2000 and have had a more or less
stable livelihood (Sletten and Pedersen, 2003). In order to understand household
vulnerability it is necessary to understand the context. The following section presents the
instruments of the Israeli occupation of the Palestinian Territories.
175 Appendix 5.4 contains the cross-tabulation between household characteristics and governorate.

198
4.2 Conflict Data
The Israeli occupation of the Palestinian Territories is a well-documented reality.
Governmental institutions, NGOs and international organizations have put great efforts into
monitoring its development, giving place to a great myriad of data. In a context where the
micro-analysis of conflict is highly constrained by the lack of relevant data, the study of the
Israeli-Palestinian conflict offers a great opportunity to approach the behaviour of conflict-
affected households. Thus, the overall aim of this section is to discuss the source-related
characteristics of the conflict-produced shocks during 2000-2004, such as their endogenous,
dynamic and structural nature as well as their multi-dimensionality. In order to do so, this
section has been divided into three main sections. Section 1 details the construction of the
data set, from the identification of the shocks to the selection of the variables. Section 2
provides a descriptive analysis of the conflict across time and space. Section 3 uses a
correlation analysis to understand the relationships between the conflict instruments.
4.2.1 The Conflict Data Set
As has been argued during the theoretical discussion, the lack of information about the risk
events or shocks have been one of the main constraints of the micro-analysis of conflict. In
the more general framework of the analysis of risk management, the lack of specific data on
the risk events had important consequences: i) the crisis-produced shocks are proxied by the
coefficient of variation on the impact variables; ii) risk management strategies are categorized
without their causes; and iii) the risk events have not been studied in a comprehensive
manner taking into account all the characteristics in terms of nature, spread, predictability,
intensity, duration and frequency.
In the case of the Israeli-Palestinian conflict, in spite of the availability of conflict data and
its identification as the main cause of the current poverty levels in the oPt, the analysis of
risk management strategies was not carried out from a shock perspective; instead the focus
was placed on household-related determinants, hence emphasising the symptoms (e.g.
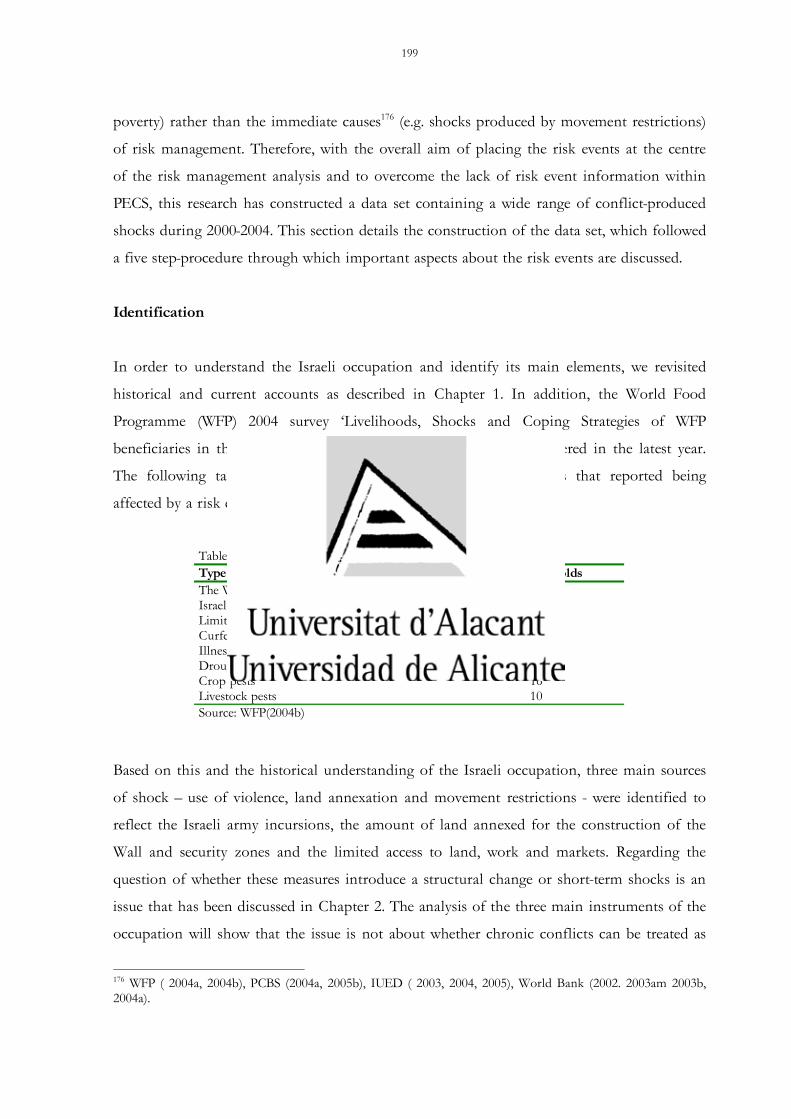
199
poverty) rather than the immediate causes176 (e.g. shocks produced by movement restrictions)
of risk management. Therefore, with the overall aim of placing the risk events at the centre
of the risk management analysis and to overcome the lack of risk event information within
PECS, this research has constructed a data set containing a wide range of conflict-produced
shocks during 2000-2004. This section details the construction of the data set, which followed
a five step-procedure through which important aspects about the risk events are discussed.
Identification
In order to understand the Israeli occupation and identify its main elements, we revisited
historical and current accounts as described in Chapter 1. In addition, the World Food
Programme (WFP) 2004 survey ‘Livelihoods, Shocks and Coping Strategies of WFP
beneficiaries in the oPt’, asks about the shocks households have suffered in the latest year.
The following table provides the percentages of WFP beneficiaries that reported being
affected by a risk event.
Table 4.2: Risk events in the oPt Type of risk % of households The Wall & security zones 71 Israel Army incursions 66 Limited access to land, work and markets 61 Curfew 54 Illness 41 Drought or irregular rains 36 Crop pests 16 Livestock pests 10 Source: WFP(2004b)
Based on this and the historical understanding of the Israeli occupation, three main sources
of shock – use of violence, land annexation and movement restrictions - were identified to
reflect the Israeli army incursions, the amount of land annexed for the construction of the
Wall and security zones and the limited access to land, work and markets. Regarding the
question of whether these measures introduce a structural change or short-term shocks is an
issue that has been discussed in Chapter 2. The analysis of the three main instruments of the
occupation will show that the issue is not about whether chronic conflicts can be treated as
176 WFP ( 2004a, 2004b), PCBS (2004a, 2005b), IUED ( 2003, 2004, 2005), World Bank (2002. 2003am 2003b, 2004a).

200
shocks, but on how to capture the double time nature of the conflict – structural and
dynamic.
Compilation
In order to look for data capturing the above-mentioned dimensions of the Israeli
occupation, we rely on secondary sources from Palestinian, international and Israeli
organizations which have carefully monitored the occupation within the context of the
Palestinian-Israeli conflict. The organizations consulted were the PCBS, the Palestinian Red
Cross Society (PRCS), OCHA, UNRWA, the International Committee of the Red Cross
(ICRC), B’Tselem and PeaceNow. The following table summarizes the result of this research
by detailing the data available by source, time coverage, unit of analysis and its rationale.

201
Table 5.3: Available conflict information
Data Source Time coverage Unit of analysis Rationale
B’Tselem Daily from October 2000 Village
PRSC Monthly from Sept. 2000 Governorate No. Palestinians
killed
OCHA Monthly 2004 & 2005 Governorate
PRSC Monthly from October 2000 Governorate No. Palestinians
injured OCHA
Monthly for 2005 & 2006 Governorate
B’Tselem Monthly from January 2001 oPt No. Palestinians
detained OCHA
Monthly June 2005 – Oct. 2006 Governorate
No. arrests & search campaigns OCHA
Monthly June 2005 – October 2006
Governorate
By killing, injuring or arresting, the Government of Israel (GoI) tends to reduce militant attacks and organized resistance
OCHA Daily October 2003 - 2006 Village
UNRWA Daily July 2002 – September 2003 Village
USE
OF
VIO
LEN
CE
No. hours under curfew
PRSC Monthly June 2003- March 2005 Governorate
In spite of a curfew being one of the most sweeping and extreme restrictions of movement, as it imprisons entire communities within the confines of their homes, it also serves many purposes related to the use of violence (to restore calm and order; to prevent disturbances during house demolitions, Jewish holidays, to facilitate search and arrest campaigns, etc.
OCHA Daily from October 2003 Village
Although it is officially said by the GoI that houses are demolished to punish militant supporters and their relatives, it is also used to clear land which later is claimed by the GoI.
No. of houses demolished
PCBS April 2005 (aggregate since 2000)
Governorate
No. of settlements PCBS 1967 - 2005 Governorate Settlements, built-up areas & municipal boundaries
PCBS 2005 and 2001 (respectively) Governorate
Settlement occupied areas.
Peace Now 2006 Settlements
Settlers population PCBS 1996-2005 (yearly) Governorate
The construction of settlements in the West Bank is one of the main reasons for land annexation.
Amount of confiscated land
OCHA October 2003 – November 2006 Village It can occur that land rather than being occupied, it is first confiscated.
ANN
EX
ATIO
N O
F LA
ND
Amount of confiscated land for the construction of the Wall
PCBS August 2003 & March 2004 Governorate The Wall, when it is finished, will de facto annex 47% of the West Bank..
No. of checkpoints & roadblocks per governorate
OCHA
2000, December 2003, January 2004, March 2004, July 2004, November 2004, April 2005, August 2005, January 2006, July 2006.
Governorate
An average of 700 obstacles – checkpoints, roadblocks, trenches, earth mounds, gates – have been placed in the West Bank since 2002, to control the movement of persons and goods within the West Bank.
RE
STR
ICT
ION
S O
F M
OVE
ME
NT
Index of movement restrictions
ICRC October 2004, June 2005 and March 2006
Villages (a non-representative sample of 156
Village movement restrictions are being assessed by types of permits required, types of obstacles affecting movement, level of closure, aspects of life affected by lack of movement

202
villages)

203
Selection
Out of the total number of variables, highlighted in Table 4.3, a group was chosen based on
three criteria:
i) the three instruments – use of violence, land annexation and movement
restrictions – need to be represented.
ii) the time covered by the data has to be the year of PECS, 2004, and if possible
within the whole period since the onset of the II Intifada, i.e. 2000-2004.
iii) the unit of analysis of the variables has to be both governorate and village.
Out of these criteria, the most controversial is the unit of analysis requirement. It is
important because it provides the nexus between the two data sets used in the analysis of risk
management, i.e. PECS and the conflict data. As mentioned in Chapter 3, the furthest
geographical unit, where both household and conflict data converge is the village. In the oPt,
this disaggregation to the village level is particularly relevant given the geography of the
conflict and the territorial differences produced, as mentioned in the previous section. In
addition, most of the studies on conflict in the oPt are disaggregated by two physically-
separated entities (Gaza or the West Bank), by region (north-middle-south Gaza and north-
middle-south West Bank) or by the 11 governorates which divide the West Bank and the
Gaza Strip. The only study analyzing conflict further than the above-mentioned units of
analysis, is the previously-mentioned work of Astrup and Dessus (2001) based on oPt villages.
Creation
In order to have at least three instruments represented at the governorate and village level,
new variables were constructed. Since it was not possible to decompose governorate-variables
into village-variables177, it was decided to construct village equivalents of the governorate
variables illustrating land annexation and restrictions of movement.
177 Most of the governorate variables were constructed for that level and not by adding up village-level information.
204
As a matter of simplification, the village-equivalents were constructed not for all of the 641
villages in the West Bank but just for the 100 villages surveyed in PECS. Three new variables
were constructed to illustrate land annexation and restriction of movement at the village
level. The construction of the village-equivalents was based on OCHA maps monitoring the
status and changes of closure in the oPt since 2003178.
1. Village proximity to Wall: this is a dummy variable stating whether the village is
within one kilometre to the Wall. It is assumed that the closer to the Wall, the higher
the probability of the village having land annexed. This variable was constructed
from the start of the construction of the Wall, June 2002, till December 2004.
2. Village Closure Index (VCI): inspired by the Movement Restriction Index constructed
by the ICRC over a non-representative sample of villages within the West Bank, the
VCI was constructed for the sample of villages included in PECS. It measures the
degree of proximity between the village and its natural centre, assumed as the closest
community with a hospital. It ranks the degree of movement restrictions between 0
and 5 depending on i) the type of obstacle used either -checkpoint) or unmanned-
operated (trench, earth mound, road block); ii) the type of road where the obstacle is
located (main or secondary). The village closure index is available for December
2003, January 2004, March 2004, July 2004, and November 2004. For a detailed
description of the construction of the village closure index see Appendix 10.
3. Wall Enclosure of Village: this variable has been constructed to complement the
village closure index, which does not take into account the restrictions imposed by
the Wall due to its different nature. The Wall enclosure of village describes how
much the Wall encloses the village, specifically how many village sides are within
1km of the Wall. This variable has been constructed for the period June 2002 –
December 2004 and its values go from 0 to a maximum of 4.
178 OCHA maps monitor the closure obstacles and construction of the Wall. They contain details on the villages, road systems as well as type of obstacles. They have been available since 2003 and they are released on a quarterly basis. See http://www.ochaOPT.org/?module=displaysection§ion_id=96&static=0&format=html

205
Representation
This last step in the construction of the data set aims to select the most representative
variables of each occupation instrument during the period 2000-2004 taking into account
that both village and governorate levels need to be represented. In order to do this, a
correlation analysis was carried out across the variables of each instrument. Besides selection
of the most representative variables, this type of analysis allows getting to know some aspects
of the conflict-produced shocks such as their structural and dynamic nature.
Use of Violence
The table below summarises the Pearson coefficient of correlation of violence variables
depending on time (for the single year 2004 and for the period 2000-2004) and the unit of
analysis (governorate and village). The strongest correlations are between the number of
Palestinians killed and the hours under curfew. It seems that curfews, besides imprisoning
entire communities within the confines of their homes, serve many other purposes related to
the use of violence. The fact that curfew is weakly related to low-profile use of violence
(injuries) but strongly related to high-profile violence (deaths), underlines the violent nature
of IDF military incursions into the oPt, which normally take place under curfew.
Given the strong correlations observed between number of Palestinians killed and hours
under curfew, the latter will be not further considered in the correlation analysis between
strategies and conflict-produced shocks. Regarding the number of injured, it is not further
considered because its geographical coverage does not include village.
Table 4.4: Pearson coefficient of correlation between variables proxying violence according to time coverage and unit of analysis
Correlated variables Governorate 2000-2004
Governorate 2004
Village 2000-2004
Village 2004
No. Palestinians killed – No. Palestinians injured 0.39* 0.48* na na
No. Palestinians killed – No. hrs under curfew 0.80* 0.68* 0.74* 0.47*
No. Palestinians injured – No. hrs under curfew 0.14* 0.52* na na
Note: * = significant at the 0.05 percent level using Pearson chi-square test Note: na = stands for not available and it is used for those cases where the two analysed variables are not available at the same level of analysis, i.e. governorate or village.

206

207
Annexation of Land
The construction of the settlements and the Wall are part of the policy of occupation,
aiming to clear land for continued expansion into the land recognised under international
law as territory on which the Palestinian people are entitled to exercise their rights to self-
determination (Al Haq, 2005). Despite the importance of the settlements in the Israeli-
Palestinian conflict, as argued in Chapter 1, this study cannot consider them further and
include them in the analysis of Palestinian risk management. The main reason for excluding
them is because of the unavailability of data accounting for the changes in settlement
structures across Palestinian governorates and villages during the period 2000-2004. During
these four years, most of the changes registered in the settlement structures have been due to
the expansion of built-up areas and the population of settlers (OCHA, 2007). Unfortunately,
since it is not possible to account for the land area being annexed for those purposes, the
settlement variables cannot be considered as land annexation shocks. Instead the settlement
variables will be used to understand other conflict shocks, such as those produced by the use
of violence or movement restrictions.
The other variable used to illustrate the annexation of land is the construction of the Wall.
The construction of the Wall was not done either in a systematic manner (the route of the
wall was changed on several occasions during 2004 and 2005) or as a one-off exercise.
Instead, the construction of the Wall comprises a long-term process. In January 2005, out of
the total 670 kilometres of the Wall, 209 kilometres were completed and the rest was
classified into the following categories: planned, special security area, route subject to the
completion of further inter-ministerial examination, and road protection (see map, Chapter
1). Although the probabilities of crossing the Wall are reduced as its construction is
advanced, being able to cross the Wall, whatever the status, is always an uncertain event
because the area is protected and subject to military rule. Like movement restrictions, if the
construction of the Wall introduces a structural change in the territory and therefore in the
Palestinian economy and society, it also introduces micro-scale and short-term shocks

208
produced by the changes in the policy of closure (including the Wall) which determines the
number of working gates, the opening hours of gates and permit requirements179.
The Table 4.5 presents the Pearson coefficients of correlation between all the variables that
illustrate the annexation of land due to settlements or Wall construction. Unlike the violence
variables, the land annexation variables do not include a time period and or different unit of
analysis. All the land annexation variables are collected at the governorate level180 and for
single years. The table is divided into two parts. The first part is concerned with the
correlation of the different settlement dimensions (built-up area, municipal area, number and
settler population). The second part relates to the correlation between settlement variables
and the annexation of land due to the construction of the Wall.
Regarding the annexation of land through the construction of the settlements, we have the
first 6 correlations. With the exception of one relationship (municipal area and population),
the rest of the variables (built-up area, number and population) are strongly and positively 179 For example, agricultural gates allow access to agricultural fields, green houses and orchards located on the opposing side of the Wall. Farmers must obtain a green permit to cross the gate to their fields. Opening times depend on the specific gate but in many instances they are open three times a day for an hour or an hour-and-a-half. Another example are the school gates, whose opening coincide with school hours twice daily and they are only open to children and teachers (OCHA and UNRWA, 2004). 180 While wall-related land annexation variables are available at the village level (village proximity to the wall), the settlements related variables are not collected at this level.
Table 4.5: Coefficient of correlation between variables proxying land annexation
Land annexation correlated variables Pearson
coefficient of correlation
No. of settlements (2005) – Settler population (2005) 0.71*
No. of settlements (2005) – Settlements municipal area (2001) 0.77*
No. of settlements (2005) – Settlements built-up area (2005) 0.84*
Settler population (2005) - Settlements municipal area (2001) 0.24*
Settler population (2005) - Settlements built-up area (2005) 0.77*
Settlements municipal area (2001) – Settlements built-up area (2005) 0.64*
Area of confiscated land for the construction of the Wall (2004) - Settler population (2005) -0.17*
Area of confiscated land for the construction of the Wall (2004) - Settlements municipal area (2001) -0.54*
Area of confiscated land for the construction of the Wall (2004) - Settlements built-up area (2005) -0.44*
Area of confiscated land for the construction of the Wall (2004) - No. of settlements (2005) -0.63*
Note: * = significant at the 0.05 percent level using Pearson chi-square test

209
related. The lack of correlation between settlement population and municipal area raises the
idea that land annexation responds to other long-term objectives rather than the current
needs of the settler population. Thus, while the settlements in built-up areas include all the
areas of human activity including buildings, service facilities, public parks, squares and roads,
municipal area refers to the land that is planned for the construction according to the master
plan of the occupation site or confiscated land to be annexed later to the occupation site.
As for the relationship between the Wall and the settlement variable is negative. This type of
relationship could be seen as clashing with the fact that the route of the Wall is not along
the 1949 Armistice Line but enters into the oPt, annexing to Israel the land on which the
settlements stand (or can expand). In this sense, it might have been expected to find a
positive relationship between the settlement and the Wall variables. However, there are two
issues that may explain the negative relationship. On the one hand, the Wall annexes the
biggest settlement structures and it leaves a large number of them within the West Bank (see
Maps 2 and 3 in Chapter 1). On the other hand, there are three governorates - Jericho,
Nablus and Hebron – which contain a good number of settlements and are hardly, if at all,
affected by the Wall.
Restrictions of Movement
The restriction of movement is proxied with one government variable (number of obstacles
restricting the movement of Palestinian pedestrian and vehicles) and two village variables
(village closure index and village wall enclosure). The location of physical obstacles -
checkpoints, roadblocks, trenches, earth mounds (including the Wall) – introduce both
structural changes and micro-scale short term shocks. For instance, while unmanned obstacles
(trenches, earth mounds, roadblocks) can be set up at any time and anywhere, manned
obstacles (checkpoints and Wall gates) are unpredictable in terms of the time it will take to
pass and the degree of access. It is impossible to know until the last moment whether you
will be granted a permit, whether the checkpoint is open or temporary closed or if additional
restrictions have been imposed (gender, age, geographical area) rendering the permits invalid
or if your identity document will be taken away. This administrative and physical uncertainty
that impregnates Palestinian livelihoods is accompanied by the absence of law or concrete
procedures and its arbitrary application.

210
Regarding the relationship between the movement restrictions variables, we have correlated
the village-level variables (village closure index and village Wall enclosure) and found a weak
Pearson coefficient of correlation181. This near-lack of correlation indicates that both
measures are unrelated and therefore both of them will be further included in the analysis.
At the moment, the Wall does not seem to be the general alternative claimed by the
government of Israel for the physical obstacles. Even if we argue that the Wall would be an
alternative for other physical obstacles when it is completed, we do not find evidence of this.
The coefficient of correlation between village closure index and wall enclosure in the
governorates where the Wall is completed varies considerably and therefore no conclusions
can be drawn182.
To conclude the analysis of the occupation instruments and shocks, the following table
presents the variables that have been chosen to illustrate the instruments at the village and
governorate level during the period 2000-2004.
Table 4.6: Selected conflict variables to illustrate the Israeli occupation of the oPt during 2000-2004 Occupation instrument Variable description Unit of analysis & time coverage
Use of violence
Number of Palestinians killed
Governorate & Village (2000-04)
Land annexation
Area of confiscated land for the construction of the wall The village is located within one-kilometre of the Wall
Governorate (2004) Village (2003, 2004)
Movement restrictions
Number of ‘temporary’ physical obstacles Village Closure Index Number of village sides enclosed by the Wall
Governorate (2003, 2004) Village (2003, 2004) Village (2003, 2004)
Regarding the unit and time of analysis, it is to be noted that the conflict variables used in
the examination of the relationship between conflict-produced shocks and risk management
strategies (Section 4.4) are just the 2004 village-level variables. On the one hand, since the
PECS was carried for 2004 and the risk management strategies reported were adopted within
this year, we are particularly interested about the conflict behaviour in 2004. On the other
hand, the shock village dimension is preferred because its impact on the household is greater
than that caused by the governorate shocks. Ideally, both of them should be included in the
181 Pearson coefficient of correlation = -0.13. The relationship between village closure index and wall enclosure is significant at the 0.05 percent level using Pearson chi-square test. 182 The Pearson coefficient of correlation is = - 0.26 (for Jenin), 0.29 (for Tulkarem) and - 0.76 (for Qalqilya).

211
analysis of risk management strategies and hence illustrate the macro- and micro-conflict-
produced shocks. However, due to time constraints, it was decided to focus on the furthest
geographical unit, the village.
4.2.2 Understanding the Occupation Instruments
This section aims to present certain aspects of the behaviour of the Israeli occupation
instruments such as the spread, the intensity and their multidimensional, endogenous and
dynamic nature. With this overall aim, descriptive and correlation analyses have been carried
out to explore the conflict-produced shocks across time and geography and the relationship
between the instruments.
4.2.2.1 Descriptive Analysis of Conflict across Time and Space
In order to illustrate certain characteristics of the Israeli occupation during the period 2000-
2004, we have looked at the occupation instruments and at the specific conflict-produced
shocks from a spatial and time perspective183. Since the analysis of risk management strategies
in this investigation lacks a dynamic approach, the understanding of the conflict dynamics
during the period of study becomes particularly relevant. It provides information about
conflict intensity and spread, which are two of the risk event characteristics that yield
information about the impact of the conflict on the households as well as the possibilities of
dealing with their consequences. Regarding this, we know that the longer the period of
conflict, the more likely it becomes that households liquidate their productive assets or
abandon them to become refugees. However, a short war can also strongly affect household
welfare, especially if the conflict-produced shocks, are intense, widespread and if the
households were already vulnerable at the outset of the conflict. Covariate shocks, such as
armed conflicts, impose a heavy burden on the conflict-affected population as they reduce
the effectiveness of many risk management strategies such as risk-sharing, buffer-stock
behaviour and diversification. In addition, armed conflicts, despite their covariate nature,
have idiosyncratic components, which are to a large extent determined by the household
183 See Appendix 11 for descriptive statistics.

212
location, such as living in the northern governorates of the West Bank, in a refugee camp,
close to a settlement or close to the route of the Wall. The following discussion is structured
by occupation instrument and analyses conflict-produced shocks across time, governorate
and village.
Use of Violence
Overall, the use of violence reached its peak in 2002 and after then it decreased considerably
(with the exception of the number of those injured, which increased again in 2004). Looking
into these dynamics across governorates in the following graphs, one can first notice its
overall widespread nature.
Graph 4.5: No. Palestinians killed across governorates
0 100 200 300 400No. Palestinian killed
Hebron
Bethlehem
Jericho
Ramallah
Salfit
Qalquilya
Nablus
Tulkarem
Tubas
Jenin
2000-2004 20032004
Graph 4.6: No. Palestinians killed (proportional)
0 .0005 .001 .0015No. Palestinian killed/governorate population
Hebron
Bethlehem
Jericho
Ramallah
Salfit
Qalquilya
Nablus
Tulkarem
Tubas
Jenin
2000-2004 20032004
Graph 4.7 Palestinians killed 2000-2004 (proportional)
The differences across governorates (Graph 4.5)
are smoothed when the proportional number
of Palestinians killed is considered (Graph 4.6).
The northern governorates of the West Bank
(Jenin, Tubas, Tulkarem and Nablus) are the
most affected by violence during the whole
period 2000-2004 as well as during 2004. If we
look at the use of violence in each community
during 2000-2004 (Graph 4.7) the spread widens
across governorates. The number of Palestinian
killed across the 100 villages184 sampled in
PECS is proportionally well distributed across
governorates. In 2004, the use of violence is
184 In the scatterplot, the villages are presented by governorate: 1 (Jenin), 5 (Tubas), 10 (Tulkarem), 15 (Nablus), 20 (Qalqilya), 25 (Salfit), 30 (Rammallah), 45 (Bethlehem), 50 (Hebron).

213
010
2030
4050
villa
ges
0 .005 .01 .015no. Palestinian killed/village population size
more concentrated in certain governorates:
Jenin, Nablus, Rammallah and Hebron.
Looking across the most-affected communities,
we note that the majority were either the
governorate capital, refugee camps185 or close to
settlements or the Wall186.
Annexation of Land
As has been explained at the beginning of this section, two of the main reasons why the
Israeli government annexes land in the West Bank are for the construction of settlements
and, since 2002, for the construction of the Wall. The following graphs illustrate the spread
across governorates in terms of amount and nature of land confiscated in 2004. Remember
that the land annexation variables are not available across time and the focus is placed on
the Wall, and the settlement variables are not considered as shocks but their analysis is useful
in one’s understanding of the conflict instruments and conflict-produced shocks.
Graph 4.8: Total occupied area by governorate and land use in 2004
Graph 4.9: Proportional occupied area by governorate and land use in 2004
0 20 40 60 80consfiscated area (in dunums)
Hebron
Bethlehem
Jericho
Ramallah
Salfit
Qalquilya
Nablus
Tulkarem
Tubas
Jenin
wall confiscated area sett.muncipal areasett. built-up area
0 .1 .2 .3 .4consfiscated area/governorate area (in dunums)
Hebron
Bethlehem
Jericho
Ramallah
Salfit
Qalquilya
Nablus
Tulkarem
Tubas
Jenin
wall confiscated area sett.muncipal areasett. built-up area
The distribution of the settlement structures can be observed in the graphs. It is interesting
to note that settlements are not concentrated in one part of the West Bank; instead they are
distributed all over the 10 governorates. Taking into account the size of the governorates 185 The villages most affected by the number of Palestinians killed in 2004 are the following across governorates: Nablus (‘Askar Camp, Burin, Kafr Qalil, Nablus city,), Bethlehem (‘Ayda Camp, Al ‘Aza Camp, Bethlehem city ), Ramallah (Al Amari Camp, Balata Camp, Qarawat beni Zeid, Rammallah city), Hebron (Al-Fawwar Camp), Jenin (Arrab, Jenin City, Jenin Camp, Kafr Rai,), Salfit (Deir Istiya, Saflit city), Tulkarem (Nur Shams Camp, Tulkarem city, Tulkarem camp), Qalqilya (Qalqilya city) and Tubas (Tammum). 186 The location of the villages in reference to the Wall and settlements can be checked in the OCHA Map Centre, http://www.ochaOPT.org/?module=displaysection§ion_id=96&static=0&format=html

214
(Graph 4.9), the presence of settlement structures is proportionally the highest in Salfit,
Qalqilya and Jericho. Another issue about the settlements is the difference between the
municipal and built-up areas, which allows the expansion of the latter and therefore the
continuous expansion of the settlement population.
Regarding the Wall, Graph 4.8 illustrates its wide presence in the West Bank. As a result, and
based on OCHA monitoring the construction of the Wall, it was reported that at the end of
2004, 10 % of the West Bank land had been either confiscated for the construction of the
Wall or was trapped between the Wall and the Green Line, the so-called ‘seamed zone’
(OCHA and UNRWA, 2005). With the exception of the governorates of Jericho, Nablus and
Tubas, the Wall passes through all the rest of the governorates. Note that Hebron does not
account yet for any land annexed by the Wall because its construction did not start till 2005.
The Wall particularly affects Qalqilya, Tulkarem and Salfit, which contain settlements that
are being annexed by the Wall such as the Ariel, Emmanuel and Sal’it settlements (see Map
3, Chapter 1). At the community level, the amount of land confiscated for the building of
the Wall has been looked at through the village proximity. Accordingly, 20% of the villages
in the sample are within the 1km-perimiter to the Wall. As opposed to the above-mentioned
governorate distribution and the warning about the importance of the unit of analysis, the
villages most affected by the Wall, because of their location, belong to the governorates of
Bethlehem, Rammallah, Qalqilya and Tulkarem187. With the exception of the Tulkarem
villages, the villages located in those governorates are in a greater extent located close to
settlements.
Restrictions of Movement
The period 2000-2004 was characterized by strict restrictions on the movement of people and
goods within the oPt. Since the data illustrating the movement restrictions were firstly
published in 2003, the following analysis is restricted to the years 2003 and 2004. In order to
account for the degree of movement restriction, three variables have been analysed: the
187 The communities within 1 kilometre of the Wall are the following across governorates: Jenin (Zububa), Tulkarem (Tulkarem city, Far’un, Qaffin), Qalqilya (‘Isla, Kafr Thulth, An Nabi Elyas, Qalqilya), Salfit (Biddya, Mash-ha), Rammallah (Al Am’ari Camp, Beit Liqya, Beitunya, Al-Bireh), Bethlehem (Beit Sahur, Al ‘Aza Camp, Bethelehem, Wai Al Arayis and Ayda Camp).

215
number of obstacles per governorate, the village cluster index and the degree of wall
enclosure.
Comparing the impact of the number of obstacles across governorates is a difficult task since
the obstacles exercise different degrees of restriction depending on their type (checkpoint,
roadblock, trench, earth mound or road gate), where it is located (main or secondary road),
the governorate infrastructure (size of the road system) and the personal mandates of Israeli
officials. Since these issues are difficult to control for, a rough measure is to make the
number of obstacles proportional to governorate size.
Thus, if we look at Graph 4.10, we observe that movement restrictions affect all the
governorates and, with the exception of Tulkarem and Salfit, the number of obstacles
increased in 2004. In 2004, there were approximately 60 checkpoints and more than 460
physical obstacles, such as roadblocks, road-gates, earth-mounds, roadblocks and trenches,
located in the West Bank (OCHA, 2004). In addition, it is interesting to note how the
distribution of closure intensities across governorates becomes more alike when the
governorate area is taken into account (Graph 4.11).
Graph 4.10: Number of obstacles across governorates
Graph 4.11: Proportional number of obstacles across governorate
0 50 100 150 200No. Obstacles
Hebron
Bethlehem
Jericho
Ramallah
Salfit
Qalquilya
Nablus
Tulkarem
Tubas
Jenin
2003 2004
0 .1 .2 .3 .4No. Obstacles/governorate area
Hebron
Bethlehem
Jericho
Ramallah
Salfit
Qalquilya
Nablus
Tulkarem
Tubas
Jenin
2003 2004
At the village level, movement restrictions affected 59% of the sampled villages in 2003 and
2004. As the scatterplot 4.12 and 4.13 show, the distribution does not change dramatically
across time and most of these villages are located in Rammallah, Salfit, Qalqylya and
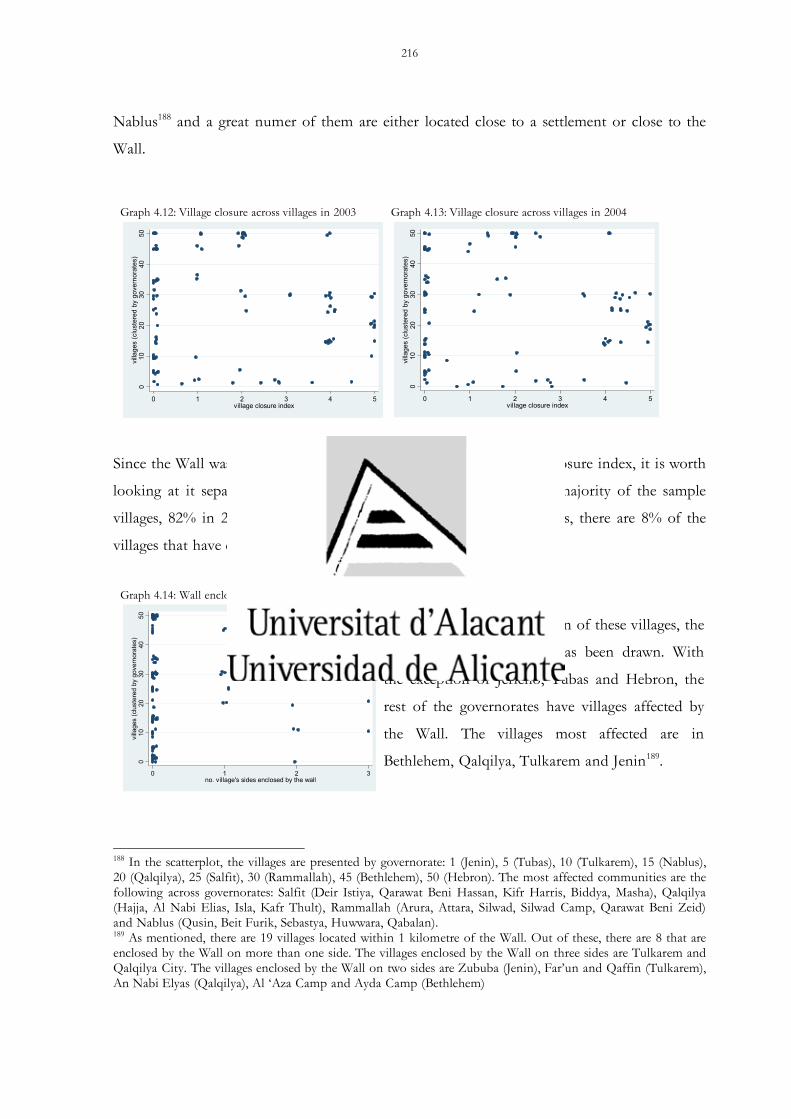
216
Nablus188 and a great numer of them are either located close to a settlement or close to the
Wall.
Graph 4.12: Village closure across villages in 2003 Graph 4.13: Village closure across villages in 2004
010
2030
4050
villa
ges
(clu
ster
ed b
y go
vern
orat
es)
0 1 2 3 4 5village closure index
010
2030
4050
villa
ges
(clu
ster
ed b
y go
vern
orat
es)
0 1 2 3 4 5village closure index
Since the Wall was not considered in the construction of the village closure index, it is worth
looking at it separately. It is observed in Graph 4.14 that the great majority of the sample
villages, 82% in 2004 are not enclosed by the Wall at all. Nonetheless, there are 8% of the
villages that have either two or three sides enclosed by the wall.
Graph 4.14: Wall enclosure across villages in 2004
010
2030
4050
villa
ges
(clu
ster
ed b
y go
vern
orat
es)
0 1 2 3no. village's sides enclosed by the wall
In order to show the location of these villages, the
accompanying scatterplot has been drawn. With
the exception of Jericho, Tubas and Hebron, the
rest of the governorates have villages affected by
the Wall. The villages most affected are in
Bethlehem, Qalqilya, Tulkarem and Jenin189.
188 In the scatterplot, the villages are presented by governorate: 1 (Jenin), 5 (Tubas), 10 (Tulkarem), 15 (Nablus), 20 (Qalqilya), 25 (Salfit), 30 (Rammallah), 45 (Bethlehem), 50 (Hebron). The most affected communities are the following across governorates: Salfit (Deir Istiya, Qarawat Beni Hassan, Kifr Harris, Biddya, Masha), Qalqilya (Hajja, Al Nabi Elias, Isla, Kafr Thult), Rammallah (Arura, Attara, Silwad, Silwad Camp, Qarawat Beni Zeid) and Nablus (Qusin, Beit Furik, Sebastya, Huwwara, Qabalan). 189 As mentioned, there are 19 villages located within 1 kilometre of the Wall. Out of these, there are 8 that are enclosed by the Wall on more than one side. The villages enclosed by the Wall on three sides are Tulkarem and Qalqilya City. The villages enclosed by the Wall on two sides are Zububa (Jenin), Far’un and Qaffin (Tulkarem), An Nabi Elyas (Qalqilya), Al ‘Aza Camp and Ayda Camp (Bethlehem)

217
Once each of the occupation instruments across time and space had been analysed, it is
possible to observe the covariate spread across governorates. Although there are hot spots –
mostly related to the proximity to the settlement structures, the Green Line or the Wall as
well as living in a governorate capital or refugee camp – the broad spread of the instruments
of the occupation is remarkable. If we add the fact that the instruments seem to be unrelated,
particularly the policy of closure including the Wall and the use of violence, one wonders
about their rationale. The relationship between instruments is analysed in next section.
Furthermore, the intensity of the conflict is reflected by multiple shocks, which do not
necessarily behave similarly across time. Thus, while the conflict was characterised by intense
violence during the period 2000-2002, it was mostly shaped by movement restrictions during
2003-2004. Due to the differences observed, we may think that the assessment of the conflict
effects may change not just depending on the time period but also on the unit of analysis
(governorate and village) and the conflict-produced shocks. Regarding the latter, the
dimensions of the conflict gaining relevance during these two years were not so much related
to violence but to space and land. In fact, the conflict within these two years was largely
characterised by the construction of the Wall and the policy of closure, which annexed great
amounts of land and fragmented the West Bank territory into a series of enclaves. Thus, if
we do not take into account the direct effects of conflict on land annexed and movement
restrictions and focus solely on the use of violence, it would have not been possible to
capture the dynamics of land and space, which characterized the intensification of the
conflict during the years 2002-2004.
4.2.2.2 Correlation Analysis between Israeli Occupation Instruments
In an attempt to understand the rationale of these endogenous shocks, whose spread,
intensity and multiple nature seems to be somehow unrelated to the situation of security, a
correlation analysis between the instruments of the occupation was carried out. Bearing in
mind the limitations of this type of analysis, this section relies on coefficients of correlation
and measures of association to provide a preliminary assessment of the extent to which the
occupation instruments were related in 2004 and how they fit in with the Israeli discourse of
preventive security and the Palestinian claims of dispossession and domination.

218
Use of Violence vs. Annexation of Land
Table 4.7 provides the coefficients of correlation between the use of violence and land
annexation variables. Contrary to what was expectated, the relationship between these two
sets of variables is neither strong nor always positive.
Table 4.7: Coefficient of correlation1 between use of violence and land annexation in 2004 Land annexation
Governorate Village Violence
Settlement Number
Settlement Population
Settlement Built-up area
Settlement Municipal
area
Wall confiscated land area
Wall enclosure
Curfew hours 0.01* 0.10* 0.04* -0.23* -0.27* 0.08 Palestinians killed -0.35* -0.37* -0.22* -0.30* -0.06* 0.35 Palestinians injured 0.53* 0.37* 0.58* 0.25* 0.49* Na.
1. The Pearson coefficient of correlation is used for interval or scale variables. Goodman and Kurskals’s gamma is used for ordinal categorical variables. Note: * = significant at the 0.05 percent level using Pearson chi-square test Note: na = stands for not available and it is used for those cases when the two analysed variables are not available at the same level (governorate or village).
Despite the fact that episodes of violence have been reported between Palestinian residents
and settlers as well as due to the construction of the Wall, they do not seem to be
representative on a general basis in 2004, according to our data. However, as the coefficient
of correlation show, not all the variables within a specific instrument behave similarly. For
example, the strongest correlations are positive and are found between low-profile violence
(injured) and certain land annexation variables such as the settlement number, built-up area
and Wall-confiscated land area. These correlations could be an indication of the nature of
the episodes of the above mentioned violence.
Use of Violence vs. Restrictions of Movement
As mentioned in Chapter 1 when discussing its policy, closure was instituted as a security
instrument to prevent, or minimize the threat of Palestinian attacks on Israeli security forces
or citizens. However, the closure policy has other objectives beyond security, which are
economically or geo-politically related. As previously mentioned, many organizations
assessing the impact of closure have argued that generalized movement restrictions are
ineffective in producing security for the Israeli military and citizens; yet instead they are the
single most important factor negatively affecting the Palestinian economy and living

219
conditions. This tension between competing explanations for closure – security versus geo-
political reasons – has been, from 2003 onwards, seen most acutely in relation to the Wall.
According to the descriptive analysis of conflict across time in the previous section,
movement restrictions and violence seemed to be disconnected. While the IDF’s use of
violence dramatically fell after the year 2002 and during the two subsequent years remained
low, during these last two years, 2003-2004, the number of obstacles did not decrease and the
movement restrictions imposed by the construction of the Wall increased. This lack of a
strong relationship is also observed in Table 4.8, which shows differences in the association
behaviour, depending on the nature of violence (injurees, killed, curfew), the unit of analysis
of closure (governorate or village) and the instrument of closure (checkpoint or Wall). This
lack of an homogenous behaviour highlight the complexity of closure and hence the
sensitivity of the assessment to the unit of analysis as well as to the nature of the conflict-
produced shock.
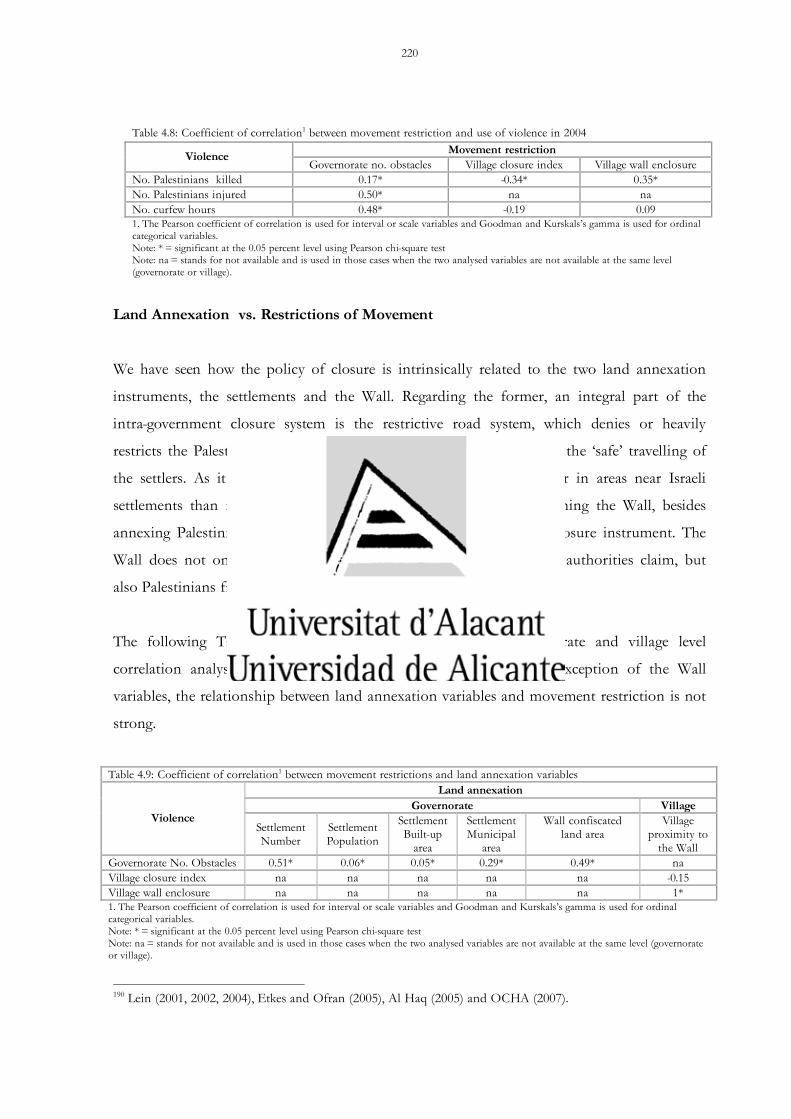
220
Table 4.8: Coefficient of correlation1 between movement restriction and use of violence in 2004
Movement restriction Violence Governorate no. obstacles Village closure index Village wall enclosure
No. Palestinians killed 0.17* -0.34* 0.35* No. Palestinians injured 0.50* na na No. curfew hours 0.48* -0.19 0.09 1. The Pearson coefficient of correlation is used for interval or scale variables and Goodman and Kurskals’s gamma is used for ordinal categorical variables. Note: * = significant at the 0.05 percent level using Pearson chi-square test Note: na = stands for not available and is used in those cases when the two analysed variables are not available at the same level (governorate or village).
Land Annexation vs. Restrictions of Movement
We have seen how the policy of closure is intrinsically related to the two land annexation
instruments, the settlements and the Wall. Regarding the former, an integral part of the
intra-government closure system is the restrictive road system, which denies or heavily
restricts the Palestinian use of certain roads within the oPt to favour the ‘safe’ travelling of
the settlers. As it has been argued, movement restrictions are tighter in areas near Israeli
settlements than in those areas where settlers do not live190. Concerning the Wall, besides
annexing Palestinian land it acts as both an external and internal closure instrument. The
Wall does not only separate Israelis from Palestinians, as the Israeli authorities claim, but
also Palestinians from Palestinians.
The following Table, 4.9, summarises the results of the governorate and village level
correlation analysis between these two set of variables. With the exception of the Wall
variables, the relationship between land annexation variables and movement restriction is not
strong.
Table 4.9: Coefficient of correlation1 between movement restrictions and land annexation variables Land annexation
Governorate Village Violence
Settlement Number
Settlement Population
Settlement Built-up
area
Settlement Municipal
area
Wall confiscated land area
Village proximity to
the Wall Governorate No. Obstacles 0.51* 0.06* 0.05* 0.29* 0.49* na Village closure index na na na na na -0.15 Village wall enclosure na na na na na 1* 1. The Pearson coefficient of correlation is used for interval or scale variables and Goodman and Kurskals’s gamma is used for ordinal categorical variables. Note: * = significant at the 0.05 percent level using Pearson chi-square test Note: na = stands for not available and is used in those cases when the two analysed variables are not available at the same level (governorate or village).
190 Lein (2001, 2002, 2004), Etkes and Ofran (2005), Al Haq (2005) and OCHA (2007).

221
At the governorate level, we firstly observe that number of obstacles, and hence the degree of
closure they exercise, is related to the number of settlements. Regardless of the area they
occupy or the people living in them, all settlements seem to be protected by a series of
physical obstacles. Secondly, it is interesting to note the positive sign between the number of
obstacles and the land area annexed for the construction of the Wall. This could be an
indication of their complementarity. As mentioned before in the discussion on movement
restriction variables, the Wall does not seem to be the alternative claimed by the Israeli
authorities to the other physical obstacles. I would say that rather than being an alternative,
it is another instrument of the policy of closure.
To conclude, the correlation analysis carried out to understand the rationale of the
occupation-produced shocks, whose covariate spread, high intensity and multiple nature seem
to be somehow unrelated to the situation of security, does not provide sufficient evidence to
say that the shocks – use of violence, Wall-produced land annexation and movement
restrictions – are overall strongly correlated. This warns of the importance of illustrating the
conflict in a comprehensive manner, as any simplification could cause a loss of information.
Furthermore, the fact that the number of obstacles is positively and strongly correlated to
low violence, the construction of the Wall and to the settlement structures raises the question
of whether it is a ‘temporary’ security measure or whether it serves geopolitical interests
related to the maintenance of the settlements and the construction of the Wall, which aimed
at expanding control and transforming the physical landscape. The disconnection between
closure and security is also shown by the conflict dynamics during the period 2000-2004.
While the first two years after the onset of the second Intifada were characterised by the use
of violence, the policy of closure was tightened during 2003-2004, a period that was
considered of low intensity of violence. It would be interesting to explore the shock
interactions across time and assess whether they are complementary or independent and how
they fit in with the Israeli discourse of preventive security and the process of dispossession
and domination that has characterised the Israeli occupation of the Palestinian Territories.

222
4.3 Palestinian Responses to the Crisis: PECS and Beyond
With the overall aim of contributing to the emerging area of research about risk
management of conflict-affected households, this section discusses how risk management has
been studied within the framework of the household surveys in the oPt and compares it with
the results of interviews carried out to collect primary data about the households’ perceptions
of the risk events and their risk management strategies.
In the context of the oPt, there are various household surveys containing information about
household responses to the anticipated and actual losses associated with the risk events and
outcomes produced by the violence, land annexation and movement restrictions. Despite the
availability of risk event information, risk management strategies have been analysed
irrespective of their immediate causes, focusing instead on household-related determinants.
This way of approaching risk management is a consequence of a gap in the literature on the
risk management of conflict-affected households and the assumption that there is equivalence
to the well-known risk management behaviour of households during natural or economic
crises. Although there is an emerging literature of conflict-affected households risk
management that challenges these assumptions, development policies and programmes do
not recognise the specificities of risk management of conflict-affected households. Therefore,
in order to address the strategies according to their contexts of armed conflicts, this section,
firstly, compares the strategies included in PECS with the strategies reported by the
Palestinians interviewed, and secondly, discusses the PECS distribution of risk management
strategies.
4.3.1 Households Responses to Conflict-produced Shocks
With the overall aim of approaching household risk management strategies during armed
conflict this section explores household responses to conflict-produced shocks using PECS
and interviews. Regarding the former, under the question “which of these actions have your
household taken to cover expenditure during the current month” PECS provides the
interviewed with the following list of 14 possible ex-post risk management strategies:
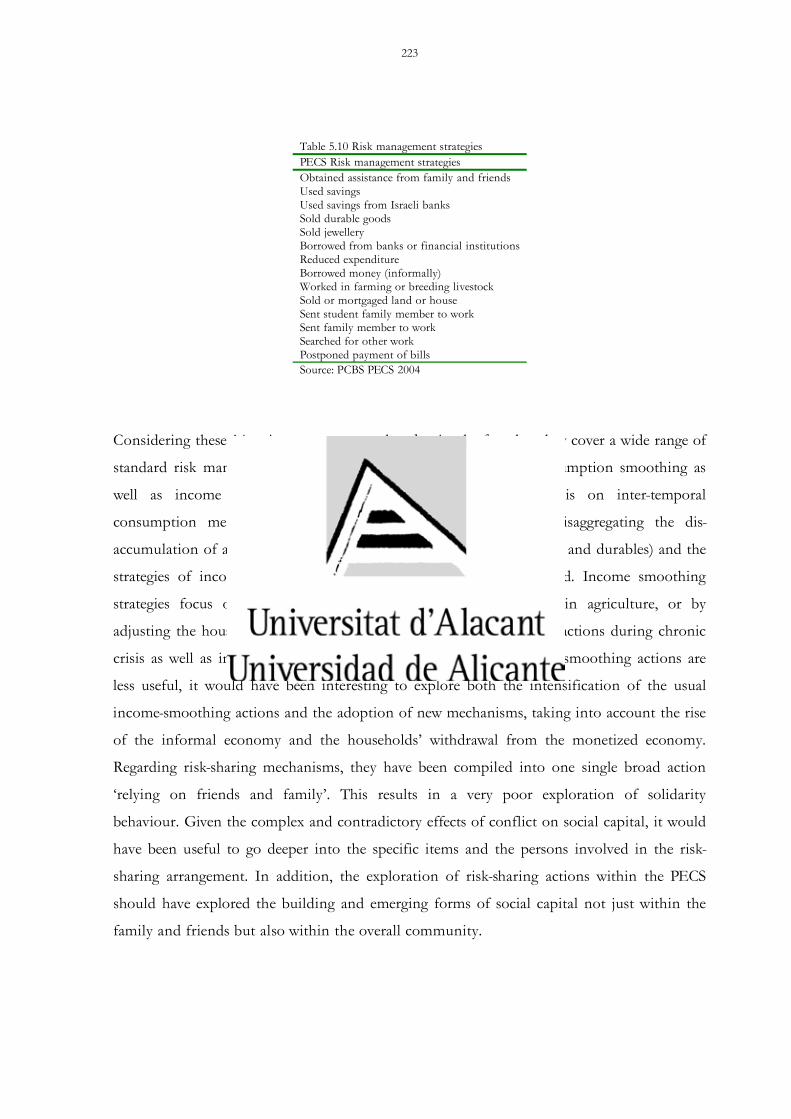
223
Table 5.10 Risk management strategies PECS Risk management strategies Obtained assistance from family and friends Used savings Used savings from Israeli banks Sold durable goods Sold jewellery Borrowed from banks or financial institutionsReduced expenditure Borrowed money (informally) Worked in farming or breeding livestock Sold or mortgaged land or house Sent student family member to work Sent family member to work Searched for other work Postponed payment of bills Source: PCBS PECS 2004
Considering these 14 actions, we connote that despite the fact that they cover a wide range of
standard risk management strategies (inter-temporal and spatial consumption smoothing as
well as income smoothing strategies), there is a clear emphasis on inter-temporal
consumption mechanisms. Thus, these have been explored by disaggregating the dis-
accumulation of assets (use of savings in Israeli Banks, selling jewellery and durables) and the
strategies of income smoothing and risk sharing are hardly detailed. Income smoothing
strategies focus on, for example, income diversification, whether in agriculture, or by
adjusting the household labour force. Given the importance of these actions during chronic
crisis as well as in covariate and intense shocks, where consumption smoothing actions are
less useful, it would have been interesting to explore both the intensification of the usual
income-smoothing actions and the adoption of new mechanisms, taking into account the rise
of the informal economy and the households’ withdrawal from the monetized economy.
Regarding risk-sharing mechanisms, they have been compiled into one single broad action
‘relying on friends and family’. This results in a very poor exploration of solidarity
behaviour. Given the complex and contradictory effects of conflict on social capital, it would
have been useful to go deeper into the specific items and the persons involved in the risk-
sharing arrangement. In addition, the exploration of risk-sharing actions within the PECS
should have explored the building and emerging forms of social capital not just within the
family and friends but also within the overall community.
224
The focus on ex-post and inter-temporal consumption smoothing in the oPt can be
misleading. On the one hand, the fact that the Israeli-Palestinian conflict is a chronic
conflict and more specifically that there is a time gap between the onset of the second
Intifada in 2000 and the reporting period of the risk management strategies adopted here
(any month during 2004) requires the inclusion of ex-ante risk management strategies in
order to capture the dynamic and structural nature of the risk management. On the other
hand, regarding the focus on inter-temporal consumption smoothing, in the context of
armed conflict, consumption cannot be considered as the only basic human need within a
hierarchy of concerns and therefore the emphasis on those actions that aim to protect
expenditure is insufficient. As previously discussed, managing household economics to secure
consumption is a piece of a jigsaw of other immediate and long-term needs related to the
household’s vulnerability such as the household own security and ideological motives.
This emphasis on ex-post strategies and inter-temporal consumption smoothing, which was
also found in other secondary data in the oPt191 and was observed in the food security
assessments of famines, raises some doubts as to whether the PECS list of strategies was
properly configured either for the specific case of the oPt or more generally for the context
of armed conflict. It seems as if the list of actions is a blueprint for risk management
strategies detached from the type of crisis concerned; more specifically as if they had been
replicated from the contexts of natural or economic crises, where the strategies do not
mention conflict-produced shocks at all and they seem to be simply expecting responses to
the exogenous economic degradation of their livelihoods. Regarding the way risk
management has been conceived in the Israeli-Palestinian conflict, in this research, interviews
were carried out to explore, outside the then current frame of household surveys, how
Palestinians viewed the conflict-produced shocks and their responses. The interviews were
carried out with households living in Jerusalem, Nablus, Bethlehem and Hebron. As it is
framed in Chapter 3, the objective of carrying out these interviews was not to draw national
inferences or to make representative statements; instead it aimed to illustrate whether PECS
and other secondary data in the oPt had taken too narrow a perspective to risk management
strategies. The findings of the interviews are presented next. 191 The other surveys containing information about risk management strategies also contained ex-post and inter-temporal consumption smoothing bias. The surveys are the following: PCBS ‘Impact of the Israeli measures on the socio-economic status of the Palestinians, the IUED ‘Palestinian public perceptions survey’ and the WFP ‘Livelihoods, Shocks, and Coping strategies of the WFP beneficiaries in the oPt’.

225
The following scheme summarises the household’s perceptions of the conflict-produced
shocks; it contains the (noted in the scheme in small font), the overall cause (referring to the
Israeli occupation of the oPt) and the objectives (the rest of information in the scheme).
Scheme 4.1: Perceptions of the conflict-produced risk events
During the conversations held with the interviewees, the little attention they dedicated to the
shocks themselves was surprising. On the contrary, the focus was on the objectives of the
shocks. Regarding the shocks themselves, it is notable that they follow the three dimensions
established by this research – use of violence, land annexation and movement restrictions –
although their scope has widened significantly if compared to the way the occupation has
been illustrated by this study.
Vis-à-vis the objectives, basically, the main point raised was that the shocks are not perceived
as isolated and temporary but rather they are seen an integral part of a four-layer chain

226
composed of causes (Israeli occupation), short-term objectives (violence, land annexation,
movement restrictions), middle-term objectives (economic strangulation and social
fragmentation) and long-term objectives (Palestinian self existence within the 1967 borders).
This approach to the risk events recognised the overall context of vulnerability. It includes
the endogenous and multi-dimensional nature of the risk events, which deliberately threaten
not just a household’s economics but its overall livelihood. In addition, the three-level
objectives make explicit the double-time dimension of the conflict.
As might be expected, one of the consequences of the portrayal of risk beyond the risk events
themselves and including overall causes and objectives is the widening of the scope of risk
management strategies. The following table presents all the actions reported by the
interviewees when asked about the strategies to deal with the anticipated and actual loss
associated with the risk events and outcomes produced by the armed conflict. As the table
shows, the strategies have been classified into income-, consumption- and livelihood-based.
Table 4.11: Risk management strategies as reported by interviewees Income-based strategies Consumption-based strategies Livelihoods-based strategies
Migrate outside the oPt and within the oPt Work (and stay) in Israel illegally Rely on subsistence agriculture Increase the household labour supply (women, elderly and children). Access restricted areas for searching for jobs or working in the agricultural fields. Use someone else’s movement permit to find work somewhere else Reduce cash transactions by bartering, self-production and in-kind payments. Open a business in the village/ Selling at the checkpoints Pay someone to harvest the crop if you cannot access the agricultural field. Reduce wage employment and rely on family work
Eat less and worse Making less last longer Reduce non-essential expenditures Do not pay utility bills Do not pay at the corner-shop Merge households among kin Use savings Sell goods Receive help from family members (for school fees and medical bills, help with the construction of the house, covering unexpected expenses, etc.) Obtain assistance from community associations, civil groups, people’s committees, charities and religious groups (food, labour force, education expenses, payment of medical bills, psychological support, etc.) Obtain assistance from international organizations
Permanence in the oPt Have children Construct houses without licenses (only Jerusalemites and those living in areas C in the West Bank) Continue with life in spite of the associated-risk produced by violence, restrictions of movement and land annexation: keep going to the university despite the long journey; celebrating life-cycle events, etc. Support or join the armed resistance
227
The table above brings out the wide range of actions adopted by Palestinian households.
Both income and consumption-based strategies are much more detailed that the 14 type of
strategies included in PECS. Parallel to this, other type of actions were suggested: the so-
called livelihood-based strategies. These are activities that have to do more with the overall
livelihood vulnerability and the long- and mid-term objectives of the conflict-produced
shocks, rather than with the household mapping of consumption and income. This much
more complex set of strategies portfolio adopted by the West Bank Palestinians backs up the
findings of the recent research on risk management in context of armed conflict about the
household’s motivations for risk management. As previously discussed, managing household
economics to secure consumption is a piece of a jigsaw of other immediate and long-term
needs related to the household’s vulnerability. The management of household economics and
own-security to deal with vulnerability cannot be detached from ideological motives, which
acknowledge the political struggle and the socio-political pressures resulting. This does not
mean that the household’s actions to cover their expenditure are not important, they are, but
they are interlinked with the political environment. The multiple and interlinked effects of
armed conflict unfold into risk management by blurring the boundaries between
consumption-stress-driven and other livelihood needs related to the vulnerability context.
Related to this is the doubt expressed by the interviewees as to whether you can limit the risk
management strategies to those aiming at economic survival. For them, since the Israeli
occupation targets the existence of the Palestinians within the 1967 borders, focusing just on
an economic dimension of their livelihoods is not enough. They referred to the risk
management strategies with the Arabic word, sumud, which means steadfastness and an
impregnable strength. Sumud is also used to describe the feeling of attachment to the land;
the Movement for the National Liberation of Palestinian (Al-Fatah) used sumud as the
principle for not abandoning the land. Sumud is a monetary fund established by the Arab
Meeting in Baghdad in 1978 to discourage the emigration of Palestinian from the territories
occupied by Israel in 1967. Sumud was the name of a refugee camp in Jerusalem, which was
completely destroyed in 1998 by the IDF leaving 75 families homeless. Sumud is the name of
an unfinished school in Jerusalem, occupied by 20 of those families which had been living in
Sumud refugee camp. These people prefer to live in these conditions rather than move to the

228
other side of the Wall, where the accommodation prices are lower, and fear the risk of losing
their ID with Jerusalem residence. Sumud is a female name in the oPt.
This raises the idea that the management of household economics and security to deal with
the specific vulnerability context, which deliberately threatens self-sufficiency by destroying
assets and blocking responses, cannot be detached from the ideological motives inherent in
everyday lives. Based on the previous discussion about Scott’s framework on everyday forms
of resistance, if forms of resistance are considerably determined by the intensity and structure
of the system of domination and they do not necessarily need to be collective, organised,
intentional, principled-based and effective, Palestinian utilitarian and individualistic acts to
manage the outputs of conflict-produced shocks are part of the nationalist struggle, which
they call sumud. In acting to manage the anticipated and actual losses from conflict-produced
shocks and hence reduce the depth of the impact and increase their reliance, they are
carrying out acts of resistance.
In order to explore these issues further, those interested in the risk management strategies
need to include both detailed information about the risk events and the strategies. Regarding
the latter, the strategies’ efficiency and sustainability as well as the households’ dependency
need to be explored within the short- and long-term motivations of the strategies which take
into account the specificities of the vulnerability contexts in which they are framed. Of
course, this is a more demanding exercise in terms of coding, data interpretation and so
forth, but it can be certainly enriching. Since very little is known about the risk management
process in the context of conflict, efforts are needed to explore it from scratch without the
lens of risk management in the context of covariate exogenous shocks.
4.3.2 The Risk Management Distribution in PECS 2004
With the overall aim of continuing the analysis on how the risk management has been
analysed in the oPt as well as to prepare the data for the conflict-correlates analysis carried
out in Section 4.4, the following discussion is about the distribution of risk management
strategies according to PECS 2004, which is presented in the following table:

229
Table 4.12: Frequencies distribution across risk management strategies (percentage) Type of
strategies Risk management strategies Used Not used Not applicable
Postponed payment of bills 73 27 0 Reduced expenditure 69 31 0 Borrowed money (informally) 41 59 0 Used savings 32 59 9 Sold jewellery 9 88 3 Sold durable goods 1 99 0 Sold or mortgaged land or house 1 89 10 Used savings in Israeli banks 0 59 41
Inter-temporal consumption
smoothing
Borrowed from banks or financial institutions
0 96 4
Worked in farming or breeding livestock 29 57 15 Searched for other work 26 72 2 Sent family member to work 6 90 4
Income smoothing
Sent student family member to work 4 79 17 Risk-sharing Obtained assistance from family and friends 14 86 0 Source: PCBS PECS 2004
Given the characteristics of 2004 PECS (a single round survey) and the way the reliance on
risk managements strategies is framed (‘used’, ‘not used’ and ‘not applicable’) it was decided
to focus on the category of ‘used’192.
In 2004, four years after the onset of the second Intifada, approximately 70% of households
rely on consumption-smoothing actions such as reducing expenditures and delaying payment
of bills. Besides these actions, another 25% of the households had to increase income sources 192 ‘Not applicable’ can mean anything from ‘the question is not relevant’, ‘do not want to answer’, ‘means were exhausted’, etc. The different meanings constrain its merge with the ‘no’ answer. The reason why PCBS decided to classify the answers as it did is unknown. Following the example of most of the other studies using PECS and specifically this question on risk management strategies, the ‘not applicable’ category is not analysed individually. Regarding the category ‘Not used’, there are two reasons why a household does not use a strategy: because the household does not need to or because they do not have the means. This differentiation is crucial. If the risk management strategies are used as indicators of vulnerability, it would be very informative to know the reasons for ‘not used’, specifically, whether it is because there is ‘no need’, or because ‘there is a need but the means are exhausted’. This type of differentiation is particularly relevant when the survey is not longitudinal and consequently no information can be deduced from the assessment of a specific household’s asset base across time. Finally, the category of ‘used’ means that you need to rely on it and you do so because you have the means. In 2004, the year of this analysis, which was the fourth year after the second Intifada started, there were a great number of households which had exhausted their means, and hence had reduced their use of certain strategies. One could argue that a reduction in the extent of use of a certain strategy could be interpreted as a reduction in the need rather than the strategies were being stretched. In theory, it may be that the decrease in use of these coping strategies reflects an improvement in the families’ economic situation and thus reduced the need for these strategies. This seems unlikely in the context of this study since average income in 2004 continued decreasing and poverty rates continued to rise to more than they were prior to the crisis’ (World Bank, 2004a). Furthermore, exhaustion does not necessarily apply just to the household but to the capacity of the community to generate means. For example, it may be the case that income diversification strategies are used to a lesser extent by some households than others because in those communities where the former live there are no possibilities of finding a job, i.e. the capacity of that community to generate employment is exhausted. Taking this into account, caution has to be paid to interpreting the use of the strategies as indicators of vulnerability.

230
by farming and breeding or search for another job as well as rely on de-accumulation actions
such as using savings and informal borrowing. Among the strategies lesser used, we find
relying on friends and family, selling jewellery, formal borrowing, using savings from Israeli
Banks, selling or mortgaging land or house, selling durable assets and adjusting the
household labour supply193.
Returning to the discussion in Section 4.4, in contexts where the conflict-produced shocks
are covariate and are repeated over time, the use of self-insurance strategies (via savings or
risk-sharing) and income-diversification is generally reduced because of the burden imposed
on the whole population, asset exhaustion, the drop in asset value and the covariance on
income sources. In addition, the longer the period of conflict, the more likely it becomes
that households liquidate productive assets and embark on mechanisms to reduce their
variability of income. Although risk management is dynamic and the strategies are adopted
simultaneously, income smoothing becomes particularly relevant when households exhaust
their means to smooth consumption. In response to repeated exposure and covariate and
intense risk, households intensify the usual income-smoothing strategies and adopt new
actions to prevent destitution.
Bearing these implications in mind, in the oPt in 2004, and given the covariate and intense
nature of the conflict-produced shocks, we could expect a low reliance on inter-temporal
consumption smoothing and a high reliance on newly adopted income-smoothing strategies
such as agriculture and adjusting household labour supply. Regarding risk-sharing, although
it is said to decrease during covariate shocks, we have seen how during armed conflict certain
types of risk-sharing are strengthened, such as those relying on bonding social capital.
Particularly, in the specific context of the oPt, numerous authors have generally stressed the
role that social cohesion is playing in preventing people falling into destitution.
Given the fact that PECS does not allow exploration of the trajectory of risk management
strategies during these four years, other sources have been consulted, particularly the PCBS
survey ‘Impact of the Israeli measures on the socio-economic status of the Palestinians’.
193 As was pointed out in the previous section, it is very difficult to explain the low use of these strategies as it can be for different reasons related to ‘not used’ (no need, never had the means, means were exhausted) or related to ‘not applicable’, for example the strategy of using savings from Israeli Banks.
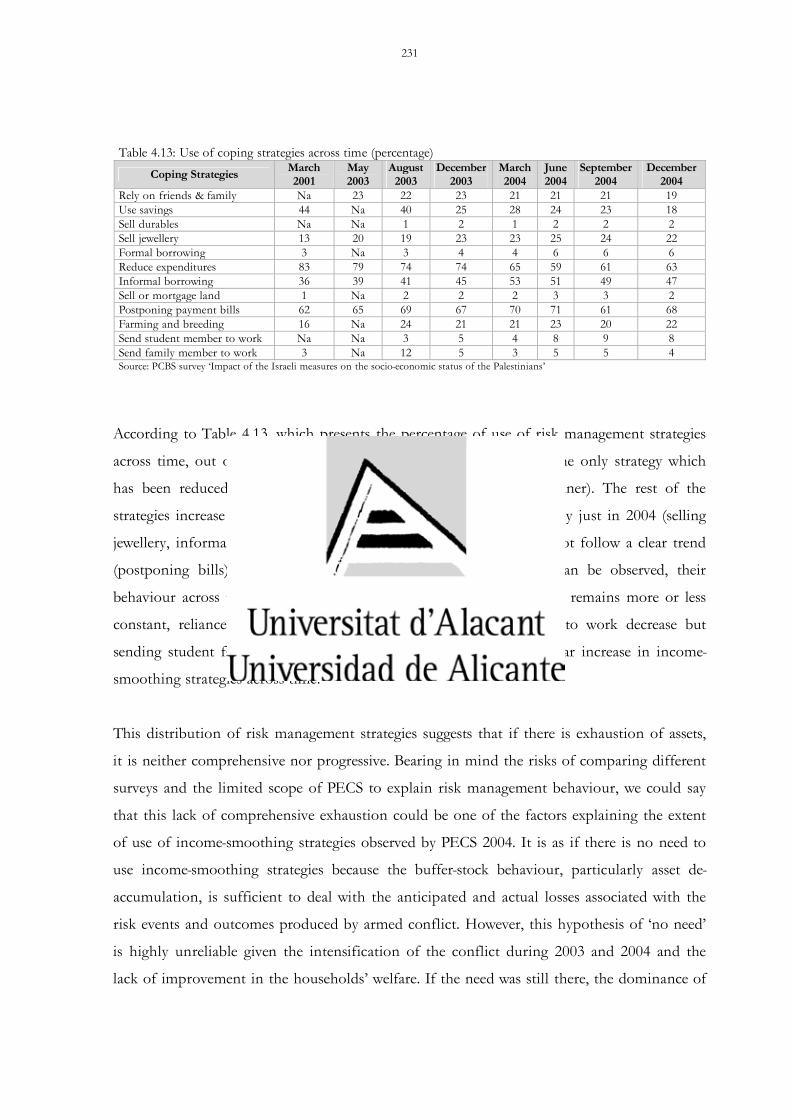
231
According to Table 4.13, which presents the percentage of use of risk management strategies
across time, out of the consumption smoothing actions, savings is the only strategy which
has been reduced significantly and monotonically (in a linear manner). The rest of the
strategies increase (formal borrowing, selling durables), decrease slightly just in 2004 (selling
jewellery, informal borrowing, relying on family and friends) or do not follow a clear trend
(postponing bills). Regarding the income-smoothing strategies, as can be observed, their
behaviour across time varies depending on the action. While farming remains more or less
constant, reliance on family income and sending family members to work decrease but
sending student family members to work increases. There is no a clear increase in income-
smoothing strategies across time.
This distribution of risk management strategies suggests that if there is exhaustion of assets,
it is neither comprehensive nor progressive. Bearing in mind the risks of comparing different
surveys and the limited scope of PECS to explain risk management behaviour, we could say
that this lack of comprehensive exhaustion could be one of the factors explaining the extent
of use of income-smoothing strategies observed by PECS 2004. It is as if there is no need to
use income-smoothing strategies because the buffer-stock behaviour, particularly asset de-
accumulation, is sufficient to deal with the anticipated and actual losses associated with the
risk events and outcomes produced by armed conflict. However, this hypothesis of ‘no need’
is highly unreliable given the intensification of the conflict during 2003 and 2004 and the
lack of improvement in the households’ welfare. If the need was still there, the dominance of
Table 4.13: Use of coping strategies across time (percentage) Coping Strategies March
2001 May 2003
August 2003
December 2003
March 2004
June 2004
September 2004
December 2004
Rely on friends & family Na 23 22 23 21 21 21 19 Use savings 44 Na 40 25 28 24 23 18 Sell durables Na Na 1 2 1 2 2 2 Sell jewellery 13 20 19 23 23 25 24 22 Formal borrowing 3 Na 3 4 4 6 6 6 Reduce expenditures 83 79 74 74 65 59 61 63 Informal borrowing 36 39 41 45 53 51 49 47 Sell or mortgage land 1 Na 2 2 2 3 3 2 Postponing payment bills 62 65 69 67 70 71 61 68 Farming and breeding 16 Na 24 21 21 23 20 22 Send student member to work Na Na 3 5 4 8 9 8 Send family member to work 3 Na 12 5 3 5 5 4 Source: PCBS survey ‘Impact of the Israeli measures on the socio-economic status of the Palestinians’

232
consumption over income-smoothing actions could be explained by the low manoeuvring to
control income variability and hence the reliance on the de-accumulation of the households’
asset bases. Given the nature of the political crisis in the oPt and its characteristics, this loss
of control could be interpreted as a deliberate reduction of the options for livelihoods. As
has been suggested by the interviews, the lack of options leads to the rise in subsistence
activities and the informal economy as well as the withdrawal from the cash economy.
Besides income-smoothing we are also concerned with the reliance on risk-sharing. The
reliance on solidarity actions according to the PCBS survey, referring to family and friends,
decreases slightly from 23 to 19%. Although there is a decrease, which could suggest the
burden imposed on these sorts of mechanisms during common-wide shocks, it is still an
important risk management strategy; according to PECS, there are 14% of the households
which rely on family and friends. Based on the relevance given to the risk-sharing
mechanisms in the oPt, we wonder if solidarity has been well captured by the survey. A wide
range of general assessments have argued that the tight-knit Palestinian social structure has
been one of the factors preventing the collapse of the economy during the years following
the Second Intifada (World Bank, 2004s). Against all odds, the Palestinian economy
continued to function and defied the devastating conditions of the previous five years. The
reasons explaining why the economy and society as a whole was able to withstand such
conditions are related to social capital, such as the resilience and cohesiveness of Palestinian
society and, of course, the informal safety nets and foreign aid, which maintained budgetary
solvency, relief and development efforts (UNCTAD, 2006).
Taking this into account, we believe that Palestinian solidarity is not sufficiently captured by
the strategy ‘relying on friends and family’ as provided in 2004 PECS. On the one hand, and
as has been already mentioned, the more general the question, the higher the probability of
misreporting. In the same way that the strategy of selling assets broke down (land, savings,
jewellery, durables), risk-sharing mechanisms should have been further specified. Another
possible bias introduced by the question frame relates to the distinction between normal and
extraordinary solidarity mechanisms. Since being a family in Arab society is a natural safety
net, there is a risk that those interviewed misreport if the questionnaires framed such a net as
an extraordinary action. On the other hand, and beyond family and friends, informal risk

233
sharing can be between friends, relatives and neighbours but also state- and community-
contingent.
Based on the belief that solidarity was being under-reported, it was decided to expand the
borders of risk-sharing strategies and include other two strategies: ‘informal borrowing’ and
‘postponing payment of bills’. Although these strategies are normally considered as inter-
temporal consumption smoothing examples, in the context of the oPt they are more risk-
sharing related. Regarding informal borrowing, in the oPt it rarely occurs with moneylender
schemes but is a common practice among in-laws and neighbours (World Bank, 2004a).
Given the flexibility of payment between in-laws and neighbours, informal borrowing in the
oPt follows a rationale which is more characteristic of spatial than inter-temporal
consumption smoothing strategies. As for the delay in the payment of bills, it has been
possible because government and private companies have assumed their costs. By subsidizing
electricity and water bills, the government and private companies have allowed these services
to continue despite the non-payment of bills194 (Sletten and Pederson, 2003).
Therefore, we would like to propose merging the strategies into groups, thereby facilitating
the analysis. To the present time, we have analyzed the strategies on an individual basis.
However, this is not very operational given that there are 14 strategies and some of them are
used by a low percentage of people. Thus, in order to increase the percentage of use, which
will make its study more relevant and also less vulnerable to statistical tests, we have merged
the strategies into three groups: income-smoothing, inter-temporal consumption smoothing
and risk-sharing. Before we present the distribution, it is important to remark that this 194 Concerning water, while there are cases where the villagers must pay for their water when the trucks arrive, in other villages water is paid through the village council, who collects the payment on behalf of the Palestinian Water Authority, which in turns makes the payment to the Israeli supplier. It is in this case where households do not pay their bills. Unlike in 1988 and 1991, when the Israeli water supplier cut off the water supply to those villages that did not pay, during the Second Intifada the Palestinian Authority assumed the costs. As regards electricity, it is paid either directly to the distribution company in Rammallah or through the municipality. In either of these cases, supply is cut off when families defer payment. In the first case, when the electricity company cuts off the electricity supply, political leaders put pressure on the company to put the electricity back on. In the second case, when it is collected through the municipality, the municipality absorbs the costs or asks the company to assume the cost. However, it is to be noted that one of the components of the Palestinian Reform Development Plan presented in 2007 is the requirement that citizens present a "certificate of payment" of utility bills in order to receive any municipal or government service. This measure will have a dramatic impact on the poor, as the government’s subsidization of electricity and water bills was a central means of survival for millions of people in an environment of rapidly spiralling poverty levels. This new measure means that individuals applying for various services - including requests for ID cards, car licenses, building permits, etc. - will be denied these if these debts are outstanding. Public sector employees will have utility debts docked from their salaries.

234
decision is backed up by the average size of the strategy portfolios. As it is illustrated in the
histogram, Palestinian households adopt a wide number of risk management strategies.
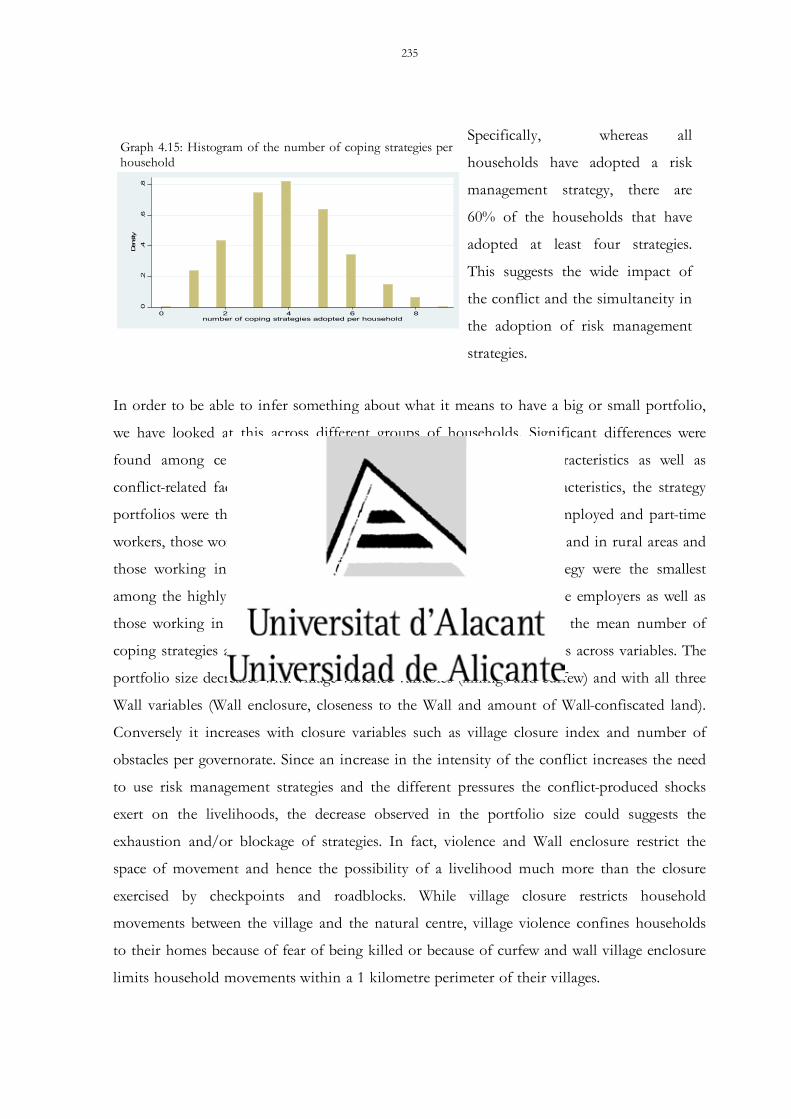
235
Graph 4.15: Histogram of the number of coping strategies per household
0.2
.4.6
.8
Den
sity
0 2 4 6 8number of coping strategies adopted per household
Specifically, whereas all
households have adopted a risk
management strategy, there are
60% of the households that have
adopted at least four strategies.
This suggests the wide impact of
the conflict and the simultaneity in
the adoption of risk management
strategies.
In order to be able to infer something about what it means to have a big or small portfolio,
we have looked at this across different groups of households. Significant differences were
found among certain socio-economic household and location characteristics as well as
conflict-related factors. Concerning the household and location characteristics, the strategy
portfolios were the biggest among poor households, big families, unemployed and part-time
workers, those working in Israel and settlements, the residents of Jenin and in rural areas and
those working in foreign private businesses. The portfolios of strategy were the smallest
among the highly educated, long-term ‘copers’, residents of Jericho, the employers as well as
those working in the Government and in NGOs. If we now look at the mean number of
coping strategies across conflict variables, the sign of the trend changes across variables. The
portfolio size decreases with village violence variables (killings and curfew) and with all three
Wall variables (Wall enclosure, closeness to the Wall and amount of Wall-confiscated land).
Conversely it increases with closure variables such as village closure index and number of
obstacles per governorate. Since an increase in the intensity of the conflict increases the need
to use risk management strategies and the different pressures the conflict-produced shocks
exert on the livelihoods, the decrease observed in the portfolio size could suggests the
exhaustion and/or blockage of strategies. In fact, violence and Wall enclosure restrict the
space of movement and hence the possibility of a livelihood much more than the closure
exercised by checkpoints and roadblocks. While village closure restricts household
movements between the village and the natural centre, village violence confines households
to their homes because of fear of being killed or because of curfew and wall village enclosure
limits household movements within a 1 kilometre perimeter of their villages.

236
Thus, based on the discussion about risk-sharing and the above-mentioned reasons to merge
the strategies into groups, the following table presents the strategies distribution as it is used
in the analysis of the conflict correlates.
Table 4.14: Frequency distribution of risk management strategies (percentage)
Type Strategies Yes No Not applicableAdjusting household labour supply1 25 58 18
Income smoothing1
Farming and/or breeding 29 57 14
Community-risk-sharing2 77 23 0 Risk-sharing2
Relying on friends and family 14 86 0
Inter-temporal consumption smoothing3 De-accumulation of assets3 63 16 21
1. Sending family member to work, sending student family members to work and searching for another job. 2. Informal borrowing and postponing payment of utility bills. 3. Using savings, using savings in Israeli Banks, selling available durable goods, selling jewellery, borrowing from banks and financial institutions, reducing expenditure, selling or mortgaging land or buildings.
Four years after the onset of the Second Intifada and the subsequent increase in intensity of the
occupation instruments, the majority of the households keep on relying to a great extent on both
types of consumption-smoothing mechanisms: inter-temporal and risk-sharing. If the influence of
covariate spread and duration of the crisis on consumption-smoothing is not as apparent as expected,
it is on the income-smoothing actions. There is one third of the population relying on extraordinary
income-smoothing actions, such as farming or adjusting the household labour supply. In order to
study these behaviours further, specifically within their causes, the conflict-correlates of risk
management strategies have been studied and are described in the next section.
4.4 Conflict Correlates of Risk Management
As in the whole of this research, the motivation for this particular analysis of the correlates
of risk management lies in the lack of understanding of risk-related behaviour in the context
of armed conflict. Since one of the issues of concerned is the study of the households
strategies without their causes, the aim of this section is to illustrate the relationship between
the intensity of the conflict-produced shocks (IDF use of violence, the Israeli policy of
closure and the construction of the Wall) and the use of risk management strategies (income-
smoothing and risk-sharing) across different groups of the population. In the analyisis of
237
these conditional associations we are particularly interested in the type of change the control
variable introduces in the relationship ‘strategy use – shock intensity’.
The control groups have been set following the previous discussion about risk management
determinants, the poverty assessments carried out in the oPt and the geography of conflict.
As noted in Section 2.2, household characteristics, and more specifically household poverty
and poverty-related factors, shape the choice and effectiveness of risk management strategies.
They determine the household asset base composition, the access to credit and insurance
schemes, the ability to take up high-return activities, the dependence of the household’s
consumption and income activities, etc. Section 4.1.2 argues for the role of community or
location characteristics. The geography, in general, determines the access to markets places,
roads, proximity to tows, access to services, etc. In the context of armed conflicts, where
land and space are the issues of contention, such as in the Israeli-Palestinian conflict, this
matters profoundly as it determines the socio-political geography of exposure and therefore
the conflict’s impact on the households and the ability to bounce back. In the West Bank
there are significant differences in living standards across localities firstly due to the political
status conferred to the different areas by the Oslo agreements, which determine access to
markets, urban centres and the quality of service underwriting the current territorial
fragmentation; and secondly and most recently due to the overall impact of the Israeli
occupation in terms of use of violence, land annexation and movement restrictions.
The following sections examine the relationship between conflict-produced shocks and risk
management strategies and the role households and location characteristics may play on it.
The following descriptive analysis centres on income-smoothing (Section 4.4.1) and risk-
sharing strategies (Section 4.4.2).
4.4.1 Conflict Correlates of Income Smoothing Strategies
Income-smoothing strategies have been hardly studied in the context of armed conflict.
Generally during such sorts of crisis there is generally an increase in the share of informal,
social, non-market activities (Brück, 2004). Economies during conflict become increasingly
informalised, and peripheral or isolated areas may withdraw from the monetised economy
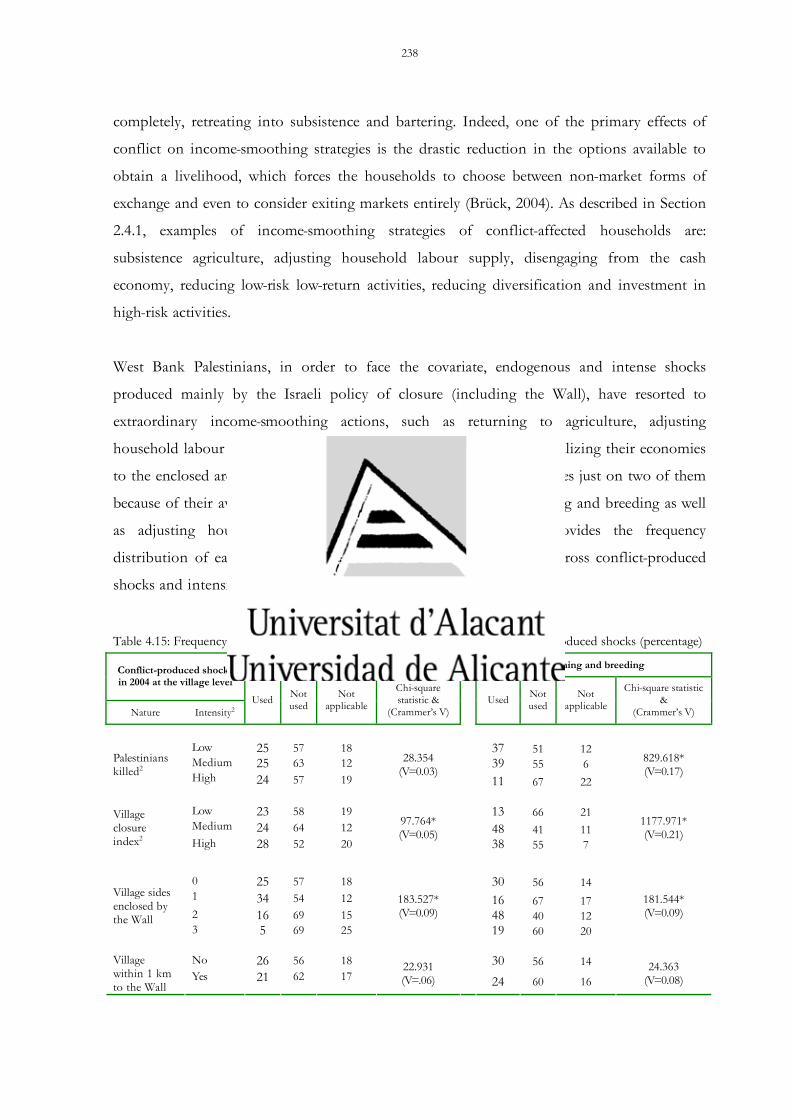
238
completely, retreating into subsistence and bartering. Indeed, one of the primary effects of
conflict on income-smoothing strategies is the drastic reduction in the options available to
obtain a livelihood, which forces the households to choose between non-market forms of
exchange and even to consider exiting markets entirely (Brück, 2004). As described in Section
2.4.1, examples of income-smoothing strategies of conflict-affected households are:
subsistence agriculture, adjusting household labour supply, disengaging from the cash
economy, reducing low-risk low-return activities, reducing diversification and investment in
high-risk activities.
West Bank Palestinians, in order to face the covariate, endogenous and intense shocks
produced mainly by the Israeli policy of closure (including the Wall), have resorted to
extraordinary income-smoothing actions, such as returning to agriculture, adjusting
household labour supply, disengaging from the cash economy and localizing their economies
to the enclosed areas (UNSCO, 2005). Out of these, this analysis focuses just on two of them
because of their availability in PECS. These are the strategies of farming and breeding as well
as adjusting household labour supply. The following table provides the frequency
distribution of each of the income-smoothing strategies (columns) across conflict-produced
shocks and intensities (rows) at the village level. Table 4.15: Frequency distributions of income-smoothing strategies across conflict-produced shocks (percentage)
Adjusting household labour supply1 Farming and breeding Conflict-produced shocks in 2004 at the village level
Nature Intensity2 Used Not
used Not
applicable
Chi-square statistic &
(Crammer’s V) Used Not
used Not
applicable
Chi-square statistic &
(Crammer’s V)
Low 25 57 18 37 51 12 Medium 25 63 12 39 55 6 Palestinians
killed2 High 24 57 19
28.354 (V=0.03)
11 67 22
829.618* (V=0.17)
Low 23 58 19 13 66 21 Medium 24 64 12 48 41 11
Village closure index2 High 28 52 20
97.764* (V=0.05)
38 55 7
1177.971* (V=0.21)
0 25 57 18 30 56 14 1 34 54 12 16 67 17 2 16 69 15 48 40 12
Village sides enclosed by the Wall
3 5 69 25
183.527* (V=0.09)
19 60 20
181.544* (V=0.09)
No 26 56 18 30 56 14 Village
within 1 km to the Wall
Yes 21 62 17 22.931 (V=.06) 24 60 16
24.363 (V=0.08)

239
1. The income-smoothing strategy ‘adjusting household labour supply’ includes: sending non-student family members to work, sending student family members to work, searching for another job. For a discussion on this see the section 4.3.2. 2. Low (the lowest 33% of the data), Medium (from 34% to the 66% of the data) & High (the highest 33% of the data) Note: * = significant at the 0.05 percent level using the Pearson chi-square test
Looking at Table 4.15 above and focusing just on the statistically-significant relationships, we
observe a variation in the extent of use195 of income smoothing across shock intensities,
which is worth studying. Given the low strength of the associations, as measured by
Crammer’s V, one could question the examination of such weak associations. However, since
very little is known about income-smoothing strategies of conflict-affected households, the
analysis of these associations could provide ideas for its future analysis. One of the reasons
that could explain this low strength is the duration of the crisis and the complexity of the
conflict itself. It had been four years since the onset of the second Intifada and the
households were embedded in a chronic and covariate conflict, which demands continuous
risk management to face a multi-layered system of unpredictable and continuous shocks. We
believe that this type of situation widens the number of risk management determinants and
therefore weakens the relationship between risk management strategies and shocks. Future
research should consider analysing how the influence of risk management determinants
varies across the time-line of the conflict.
Looking at the frequency distributions of income-smoothing strategies across shock source,
we firstly note that both strategies behave similarly and major differences are found across
the risk events. Thus, while income-smoothing is positively related to the intensity of village
closure, it is negative related to the intensity of the village violence and wall enclosure. This
lack of homogenous behaviour across the different type of risk events warns of the
simplification of viewing conflict as simply ‘the use of violence’ and therefore the need to
illustrate the conflict in a holistic way.
The second observation from the table above is about the frequency distribution of income-
smoothing strategies across shock intensity. Although the relationships are not linear,
particularly those related to farming, we observe that the reliance on income-smoothing
195 As mentioned in the section about the methods of research and detailed in Section 4.3.2, despite the fact that the variable associated with the risk management strategy has three categories (used, not used, not applicable), due to problems related to the design of the questionnaire (see Section 4.3.2), the focus is placed on the category ‘used’.

240
strategies does not always increase with the intensity of the shock. In fact out of the five
statistically significant associations, three of them are negative: the use income-smoothing
strategies are lower in high-violence (in the case of farming) and high Wall-enclosed villages
than in villages with low levels of violence and Wall enclosure.
Taking into account the wide spread nature of the conflict, the severe impact on households
welfare and the lack of a period of recovery (World Bank, 2004a), it is assumed that an
increase in the shocks intensity increases the need to use income-smoothing strategies. Thus,
assuming that there is a need, the lower use of the strategies in high conflict-affected villages
(as opposed to low conflict-affected villages) could be exaplained by two two factors:
households lack their own means (e.g. lack of labour force, lack of land and livestock) or
households own the means but access is blocked due to violence and the Wall. Regarding the
latter, conflict-produced shocks do not just reduce the options available to obtain livelihoods
to non-markets or outside-market forms of exchange as Brück suggest; they generally reduce
the livelihood options, which according to the complex emergencies approach is part of a
systematic and deliberate strategy to block household responses. Thus, if we compare the
behaviour of income-smoothing strategies across the three different types of shock, we
observe that violence and Wall enclosure exert more pressure on income-smoothing strategies
than the village closure index. Violence and Wall enclosure restrict the space of movement
and hence the possibility for a livelihood much more than the closure exerted by
checkpoints and roadblocks. Thus, taking into account the nature of the shock, we could say
that village violence confines their households to their homes because of fear of being killed
or because of curfew; Wall village enclosure limits household movements within a 1
kilometre perimeter of the villages concerned; and village closure restricts household
movements between the village and the natural centre196. Besides the space for manoeuvring
and taking into account the structure of the different types of obstacle (see Chapter 1),
Palestinian households find much more difficulty crossing the wall than the checkpoints and
the roadblocks. As opposed to roadblocks and checkpoints, the Wall, once it is fully
constructed, will be a permanent and continuous structure with few gates, whose crossing is
impossible unless you have a permit.
196 Details of the construction of the closure variables can be found in Section 4.2.1

241
However, in order to be able to conclude anything from the negative relationship observed
or more generally about the income-smoothing behaviour of conflict-affected households, it
is necessary to test for the lack-of-means hypothesis by looking at the differences across
household- and community-comparative advantages.
In the particular case of income-smoothing, one of the factors that significantly influences
the household income portfolio in contexts where credit and insurance markets are imperfect
or absent is poverty-related. Regarding this, three main factors have been identified: the
comparative advantages of households who possess particular skills or endowments of labour
which obtain higher returns; access to certain types of actions due to capital, technology
and/or the ability of households; and the last factor is related to location characteristics
determining access to public infrastructure such as market places and roads, proximity to
towns, common property resources and other public goods and services.
In the oPt, due to the type of conflict, location characteristics determine the socio-political
geography of exposure and therefore the conflict’s impact on the households and the ability
to bounce back. Although household characteristics are also exposure indicators (e.g. being
male, single and having an age within the range of 14-40 years old), the fact that the issue of
contention of the Israeli-Palestinian conflict is related to land and more generally to space,
gives certain relevance to the location as exposure indicators. Recalling Section 4.3.2,
exposure to conflict–produced shocks seems to increase if the household residence is a
refugee camp, if it is located close to settlement structures or if the household exists in a
governorate with a strong support for armed militancy, such as Jenin and Nablus. In
addition, the impact of conflict has been particularly severe in locations which combine high
exposure with low household welfare and community infrastructure. For example, UNSCO
(2005) reported severe conflict impact on rural and remote areas that are highly dependent
on West bank cities, Israel or Israeli settlements for jobs and markets. Given the type of data
we are using for this type of analysis, is not possible to disentangle whether the differences
observed in the use of income-smoothing strategies are due to poor community
infrastructure or because of exposure to conflict-produced shocks.
Since it is not possible to unravel the reasons behind the community influence on risk
management, the following analysis focuses on identifying which are the factors – either

242
household- or community-related – which introduce the major differences in the relationship
between the use of income-smoothing strategies and shocks intensity. Thus, with the overall
aim of understanding the cases where the relationship is negative and the role household and
community characteristics may have on them, we have carried out conditional associations.
More specifically, we are interested in the following questions: how different is the
relationship ‘strategy-shock’ amongt households exposed to different types of shocks? How
different is the relationship ‘strategy-shock’ among households exposed to similar type of
shocks but differentiated by household’s comparative advantages or location characteristics?
In order to address these questions, the behaviours observed across the conditional
associations have been classified into three types.
1. OT-type: The direction of the association ‘strategy use - shock intensity’ is different
across the categories of a control variable.
2. WT-type: The direction of the association ‘strategy use - shock intensity’ is similar
across the categories of a control variable but differences are identified in the form of
the relationship.
3. NO: The last type of change is when the associations are alike across the different
categories of the control variable in terms of direction and form.
In order to summaise the types of behaviour observed in the conditional associations, the
following table has been constructed based on frequency distributions197. While the the
columns, based on the results of Table 4.15, contain the statistically-significant associations
between the income-smoothing strategies and shocks, the rows include the control variables.
197 Appendixes 12 to 16 contain the results of the conditional associations between each pair of income-smoothing strategies and conflict-produced shocks. The first table of each appendix summarises the percentage of use of income-smoothing strategies across conflict-shock intensities for different groups of the population.

243
Table 4.16: Type of behaviour of conditional associations between strategies and shocks1
Associations between income-smoothing strategies and shocks
Farming and breeding Adjusting household labour supply1st order conditional or control variables2
Violence shock
Village closure shock
Wall enclosure shock
Village closure shock
Wall enclosure shock
Poverty aggregates Poverty WT NO NO nesc NO Monthly consumption WT NO nesc Max. coping period WT NO OT WT Demographics Sex nesc Age nesc Household size WT WT nesc WT Education of the household head Education level NO NO nesc nesc Employment of the household head Employment status NO WT nesc nesc nesc Job location WT NO nesc Employment sector WT NO nesc nesc nesc Dependency ratio NO NO WT NO Assets Land ownership NO NO WT nesc nesc Livestock ownership WT NO nesc nesc nesc Location Location type OT OT nesc OT neo Governorate WT neo WT nesc neo Distance to the city nesc neo neo OT neo
1. The conditional associations have been classified according to three type of behaviour, i.e. whether the relationship between income-smoothing and shocks is alike across the categories of the conditional variable (NO-type), and if not, whether the difference lies in the direction (OT-type) or in the shape (WT-type) of the association. The type of behaviour is only written when the conditional associations are statistically significant at the 0.05 percent using the Pearson chi-square test. 2. Non-categorical variables have been converted into categorical variables and as for the intensity of the conflict-produced shocks, three categories have been established based on three cut off points: low (cut off lowest 33% of the data), medium (from 34% to 66% of the data), high (highest 33% of the data). Note ‘nesc’ stands for ‘not enough categories significant’ and denotes those cases where the conditional association is statistically significant in one of the categories of the group. Note ‘neo’ stands for ‘not enough observations’ and denotes those cases where one of the categories of the group lacks observations in any of three possible scenarios, i.e. low-, medium- and high-shock intensity.

244
Looking at the distribution of the conditional associations behaviours as presented in Table
4.16, we firstly note the low numbers of OT-type behaviours; the direction of the relationship
does not change significantly across different groups of the population. Bearing in mind the
limitations of a bivariate analysis, this lack of change in the directional nature of the
relationship ‘strategy-shock’ could be an indication of the little space for manoeuvring that
the occupation-produced shocks leave to other factors to influence the impact of the shock
on the income-smoothing strategies.
A second observation from the table is about the OT-type of relationships. Note that the
majority of them are introduced by location and not by household characteristics. This is in
line with the previously-raised argument that community characteristics influence the access
of income-smoothing actions of conflict-affected households; and they do it to a greater
extent than the households’ comparative advantages. As will be shown next, while household-
comparative advantages in terms of poverty, skills and labour endowments act as enablers of
income-smoothing strategies, they do not have the power, by themselves, to transform the
direction of the relationship between strategy and shock. This does not mean that household
asset bases do not matter, they do, but their role in risk management of conflict-affected
households does not seem to be as important as the ones observed during covariate and
exogenous shocks.
After this general approximation and with the overall aim of exploring the relationship
between income-smoothing strategies and conflict-produced shocks and the role households
and community characteristics may play on it, particularly when the relationship is negative,
the following part of this section illustrates the different types of relationships as described
in Table 4.16. The following analysis does not aim to be systematic and comprehensive; it is
rather a preliminary exploitation of the data, which rather than providing conclusive facts,
aims to identify certain possible behaviours, and needs to be studied further by a
multivariate analysis.
Households Farming vs. Village Violence
Table 4.16 shows that most of the conditional associations between farming and violence are
of WT- or NO-types. This means that the negative relationships observed between farming

245
and violence in 4.15 is maintained overall across different groups of households198. The only
exception was observed among households living in refugee camps199. For the rest of the
groups examined, regardless of the household comparative advantage - in terms of poverty,
family size, education, employment, land and livestock ownership – and the governorate of
residence – specifically Tulkarem, Nablus, Jenin – households living in villages highly
affected by violence rely on farming to a lesser extent than those living in low-violence
affected villages. This homogenous behaviour across households living in camps could
suggest that farming is reduced because of physical and not economic pressure. Violence
blocks the access to agriculture land and confines the households to their homes or to
delineated areas because of fear of being killed or because of curfew.
In order to study further this hypothesis of violence blocking farming, the following graphs
illustrate the WT-type of associations. For a matter of clarity, we have not plotted all groups
on one single graph. Instead, the categories have been separated into two graphs according to
the type of negative relationship. These are line graphs and illustrate the percentage of
households using a specific strategy across low, medium and high conflict-affected villages.
Bear in mind that the focus of attention is not so much on the extent of use, which of
course varies across groups, but on the form of the relationship ‘strategy-shock’. Looking at
Graphs 4.16a and 4.16b, we can detect that the differences lie in the medium-violence-affected
villages.
Graph 4.16a: Association between farming and violence across households
0
15
30
45
60
low middle high
village violence intensity
household strategy
use ( %)
poor
small families
no livestock
Tulkarem residents
Nablus residents
family head working same locality
family head working nationalcompany
The group of households in
Graph 4.16b, rather than
decreasing monotonically the
use of farming as the groups of
Graph 4.16a do, manage to
increase their reliance on
198 Table 1 in Appendix 12 provides the percentage use of farming across village closure intensities for different groups of households. 199 Camp dwellers of different kind (poor, non-poor, small-sized, big-sized, full-time employed heads, illiterate heads, not owning land or livestock) rely on farming in high-violence villages to a greater extent than those households living in camps which are low-affected by violence. See Table 2 in Appendix 12 for the results of the second-order associations.

246
Graph 4.16b: Association between farming and violence across households
0
15
30
45
60
75
90
low middle high
village violence intensity
householdstrategy
use (%)
non-poor
medium-sized families
livestock owners
Jenin residents
family head goverment employee
family head working samegovernorate
farming in medium-violence-
affected villages. In the context
of the oPt, these households of
graph 4.16b are the better-off
categories of the selected
groups.
Second-order associations200 have been carried out to identify, as far as possible and always
within the limits of this type of analysis, the importance that certain factors may play on the
association of study. In this case, we calculated second order associations for the factors
included in graph 4.16b and none of them maintained the increase in middle-violence
villages when other conditions were added201. Thus, if they these factors of graph 5.41b may
explain this increase, they may do so in combination with other factors. For examples, in
this particular case, it seems that it is poverty and family size, more specifically non-poor and
medium-sized families, that are the factors explaining the increase in farming202.
Households Farming vs. Village Wall Enclosure
The following relationship is between household farming and village Wall enclosure.
According to Table 4.16 the number of associations studied is 5, which leaves us with a
rather small empirical basis203. Bearing this in mind, we observe that all the studied
associations hold an overall negative relationship between farming and Wall enclosure.
‘Overall’ is stated because the association is non-linear. Since it is difficult to explain this
non-linear behaviour with the data available, it has been decided to focus on the two extreme
scenarios, i.e. no closure and the highest closure. This relationship is negative and it is
negative across all the studied groups204, which raises again the relevance of the risk event
200 While a first-order association is one where another variable has been controlled, a second-order association is one in which two other variables have been controlled. 201 See Tables 3, 4, 5, 6, 7, 8 in Appendix 12 for the results of the second-order associations. 202 Scheme 1 in Appendix 12 provides the percentage of use of farming across village closure intensity for household profiles with aggregated number of characteristics. 203 As indicated in the table, the relationships studied are those whose conditional associations (e.g. family size) is statistically significant in at least two of its categories (e.g. small-sized and big-sized families) and there are observations across all conflict-intensity types (i.e. low, medium and high). Since this is a preliminary exploitation of the data, we will continue with the analysis in spite of the low empirical basis. 204 Table 1 in Appendix 14 provides the percentage of use of farming across village closure intensity for different groups of households.

247
over househlds characteristics. In order to illustrate this homogenous behaviour in the nature
of the relationship and the differences found within it, we have prepared the following
graphs.

248
Graph 4.17a: Association between farming and village Wall enclosure across households
0
15
30
45
60
75
0 1 2 3
no. village sides enclosed by the Wall
householdstrategy
use ( %)
poornon-poorcan cope > 12 monthscan cope < 4 monthshigh-dependentlow-dependent
Graph 4.17b: Association between farming and village Wall enclosure across households
0
15
30
45
60
75
90
0 1 2 3
no. village sides enclosed by the Wall
household strategy
use ( %)
Tulkarem residentsQalqilya residentsland ownersnot owning land
Graph 4.17c: Association between farming and village Wall enclosure across Qalqilya residents
0
15
30
45
60
75
90
0 1 2 3
no. village sides enclosed by the Wall
householdstrategy
use (%)
poornon-poorcan cope > 12 monthshigh dependent
While Graph 4.17a illustrates those groups
that behave alike (NO-type), Graph 4.17b
includes those groups, whose category
behaviours differ (WT-type). Looking at the
graphs, we can appreciate that farming does
not decrease progressively as the number of
the village sides enclosed by the Wall
increases. One factor influencing the
negative and non-linear behaviour, and that
should be taken into account in future
analysis, is the route of the Wall and the
extent to which the Wall separates the village
from agricultural land. The importance of
this information is confirmed in the Graph
4.17b, where the two cases with a more
progressive negative behaviour (Qalqilya
residents and households not owning land)
are households particularly affected by the
Wall. While Qalqilya is the governorate
most affected by the construction of the
Wall, households not owning land have less
probabilities to get a Wall gate permit as
they are more easily granted to households
which can demonstrate that they own land
whose access is blocked by the Wall. Out of
these two just mentioned cases, the results of
the second-order associations only confirm
the case of the Qalqilya residents205 (Graph
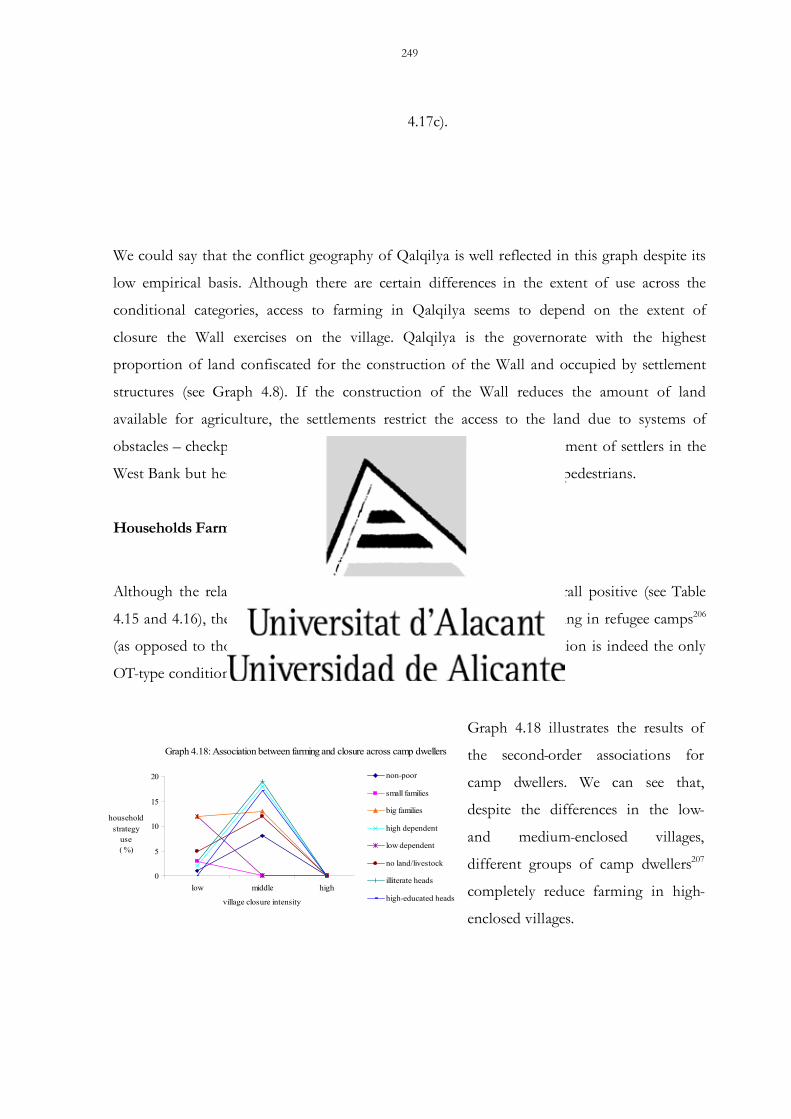
249
4.17c).
We could say that the conflict geography of Qalqilya is well reflected in this graph despite its
low empirical basis. Although there are certain differences in the extent of use across the
conditional categories, access to farming in Qalqilya seems to depend on the extent of
closure the Wall exercises on the village. Qalqilya is the governorate with the highest
proportion of land confiscated for the construction of the Wall and occupied by settlement
structures (see Graph 4.8). If the construction of the Wall reduces the amount of land
available for agriculture, the settlements restrict the access to the land due to systems of
obstacles – checkpoints, roadblocks, trenches - that guarantee the movement of settlers in the
West Bank but heavily limit the movement of Palestinian vehicles and pedestrians.
Households Farming vs. Village Closure
Although the relationship between farming and village closure is overall positive (see Table
4.15 and 4.16), there is one case where it turns negative: households living in refugee camps206
(as opposed to those living in urban and rural areas). The type of location is indeed the only
OT-type conditional association.
Graph 4.18: Association between farming and closure across camp dwellers
0
5
10
15
20
low middle high
village closure intensity
householdstrategy
use ( %)
non-poor
small families
big families
high dependent
low dependent
no land/livestock
illiterate heads
high-educated heads
Graph 4.18 illustrates the results of
the second-order associations for
camp dwellers. We can see that,
despite the differences in the low-
and medium-enclosed villages,
different groups of camp dwellers207
completely reduce farming in high-
enclosed villages.

250
Although the non-linear relationship constrains the interpretation of farming behaviour
across village closure intensities, it seems as if farming is considered an option only in
middle-closed villages. This could be explained by the fact that there is no land within the
refugee camps and camp dwellers need to go outside the camp for farming and breeding.
While dwellers of low-closed camps may prefer to work somewhere else rather than on
someone else’s land, when closure is high the cost of farming outside the enclosed area
increases considerably because of the risk involved in accessing land without the required
permit. Therefore farming is discouraged.
The fact that this is a behaviour shared by a wide range of households proxying different
welfare dimensions could indicate that the reduction of farming is explained significantly by
the characteristics of the refugee camps. Refugee camps are greatly exposed to conflict-
produced shocks as the descriptive analysis in Section 4.2.2 has shown. Furthermore, refugee
camps are more vulnerable to closure than other types of villages because of the limited
livelihood options within the camps, including access to land. Refugees (96% of the camp
dwellers) do not own land. The 19 camps of the West Bank are overcrowded and there is no
land within the camp that can be used for agriculture, even subsistence agriculture. Whether
the reduction in farming is explained by the camps overall poverty or by blockage by
occupation instruments is a question that needs to be explored in the future, taking into
account that the refugee problem and their actual conditions are produced by the conflict
itself.
Adjusting Household Labour Supply (AHLS) vs. Village Closure
The empirical basis to study the relationship between the strategy of AHLS and village
closure is low. Out of the four associations, three are classified as OT-type208. Indeed there are
three groups of households – those living far from the city, in refugee camps and those
whose period of coping is exhausted – whose reliance on this strategy decreases with the
intensity of the village closure. Of these modifier effect factors, there are two which seem to

251
be worth studying, as their modifier effect does not disappear when analysed collectively with
other household and location variables209. The following graphs illustrate the households in
terms of their coping period and village remoteness. Unlike other graphs, these include the
statistically significant categories of the control group and the results of the second-order
associations carried out for the cases introducing the modifier effect we are interested in:
households whose coping period has been exhausted (Graph 4.19a) and households living far
from the city (Graph 4.19b).
Graph 4.19a: Association between the strategy of AHLS and village closure across household's coping period
0
20
40
60
80
100
low middle high
village closure intensity
householdstrategy
use (%)
can cope < 4 months
cannot cope anymore
non-poor (can't cope)
high-dependent (can t́ cope)
not owning livestock (can't cope)
family head employed (can'tcope)
Graph 4.19b: Association between the strategy of AHLS and village closure across household's village remoteness
0
15
30
45
60
low middle high
village closure intensity
householdstrategy
use (%)
living close to the city
living far from the city
non-poor (living far)
high-dependent (living far)
not owning livestock (living far)
family head working foreigncompany (living far)
As we can see from both graphs,
households, whose coping period
has been exhausted (as opposed
to those whose coping period is
less than 4 months in Graph
4.19a) and those living far from
the city (as opposed to those
living close to the city Graph
4.19b) decrease the AHLS when
the households are in high-closed
villages.
Although the results of the second-order conditional associations do not offer a broad
spectrum of household profiles, it is worth noting the common behaviour and therefore the
potential relevance of the village remoteness and household’s vulnerability. Closure has been
particularly severe in remote communities that are highly dependent on their links to the
city as well as to Israel; particularly for jobs, markets and services. Although these have been
often localised within the enclosed areas, the size of the economy in the remote areas has
been drastically reduced and hence the for AHLS. As for the households contrainsts, it is the
households vulnerability rathen than poverty what seems to constrain the household’s
internal reorganization. Although it is out of the scope of this research to identify the
vulnerability indicators, it is generally noted that during armed conflict, household
vulnerability depends on both welfare and exposure indicators. Thus, vulnerable households

252
in the oPt are not only those that lack the means, i.e. the poor, but also the most exposed to
conflict because of their demographics and residence and job locations.
AHLS vs. Village Wall Closure
The last negative relationship we have examined between income-smoothing strategies and
the conflict-produced shocks is the association between AHLS and Wall village enclosure. As
was true with the relationship between Wall closure and farming, the empirical base is low
and only 4 studied conditional associations were studied. All of them hold a negative non-
linear relationship between the strategy AHLS and Wall closure. The following graphs
illustrate the groups that behave alike (Graph 4.20a) and the groups whose category
behaviours differ (Graph 4.20a).
Graph 4.20a: Association between the strategy of AHLS and Wall enclosure across households
0
1530
4560
75
0 1 2 3
no. village sides enclosed by the Wall
household strategy
use (%)
poornon-poorhigh dependentmedium dependent
Graph 4.20b: Association between the strategy of AHLS and Wall enclosure across households
01530456075
0 1 2 3
no. village sides enclosed by the wall
householdstrategy
use (%)
can cope > 12 months
cannot cope anymore
small-sized family
big-sized family
First of all, we can note that households,
regardless of their comparative advantages
in terms of poverty, maximum period of
coping, dependency ratio, and family size,
hold an overall non-linear negative
relationship210. As in other cases, this
homogenous behaviour upgrades the
relevance of the risk event. The closure that
the Wall produces on the villages reduces
the mobility to those enclosed, exhausting
the options available for a livelihood, and
hence the possibilities for AHLS.
A second comment on the graphs above refers to the differences as illustrated in Graph
4.20b. This graph illustrates two types of decreasing trend: an abrupt one and a smooth one.
The smooth trend is found among the small-sized families and long-term copers, i.e. those
whose maximum coping period is greater than one year. In order to be able to infer what is
behind this, we carried out second-order associations211. However, the results did not allow us
to conclude anything else besides the persistence of the negative direction of the relationship.
253
To conclude, having explored the negative relationships between income-smoothing strategies
and conflict-produced shocks, we would like to recall the main ideas that have emerged
during the analysis. Bearing in mind the limitations of the type of analysis used, based on
the findings, we can generally conclude that the reliance on income-smoothing strategies
seems to be significantly influenced by the shock type and intensity. Since land and more
generally space are the main issues of contention within the Israeli-Palestinian conflict, the
differences in the income-smoothing portfolio across shock type and intensity are mostly
found in the location-related characteristics (as opposed to household poverty or poverty-
related factors). Although there are differences in the extent of use of income-smoothing
strategies between worse- and better-off households, they do not seem to have transformative
power to be able to change the nature of the relationship between the strategy use and the
shock intensity. Therefore, in spite of the importance of income-smoothing gains in crises,
where the spread is covariate and the duration long, households living in high violence and
wall-enclosed villages rely on income-smoothing strategies to a lesser extent than those living
in less violence and wall-affected locations. The fact that this is a common behaviour across
households, regardless of their poverty status or labour requirements in terms of household
size, land/livestock ownership or skills, seems to indicate that when violence is intense and
the village’s wall enclosure high the households have little space for manoeuvring to
influence the overall affects of income-smoothing. Vis-à-vis the location characteristics, the
few examples of modifier effects have been related to the type of location; particularly living
in a refugee camp or in remote village. These factors are particularly important because the
behaviours they produce transcend household poverty and poverty-related factors. Given the
type of data, this analysis has not been able to explore what is behind the fact of living in
refugee camps or the distance to the governorate city. Future analysis is encouraged to assess,
on the one hand, whether the community power to override the nature of the relationship
between income-smoothing conflict-produced shocks is because of the public infrastructure
or a direct effect of the armed conflict. On the other hand and most importantly, it is
crucial to find out whether it is possible or, indeed, appropriate, to detach the community
living conditions from the consequences of the occupation or more specifically the Israeli-
Palestinian conflict.

254
4.4.2 Conflict Correlates of Risk-sharing Strategies
Micro-analysis of risk-sharing in the context of armed conflict is scarce. As already
mentioned, all the evidence found about risk-sharing of conflict-affected households comes
from studies that approach it indirectly from social capital and civil-society perspectives.
These studies, mostly following a macro- or meso-level type of analysis, report that risk-
sharing takes place among conflict-affected households. In spite of the impact that covariate
and intense shocks may have on risk-sharing and the deliberate targeting of social capital –
and its manifestations in the form of trust, norms of reciprocity and networks of civil
engagement – risk-sharing, particularly the arrangements based on bonding social capital, is
an important source of support for the conflict-affected household. The process affecting
social capital is complex. Generally, it is difficult to disentangle what is the effect of conflict
and what is the result of wider processes of social change (Cliffe and Rock, 1997). In
addition, the factors influencing social capital – e.g. society exclusion, strength of civil
society, nature of personal relationships, existence of social and political institutions, etc. -
are partly a cause and partly a consequence of ongoing armed conflict.
Regarding the oPt, the manifestations of social capital in the forms of risk-sharing is a
subject that requires greater attention because despite the importance that it seems to play
(World Bank, 2004a, UNCTAD; 2006), we did not find any analysis at the micro-level. An
example of the lack of attention that social capital or any of its manifestations has received is
the way it has been included in the household surveys addressing risk management strategies.
As discussed earlier in this chapter, the scope of risk-sharing within PECS is limited to a few
examples of bonding forms of informal risk-sharing arrangements based on ‘nearest and
dearest’ and local government.
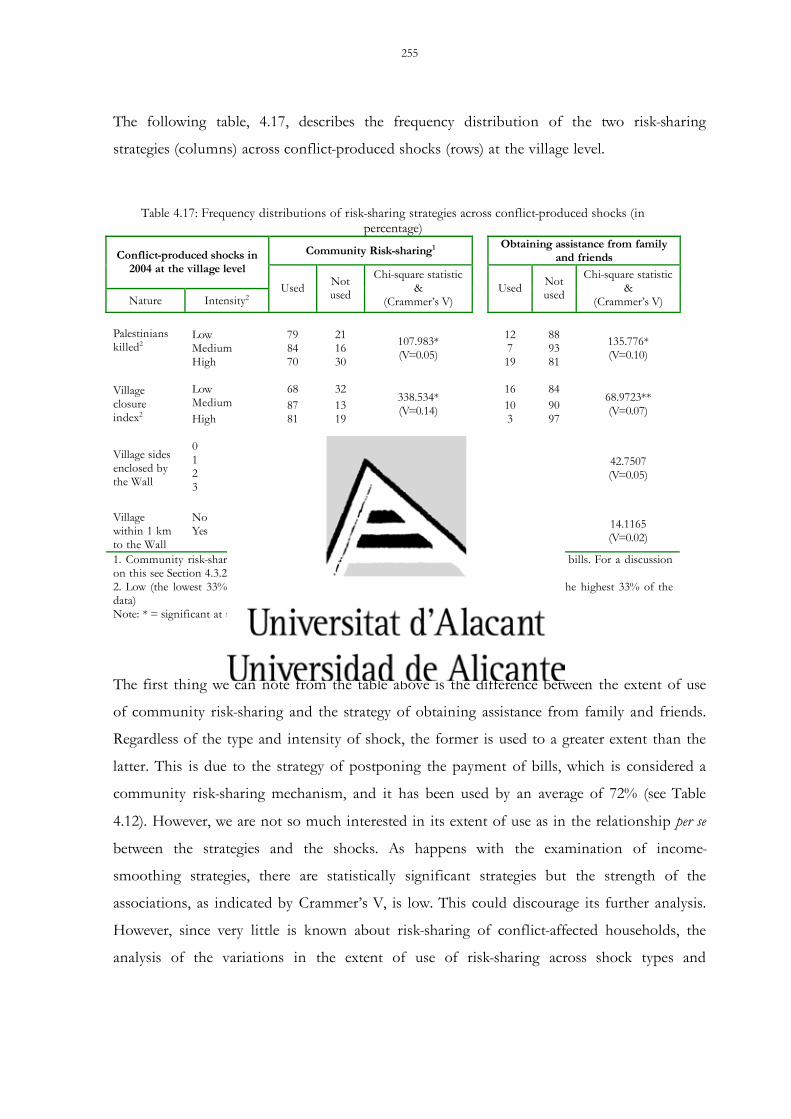
255
The following table, 4.17, describes the frequency distribution of the two risk-sharing
strategies (columns) across conflict-produced shocks (rows) at the village level.
Table 4.17: Frequency distributions of risk-sharing strategies across conflict-produced shocks (in percentage)
Community Risk-sharing1 Obtaining assistance from family and friends Conflict-produced shocks in
2004 at the village level
Nature Intensity2 Used Not
used
Chi-square statistic &
(Crammer’s V) Used Not
used
Chi-square statistic &
(Crammer’s V) Low 79 21 12 88 Medium 84 16 7 93
Palestinians killed2
High 70 30
107.983* (V=0.05) 19 81
135.776* (V=0.10)
Low 68 32 16 84 Medium 87 13 10 90
Village closure index2 High 81 19
338.534* (V=0.14)
3 97
68.9723** (V=0.07)
0 79 21 14 86 1 69 31 8 92 2 80 20 20 80
Village sides enclosed by the Wall 3 56 44
175.667* (V=0.10)
13 87
42.7507 (V=0.05)
No 79 21 14 86 Village
within 1 km to the Wall
Yes 69 31 87.308* (V=0.08) 11 89 14.1165
(V=0.02)
1. Community risk-sharing strategies include informal borrowing and postponing payment of bills. For a discussion on this see Section 4.3.2 of this chapter. 2. Low (the lowest 33% of the data), Medium (from 34% to the 66% of the data) & High (the highest 33% of the data) Note: * = significant at the 0.05 percent level using the Pearson chi-square test
The first thing we can note from the table above is the difference between the extent of use
of community risk-sharing and the strategy of obtaining assistance from family and friends.
Regardless of the type and intensity of shock, the former is used to a greater extent than the
latter. This is due to the strategy of postponing the payment of bills, which is considered a
community risk-sharing mechanism, and it has been used by an average of 72% (see Table
4.12). However, we are not so much interested in its extent of use as in the relationship per se
between the strategies and the shocks. As happens with the examination of income-
smoothing strategies, there are statistically significant strategies but the strength of the
associations, as indicated by Crammer’s V, is low. This could discourage its further analysis.
However, since very little is known about risk-sharing of conflict-affected households, the
analysis of the variations in the extent of use of risk-sharing across shock types and

256
intensities, as described in Table 4.17, could provide preliminary notions for its future
analysis.
Therefore, based on the statistically-significant relationships, we can firstly observe that the
frequency distribution of risk-sharing across shock intensity is not homogenous across
strategies and types of shocks. The distribution changes not just across the different types of
shock, as happens with income-smoothing strategy, but also across the strategies. This lack of
homogenous behaviour raises the need to recognise the multiple direct effects of armed
conflict and the different behaviours relating to social capital depending on group nature.
Secondly, we observe that half of the relationships are non-linear. Since explaining the factors
behind these types of relationship is out of the scope of this analysis, it has been decided to
leave this for future studies and simplify the exploration of the relationships between risk-
sharing and conflict-produced shocks in terms of the two extreme scenarios, i.e. low- and
high-conflict-affected villages in the case of violence and village closure; and 0 and 3 villages
sides enclosed in the case of Wall enclosure. Therefore, based on this two-scenario approach,
we can look back at Table 4.17 and see that the use of risk-sharing does not necessarily
decrease with the intensity of the shock. Indeed, there are cases where the relationship
between risk-sharing use and shock intensity is positive. These opposite forces are in line with
the contradictory processes that govern social capital during armed conflicts.
In spite of the complexities of the process of risk-sharing during armed conflict, we have
attempted to interpret the positive and negative relationships of the table in general terms.
Thus, taking into account the wide-spread nature of the conflict and the severe impact on
household welfare we have assumed that an increase in conflict intensity increases the need
to use risk-sharing mechanisms as we would assume the same for any other risk-management
strategy. If we further take into account the nature of the risk-sharing strategies (largerly
related to family and friends) and the structure of the Palestinian society (family constitutes a
strong network of social and economic obligations and privileges), a reduction in the extent
of use of risk-sharing actions may be due to the effects of conflict on civil society and social
capital. That is households reduce the use of risk-sharing because of asset exhaustion and
destruction. Asset exhaustion and looting results in an overall lack of resources within
families and communities which undermines exchange networks. Territorial fragmentation

257
splits up families and communities, taking individuals away from the context in which they
can draw on reciprocal networks. The social fabric is destroyed by the use of violence, which
creates a vacuum of mistrust and may turn the community against itself.
Besides the spread, intensity and nature of armed conflicts, the type of social capital has been
identified as an important factor, establishing the links of reciprocity and bonds of trust,
which decide the scheme of membership and the strength. Regarding the former, individuals
or groups within communities may be excluded from the risk-sharing arrangements for
economic and social reasons. In the case of bonding social capital, the social selective criteria
depend on whether you belong to the homogenous group or not, which in the specific case
of the risk-sharing strategies we are exploring it is based on kinship and national interest.
Parallel to these socio-political factors, there are the economic factors, which basically exclude
individuals and groups within the community based on their wealth.
As for the strength of social capital, research carried out in a set of countries reported that
during armed conflict the most resilient risk-sharing arrangements were frequently those
which depend on bonding social capital at the expense of broader societal networks. In our
example of risk-sharing in the oPt, taking into account the nature of the context, obtaining
assistance from family and friends and community risk-sharing could be considered as
mechanisms relying on bonding social capital; the former relying on kin and the latter on
national ties. The above-observed non-homogenous behaviour of the risk-sharing strategies
raises the question of whether the differences may not just lie in the type of social capital the
strategies rely on (bonding vs. bridging) but within the nature of the links among members
of homogenous groups (e.g. family-, friends-, neighbourhood- or wider community-based),
which define the implicit norms of reciprocity, specifically in situations of stress.
If the analysis of the factors influencing social capital and risk-sharing is a difficult task, in
the context of armed conflict it becomes more complex as these factors are endogenous to
the on-going armed conflict. Therefore, and being aware of this complexity and the limits of
this dissertation, the aim of this section is to provide preliminary analyses of the conflict-
correlates of risk-sharing by illustrating those cases where risk-sharing seems to be more
resilient and examine the role household and community characteristics may have on them.
However, due to availability of data, the control variables, rather than proxying the economic

258
and social factors influencing membership and the strength of social capital, set up general
profiles based on household welfare (consumption and vulnerability), welfare-related variables
(demographics, education, employment and productive assets) and community characteristics
(location type, distance to the city, population size and governorate). As in the previous
section, we are interested in the following questions: how different is the relationship
‘strategy-shock’ amongst households exposed to different types of shocks? How different is
the relationship ‘strategy-shock’ among households exposed to similar type of shocks but
differentiated by household’s comparative advantages or by residence’s location
characteristics?
The following table, based on frequency distributions, summarises the behaviours observed in
the conditional associations212. While the columns, based on the results of Table 4.17,
contain the statistically-significant associations between the risk-sharing strategies and shocks,
the rows include the control variables.
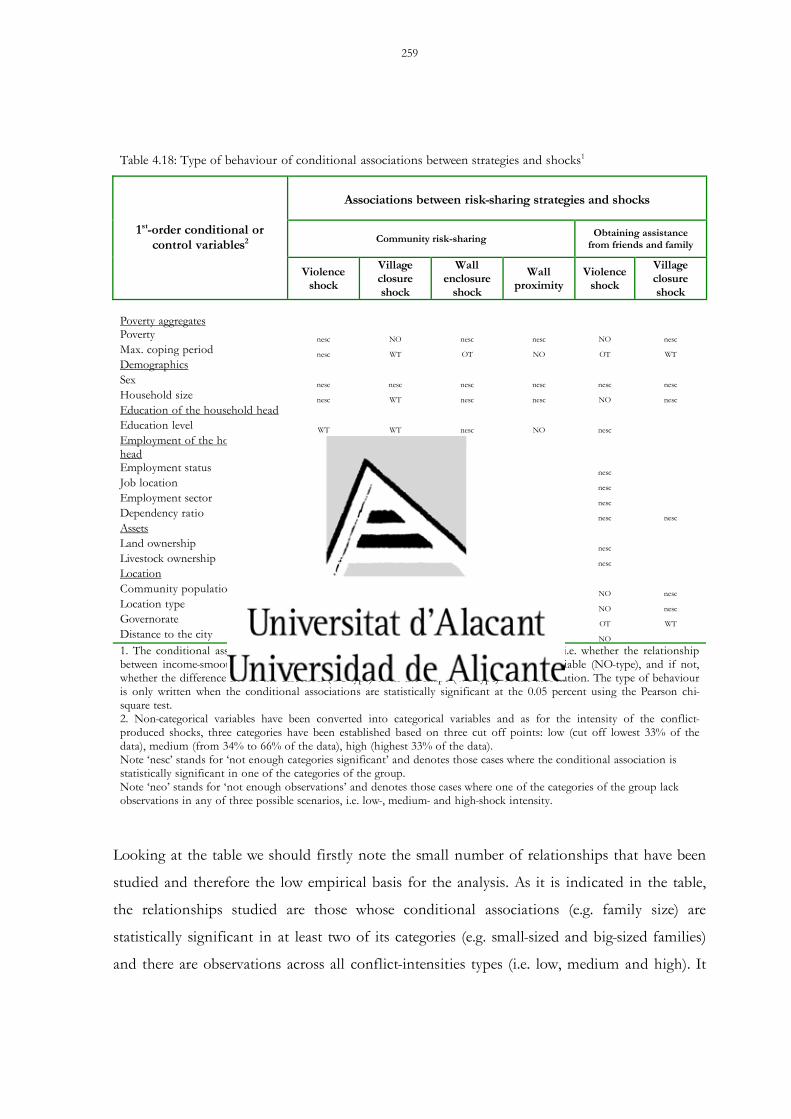
259
Looking at the table we should firstly note the small number of relationships that have been
studied and therefore the low empirical basis for the analysis. As it is indicated in the table,
the relationships studied are those whose conditional associations (e.g. family size) are
statistically significant in at least two of its categories (e.g. small-sized and big-sized families)
and there are observations across all conflict-intensities types (i.e. low, medium and high). It
Table 4.18: Type of behaviour of conditional associations between strategies and shocks1
Associations between risk-sharing strategies and shocks
Community risk-sharing
Obtaining assistance from friends and family
1st-order conditional or control variables2
Violence shock
Village closure shock
Wall enclosure
shock
Wall proximity
Violence shock
Village closure shock
Poverty aggregates
Poverty nesc NO nesc nesc NO nesc Max. coping period nesc WT OT NO OT WT Demographics Sex nesc nesc nesc nesc nesc nesc Household size nesc WT nesc nesc NO nesc Education of the household head Education level WT WT nesc NO nesc Employment of the household head
Employment status nesc OT NO nesc Job location nesc WT NO NO nesc Employment sector nesc WT nesc nesc nesc Dependency ratio NO nesc nesc nesc nesc Assets Land ownership WT NO nesc nesc nesc Livestock ownership nesc nesc nesc nesc nesc Location Community population size neo neo nesc nesc NO nesc Location type OT NO neo NO NO nesc Governorate nesc neo neo OT OT WT Distance to the city OT neo nesc nesc NO 1. The conditional associations have been classified according to three type of behaviour, i.e. whether the relationship between income-smoothing and shocks is alike across the categories of the conditional variable (NO-type), and if not, whether the difference lies in the direction (OT-type) or in the shape (WT-type) of the association. The type of behaviour is only written when the conditional associations are statistically significant at the 0.05 percent using the Pearson chi-square test. 2. Non-categorical variables have been converted into categorical variables and as for the intensity of the conflict-produced shocks, three categories have been established based on three cut off points: low (cut off lowest 33% of the data), medium (from 34% to 66% of the data), high (highest 33% of the data). Note ‘nesc’ stands for ‘not enough categories significant’ and denotes those cases where the conditional association is statistically significant in one of the categories of the group. Note ‘neo’ stands for ‘not enough observations’ and denotes those cases where one of the categories of the group lack observations in any of three possible scenarios, i.e. low-, medium- and high-shock intensity.

260
should be noted that the relationships of interest for this analysis (those holding a positive
association) have a relatively wider empirical basis.
A second general observation is about the distribution of the relationships type of behaviour.
The majority of the conditional relationships are of NO- or WT-type, which indicates that
the nature of the relationship between risk-sharing and shocks does not change across
different groups of households. At first sight, this homogenous behaviour found in the
direction of the associations could indicate the role that the source and intensity of the
shocks play in the risk-sharing behaviour, in contrast to household- and community-related
factors. If we compare the distribution of OT-type relationships across household and
community characteristics between the income-smoothing and risk-sharing strategies (Tables
5.16 and 5.18, respectively), the household variables seem to be more relevant among risk-
sharing than among income-smoothing strategies. This could suggest that in the oPt informal
and mostly family-based risk-sharing is more under the control of households than income-
smoothing strategies, whose choice and effectiveness seem to be more affected by occupation-
produced shocks, particularly the policy of closure.
Based on this general approximation to the conditional relationships between risk-sharing
and conflict-produced shocks, the remaining part of the section has been dedicated to
exploring the conditions in which informal risk-sharing arrangements are strengthened when
the intensity of the conflict increases. As mentioned before, the focus of attention is not so
much on the extent of use, which of course varies across groups, but on how the ‘strategy-
shock’ relationship behaves across groups.
Obtaining Assistance from Family and Friends (AFF) vs. Village Violence
According to Table 4.18, with the exception of two cases, the conditional relationships
between AFF and village violence is positive overall and alike across groups. ‘Overall’ is said
because the relationships are non-linear and the focus is on only low- and high-violence-
affected villages. The following graphs illustrate the NO-type (Graph 4.21a and Graph 4.21b)
and the OT-type (Graph 4.21c) conditional associations.

261
Graph 4.21a: Association between the strategy of AFF and violence intensity across households
0
15
30
45
low middle high
village violence intensity
householdstrategy
use( %)
poor
non-poor
small-sized family
big-sized family
Graph 4.21b: Association between the strategy of AFF and violence intensity across households' residence characteristics
0
15
30
45
low middle high
village violence intensity
householdstrategy
use( %)
urban dwellers
camp dwellers
living close to city
living far from city
living in medium-sizedvillageliving in big-sized village
Graph 4.21c: Association between the strategy of AFF and violence intensity across households
0
15
30
45
60
low middle high
village violence intensity
householdstrategy
use(%)
Jenin residents
Rammallah residents
Hebron residents
Tulkarem residents
can cope < 4 months
cannot cope anymore
As it is illustrated in the graphs
(Graph 4.21a and 4.21b), households
in low violence-affected villages rely
on solidarity to a lesser extent than
they do when living in high-violence-
affected villages213. This homogenous
positive behaviour found across
different types of household and
community characteristics is not
observed when the control variables
are related to the governorates of
residence or household vulnerability.
Indeed, as Graph 4.21c shows,
households living in Tulkarem and
those whose coping period is less
than four months decrease their
reliance on family and friends in
high-violence villages. However, the
results of the second-order
associations carried out for these two
cases do not provide any verification
supporting their relevance214.
If we did not find any evidence contradicting the overall positive relationship observed in
Graphs 4.21a and 4.21b, it could be that the reliance on risk-sharing is overall influenced by
the intensity of the shock; and that households and location characteristics, if they may
influence the extent of use, are not able to change the nature of the relationship.

262
Community Risk-sharing vs. Village Closure
Community risk-sharing and village closure are positively related and, as it is shown in Table
4.18, the direction of the relationship is maintained across different groups of the
population. Regardless of the household characteristics (poverty status, family size, land
ownership, head education, head job location and sector of employment) and the
community characteristics (size and location type) households living in high-closed villages
rely on community risk-sharing to a greater extent than those living in low-closed villages215.
The fact that there is no modifier effect and there is an homogenous behaviour across
household groups could be an indication of the relevance of the nature and intensity of the
shock in the risk-sharing behaviour. The following graphs illustrate the WT-type of
associations.
Graph 4.22a: Association between the strategy of community risk-sharing and village closure across households
0
20
40
60
80
100
low middle high
village closure intensity
householdstrategy
use ( %)
can cope > 12 months
big -sized family
high educated heads
family head working national company
family head working foreign company
family head working in a differentgovernorate
Graph 4.22b Association between the strategy of community risk-sharing and village closure across households
0
20
40
60
80
100
low middle high
village closure intensity
householdstrategy
use (%)
can cope 4-12 months
small family
illiterate head
family head goverment employee
family head working same locality
For a matter of clarity, we have
not plotted all groups on one
single graph. Instead, the
categories of each group have
been separated on two graphs
according to the type of negative
relationship. As the graphs show,
the difference in the shape of the
relationship lies in the highly-
closed villages. While the
households in Graph 4.22a
decrease risk-sharing in high-
violence villages, households in
Graph 4.22b increase it.
Second-order associations were calculated to identify, as far as possible and always within the
limits of this type of analysis, the importance that certain factors may play on this ever-
positive association between risk-sharing use and shock intensity. However, none of the types
of households included in Graph 4.22b maintained the increase in risk-sharing in high-closed

263
villages when other conditions were added216. Thus, if they may explain this increase they
may do it in combination with other factors.
Community Risk-sharing vs. Village Violence
Although the relationship between community risk-sharing and village violence is overall
negative (see Table 4.17 and 4.18), there are two cases where it turns positive: households
living in remote villages or in rural areas217. The following graphs illustrate these cases and
include the statistically-significant categories of the control group and the results of the
second-order associations carried out for the cases introducing the modifier effects we are
interested in: households living in rural areas (Graph 4.23a) and far from the city (4.23b)
Graph 4.23a: Association between the strategy of community risk-sharing and violence across household 's village remoteness
0
20
40
60
80
100
low middle high
violence intensity
householdstrategy
use(%)
living close to the cityliving far from the city poor (living far)non-poor (living-far)high educated head (living far)land owners (living far)
Graph 4.23b: Association between the strategy of community risk-sharing and violence across household's residence type
0
20
40
60
80
100
low middle high
violence intensity
householdstrategy
use(%)
urban dwellersrural dwellers non-poor (rural)poor (rural)land owners (rural)
As we can see from both graphs, the
risk-sharing behaviour of households
living in the city or close to the city is
the opposite of those living in rural
and remote areas. In addition,
different types of households behave
similarly when living in rural and
remote villages. Although this needs
further exploration, the homogenous
behaviour observed in rural and
remote villages could indicate that they
are more traditional and cohesive than
urban or urban-dependent areas and
the community linkages are not easily
disrupted when the intensity of the
conflict is high.
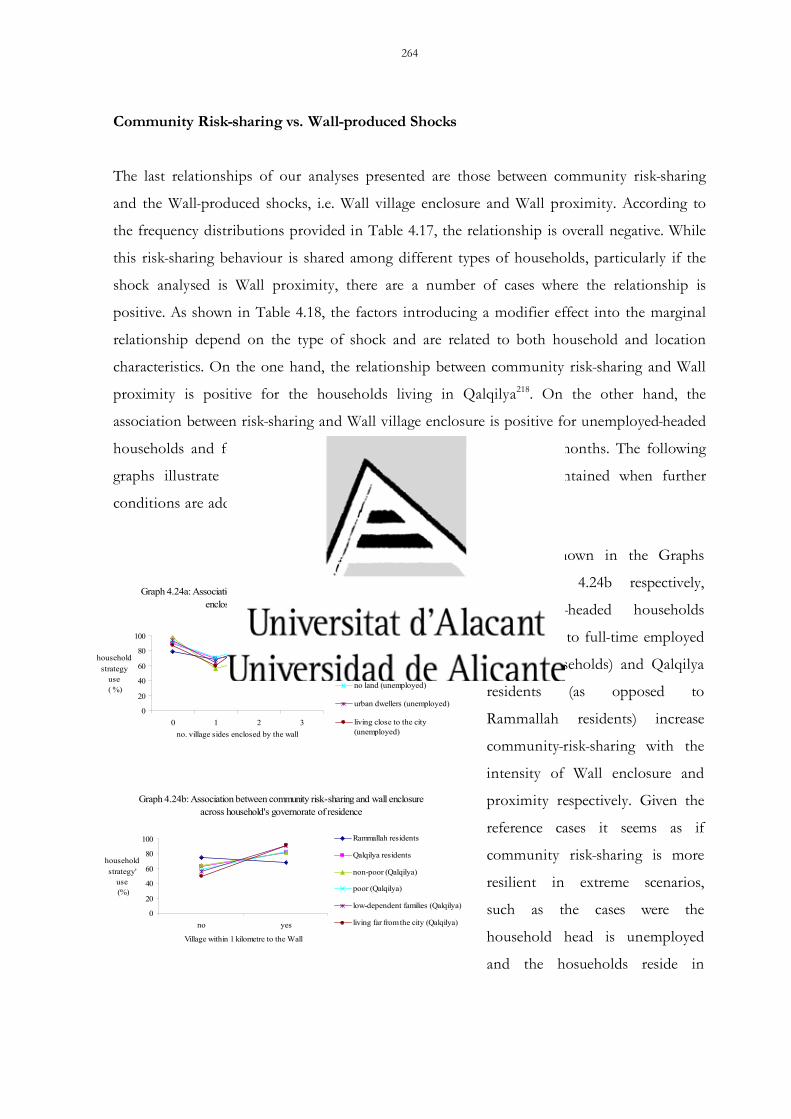
264
Community Risk-sharing vs. Wall-produced Shocks
The last relationships of our analyses presented are those between community risk-sharing
and the Wall-produced shocks, i.e. Wall village enclosure and Wall proximity. According to
the frequency distributions provided in Table 4.17, the relationship is overall negative. While
this risk-sharing behaviour is shared among different types of households, particularly if the
shock analysed is Wall proximity, there are a number of cases where the relationship is
positive. As shown in Table 4.18, the factors introducing a modifier effect into the marginal
relationship depend on the type of shock and are related to both household and location
characteristics. On the one hand, the relationship between community risk-sharing and Wall
proximity is positive for the households living in Qalqilya218. On the other hand, the
association between risk-sharing and Wall village enclosure is positive for unemployed-headed
households and for families whose coping period is less than four months. The following
graphs illustrate those cases, where the positive behaviour is maintained when further
conditions are added219.
Graph 4.24a: Association between the strategy of community risk-sharing and Wall enclosure across household's employment status
0
20
40
60
80
100
0 1 2 3no. village sides enclosed by the wall
householdstrategy
use ( %)
family head employed
family head unemployed
can cope < 4 months (unemployed)
no land (unemployed)
urban dwellers (unemployed)
living close to the city(unemployed)
Graph 4.24b: Association between community risk-sharing and wall enclosure across household's governorate of residence
0
20
40
60
80
100
no yes
Village within 1 kilometre to the Wall
householdstrategy'
use (%)
Rammallah residents
Qalqilya residents
non-poor (Qalqilya)
poor (Qalqilya)
low-dependent families (Qalqilya)
living far from the city (Qalqilya)
As it is shown in the Graphs
4.24a and 4.24b respectively,
unemployed-headed households
(as opposed to full-time employed
headed households) and Qalqilya
residents (as opposed to
Rammallah residents) increase
community-risk-sharing with the
intensity of Wall enclosure and
proximity respectively. Given the
reference cases it seems as if
community risk-sharing is more
resilient in extreme scenarios,
such as the cases were the
household head is unemployed
and the hosueholds reside in

265
Qalqilya.
To conclude, in line with the contradictory processes observed in the behaviour of social
capital in the context of armed conflict, the relationships between the use of risk-sharing
strategies and the intensity of conflict-produced shocks is often non-linear and their nature
changes across strategy and shock-type. The literature on the effects of armed conflict raised
the need to recognise the multiple direct-effects of armed conflict and the different
behaviours on account of social capital. The fact that bonding social capital-based risk-
sharing strategies behave differently towards the risk events could suggest that differences
may exist, not just within the type of social capital but also within the nature of the links
among members of homogenous groups, i.e. depending on whether they are personally-,
socially- or ideologically-based. This seems to be in line with Goodhand’s idea about the need
to shift the focus from forms to more abstract aspects of social capital such as the norms
(Goodhand et al., 2000).
Aware of the complexities in disentangling what is the result of armed conflict and the wider
processes of social change and the fact that the factors influencing social capital are partly a
cause and partly a consequence of armed conflict, this analysis has provided a preliminary
exploitation of the relationship between risk-sharing strategies and conflict-produced shocks.
Taking into account the nature of the risk-sharing strategies, Palestinian society in general,
the wide-spread nature of the conflict and the severity of the impact on people’s livelihoods,
we have assumed that there is a high probability that an increase in conflict-intensity raises
the need to use risk-sharing mechanisms and that a reduction in risk-sharing use is because
of asset exhaustion and destruction. Although this hypothesis needs to be properly tested in
the oPt, we have observed that if bonding social capital is the most resilient, bonding-based
risk-sharing seems to depend on the nature of the group, the source of the shock and the
household and community characteristics. Thus, the most resilient relationships are the
following: AFF in high violence affected villages, community risk-sharing in high-closed
villages, community risk-sharing in rural and remote high-violence areas, community risk-
sharing among unemployed-headed households and Qalqilya residents living in strongly wall-
affected areas.
The overall aim of this chapter was to provide evidence from the oPt to add to the
discussion presented in Chapter 2 on the risk management of conflict-affected households.

266
With this main aim, a descriptive analysis based on primary and secondary data has been
used to approach the characteristics of the occupation-produced shocks, household
perceptions of shocks and risk management strategies as well as the conflict-correlates of risk-
sharing and income-smoothing strategies. The findings of the analysis are in line with the
discussion presented in Chapter 2 on the specificities of risk management in the context of
armed conflict. The endogenous nature of the occupation-produced shocks induces a process
of risk management which is not necessarily the same as that observed in the context of
covariate exogenous shocks such as natural or economic crisis. By portraying risk events as
an integral part of a four-layered sequence composed of causes and short, mid- and long-term
objectives, the Palestinian defined their context of vulnerability, where on the one hand,
household responses are sumud, acts of everyday resistance aiming to map consumption and
income as well as to address the structural and short-term threat to their livelihoods. On the
other hand, within the context of vulnerability, poverty is not an effective variable that
would explain differential risk management across households and communities. In the
context of armed conflict, the nature of the risk events is an important factor in the analysis
of ineffective risk management causation. While this research in the oPt has opened up a
window to explore household responses to conflict-produced shocks, it needs further
examination.
267
CONCLUSIONS: FINDINGS AND IMPLICATIONS
The objective of this research is to contribute to the understanding of risk management in
the context of armed conflict, i.e. to add to the studies of how people deal with the
anticipated and actual losses associated with the uncertain events and outcomes produced by
socio-political risk events such as armed conflicts. The gap in the literature on risk-related
behaviours in armed conflicts has made researchers and development practitioners interested
in risk management, to equate these behaviours with risk-related behaviours of households in
developing countries affected by covariate natural or economic risk events. Since most of the
knowledge on risk management is drawn from the context of natural or economic crises, this
has been used as the standard framework for understanding risk management. This equation
of behaviour across different risk-event sources has been possible due to the portrayal of risk
events as exogenous. Despite one of the central motivating factors in the dynamics of poverty
and risk management being the risk event itself and its characteristics (spread, predictability,
intensity and nature), the risk event has largely remained on the periphery. This thesis gives
risk a central place in the analysis of risk management during armed conflicts. Thus,
motivated by the specific characteristics of the conflict-produced shocks, the hypothesis has
been posed that both the risk management determinants and the households’ responses to
the anticipated and actual loses associated with the risk events and outcomes produced by the
armed conflict are not necessarily the same as those observed in contexts of natural or
economic crises. The exploration of this hypothesis has aided understanding of the
specificities of risk management of conflict-affected households and suggests issues for the
adaptation of the risk management framework developed for the context of low-income
countries to the context of armed conflicts.
In this regard, this study has attempted to unravel household risk management in contexts of
armed conflict by, on the one hand, merging two literatures: the risk management framework
for developing countries and the characteristics of armed conflicts; and on the other, by an
empirical study of risk events and risk management strategies in the oPt. As discussed in the
introduction, the study addresses three main questions. First, this work investigated the
framework that has dominated the understanding of how households deal with the

268
anticipated and actual losses associated with uncertain risk events and outcomes. In order to
understand the extent to which risk events were integrated into the analysis, the risk-related
determinants of risk management were examined. Second, this study discussed how the
characteristics of socio-political risk events such as armed conflict and conflict-produced
shocks unfold into the analysis of risk management and analysed how the recent research on
risk management during armed conflict addresses the subject. Third, taking this into account,
the investigation examined risk management in the oPt, particularly the characteristics of the
occupation-produced shocks, the household response mechanisms as well as the relationship
between the former and the specific strategies of risk-sharing and income-smoothing.
This conclusion summarises the major findings related to general and specific issues of risk
management during armed conflicts, which make it not comparable with the risk-related
behaviours observed in contexts affected by covariate economic and natural risk events. In
addition, the lessons drawn for policy are presented.
General Principles of Risk Management in the Context of Armed Conflict
The general principles of risk management during armed conflict emerge from the analysis
of the risk-management framework for developing countries and the literature on the causes,
effects and characteristics of armed conflicts.
The debate on risk management in developing countries assumes the risk events as exogenous
and therefore focuses on the risk outcomes. Besides the lack of information about the risk
events, which has often hampered its study, the lack of attention within the debate of risk
management is mostly due to the portrayal of shocks as exogenous. This has allowed the risk-
management framework in developing countries to concentrate on the risk outcomes and to
disregard the risk events, whose nature is not addressed by its causes but by its characteristics
of spread, intensity and predictability. Furthermore, assuming risk events as exogenous has
favoured a restrictive view of the risk outcomes; not apportioning any importance to the
causes of the risk events themselves and looking into the outcomes as purely an economic
failure, mostly associated with assets and poverty. In addition, among development
practitioners, the focus on the risk outcomes rather than on the risk events has allowed the

269
emphasis on the ex-post risk management mechanisms over ex-ante risk strategies and uses
the former as predictors of household vulnerability.
The CE approach questions the portrayal of risk events, such as those encountered during
armed conflicts, as exogenous by studying their characteristics in detail. The nature of armed
conflicts is multi-dimensional, setting up complex and multilayered systems in which
different conflicts interact with one another. They have a double-time dimension; while they
produce structural changes embedding the society and therefore the on-going economic,
social and political processes, they are not static but in continuous transformation.
Furthermore, in addition to their multi-dimensional, structural and dynamic natures, armed
conflicts are endogenous. Just as natural disasters, they damage social services, market
networks and agricultural enterprises while at the same time they increase the demand for the
essential services such features normally provide. Unlike natural disasters, however, armed
conflicts systematically and deliberately violate individual and group rights to reproduce and
secure an adequate livelihood, by eroding and destroying the political, economic, social and
environmental systems as well as blocking and manipulating coping strategies.
Taking into account the implications of assuming risk as exogenous and the characteristics
of armed conflict and conflict-produced shocks, risk events need to be placed at the centre of
the analysis of risk management of households living in armed conflicts. If the assumption
of risk events as exogenous has allowed labelling risk in a generic manner, focusing on the
characteristics of spread, intensity and predictability, and putting the risk events on a
secondary level, then assuming them as endogenous has the reverse effect, which is to place
them at the centre of the risk management process. This means that both external and
internal sides of household vulnerability – risk events and household responses - need to be
studied within the context of their causes.
Studying risk events within the context of their causes means that they cannot be integrated
into the analysis just by the characteristics of spread, intensity and predictability. In this
sense, the nature of the risk events needs to be studied beyond the above-mentioned features
and be understood by the specific source (e.g. use of violence, asset looting, movement
restrictions, economic embargoes, etc.) and intrinsic characteristics (endogenous, multi-
dimensional, dynamic and structural factors) taking into account the general objectives of

270
the conflict (ethnic cleansing, economic subjugation, land occupation, etc.). The nature of
the risk is important as it contains information the households care about when managing
the risk - such as the specific causes, the timing, avoidance margin, competing set of
objectives to trade-off, options available, etc. – and also because it influences the breadth of
exposure, the intensity of the impact as well as the capacity and possibilities to deal with its
consequences.
Household risk management strategies need to be addressed by their causes. Unlike in
contexts of exogenous risk events, a categorization of household strategies of conflict-affected
households as indicators of vulnerability cannot be carried out independently of the causes,
as these provide information about the dynamics of power between the strategies of the
conflict-produced shocks and the strategies of the conflict-affected households. The fact that
armed conflicts systematically and deliberately destroy household and community asset bases
and block responses establishes a particular link between the strategies and the risk events,
which may make them inter-dependent and shifts the attention from households (mostly
associated with assets and poverty) to risk-related determinants of risk management. It is
thought that just as household vulnerability in the context of armed conflict, risk
management cannot be determined simply by poverty or a market failure, especially when
these outcomes are advantageous to the powerful.
Specificities of Risk Management in the Context of Armed Conflict
Based on the above-mentioned general principles and the results of recent research on risk
management in the context of armed conflict, as well as this study carried out in the oPt, a
series of issues relating to the risk management strategies of conflict-affected households have
been identified. The issues are structured in accordance with the general implications
previously presented related to the risk events, the strategies and the determinants of risk
management. Since one of the objectives of this research is to participate in the emerging
debate on risk management in the context of armed conflict, the following discussion on the
above-mentioned three aspects embraces reflections on how the recent literature on risk
management in conflict areas addressees the subject.
Addressing the Risk Events during Armed Conflicts

271
Research into risk management in conflict has integrated the risk events via their causes and
not by the variability of change of impact indicators. Although the causes are brought in, the
wide range of nature-related characteristics of the risk events – multi-dimensional,
endogenous, dynamic and structural factors - are not always raised in the analysis and instead
the magnitude of the shock seems to be used as catch-all term describing the features of
conflict. Thus the direct effects of armed conflict have been illustrated either by continuous
or dummy variables illustrating a particular risk event such as deaths, house damage,
detainees, refugees, movement restrictions, etc. Regardless of the type of variable the
magnitude of the shock is mostly used as an indication of the absence or presence of
conflict.
Regarding the multi-dimensional nature of the armed conflicts, there is a tendency within
the analysis of risk management to identify one single direct effect. Although violence is the
instrument of war which is most often illustrated, it is to be noted that other conflict-
produced shocks should also be taken into account. However, the problem lies in the
selection of single factors. Rather than illustrating the effects of the conflict by a set of
variables, conflict is often simplified into one unique factor. The illustration of conflict by
the intensity of violence, is in line with one of the most common ways of categorizing
conflict: its intensity - high, medium or low - depending on the number of casualties. While
this could be enough to explain certain armed conflicts or certain periods of an armed
conflict, it can be a misleading simplification for others such as the Israeli-Palestinian
conflict, which cannot adequately be illustrated by a single factor. During the period 2002-
2004, while the number of casualties dropped significantly compared to the first two years of
the Intifada, the conflict was in the process of intensification. The dimensions of the conflict
gaining relevance during these two years were not so much related to violence but to the
construction of the Wall and the policy of closure, which annexed great amounts of land
and fragmented the West Bank territory into a series of enclaves. If the focus had been solely
on the violence, it would have been not possible to capture the dynamics of land and space,
which characterized the conflict during the years 2002-2004. The relationships between these
types of shocks have been analysed and we did not observe a strong overall correlation,
which suggests the need to illustrate conflict by use of violence, land annexation and
movement restrictions, as any simplification could cause a loss of information. If the object

272
of a study is something occurring within a context of conflict, the conflict itself requires a
deep exploration in order to identify both general and time- and location-specific risk events.
As regards the endogenous nature of the conflict-produced shocks, there is an important
observation to present. The studies on risk management in armed conflict integrate the
endogenous character of conflict-produced shocks via the analysis of uncertainty. Unlike
other risk events, armed conflicts introduce uncertainty in the assets. Thus, while the model
of consumption under liquidity constraints developed by Deaton (1991), the so-called buffer-
stock model, focuses all the uncertainty on income, in the context of conflict, savings (both
liquid and physical) are also affected because of looting and destruction of assets. The
destruction of the assets could be explained by a predatory behaviour and by the assets
symbolism in the conflict. Thus, despite the relevance of the accumulation of livestock as a
substitute for savings and of investment in human capital as facilitator for economic
mobility, livestock was not used as a buffer-stock (Bundervoet, 2007; Verpoorten, 2007) and
human capital was depleted (Deininger, 2003; Shemyakina, 2006) because of the riskiness
attached to the assets. The consequences of risky assets also are illustrated in the income-
smoothing strategies of investing in low-risk activities and adjusting the labour supply.
Regarding the former, asset-rich households do not reduce their allocation of low-risk low
return activities (Bundervoet, 2007). Unlike the postulate of standard risk management
theory, in the context of armed conflicts assets are not risk-free. Therefore they cannot
provide the insurance that the investment in high-risk activities requires. Vis-à-vis the latter,
households concerned with their own security adjust their labour supply by replacing the
highly-risky members (primarily men within a certain age range) with low-profile members
(e.g. women, children and the elderly) (Korf, 2004; UNSCO, 2005).
All the evidence for risk management strategies being explained by asset looting and
destruction shows that the lack of safe assets is not just a characteristic of the poor, as risk
management theory in contexts of developing countries suggests. Instead it is a characteristic
of conflict-affected communities. This could indicate that by acknowledging the endogenous
nature of risk events, the relationship between household risk management and the risk
events strengthens, and the relationship between household risk management and household
poverty weakens. The exposure to risk events is neither generic across households nor poverty
the effective variable that would explain the differential household vulnerability across

273
households and community groups. Furthermore, although the endogenous nature has been
explained by a predatory behaviour of the powerful sectors and by the symbolism attached to
the assets, we think that, in certain contexts, it needs to be portrayed within a wider strategy
of domination and dispossession. This ample approach to the assets riskiness has two major
implications. Firstly, it makes explicit the power dynamics between two belligerent parties
with a context of political vulnerability. Secondly, it leaves room to explain other risk
management behaviour such as those related to the risk-sharing and the adoption of high-
risk activities, which do not seem to be motivated by security concerns but instead by the
lack of rights that characterized their context of vulnerability. As we will see next, Given the
multi-dimensional and often deliberate nature of conflict-produced shocks, it is highly
probable that the motives for a particular strategy are not singular or simple but various and
interlinked.
In an attempt to understand the endogenous rationale of the conflict-produced shocks in the
oPt beyond single events, we have analysed how the different shocks interact. Although
correlation analysis did not show an overall strong relationship between the shocks
illustrating the occupation instruments of use of violence, land annexation and movement
restrictions, there are a couple of associations which are considerably strong. The fact that
the number of obstacles is positively related to low violence but also to the construction of
the Wall and to the settlement structures brings in the question of whether it is a ‘temporary’
security measure or whether it serves geo-political interests. This result is in line with the
arguments presented by many organizations assessing the impact of the policy of closure and
the construction of the Wall. Since the policy of closure has been a continuous Israeli policy
since the 1990s, and is too-far-reaching to be seen as an ad hoc measure linked to Palestinian
security performance, it needs to be understood in the context of the Israeli occupation and
other policies within the oPt, which are aimed at expanding control and transforming the
physical landscape. The policy of closure is, above all, a mean of protecting Israeli settlers
and of securing the Israeli road network within the occupied territory, which, in the long-
term, clashes with the possibility of a continuous Palestinian state within the 1967 borders
and, in the short-term, negatively affects the Palestinian economy and living conditions.
Concerning the Wall, its extent, nature and the enormous costs of its construction, its
location inside the West Bank and the fact that hundreds of thousands of Palestinian will be
placed on its western sides raises serious doubts as to its temporary nature and its exclusively-

274
security-based rationale. On the contrary, it has also led to great Palestinian and international
concern that it will become the final border.
Having said that, it is believed that the endogenous nature of armed conflict needs to be
assessed by taking into account the objectives and inter-relationships of the different shocks
within the overall conflict context and objectives. We think that there would be a
fundamental difference if the shocks of movement restrictions produced by the policy of
closure are thought as a security measure or as a strategy of dispossession and domination. If
it is the latter, it is to be expected to have a more comprehensive and deeper impact on the
affected population but also to elicit a stronger response from that affected population, who
will understandably claim strongly for their lost rights and stolen entitlements.
Another nature-related aspect of the conflict-produced shocks being addressed by the
descriptive analysis of this research was the double-time dimension, where temporal and
structural changes cohabit. Armed conflict, particularly chronic examples, introduce
structural changes in the affected communities. However, conflict is in not static. It
transforms across time and introduces micro-scale and short-term changes into the conflict-
affected households. If the start of the conflict introduces a long-term widespread structural
change of the fundamental structure of the economy and society, unremitting shocks of a
changing nature bring in micro-scale or short-term outputs that can not be disregarded. This
idea clashes with the general concern about whether chronic conflicts can be treated as
shocks. The evidence found indicates that structural and dynamic factors, i.e. both the long-
and short-term impacts of conflict, need to be taken into account. Conflict impregnates
everything with uncertainty. It introduces risk in the assets and generally reduces the
predictability of risk events and outcomes. While the importance of uncertainty has been
raised by the macro-level studies of the links between conflict and development, at the micro
level, as we mentioned above, it has been addressed via the assets riskiness. This research in
the oPt observed that at the micro-level uncertainty goes beyond households assets
impregnating people’s lives by filling them with a sense of lack of control. Although there is
a general consciousness of the state of war, and this makes one expect something bad to
occur, the predictability of the risk event and its magnitude is low. For example, in the oPt,
both the policy of closure and the Wall have a dynamic nature but they aim to introduce
structural changes. Firstly, both introduced structural changes during the years following the

275
onset of the Second Intifada. The introduction of hundreds of movement obstacles -
checkpoints, roadblocks, trenches, earth mounds, etc. - and the construction of the Wall
fragmented the West Bank territories into a series of enclaves, which in turn fragmented the
Palestinian economy and society. Secondly, their introduction impregnates the Palestinian
livelihoods with short-term shocks produced by the continuous changes in the policy of
closure and the Wall, which determine the requirements for holding a permit, the type of
obstacles obstructing the way, the number and types of Wall gates, their opening hours, etc.
The uncertainty introduced is administrative and physical, which accompanied by the
absence of law or its arbitrary application, are inherent characteristics of what appears to be a
sophisticated system of control. The lack of transparency of the occupation measures
produces a sense of arbitrariness and uncertainty, which permeates the tempo of daily life. At
the individual level, it creates a sense of powerlessness; at the family level, it obstructs the
ability of households to chart a purposeful existence for their members; and at the
community and national levels, it prevents systematic planning for the future.
To finish this section, I would like to introduce the results of the interviews carried out
within the framework of this research to explore the households’ perceptions of the risk
events. In spite of the limited scope of the interviews and therefore the need for further
research, they reveal an interesting picture of the occupation-produced shocks in the oPt.
One of the most important outputs of the interviews was the shift from the form and
sources to the objectives of the shocks. The shocks are not perceived simply as isolated and
temporary but rather they are an integral part of a three-factored chain composed of causes
(Israeli occupation), short-term objectives (violence, land annexation, movement restrictions),
middle-term objectives (economic strangulation and social fragmentation) and long-term
objectives (Palestinian self-existence within the 1967 borders). This approach to the risk
events recognises the nature of the risk within the specific context of vulnerability in the oPt.
It includes the endogenous and multi-dimensional nature of the risk events, which
deliberately threaten not only households’ economics but also their overall livelihoods. In
addition, the three-level objectives make explicit the dynamic and chronic nature of the
conflict, which is embedded and hence inherent in the Palestinian livelihoods.
Understanding Risk Management Strategies

276
The analysis of the reviewed studies of risk management in armed conflict highlighted two
important aspects about how household responses were being examined. Firstly, with the
exception of the strategy of using violence or joining armed groups, the strategies reported as
risk management strategies were similar to those adopted during natural or economic crises.
Concerned with this similarity, also found in the context of the oPt, and the possibility that
the strategies had not been identified specifically in the context of armed conflict but rather
taken from contexts of economic and natural crises, interviews were carried out in order to
ask Palestinians about their own perceptions of risk management strategies. The results of
this inquiry showed the narrow view through which risk management strategies had been
studied in the oPt. Thus, on the one hand, a wider range of consumption- and income-based
strategies are reported beyond the limits imposed by PECS (which included 14 strategies,
with a clear bias towards ex-post consumption-based actions), illustrating the adaptation of
livelihoods to the fragmented territory and the building of forms of social and economic
capital provided by the emerging social networks, the booming informal economy and
political parties or humanitarian agencies. Examples of these are the localization of
production, trade and services within the enclosed areas, community solidarity (via religious
groups, civic associations, people committees), withdrawal from the cash economy (use of
bartering and in-kind payments, reliance on family work), etc. On the other hand, from the
interviews a new set of risk management mechanisms emerged such as permanence in the oPt
(as opposed to migration), contributing to the demographic growth by having children,
construction without licences and supporting and joining the armed struggle. These strategies
have more to do with the overall livelihood vulnerability than with the household mapping
of consumption and income. In fact, they are more related to the long- and mid-term
occupation than to short-term objectives as had previously been perceived.
The second observation that was found in both the analysis of risk management in the
different context of armed conflict as well as in the analysis within the framework of this
research, concerns the motivation for the households’ responses. Motivations are important,
yet they are rarely researched. Within the framework of risk management in developing
countries, it is generally assumed that responses are generally taken to deal with the short-
term income-fluctuations and more particularly to deal with the anticipated or actual loss of
income associated with uncertain risk events and outcomes. In the context of armed conflict,
households adopt income-smoothing strategies, risk-sharing and consumption-based actions

277
to manage household economics but also to manage their own security. This fact suggests
that risk management in the context of armed conflict may not be purely an economic
behaviour; instead it responds to the multi-dimensional effects of armed conflict, in which
security-orientated behaviour may be significant, but there might be other reasons related to
the culture, posterity and politics, etc. Managing household economics to secure
consumption is a piece of a jigsaw of other immediate and long-term needs related to the
household’s vulnerability because of asset looting and destruction and, more generally,
because of a strategy of dispossession and domination. In this sense, and from a more
general perspective, the management of household economics and security cannot be
detached from ideological motives, which acknowledge the political struggle, the socio-
political pressures resulting from it and the individual commitments to advance their rights
and entitlements deliberately targeted by the armed conflict. This does not mean that the
economics do not matter, they do matter but they are linked to the political environment. In
addition, this research suggests that the fact that armed conflicts systematically and
deliberately destroy household and community asset bases and block responses establishes a
particular link between the strategies and the risk events making them inter-dependent.
Taking into account the objectives of the occupation-produced shocks, the resilience of the
Palestinian population to the occupation could be measured by the continued strength of the
parallel economy and social unity. Thus, by linking the strategies of both the risk events and
affected-households together, risk management strategies could be understood as everyday
resistance strategies. Using Scott’s definition of ‘everyday forms of resistance’, which states
that there are no unique or predefined forms of resistance as they are influenced by the
intensity and structure of the system of domination (Scott, 1985), the research pursues the
idea that the Palestinians, in acting in a utilitarian and individualistic fashion to marginally
increase their chance of survival against the forces threatening their livelihoods, are also
engaging in their national struggle and therefore carrying out acts of resistance. This
conception of risk management strategies as everyday forms of resistance was confirmed
during the interviews held. Palestinians acknowledged the political struggle in everyday life
by referring to strategies and overall risk management behaviour with the Arabic word,
sumud, which means steadfastness, the impregnable strength, the attachment to the land, the
principle of not abandoning the land.

278
The final question we would like to raise about the households’ risk management strategies
in the context of conflict is related to the structural and dynamic dimensions of conflict-
produced shocks which were observed in the oPt. The duration of the conflict is a key aspect
to look at when analysing the risk management of households in conflict. When shocks are
repeated over time, there is a need to capture the continuous process of change in the
household livelihoods. Disregarding the time and framing the risk events as temporary may
mask the collapse of the livelihood systems and may blind policy-makers as well as
researchers to the need for a radical re-appraisal of the requirements of people’s livelihoods,
which could unlock people from the vicious circle of subsistence and coping. For example,
the focus on the risk outcomes rather than the risk events observed in the risk management
framework for developing countries favoured an emphasis on ex-post risk management,
which disregarded the structural changes occurring during long periods of stress. When there
are fundamental and irreversible changes in local livelihood systems, this focus could lead to
wrong appreciations because it could imply that people do cope and thus that household
insecurity is a transitory phenomenon even if the livelihoods are exhausted. A way to
integrate this double-time dimension observed in conflict-produced shocks could be to use
Davies’s (1996) differentiation between transitory, unusual strategies used to cope with the
short-term dynamics and survive within the prevailing rule system (coping strategies) and
long-term, usual strategies adopted as a result of a structural change in the rule system
(adapting strategies). An example of the strategies of adaptation have been observed in the
oPt, where Palestinians, due to the fragmentation of territory, economy and society, are
forced to adapt their livelihoods since they can not cope any longer with the short-term
shocks and need to alter fundamentally the ways in which they subsist. UNSCO (2005)
reported adaptation patterns of households living in rural communities. An example of this I
the localization of small businesses and services within the enclosed areas; due to the loss of
market access, businesses and services have expanded directly into small towns and rural
communities in order to reach consumers, unable to purchase goods far from their
community. Parallel to this, industrial and agricultural production and marketing have
undergone several geographical and economic re-configurations in order to adapt to closure-
induced fragmentation. Finally, like consumption, production and trade-related adaptation
strategies, the traditional labour patterns have also changed due to the fragmentation. For
instance, there has been an increased role of women in the labour force substituting for male
lost incomes, a shift from wage to self-employment and family labour, a return to agriculture

279
and a continuing reliance on employment and markets in Israel in spite of the risks its access
involves.
However, the coping and adapting behaviours are not distinguishable by their activities and
one needs to know the reasons for particular activities being pursued and their frequency of
use and effectiveness (Davies, 1996). Understanding risk management behaviour by these
aspects is by far a more complex task than simply monitoring whether or not particular
activities are been undertaken and assuming their relation to household vulnerability. It
could be that the lack of information about these other factors is the reason why the
complexities of adaptation have not been grasped.
In more general terms, the findings observed in risk management strategies in the context of
armed conflict indicate that household responses are not the same as those observed in
developing countries in contexts of economic and natural crisis. They are not the same
because the risk events are different and therefore so are the household motives for their
adoption. However, if this research has opened the window, it is also true that much more
research is needed. In order to explore these issues further, any research interested in risk
management strategies should include detailed information on the risk events but also
information on the strategies and the motives. Regarding the strategies, the information
required is the actions per se as well as their frequency of use, efficiency, sustainability,
household dependency along with short and long-term motivations. Similarly, vis-à-vis the
risk events, in order to have a good understanding of the context of vulnerability, it would
be useful to have information on the shocks themselves and their significance within the
overall context of the armed conflict. This information is important in order to assess the
full implications of the conflict-produced shocks for the possibilities for peace, security and
development. Of course, collecting all this data on risk events and strategies is a more
demanding exercise in terms of coding, interpretation and so forth, but it can be certainly
enriching. Since very little is known about the risk management process in the context of
conflict, efforts are needed to explore it from scratch without the lens of risk management in
contexts of covariate exogenous shocks.
The Factors Influencing Risk Management

280
Understanding the factors influencing risk management in the context of armed conflicts
requires a shift from the risk outcomes to the risk events. If the assumption of risk events as
exogenous factors has allowed taking away the causality from the risk events and defining the
risk management determinants purely through economic factors (mostly associated with
poverty and assets), then acknowledging the endogenous nature of factors entails
apportioning some part of the cause to the risk events themselves and using them as effective
variables that would explain the differential household vulnerability seen across households
and community groups. Focusing on the risk events means that the (political) causes should
be emphasized over the (economic) symptoms. This does not mean that the symptoms do
not matter, they do, but they can not be detached from the causes; poverty and household
assets cannot be presented as the ultimate explanatory factors of risk management in the
context of armed conflict.
The linkage of causes and symptoms is one of the consequences of the political vulnerability
approach as defined by CE. Accordingly, when looking into the nature-related characteristics
of the conflict-produced shocks, a household’s vulnerability cannot be attributed to market
or poverty failure if it is deliberately produced (directly or indirectly) and if its continuation
is advantageous to the powerful. In these sorts of situation, the households’ vulnerability is
related to the political strategy of dispossession and domination. The evidence observed for
asset riskiness influencing the choice of risk management strategies and subsequently the
households’ motivation being beyond managing households’ economics confirmed the
relevance of linking the economic symptoms to the political causes when looking at the
factors influencing risk management in a context of political vulnerability.
Although the debate needs further exploration, the study of the strategy of the use of
violence in the oPt and particularly the analysis of its determinants has provided a good
laboratory to understand the links between the different factors influencing household
responses in armed conflicts and the implications the neglect of these links may have on
policy-making. Unlike the dominant discourse of Krueger and Maleč ková (2003), which
analysed the probability of becoming a suicide bomber by assuming that the Palestinian
militants depend solely on quantifiable economic indicators such as poverty and education,
Saleh (2004b) explained Palestinian suicide attacks through the strategies of the occupation,
proxied by the IDF use of violence and IPC economic strangulation. According to Saleh

281
(2004b), the detachment of economic factors from ideological motives, as implied by Kruger
and Male čková (2003), neglects the nature of the political struggle and fails to account for
the socio-political pressures resulting from it, such as anger, frustration and alienation as well
as the desire for retaliation and revenge, on the individual’s commitment to nationalist
aspirations of freedom and independence. This detachment has made possible the current
international policy against terrorism, which disregards tackling poverty and centres on the
use of military violence to quell insurgent violence. However, as Saleh (2004b) demonstrates
in the context of the oPt, economics do matter and are linked to the political environment
and frustration. As it has been argued in this research, the fact that the economic depression,
with its unprecedented levels of poverty and unemployment in the oPt, can be greatly
explained by the Israel Policy of Closure. This requires poverty to be treated not only as an
economic but a political problem. In addition, Saleh’s findings show that Palestinian suicide
attacks – shootings and bombings - will only be reduced if there is a change in the Israeli
Closure Policy and IDF military operations which improve the economic, political and social
conditions in the oPt. Since Palestinian unemployment or overall poverty is a result of the
political dispute, then it should be pivotal in motivating attacks against Israel.
In order to illustrate the importance of the occupation strategies on risk management, the
relationship between the intensity of the conflict-produced shocks (IDF use of violence, the
Israeli Policy of closure and the construction of the Wall) and the use of risk management
strategies (income-smoothing and risk-sharing) has been analysed across different groups of
the population.
Groups were set to illustrate household asset base and location characteristics. Since the
conflict-produced shocks were collected at the village level, and while the household asset
base proxies the household-related determinants of income-smoothing and risk-sharing, the
village’s location illustrates partially the geography of conflict. Conflict-produced shocks can
target people based on their welfare, ethnic origin, location , etc. In the case of the oPt, where
the issue of contention is related to land and more generally space, as Hanafi (2008) argued,
residence location is particularly relevant in determining conflict geography. As the evidence
of this research has shown, there are great geographical differences in the impact of Israeli
occupation across areas. The closer the residence is to the Israeli structures in the West Bank
(settlements, settlement roads, the Wall), the greater is the magnitude of the conflict-

282
produced shocks. Taking into account the type of location, the refugee camps and
governorate capitals are particularly targeted by the IDF use of violence. The micro-analysis
observed further geographical differences across types of location. Specifically, rural areas and
remote villages are more vulnerable to closure than urban areas and villages with a city
nearby because they are highly dependent on their longer links to the cities for jobs, markets,
production and social services (UNSCO, 2005).
Regarding the relationship between income-smoothing strategies and shocks, we have
observed that despite the importance of the strategies of farming and adjusting household
labour supply during covariate and long crises, in the context of armed conflicts such as the
oPt, their reliance seems to be determined by the nature of the shock. Thus, while the use of
income-smoothing strategies decreases (sometimes in a non-linear manner) with the intensity
of violence and Wall-related shocks, it increases with the intensity of village closure.
Assuming that the intensity of the shocks increases the need to use income-smoothing
strategies, then a reduction of income-smoothing can be interpreted as either the household’s
lack of means or access to the means is blocked220. The difference observed across the shock
types seems to back up the blockage hypothesis. It is as if the violence- and the Wall-related
shocks exercise bigger pressure on income-smoothing strategies than the closure-related
shocks. In fact, the space of movement and hence the possibility for a livelihood is reduced
to a greater extent by violence and Wall enclosure than by the village closure. While violence
confines the people to their homes and the Wall to their villages, village closure restricts
household movements between the village and the natural centre, which has been assumed to
be the closest village or city with a hospital. In order to test for the lack of means hypothesis,
the negative relationships were examined across households. We observed that households,
regardless of their comparative advantages (skills and labour endowments or capital access),
living in high-violence and Wall-enclosed villages rely on income-smoothing strategies to a
lesser extent than those living in less violent and Wall-affected locations. This seems to
suggest that access to agricultural land and labour markets in high conflict-affected villages is
not determined by household assets as much as by IDF violence and Wall-related enclosure,
which deliberately block the access and restrict movement. Given the informal nature of the
income-smoothing strategies we are looking at, the evidence indicates that the reduction in
options for a livelihood is comprehensive; conflicts do not just reduce the options of relying
283
on the markets as some authors argue (Brück, 2004), but also those depending on the
informal economy and subsistence forms of living. In addition to the relevance of the nature
of the shock in shaping risk management in high conflict-affected areas, advanced analysis is
needed to examine the little space to manoeuvre that violence and the Wall seem to leave to
household- and community-related factors to influence the reliance of farming and adjusting
household labour supply. If the extent of use changes across household and community
characteristics, the nature of the relationship ‘strategy-shock’ does not.
Other examples studied, where the use of income-smoothing decreases with shock, are those
found amongst households living in highly-closed remote villages and refugee camps. Thus,
although the marginal relationship was positive it turned negative when it was conditioned
to living in refugee camps or in remote villages. The low reliance on income smoothing
observed in these two types of community is because of their vulnerability to the policy of
closure. Refugee camps and remote villages are highly dependent to the city for jobs markets,
productive and social services. Thus, as soon as their access to the city is blocked by the
policy of closure, the options for a livelihood fall and subsequently the reliance on farming
and adjusting labour supply. The fact that this is an homogenous behaviour among camp
dwellers and residents of remote communities despite their welfare differences could be an
indication of the relevance of community over household characteristics. It is to be noted
that the majority of the factors introducing the modifier effects were related to the location
of the households rather than their comparative advantages in terms of skills, welfare or
labour endowments. Future analysis is encouraged to assess overall the determinants of
income-smoothing strategies, particularly the role that household and community
characteristics play in terms of exposure and welfare in high conflict-affected villages. More
specifically and based on the findings of this research, there is a need to assess whether the
community power to override the nature of the relationship between income-smoothing
conflict-produced shocks is because of the public infrastructure or a direct effect of the
armed conflict. In addition and most importantly, it is crucial to find out whether it is
possible or, indeed, appropriate to detach the community living conditions from the
consequences of the occupation or more specifically the Israeli-Palestinian conflict.
The second strategy we have examined in relation to the occupation instruments is that of
risk-sharing. It has been looked at through the specific strategies of obtaining assistance from

284
family and friends and community risk-sharing, the latter including informal borrowing
among in-laws and neighbours and the state subsidizing the payment of utility bills. In line
with the contradictory and complex processes affecting social capital during conflict, we
observed that the Palestinian reliance on risk-sharing across shock intensity changes across
strategies and shock type. The lack of homogenous behaviour across shocks and strategy
types highlights the need to take into account the multiple direct effects of armed conflict
and the nature of the group on which the risk-sharing arrangements are based. Within the
different relationships, the cases, where risk-sharing seems to be more resilient, were studied
across different groups of the population. Taking into account the wide-spread nature of the
conflict and the severe impact on household welfare, we have assumed that an increase in
conflict intensity increases the need to use risk-sharing mechanisms as we would assume the
same for any other risk-management strategy. If we further take into account the nature of
the risk-sharing strategies mostly related to family, friends and community and the structure
of the family-based Palestinian households constituting a strong network of social and
economic obligations and privileges, a reduction in the extent of use of risk-sharing actions
may be due to the effects of conflict on civil society and social capital. That is, households
reduce the use of risk-sharing because of asset exhaustion and destruction. Asset exhaustion
and looting results in an overall lack of resources within families and communities, which
undermines exchange networks. Territorial fragmentation splits up families and
communities, taking individuals away from the context in which they can draw on reciprocal
networks. The social fabric is destroyed by the use of violence, which creates a vacuum of
mistrust and may turn the community against itself.
The results of the analysis of risk-sharing seem to indicate that in the oPt the resilience of
risk-sharing does not depend only on the type of social capital. This is so whether it is
bonding or bridging, as the general evidence about risk-sharing in armed conflict has
suggested. Instead, other factors appear relevant, such as the nature of the group (e.g. family,
community or nationality-based, etc.), which sets up membership restrictions and the norms
of reciprocity and trust; the source of the shock (e.g. IDF violence, village closure, Wall-
related closure and land annexation, etc.) influencing the creation and destruction of social
capital; as well as the household and community characteristics shaping both the strength of
social capital and exposure to the conflict. However, one needs to be cautious about these
results because the empirical basis was scarce. Generally speaking, in the oPt, the
285
manifestations of social capital in the form of risk-sharing is a subject that requires more
attention. Despite the general belief that the tight-knit nature of the Palestinian social
structure and informal safety nets are some of the factors that prevented the collapse of the
economy during the four years following the onset of the Intifada (UNCTAD, 2005), we did
not find any evidence of this at the micro-level. It would be interesting to explore how
occupation instruments interact with social capital and how this interaction unfolds into the
behaviour of risk-sharing arrangements.
In spite of the limitations of the conditional association analysis, the findings seem to
indicate that the relationship between strategies and the shocks strengthens while the
relationship between strategies and household poverty weakens. In highly conflict-affected
villages, poverty is not anymore an effective variable that would explain the differential
household vulnerability across households and community groups.
Supporting Risk Managements Strategies in the oPt
This final section sets out some guidelines drawn from the research and outlines a series of
measures, approaches and policy-oriented frameworks that can be used by both Palestinian
actors and their donor partners in order to reframe the latter’s engagement in reducing
household vulnerability by supporting risk management strategies.
The core suggestion emerges from analysis of donor involvement in the Palestinian arena. In
the oPt, there is a striking disconnection between the diplomatic policies of international
actors, foreign aid policies and programmes and the facts on the ground221 (Keating et al.,
2005). One illustration of this is the donor’s lack of recognition of the process of territorial
fragmentation as a result of the Israeli policy of closure, the expansion of the settlements
structures and the Wall (Le More, 2005). Despite the fact that the occupation instruments,
particularly movement restrictions and the Wall, are widely acknowledged to be the primary
causes of the rising poverty rates in the oPt, they are left out of the picture and the aid
programmes and policies mask the collapse of livelihoods and lock people into a vicious
circle of subsistence systems by defining household vulnerability as an economic failure222.

286
We believe that international donor institutions and countries need to radically re-assess the
requirements for effective livelihoods in the oPt, taking into account the increasing
territorial, socio-economic and political fragmentation, which has been intensified with the
onset of the Al-Aqsa Intifada. Fragmentation at all levels can be seen mainly as a result of
policies justified by Israel on security grounds, notably continuing military occupation, the
closure regime imposed on the West Bank and Gaza Strip since the early 1990s and the
creation of the physical ‘facts on the ground’ on Palestinian land through measures such as
the expansion of settlements, the construction of the bypass roads and other infrastructure,
and the building of the Wall from 2002 onwards. This, in turn, is to be understood as a
continuation of Israeli policy of territorial expansion into the oPt, which began in 1967 and
continues unabated to this day. Thus, the funding policy must be reframed according to this
reality if their objectives of contributing to the peace process and improving the living
conditions of the population are to be achieved. If the two-state solution remains the leading
option within the peace process223, at this stage, only international effort and sustained
pressure on Israel to end its 46-year of occupation and retreat into its pre-1967 borders could
save it.
Thus, within an overall strategy of advocacy, which gives more weight to the causes than to
the symptoms of the conflict, we propose micro-level interventions to reduce household
vulnerability via the support of the risk management strategies, which strengthen
Palestinians’ everyday sumud to resist any policy that dispossess them from their land and
therefore have the potential to transform the current status quo and contribute to a lasting
reduction in vulnerability. In order to identify this type of risk management strategy, a short
study needs to be undertaken, which, taking into account the issues discussed in this research
about the risk management in the context of armed conflict, creates a ‘map’ of household
risk management strategies and how they operate within the Palestinian vulnerability context.
This exercise would illustrate a range of possibilities for reducing household vulnerability
without perpetuating the fragmentation. Out of the different risk management mechanisms
that have been studied in detail within the framework of this research, there are two of them
- risk-sharing and agriculture – that seem to be particularly relevant in addressing the social
fragmentation and the Israeli territorial expansion respectively.

287
Risk-sharing strategies are an important source of support in the oPt. While the assessments
of risk-sharing has put an emphasis on family-, friend- and charity (mostly NGOs)-based-
solidarity, there is a need to expand risk sharing beyond this and bring in other factors of
risk-sharing such as professional organizations, trade unions, civil groups, municipal and
local societies, community associations and people’s committees. Given the complex and
contradictory process on which conflict impacts on social capital, which is understood to be
the basis of the risk-sharing and social cohesion, there is a need to know how social capital
fits within people’s livelihood strategies but also within the wider politico-economic context
in order to identify the situations in which social capital can be strengthened as well as
undermined. For example, as Nablusi (2005) argues, there is a need to legitimize and support
the grassroots associational life, which has been neglected in favour of the donor-driven
creation of a civil society through the support of (unelected) NGOs, whose power base and
prestige has been supported through heavy funding. Supporting risk-sharing via
representative associational and often political structures is not popular with the donor
community. Yet they at least have the merit of being legitimate grassroots structures
committed to the Palestinian cause of self-determination.
Agriculture, particularly livestock breeding and irrigated farming, which was abandoned
twenty years ago by unqualified work in Israel, has now become a resilient buffer for a wide
range of households against closure. While small-scale agriculture relies mostly on family
labour, large-scale farmers who cannot afford to pay waged workers any longer are selling or
renting out their land or engaging in sharecropping arrangements with landless Palestinians.
In spite of its importance, agriculture has largely been ignored by donors, who consider it as
a sensitive area as it is bound-up in issues of both land use and water consumption (much
agricultural land falling within Area C). This is exactly why it is thought that the Palestinian
return to agriculture needs to be supported: in order to change the power dynamics, which
have governed the sectoral allocation of aid, notably those sectors which touch upon the
contentious issues of land, territory and control over resources such as transportation,
agriculture and energy, and have underwritten the process of Palestinian fragmentation.

288
BIBLIOGRAPHY Ajluni, S., 2003. ‘The Palestinian Economy and the Second Intifada’. Journal of Palestinian Studies, 32 (3). Alderman, H., 1996. ‘Saving and Economic Shocks in Rural Pakistan’. Journal of Development Economics, 51 (2): 343-366. Alderman, H. & Paxson, C., 1992. ‘Do the Poor Insure? A Synthesis of the Literature of Risk and Consumption in Developing Countries’. Discussion Paper 164. University of Princeton. Al Haq, 2005. Waiting for Justice: Al-Haq: 25 years Defending Human Rights (1979-2004). Annual Report 2004. Rammallah: Al-Haq. Al Sarraj, I., 2003. ‘On Violence and Resistance’. Palestinian-Israeli Journal of Politics, Economics and Culture, 10 (1): 36-40. Alonso, J.A.,2005. ‘El ahorro como variable clave de la dimensión económica’. Cuadernos de información económica 188: 63-69. Alonso, J.A. ed., 2007. Cooperación en países de renta media. Madrid: Editorial Complutense. Álvarez-Ossorio, I., 1999. El Proceso de Paz en Oriente Medio. Historia de un Desencuentro. Madrid: Agencia Española de Cooperación Internacional. Álvarez -Ossorio, I., 2003. ‘El Colapso de Oslo: Negociaciones o Intifada’. In I. Álvarez-Ossorio, ed. Informe sobre el Conflicto de Palestina: De los Acuerdos de Oslo a la Hoja de Ruta. Guadarrama (Madrid): Ediciones del Oriente Medio y del Mediterráneo Alwang, J. et al., 2001. ‘Vulnerability: A View from Different Disciplines’. Social Protection Discussion Paper Series 0115. Washington DC: World Bank Amoore, L., 2005. The Global Resistance Reader. London: Routledge Anderson, M., 1999. Do not Harm. How Aid can Support Peace or War. London: Lyne Rienner Publishers Inc. Andoni, G., 2007. ‘A Comparative Study of Intifada 1987 and Intifada 2000’. In R. Carey, ed. The New Intifada: Resisting Israel’s Apartheid. London: Verso. Andre, C. & Platteau, J.P., 1998. ‘Land Relations under Unbearable Stress: Rwanda Caught in the Malthusian Trap'. Journal of Economic Behaviour and Organization, 34, 1-47 Antle, J., 1987. ‘Econometric Estimation of Producer’s Risk Attitudes’, American Journal of Agricultural Economics, 69 (3): 509-522. Aranki, T.N., 2004. ‘The Effect of Israeli Closure Policy on Wage Earnings in the West Bank and Gaza Strip’. Working Papers Series 4. Örebro University. Astrup, C. & Dessus, S., 2001. ‘The Geography of Poverty in the Palestinian Territories’. ERF Working Paper Series 120. Egypt: Economic Research Forum

289
Baulch, B. & Hoddinott, J. eds., 2000. Economic Mobility and Poverty Dynamics in Developing Countries. London: Frank Cass. Bebbington, A., 1999. ‘Capital and Capabilities: A Framework for Analyzing Peasant Viability, Rural Livelihoods and Poverty’. World Development, 27 (3): 2021-2044. Beck, U., 1998. La Sociedad del Riego. Barcelona: Paidós. Bell, C., 1988. ‘Credit Markets and Interlinked Transactions’. In H. Chenery & T.N. Srinivasan, eds. Handbook of Development Economics Vol. 1. Amsterdam: North Holland. Berrebi, C., 2003. ‘Evidence about the Link between Education, Poverty and Terrorism among Palestinians’. Princeton University. Mimeo. Berstein, P., 1996. Against the God: The Remarkable Story of Risk. New York: John Wiley & Sons. Besley, T., 1995. ‘Non-market Institutions for Credit and Risk Sharing in Low-income Countries’. Journal of Economic Perspectives, 9 (3): 115-128. Bhabha, H.K., 1984. ‘Of Mimicry and Man: The Ambivalence of Colonial Discourse’. October 28: 225-133. Bhalla, S., 1980. ‘The Measurement of Permanent Income and its Application to Savings Behavior’. Journal of Political Economy, 88 (4): 722-44. Bigman, D. & Fofack, V., 2000. Geographical Targeting for Poverty Alleviation. Washington DC: The World Bank. Binswanger, H., 1980. ‘Attitudes towards Risk: Experimental Measurement in Rural India’. American Journal of Agricultural Economics, 62 (3): 395-407 Bishara, A., 2001. ‘The Palestinians of Israel’. In R. Carey, ed. The New Intifada: Resisting the Israeli Apartheid. London: Verso. Bishara, A., 2005. ‘Notes on Violence’. Al-Ahram Weekly Opinion, 729. Bornstein, A., 2001. ‘Border Enforcement in Everyday Life: Palestinian Day Labourers and Entrepreneurs Crossing the Green Line’. Human Organizations, 60 (3): 298-307. Bradham, P. & Udry, C., 1999. Development Microeconomics. New York: Oxford University Press. Brown, A., 2004. ‘The Immobile Mass: Movement Restrictions in the West Bank’. Social and Legal Studies, 13 (4): 501-521. Brück, T., 2004. ‘Coping Strategies in Post-War Rural Mozambique’. DIW Discussion Paper 384. Berlin: Deutsches Institut für Wirtschaftsforschung (DIW). Brynen, R., 2000. A Very Political Economy: Peacebuilding and Foreign Aid in the West Bank and Gaza. Washington DC: United States Institute of Peace Press. Bundervoet, T., 2007. ‘Livestock, Activity Choice and Conflict: Evidence from Burundi’. HiCN Working Paper 24. Households in Conflict Network.

290
Carbonier, G., 1998. ‘Conflict, Postwar Rebuilding and the Economy’. War-Torn Societies Project Occasional Paper 2. Geneva: United Nations Research Institute for Social Development. Carrol, C.D., 1997. ‘Buffer-Stock Saving and the Life Cycle/Permanent Income Hypothesis'. Quarterly Journal of Economics, 112 (1): 1-56. Carter, M., 1991. ‘Risk, Reciprocity and Conditional Self-Insurance in the Sahel: Measurement and Implications for the Trajectory of Agricultural Development in West Africa’. Department of Agricultural Economics Staff Paper 333. University of Wisconsin. Cashdan, E., 1985. ‘Coping with Risk: Reciprocity among the Basarwa of Northern Botswana’. Man New Series, 20 (3): 454-474. Chambers, R., 1989. ‘Vulnerability, Coping and Policy’. IDS Bulletin, 20 (2): 1-7. Brighton: Institute of Development Studies. Cheru, F., 1997. ‘The Silent Revolution and the Weapons of the Weak’. In L. Amoore, ed., 2005. The Global Resistance Reader. London: Routledge. Chesin, A., et al., 1999. Separate and Unequal: The Inside Story of Israeli Rule in East Jerusalem. Cambridge: Harvard University Press. CIA, 2007. World Fact Book. Issues for West Bank, Lebanon, Jordan, Egypt and Syria. Washington DC: Central Intelligence Agency. Cliffe, L. & Rock, J., 1997. ‘Identity Livelihoods and Post Conflict Recovery in Ethiopia and Eritrea’. In B. Frederickson & F. Wilson, eds. Livelihood, Identity and Instability. Copenhagen: Centre for Development Research. Cliffe, L. & Luckham, R., 1999. ‘Complex Political Emergencies and the State: Failure and the Fate of the State’. Third Quarterly Report, 20 (1): 27-50. Cliffe, L. & Luckham, R. 2000. ‘What Happens to the State in Conflict? Political Analysis as a Tool for Planning Humanitarian Assistance’. Disasters, 24 (4): 291-313. Coate, S. & Ravallion, M., 1993. ‘Reciprocity without Commitment: Characterization and Performance of Informal Insurance Arrangements’. Journal of Development Economics, 40 (1): 1-24. Colleta, N.J. & Cullen, M.L., 2000. Violent Conflict and the Social Transformation of Social Capital. Lessons from Cambodia, Rwanda, Guatemala, and Somalia. Washington DC: The World Bank. Collier, P. & Hoeffler, A., 1998. ‘On Economic Causes of Civil War’. Oxford Economic Papers, 50: 563-573. Collier, P., 2000a. ‘Doing Well out of War. An Economic Perspective’. In M. Berdal & D. Malone, eds. Greed and Grievance. Economic Agendas in Civil Wars. London: Lynne Rienner. Collier, P., 2000b. ‘Economic Causes of Civil Conflict and their Implications for Policy’. Washington DC: World Bank. Cook, S., 1966. ‘The Obsolete ‘Anti-Market’ Mentality: A Critique of Substantive Approach to Economic Anthropology’. American Anthropologist, 68 (2): 323-345.

291
Corbett, J., 1989. ‘Famine and Household Coping Strategies’. World Development, 10 (9): 1099-1112. Cramer, C. 1997. ‘Civil War is not a Stupid Thing: Exploring Growth, Distribution and Conflict Linkages’. SOAS Working Paper 73. School of Oriental and Asian Studies. University of London. Cramer, D. 1998. Fundamental Statistics for Social Research. London: Routledge. Daines, V. & Seddon, D., 1991. ‘Survival Struggles, Protest and Resistance: Women’s Responses to Austerity and Structural Adjustment’. Gender Analysis in Development Subseries, 4. School of Development Studies. University of East Anglia. Dalton, G., 1961. ‘Economic Theory and Primitive Society’. American Anthropologist, 63 (1): 1-25. Davies, S., 1996. Adaptable Livelihoods. London: McMillan Press. Deaton, A., 1991. ‘Saving and Liquidity Constraints’. Econometrica, 59 (5): 1221-1248. Deaton, A., 1992. Understanding Consumption. Oxford: Clarendon Press. Deaton, A., 1997. The Analysis of Household Surveys: A Microeconomic Approach to Development Policy. Baltimore: John Hopkins University Press. Deininger, K., 2003. ‘Causes and Consequences of Civil Strife: Micro-Level Evidence from Uganda’. Oxford Economic Papers, 55: 579-606. Deng, L., 2004. Managing Risk and Uncertainty: A Comparative Study of Households Assets Management in Complex Emergency. Ph.D. Institute of Development Studies. University of Sussex. Dercon, S., 1996. ‘Risk, Crop Choice and Savings: Evidence from Tanzania’. Economic Development and Cultural Change, 44 (3): 485-514. Dercon, S., 2000. ‘Income Risk, Coping Strategies and Safety Nets’. Background paper for the World Bank World Development Report 2000/2001. Dercon, S., 1998. ‘Wealth, Risk and Activity Choice: Cattle in Western Tanzania’. Journal of Development Economics, 55 (1): 1-42. Dercon, S., 2005. ‘Vulnerability: a Micro Perspective’. QEH Working Papers 149. Queen Elizabeth House, University of Oxford. Dercon, S. & Krishnan, P., 1996. ‘Income portfolios in Rural Ethiopia and Tanzania: Choices and Constraints’. Journal of Development Studies, 32 (6): 850-875. Dercon, S. & Krishnan, P., 2000a. ‘Vulnerability, Seasonality and Poverty in Ethiopia’. Journal of Development Studies, 36 (6): 25-53. Dercon, S. & Krishnan, P., 2000b. ‘In Sickness and in Health: Risk-sharing within Households in Ethiopia’. Journal of Political Economy, 108 (4): 688-727. De Soysa, I., 2000. ‘The Resource Curse: Are Civil Wars Driven by Rapacity or Paucity?’ In M. Berdal, M. & D. Malone, eds. Greed and Grievances: Economic Agendas in Civil Wars. London: Lyne Rienner Publishers Inc.

292
Dessalegn, R., 1991. Famine and Survival Strategies: A Case Study from Northern Ethiopia. Uppsala: Nordiska Afrikainstitutet. Devereux, S., 1992. Household Responses to Food Insecurity in North-eastern Ghana. Ph.D. University of Oxford. Devereux, S., 1993. ‘Goats before Ploughs: Dilemmas of Household Response Sequencing During Food Shortages’. IDS Bulletin, 24 (4): 52-59. Brighton: Institute of Development Studies. Devereux, S., 1999. ‘Making Less Last Longer: Informal Safety Nets in Malawi’. IDS Discussion Paper 373. Brighton: Institute of Development Studies. Devereux, S., 2000. ‘Famine in the Twentieth Century’. IDS Working Paper 105. Brighton: Institute of Development Studies. Devereux, S., 2001. ‘Sen’s Entitlement Approach: Critiques and Counter-critiques’. Oxford Development Studies, 29 (3): 245-263. De Waal, A., 1989. Famine that Kills. Oxford: Clarendon Press. De Waal, A., 1990. ‘A Re-assessment of Entitlement Theory in the Light of the Recent Famines in Africa’. Development and Change, 21 (3): 469-490. De Waal, A., 1997. Famine Crimes: Politics and the Disaster Relief in Africa. Oxford: James Currey. Drèze, J. and Sen, A., 1989. Hunger and Political Action. Oxford: Clarendon Press. Duffield, M., 1991. ‘War and Famine in Africa’. Oxfam Research Paper 5. Oxford: Oxfam. Duffield, M., 1994. ‘The Political Economy of Internal War’. In J. Macrae & A. Ziwi, eds. War and Hunger: Rethinking International Responses to Complex Emergencies. London: Zed Press. Duffield, M., 2001. Global Governance and the New Wars: The Merging of Development with Security. London: Zed Books. Ellis, F., 2000. Rural Livelihoods and Diversity in Developing Countries. New York: Oxford University Press. Erickson, U., 2001. ‘Recent Developments in the Palestinian Economy’. In R.A. Vadivieso et al., eds. West Bank and Gaza: Economic Performance, Prospects and Policies. Washington DC: International Monetary Fund (IMF). Escudero Alday, R., 2006. Los Derechos a la Sombra del Muro: Un Castigo más para el Pueblo Palestino. Madrid: Los Libros de la Catarata. Esposito, M.K., 2005. ‘The Al-Aqsa Intifada: Military Operations, Suicide Attacks, Assassinations, and Losses in the First Four Years’. Journal of Palestinian Studies, 34 (2): 85-122. Etkes, D. & Ofran, H., 2005. Breaking the Law in the West Bank: Israeli Settlement Building on Private Palestinian Property. Jerusalem: PeaceNow. Fafchamps, M., 1992. ‘Solidarity Networks in Pre-industrial Societies: Rational Peasants with a Moral Economy’. Economic Development and Cultural Change, 41 (1): 147-174.
293
Fafchamps, M., et al., 1998. ‘Drought and Saving in West Africa: Are Livestock a Buffer Stock?’ Journal of Development Economics, 55: 273-305. FAO, 2003. Food Security Assessment: West Bank and Gaza Strip. Jerusalem: Food Agriculture Organization of the United Nations. FAO, 2006. Comprehensive Food Security and Vulnerability Analysis (CFSVA) in the West Bank and Gaza Strip. Jerusalem: Food Agriculture Organization of the United Nations. Fearon, J. & Laitin, D., 2003. ‘Ethnicity, Insurgency and Civil War’. American Political Science Review, 97 (1): 95-70. Fine, B. 1999. ‘The Developmental State Is Dead - Long Live Social Capital?’. Development and Change, 30 (1): 1-19. Foucault, M., 1980. Power/Knowledge: Selected Interviews and Other Writings 1972-1977. New York: Pantheon Books García-Jiménez, A., 2008. ‘La otra intifada: mantener la identidad palestina en Jerusalem’. Pueblos, Mayo. Paz y Dignidad. Gittel, R. & Vidal, A., 1998. Community Organizing: Building Social Capital as a Development Strategy. Newbury Park (California): Sage Publications. Goodhand, J., 2001. ‘Violent Conflict, Poverty and Chronic Conflict’. CPRC Working Paper 6. Chronic Poverty Research Centre. Goodhand, J. & Hulme, D., 1999. ‘From Wars to Complex Political Emergencies: Understanding Conflict and Peace-building in the New World Disorder’. Third World Quarterly, 20 (1): 13-26. Goodhand et al., 2000. ‘Social Capital and the Political Economy of Violence: A Case Study of Sri Lanka’. Disasters, 24 (4): 390-406. Gramsci, A., 1971. Selections from the Prison Notebook. London: Lawrence and Wishart. Grimard, F., 1997. ‘Household Consumption Smoothing Through Ethnic Ties: Evidence from Cote d’Ivoire’. Journal of Development Economics, 53 (2): 391-422. Guediri, K. & Dallasheh, K. 2004. Cleansing and Apartheid in Jerusalem: An Alternative Guide to Jerusalem. Jerusalem: Alternative Information Center (AIC). Guichaoua, Y., 2007. ‘Who Joins Ethnic Militias? A Survey of the Oudua People’s Congress in the South Western Nigeria’. HiCN Working Paper 26. Households in Conflict Network. Gupta, D., 1990. The Economics of Political Violence: The Effect of Political Instability on Economic Growth. New York: Praeger. Gurr, T. ed., 1970. Why Men Rebel. Princeton: Princeton University Press Hadi, M. ed., 2007. Documents on Jerusalem. Jerusalem: Palestinian Academic Society for the Study of International Affairs (PASSIA).

294
Halevi, K., 2000. ‘The Political Sources of Humanitarian Emergencies’. In E.W. Nafziger et al., eds. The Origins of Humanitarian Emergencies: War and Displacement in Developing Countries. Oxford: Oxford University Press. Hall, R.E., 1978. ‘Stochastic Implications of the Life Cycle-Permanent Income Hypothesis: Theory and Evidence’. Journal of Political Economy, 86 (6): 971-987. Halper, J. & Jounan, M., 2005. Obstacles to Peace: A Re-framing of the Palestinian – Israel Conflict. Jerusalem: The Israeli Committee against House Demolitions (ICAHD). Hanafi, S. & Tabar, L., 2005. The Emergence of Palestinian Globalized Elite. Donors, International Organizations and Local NGOs. Jerusalem: Institute of Jerusalem Studies. Hanafi, S., 2008. ‘Spacio-cide: Colonial Politics, Invisibility and Rezoning in Palestinian Territory’. Contemporary Arab Affairs, 2 (1): 106-121. Harriss, J., 2001. ‘Social Capital Construction and the Consolidation of Civil Society in Rural Areas’. DSI Working Papers 16. London: Development Studies Institute at the London School of Economics. Harvey, P., 1998. ‘Rehabilitation in Complex Emergencies: Is Rebuilding Civil Society the Answer?’ Disasters, 22 (3): 200-17. Hazell, P., 1982. ‘Application of Risk Preference Estimates in Firm-Household and Agricultural Sector Models’. American Journal of Agricultural Economics, 64 (2): 385-390. Hazell, P., 1987. Insurance for Agricultural Development. Baltimore: Johns Hopkins University Press. Heiberg, M. & Øvensen, G., 1997. Palestinian Society in Gaza, West Bank and Arab Jerusalem: A Survey of Living Conditions. Oslo: Fafo. Hidalgo-Moratal, M., 2008. ‘Teorías e indicadores de desarrollo’. In A. Piqueras, ed. Desarrollo y Cooperación: un análisis crítico. Valencia: Tirant Lo Blanc. Holzmann, R. & Jorgensen, S., 2000. ‘Social Risk Management: A New Conceptual Framework for Social Protection, and Beyond’. World Bank Social Protection Discussion Paper 6. Washington DC: World Bank Homer-Dixon, T., 1999. Environment, Scarcity and Violence. Princeton: Princeton University Press. Howe, L., 1998. ‘Scrounger, Worker, Beggarman, Cheat: The Dynamics of Unemployment and the Politics of Resistance in Belfast’. Journal of the Royal Anthropological Institute, 4: 531-550. Hulme, D. & Mosley, P., 1996. Finance against Poverty. London: Routledge Humphreys, M. & Weinstein, J., 2004. ‘What the Fighters Say: A Survey of Ex-Combatants in Sierra Leone’. CGSD Working Paper 20. New York: Center on Globalization and Sustainable Development. Earth Institute. Columbia University. International Crisis Group, 2004. ‘Identity Crisis: Israel and its Arab Citizens’. Middle East Report 25. Brussels: International Crisis Group. IUED, 2001-2004. Palestinian Public Perceptions Survey. Geneva: Institute Universitaire d’etudes du Developemment International (IUED).

295
Jacoby, H. & Skoufias, E., 1997. ‘Risk, Financial Markets and Human Capital in a Developing Country’. Review of Economic Studies, 64 (3): 311-335. Jalan, J. & Ravallion, M., 1997. 'Are the Poor less Well-Insured?' Word Bank Working Papers 1863. Washington DC: World Bank Jalan, J. & Ravallion, M., 1998. ‘Behavioural Responses to Risk in Rural China’. World Bank Working Papers 1978. Washington DC: World Bank Jasper, J., 1997. The Art of Moral Protest. Chicago: University of Chicago Press. Jodha, N.S., 1975. ‘Famine and Famine Policies: Some Empirical Evidence’. Economic and Political Weekly, 10 (41): 1609-1624. Justino, P., 2007. ‘On the Links between Violent Conflict and Household Poverty: How Much Do We Really Know?’ MICROCON Research Working Paper 1. Justino, P., 2008. ‘Poverty and Violent Conflict: A Micro Level Perspective on the Causes and Duration of Warfare’. MICROCON Research Working Paper 6. Justino, P. & Verwimp, P., 2008. ‘Poverty Dynamics, Violent Conflict and Convergence in Rwanda’. MICROCON Research Working Paper 6. Kabeer, N., 2000. The Power to Chose: Bangladeshi Women and Labour Market Decisions in London and Dhaka, London: Verso. Kanaaneh, R.A., 2002. Birthing the Nation: Strategies of Palestinian Women in Israel. London: University of Californian Press. Keating, M. et al. eds., 2005. Aid, Diplomacy and Facts on the Ground: The Case of Palestine. London: Royal Institute of International Affairs. Keen, D., 1994. The Benefits of Famine: A Political Economy of Famine in South-west Sudan, 1983-1989. Princeton: Princeton University Press. Keen, D., 1998. ‘The Economic Functions of Violence in Civil Wars’. Adelphi Papers 320. Keen, D., 2000. ‘Incentives and Disincentives of Violence’. In M. Berdal & D. Malone, eds. Greed and Grievance. Economic Agendas in Civil Wars. London: Lynne Rienner. Keen, D., 2001. ‘The Political Economy of War’. In F. Stewart & V. FitzGerald, eds. War and Underdevelopment: The Economic and Social Consequences of Conflict. Oxford: Oxford University Press. Khasan, H., 2003. ‘Collective Palestinian Frustration and Suicide Bombings’. Third World Quarterly, 24 (6): 1067: 2003. Kinsey, B. et al. 1998. 'Coping with Drought in Zimbabwe: Survey Evidence on Responses of Rural Households to Risk'. World Development, 26 (1): 89-110 Kochar, A., 1995. ‘Explaining Household Vulnerability to Idiosyncratic Income Shocks’. American Economic Review, 85 (2): 159-164.

296
Kochar, A., 1999. ‘Smoothing Consumption by Smoothing Income: Hours-of-Work Responses to Idiosyncratic Agricultural Shocks in Rural India’. The Review of Economics and Statistics, 81 (1): 50-61. Korf, B., 2004. ‘War, Livelihoods and Vulnerability in Sri Lanka’. Development and Change, 35 (2): 275-295. Krishna, A., 2002. Active Social Capital. Tracing the Roots of Development and Democracy. New York: Columbia University Press. Krueger, A.B. & Male čková, J., 2003. ‘Education, Poverty and Terrorism: Is there a Causal Connection?’. Journal of Economic Perspectives, 17(4): 119-144. Lautze, S., 2000. Saving Lives and Livelihoods: The Fundamentals of a Livelihood Strategy. Boston: Feinstein International Famine Center. TUFTS University. Leader, N., 2000. ‘The Politics of Principle: The Principles of Humanitarian Action in Practice’, HPG Report 2. Humanitarian Policy Group. London: Overseas Development Institute. Le Billon P., 2000, ‘The Political Economy of War: What Relief Agencies Need to Know’. Humanitarian Practice Network Working Paper 33. London: Overseas Development Institute. Lecoutere, E. & Titeca, K., 2007. ‘The OPEC Boys and the Political Economy of Smuggling in Northern Uganda’. HiCN Working Paper 36. Households in Conflict Network. Legrain, J.F., 1996. ‘Judaïsation et Démembrement: Politiques Israéliannes du Territoire en Cisjordanie-Gaza (1967-1995)’. Monde Arabe – Maghreb Machreck 152 Lein, Y., 2001. Civilians under Siege: Restrictions on Freedom of Movement as Collective Punishment. Jerusalem: The Israeli Information Center for Human Rights in the Occupied Territories (B`Tselem). Lein, Y., 2002. Land Grab. Israel Settlements Policy in the West Bank. Jerusalem: The Israeli Information Center for Human Rights in the Occupied Territories (B`Tselem). Lein, Y., 2004. Forbidden Roads: The Discriminatory West Bank Road Regime. Jerusalem: The Israeli Information Center for Human Rights in the Occupied Territories (B`Tselem). Le More, A., 2005. ‘Realities on the Ground and the International Agenda’. In M. Keating et al. eds. Aid, Diplomacy and Facts on the Ground: The Case of Palestine. London: Royal Institute of International Affairs. Le More, A., 2008. International Assistance to the Palestinians after Oslo. London: Routledge Studies on the Arab-Israeli Conflict. Lichbach, M., 1995. The Rebel’s Dilemma. Ann Arbor: University of Michigan Press. Luckham. R., 2001. ‘Conflict and Poverty in Sub-Saharan Africa: An Assessment of the Issues and Evidence’. IDS Working Paper 128. Brighton: Institute of Development Studies Lukes, S. ed., 1974. Power. London: MacMillan Press Ltd. Macrae, J., et al., 1997. ‘Conflict, the Continuum and Chronic Emergencies: A Critical Analysis of the Scope for Linking Relief, Rehabilitation and Development Planning in Sudan’. Disasters, 21 (3): 223 – 243.

297
Mansour, C., 2001. ‘Israel’s Colonial Impasse’. Journal of Palestine Studies, 30 (4): 83-87 Marable, M., 2002, ‘The Political and Theoretical Contexts of the Changing Racial Terrain’. Souls, 4 (3): 1-16 Mardam-Bey, F. & Sanbar, E. eds. 2004. El Derecho al Retorno: El Problema de los Refugiados Palestinos. Guadarrama: Ediciones del Oriente y del Mediterráneo. Margaliot, S.R., 2004. ‘Labour Market Discrimination against Arab Israeli Citizens: Can Something be Done? New York University Journal of International Law and Politics, 36 (4): 845-884. Margalit, M., 2007. No Place like Home. House Demolitions in East Jerusalem. Jerusalem: International Committee against House Demolitions (ICAHD). McAdam, D. et al., 2001. Dynamics of Contention. Cambridge: Cambridge University Press. McCulloch, N., et al., 2001. Trade Liberalization and Poverty: A Handbook. London: Centre for Economic Research. McGinn, Th., 2000. ‘Reproductive Health of War-Affected Populations: What Do We Know?’ International Family Planning Perspectives, 26 (4): 174-180. Mittleman, J.H. & Chin, C. B. N., 2000. ‘Conceptualizing Resistance to Globalization’. In Amoore, L. ed., 2005. The Global Resistance Reader. London: Routledge Morduch, J., 1990. Risk, Production and Saving: Theory and Evidence from Indian Households. Harvard University. Mimeo. Morduch, J., 1991. Consumption Smoothing Across Space. Harvard University. Mimeo. Morduch, J., 1995. ‘Income Smoothing and Consumption Smoothing’. Journal of Economic Perspectives, 9 (3): 103-114. Meron, T., 2000, ‘The Humanization of the Humanitarian Law’. American Journal of International Law, 94: 239-241 Moser, M., 1998. ‘The Asset Vulnerability Framework: Reassessing Urban Poverty Reduction Strategies’. World Development, 26 (1): 1-19. Moughrabi, F., 1992. ‘Israel Control and Palestinian Resistance’. Social Justice, 19 (3): 46-62. Myers, N., 1987. ‘Populationn, Environment and Conflict’. Environmental Conservation, 14 (1): 15-22. Nablusi, K., 2005. ‘The State-Building Project: What Went Wrong?’ In Keating, M. et al. eds., 2005. Aid, Diplomacy and Facts on the Ground: The Case of Palestine. London: Royal Institute of International Affairs. Naïr, S., 1995. En el nombre de Dios. Colonialismo versus integrismo en la tragedia argelina. Madrid: Icaria. Naïr, S., 1998. Las heridas Abiertas. Madrid: El PAIS Aguilar. Nair, S., 2002. ‘Arab Unity and Palestinian Intifada’. News from Within, Vol. 17 (5): 4-10.
298
Narayan, D., 1999. ‘Bonds and Bridges: Social Capital and Poverty’. World Bank Policy Research Working Paper 2167. Washington DC: World Bank. Narayan, D. & Pritchett, L., 1999. ‘Cents and Sociability: Household Income and Social Capital in Rural Tanzania’. Economic Development and Cultural Change, 47 (4): 871-897. OCHA, 2003-2004a. Weekly Briefing Notes. Jerusalem: United Nations Office for the Coordination of Humanitarian Affairs. OCHA, 2003-2004b. Monthly Movement and Access Report. Jerusalem: United Nations Office for the Coordination of Humanitarian Affairs. OCHA, 2005a. Humanitarian Appeal 2005 for Occupied Palestinian Territory. Consolidated Appeals Process (CAP). Jerusalem: United Nations Office for the Coordination of Humanitarian Affairs. OCHA, 2005b. ‘Restrictions on the Movement of People and Goods within the West Bank’, OCHA Technical Note. Jerusalem: United Nations Office for the Coordination of Humanitarian Affairs. OCHA, 2007. The Humanitarian Impact on Palestinians of the Israeli Settlements and other Structures in the West Bank. Jerusalem: United Nations Office for the Coordination of Humanitarian Affairs. OCHA (2008), ‘Lack of Permit Demolitions and Resultant Displacement in Area C’, OCHA Special Focus. Jerusalem: United Nations Office for the Coordination of Humanitarian Affairs. OCHA and UNRWA, 2003 – 2009. ‘The Humanitarian Impact of the West Bank Barrier on Palestinian Communities’. Humanitarian Impact of Barrier Updates. Jerusalem: United Nations Office for the Coordination of Humanitarian Affairs and United Nations Relief and Works Agency for Palestinian Refugees. Olson, M., 1965. The Logic of Collective Action: Public Good and the Theory of Groups. Cambridge (Massachusetts): Harvard University Press. Pacheco, A., 2001. ‘Flouting Convention: The Oslo Agreements’. In R. Carey ed. The New Intifada: Resisting the Israeli Apartheid. London: Verso. Pain, A. & Lautze, S., 2002. ‘Addressing Livelihoods in Afghanistan’. AREU Issues Paper Series. Kabul: Afghanistan Research and Evaluation Unit. PASSIA, 2004. ‘Palestinian Refugees’. PASSIA Special Bulletin. Jerusalem: Palestinian Academic Society for the Study of International Affairs. Pappe, I., ed., 1997. The Israeli/Palestinian Question. London: Routledge. Pappe, I., 2007. Ethnic Cleansing of Palestine. Oxford: Oneworld. Paxson, C., 1992. ‘Using Weather Variability to Estimate the Response of Savings to Transitory Income in Thailand’. The American Economic Review, 82 (1): 15-33. Paxson, C., 1993. ‘Consumption Smoothing and Income Seasonality in Rural India’. Discussion Paper 173. University of Princeton.

299
Payne, P. & Lipton, M., 1994. ‘How Third World Rural Households Adapt to Dietary Energy Stress’. Food Policy Reviews 2. Washington DC: International Food Policy Research Institute (IFPRI). PCBS, 2004a. Palestinian Expenditure and Consumption Survey. Levels of Living in the Palestinian Territory 2004. Rammallah: Palestinian Central Bureau of Statistics. PCBS, 2004b. Economy Survey Series-2004: Main results. Rammallah: Palestinian Central Bureau of Statistics. PCBS, 2004c. Demographic and Health Survey 2004. Press Conference on the Initial Survey Results. Rammallah: Palestinian Central Bureau of Statistics. PCBS, 1999, 2001, 2003. Labour Force Survey. Rammallah: Palestinian Central Bureau of Statistics. PCBS, 2005a. Israeli Settlements in the Palestinian Territory. Annual Statistical Report. Rammallah: Palestinian Central Bureau of Statistics. PCBS, 2005b. Impact of the Israeli Measures on the Economic Conditions of Palestinian Households Survey. Monitoring Reports. Rammallah: Palestinian Central Bureau of Statistics. Pinchotti, S. and Verwimp, P. 2007. ‘Social Capital and the Rwanda Genocide. A Micro-level Analysis’. HiCN Working Paper 30. Households in Conflict Network. Platteau, J.F., 1991. ‘Traditional Systems of Social Security and Hunger Insurance: Past Achievements and Modern Challenges’. In E. Ahmad et al., eds. Social Security in Developing Countries. Oxford: Clarendon Press. Platteau, J.F., 1997. ‘Mutual Insurance as an Elusive Concept in Traditional Rural Societies’. Journal of Development Studies, 33 (6): 764-96. Platteau, J.F & Abraham, A., 1987. ‘An Inquiry into Quasi-credit Contracts: The Role of Reciprocal Credit and Interlinked Deals in Small-scale Fishermen Communities’. Journal of Development Studies, 23 (4): 461-490. Pérez de Armiño, K., 1997. ‘Vulnerabilidad y desastres: causas estructurales y procesos de crisis de África’. Cuadernos de Trabajo de Hegoa 24. Polanyi, K., 1957. The Great Transformation: The Political Economy Origins of Our Time. London: Beacon Process. Posner, R., 1980. ‘A Theory of Primitive Society, with Special Reference to Law’. Journal of Law and Economics, 23 (1): 1-53 PRCS, 2000-2004. Conflict Statistics. Rammallah: Palestinian Red Crescent Society (PRCS). Putnam, R., et al., 1993. Making Democracy Work: Civic Traditions in Modern Italy. Princeton: Princeton University Press Rabbani, M., 2001. ‘A Smorgasbord of Failure: Oslo and the Al-Aqsa Intifada’. In R. Carey ed. The New Intifada: Resisting the Israeli Apartheid. London: Verso. Rangasami, A., 1985. ‘Failure of Exchange Entitlements Theory of Famine. A Response’. Economic and Political Weekly, 20 (41): 1747-1752.

300
Rao, J. N. K. and Scott, A. J. (1981). The Analysis of Categorical Data from Complex Sample Surveys: Chi-squared Tests for Goodness of Fit the Independence in Two-Way Tables. Journal of the American Statistical Association, 76: 221-230. Rao, J. N. K. and Scott, A. J. (1984). On Chi-squared Test for Multiway Contingency Tables with Cell Proportions Estimated from Survey Data. The Annals of Statistics, 12: 46-60. Ravallion, M. & Dearden, L., 1988. ‘Social Security in a ‘Moral Economy’: An Empirical Analysis for Java’. The Review of Economics and Statistics, 70 (1): 36-44. Reardon, T., et al., 1994. ‘Is Income Diversification Agriculture-led in West African Semi-Arid Tropics’. In A. Atsain, et al., eds. Economic Policy Experience in Africa: What Have We Learned? Nairobi: African Economic Research Consortium. Redding. S. & Venables, A., 2000. ‘Economic Geography and International Inequality’. CEPR Discussion Paper 2568. London: Centre for Economic Policy Research. Richards, P., 1996. Fighting for the Rainforest. War; Youth and Resources in Sierra Leone. Oxford: James Currey. Romer, D., 1996. Advanced Macroeconomics. New York: McGraw Hill. Rosenzweig, M. & Wolpin, K., 1993. ‘Credit Market Constraints, Consumption Smoothing, and the Accumulation of Durable Production Assets in Low-Income Countries: Investments in Bullocks’. Journal of Political Economy, 101 (2): 223-244. Rosenzweig, M. & Binswanger, H., 1985. ‘Specific Experience, Household Structure, and Inter-generational Transfers: Farm Family Land and Labour Arrangements in Developing Countries’. Quarterly Journal of Economics, 100: 961-987 Rosenzweig, M. & Binswanger, H., 1993. ‘Wealth, Weather Risk and the Composition and Probability of Agricultural Investments’. Economic Journal, 103: 56-78. Rouhana, N. & Ghanem, A., 1997. ‘The Democratization of a Traditional Minority in an Ethnic Democracy’. In I. Pappe, ed. The Israeli/Palestinian Question. London: Routledge. Roy, S., 2001a. ‘Decline and Disfigurement: The Palestinian Economy after Oslo’. In R. Carey, ed. The New Intifada: Resisting the Israeli Apartheid. London: Verso. Roy, S., 2001b. ‘Palestinian Society and Economy: The Continued Denial of Possibility’. Journal of Palestinian Studies, 30 (4): 5-20. Roy, S., 2007. Failing Peace: Gaza and the Palestinian-Israeli Conflict. London: Pluto Press. Sachs, J., & Warner, A., 1999, ‘Natural Resource Abundance and Economic Growth’. NBER, Working Paper 5398. Boston: National Bureau of Economic Research. Said, E., 1994. The Politics of Dispossession: The Struggle for the Palestinian Self-determination, 1969-1994. New York: Vintage. Said, E., 1996. Peace and its Discontents: Essays on Palestine in the Middle East Peace Process. London: Vintage.
301
Said, E., 2001. The End of the Peace Process: Oslo and After. New York: Vintage. Saleh, B., 2004a. Palestinian Suicide Attacks Revisited: A Critique of Current Wisdom. St. Johns University. Mimeo. Saleh, B., 2004b. ‘Economic Conditions as a Determinant of Political Violence in the Palestinian Territories’. In World Institute for Development Economic Research (WIDER) Conference, Helsinki, Finland 3-6 June. Scott, J., 1976. The Moral Economy of the Peasant: Rebellion and Subsistence in Southeast Asia. New Heaven: Yale University Press. Scott, J., 1985. The Weapons of the Weak; Everyday Forms of Peasant Resistance. New Haven: Yale University Press. Scott, J., 1990. Domination of Art of Resistance: Hidden Transcripts. New Haven: Yale University Press. Scoones, I., 1998. ‘Sustainable Livelihoods: A Framework for Analysis’. IDS Working Paper 72. Brighton: Institute of Development Studies Sen, A., 1981. Poverty and Famines: An Essay on Entitlement and Deprivation. Oxford: Oxford University Press. Shafer, J., 2002. ‘Supporting Livelihoods in Situations of Chronic Conflict and Political Instability: Overview of Conceptual Issues’. ODI Working Paper 183. London: Overseas Development Institute. Shearer, D., 2000. ‘Aiding or Abetting? Humanitarian Aid and Its Economic Role in Civil War’. In M. Berdal & D. Malone, eds. Greed and Grievance. Economic Agendas in Civil Wars. London: Lynne Rienner. Shearer, D. & Meyer, A., 2005. ‘The Dilemma of Aid under Occupation’. In Keating, M. et al. eds., 2005. Aid, Diplomacy and Facts on the Ground: The Case of Palestine. London: Royal Institute of International Affairs. Shehadeh, R., 1989.Occupiers’ Law: Israel and the West Bank. Jerusalem: Institute for Palestine Studies. Shemyakina, O., 2006. ‘The Effect of Armed Conflict on Accumulation of Schooling: Results from Tajikistan’. HiCN Working Paper 12. Households in Conflict Network. Shultz, P., 1988. ‘Education Investments and Returns’. In H. Chenery & T.H Srinivasan, eds. Handbook of Development Economics Vol. 1. Amsterdam: North Holland. Siegel. P. & Alwang, J., 1999. ‘An Asset-Based Approach to Social Risk Management: A Conceptual Framework’. Social Protection Discussion Paper Series 9926. Washington DC: World Bank. Singer, J.D. & Small, M., 1994. Correlates of War Project: International and Civil War Data, 1815-1992. Ann Arbor, Michigan, Inter-University Consortium for Political and Social Research. Sinha, S. & Lipton, M., 1999. ‘Damaging Fluctuations, Risks and Poverty: A Review’. Background paper for the World Bank World Development Report 2000/2001. Sletten, P. & Pedersen, J., 2003. Coping with Conflict: Palestinian Communities Two Years into the Intifada. Oslo: Fafo.

302
Stein, K., 1990. ‘The Intifada and the 1936-39 Uprising: A Comparison. Journal of Palestine Studies, 19(4), 64-85. Stewart, F., 1993. ‘War and Underdevelopment: Can Economic Analysis Help Reduce the Costs?’ Journal of International Development, 5 (4): 357-380. Stewart, F., ed. 1997. The Social and Economic Costs of Conflict in Developing Countries. London: Economic and Social Research (ESCOR) UK Department of International Development (DFID). Stewart, F., 2000. ‘The Root Causes of Humanitarian Agencies’. In W.E Nafizger et al., eds. War, Hunger and Displacement: The Origins of Humanitarian Emergencies, Vol. 1. Oxford: Oxford University Press. Stewart, F. et al, 2001. ‘Internal Wars in Developing Countries: An Empirical Overview of Economic and Social Consequences’. In F. Stewart. & V. FitzGerald. War and Underdevelopment: The Economic and Social Consequences of Conflict. Oxford: Oxford University Press. Stewart, F. & FitzGerald, V., 2001. War and Underdevelopment: The Economic and Social Consequences of Conflict. Oxford: Oxford University Press. Swift, J., 1989. ‘Why Are Rural People Vulnerable to Famine?’. IDS Bulletin, 20 (2): 8-15. Brighton: Institute of Development Studies. Tamari, S., 2003. ‘Jerusalem: Una Ciudad Disputada en una Geografía Sagrada’. In I. Álvarez-Ossorio, ed. Informe sobre el Conflicto de Palestina: De los Acuerdos de Oslo a la Hoja de Ruta. Guadarrama (Madrid): Ediciones del Oriente Medio y del Mediterráneo. Tilley, V., 2005. The One-State Solution. Ann Arbor: University of Michigan Press. Townsend, R., 1994. ‘Risk and Insurance in Village India’. Econometrica, 62 (3): 539-591. Townsend, R., 1995. ‘Consumption Insurance: An Evaluation of Risk-Bearing Systems in Low-Income Economies’. Journal of Economic Perspectives, 9 (3): 83-102. Udry, C., 1990. ‘Credit Markets in Northern Nigeria: Credit as Insurance in a Rural Economy’. World Bank Economic Review, 4 (3): 251-271. Udry, C., 1994. ‘Risk and Insurance in a Rural Credit Market: An Empirical Investigation in Northern Nigeria’. Review of Economic Studies, 61: 495-526. Udry, C., 1995. ‘Risk and Saving in Northern Nigeria’. The American Economic Review, 85 (5): 495-526. UNCTAD, 2006. The Palestinian War-torn Economy. Aid, Development and State Formation. Geneva: United Nations Conference on Trade and Development. UNDP, 2007. Human Development Report. Annual Report. New York: United Nations Development Programme. UNSCO, 2005. Economic Fragmentation and Adaptation in the Rural West Bank. Rammallah: Office of the United Nations Special Coordinator for the Middle East Peace Process.
303
Verpoorten, M., 2007. ‘Household Coping in War- and Peacetime: Cattle Sales in Rwanda, 1991-2000’. LICOS Discussion Papers 189. Center for Institutions and Economic Performance. Katholieke Universiteit Leuven. Verwimp, P., 2005a. ‘An Economic Profile of Peasant Perpetrators of Genocide: Micro-level Evidence from Rwanda’. Journal of Development Economics, 77: 297-323. Verwimp, P., 2005b. ‘Child Survival and Fertility of Refugees in Rwanda’. European Journal of Population, 21 (2-3): 271-290. Vinthagen, S. & Lilja, M., 2007. ‘The State of Resistance Studies’. In European Sociologists Association Conference, Glasgow, Scotland 3 – 6 September 2007. Warschawski, M., 2002. Israel-Palestina. La Alternativa de la convivencia binacional. Madrid: La Catarata Warschawski, M., 2008. "The One State Solution and Irreversibility". Alternative Information Center, 15 April 2008 Watts, M., 1983. Silent Violence: Food, Famine and Peasantry in Northern Nigeria. Berkeley: University California Press. Watts, M., 1991. ‘Entitlements or Empowerment? Famine and Starvation in Africa’. Review of African Political Economy, 51: 9-26. Webb, P. & Reardon, T., 1992. ‘Drought Impact and Household Response in East and West Africa’. Quarterly Journal of International Agriculture, 31 (3): 230-246. WFP, 2004a. Coping Strategies of WFP Beneficiaries in oPt: A Pre-Test Study. Jerusalem: World Food Programme. WFP, 2004b. Livelihoods, Shocks and Coping Strategies of WFP Beneficiaries in the Occupied Palestinian Territory –oP: A Baseline Survey September-November 2004. Jerusalem: World Food Programme. Wickham-Crowley, T., 1991. Exploring Revolution: Essays on Latin America Insurgency and Revolutionary Theory. New York: M.E. Sharpe. Woolcock, M., 1998. ‘Social Capital and Economic Development: Toward a Theoretical Synthesis and Policy Framework’. Theory and Society, 27(2): 151-208. World Bank, 2000. World Development Report 2000-2001. Washington DC: World Bank. World Bank, 2002. Fifteen Months – Intifada, Closures and Palestinian Economic Crisis. An Assessment. Washington DC: World Bank. World Bank, 2003a. Two Years of Intifada Closures and Palestinian Economic Crisis. An Assessment. Washington DC: World Bank. World Bank, 2003b. The Impact of the Separation Barrier. Jerusalem: World Bank. World Bank, 2004a. Four Years – Intifada, Closures and Palestinian Economic Crisis. An Assessment. Washington DC: World Bank. World Bank, 2004b. Deep Palestinian Poverty in the Midst of Economic Crisis. Washington DC: World Bank.

304
Yom, S. & Saleh, B., 2004. ‘Palestinian Suicide Bombers: A Statistical Analysis’. ECAAR News Network, 16 (3): 8-11. Economists Allied for Armed Reduction. Young, H., et al., 2002. Nutrition and Livelihoods in Situations of Chronic Conflict and other Crises. Boston: Feinstein International Famine Centre, Tufts University. Yuval-Davis, N., 1997. Gender and Nation Sage. Publication: London, Thousand Oaks, New Delhi Zeldes, S., 1989. ‘Consumption and Liquidity Constraints: An Empirical Investigation’. Journal of Political Economy, 97 (2): 305-346.

305
APPENDICES Appendix 1: Historic Overview of the Palestinian-Israeli Conflict till 2006 1922: Following the fall of the Ottoman Empire, the whole of historic Palestine, which now encompasses Israel, the West Bank and Gaza Strip, is placed under a mandate entrusted to the British Government by the League of Nations. 1923-1939: Nazi persecution of Jews and other groups in Europe escalates. Jewish immigration to Palestine is facilitated by the British Mandate, despite nationwide riots by Palestinians and full scale rebellions in 1936 and 1939 to oppose it. Although the Jewish population increases to represent some 30% of the population in Palestine, Jewish landholding represents only 6.6% of the total territory of Palestine. 1947: The United Nations General Assembly (GA) passes resolution 181, recommending the partition of Palestine into separate independent Arab and Jewish states and an internationalised Jerusalem. Since the plan provides the proposed Jewish state with 55% of the territorial home of the substantial Palestinian population, the plan is rejected by the Palestinians. British authorities announce their intention to terminate the mandate. 1948: The British Mandate expires and Jewish leaders declare the establishment of the State of Israel. War breaks out involving several neighbouring Arab countries. With the declaration of the armistice, Israel takes control of all Palestine except those areas now known as the West Bank and Gaza Strip, and 750,000 Palestinians become refugees. UN GA Resolution 194 of the same year “resolves that refugees wishing to return to their homes and live at peace with their neighbours should be permitted to do so at the earliest practicable date.” 1964: The Palestine Liberation Organisation (PLO) is officially established by the Arab League as the political representative of the Palestinian people, and it adopts a policy of armed struggle as a means of regaining historic Palestine. 1967: Israel occupies the West Bank (including East Jerusalem), the Gaza Strip, the Sinai Peninsula, and the Golan Heights during a six-day war with neighbouring Arab states. The UN Security Counsel passes Resolution 242, reinforced by Resolution 338, both of which remain central to diplomatic and international efforts to resolve the conflict and which emphasise the “inadmissibility of the acquisition of territory by war,” and the need for the withdrawal of “Israeli armed forces from territories occupied in the recent conflict.” More than 400,000 Palestinians are displaced, half of whom are 1948 refugees now displaced for a second time, while another 1.3 million Palestinians find themselves under Israeli occupation. 1973: The October War starts with a surprise attack launched by the Syrians and Egyptians to regain the territory occupied by Israel in 1967. 1978: Egypt and Israel sign the Camp David Peace Agreement, which restores Sinai to Egypt and outlines a negotiation framework for a five-year autonomous regime in the oPt. 1980: Israel effectively annexes East Jerusalem when the Israeli Knesset (parliament) declares “Jerusalem in its entirety to be the eternal capital of Israel.” The action is condemned as illegal by the UN and almost all of the international community. 1987: Demonstrations against Israel’s occupation erupt in the Gaza Strip and spread to the West Bank. They develop into the intifada, a wave of mass civil resistance by the Palestinian population in response to the long duration and large scale of violations of the Israeli occupation. The intifada is without precedent in the conflict’s history, and was increasingly met with an official policy of force, might and beatings, which was made the object of severe international condemnation. 1988: Jordan cuts its legal and administrative ties with the West Bank, a disengagement that strengthens the position of the PLO. So far Israel’s policy had been to never recognize the PLO or enter into political negotiations. During the same year, the Palestine National Council issues a symbolic declaration, proclaiming

306
“the establishment of the State of Palestine on our Palestinian territory with its capital Holy Jerusalem,” and with only respect to the pre-1967 “territorial boundaries of the West Bank (including East Jerusalem) and the Gaza Strip.” 1991: Following the defeat of Iraq in the 1990-1991 Gulf War, and against the background of the ongoing first intifada, the first round of direct negotiations takes place between representatives of Israel, Lebanon, Syria and a joint Jordanian/Palestinian delegation. The US Secretary of State, James Baker, in remarks closing the Madrid conference, says a breakthrough was achieved with the start of “direct bilateral negotiations.” 1993: Israeli Prime Minister Yitzhak Rabin and PLO Chairman Yasser Arafat sign the Declaration of Principles in Washington DC, outlining a framework for Palestinian autonomy in the oPt for a transitional period of five years. The interim phase was to be followed by permanent-status negotiations and a settlement based on UN SC Resolutions 242 and 338. This settlement does not materialize. 1994: Israel and the Palestinian National Authority (PNA) sign an agreement on the Gaza Strip and Jericho Area (Oslo I), which provides a framework for transferring power and responsibilities to the PNA and provides for Israeli redeployment from the Gaza Strip and the West Bank city of Jericho. 1995: The Israeli-Palestinian Interim Agreement on the West Bank and the Gaza Strip (Oslo II) is signed in Taba, Egypt, scheduling Israeli redeployment from the major Palestinian population centres in the West Bank. It also confirms the PNA’s expanded role, including policing, and sets coordination mechanisms for security, legal, judicial and economic policies. In November, the Israeli Prime Minister Rabin is assassinated. Shimon Peres becomes Prime Minister and suspends the component of the Oslo II Agreement requiring Israel to withdraw from the West Bank city of Hebron. 1996: Palestinian presidential and legislative elections are held. Yasser Arafat is elected as the President of the PNA, and the Palestinian Legislative Council (PLC) is elected as the legislature. A few months later, early elections in Israel culminate in the election of Binyamin Netanyahu as Prime Minister of Israel. 1997: In January 1997, the Protocol Concerning the Redeployment in Hebron, concluded by Israeli Prime Minister Benjamin Netanyahu and PNA President Yasser Arafat, details the arrangements for the withdrawal of Israeli troops from 80% of Hebron. 1998: The Wye River Memorandum outlines the steps to be taken to implement the Oslo II Agreement. 1999: Ehud Barak is elected Israeli Prime Minister. In September, both sides agree on implementing the Sharm El Sheikh Agreement (the Wye River Accord). Among other things, it provides for the opening of a safe passage between the Gaza Strip and the West Bank. Both sides also agree to start final status negotiations. 2000: In July Camp David negotiations failed. In September, clashes erupt at Al-Aqsa Mosque in occupied East Jerusalem, between Israeli forces and Palestinian worshippers angered by a visit made by then opposition leader Ariel Sharon and Israeli forces to the compound. The event proves to be the opening sequence of the largest sustained Palestinian uprising or intifada against Israeli occupation.
2001: Taba Talks: Arafat and Barak find common ground but no agreements. Bush inaugurated. Likud wins Israeli elections; Sharon elected Prime Minister. Violence escalates. Mitchell Report released. Ceasefire attempts are made but broken. First informal meeting of the Quartet (the United Status, the European Union, Russia and the United Nations) in New York.
2002: During March-April, Israel launched the Operation Defensive Shield into the oPt Reoccupation of Palestinian areas begins. Arafat placed under house arrest. Occupation of Church of the Nativity in Bethlehem. Saudi Crown Prince peace plan, endorsed by Arab League, promises recognition of Israel for ending occupation. United Nationsl Security Council (UNSC) Res. 1397 affirms 2-state vision, welcomes Saudi initiative and Quartet diplomacy. 23 June Arafat launched the ‘100 Days Reform Plan’, which foresees an administrative reform of the PNA and call for elections. 24 June President Bush declares vision for a “viable Palestinian state next to a secure Israel.” Israel begins construction of “security fence” around the West Bank. In June Sharon announces the construction of a Wall to separate the oPt from Israel. In July Quartet launches Task Force on

307
Palestinian Reform. Sharon’s request to UN Secretary-General for assessment of the humanitarian situation in the oPt – Bertini Mission. By December, finalization of the Quarter’s ‘Roadmap’ draft.
2003: After Arafat’ decision to appoint Prime Minister, Mahmoud Abbas (Abu Mazen) is presented as first Palestinian Prime Minister. The Road Map is released by the US, UN, Russia and the EU. The proposal never made it beyond the first phase, which called for a halt to Israeli settlement construction and a halt to Israeli and Palestinian violence, none of which was achieved. Abbas resigns and Quorei (Abu Ala) appointed as Prime Minister.
2004: Sharon announces unilateral Gaza withdrawal plan and gains U.S. support. Palestinian Authority President Yasser Arafat dies. International Court of Justice rules that the route of Israel’s “separation barrier” violates international law.
2005: Mahmoud Abbas elected President of the Palestinian Authority on a non-violent platform. Second Intifada ends with Sharm el-Sheikh summit in February and declaration of cease-fire by militant groups in March. Bush recommits to two-state solution and asks Congress for additional aid to the Palestinians. Gaza withdrawal is completed in September.
2006: Deputy PM Ehud Olmert assumes power replacing Sharon. Hamas wins majority in the Palestinian Legislative Council elections. EU foreign ministers endorsed a temporary halt to direct aid to the Palestinian government led by Hamas.

308
Appendix 2: A Territorial Approximation to the Palestinian-Israeli Conflict
Source: Lisol

309
Appendix 3: The Road Network in the West Bank

310
Appendix 4: Organizations and Persons Interviewed during February-July 2005 Christi Campbell, World Food Programme, Jerusalem
Genevieve Wills, International Committee Red Cross (ICRC), Jerusalem
Elena Mancusi, United Nations Relief and Works Agency for Palestine Refugee in the Near East
(UNRWA), Jerusalem
Allegra Pacheco, United Nations Office for the Coordination of Humanitarian Affairs
(OCHA), Jerusalem
Francine Pick-up, Office of the United Nations Special Coordinator (UNSCO), Ramallah
Rana Hanoun, Ministry of Planning and consultant for the Food and Agriculture Organization
(FAO), Ramallah
Zara Sejberg, development worker at Danish Red Cross, Jenin
Magali Thil, Head of Delegation ACSUR las Segovias, Jerusalem
Silvia Asensio, Head of Delegation PTM Mundubat, Jerusalem
Ana García, Head of Delegation Solidaridad Internacional, Jerusalem
Piedad Martín, AECI Jerusalem
Rafaella Iodice, Head of the Social Development Department and head of operations, European
Commission Delegation in Jerusalem
Michael Mansour, food security unit, European Commission Delegation in Jerusalem
Stefano Mocci, consultatnt for the World Bank, Amman.
Alejandro Zurita, Head of Delegation, Acción contra el Hambre, Jerusalem
Samir Abdullah, Director of Palestinian Economic Policy Research Institute (MAS), Rammallah
Meir Margalit, member of the Israeli NGO; Committee Against house Demolitions
Yasser Akawi, responsible for social and youth issues, member of the Palestinian-Israeli NGO,
Alternative Information Center, Jerusalem
Shir Herver, responsible for economic issues, Alternative Information Center, Jerusalem
Sergio Yanni, responsible for communications, Alternative Information Center, Jerusalem
Jamal Yuma, director of the Stop the Wall Campaign
Jawad Saleh, responsible for socio-economic surveys at the Palestinian Central Bureau of
Statistics (PCBS), Rammallah
International Palestinian Youth League (IPYL), Hebron
Palestinian Society for Regional Studies, Nablus

311
Appendix 5a: Proposal of Collaboration for the Palestinian Central Bureau of Statistics
PROPOSAL FOR COLLABORATION Livelihoods in Conflict
Silvia Jarauta Bernal, PhD Candidate
22 May 2006
The following proposal aims to start a dialogue with the Palestinian Central Bureau of Statistics (PCBS) about collaborative action-research on Livelihoods in Conflict.
In order to start the conversations, the proposal introduces the state of art of Livelihoods in Conflict, the issues being currently studied, data & methodological concerns as well as suggestions for research. The proposal finishes by presenting some of the possibilities for collaboration. It is to be noted that the collaborative action-research is proposed within the framework of my PhD thesis “Coping with Conflict in the oPt: Vulnerability vs. Resilience”, which I am currently working on at the University of Alicante, Spain. State of the Art There is a gap in the literature on household vulnerability and political conflict. Overall, and including oPt, household vulnerability in conflict situations is still being explored and understood using ‘lenses’, theoretical frameworks and tools for analysing vulnerability in the context of natural and economic shocks. However, neither the impact nor the household responses to a political crisis are comparable to economic or natural disasters. On the one hand, unlike natural and economic disasters, political conflicts violate, systematically and deliberately, individual and group rights to reproduce and secure an adequate liveilhood by eroding and destroying their victims’ political, economic, social and environmental systems as well as blocking and manipulating coping strategies. On the other hand, the fact that risk is endogenous demands the understanding of the coping strategies within their causes and symtoms, i.e as outcomes of an interactive process between oppressor and oppressed. Thus, if coping strategies are to be used as indicators of household vulnerability to conflict, is not enough to know what are the coping strategies and who are the coping strategies users. Instead the quesitons of why and how need also to be integrated by asking for specific household reasons for choosing a specific strategy portfolio; the coping strategies, their intensity of use, how dependent the households are on coping strategies, as well as the effectiveness and sustainability of such coping strategies. Despite the importance of these questions, coping strategies have been researched and monitored without understanding these issues. This has, firstly, masked the collapse of livelihood systems by presupposing that people do cope. Secondly, it has locked people into a vicious circle of subsistence and coping, enabling people to stand still but preventing them from moving ahead. Addressing these questions becomes a must in chronic situations, where household vulnerability will not be targeted with just a reduction in the risk events or the introduction of mechanisms to help people’s coping strategies. In addition, rebuilding the households’ asset bases - exhausted or weakened over the years – and supporting refugees’ process of adaptation of their livelihoods should also be considered.

312
Having introduced how Livelihoods in Conflict is currently understood, what do you think about it? Can this view be applied in the oPt? Do you think is a need to move further? Current Issues Despite the particular vulnerabilization of households in situations of conflict, there is very little understanding on how households cope with conflict, particularly on:
a) Choices of war-affected farmers between becoming subsistence producers and consumers or turning to market-based activities for survival.
b) Determinants in coping with conflict/violence. c) The role of land reform and access to land-related assets in initiating, but also coping
with, violent conflicts. d) The choices of conflict-induced refugees to reconstruct their economic livelihoods. e) The importance of rural-urban migration during war and mass violence and its long-
term economic effects on households’ livelihoods. f) Differences between war-time and post-war coping strategies of households. g) The combined effect of conflict and ill-health on coping, welfare and survival. h) The role of women and girls in conflict-affected households and the analysis of coping
choices from a gender perspective. i) The relationship between coping choices and various monetary and non-monetary forms
of household welfare. j) Coping with chronic conflict.
What do you think about these issues? Do you think that others need to added? Is the PCBS interested in the analysis of any of these issues in particular? Data and Methodological Concerns and Suggestions One of the main challenges to understanding conflict from a micro-level perspective is the absence of adequate data sets. This partially results from the focus of traditional security studies by the state and state agencies. There are, in addition, a number of difficulties associated with the collection of data in conflict areas, not least of which are the destruction associated with violence and potential ethical and security challenges to research in areas of conflict. Experience with data analyses that attempt to come to grips with conflict at the micro level faces a number of methodological challenges, such as representativeness or selection effects. However, since adequate data sets are not available, efforts are needed to develop methods of analysis that can overcome these limitations and still provide sound analysis. Fortunately in the oPt, there are available data on households’ coping mechanisms. Specifically, coping strategy questions can be found in the following surveys: Palestinian Expenditure and Consumption Survey & Poverty (PCBS), Impact of the Israeli Measures on the economic status of the Palestinians (PCBS), Impact of the Wall on socioeconomic conditions of the Palestinians (PCBS), Coping strategies among the World Food Programme (WFP)-beneficiaries and Palestinian public Perceptions of their living conditions (IIUE). However, despite its availability it remains an under-explored issue. Why do you think is that? Would you be interested in exploiting the PCBS data on coping strategies? There are two main concerns about the available data – both in PCBS surveys and others – which, in my opinion, constrain its exploitation. On the one hand, the data sets are not longitudinal household data but repeated cross-sections. On the other hand, the questions of coping strategies are not accompanied by information about the type of risk event/shock they are responding to, the motivation to use certain coping strategies, their intensity of use,

313
household dependence on the strategies, their sustainability and effectiveness. While the first limitation prevent us from accounting for any changes over time, the second limit the use of coping strategy as indicators of household vulnerability to conflict. A way to sort out these limitations could be to analyse coping strategies at the village level by the construction of a panel of villages using the Household Consumption and Expenditures Survey (PECS). This will allow us to account for changes over time and control for conflict information, which will help to understand the coping strategies within their causes and symptoms. Aware of the lack of representativeness of the data at the village level, the analysis will not attempt the modelling of coping strategies but simply empirical observations of the coping strategies used across villages, clustered according to attributes of:
Location: rural, urban, village size, camp, etc. Impact of conflict: location vis-à-vis the Wall, severness of closure, etc. Socio-economic characteristics: poverty, human capital, unemployment, social capital,
etc. This approach is subject to the level of sample attrition, which will determine the number of villages that will integrate the panel data base. What do you think about this way of overcoming the problem of the available data for the purpose of the study? Would the data be available? Do you have other suggestions for approaching the issue? Suggested Issues for Future Study Once the state of art, current issues, methodological and data concerns and suggestions have been introduced and discussed, I would like to propose a list of issues that can be studied using village panel data and can contribute to the understanding of the under-explored ‘Livelihoods in Conflict’ in the oPt.
a) How is the conflict experienced? What are the risk events? b) What is the coping behaviour towards the conflict? What are the coping mechanisms?
How do people combat crisis? c) How do coping strategies differ and behave according to the type and impact of the risk
events? d) The role of human and social capital and networks in coping with conflict. e) The choices to build up household resilience.
What do you think about thes issues? Do you think they are relevant in the case of the oPt. Given the data available, do you think that other issues could be studied? Would you be interested in the exploration of these issues? The Collaboration: Actors and Scenarios While my PhD is about understanding household vulnerability, it also aims to reflect on its practice by observing and participating with the Palestinians in the action process of vulnerability – data, research and policy-making. It is this interest in engaging in an action process of vulnerability which has driven this proposal for collaboration with the PCBS. With the PCBS interested, the following scenarios are suggested

314
for the collaboration, which can take the form of sharing information, skills and resources and carrying out collective actions mainly in the form of publications:
At the moment, I am holding discussions about anchoring my PhD research with the Institue of Development Studies (IDS) within the context of a EU -co-funded programme MICROCON - micro level analysis of violent conflict. The MICROCON programme, with its consortium of partners and associate institutions224, aims to increase the knowledge in the field of conflict analysis in Europe, through the construction of an innovative micro-level, interdisciplinary approach. This approach will promote in-depth understanding of individual and group interactions leading to and resulting from violent mass conflict. The project aims to uncover much-needed fundamentals for better informed domestic, regional and international conflict policy, which places individuals and groups at the centre of their interventions. In order to achieve these aims, MICROCON takes an integrated approach, which will lay the foundations for the development of a new European interdisciplinary research agenda in conflict analysis and policy. The project entails six specific goals: a) to create and develop conceptual breakthroughs in the understanding of micro-level processes that lead to and result form the full cycle of conflict; b) to compile and collect, and develop methods for the collection of qualitative and quantitative data on violent conflict at the individual, household and project levels; c) to advance and develop appropriate theoretical and empirical methods for the analysis of violent mass conflict at the micro level; d) to build and disseminate a constructive narrative on micro level conflict processes for the use of European and international policy-makers and practitioners, which will influence positively and constructively the design of effective and sustainable policy actions throughout the full conflict cycle; e) to train and facilitate the mobility of young researchers in Europe as well as talented researchers in developing countries interested in conflict analysis; f) to manage and support a pan-European team of previously scattered researchers from various social scineces backgrounds to form a coherent project in a fundamental area of social science and research and policy. Since the University of Alicante is a consortium partner, the possibilities for collaborative research between MICROCON and myself within the framework of my PhD are being assessed. The advanced status of the proposal225 limits the integration of new partners and hence the relationships between MICROCON and PCBS will be indirect, within the context of my PhD.
P C B S
MICROCON
Household in Conflict Network
Univer-sity of
Alicante
PhD - Coping
with Conflict
PhD - Coping with Conflict
315
Since I am a self-funded student, I am in cooperation with Dr. Patricia Justino (fellow at IDS and coordinator of the MICROCON programme) and I am actively looking for other funding possibilities for my PhD. PCBS will be considered as a partner in any proposal we might put together in the future. I have been also proposed as an affiliate of the Households in Conflict Network (www.hicn.org), which is a network that brings together researchers interested in the micro-economic and econometric analysis of the relationship between violent conflict and household behaviour. The purpose of the HiCN is to undertake collaborative research into the causes and effects of violent conflicts at the household level. In particular, the researchers affiliated to the network are committed to: characterise various forms of conflict from a household-level perspective; identify channels through which households are affected by conflict-induced shocks; quantify the impact of conflict at the household level; analyse the feedback mechanisms from houshold behaviour to violent conflict, such as the effect of inequality and poverty on the incidence of conflict; develop methods best suited to analyse the impact of conflict on household welfare using household surveys; and derive policy recommendations based on research findings for supporting households and communities affected by conflict. Having introduced the different actors and the type of interactions, I would like to know what PCBS thinks? Does PCBS have any other suggestions for collaboration? Would it be interested in such an association? What about the forms of collaboration – sharing skills, resources and information as well as joint publications? Do you have other conditions to put forward?

316
Appendix 5b: Working Paper Prepared for Discussion with Food Agriculture Organization of the United Nations (FAO) in Jerusalem Understanding Household Vulnerability and Coping Strategies in the Occupied Palestinian
Territories (oPt): Key Issues for Analysis
Silvia Jarauta Bernal, PhD Candidate 22 May 2006
In order to assess the possibilities for a collaboration within the framework of the Food Agriculture Organization of the United Nations (FAO) Food Security Assessment, the following paper aims to introduce key issues that need to be taken into account when analysing household vulnerability and coping strategies in situations of conflict226. Vulnerability: State of the Art There is a gap in the literature on household vulnerability and political conflict. Overall, and including the Israeli-Palestinian conflict, household vulnerability in conflict situations is still explored and understood using ‘lenses’, theoretical frameworks and tools for analysing vulnerability in contexts of natural and economic shocks. However, neither the impact nor a household’s responses to a political crisis are comparable to economic or natural disasters. On the one hand, unlike natural and economic disasters, political conflicts violate, systematically and deliberately, individual and group rights to reproduce and secure an adequate liveilhood by eroding and destroying their political, economic, social and environmental systems as well as blocking and manipulating coping strategies. On the other hand, the fact that risk is endogenous demands the understanding of the coping strategies within their causes and symtoms, i.e as outcomes of an interactive process between oppressor and oppressed. Coping Strategies as Indicators of Vulnerability After a decade of extensively using coping strategies as indicators of food insecurity, it is time to start asking about how useful the concept of coping strategies is, and if used which are the issues that need to be borne in mind:
- Coping strategies is often used as a catch-all term to describe everything that rural producers do over and above primary productive activities. It simply has become a synomym with the socio-economics of the househodld or more recently with livelihood security.
- Focusing on coping strategy in situations of food stress can imply that people do cope
and thus that food insecurity is a transitory phenomenon. At the extreme, all behaviour becomes a coping strategy. For example, pastoralists have lost their means of primary production and indeed have to cope to survive. But it is conceptually confusing to lump the means of subsistence depleated by these persons with pre-planned strategies used by people within a livelihood system to overcome an exceptionally severe episode.
- Furthermore, searching for and monitoring of coping strategies can mask the collapse of
livelihood systems by presupposing that people cope even in subsistence economies
317
which are no longer viable from the point of view of either food or livelihood security. There are places where the combination of agro-climatic conditions, civil war and impoverishment from chronic situations has rendered some groups incapable of surviving, irrespective of current conditions. These are the circumstances under which food insecurity becomes endemic and when producers will need to radically alter their livelihood strategies to survive. And emphasis on coping may blind policy-makers and researchers to the need for a radical re-appraisal of the requirements of people’s livelihoods in marginal areas.
- Coping strategies may be useful in the short-term yet they might be bad for long-term
development. Implicit in the coping strategies is that the entire working life of susbsistence producers is taken up in acquiring food; enabling people to stand still, but preventing them from moving ahead. Growth links are central to the process of adaptation, but rarely included in the analysis of coping behaviour.
- Coping strategies are not necessarily economically or environmentally sustainble. In line
with this concern, coping strategies have been categorized into erosive and non-erosive coping. However, there is not much evidence to show how the trade-offs between subsistence and economic sustainability works in meeting immediate food needs and long-term livelihood needs.
- In opposition to to the advocates of indigenous coping strategies being a more effective
way to combat famine than providing food aid once livelihoods have been eroded, reinforcing coping strategies could lock the people into a vicious circle of subsistence and coping. If, on the other hand, food insurance is provided, this may enable people to be economically active (to take risks, to save, etc.) Thus, whereas there is an economic-efficency argument for guaranteeing food security, over and above the purely humanitarian issue, reinforcing coping strategies may be economically inefficient because they will reinforce the risk-averse survival orientation of poor people. Indeed, it might be argued that the focus on short-term alleviation and the allied notion of coping create the very conditions of dependency rural producers are often blamed for having.
Having said this, it can be argued that coping strategies are very useful as contextual items of information which inform about how people are making trade-offs but not as clear indicators of something going wrong, i.e. household vulnerability. If coping strategies are to be useful indicators of food stress the following aspects should be explored:
- Information about the specific shocks the household is responding to - The motivations or reasons to choose one strategy or the other - The intensity of the coping strategy used - Effectiveness of the coping strategy in meeting food and livelihood needs - Sustainability of the chosen strategies
However, it is not enough to understand when and why people use certain coping strategies. Thre is also the issue about where to draw the line between behaviour that is principally driven by food stress (coping227) and that which is motivated by the need to fundamentally alter the mix of activities required for subsistence (adapting228). This distinction is important for two main reasons. Firstly, it makes them usable as indicators and, secondly, it really shapes the policy options. While coping strategies indicate that if livelihood systems are given a low-level one-off support action, it is possible to to provide security for those who depend on them. However, adaptive strategies imply that livelihood systems are moving towards a new equilibrium (or not), necessitating that external support responds to the much more basic constraints encountered in such processes.

318
However, although there are useful distinctions - erosive (survival strategies) and non-erosive dissaccumulation (coping strategies); proactive-positive (accumulation strategies and adaptive strategies) and reactive-defensive (coping and survival strategies) – it is impossible to demarcate with any certainty or rigour, which makes any clasification somewhat artificial:
- The mere fact of using a strategy (or sequence) can indicate nothing about food stress because some people use it all the time and some others for only parts of the year. This can be overcome if a historical perspective is incorporated.
- The timing of use might change depending on how evolved the process of adaptation is. - The reasons for uptake will depend on the mix of strategies available. This mix is
determined by the characteristics of the strategies and the phase of the adaptation process.
- The fact that livelihood systems are diverse and are in constant adaptation poses an added difficulty to monitoring systems based on coping strategies.
- Although the activities may remain the same, the reason for using them, and the timing and frequency of use may change. At any given moment in a country, one person’s coping strategy may be another´s adaptive strategy.
- The shift between coping and adaptive strategies is ocurring all the time. Coping strategies are always pursued inquisitively, so that, if they don’t demonstrate that a better option than current behaviour exist, they are taken up as permanent activities.
One way to resolve the problem is to use rigid temporal cut-off points to differentiate coping strategies from other household behaviour. For example, in the oPt strategies have been differentiated between those that aim to protect food consumption and others, based on the overall believe that food is the most basic human need, within a hierarchy of concerns. However, this distinction has been challenged by the sustainable-livelihood-security approach, which shifts food security to being a piece in a jigsaw of immediate and long-term needs, and blurs even more the boundaries between food-stress-driven and livelihood needs. The complexity of human livelihoods and their multiple interactions between all factors interplaying in these livelihoods, makes it very difficult to establish clear-cut off categories. Data and Methodological Concerns and Suggestions One of the main challenges to understanding conflict from a micro-level perspective is the absence of adequate data sets. This partially results from the focus of traditional security studies by the state and state agencies. There are, in addition, a number of difficulties associated with the collection of data in conflict areas, not least of which are the destruction associated with violence and potential ethical and security challenges to research in areas of conflict. Experience with data analyses that attempt to come to grips with conflict on the micro level produces a number of methodological challenges, such as representativeness or selection effects. However, since adequate data sets are not available, efforts are needed to develop methods of analysis that can overcome these limitations and still provide sound analysis. Fortuntately in the oPt there are available data on household coping mechansisms. Specificially coping strategies questions can be found in the following surveys: Palestinian Expenditure and Consumption Survey & Poverty (PCBS), Impact of the Israeli Measures on the economic status of the Palestinians (PCBS), Impact on the wall on socioeconomic conditions of the Palestinians (PCBS), Coping strategies among the WFP-beneficiaries (WFP), Palestinian public Perceptions on their living conditions (IIUE). There are two main concerns about the data available – both in PCBS surveys and others – which, in my opinion, constrain their exploitation. On the one hand, the data sets are not longitudinal household data but repeated cross-sections. On the other hand, the questions of coping strategies are not accompanied by information about the specific shocks they are

319
responding to, motivation to use certain coping strategies, their intensity of use, household dependence on the strategy, their sustainability and effectiveness. While the first limitation prevent us from accounting for any changes over time, the second limit the use of coping strategy as indicators of household vulnerability to conflict. If coping strategies are to be used as indicators of vulnerability, the above-mentioned questions need to be addressed.

320
Appendix 6: Question Grid for Interviews Questions for interview How is the daily life under occupation? How does the occupation constrain your life? Economic, politically, socially, human… What do you do to overcome the problems of the occupation? For example, if you havent been paid what are you doing to overcome this? How has your life changed? Economic crisis (basic needs and unexpected expenditure) Are you employed? Where? And since when? Have you been paid recently? Before this crisis, what was your situation? What is the difference in your current situation? Eating less and worse Reducing the meals of adults in favour of children Going to eat somewhere else Sending the children to eat somewhere else Using life savings Migration Selling household items Selling productive assets Selling jewellry Put more family members to work Returning to self-suffiency agriculture – growing things in your garden Borrowing money Buying on credit Finding other jobs – diversification of income sources Asking for help from friends, neighbours, family Getting humanitarian aid Move to your family house, or with another brother… Delaying payment of bills Reducing social activities Reducing the cost of children education Reducing health expenditures (Jerusalemites have insurance) Reducing expenditure, to become more self-sufficient Bartering Changing nature of job Adapting your job location towards mobility constraints – localization of services and economic activities. Is the situation getting worse? Do people have less and less? Are you thinking ahead? Do you have any plans? Socially, how do you face the occupation? Who do you live with? Where does your (extended) family live? Do you see them often? On what occasions? Who are your neighbours? How is your relationship with your neighbours? How does the occupation affect your social relationships? Do you live close to your family and friends? Why did you decide to have children, despite the present situation? Why do you think that, despite the bad economic situation, people continue to have children? Are you closer to your friends? Family? Neighbours? Have you got help from them recently? What exactly? Have you helped others? Do you still celebrate life-cycle events? Politically, how do you face the occupation? Are you involved in collective action? Organizations? Or something else? What do you do there? Objectives, activities? What are the resources? Do you boycott Israeli products? Have you decided to stay and not to migrate? Physical presence Do you confront the IDF directly? How? Have you thought of becoming a martyr? Is this your house? Do you have a construction permit? Can we say that your mobility, regardless of the closure, is a political action? Or just economic? Have you been in jail? What did jail mean to you? Human? Human: Are you/any family member ill? Is someone in your family chronically ill? What is your level of education? Do your children go to school? Do you feel depressed? Sad? Fustrated? Tired? Exhausted? Empowered? Stronger? How long can you handle the situation like this? What makes you keep going? From where do you get the power to continue?
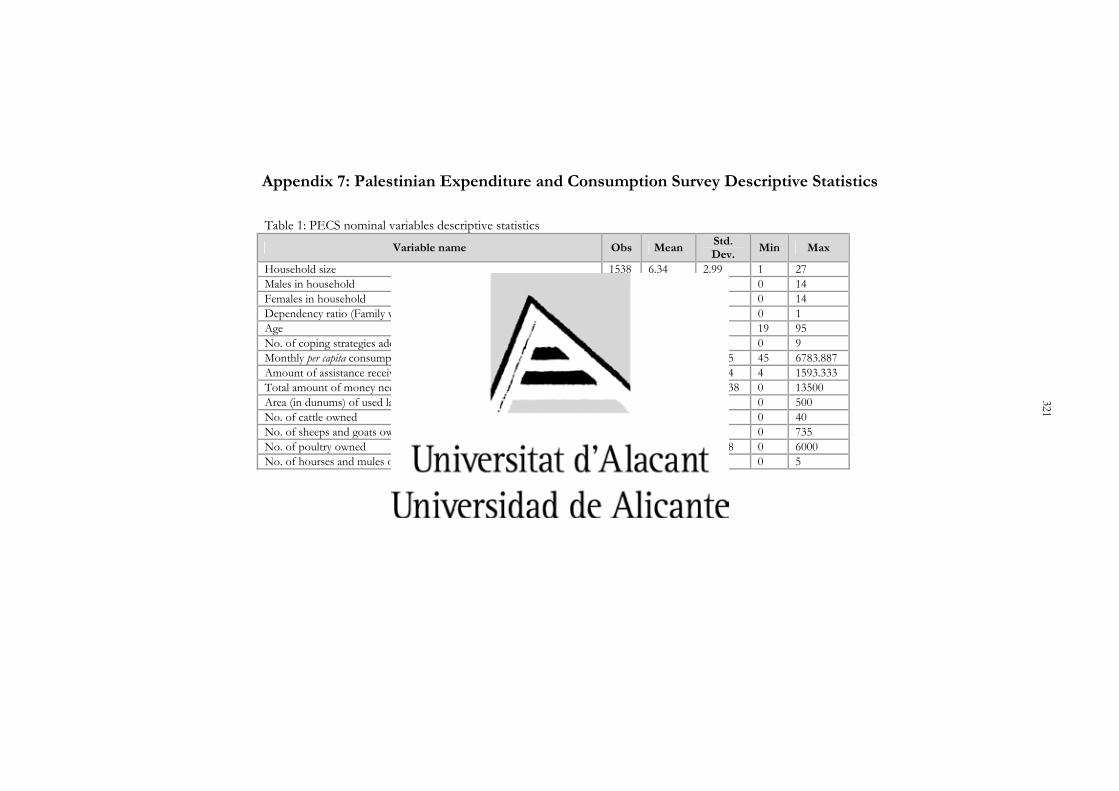
321
Appendix 7: Palestinian Expenditure and Consumption Survey Descriptive Statistics
Table 1: PECS nominal variables descriptive statistics
Variable name Obs Mean Std. Dev. Min Max
Household size 1538 6.34 2.99 1 27 Males in household 1538 3.17 1.85 0 14 Females in household 1538 3.16 1.76 0 14 Dependency ratio (Family working members/Family size) 1538 .22 0.13 0 1 Age 1538 45.01 14.20 19 95 No. of coping strategies adopted 1538 3.95 1.62 0 9 Monthly per capita consumption 1538 649.69 493.95 45 6783.887 Amount of assistance received during current month (in NIS) 287 115.07 205.64 4 1593.333 Total amount of money needed to satisfy basic needs (in NIS) 1517 2569.89 1470.38 0 13500 Area (in dunums) of used land 592 9.81 34.35 0 500 No. of cattle owned 386 .260 1.75 0 40 No. of sheeps and goats owned 408 8.59 26.87 0 735 No. of poultry owned 429 43.97 374.48 0 6000 No. of hourses and mules owned 396 .240 0.57 0 5

322
Table2: PECS selected categorical variables descriptive statistics
Variables description Frequencies (percentage) Variables description Freq. % Variables description Freq. % Variables description Freq. %
Village residence type Refugee status HH Do you do another job Yes (10) No (90) Coping strategies used Urban 49 Registered refugee 30 Poverty (2.1$ per person per
day)Yes (24) No (76) Dependence on family income Yes (89) No (9) Na (1)
Rural 45 Non-registered refugee 1 Deep poverty (1.6$) Yes (14) No (86) Obtaining assistance from friends and family Yes (14) No (86) Refugee camp 6 Non-refugee 69 Own poverty assessment Using savings Yes (32) No (59) Na (9) Governorate Employment status HH Very poor 4 Using savings in Israeli Banks Yes (0) No (59) Na (41) Jenin 13 Part-time employed 6 Poor 14 Selling availabel durable goods Yes (1) No (99) Na (0)
Tubas 2 Fully employed 62 Middle 68 Selling jewellry Yes (9) No (88) Na (3) Tulkarem 9 Does not work 6 Good 14 Borrowing from banks /financial institutions Yes (0) No (96) Na (4) Nablus 17 Unemployed 16 Land ownership Yes (42) No (58) Reducinge expenditure Yes (69) No (31) Qalqilya 5 Housewife 5 Land use Borrowing money informally Yes (41) No (59) Salfit 3 Unable to work 5 Agriculture 82 Working in farming or breeding livestock Yes (29) No (57) Na (15) Ramallah 15 Type of employment HH Building 4 Selling or mortgaging land or house Yes (1) No (89) Na (10)
Jericho 2 Employer 7 Unused land 6 Sending family student member to work Yes (4) No (79) Na (17) Bethlehem 9 Self-employed 29 Other 3 Sending family non-student member to work Yes (6) No (90) Na (4) Hebron 24 Employee 0 Livestock ownerhsip Searching for other work Yes (26) No (72) Na (2) Sex household head (HH) Family work 62 Yes 28 Postponing payment of bills Yes (73) No (27) Male 91 Sector of employment HH No 72 Durables goods Female 9 National private 63 Type of house tenure Car Yes (29) No (71)
Marital status HH Foreign private 14 Owned 85 Refrigerator Yes (93) No (7) Never married 2 Government 14 Rented 9 Solar boiler Yes (66) No (34) Legally married 0 Foreign government 0 Without payment 6 Washing machine Yes (88) No (12) Currently married 90 NGO 1 For work 0 Cooking stove Yes (98) No (2) Divorced 0 International organization 2 Other 0 Dishwasher Yes (2) No (98) Widowed 7 Outside 6 Received remittances Yes (6) No (94) Central heating Yes (3) No (97)
na 1 Work place HH Home production Yes (10) No (90) Vacuum cleaner Yes (23) No (76) Education status HH Home 1 Coping span Library Yes (19) No (81) Illiterate 9 Same locality 44 Don’t know 13 TV Yes (95) No (5) Read & write 18 Same governorate 31 In danger 8 Video Yes (17) No (83) Elementary 26 Other governorate 9 < 4 motnhs 19 Phone line Yes (40) No (60) Preparatory 22 Israel 14 4-7 months 10 Mobile Yes (53) No (47)
Secondary 10 Settlement 1 7-12 months 15 Internet Yes (5) No (95) Diploma and above 15 Abroad 0 >12 months 35 Computer Yes (25) No (75)

323
Appendix 8: Welfare Profiles
Table 1. Relationship between monthly per capita consumption and other household characteristics
Mean Median Standard Error Chi-square statistic Age 36.8681*
Lowest 25% of the data 634.87 521.45 23.44 From 26 to 50% of the data 546.76 456.62 19.18 From 51 to 75% of the data 595.69 503.50 22.33 Highest 76% of the data 836.90 621.84 41.59
Household size 262.52* Lowest 25% of the data 947.49 759.66 38.03 From 26 to 50% of the data 645.11 583.11 18.97 From 51 to 75% of the data 514.26 450.50 15.92 Highest 76% of the data 402.05 371.32 14.42
Proportion of young men 100.93* Lowest 33% of the data 704.50 564.01 22.08 From 34 to 66% of the data 635.06 518.54 25.21 Highest 76% of the data 536.68 452.92 18.98
Dependency rate (working member/family size) 103.36* Lowest 25% of the data 604.92 441.31 33.56 From 26 to 50% of the data 545.18 475.41 16.06 From 51 to 75% of the data 650.80 579.84 25.02 Highest 76% of the data 882.10 734.23 36.87
Sex of the household head 197.77* Male 623.62 509.30 13.31 Female 928.91 656.53 76.34
Refugee status of hh 13.65 Refugee 634.22 499.52 22.78 Non-refugee 654.75 529.36 17.73
Educaitonal status hh 335.44* Illiterate 669.38 532.02 53.89 Functionally illiterate 580.68 471.13 29.20 Elementary 570.22 451.19 25.30 Preparatory 613.93 524.87 22.11 Secondary 662.15 529.36 45.73 Diploma 885.67 748.06 44.13
Employment status hh 198.18* Fully employed 638.73 540.69 14.47 Part-time employed 588.55 449.38 47.32 Unemployed 541.06 435.81 29.23
Employment location 104.34* Same locality 647.40 524.95 20.63 Same governorate 635.96 523.79 21.85 Different governorate 579.94 516.71 35.31 Israel 471.31 409.56 25.81 Settlement 591.14 507.84 69.10
Employment sector hh 103.77* State company 625.79 516.75 16.07 Foreigh company 508.62 414.87 28.55 Government 698.67 616.81 31.30
Land ownership 7.35 Yes 653.69 547.23 22.58 No 646.85 503.17 17.89
Livestock owernship 163* Yes 562.90 456.18 22.45 No 684.96 562.42 17.37
Maximum coping period 998.09* > 12 months 828.62 664.60 29.49 4-12 months 579.67 462.1 22.18 < 4 months 549.28 451.19 25.76 In danger 436.28 340.26 32.68
Note: * = Significant at the 0.1 per cent level
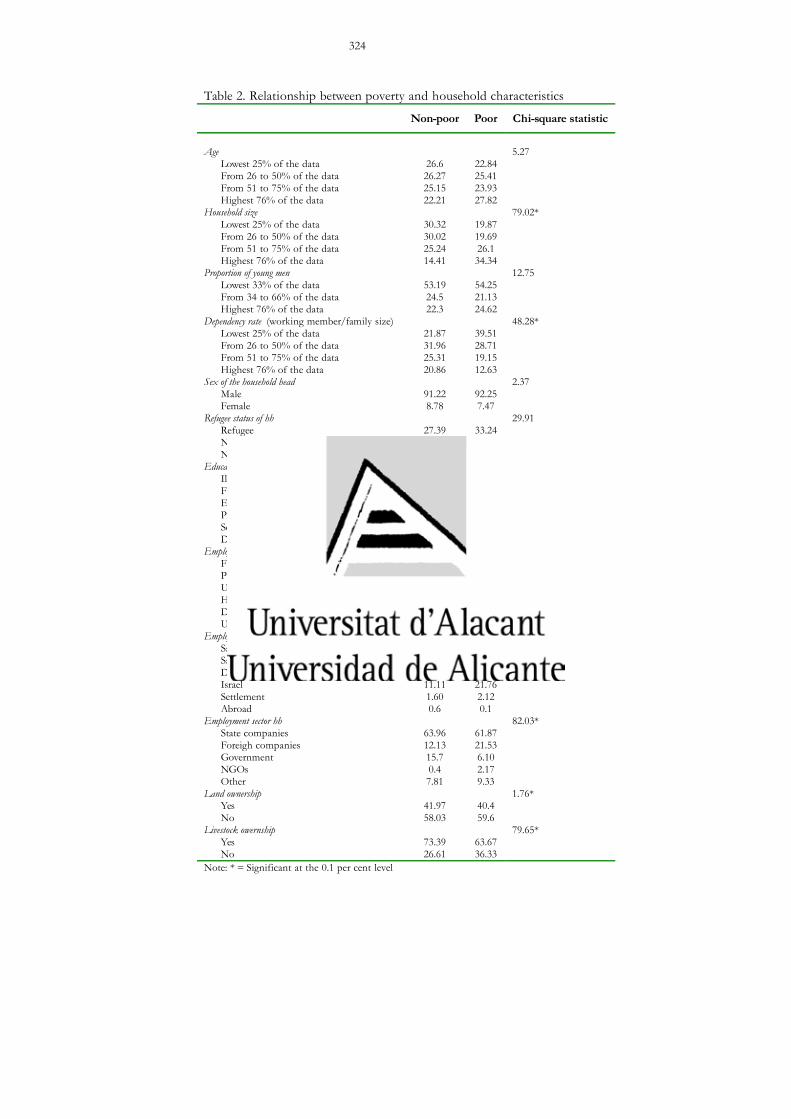
324
Table 2. Relationship between poverty and household characteristics
Non-poor Poor Chi-square statistic
Age 5.27
Lowest 25% of the data 26.6 22.84 From 26 to 50% of the data 26.27 25.41 From 51 to 75% of the data 25.15 23.93 Highest 76% of the data 22.21 27.82
Household size 79.02* Lowest 25% of the data 30.32 19.87 From 26 to 50% of the data 30.02 19.69 From 51 to 75% of the data 25.24 26.1 Highest 76% of the data 14.41 34.34
Proportion of young men 12.75 Lowest 33% of the data 53.19 54.25 From 34 to 66% of the data 24.5 21.13 Highest 76% of the data 22.3 24.62
Dependency rate (working member/family size) 48.28* Lowest 25% of the data 21.87 39.51 From 26 to 50% of the data 31.96 28.71 From 51 to 75% of the data 25.31 19.15 Highest 76% of the data 20.86 12.63
Sex of the household head 2.37 Male 91.22 92.25 Female 8.78 7.47
Refugee status of hh 29.91 Refugee 27.39 33.24 Non-registered refugee 1.69 1.27 Non-refugee 70.92 65.48
Educaitonal status hh 329.76* Illiterate 7.91 15.07 Functionally illiterate 14.31 20.59 Elementary 23.86 34.29 Preparatory 23.57 17.2 Secondary 11.97 6.93 Diploma 18.38 5.914
Employment status hh 172.26* Full-employed 66.04 49.43 Part-time employed 5.59 8.028 Unemployed 13.55 22.91 Housewife 4.27 4.33 Does not work 5.42 9.53 Unable to work 5.ºº 5.8
Employment location 51.39* Same locality 42.94 38.1 Same governorate 33.14 28.2 Different governorate 8.16 8.93 Israel 11.11 21.76 Settlement 1.60 2.12 Abroad 0.6 0.1
Employment sector hh 82.03* State companies 63.96 61.87 Foreigh companies 12.13 21.53 Government 15.7 6.10 NGOs 0.4 2.17 Other 7.81 9.33
Land ownership 1.76* Yes 41.97 40.4 No 58.03 59.6
Livestock owernship 79.65* Yes 73.39 63.67 No 26.61 36.33
Note: * = Significant at the 0.1 per cent level

325
Table 3. Relationship between maximum coping period and other household characteristics
>12 monts
4-12 motnhs
<4 months
In danger
Chi-square statistic
Age 12.60 Lowest 25% of the data 22.61 27.29 27.59 19.51 From 26 to 50% of the data 27.78 24.79 26.37 23.74 From 51 to 75% of the data 25.44 25.15 24.09 30.68 Highest 76% of the data 24.18 22.76 21.96 26.06
Household size 20.97 Lowest 25% of the data 30.13 28.28 26.09 23.22 From 26 to 50% of the data 28.82 25.17 26.73 27.15 From 51 to 75% of the data 26.77 25.38 24.4 21.64 Highest 76% of the data 14.28 21.17 22.77 27.98
Proportion of young men 64.19 Lowest 33% of the data 54.48 51.14 52.62 62.36 From 34 to 66% of the data 24.65 22.99 25.45 20.33 Highest 76% of the data 20.88 25.88 21.93 17.31
Dependency rate (working member/family size) 128.85* Lowest 25% of the data 14.4 21.9 36.58 52.9 From 26 to 50% of the data 33.4 33.03 28.45 21.64 From 51 to 75% of the data 25.69 29.16 21.82 14.94 Highest 76% of the data 26.5 15.91 13.18 10.53
Sex of the household head 39.14 Male 92.07 93.82 89.5 89.91 Female 7.93 6.17 10.5 10.19
Refugee status of hh 60.65 Refugee 26.88 29.71 32.2 32.91 Non-registered refugee 2.26 0.86 1.7 1.81 Non-refugee 70.86 69.43 66.05 62.27
Educaitonal status hh 888.69* Illiterate 6.11 9.56 12.51 16.62 Functional illiterate 9.56 18.09 17.01 23.2 Elementary 18.5 30.35 32.95 27.21 Preparatory 21.82 22.68 17.97 18.49 Secondary 14.5 9.05 12.88 6.63 Diploma 29.5 10.27 6.86 7.83
Employment status hh 527.61* Full-employed 73.32 63.51 56.27 34.85 Partial employed 4.89 8.55 4.89 7.86 Unemployed 7.25 15.06 20.76 33.49 Housewife 3.69 1.98 5.74 6.01 Does not work 6.78 5.29 7.12 7.04 Unable to work 4.04 5.59 5.19 10.74
Employment location 173.82* Same locality 49.03 42.67 34.68 34.1 Same government 32.79 34.99 29.1 27.83 Different government 9.42 5.58 13.02 3.66 Israel 6.33 12.74 18.38 30.49 Settlements 1.34 1.63 1.24 1.20 Abroad 0.30 0.67 0.76 1.29
Employment sector hh 214.62* National companies 65.49 65.19 57.81 57.02 Foreigh companies 7.282 13.46 17.06 30.11 Government 21.05 11.32 12.44 1.77 NGO 1.21 0.89 0 1.38 Other 4.24 8.63 11.29 8.51
Land ownership 47.86 Yes 45.69 40.18 41.8 35.71 No 54.31 59.82 58.2 64.29
Livestock owernship 120.15 Yes 25.91 28.32 38.22 31.33 No 74.09 71.68 61.78 68.67
Note: * = Significant at the 0.1 per cent level
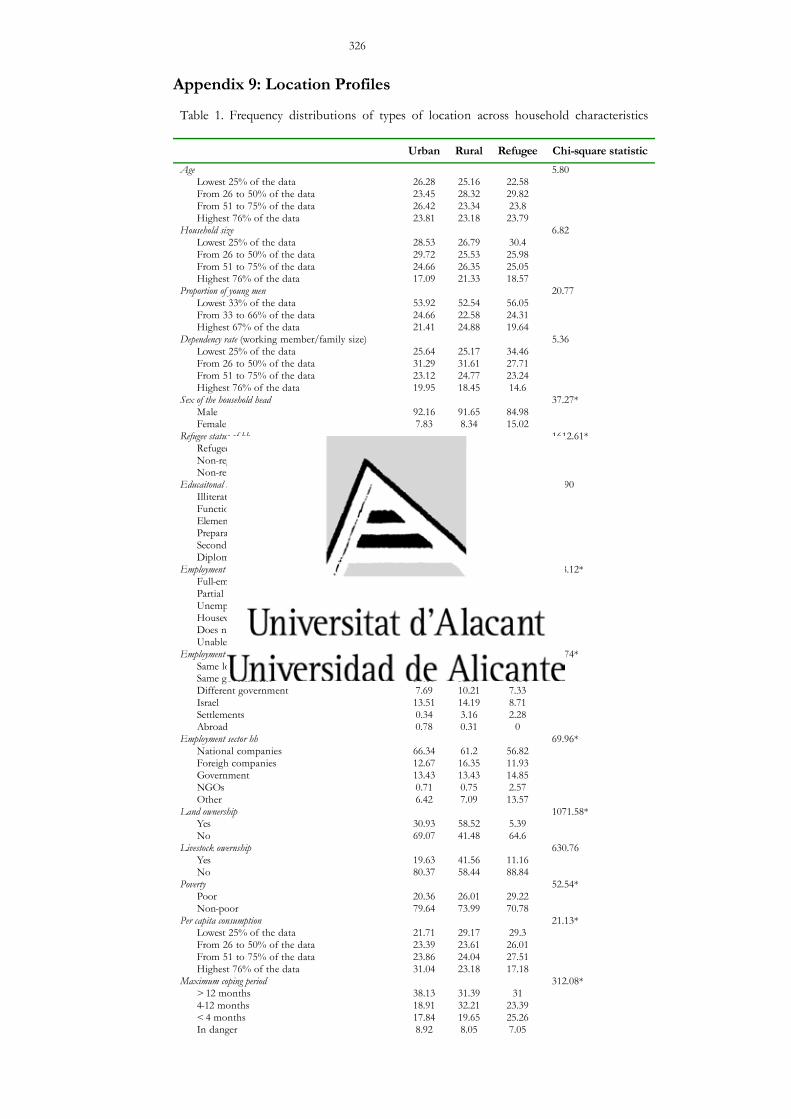
326
Appendix 9: Location Profiles
Table 1. Frequency distributions of types of location across household characteristics
Urban Rural Refugee Chi-square statistic Age 5.80
Lowest 25% of the data 26.28 25.16 22.58 From 26 to 50% of the data 23.45 28.32 29.82 From 51 to 75% of the data 26.42 23.34 23.8 Highest 76% of the data 23.81 23.18 23.79
Household size 6.82 Lowest 25% of the data 28.53 26.79 30.4 From 26 to 50% of the data 29.72 25.53 25.98 From 51 to 75% of the data 24.66 26.35 25.05 Highest 76% of the data 17.09 21.33 18.57
Proportion of young men 20.77 Lowest 33% of the data 53.92 52.54 56.05 From 33 to 66% of the data 24.66 22.58 24.31 Highest 67% of the data 21.41 24.88 19.64
Dependency rate (working member/family size) 5.36 Lowest 25% of the data 25.64 25.17 34.46 From 26 to 50% of the data 31.29 31.61 27.71 From 51 to 75% of the data 23.12 24.77 23.24 Highest 76% of the data 19.95 18.45 14.6
Sex of the household head 37.27* Male 92.16 91.65 84.98 Female 7.83 8.34 15.02
Refugee status of hh 1612.61* Refugee 27.5 20.12 96.89 Non-registered refugee 1.96 1.29 0.91 Non-refugee 70.54 78.58 2.19
Educaitonal status hh 51.90 Illiterate 8.58 10.03 14.07 Functional illiterate 15.74 15.54 17.83 Elementary 26.68 26.54 22.01 Preparatory 20.31 23.24 27.18 Secondary 11.93 9.88 8.52 Diploma 16.76 14.78 10.39
Employment status hh 138.12* Full-employed 62.59 62.37 57.24 Partial employed 5.5 7.54 1.76 Unemployed 16.97 14.77 13.4 Housewife 4.86 2.96 8.98 Does not work 6.76 5.53 9.35 Unable to work 3.30 6.81 9.26
Employment location 76.74* Same locality 46.72 37.58 33.34 Same government 30.18 32.19 46.31 Different government 7.69 10.21 7.33 Israel 13.51 14.19 8.71 Settlements 0.34 3.16 2.28 Abroad 0.78 0.31 0
Employment sector hh 69.96* National companies 66.34 61.2 56.82 Foreigh companies 12.67 16.35 11.93 Government 13.43 13.43 14.85 NGOs 0.71 0.75 2.57 Other 6.42 7.09 13.57
Land ownership 1071.58* Yes 30.93 58.52 5.39 No 69.07 41.48 64.6
Livestock owernship 630.76 Yes 19.63 41.56 11.16 No 80.37 58.44 88.84
Poverty 52.54* Poor 20.36 26.01 29.22 Non-poor 79.64 73.99 70.78
Per capita consumption 21.13* Lowest 25% of the data 21.71 29.17 29.3 From 26 to 50% of the data 23.39 23.61 26.01 From 51 to 75% of the data 23.86 24.04 27.51 Highest 76% of the data 31.04 23.18 17.18
Maximum coping period 312.08* > 12 months 38.13 31.39 31 4-12 months 18.91 32.21 23.39 < 4 months 17.84 19.65 25.26 In danger 8.92 8.05 7.05

327
Do not know 16.19 8.69 13.28 Note: * = Significant at the 0.1 per cent level
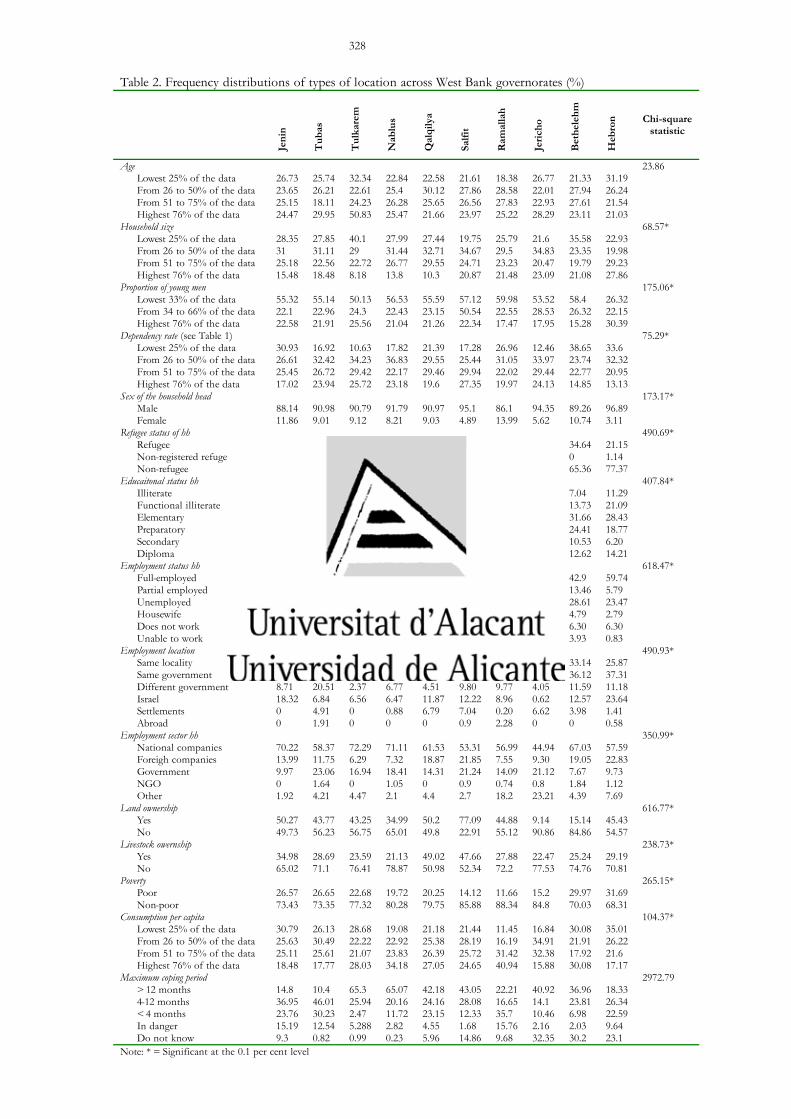
328
Table 2. Frequency distributions of types of location across West Bank governorates (%)
Jeni
n
Tub
as
Tul
kare
m
Nab
lus
Qal
qily
a
Salfi
t
Ram
alla
h
Jeric
ho
Bet
hele
hm
Heb
ron
Chi-square statistic
Age 23.86 Lowest 25% of the data 26.73 25.74 32.34 22.84 22.58 21.61 18.38 26.77 21.33 31.19 From 26 to 50% of the data 23.65 26.21 22.61 25.4 30.12 27.86 28.58 22.01 27.94 26.24 From 51 to 75% of the data 25.15 18.11 24.23 26.28 25.65 26.56 27.83 22.93 27.61 21.54 Highest 76% of the data 24.47 29.95 50.83 25.47 21.66 23.97 25.22 28.29 23.11 21.03
Household size 68.57* Lowest 25% of the data 28.35 27.85 40.1 27.99 27.44 19.75 25.79 21.6 35.58 22.93 From 26 to 50% of the data 31 31.11 29 31.44 32.71 34.67 29.5 34.83 23.35 19.98 From 51 to 75% of the data 25.18 22.56 22.72 26.77 29.55 24.71 23.23 20.47 19.79 29.23 Highest 76% of the data 15.48 18.48 8.18 13.8 10.3 20.87 21.48 23.09 21.08 27.86
Proportion of young men 175.06* Lowest 33% of the data 55.32 55.14 50.13 56.53 55.59 57.12 59.98 53.52 58.4 26.32 From 34 to 66% of the data 22.1 22.96 24.3 22.43 23.15 50.54 22.55 28.53 26.32 22.15 Highest 76% of the data 22.58 21.91 25.56 21.04 21.26 22.34 17.47 17.95 15.28 30.39
Dependency rate (see Table 1) 75.29* Lowest 25% of the data 30.93 16.92 10.63 17.82 21.39 17.28 26.96 12.46 38.65 33.6 From 26 to 50% of the data 26.61 32.42 34.23 36.83 29.55 25.44 31.05 33.97 23.74 32.32 From 51 to 75% of the data 25.45 26.72 29.42 22.17 29.46 29.94 22.02 29.44 22.77 20.95 Highest 76% of the data 17.02 23.94 25.72 23.18 19.6 27.35 19.97 24.13 14.85 13.13
Sex of the household head 173.17* Male 88.14 90.98 90.79 91.79 90.97 95.1 86.1 94.35 89.26 96.89 Female 11.86 9.01 9.12 8.21 9.03 4.89 13.99 5.62 10.74 3.11
Refugee status of hh 490.69* Refugee 35.98 18.71 31.1 29.98 47.38 7.42 27.8 32.01 34.64 21.15 Non-registered refugee 0.75 0.80 1.46 1.15 8.54 0 1.81 5.65 0 1.14 Non-refugee 63.3 80.49 67.43 68.87 44.07 92.57 70.39 62.33 65.36 77.37
Educaitonal status hh 407.84* Illiterate 13.09 12.8 8.96 6.87 10.04 6.69 7.43 18.45 7.04 11.29 Functional illiterate 10.62 20.73 7.78 14.35 18.85 14.75 15.98 30.33 13.73 21.09 Elementary 26.77 22.49 28.46 22.92 22.58 18.74 25.48 23.96 31.66 28.43 Preparatory 30.75 16.14 16.65 23.61 15.26 25.04 22.76 18.11 24.41 18.77 Secondary 10.79 11.44 17.81 12.87 16.35 11.48 10.52 4.81 10.53 6.20 Diploma 7.97 16.39 20.34 19.38 16.92 23.3 17.82 4.32 12.62 14.21
Employment status hh 618.47* Full-employed 59.13 69.23 77.66 62.25 59.49 69.5 62.88 67.38 42.9 59.74 Partial employed 6.65 3.27 6.07 4.61 5.65 10.07 3.58 4.40 13.46 5.79 Unemployed 14.68 7.86 6.26 9.86 12.93 5.85 12.17 20.81 28.61 23.47 Housewife 4.90 5.16 2.43 4.64 6.79 2.47 5.87 5.24 4.79 2.79 Does not work 6.65 81.6 4.35 7.61 8.9 8.1 3.79 0.57 6.30 6.30 Unable to work 7.97 6.29 3.19 6 6.22 3.99 11.69 1.58 3.93 0.83
Employment location 490.93* Same locality 54.19 47.47 54.94 54.76 61.9 49.82 30.55 37.81 33.14 25.87 Same government 18.77 18.36 34.05 30.29 14.05 20.22 41.41 50.27 36.12 37.31 Different government 8.71 20.51 2.37 6.77 4.51 9.80 9.77 4.05 11.59 11.18 Israel 18.32 6.84 6.56 6.47 11.87 12.22 8.96 0.62 12.57 23.64 Settlements 0 4.91 0 0.88 6.79 7.04 0.20 6.62 3.98 1.41 Abroad 0 1.91 0 0 0 0.9 2.28 0 0 0.58
Employment sector hh 350.99* National companies 70.22 58.37 72.29 71.11 61.53 53.31 56.99 44.94 67.03 57.59 Foreigh companies 13.99 11.75 6.29 7.32 18.87 21.85 7.55 9.30 19.05 22.83 Government 9.97 23.06 16.94 18.41 14.31 21.24 14.09 21.12 7.67 9.73 NGO 0 1.64 0 1.05 0 0.9 0.74 0.8 1.84 1.12 Other 1.92 4.21 4.47 2.1 4.4 2.7 18.2 23.21 4.39 7.69
Land ownership 616.77* Yes 50.27 43.77 43.25 34.99 50.2 77.09 44.88 9.14 15.14 45.43 No 49.73 56.23 56.75 65.01 49.8 22.91 55.12 90.86 84.86 54.57
Livestock owernship 238.73* Yes 34.98 28.69 23.59 21.13 49.02 47.66 27.88 22.47 25.24 29.19 No 65.02 71.1 76.41 78.87 50.98 52.34 72.2 77.53 74.76 70.81
Poverty 265.15* Poor 26.57 26.65 22.68 19.72 20.25 14.12 11.66 15.2 29.97 31.69 Non-poor 73.43 73.35 77.32 80.28 79.75 85.88 88.34 84.8 70.03 68.31
Consumption per capita 104.37* Lowest 25% of the data 30.79 26.13 28.68 19.08 21.18 21.44 11.45 16.84 30.08 35.01 From 26 to 50% of the data 25.63 30.49 22.22 22.92 25.38 28.19 16.19 34.91 21.91 26.22 From 51 to 75% of the data 25.11 25.61 21.07 23.83 26.39 25.72 31.42 32.38 17.92 21.6 Highest 76% of the data 18.48 17.77 28.03 34.18 27.05 24.65 40.94 15.88 30.08 17.17
Maximum coping period 2972.79 > 12 months 14.8 10.4 65.3 65.07 42.18 43.05 22.21 40.92 36.96 18.33 4-12 months 36.95 46.01 25.94 20.16 24.16 28.08 16.65 14.1 23.81 26.34 < 4 months 23.76 30.23 2.47 11.72 23.15 12.33 35.7 10.46 6.98 22.59 In danger 15.19 12.54 5.288 2.82 4.55 1.68 15.76 2.16 2.03 9.64 Do not know 9.3 0.82 0.99 0.23 5.96 14.86 9.68 32.35 30.2 23.1
Note: * = Significant at the 0.1 per cent level

329
Appendix 10: Methodology of Village Closure Index
The village closure index has been constructed in order to measure the degree of closure between the
village and its natural centre, which is defined as the closest village with a hospital.
Closure is determined by the permit system, which is enforced by checkpoints, physical obstacles,
the type of road used, where these are located and the number of alternative roads that have been
cleared to avoid checkpoints. Given the fact that just 0.1% of Palestinians and 7% of the licensed
vehicles hold the Special Movement Permit at Internal Checkpoints in Judea and Samaria, it has been assumed
that the presence of checkpoints automatically constrains the movement regardless of the permit. In
addition, it is well-known that while the possession of a permit eases travel and reduces the risk of
being turned back at a checkpoint, it does not guarantee either passing through or even fair
treatment.
Checkpoints can be established permanently or sporadically (flying checkpoints); manned full-time
or intermittently; located along the Green Line (external checkpoints) or within the West Bank
(internal checkpoints); and placed on prohibited or restricted roads. Although these location and
operation checkpoints characteristics are supposed to be the determinants of the degree of closure
exercised, the reality is that checkpoints are opened in a arbitrary manner. This is one of the reasons
why there are more and more Palestinians that do not apply for permits anymore. Besides
checkpoints, the following physical obstacles restrict the vehicle movement within the West Bank:
An earth mound is a pile of rubble, dirt and/or rocks.
A roadblock is a series of 1 metre concrete blocks
A trench is a ditch
A road gate is a metal gate, often manned by the Israeli Defence Forces (IDF)
An observation tower is an elevated military tower.
A road barrier is a metal fence along restricted roads.
Earth walls are continuous series of earth mounds

330
Roadblocks are mostly placed obstructing the intersection between a checkpoint-controlled road and
a Palestinian village so that Palestinian vehicles are forced to pass through the checkpoint. Besides
contributing to the effectiveness of the checkpoint network, the roadblocks are also placed to make
people movement difficult, as movement becomes more costly and time consuming. Pedestrians,
unlike motor vehicles, are generally able to bypass the roadblocks, primarily when soldiers are not
present. However, they have to get out of the car, cross by foot and get into another vehicle. This
exercise has to be repeated as many times.
A further integral part of the intra-government closure system is the restrictive road system, which
denies or heavily restricts the Palestinian use of certain roads within the oPt in favour of the “safe”
travelling of the settlers. The following table introduces the four main types of roads operating
within the restricted West Bank road system (See Appendix 3 for details on the road network),
classified according to the enforcing method (checkpoints, roadblocks and patrols) or the nature of
the restrictions imposed (total, partial and none):
Table 1: Type of roads according to its passage requirements and enforcement instruments Road type Passage requirements: Enforcement by: Extension &
Location Remarks
Forbidden Roads
Forbidden to Palestinian vehicles*
Staffed checkpoints along the route and roadblocks obstructing the access to secondary roads leading to Palestinian villages
124 km – 17 roads or sections of roads mostly in area C
Sometimes not only is travelling along the road forbidden but also crossing the road. In these cases, Palestinians have to get out of the car, cross the road by foot and get into another vehicle.
Partially- Prohibited Roads
Only Palestinians holding the Special Movement Permit at Internal Checkpoints in Judea and Samaria and Palestinians whose identity cards indicate that their place of residency is accessible through these roads
As above
244 km – 10 roads or sections of roads mostly in area C
Restricted Roads Palestinians without a permit As above.
364 km – 14 roads or sections of roads mostly in area C
Despite free passage, the long waiting times at the checkpoints, the heavy presence of Israeli police patrolling and strictly enforcing traffic laws against Palestinians with heavy fines and confiscation of vehicles discourage Palestinians from using these roads.
Free Roads Palestinians Some roadblock. and
flying checkpoints
The remainder of the roads. -located in aresa A and B.
A military order prohibits the Israelis civilians from entering areas A and B.
* Palestinian vehicles that have license plates issued by the Palestinian Authority (green plates). It does not apply to Palestinians in vehicles with Israeli (yellow) plates. The Arab Israelis as well as the Palestinians living in Jerusalem have their cars with yellow licensed plates at they are issued by the Government of Israel. Source: B’Tselem (2004)

331
Much like the entire permit and closure system, the road regime has no clear basis in law and is the
culmination of military orders229, informal decision processes and the caprice of the Israeli authority
commanding officer responsible for the area in which the policy operates (Al Haq 2005). The
regime does not prevent movement of Palestinians in the oPt in and out of itself. Rather it makes
using privately owned Palestinian vehicles to travel freely within the oPt impossible.
The four categories constitute the number of alternative roads available. However, since they are in
continuous change it is very difficult to monitor them and hence to take them into account in the
construction of the index. Besides, their integration into the index would require a description of
the topography of the village, which, however, would considerably help determine the degree of
vehicular and pedestrian movement.
Based on these determinants it has been assumed that firstly, Palestinians generally want to avoid
checkpoints either because they don’t hold a permit when required or because they want to avoid
the long waiting time or the humiliation that often takes place at the checkpoint. Secondly, the
main road is preferred as it is better paved and it is a faster route. Based on the above-mentioned
determinants and assumptions, the following closure index has been constructed to measure the
degree of movement restrictions imposed on the main and most direct routes and on identifiable
alternative secondary roads connecting the village with its natural centre. The natural center has
been defined as the closest town or village with a hospital. It coincides almost always with the
governorate capital. In the case of the governorate capital the village index equals 0.
Table 2: Movement restrictions index
1st Road 2nd road Score Explanations Legend
0 People and vehicles will use the main road.
∆ 0 People and vehicles will use the main road.
∆ 1
Private vehicles (including trucks) are forced to use a secondary road. People will travel by public transport on the main road. In this case, Palestinians have to get out of the car, cross the roadblock by foot and get into another vehicle.
∆ ∆ 2 People, as above, and trucks will use the back-to-back system (trucks will be off-loaded and then reloaded at the other side of the roadblock.), dramatically increasing transport costs.
� 3 Secondary roads are the only option in order to avoid checkpoints
� ∆ 4 People and private vehicles are forced to use the back-to-back system.
� � 5 People and private vehicle traffic are compulsorily subject to permit possession or check.
= clear road
� = checkpoint
∆ = roadblock

332
The following table provides the status of closure of main (M) and secondary (S) roads as well as the
closure index (R) for each specific sampled village across time. Table 3: Village closure
Village Natural Centre Dec03 Jan 2004 March04 July 2004 November
2004 April 2005 August 2005 January 2006 June 2006
M S R M S R M S R M S R M S R M S R M S R M S R M S RAd Doha Bethlehem 0 0 0 0 0 0 0 0 0 Al 'Aza (Beit Jibrin) RC Bethlehem � 0 � 0 � 0 � 0 � 0 � 0 � 0 � 0 � 0 Ash Shawawra Bethlehem ∆ 1 ∆ � 1 ∆ � 1 ∆ � 1 ∆ � 1 ∆ � 1 � 0 � 0 � 0 'Ayda Camp Bethlehem � 0 � 0 � 0 � 0 � 0 � 0 � 0 � 0 � 0 Beit Jala Bethlehem � 0 � 0 � 0 � 0 � 0 � 0 � 0 � 0 � 0 Beit Sahur Bethlehem � 0 � 0 � 0 � 0 � 0 � 0 � 0 � 0 � 0 Bethlehem Bethlehem � � 0 � 0 � 0 � 0 � 0 � � 0 � Wadi al 'Arayis Bethlehem ∆ ∆ 2 ∆ ∆ 2 ∆ ∆ 2 ∆ ∆ 2 ∆ ∆ 2 � 0 � 0 � 0 � 0 Za'tara Bethlehem ∆ � 1 ∆ � 1 ∆ � 1 ∆ � 1 ∆ � 1 ∆ � 1 � � 0 � � 0 � � 0 Adh Dhahiriya Hebron ∆ ∆ 2 ∆ ∆ 2 ∆ ∆ 2 ∆ ∆ 2 ∆ ∆ 2 ∆ � 1 ∆ � 1 � � 3 � � 3 Al Arrub Camp ∆ � 2 ∆ � 2 ∆ � 2 ∆ � 2 ∆ � 2 ∆ ∆ 2 ∆ ∆ 2 ∆ ∆ 2 ∆ ∆ 2 Al Fawwar Camp Hebron ∆ ∆ 2 ∆ ∆ 2 ∆ ∆ 2 ∆ ∆ 2 ∆ ∆ 2 ∆ ∆ 2 ∆ ∆ 2 � ∆ 4 � ∆ 4 As Samu' Hebron ∆ ∆ 2 ∆ ∆ 2 ∆ ∆ 2 ∆ ∆ 2 � ∆ 4 � ∆ 2 � ∆ 2 � ∆ 4 � ∆ 4 Ash Shuyukh Hebron � ∆ 4 � ∆ 4 � ∆ 4 � ∆ 4 � ∆ 4 ∆ ∆ 2 ∆ ∆ 2 ∆ ∆ 2 ∆ ∆ 2 Beit Kahil Hebron � na 0 � na 0 � na 0 � na 0 � na 0 ∆ na 2 ∆ na 2 ∆ na 2 ∆ na 2 Halhul Hebron ∆ � 2 ∆ � 2 ∆ � 2 ∆ � 2 ∆ � 2 ∆ ∆ 2 ∆ ∆ 2 ∆ ∆ 2 ∆ ∆ 2 Hebron (Al Khalil) Hebron � � 0 � 0 � 0 � 0 � 0 � � 0 � Hitta Hebron ∆ � 1 ∆ � 1 ∆ � 1 ∆ � 1 � � 3 � ∆ 4 � ∆ 4 � ∆ 4 � ∆ 4 Idhna Hebron ∆ � 1 ∆ � 1 ∆ � 1 ∆ � 1 � � 3 � � 3 � � 3 � � 3 � � 3 I'zeiz Hebron ∆ ∆ 2 ∆ ∆ 2 ∆ ∆ 2 ∆ ∆ 2 ∆ ∆ 2 ∆ ∆ 2 ∆ ∆ 2 � ∆ 4 � ∆ 4 Khursa Hebron ∆ ∆ 2 ∆ ∆ 2 ∆ ∆ 2 ∆ ∆ 2 � ∆ 4 � � 3 � � 3 � � 3 � � 3 Sa'ir Hebron � ∆ 4 � ∆ 4 � ∆ 4 � ∆ 4 � ∆ 4 ∆ ∆ 2 ∆ ∆ 2 ∆ ∆ 2 ∆ ∆ 2 Shuyukh al 'Arrub ∆ � 2 ∆ � 2 ∆ � 2 ∆ � 2 ∆ � 2 ∆ ∆ 2 ∆ ∆ 2 ∆ ∆ 2 ∆ ∆ 2 Taffuh Hebron � 0 � 0 � 0 � 0 � 0 � 0 � 0 � 0 � 0 Yatta Hebron ∆ ∆ 2 ∆ ∆ 2 ∆ ∆ 2 ∆ ∆ 2 ∆ ∆ 2 ∆ ∆ 2 ∆ ∆ 2 � ∆ 4 � ∆ 4 Al Judeida (Jadida) Jenin na � ∆ 4 � ∆ 4 � � 3 � � 3 � � 3 ∆ � 1 � 0 � 0 Al Yamun Jenin � � 3 � 0 � 0 ∆ � 1 � 0 � 0 � 0 � 0 Arraba Jenin � ∆ 4 ∆ ∆ 2 ∆ � 1 � ∆ 4 � ∆ 2 � ∆ 2 � 0 ∆ � 1 Ash Shuhada Jenin � ∆ 4 ∆ ∆ 2 ∆ � 1 � 0 � 0 � 0 � 0 � 0 Jaba' Jenin � ∆ 4 ∆ ∆ 2 ∆ � 1 � � 3 � � 3 � � 3 � 0 � 0 Jenin Jenin � � 0 � 0 � 0 � 0 � 0 � � 0 � Jenin Camp Jenin � 0 � 0 � 0 � 0 � 0 � 0 � 0 � 0 Kafr Ra'i Jenin � ∆ 4 ∆ ∆ 2 ∆ � 1 � ∆ 4 � ∆ 4 � ∆ 4 � 0 � 0 Meithalun Jenin � ∆ 4 � ∆ 4 � � 3 � � 3 � � 3 ∆ � 1 � 0 � 0 Ti'innik Jenin � � 3 � 0 � 0 ∆ � 1 � 0 � 0 � 0 � 0 Ya'bad Jenin � ∆ 4 ∆ ∆ 1 ∆ ∆ 1 � ∆ 4 � ∆ 4 � ∆ 4 � ∆ 4 � ∆ 4 Zububa Jenin � � 3 � 0 � 0 � 0 � 0 � 0 � 0 � 0 Al 'Auja Jericho ∆ � 1 ∆ � 1 ∆ � 1 ∆ � 1 � � 3 � � 3 � � 3 � � 3 � � 3 Al Jiftlik Jericho ∆ � 1 ∆ � 1 ∆ � 1 ∆ � 1 � ∆ 4 � ∆ 4 � ∆ 4 � � 5 � � 5 Aqbat Jaber Camp Jericho � 0 � 0 � 0 � 0 � 0 � � 0 � 0 � 0 'Ein ad Duyuk al Fauqa Jericho � 0 � 0 � 0 � 0 � 0 � 0 � 0 � 0 � 0 'Ein ad Duyuk at Tahta � 0 � 0 � 0 � 0 � 0 � 0 � 0 � 0 � 0 'Ein as Sultan Camp Jericho � 0 � 0 � 0 � 0 � 0 � 0 � 0 � 0 � 0 Jericho (Ariha) � � 0 � 0 � 0 � 0 � 0 � � 0 � 'Askar Camp Nablus � � 0 � � 0 � � 0 � � 0 � � 0 � � 0 � � 0 � � 0 � � 0 Balata Camp Nablus � � 0 � � 0 � � 0 � � 0 � � 0 � � 0 � � 0 � � 0 � � 0 Beit Furik Nablus � ∆ 4 � ∆ 4 � ∆ 4 � ∆ 4 � � 5 � � 5 � � 5 � � 5 � � 5 Burin Nablus � ∆ 4 � ∆ 4 � ∆ 4 � ∆ 4 � ∆ 4 � � 4 � � 4 � ∆ 4 � ∆ 4 Huwwara Nablus � ∆ 4 � ∆ 4 � ∆ 4 � ∆ 4 � ∆ 4 � ∆ 4 � ∆ 4 � ∆ 4 � ∆ 4 Ijnisinya Nalbus � ∆ 4 � ∆ 4 � ∆ 4 � ∆ 4 � ∆ 4 � ∆ 4 � ∆ 4 � ∆ 4 � ∆ 4 Kafr Qallil Nablus � � 0 � � 0 � � 0 � � 0 � � 0 � � 0 � � 0 � � 0 � � 0 Nablus � � 0 � 0 � 0 � 0 � 0 � � 0 � Qabalan Nablus � ∆ 4 � ∆ 4 � ∆ 4 � ∆ � ∆ 4 � ∆ 4 � ∆ 4 � ∆ 4 � ∆ 4

333
Table 3: Village closure (continuation) Village Natural
center Dec03 Jan 2004 March04 July 2004 November 2004 April 2005 August 2005 January 2006 June 2006
M S R M S R M S R M S R M S R M S R M S R M S R M S RQusin Nablus � � 5 � � 5 � � 5 � � � � 5 � � 5 � ∆ 4 � ∆ 4 � ∆ 4 Sabastiya Nablus � ∆ 4 � ∆ 4 � ∆ 4 � ∆ 4 � ∆ 4 � ∆ 4 � ∆ 4 � ∆ 4 � ∆ 4 Tell Nablus � ∆ 4 � ∆ 4 � ∆ 4 � ∆ 4 � ∆ 4 � � 5 � � 5 � � 3 � � 3 An Nabi Elyas Qalqilya na � 5 � 5 � 5 � 5 � 5 � 5 � 5 � 5 'Azzun Qalqilya � 5 � 5 � 5 � 5 � 5 � 5 � 5 � 5 Hajja Qalqilya � 5 � 5 � 5 � 5 � 5 � 5 � 5 � 5 'Isla Qalqilya � 5 � 5 � 5 � 5 � 5 � 5 � 5 � 5 Kafr Thulth Qalqilya � 5 � 5 � 5 � 5 � 5 � 5 � 5 � 5 Qalqiliya � � 0 � 0 � 0 � 0 � 0 � � 0 � Al Am'ari Camp Ramallah � 0 � 0 na � 0 � 0 � � 0 � 0 � 0 Al Bireh Ramallah � 0 � 0 � 0 � 0 � � 0 � 0 � 0 Al Jalazun Camp Ramallah ∆ ∆ 2 ∆ ∆ 2 ∆ ∆ 2 � � 5 � � 5 � � 5 � � 5 � � 5 Al Mazra'a ash Sharqiya Ramallah � � 3 � � 3 � � 3 � � 5 � � 5 � � 5 � � 5 � � 5 Al Mughayyir Ramallah � � 3 � � 3 � � 3 � � 5 � � � � 5 � � 5 � � 5 'Arura Ramallah � ∆ 4 � ∆ 4 � ∆ 4 � � 5 � � � � 5 � � 5 � � 5 'Atara Ramallah � ∆ 4 � ∆ 4 � ∆ 4 � � 5 � � � � 5 � � 5 � � 5 Beituniya Ramallah � 0 � 0 � 0 � 0 � � 0 � 0 � 0 Beit Liqya Ramallah � � 5 � � 5 � � 5 � � 5 � � 5 � � 5 � � 5 � � 5 � � 5 Deir Ibzi' Ramallah ∆ ∆ 2 ∆ ∆ 2 ∆ ∆ 2 ∆ � 2 ∆ � 2 � 0 � 0 � 0 Kafr 'Ein Ramallah � na 5 � na 5 � na 4 � na 5 � na � na 5 � na 5 � na 5 Qarawat Bani Zeid Ramallah � na 5 � na 5 � na 4 � na 5 � na � na 5 � na 5 � na 5 Ramallah � � 0 � 0 � 0 � 0 � 0 � � 0 � Silwad Ramallah � ∆ 4 � ∆ 4 � ∆ 4 � � 5 � � � � 5 � � 5 � � 5 Silwad Camp Ramallah � ∆ 4 � ∆ 4 � ∆ 4 � � 5 � � � � 5 � � 5 � � 5 Biddya Salfit � ∆ 4 � ∆ 4 � ∆ 4 � ∆ 4 � � 5 � � 5 � � 5 � � 5 � � 5 Deir Istiya Salfit � ∆ 4 � ∆ 4 � ∆ 4 � ∆ 4 � � 5 � na 5 � na 5 � na 5 � na 5 Farkha Salfit � 0 � 0 � 0 � 0 � 0 � 0 � 0 � 0 � 0 Kafr ad Dik Salfit � 0 � 0 � 0 � 0 � 0 � 0 � 0 � 0 � 0 Kifl Haris Salfit � ∆ 4 � ∆ 4 � ∆ 4 � ∆ 4 � � 5 � na 5 � na 5 � na 5 � na 5 Mas-ha Salfit � ∆ 4 � ∆ 4 � ∆ 4 � ∆ 4 � � 5 � � 5 � � 5 � � 5 � � 5 Qarawat Bani Hassan Salfit � ∆ 4 � ∆ 4 � ∆ 4 � ∆ 5 � � 5 � na 5 � na 5 � na 5 � na 5 Salfit Salift � � 0 � 0 � 0 � 0 � 0 � � 0 � Yasuf Salfit ∆ na 2 ∆ na 2 � 0 � 0 � na 5 � na 5 � na 5 � na 5 � na 5 'Aqqaba Tubas � 0 � 0 � 0 � 0 � 0 � 0 � 0 � 0 � 0 El Far'a Camp Tubas � 0 � 0 � 0 � 0 � 0 � 0 � 0 � 0 � 0 Ras al Far'a Tubas � 0 � 0 � 0 � 0 � 0 � 0 � 0 � 0 � 0 Tammun Tubas � 0 � 0 � 0 � 0 � 0 � 0 � 0 � 0 � 0 Tayasir Tubas � 0 � 0 � 0 � 0 � 0 � 0 � 0 � 0 � 0 Tubas Jenin ∆ ∆ 2 ∆ ∆ 2 ∆ ∆ 2 ∆ ∆ 2 ∆ � 1 ∆ � 1 ∆ � 1 � � 0 � � 0 An Nazla al Gharbiya Tulkarem � � 0 ∆ � 0 � 0 � 0 � 0 � 0 � 0 � 0 � 0 'Anabta Tulkarem ∆ � 1 ∆ � 1 ∆ � 1 � 0 � 0 � 0 � 0 � 0 � 0 Dhinnaba Tulkarem � 0 � 0 � 0 � 0 � 0 � 0 � 0 � 0 � 0 Far'un Tulkarem � 0 � 0 � 0 � 0 � 0 � 0 � 0 � 0 � Nur Shams Camp Tulkarem � 0 � 0 � 0 � 0 � 0 � 0 � 0 � 0 � 0 Qaffin Tulkarem � na 5 ∆ na 2 � 0 � 0 ∆ na 2 ∆ na 2 � 0 � 0 � 0 Tulkarm Tulkarem � � 0 � 0 � 0 � 0 � 0 � � 0 � Tulkarm Camp Tulkarem � � 0 � 0 � 0 � 0 � 0 � � 0 �

334
Appendix 11 : Conflict Variables Descriptive Statistics
Table 1: Conflict descriptive statistics Variable Obs Mean St. Dev. Min Max No. Palestinians killed by governorate 2000-2004 10 131.4 115.92 2 371 No. Palestinians killed by governorate 2004 10 31.4 55.1 0 177 No. Palestinians killed by village 2000-2004 100 10.85 26.08 0 158 No. Palestinians killed by village 2004 100 1.42 5.10 0 37 No. Palestinians injured by governorate 2000-2004 9 1939.2 1506.59 294 5035 No. Palestinians injured by governorate 2004 9 186.3 162.12 36 478 No. hours under curfew by governorate 2000-2004 10 20037.5 13191.76 126 55143 No. hours under curfew by governorate 2004 10 620.6 492.14 6 1555 No. hours under curfew by village 2000-2004 100 1142.65 1867.15 0 9763 No. hours under curfew by village 2004 100 30.94 62.08 0 355 No. obstacles 2003 10 68.1 52.34 4 179 No. obstacles 2004 10 72.49 60.68 5 209 Village closure Index 2003 100 1.862 1.80 0 4 Village closure index 2004 100 1.876 1.85 0 5 Village Wall enclosure 2003 100 0.27 0.66 0 3 Village Wall enclosure 2004 100 0.28 0.66 0 3 Area of land confiscated for Wall 10 25.69 30.16 0 70.46 Dummy village within 1km of Wall 2003 100 Yes(18) No (82) Dummy village within 1km of Wall 2003 100 Yes (19) No (81)

335
Table 2: Conflict descriptive statistics* across governorates Jenin Tubas Tulkarem Nablus Qalqilya Salfit Ramallah Jericho Bethlehem Hebron
Variables Sum/ Mean St.Dev. Sum/
MeanSt.De
v. Sum/ Mean St.Dev. Sum/
Mean St.De
v. Sum/ Mean St.Dev. Sum/
Mean St.Dev. Sum/ Mean St.Dev. Sum/
MeanSt.De
v. Sum/ Mean St.Dev. Sum/
Mean St.Dev
. No. Injured by governorate 2000-04 2241 na 1209 3016 1315 294 5035 359 1220 2764 No. Injured by governorate 2001 1555 1555 725 1050 978 63 3951 312 988 1856 No. Injured by governorate 2002 381 381 304 878 171 9 590 5 135 422 No. Injured by governorate 2003 181 181 138 610 107 2 103 6 34 222 No. Injured by governorate 2004 124 124 42 478 59 220 391 36 63 264 No. Killed by governorate 2000-04 262 37 173 371 55 25 129 2 97 162 No. Killed by governorate 2001 61 10 42 81 20 14 43 2 40 60 No. Killed by governorate 2002 124 21 69 162 20 6 65 0 43 62 No. Killed by governorate 2003 37 5 34 59 8 2 10 0 10 27 No. Killed by governorate 2004 40 2 28 69 7 3 11 0 4 13 No. hours curfew by governorate 2002-02 21775 3504 49935 55143 7123 4330 15182 2126 27699 15662 No. hours curfew by governorate 2002 15461 3192 38492 41998 5059 3216 12297 24 20530 7786 No. hours curfew by governorate 2003 5578 288 10974 11590 1672 708 2242 96 5891 7079 No. hours curfew by governorate 2004 736 24 469 1555 392 406 643 6 1278 697 Dummy village within 1 km of Wall 2000-04 0.166 0.577 0 0 0.75 1.03 0 0 1.33 1.03 0.444 0.88 0.466 0.83 0 0 1.111 1.05 0 0
Dummy village within 1 km of Wall 2003 0.083 0.28 0 0 0.375 0.517 0 0 0.666 0.51 0.222 0.44 0.2 0.41 0 0 0.55 .52 0 0 Dummy villages within 1 km of Wall 2004 0.083 0.28 0 0 0.375 0.517 0 0 0.666 0.51 0.222 0.44 0.26 0.45 0 0 0.55 .52 0 0 No. obstacles by governorate 2003-2004 126.75 9 76 239 76 112.75 159.75 30.5 193.75 0 388.25 No. obstacles by governorate 2003 60 4 40 119 36 70 65 13 95 179 No. obstacles by governorate 3004 66.75 5 36 120 40 42.75 94.75 17.5 98.75 209.25 Village Closure Index 2003-04 3.86 2.824 0.66 1.62 1.06 2.45 5.52 4.11 8.332 4.082 4.944 4.1 5.526 3.941 0.745 1.27 0.88 1.44 3.62 2.35 Village Closure Index 2003 1.93 1.41 0.33 0.81 0.75 1.75 2.75 2.05 4.166 2.041 2.444 1.943 2.733 1.944 0.285 0.48 0.44 0.72 1.75 1.18 Village Closure Index 2004 1.93 1.41 0.33 0.81 0.31 0.70 2.77 2.06 4.166 2.041 2.5 2.157 2.793 1.997 0.46 0.79 0.44 0.72 1.87 1.17 Village Wall Enclosure 2003-04 0.33 1.154 0 0 1.75 2.48 0 0 2.33 2.338 0.44 0.88 0.33 0.72 0 0 1.55 1.66 0 0 Village Wall Enclosure 2003 0.16 0.57 0 0 0.87 1.24 0 0 1.16 1.16 0.222 0.440 0.13 0.35 0 0 0.77 .83 0 0 Village Wall Enclosure 2004 0.16 0.57 0 0 0.87 1.24 0 0 1.16 1.16 0.222 0.440 .2 0.41 0 0 0.77 .83 0 0 Note *: Means apply for non-categorical data. Sum are calculated for categorical data. Standard deviations are calculated for the conflict variables at the village level

336
Appendix 12: Conditional Associations between Farming and Violence
Table 1: Percentage of use1 of farming across village violence intensities for different groups of households2 Village Violence intensity3
1st order control variables Category Low Medium High
Poor 44 40 15 Poverty line Non-poor 35 38 10
Same locality 49 39 10 Location of employment of household head (hh) Same governorate 25 31 5
Unemployed 29 32 13 Employment status (hh) Full-time employed 49 39 10
State company 38 35 9 Employment sector (hh) Government employee 31 39 8
Medium 31 29 10 Household size3
High 43 53 5
Illiterate 42 63 12 Education (hh) High 39 40 12
Sex (hh) Male 39 41 10
Yes 58 60 31 Land ownership No 14 19 6
Yes 69 75 42 Livestock ownership No 19 11 6
Urban 22 46 9 Location type Refugee camp 1 5 8
Village distance to the governorate capital3 Medium 44 26 29
Jenin 48 54 19
Tulkarem 44 40 15 Governorate Nablus 35 25 7
Note 1: As a matter of simplification, this table does not include the three categories of the risk management strategy (used, not used, not applicable); instead it includes just the category of ‘used’. Since the percentages have been calculated across the strategy variable (used, not used, not applicable) and not across the village conflict intensities, the rows do not add up to 100%. Note 2 The control groups and their respective categories here included are just those that are statistically significant at the 0.05 percent level using the Pearson chi-square test Note 3: Low (lowest 33% of the data), Medium (from 34% to 66% of the data), High (highest 33% of the data).

337
Table 2: Percentage of useof farming across village violence intensities1 for camp dwellers, conditioned to other characteristics2
1st order control variable 2nd order control variables
Poverty Household size3 Education (hh) Sex (hh) Employment
sector (hh) Employment status
(hh) Land/livestock
ownership Distance to
the city3 Governorate Group Category Poor Non-poor Low Medium Illiterate Male Government Employed No Medium Nablus
Location type Refugee camp 0, 12, 17 1, 3, 3 0, 0, 5 3, 7, 11 0, 0, 8 1, 6, 9 0, 0, 0 1, 0, 10 1, 5, 8 0, 0, 27 0, X, 6 Note 1: The percentages of strategy use across village violence intensities are written in the form of ‘a, b, c’, where ‘a’ represents the percentage of strategy use in low violence-affected villages; ‘b’ the percentage of strategy use across medium violence-affected villages; and ‘c’ represents the percentage of strategy use in highly violence-affected villages. The villages violence intensities have been calculated based on three cut-off points: i) Low (lowest 33% of the data), medium (from 34% to 66% of the data), high (highest 33% of the data) Note 2: All the variables included in Table 1 of this Appendix are considered as second-order control variables. However, the ones included here are only those that are statistically significant at 0.05%. Note 3: Low (lowest 33% of the data), medium (from 34% to 66% of the data), high (highest 33% of the data). Note X: There is no observations Table 3: Percentage of use of farming across village violence intensities1 for non-poor, conditioned to other characteristics2
1st order control variable 2nd order control variables
Location type Household size3 Education (hh) Sex (hh) Employment sector (hh) Employment
status (hh) Job location Land/livestock ownership Governorate
Group Category Urban Low Medium Illiterate High Male State
company Government Employed Same locality
Same governorate Yes No Nablus Jenin Tulkarem
Poverty Non-poor 23, 47, 8 31, 29, 10 42, 49, 5 36, 42, 19 31, 42, 1 36, 42, 8 35, 34, 7 32, 48, 8 36, 39, 7 46, 34, 9 23, 32, 2 54, 63, 29 23, 21, 9 32, 26, 5 47, 80, 22 41, 40, 3 See notes to Table 2 of this Appendix Table 4: Percentage of use of farming across village violence intensities1 for medium-sized families, conditioned to other characteristics2
1st order control variable 2nd order control variables
Location type Poverty status Education (hh) Sex (hh) Employment sector (hh) Employment
status (hh) Job location Land/livestock ownership Governorate
Group Category Urban Poor Non-
poor Illiterate High Male State company
Government Employed Same
locality Same
governorate Yes No Nablus Jenin Tulkarem
Family size Medium 33, 65, 5 46, 60, 7 42, 49, 5 48, 82, 9 52, 52, 0 44, 51, 6 47, 53, 6 33, 0, 0 47, 59, 5 58, 48, 6 24, 36, 3 59, 79, 19 29, 33, 5 47, 0. 4 44, 100, 0 55, 67,4
See notes to Table 2 of this Appendix

338
Table 5: Percentage of use of farming across village violence intensities1 for families not owning livestock, conditioned to other characteristics2
1st order control variable 2nd order control variables
Location type Poverty status Education (hh) Sex (hh) Employment status (hh) Employment
sector (hh) Job location Governorate Group Category
Urban Non-poor High Male Employed Unemployed State company Same locality Jenin Tulkarem
Livestock ownership
No 44, 72, 28 54, 63, 29 49, 64, 4 59, 63, 32 57, 59, 27 53, 68, 66 6, 56, 29 66, 57, 27 69, 56, 62 54, 38, 21
See notes to Table 2 of this Appendix Table 6: Percentage of use of farming across village violence intensities1 for families whose heads work in the same governorate, conditioned to other characteristics2
1st order control variable 2nd order control variables
Land ownership Poverty status Family size3 Sex (hh) Employment sector (hh) Employment status
(hh) Governorate Group Category Yes Non-poor Low Medium Male State company Government Employed Nablus Tulkarem
Job location (hh) Same governorate 16, 15, 4 23, 32, 2 23, 0, 1 20, 35, 3 26, 33, 5 26, 25, 5 22, 72, 4 26, 33, 2 26, 20, 7 26, 67, 2 See notes to Table 2 of this Appendix Table 7: Percentage of use of farming across village violence intensities1 for Jenin residents, conditioned to other characteristics2
1st order control variable 2nd order control variables
Location type Poverty status Land ownership Sex (hh) Employment status (hh) Family size3 Job location Employment sector Group Category Rural Non-poor Yes Male Employed Medium Same locality State company Governorate Jenin 59, X, 33 47, 80, 22 68, 56, 62 50, 50, 2 54, 50, 6 55, X, 12 64, 67, 7 51, 47, 7
See notes to Table 2 of this Appendix Table 8: Percentage of use of farming across village violence intensities1 for families whose heads work in the government, conditioned to other characteristics2
1st order control variable 2nd order control variables
Poverty status Land ownership Group Category Poor no Sector of employment (hh) Government 100, X, 0 6, X, 0
See notes to Table 2 of this Appendix

339
Scheme 1: Frequency of farming and violence across aggregate household characteristics1 (percentage)
Reference case Added conditions
household size Poverty Job location OR Education OR Employment status OR Sector of employment Productive means
Low (53, 44, 30)
Poor
Non-Poor (51, 46, 28)
Village (67, 45, 28)
Employed (51, 37, 17)
State (55, 44, 20)
Owning land or livestock (57, 62, 33)
Medium
(59, 79, 19)
Poor
Village (97, 64, 4)
Illiterate (46, 100, 0)
Non-Poor (56, 77, 17)
Village (58, 57, 17)
Employed (57, 75, 18)
State (55, 78, 18)
High
Poor Employed (79, 55, 86)
Non-Poor
Government (45, 100, 0)
Low (20, 13, 18)
Poor (24, 17, 4)
Illiterate (26, 65, 6) High (11, 0,. 1)
Non-Poor (20, 11, 9)
Village (23, 0, 0)
Employed (18, 9, 5)
State (17, 0, 6)
Not owning land or
livestock (24, 21, 9)
Medium
(29, 34, 5)
Poor
Village (77, 0, 4)
Unemployed (27, 0, 17)
Non-Poor (30, 38, 4)
Village (37, 21, 7)
High (57, 47, 0)
Employed (31, 38, 5)
State (24, 41, 5) Government (32, 0, 0)
High
Poor
Non-Poor
Village (43, 0, 11)
Government (8, 100, 0)
Note 1: The scheme has been developed as follows. First of all, the frequency distributions were calculated on the reference case, which was built around the characteristics: land/livestock ownership, household size and poverty status. In a second step, additional variables related to the employment and education status of the household head was added, on an individual basis, to the reference case. The cases that contain the frequency percentages are only those that are statistically significant at 0.05 % using the Pearson Chi-square test. The percentages of farming across village violence intensities are written in the form of ‘a, b, c’, where ‘a’ represents the percentage of use of farming in low-violence villages; ‘b’ the percentage of use of farming across medium-violence villages; and ‘c’ represents the percentage of use of farming in high-violence villages. The villages violence intensities – low, medium high – have been calculated based on three cut-off points: i) Low (the lowest 33% of the data), Medium (from 34% to 66% of the data), High (the highest 33% of the data).

340
Appendix 13: Conditional Associations between Farming and Village Closure
Table: 1 Percentage of use1 of farming across village closure intensities for different groups of households2 1st order control variables Category Village closure: Low3 Village Closure: Medium3 Village Closure: High3
Poor 20 52 36 Poverty line Non-poor 12 46 38
> 12 months 13 54 42
12-4 months 15 51 40
<4 months 10 55 33 Maximum coping period
In danger 13 29 39
Same governorate 7 38 32 Location of employment of household head (hh) Different governorate 12 45 27
Unemployed 8 36 39 Employment status of hh Full-time employed 14 50 36
State company 12 45 40
Foreign company 26 55 35 Employment sector (hh) Government employee 13 37 34
High 10 40 31
Medium 16 47 29 Dependency ratio (no. working family members/household size)3
Low 13 61 54
Low 10 44 35
Medium 14 45 45 Household size3
High 26 59 38
Illiterate 16 49 46
Functionally illiterate 14 54 50 Education (hh) High 14 59 37
Yes 38 69 54 Land ownership No 6 25 12
Yes 54 75 67 Livestock ownership No 5 27 21
Urban 8 44 26
Rural 36 57 42 Location type Refugee camp 4 12 0
Low 8 35 No observations Village distance to the governorate capital3
Medium 38 54 36
Qalqilya 23 No observations 51 Governorate Rammallah 4 7 26
Note 1: As a matter of simplification, this table does not include the three categories of the risk management strategy (used, not used, not applicable); instead it includes just the category of ‘used’. Since the percentages have been calculated across the strategy variable (used, not used, not applicable) and not across the village conflict intensities, the rows do not add up to 100%. Note 2 The control groups and their respective categories here included are just those that are statistically significant at the 0.05 percent level using the Pearson chi-square test Note 3: Low (lowest 33% of the data), Medium (from 34% to 66% of the data), High (highest 33% of the data). For the dependency ratio, ‘high’ represents the lowest 33% of the data and low the highest 33%.
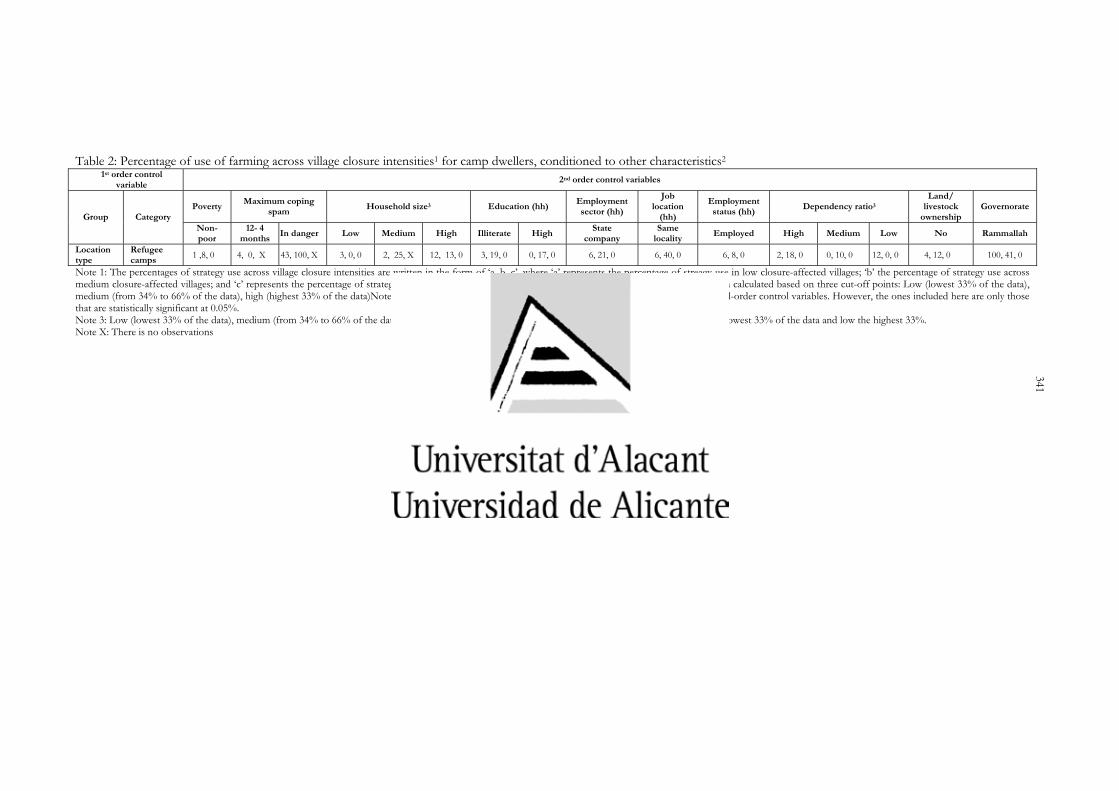
341
Table 2: Percentage of use of farming across village closure intensities1 for camp dwellers, conditioned to other characteristics2
1st order control variable 2nd order control variables
Poverty Maximum coping spam Household size3 Education (hh) Employment
sector (hh) Job
location (hh)
Employment status (hh) Dependency ratio3
Land/ livestock
ownership Governorate
Group Category Non-poor
12- 4 months In danger Low Medium High Illiterate High State
company Same
locality Employed High Medium Low No Rammallah
Location type
Refugee camps 1 ,8, 0 4, 0, X 43, 100, X 3, 0, 0 2, 25, X 12, 13, 0 3, 19, 0 0, 17, 0 6, 21, 0 6, 40, 0 6, 8, 0 2, 18, 0 0, 10, 0 12, 0, 0 4, 12, 0 100, 41, 0
Note 1: The percentages of strategy use across village closure intensities are written in the form of ‘a, b, c’, where ‘a’ represents the percentage of streagy use in low closure-affected villages; ‘b’ the percentage of strategy use across medium closure-affected villages; and ‘c’ represents the percentage of strategy use in highly closure-affected villages. The villages closure intensities have been calculated based on three cut-off points: Low (lowest 33% of the data), medium (from 34% to 66% of the data), high (highest 33% of the data)Note 2: All the variables included in Table 1 of this Appendix are considered as second-order control variables. However, the ones included here are only those that are statistically significant at 0.05%. Note 3: Low (lowest 33% of the data), medium (from 34% to 66% of the data), high (highest 33% of the data). For the dependency ratio, high represents the lowest 33% of the data and low the highest 33%. Note X: There is no observations

342
Appendix 14: Conditional Associations between Farming and Wall Enclosure Intensity
Table 1: Percentage of use1 of farming across village closure intensities for different groups of households2 Village sides enclosed by the Wall 1st order control variables Category
0 1 2 3 Poor 36 30 50 31
Poverty Non-poor 28 12 46 20
> 12 months 29 15 61 11 Maximum coping span < 4 months 36 5 46 8
High 27 8 54 16 Dependency ratio (no. working family members/household size)3 Low 39 12 44 11
Employment status of household head (hh) Unemployed 29 14 55 14
Employment sector (hh) State company 27 76 57 21
Household size3 High 34 18 43 11
Education (hh) Illiterate 37 12 63 14
Yes 55 39 74 34 Land ownership No 25 34 18 4
Livestock ownership No 14 3 3 8
Urban 21 5 no observations 19 Location type Refugee camps 6 0 0 no observations
Low 7 2 0 19 Village distance to the governorate capital3 High 41 16 76 no observations
Tulkarem 27 25 60 17
Qalqilya 52 62 20 21
Salfit 49 11 no observations no observations Governorate
Bethlehem 37 16 0 no observations
Note 1: As a matter of simplification, this table does not include the three categories of the risk management strategy (used, not used, not applicable); instead it includes just the category of ‘used’. Since the percentages have been calculated across the strategy variable (used, not used, not applicable) and not across the village conflict intensities, the rows do not add up to 100%. Note 2 The control groups and their respective categories here included are just those that are statistically significant at the 0.05 percent level using the Pearson chi-square test Note 3: Low (lowest 33% of the data), Medium (from 34% to 66% of the data), High (highest 33% of the data). For the dependency ratio, high represents the lowest 33% of the data and low, the highest 33% of the data.

343
Table 2: Percentage of use of farming across village Wall closure intensities1 for households not owning land, conditioned to other characteristics2
1st order control variable 2nd order control variables
Poverty line Education (hh)
Distance to the city3 Governorate Group Category
Poor Illiterate Low Salfit Bethlehem
Land ownership No 14, 21, 0, 8 14, 0, 0, 25 4, 2, 0, 15 35, 0, X, X 22, 13, 0, X
Note 1: The percentages of strategy use across village wall closure intensities are written in the form of ‘a, b, c, d’, where ‘a’ represents the percentage of strategy use in villages enclosed by the Wall by 1 side; ‘b’ represents the percentage of strategy use in villages enclosed by the Wall by 2 sides; ‘c’ represents the percentage of strategy use in villages enclosed by the Wall by 3 sides; ‘d’ represents the percentage of strategy use in villages enclosed by the Wall by 4 sides. Note 2: All the variables included in Table 1 of this Appendix are considered as second-order control variables. However, the ones included here are only those that are statistically significant at 0.05%. Note 3: Low (lowest 33% of the data), medium (from 34% to 66% of the data), high (highest 33% of the data). Note X: There is no observations
Table 3: Percentage of use of farming across village Wall closure intensities1 for Qalqilya residents, conditioned to other characteristics2
1st order control variable 2nd order control variables
Poverty line Maximum coping period Dependency ratio3 Location type Group Category
Non-poor Poor > 12 months High Urban
Governorate Qalqilya
54, 60, 40, 23 44, 75, 0, 20 67, 73, 20, 17 51, 80, 25, 12 43, X, X, 23
See notes to Table 2 of this Appendix

344
Appendix 15: Conditional Associations between Adjusting Household Labour Supply (AHLS) and Village Closure Intensity
Table 1: Percentage of use1 of AHLS across village closure intensities for different groups of households2 Village Closure Intensity3
1st order control variables Category Low Medium High
Poverty line Non-Poor 22 18 27
< 4 months 22 23 34 Maximum coping period In danger 31 38 17
Employment status of hh Unemployed 34 32 44
Employment sector (hh) Foreign company 34 39 35
High 24 21 30 Dependency ratio (no. working family members/household size)3 Low 22 32 33
Age (hh) 3 Medium 25 21 27
Land ownership Yes 20 21 31
Livestock ownership No 23 20 23
Rural 20 24 30 Location type Refugee camp 32 20 30
Low 22 26 27 Village distance to the governorate capital3 High 31 24 26
Governorate Rammallah 28 5 16
Note 1: As a matter of simplification, this table does not include the three categories of the risk management strategy (used, not used, not applicable); instead it includes just the category of ‘used’. Since the percentages have been calculated across the strategy variable (used, not used, not applicable) and not across the village conflict intensities, the rows do not add up to 100%. Note 2 The control groups and their respective categories here included are just those that are statistically significant at the 0.05 percent level using the Pearson chi-square test Note 3: Low (lowest 33% of the data), Medium (from 34% to 66% of the data), High (highest 33% of the data). For the dependency ratio, high represents the lowest 33% of the data and low, the highest 33% of the data.

345
Table 2: Percentage of use of AHLS across village closure intensities1 for camp dwellers conditioned, to other characteristics2
1st order control variable 2nd order control variables
Poverty Maximum coping period Dependency ratio3 livestock ownership Governorate Group Category
Non-poor > 4 months Danger Low No Rammallah
Location type Refugee camps residents 27, 17, 50 47, 10, 50 39, 16, X 38, 13, 50 31, 18, 30 55, 18, 30
Note 1: The percentages of strategy use across village closure intensities are written in the form of ‘a, b, c’, where ‘a’ represents the percentage of strategy use in low closure-affected villages; ‘b’ the percentage of strategy use across medium closure-affected villages; and ‘c’ represents the percentage of strategy use in highly closure-affected villages. The villages closure intensities have been calculated based on three cut-off points: Low (lowest 33% of the data), medium (from 34% to 66% of the data), high (highest 33% of the data). Note 2: All the variables included in Table 1 of this Appendix are considered as second-order control variables. However, the ones included here are only those that are statistically significant at 0.05%. Note 3: For the variable ‘dependency ratio’: High (lowest 33% of the data), medium (from 34% to 66% of the data), Low (highest 33% of the data). Note X: There is no observations
Table 3: Percentage of use of AHLS across village closure intensities1 for households living far from the city, conditioned to other characteristics2
1st order control variable 2nd order control variables
Poverty Dependency ratio3 Livestock ownership Employment sector (hh) Group Category3 Non-Poor High No Foreign company
Distance to the city High 38, 20, 26 51, 23, 25 35, 18, 18 37, 35, 35
See notes to Table 2 of this Appendix
Table 4: Percentage of use of AHLS across village closure intensities1 for households, whose coping period has been exhausted and are in danger, conditioned to other characteristics2
1st order control variable 2nd order control variables
Poverty Dependency ratio3 Employment status (hh) Livestock ownership Location type Group Category Non-poor High Employed No Refugee camp
Maximum coping period In danger
42, 30, 17 31, 37, 22 47, 78, 23 31, 39, 7 39, 16, X
See notes to Table 2 of this Appendix

346
Appendix 16: Conditional Associations between AHLS and Wall Enclosure Intensity
Table 1: Percentage of use1 of AHLS across village wall closure intensities for different groups of households2 Villages sides enclosed by the wall 1st order control variables Category
0 1 2 3 Poor 29 60 18 12
Poverty Non-poor 24 27 14 4
> 12 months 21 19 18 2
12 – 4 months 26 62 13 11 Maximum coping spam In danger 31 39 0 0
High 26 30 12 0 Dependency ratio (no. working family members/household size)3 Medium 23 39 17 6
Employment status of household head (hh) Employed 25 35 16 5
Employment sector (hh) National company 27 30 19 5
Employment location(hh) Same locality 29 33 12 6
25th quartile (small) 17 21 22 1 Household size3 75th quartile 37 60 6 14
Education (hh) Illiterate 26 47 12 14
Age3 (hh) High 34 40 4 12
Land ownership No 25 34 18 4
Livestock ownership No 24 31 14 2
Urban 25 28 No observations 5 Location type Rural 26 49 14 No observations
Low 26 21 22 5 Village distance to the governorate capital3 High 25 54 20 No observations
Jenin 33 No observations 18 No observations
Rammallah 15 30 No observations No observations Governorate Bethlehem 16 39 22 No observations
Note 1: As a matter of simplification, this table does not include the three categories of the risk management strategy (used, not used, not applicable); instead it includes just the category of ‘used’. Since the percentages have been calculated across the strategy variable (used, not used, not applicable) and not across the village conflict intensities, the rows do not add up to 100%. Note 2 The control groups and their respective categories here included are just those that are statistically significant at the 0.05 percent level using the Pearson chi-square test Note 3: Low (lowest 33% of the data), Medium (from 34% to 66% of the data), High (highest 33% of the data). For the dependency ratio, high represents the lowest 33% of the data and low, the highest 33% of the data.

347
Table 2: Percentage of use of human diversification across village wall closure intensities1 for the most vulnerable households, conditioned to other characteristics2
1st order control variable 2nd order control variables
Poverty Dependency ratio3 Land ownership
Livestock ownership Location type Governorate Group Category
Non-poor Poor High Medium No No Urban Rural Rammallah
Maximum coping period
Cannot cope any longer (in danger) 31, 31, 0, 0 32, 62, 0, 0 33, 44, 0, 0 22, 100, 0, 0 30, 21, 0, 0 30, 39, 0, 0 46, 42, X, 0 15, 0, 0, X 6, 40, X, X
Note 1: The percentages of strategy use across village wall closure intensities are written in the form of ‘a, b, c, d’, where ‘a’ represents the percentage of strategy use in villages enclosed by the Wall by 1 side; ‘b’ represents the percentage of strategy use in villages enclosed by the Wall by 2 sides; ‘c’ represents the percentage of strategy use in villages enclosed by the Wall by 3 sides; ‘d’ represents the percentage of strategy use in villages enclosed by the Wall by 4 sides. Note 2: All the variables included in Table 1 of this Appendix are considered as second-order control variables. However, the ones included here are only those that are statistically significant at 0.05%. Note X: There is no observations Table 3: Percentage of use of human diversification across village wall closure intensities1 for long-term copers, conditioned to other characteristics2
1st order control variable 2nd order control variables
Poverty Employment sector (hh) Employment location (hh) Land
ownership Livestock ownership Location type
Group Category Non-poor State
company Same locality No No Urban
Maximum coping period > 12 months 21, 18, 19, 2 22, 26, 13, 2 27, 26, 14, 2 22, 20, 17, 13 20, 17, 22, 1 20, 16, X, 0
See notes to Table 2 of this Appendix Table 4: Percentage of use of human diversification across village wall closure intensities1 for big-sized families, conditioned to other characteristics2
1st order control variable 2nd order control variables
Poverty line Maximum
coping period
Education (hh) Land ownership Location type Governorate Distance to the city3
Group Category3
Poor 12.4 months Illiterate No Rural Bethlehem Jenin Rammallah Medium
Family size
High 39, 74, 10, 0 38, 7, 0, 6 34, 68, 0, 16 36, 59, 0, 0 38, 72, 7, X 14, 65, 0, X 72, X, 0, X 13, 58, X, X 38, 79, 33, X
See notes to Table 2 of this Appendix Table 5: Percentage of use of human diversification across village wall closure intensities1 for small-sized families, conditioned to other characteristics2
1st order control variable 2nd order control variables
Poverty line Maximum coping period
Dependency atio3 Land ownership Livestock
ownership Location
type Governorate Distance to the city3 Group Category3
Non-Poor 12.4 months High No No Urban Bethlehem Low Family size
Low 18, 21, 21, 0 20, 52, 43, 0 14, 16, 19, 0 17, 21, 23, 1 16, 21, 20, 1 18, 19, X, 1 18, 22, 31, X 17, 15, 31, 1
See notes to Table 2 of this Appendix

348
Appendix 17: Conditional Associations between Obtaining Assistance from Family & Friends (AFF) and Violence
Table 1: Percentage of use1 of the strategy of obtaining assistance from family and friends across village violence intensity for different groups of households2 Violence3
1st order control variables Category Low Medium High
Poor 16 5 33 Poverty line Non-poor 11 8 16
< 4 months 16 1 3 Maximum coping period In danger 19 12 56
Location of employment of household head (hh) Same governorate 11 8 13
Employment status of hh Unemployed 11 15 34
Employment sector (hh) Foreign company 7 6 24
Small 14 10 21 Household size3 High 8 3 18
Dependency ratio (no. working family members/household size)3
High 16 11 41
Education (hh) High 11 10 15
Sex (hh) Male 11 5 17
Land ownership No 15 5 21
Livestock ownership No 13 8 20
Urban 8 0 18 Location type Refugee camp 18 4 24
Low 7 5 17 Village distance to the governorate capital3 High 10 1 42
Medium 13 1 30 Village population size3 High 5 0 17
Jenin 19 0 49
Tulkarem 19 40 11
Salfit 13 No observations 42
Rammallah 5 2 34 Governorate
Hebron 4 0 6
Note 1: As a matter of simplification, this table does not include the three categories of the risk management strategy (used, not used, not applicable); instead it includes just the category of ‘used’. Since the percentages have been calculated across the strategy variable (used, not used, not applicable) and not across the village conflict intensities, the rows do not add up to 100%. Note 2 The control groups and their respective categories here included are just those that are statistically significant at the 0.05 percent level using the Pearson chi-square test Note 3: Low (lowest 33% of the data), Medium (from 34% to 66% of the data), High (highest 33% of the data). For the dependency ratio, high represents the lowest 33% of the data and low, the highest 33% of the data.

349
Table 2: Percentage of use of the strategy of AFF across village violence intensity1 for Tulkarem residents, conditioned to other characteristics2
1st order control variable 2nd order control variables
Poverty Maximum coping period
Household size3
Employment sector (hh)
Location type
Village population
size3 Group Category
Non-Poor Danger Low Foreign company Urban High Governorate Tulkarem 13, 14, 6 100, 100, 0 26, 43, 11 0, 100, 25 30, X, 0 20, X, 43
Note 1: The percentages of strategy use across village violence intensities are written in the form of ‘a, b, c’, where ‘a’ represents the percentage of strategy use in low violence-affected villages; ‘b’ the percentage of strategy use across medium violence -affected villages; and ‘c’ represents the percentage of strategy use in highly violence-affected villages. The villages violence intensities have been calculated based on three cut-off points: Low (lowest 33% of the data), medium (from 34% to 66% of the data), high (highest 33% of the data). Note 2: All the variables included in Table 1 of this Appendix are considered as second-order control variables. However, the ones included here are only those that are statistically significant at 0.05%. Note 3: Low (lowest 33% of the data), medium (from 34% to 66% of the data), high (highest 33% of the data). Note X: There is no observations
Table 3: Percentage of use of the strategy of AFF across village violence intensity1 for households whose coping span is less than 4 months, conditioned to other characteritsics2 1st order control
variable 2nd order control variables
Poverty line Household size3 Dependency
ratio3 Education
(hh) Sex (hh)
Employment Status (hh)
Employment sector (hh)
Land ownership
Livestock ownership
Location type Governorate Distance to the city3
Village population3
Group Category Poor Non-poor Low High Low Illiterate Male Unemployed Foreign
company No No Urban Salfit Hebron Low High High
Coping span
< 4 months 17, 0, 43 12, 2, 23 13, 3, 26 12, 0, 42 18, 0, 38 14, 3, 28 12, 1, 27 8, 0, 45 14, 4, 49 16, 2, 33 12, 3, 32 6, 0, 35 25, X, 100 6, 0, 32 7, 5, 17 10, 1,
42 0, 0, 35
See notes to Table 2 of this Appendix
Table 4: Percentage of use of the strategy of AFF across village violence intensity1 for households whose coping span has been exhausted and are in danger, conditioned to other characteritsics2 1st order control variable 2nd order control variables
Poverty line
Household size3
Dependency ratio3
Education (hh)
Sex (hh)
Employment Status (hh)
Employment sector (hh)
Land ownership
Livestock ownership
Location type Governorate Distance to the city3
Group Category Non-poor Low High Illiterate Male Unemployed Foreign
company No No Urban Jenin Tulkarem Rammallah Hebron Medium High
Coping span danger 21, 13, 71 8, 5, 58 21, 16, 55 35, 0, 82 14, 12, 59 10, 14, 60 0, 17, 82 34, 9, 57 26, 13, 61 13, 0, 54 16, 0, 79 100, 100, 0 5, 0, 100 7, 0, 60 21, 0, 77 19, 0, 54 See notes to Table 2 of this Appendix
Table 5: Percentage of use of the strategy of AFF across village violence intensity1 for Jenin residents, conditioned to other characteritsics2 1st order control variable 2nd order control variables
Poverty line Household size3 Coping span Sex
(hh) Employment Status (hh)
Land ownership
Livestock ownership Location type
Distance to the city3
Village population3 Group Category Poor Non-poor Low Danger Male Unemployed No No Urban High Medium High
Governorate Jenin 23, 0, 56 17, 0, 46 21, 0, 54 16, X, 79 19, 0, 42 6, 0, 66 28, 0, 51 21, 0, 50 12, 0, 70 18, 0, 47 17, 0, 38 17, X, 70 See notes to Table 2 of this Appendix

350
Table 6: Percentage of use of the strategy of AFF across village violence intensity1 for Rammallah residents, conditioned to other characteritsics2 1st order control variable 2nd order control variables
Poverty line Household size3 Coping span Sex
(hh) Employment
sector Dependency
Ratio3 Land
ownership Livestock ownership Location type
Distance to the city3
Village population3
Group Category Poor Non-poor Low Danger Male Foreign
company High No No Urban Close High
Governorate Rammallah 2, 13, 33 6, 0, 33 4, 8, 39 5, 0, 100 3, 3, 24 4, 0, 78 8, 0, 39 4, 2, 33 7, 2, 35 2, 0, 38 3, X, 34 3, X, 38 See notes to Table 2 of this Appendix
Table 7: Percentage of use of the strategy of AFF across village violence intensity1 for Hebron residents, conditioned to other characteritsics2 1st order control variable 2nd order control variables3
Poverty line Coping span Sex (hh)
Education (hh)
Dependency Ratio3
Employment status (hh)
Land ownership
Livestock ownership
Location type Village population3 Group Category
Non-poor In danger < 4 months Male Illiterate High Unemployed No No Urban High Governorate Hebron 1, 0, 11 7, 0, 60 6, 0, 32 4, 0, 12 2, 0, 25 6, 0, 19 7, 0, 40 5, 0, 15 2, 0, 19 3, 0, 13 3, 0, 13 See notes to Table 2 of this Appendix

351
Appendix 18: Conditional Associations between Community Risk Sharing and Village Closure
Table 1: Percentage of use1 of community risk-sharing across village closure intensity for different groups of households2 Village closure3
1st order control variable Category Low Medium High
Poor 82 97 90 Poverty line Non-poor 65 81 79
> 12 months 49 71 60
4-12 months 78 88 92 Maximum coping period < 4 months 85 100 88
Employment status Partial employed 69 87 82
Same locality 69 83 86 Location of employment of household head (hh) Different governorate 55 94 79
State company 72 88 83
Foreign company 75 96 89 Employment sector (hh) Government 60 73 82
Low 63 81 82 Household size3 High 78 98 79
Illiterate 70 82 84 Education (hh) High 68 93 89
Sex (hh) Male 69 88 82
Yes 67 82 79 Land ownership No 89 93 85
Livestock ownership No 66 87 77
Urban 64 86 82 Location type Rural 74 87 81
Rammallah 56 80 77 Governorate Bethlehem 71 89 No observations
Low 66 88 No observations Village distance to the governorate capital3 High 71 92 81
Low 75 88 78 Village population size3 High 65 91 83
Note 1: As a matter of simplification, this table does not include the three categories of the risk management strategy (used, not used, not applicable); instead it includes just the category of ‘used’. Since the percentages have been calculated across the strategy variable (used, not used, not applicable) and not across the village conflict intensities, the rows do not add up to 100%. Note 2 The control groups and their respective categories here included are just those that are statistically significant at the 0.05 percent level using the Pearson chi-square test Note 3: Low (lowest 33% of the data), Medium (from 34% to 66% of the data), High (highest 33% of the data).

352
Table 2: Percentage of use of community risk sharing across village closure intensity1 for small-sized household families, conditioned to other characteristics2
1st order control variable 2nd order control variables
Maximum coping period
Poverty line
Employment sector
Employment location
Employment status Sex (hh) Education (hh) Land ownership Livestock
ownership Location type Governorate
Group Category3 > 12 months Non-poor State
companies Different
governorate Employed Male Illiterate High No Yes No Urban Rammallah
Household size
Low 44, 58, 64 61, 78, 81 67, 82, 85 50, 100, 78 64, 81, 86 63, 83, 85 62, 72, 81 35, 72, 56 62, 74, 78 63, 88, 86 61, 83, 79 58, 78, 94 48, 88, 82
Note 1: The percentages of strategy use across village violence intensities are written in the form of ‘a, b, c’, where ‘a’ represents the percentage of streagy use in low closure -affected villages; ‘b’ the percentage of strategy use across medium closure -affected villages; and ‘c’ represents the percentage of strategy use in highly closure -affected villages. The villages closure intensities have been calculated based on three cut-off points: Low (lowest 33% of the data), medium (from 34% to 66% of the data), high (highest 33% of the data). Note 2: All the variables included in Table 1 of this Appendix are considered as second-order control variables. However, the ones included here are only those that are statistically significant at 0.05%. Note 3: Low (lowest 33% of the data), medium (from 34% to 66% of the data), high (highest 33% of the data). Note X: There is no observations Table 3: Percentage of use of community risk sharing across village closure intensity1 for households whose coping period is 4-12 months, conditioned to other characteristics2
1st order control variable 2nd order control variables
Sex Employment sector (hh) Group Category Male Foreign company Maximum coping period 4-12 months 81, 91, 92 34, 95, 94
See notes to Table 2 of this Appendix Table 4: Percentage of use of community risk sharing across village closure intensity1 for illiterate-headed households, conditioned to other characteristics2
1st order control variable 2nd order control variables
Household size3 Land ownership Sex (hh) Employment sector (hh) Employment status Location type Group Category Low High No Male State company Employed Urban Education (hh) Illiterate 62, 72, 81 70, 96, 76 70, 88, 94 72, 84, 89 79, 84, 85 73, 90, 95 69, 84, 94 See notes to Table 2 of this Appendix Table 5: Percentage of use of community risk sharing across village closure intensity1 for households whose head works in the same locality, conditioned to other characteristics2
1st order control variable 2nd order control variables
Poverty line Maximum coping period Household size3 Education
(hh) Employment
status Sex (hh) Livestock ownership
Land ownership
Employment sector Location type
Group Category Non-poor > 12 months Low High High Employed Male No No State
companies Urban
Employment location (hh)
Working same locality 67, 77, 84 54, 72, 75 65, 72, 88 73, 98, 89 39, 72, 80 69, 83, 86 69, 85, 86 67, 79, 86 68, 89, 86 69, 84, 87 65, 74, 91
See notes to Table 2 of this Appendix Table 6: Percentage of use of community risk sharing across village closure intensity1 for households whose head works in the same locality, conditioned to other characteristics2
1st order control variable 2nd order control variables
Poverty line Sex (hh) Employment status (hh)
Employment location (hh) Land ownership Distance to the
city3 Governorate Group Category
Non-Poor Male Employed Different governorate No High Rammallah
Employment sector Government 58, 68, 80 59, 73, 82 61, 74, 83 31, 100, 69 59, 77, 89 63, 100, 99 83, 35, 100 See notes to Table 2 of this Appendix

353
Appendix 19: Conditional Associations between Community Risk Sharing and Violence
Table 1: Percentage of use1 of community risk sharing across village violence intensity for different groups of households2 Violence3
1st order control variable Category Low Medium High
Poor 91 96 82 Poverty line Non-poor 75 78 68
Location of employment of household head (hh) Same locality 81 90 68
Employment sector (hh) Foreign company 87 98 76
Household size3 Low 75 78 65
High 83 92 76 Dependency ratio (no. working family members/household size)3 Low 76 89 59
Illiterate 77 96 78 Education (hh) High 88 68 67
Sex (hh) Male 80 83 71
Yes 79 76 64 Land ownership No 78 91 72
Livestock ownership No 74 81 69
Urban 71 91 66 Location type Rural 82 64 90
Governorate Hebron 89 94 77
Low 56 86 50 Village distance to the governorate capital3 High 83 68 97
Low 82 70 No observations Village population size3 High 83 68 97
Note 1: As a matter of simplification, this table does not include the three categories of the risk management strategy (used, not used, not applicable); instead it includes just the category of ‘used’. Since the percentages have been calculated across the strategy variable (used, not used, not applicable) and not across the village conflict intensities, the rows do not add up to 100%. Note 2 The control groups and their respective categories here included are just those that are statistically significant at the 0.05 percent level using the Pearson chi-square test Note 3: Low (lowest 33% of the data), Medium (from 34% to 66% of the data), High (highest 33% of the data). For the dependency ratio, high represents the lowest 33% of the data and low, the highest 33% of the data.
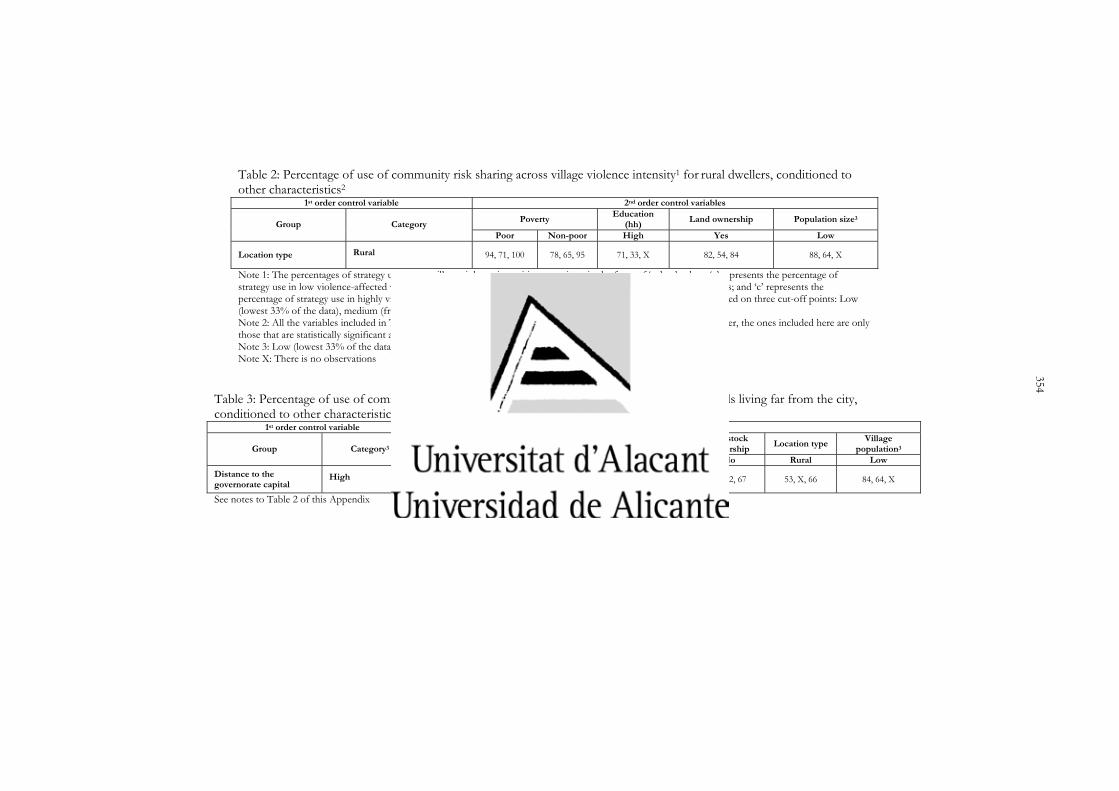
354
Table 2: Percentage of use of community risk sharing across village violence intensity1 for rural dwellers, conditioned to other characteristics2
1st order control variable 2nd order control variables
Poverty Education (hh) Land ownership Population size3 Group Category
Poor Non-poor High Yes Low
Location type Rural
94, 71, 100 78, 65, 95 71, 33, X 82, 54, 84 88, 64, X
Note 1: The percentages of strategy use across village violence intensities are written in the form of ‘a, b, c’, where ‘a’ represents the percentage of strategy use in low violence-affected villages; ‘b’ the percentage of strategy use across medium violence -affected villages; and ‘c’ represents the percentage of strategy use in highly violence -affected villages. The villages violence intensities have been calculated based on three cut-off points: Low (lowest 33% of the data), medium (from 34% to 66% of the data), high (highest 33% of the data). Note 2: All the variables included in Table 1 of this Appendix are considered as second-order control variables. However, the ones included here are only those that are statistically significant at 0.05%. Note 3: Low (lowest 33% of the data), medium (from 34% to 66% of the data), high (highest 33% of the data). Note X: There is no observations
Table 3: Percentage of use of community risk sharing across village violence intensity1 for households living far from the city, conditioned to other characteristics2
1st order control variable 2nd order control variables
Poverty line Education (hh) Land ownership
Livestock ownership Location type Village
population3 Group Category3
Poor Non-poor High No No Rural Low Distance to the governorate capital
High
95, 76, 100 78, 61, 87 75, 42, 100 57, 86, 71 56, 82, 67 53, X, 66 84, 64, X
See notes to Table 2 of this Appendix

355
Appendix 20: Conditional Associations between Community Risk Sharing and Wall Village Closure
Table 1: Percentage of use1 of community risk sharing across village Wall closure for different groups of households2
Villages sides enclosed by the wall 1st order control variables Category 0 1 2 3 Poverty Non-poor 75 65 80 52
> 12 months 58 46 69 38 Maximum coping spam < 4 months 92 73 87 92
Full-time employed 79 69 85 50 Employment status of household head (hh) Unemployed 90 70 76 100
Same locality 79 72 92 56 Employment location (hh) Different governorate 82 51 80 20
Employment sector (hh) National company 81 68 86 56
Dependency ratio (no. working family members/household size)3
Low 76 60 80 32
Household size3 Low 75 50 78 51
Sex (hh) Male 80 69 83 57
Education (hh) Illiterate 80 65 57 54
Land ownership No 80 67 87 55
Livestock ownership No 76 65 79 51
Urban 75 61 No observations 56 Location type Refugee camps 89 64 78 No observations
Village distance to governorate capital3 Low 70 54 78 56
Tulkarem 62 No observations 75 41 Governorate Rammallah 77 52 No observations No observations
Village population size3 High 76 53 No observations 56
Note 1: As a matter of simplification, this table does not include the three categories of the risk management strategy (used, not used, not applicable); instead it includes just the category of ‘used’. Since the percentages have been calculated across the strategy variable (used, not used, not applicable) and not across the village conflict intensities, the rows do not add up to 100%. Note 2 The control groups and their respective categories here included are just those that are statistically significant at the 0.05 percent level using the Pearson chi-square test Note 3: Low (lowest 33% of the data), Medium (from 34% to 66% of the data), High (highest 33% of the data). For the dependency ratio, high represents the lowest 33% of the data and low, the highest 33% of the data.

356
Table 2: Percentage of use of community risk sharing across village Wall closure intensity1 for unemployed headed households, conditioned to other characteristics2
1st order control variable 2nd order control variables
Maximum coping period Land ownership Livestock ownership Location type Distance to
the city3 Group Category < 4 months No No Urban Close
Employment status Unemployed 98, 56, 71, 100 92, 71, 89, 100 91, 63, 75, 100 94, 64, X, 100 88, 60, 100, 100 Note 1: The percentages of strategy use across village wall closure intensities are written in the form of ‘a, b, c, d’, where ‘a’ represents the percentage of strategy use in villages enclosed by the Wall by 1 side; ‘b’ represents the percentage of strategy use in villages enclosed by the Wall by 2 sides; ‘c’ represents the percentage of strategy use in villages enclosed by the Wall by 3 sides; ‘d’ represents the percentage of strategy use in villages enclosed by the Wall by 4 sides. Note 2: All the variables included in Table 1 of this Appendix are considered as second-order control variables. However, the ones included here are only those that are statistically significant at 0.05%. Note 3: Low (lowest 33% of the data), medium (from 34% to 66% of the data), high (highest 33% of the data). Note X: There is no observations
Table 3: Percentage of use of community risk sharing across village Wall closure intensity1 for households whose coping span is less than 4 months, conditioned to other characteristics2
1st order control variable 2nd order control variables
Employment sector (hh) Employment status Location type Land ownership Group Category State companies Employed Unemployed Urban Refugee
camps No
Maximum coping period < 4 months 94, 74, 100, 75 94, 74, 100, 75 98, 56, 71, 100 93, 69, X, 92 97, 78, 67, X 94, 66, 73, 92
See notes to Table 2 of this Appendix

357
Appendix 21: Conditional Associations between Community Risk Sharing and Wall Village Proximity
Table 1: Percentage of use1 community risk sharing across Wall village proximity for different groups of households2
Is the village within 1 km of the Wall? 1st order control variable Category No Yes Poverty Non-poor 75 65
> 12 months 58 47 Maximum coping span < 4 months 92 80
Employed 79 66 Employment status of household head (hh) Unemployed 90 78
Same locality 79 70
Same governorate 79 66 Employment location (hh) Different governorate 82 51
Employment sector (hh) State company 81 68
Dependency ratio (no. working family members/household size)3
Low 76 53
Household size3 Low 75 60
Sex (hh) Male 70 69
Illiterate 80 62 Education (hh) High 61 40
Land ownership No 80 62
Livestock ownership No 76 64
Urban 75 59 Location type Refugee camps 88 74
Village distance to the governorate capital3 High 70 57
Qalqilya 63 82 Governorate Rammallah 75 68
Village population size3 High 76 55
Note 1: As a matter of simplification, this table does not include the three categories of the risk management strategy (used, not used, not applicable); instead it includes just the category of ‘used’. Since the percentages have been calculated across the strategy variable (used, not used, not applicable) and not across the village conflict intensities, the rows do not add up to 100%. Note 2 The control groups and their respective categories here included are just those that are statistically significant at the 0.05 percent level using the Pearson chi-square test Note 3: Low (lowest 33% of the data), Medium (from 34% to 66% of the data), High (highest 33% of the data). For the dependency ratio, high represents the lowest 33% of the data and low, the highest 33% of the data.

358
Table 2: Percentage of use of community risk sharing across Wall village proximity1 for Qalqilya residents, conditioned to other characteristics2
1st order control variable 2nd order control variables Poverty status Dependency ratio3 Distance to the city3
Group Category Poor Non-poor Low High Governorate Qalqilya 58, 84 65, 81 56, 91 50, 92
Note 1: The percentages of strategy use across wall village proximity are written in the form of ‘a, b’, where ‘a’ represents the percentage of strategy use in villages which are not close to the Wall; ‘b’ the percentage of strategy use in villages which are close to the Wall. Note 2: All the variables included in Table 1 of this Appendix are considered as second-order control variables. However, the ones included here are only those that are statistically significant at 0.05%. Note 3: Low (lowest 33% of the data), medium (from 34% to 66% of the data), high (highest 33% of the data). For the dependency ratio, high represents the lowest 33% of the data and low, the highest 33% of the data. Note X: There is no observations

359
SPANISH SUMMARY
El siguiente resumen de la tesis Supervivencia, adaptación y resistencia: un análisis crítico de la gestión de
riesgo en contextos de conflicto armado se ha estructurado de la siguiente manera: la primera parte
describe brevemente el objetivo, la motivación, la hipótesis y la estructura de la investigación;
a continuación, se desarrolla el estado de la cuestión de los estudios sobre la gestión de riesgo
y los conflictos armados; la tercera sección de este resumen se ha dedicado a la descripción
de los métodos de investigación; el último apartado, el más extenso, presenta las
conclusiones.
1. Introducción
El objetivo de esta investigación es analizar la gestión de riesgo230 de los hogares en contextos
de conflicto armado, es decir, cómo las familias hacen frente a los eventos de riesgo y sus
consecuencias producidos por los conflictos armados. Siendo ésta un área de estudio
emergente, esta investigación quiere participar en la construcción de un marco conceptual
que reconozca las peculiaridades de la gestión de riesgo de los hogares en este tipo de
situaciones. A pesar de que la gestión de riesgo y los conflictos armados han sido
ampliamente investigados de forma individual, su interacción sigue siendo un área
inexplorada. Por un lado, el estudio de la gestión de riesgo en países en vías de desarrollo se
ha enmarcado casi exclusivamente en situaciones de crisis económicas y desastres naturales y
ha ignorado los eventos de riesgo de tipo socio-político. Por otro lado, la mayoría de los
estudios sobre conflictos armados carecen de una perspectiva micro; las cuestiones sobre la
naturaleza, los actores, las causas y los efectos de los conflictos armados se han abordado
desde una perspectiva macro.
Esta laguna en la gestión de riesgo en conflictos armados ha permitido equiparar los
comportamientos de los hogares en conflicto con aquellos producidos en contextos de crisis
económicas y desastres naturales, donde los eventos de riesgo se asumen como transitorios y
exógenos y la vulnerabilidad de los hogares como una falta de medios económicos. Este tipo
de enfoque que no tiene en cuenta las causas ha contribuido a la desconexión entre las
360
intervenciones de cooperación al desarrollo y ayuda en emergencia y las características del
conflicto. Esta desconexión puede apreciarse en el conflicto palestino-israelí, donde los países
e instituciones donantes no reconocen los hechos en el terreno, como son la fragmentación
territorial, económica y social producida por la política israelí de restricción de movimientos,
la expansión de las estructuras de asentamiento y la construcción del muro231 (Le More,
2005). La paradoja de esta ultima década es que, a pesar de que el objetivo explícito de la
ayuda ha sido favorecer el proceso de paz, los donantes han actuado como si el desarrollo en
los Territorios Palestinos Ocupados (TPO) pudiera realizarse al margen de la evolución y
acontecimientos del proceso político bilateral de Israel y los TPO.
Esta situación de los TPO ha inspirado la hipótesis central de esta investigación, la cual
concede a los eventos de riesgo un lugar central en el análisis al afirmar que tanto los
condicionantes de la gestión de riesgo como las respuestas de los hogares a pérdidas previstas
o reales asociadas con los sucesos de riesgo y consecuencias del conflicto armado no son
necesariamente los mismos que los observados en contextos de crisis naturales y económicas.
La exploración de esta hipótesis se ha llevado a cabo a través de una discusión, de carácter
más conceptual, sobre las implicaciones de las características del riesgo en su gestión y de un
análisis empírico en los TPO. Con este doble enfoque, esta investigación ha tratado una serie
de cuestiones estructuradas en cuatro capítulos. El capítulo 1 presenta el conflicto palestino-
israelí y en particular una de sus cuestiones, la ocupación israelí de los territorios palestinos,
sobre la cual se centra el análisis empírico de la tesis232. Dadas las diferentes realidades que
viven cada uno de los territorios comprendidos en los TPO - la Franja de Gaza, Cisjordania y
Jerusalén - así como el carácter crónico de la ocupación israelí, el estudio se limita a
Cisjordania y al periodo 2000-2004, los cuatro años siguientes al comienzo de la Intifada Al
Aqsa. Este periodo, que surge como una continuación lógica e inevitable del contexto de
desposesión que supuso el proceso de paz de Oslo233, está caracterizado por el regreso de las
Fuerzas de Defensa Israelíes (FDI) a Cisjordania, el recrudecimiento de la política israelí de
restricción de movimientos y la construcción del muro, así como por la significativa
reducción del bienestar de los palestinos234.
El Capítulo 2 analiza en primer lugar el debate que ha dominado la comprensión de la
gestión de riesgo en países en vías de desarrollo. En este examen se ha prestado particular

361
atención a cómo se ha integrado el riesgo en el análisis. La segunda parte del capitulo está
dedicada a los conflictos armados, en particular a sus causas, efectos y sobre todo a sus
características. Basándonos en estas últimas y en los estudios recientes sobre la gestión de
riesgo en contextos de conflicto armado, se han identificado una serie de cuestiones generales
y especificas sobre la gestión de riesgo en este tipo de contextos.
El capitulo 4, precedido por una descripción de los métodos de investigación (capítulo 3),
presenta el análisis empírico sobre la gestión de riesgo en los TPO. Con el fin de
complementar la discusión anterior e ilustrar de manera preliminar la gestión de riesgo en
Cisjordania – características de los eventos de riesgo, las estrategias y su interacción - se ha
llevado a cabo un análisis descriptivo basado en datos primarios y secundarios.
2. Estado de la cuestión
Conceptualmente, esta tesis doctoral se ubica en la discusión sobre la gestión de riesgo en
países en vías de desarrollo y en los estudios sobre las causas y efectos de los conflictos.
En lo que concierne al debate sobre la gestión de riesgo habría que señalar que siendo un
ingrediente esencial de la vida de toda comunidad, su gestión, particularmente las cuestiones
sobre cómo las personas se adaptan a las fluctuaciones en sus ingresos y cuáles son los
factores que influyen en la vulnerabilidad de los hogares, ha sido objeto de estudio por parte
de las ciencias sociales. Se podría decir que el debate estuvo motivado en su origen por una
discusión entre antropólogos sobre los comportamientos de sociedades premercantiles. La
falta de consenso sobre si éstas se regían por principios de redistribución y reciprocidad o
por un comportamiento racional tendente a la maximización del beneficio, incitó a los
economistas a evaluar la asignación de recursos en este tipo de sociedades. A pesar de la
diversidad de opiniones, la mayoría de estos estudios concluyen que los agricultores toman
decisiones racionales, condicionadas principalmente por una aversión al riesgo moderada235.
Sin embargo, esta importancia de la aversión al riesgo fue cuestionada por Alderman y
Paxson (1992), quienes sostenían que los problemas de información asimétrica y los
problemas de cumplimiento de los contratos debido a las imperfecciones de los mercados de
crédito y seguros pueden llevar a exagerar o subestimar el grado de aversión al riesgo236. En
paralelo a esta discusión, nos encontramos con los trabajos realizados durante las hambrunas
362
de la década de 1980 en África237. Sus conclusiones revelan que incluso en contextos de
mercados imperfectos, los individuos no se quedan impasibles ante la crisis, todo lo
contrario, adoptan toda una serie de mecanismos a priori y a posteriori, a corto y largo
plazo, para hacer frente a los eventos de riesgo y a sus consecuencias adversas. En esta década
se encuentra el trabajo de Sen sobre las titularidades al alimento (1981), cuya mayor
contribución fue la de hacer patente la realidad de que las hambrunas no se producen por un
fallo en la oferta sino en la demanda, es decir, no tanto por una falta en la disponibilidad de
alimentos en el mercado sino por un fallo en las titularidades de los individuos que les priva
del acceso a los alimentos. Alentados por la decisiva aportación de Sen se llevaron a cabo
numerosos estudios con el fin de reflexionar sobre las estrategias, procesos y condicionantes
de la gestión de riesgo en contextos de crisis. Gracias a éstos sabemos que el proceso de
gestión es dinámico, diverso y previsor238. Los hogares adoptan de manera simultánea una
gran variedad de mecanismos informales a través de los cuales persiguen la gestión del riesgo
a priori239 (estrategias de estabilización del ingreso) y su supervivencia a posteriori240
(estrategias de estabilización del consumo) teniendo en cuenta unos objetivos a corto plazo
de consumo y al largo plazo de sostenibilidad.
Por lo que se refiere a los determinantes, su estudio está intrínsicamente vinculado con el de
la vulnerabilidad de los hogares. Mientras que el término ‘vulnerabilidad’ se ha empleado
con múltiples acepciones, en la mayoría de los trabajos sobre pobreza y gestión de riesgo, la
vulnerabilidad, siendo una función de los eventos, las estrategias y las consecuencias del
riesgo, mide la probabilidad de que la exposición al evento de riesgo o perturbación resulte
en una reducción del bienestar (Banco Mundial, 2000). Sin embargo, la definición de
vulnerabilidad241 varía dependiendo de la disciplina (economía, medicina, sociología,
antropología, etc.) y del objeto de estudio (eventos, estrategias y consecuencias del riesgo). Por
ejemplo, en el campo de la economía, mientras que las perspectivas de los activos y de
seguridad alimentaria se centran principalmente en las estrategias, la teoría de la gestión de
riesgo y el estudio de las dinámicas de pobreza se interesan por las consecuencias. Así con
este tipo de aproximación, la gestión de riesgo en los países en vías de desarrollo se ha
centrado en medir la capacidad que tienen los hogares para estabilizar o regular su consumo
e ingreso, lo que se ha venido explicando a través de factores relacionados con la pobreza242,
la disponibilidad de crédito y seguros, la cobertura, intensidad y previsibilidad de las
perturbaciones243.

363
Es muy importante señalar que a los eventos de riesgo, aun siendo la razón de ser de este
tipo de estudio, se les ha concedido una menor importancia y su integración en el análisis de
la gestión de riesgo - y de forma más general en las dinámicas de pobreza - ha quedado
relegada a un segundo plano. Además de la falta de información sobre los sucesos de riesgo,
una de las razones que explican el énfasis en las consecuencias de los riesgos y la falta de
atención a sus causas es, como bien indica el enfoque de emergencias complejas (EC), la
representación del riesgo como exógeno, es decir, si bien sus efectos pueden ser influidos
por la intervención humana, sus causas no, y por ello se consideran ajenas al sistema
(Duffield, 1994). Más aún, presuponer que los sucesos de riesgo son exógenos ha favorecido
una visión restrictiva de la gestión de riesgo como un proceso a posteriori que depende en
gran medida de las condiciones económicas de los individuos u hogares.
A pesar de esta importante limitación, los enfoques de seguridad alimentaria y de la gestión
de riesgo han proporcionado una gran riqueza de información sobre cómo los hogares
afrontan el riesgo, y por tanto constituye el marco de referencia para comprender la gestión
de riesgo. La cuestión de si se pueden aplicar al contexto de los conflictos armados es el
objeto de estudio de esta investigación.
El estudio de los conflictos armados244 es la segunda línea de investigación en que se apoya
esta tesis. Por lo general, estos análisis han estado marcados durante mucho tiempo por una
especie de bloqueo mental, que consideraba la guerra como un mal del subdesarrollo, una
erupción irracional de violencia o un telón de fondo (Keen, 1998). Este tipo de enfoque que
no concedía la importancia debida a las realidades de la guerra y que prefirió centrarse en sus
repercusiones protagonizó durante la década de 1980 los estudios sobre las hambrunas en el
Cuerno de África y la discusión sobre el desarrollo en situaciones de conflictos armados
(Stewart, 1993).
En las últimas dos décadas ha habido importantes aportaciones a la comprensión de los
conflictos armados. Por una parte, se han llevado a cabo trabajos analíticos en diversas
disciplinas sobre cómo los conflictos afectan a la política, a las economías y a las

364
sociedades245. Por otra parte, el enfoque de las EC y su análisis político-económico sobre la
distribución de poder y la economía de la guerra aportan una nueva visión de los conflictos
armados246. Este enfoque surge como crítica a los enfoques de titularidades y seguridad
alimentaria, pues si bien estos han informado del comportamiento racional, variado,
dinámico y previsor de la gestión de riesgo de los hogares en situaciones de crisis, han
ignorado las dinámicas de poder al considerar los riesgos como exógenos a las titularidades o
a la seguridad alimentaria de los individuos. Según este tipo de análisis, las hambrunas tanto
como la violencia, la limpieza étnica o los desplazamientos forzosos resultan del ejercicio
consciente del poder en pos de ganancias y ventajas. Si los sectores poderosos utilizan la
hambruna deliberadamente para despojar a los sectores vulnerables de sus recursos
económicos o provocar su fragmentación social, entonces la vulnerabilidad de los débiles no
puede entenderse únicamente como una falta de poder adquisitivo sino que debe entenderse
como una falta de acceso a los medios de poder y representación política (Duffield, 1994).
Además de esta naturaleza endógena de los eventos de riesgo, el análisis de las emergencias
complejas ayuda a desentrañar otras características de los conflictos armados como pueden
ser sus múltiples causas y efectos, y su carácter transformador de dimensiones estructurales y
dinámicas (Cliffe y Luckham, 2000).
Estas características de los eventos de riesgo ponen en evidencia las diferencias que existen
entre los eventos de riesgo económicos y naturales supuestamente exógenos y aquellos de tipo
socio-político como los conflictos armados. A diferencia de los desastres naturales y
económicos, los conflictos armados violan sistemática y deliberadamente el derecho de los
individuos y grupos a construir y disponer de unos modos de vida adecuados y seguros. Esto
se realiza erosionando y destruyendo los sistemas políticos, económicos, sociales y
medioambientales, por un lado, y manipulando las respuestas con que los hogares afrontan
las pérdidas previstas y reales generadas por los eventos y consecuencias del riesgo generadas
por el conflicto, por otro (Duffield, 1994). Estas características de los conflictos armados, son
el punto de partida de la hipótesis de esta investigación, la cual cuestiona que las estrategias y
condicionantes de la gestión de riesgo sean ajena a sus causas.
La gran variedad de investigaciones realizadas en las últimas dos décadas, especialmente
durante la década de 1990, ha estimulado entre los economistas otros puntos de vista sobre
las causas de los conflictos más allá de su visión como un mal del subdesarrollo o una

365
erupción irracional de violencia. Actualmente, el debate sobre las causas está protagonizado
por una serie de cuestiones interrelacionadas tales como la identificación de causas únicas
(por ejemplo, la escasez de recursos naturales (Homer-Dixon, 1995), las ‘njusticias sociales
(Gurr, 1970; Stewart, 2000) y la codicia (Collier y Hoeffler, 1998)), el protagonismo
concedido a las causas basadas en la codicia, el vínculo cada vez más aceptado entre conflicto
y criminalidad, así como la desconexión entre la codicia y las injusticias sociales.
En general, estos debates sobre las causas, efectos y características de los conflictos han estado
dominados por una perspectiva macro. A pesar de la utilidad de esta óptica para explicar el
conflicto y extraer información sobre las causas y efectos, ésta es incapaz de captar las
dinámicas a nivel micro, es decir, cómo los conflictos inciden en los modos de vida de
comunidades e individuos (Stewart y FitzGerald, 2001; Justino, 2007). Los micro-análisis
sobre los conflictos armados han aumentado significativamente en años recientes. Si bien
empieza a haber evidencia empírica sobre la relación entre conflicto y pobreza247, las
cuestiones relacionadas con la dimensión temporal de la pobreza, incluida la gestión de
riesgo248, son áreas todavía muy poco exploradas. Aunque la evidencia es escasa y necesita ser
contrastada, el debate emergente es una excelente oportunidad para discutir la gestión de
riesgo durante conflictos armados.
Así, con el fin de establecer conexiones entre las dimensiones macro y micro de los conflictos
armados y de explorar si la gestión de riesgo en contextos de conflicto armado requiere de un
enfoque diferente según sea la naturaleza de la crisis, esta investigación estudia cómo afectan
las características de los conflictos armados a la gestión de riesgo de los hogares en conflicto.
3. Métodos de investigación
Este estudio fue concebido como una investigación colaborativa con organizaciones
interesadas en la gestión de riesgo como un indicador de la vulnerabilidad de los hogares –
como la Oficina Central Palestina de Estadística (OCPE) y la Organización de las Naciones
Unidas para la Agricultura y la Alimentación (FAO) en Jerusalem. La intención era realizar
un estudio que fuese un proceso reflexivo dirigido por individuos que trabajasen en la misma
área a fin de mejorar la manera de entender la vulnerabilidad y también de establecer
mecanismos para vincular la investigación con la práctica de la cooperación y el desarrollo.

366
Con este fin se llevó a cabo un trabajo de campo a lo largo de 10 meses en los TPO con un
formato de cinco visitas intermitentes durante febrero de 2005 y agosto de 2006. Podría
decirse que el trabajo de campo constó de dos fases, identificación y participación. Durante
el periodo de identificación se entrevistó a un amplio grupo de organizaciones palestinas,
israelíes e internacionales con el fin de comprobar la relevancia de la hipótesis de esta
investigación para el contexto de los TPO y de los datos disponibles para su exploración. La
siguiente fase del trabajo de campo se dedicó por una parte a establecer una relación con la
OCPE y la FAO mediante la discusión de propuestas de colaboración249; por otra, se
recopilaron datos primarios a través de entrevistas individuales y de grupo sobre las
percepciones de familias palestinas acerca de las estrategias y eventos de riesgo, y se
obtuvieron datos secundarios como la Encuesta de la OCPS sobre Gasto y Consumo de los
Hogares Palestinos (EGCP) del año 2004 y una serie de datos sobre los eventos de riesgo
producidos por la ocupación israelí de los TPO durante el periodo 2000-2004.
Uno de los valores añadidos de esta tesis es sin duda el estudio de los eventos de riesgo
producidos por la ocupación israelí de los territorios palestinos. A diferencia de otros
conflictos, el conflicto palestino-israelí es una realidad bien documentada. Organismos
estatales e internacionales, así como organizaciones no gubernamentales (ONGs), se han
encargado de monitorear la evolución del conflicto generadando una gran cantidad de datos.
Dado que el micro-análisis de los conflictos armados se ve en gran medida obstaculizado por
la falta de datos, la riqueza informativa que proporciona el caso palestino-israelí es una
excelente oportunidad para mejorar nuestra comprensión del comportamiento de los hogares
en un conflicto. Así, con el fin de dar al riesgo un papel central en el pensamiento actual
sobre la gestión de riesgo durante conflictos armados, uno de los objetivos de este estudio es
la operacionalización de la ocupación israelí mediante el acopio de un conjunto de datos que
refleje exhaustivamente las perturbaciones producidas durante el periodo 2000-2004250.
Tanto los datos primarios como los secundarios constituyen la base de un análisis descriptivo
destinado a complementar la discusión del capítulo 2 sobre la gestión de riesgo de los
hogares en situaciones de conflicto armado a través de una visión preliminar en los TPO. En
particular, el análisis de las percepciones examina dos de los elementos de la gestión de riesgo
– eventos y estrategias - fuera del marco de las encuestas251, pues si bien éstas incluyen las
estrategias de gestión de riesgo lo hacen de una manera que creemos sesgada a favor de la

367
gestión de riesgo en contextos de crisis económicas y naturales donde se enfatizan su
dimensión a posteriori y las estrategias de estabilización del consumo. Específicamente, se
han explorado las siguientes cuestiones: ¿Cuáles son las causas del riesgo en los TPO? ¿Qué
tipo de respuestas adoptan los hogares para hacer frente al riesgo? ¿Cuál son las motivaciones
de los hogares para la gestión de riesgo?
Los datos secundarios se han utilizado con dos objetivos. El primero es ilustrar la naturaleza
multidimensional, endógena, estructural y dinámica de la ocupación israelí de los TPO
durante el periodo 2000-2004 a través de un análisis de sus instrumentos (uso de violencia,
anexión de tierra y restricciones al movimiento) a lo largo del tiempo y el espacio así como
de sus interacciones. Se han explorado las siguientes preguntas: ¿cómo se comporta la
ocupación israelí durante el periodo 2000-2004? ¿Cuáles son las diferencias territoriales de su
impacto? ¿Puede la intensidad de la ocupación israelí de los TPO verse reflejada a través del
uso de violencia de las Fuerzas de Defensa Israelí (FDI)? ¿Cuál es la relación entre el uso de
violencia de los FDI, las restricciones al movimiento y las estructuras de los asentamientos o
la construcción del muro? El segundo objetivo es la exploración de las estrategias a través de
sus causas. Si bien la identificación de los factores determinantes está fuera del alcance de
esta investigación, el análisis de correlación pretende mostrar la importancia de los eventos
de riesgo en la gestión de riesgo. Para ello se ha estudiado la relación entre la intensidad de
las diferentes perturbaciones (uso de violencia, anexión de tierra y restricciones del
movimiento) y el uso de las estrategias de gestión de riesgo (agricultura, diversificación de la
oferta laboral familiar, solidaridad entre familiares y entre miembros de la comunidad) en
diferentes grupos de población, dependiendo de su nivel de bienestar y ubicación de su
residencia. Estas variables de control han sido elegidas según aquellas características que son
importantes para la gestión de riesgo, al menos en contextos de crisis económicas y naturales,
y aquellas que captan la exposición geográfica al riesgo en los TPO252.
4. Conclusiones
La última parte de este resumen presenta las conclusiones – principios generales y específicos
de la gestión de riesgo en contextos de conflicto armado – y sus implicaciones en las políticas
de reducción de la vulnerabilidad.

368
Principios generales de gestión de riesgo en contextos de conflicto armado
Si la suposición de que los eventos de riesgo son exógenos los ha situado en un segundo
plano y ha contribuido a su clasificación genérica (en ausencia de sus causas) a partir de sus
características de intensidad y cobertura, entonces considerarlos endógenos tendrá un efecto
contrario, es decir, los situará en el centro del proceso de gestión de riesgo haciendo que
tanto los eventos de riesgo como sus respuestas se estudien en el contexto de sus causas.
Estudiar los sucesos de riesgo dentro del contexto de sus causas significa que no pueden
integrarse en el análisis solamente a través de las características de cobertura, intensidad y
previsibilidad. Tratar la naturaleza de los sucesos de riesgo según estas características no
reflejaría muchos aspectos relacionados con su origen que son importantes a la hora de
gestionar el riesgo. En este sentido, la naturaleza de los sucesos de riesgo debería estudiarse
más allá de los aspectos anteriormente mencionados y comprenderse según su origen
específico (es decir, empleo de la violencia, saqueo de bienes, restricciones a los
desplazamientos, etc.) y sus características intrínsecas (de naturaleza endógena,
multidimensional, dinámica y estructural), y teniendo en consideración los objetivos
generales del conflicto (por ejemplo, limpieza étnica, sometimiento económico, ocupación
territorial, etc.). La naturaleza del riesgo es importante porque influye en la cobertura e
intensidad del impacto y en la capacidad y las posibilidades para afrontar las consecuencias.
Las estrategias de gestión de riesgo de los hogares necesitan tratarse según sus causas dado
que proporcionan información sobre las dinámicas de poder entre las estrategias de los
hogares afectados y las estrategias que esconden los eventos de riesgo. El hecho de que los
conflictos armados destruyan sistemática y deliberadamente bienes individuales y
comunitarios y bloqueen las respuestas de gestión de riesgo, establece un vínculo particular
entre las estrategias y los sucesos de riesgo que las convierte en interdependientes y provoca
un desplazamiento en la importancia de los determinantes, desde los relacionados con las
características de los individuos y familias a los relacionados con los eventos de riesgo en sí.
Al igual que la vulnerabilidad, la gestión de riesgo de los hogares en conflicto armado no
puede determinarse exclusivamente por la pobreza o por fallos del mercado si su
comportamiento y rendimiento están deliberadamente obstaculizados.

369

370
Particularidades de la gestión de riesgo en contextos de conflicto armado
A partir del análisis de los escasos estudios sobre la gestión de riesgo en contextos de
conflicto armado y de la investigación llevada a cabo en los TPO, se han identificado una
serie de cuestiones que componen la gestión de riesgo de hogares afectados por conflictos.
Los eventos de riesgo
Se ha observado en los estudios sobre la gestión de riesgo en conflictos armados que si bien
integran los eventos de riesgo a través de sus causas y no a través de la variabilidad de los
indicadores de impacto, no siempre se hace uso de la información contenida en los eventos
de riesgo, es más, el énfasis suele recaer sobre la magnitud o intensidad de las perturbaciones.
Dicha magnitud parece utilizarse como una dimensión general que aglutina todas las otras
características intrínsecas de los eventos de riesgo, de naturaleza multidimensional, endógena,
estructural y dinámica, e indica sin más la ausencia o presencia de conflicto.
Esta observación contrasta con los resultados de las entrevistas realizadas sobre las
percepciones que los individuos palestinos tienen sobre los eventos de riesgo. Al describir los
eventos de riesgo, los palestinos no prestan tanta atención a los eventos en sí, como a sus
fundamentos o rationale. De tal modo, los eventos de riesgo no se perciben como sucesos
aislados y temporales sino como parte integral de un conjunto de varios niveles compuesto
por las causas (la ocupación israelí), objetivos a corto plazo (violencia, anexiones territoriales,
restricciones al movimiento), objetivos a medio plazo (estrangulación económica y
fragmentación social) y objetivos a largo plazo (la existencia de un estado palestino dentro de
las fronteras de 1967). Esta manera de entender los eventos de riesgo a través de sus objetivos
y causas reconoce la naturaleza del riesgo dentro del contexto específico de vulnerabilidad de
los TPO.
A continuación exponemos las siguientes reflexiones sobre cada una de las características
intrínsecas de los conflictos armados:
1. A pesar del carácter multidimensional de los conflictos armados, existe una tendencia a
representarlos a través de un único efecto directo (por ejemplo, uso de violencia, pillaje,

371
restricciones al movimiento), siendo el uso de violencia el evento de riesgo más
frecuentemente elegido. La representación del conflicto únicamente a través del uso de
violencia coincide con uno de los modos más frecuentes de clasificar el conflicto, es decir,
según su intensidad -alta, media o baja- dependiendo del número de bajas. Si bien es verdad
que esto bastaría para explicar determinados conflictos armados o determinados períodos de
ellos, en otros casos podría resultar erróneo. Por ejemplo, en el contexto del conflicto
palestino-israelí, a pesar de que el uso de violencia disminuyó considerablemente durante el
periodo 2003-2004 en comparación con los dos años anteriores, el conflicto estaba en un
proceso de intensificación producido por la política de restricción al movimiento así como
por la construcción del muro. Con el fin de estudiar la relación que existe entre estas tres
dimensiones de la ocupación, se llevó a cabo un análisis de correlación y, con algunas
excepciones que señalaremos más tarde, la relación entre los instrumentos no es
suficientemente fuerte como para poder simplificar su representación; las tres dimensiones
son necesarias para entender el comportamiento de la ocupación durante el periodo 2000-
2004.
2. Los estudios sobre gestión de riesgo en conflictos armados integran el carácter endógeno
de los eventos de riesgo mediante el análisis de la incertidumbre. Mientras que el modelo de
consumo sometido a restricciones de liquidez que desarrolló Deaton (1991) concentraba toda
la incertidumbre en los ingresos, en contextos de conflicto armado ésta también se da en los
ahorros (tanto en dinero como en especie) a causa del saqueo y la destrucción de bienes. Esto
último no se debe únicamente a un comportamiento predatorio o al simbolismo que ciertos
bienes adquieren en el conflicto253, como sugieren los estudios emergentes sobre gestión de
riesgo en situaciones de conflicto armado, sino que en el caso de los TPO creemos que
responden a una estrategia más compleja de desposesión y dominación.
Con el fin de explorar la naturaleza endógena de la ocupación israelí de los TPO durante el
periodo 2000-2004, se llevó a cabo un análisis de correlación entre los diferentes
instrumentos. Aunque generalmente la correlación es débil, se ha observado una fuerte
relación de signo positivo entre el número de obstáculos al movimiento (checkpoints,
terraplenes, etc.) y las variables que ilustran el número de heridos, la presencia del muro y de
asentamientos. Esta correlación cuestiona el argumento de Israel sobre si la política de
restricción al movimiento constituye una medida de seguridad temporal y pone en evidencia

372
sus objetivos de expansión territorial254. Esta diferencia en los fundamentos de los
instrumentos de la ocupación es importante a la hora de entender la gestión de riesgo, pues
explica tanto el alcance y profundidad del impacto como la forma y fortaleza de las
respuestas de la población afectada.
3. Otro aspecto relativo a la naturaleza de los eventos de riesgo que trata el análisis
descriptivo de esta investigación es su doble dimensión temporal. Por una parte, los
conflictos armados, en particular los crónicos, introducen cambios estructurales en las
comunidades afectadas. Por otra parte, el conflicto no es estático sino que se transforma a lo
largo del tiempo e introduce perturbaciones a pequeña escala y a corto plazo. A pesar de la
ausencia de análisis sobre el factor tiempo y de las dudas expresadas por varios autores acerca
de si los conflictos crónicos pueden tratarse como si fueran eventos de riesgo, en el caso de
los TPO hemos observado que es necesario tener en cuenta ambas dimensiones para captar el
impacto estructural y dinámico del conflicto. Por ejemplo, en los TPO, la introducción de
cientos de obstáculos a la movilidad - puntos de control, cortes de carreteras, trincheras,
terraplenes - y la construcción del Muro han fragmentado el territorio de Cisjordania en una
serie de enclaves y con ello las estructuras económicas y sociales de la sociedad palestina. Las
políticas que rigen estos instrumentos cambian continuamente su modus operandi – requisitos
para obtener el permiso de movimiento dentro de Cisjordania, la apertura de los checkpoints o
las puertas del Muro, el número y tipo de obstáculos emplazados en las carreteras, etc. -
impregnando los modos de vida de los palestinos con incertidumbre. Esta incertidumbre
administrativa y física está acompañada de una falta de transparencia y una aplicación
arbitraria de los procedimientos que han penetrado el tempo de la vida cotidiana en
Cisjordania creando una sensación de impotencia e incapacidad para controlar el futuro más
próximo.
Las estrategias de gestión de riesgo
Según el análisis de la literatura existente sobre la gestión de riesgo en conflictos armados y
de la situación en los TPO hemos visto que las respuestas de los hogares no son las mismas
que las observadas en países en vías de desarrollo durante crisis económicas y naturales. Y no
son iguales porque los sucesos de riesgo son diferentes y en consecuencia también lo son los
motivos de los hogares para adoptar las estrategias.
373
El análisis de los estudios de gestión de riesgo en conflictos armados muestra dos
importantes aspectos sobre cómo se están examinando las respuestas de los hogares.
1. A excepción de las estrategias relacionadas con el uso de la violencia y el apoyo a grupos
armados, la naturaleza del resto de las estrategias observadas son muy similares a las
adoptadas durante crisis naturales o económicas. Sin embargo, los resultados de las
entrevistas llevadas a cabo en Cisjordania indican que esta similitud no es real, sino que
probablemente está causada por la influencia de los estudios de gestión de riesgo en
contextos de crisis naturales o económicas. Así, las estrategias de gestión de riesgo observadas
en Cisjordania van más allá de los límites impuestos por la EPGC (la encuesta abarca 14
estrategias con un claro sesgo a favor de actos de consumo a posteriori) y muestran las
nuevas formas de capital social y económico nacidas de las redes sociales emergentes, de la
economía informal y de partidos políticos y de organizaciones humanitarias. Ejemplos de
esto son la localización de la producción, el comercio y los servicios, la solidaridad
comunitaria, la retirada de la economía monetaria (empleo del trueque y pagos en especie,
empleo de trabajo familiar), el apoyo y/o participación en la lucha armada, la inversión en
actividades de alto riesgo (la construcción sin licencia, el acceso a áreas prohibidas para
buscar trabajo, la permanencia en los TPO). Esta amplia visión de las estrategias de gestión
de riesgo debe ser entendida como una consecuencia de la representación de los eventos de
riesgo mencionada anteriormente donde éstos no se perciben como elementos aislados sino a
través de sus contextos de vulnerabilidad.
2. La siguiente observación tiene que ver con la motivación de los hogares al adoptar las
estrategias de gestión de riesgo. Aunque las motivaciones son importantes, raras veces son
objeto de investigación. Dentro del marco de la gestión de riesgo en países en vías de
desarrollo, se suele presuponer que las reacciones ante el riesgo se emprenden normalmente
para afrontar fluctuaciones de los ingresos, y más en particular, de la pérdida prevista o real
de ingresos asociada con sucesos de riesgo inciertos o con sus consecuencias. Sin embargo, en
contextos de conflicto armado hemos visto cómo se han identificado otras motivaciones más
allá de las puramente económicas, lo que podría indicar que la gestión de riesgo responde
ante los efectos multidimensionales del conflicto armado. Pensamos que la gestión de la
economía familiar para garantizar el consumo es una pieza más de un puzzle que comprende

374
otras necesidades relacionadas con la vulnerabilidad de los hogares a causa de la inseguridad
de los bienes255, y más en general, a causa de una estrategia de desposesión y dominación256.
Esto no significa que lo económico no importe. Importa, pero está vinculado al entorno
político. La gestión de la economía y seguridad familiares no puede desligarse de los motivos
ideológicos, que comprenden la lucha política y los compromisos individuales de reclamar
sus propios derechos vulnerados deliberadamente por el conflicto armado.
Estas relaciones entre la dimensión económica y política de la gestión de riesgo se ponen en
marcha en el momento en que los conflictos armados destruyen y bloquean sistemática y
deliberadamente las bases de bienes y las respuestas de los hogares afectados. Esta dinámica,
que establece un vínculo de interdependencia entre los eventos de riesgo y las estrategias de
los hogares, transforma los mecanismos de respuesta en formas de resistencia. Basándonos en
la definición de Scott (1985) sobre Everyday Forms of Resistance, según la cual las formas de
resistencia están determinadas por la intensidad y la estructura del sistema de dominación, y
de acuerdo con la manera en que los palestinos se refieren a sus estrategias de gestión, como
sumud257, los mecanismos de gestión de riesgo en contextos de conflicto armado deberían
concebirse como formas cotidianas de resistencia. Las estrategias utilitaristas e individualistas
que adoptan los palestinos para hacer frente a las perturbaciones producidas por la
ocupación y sus consecuencias persiguen su supervivencia económica dentro de un marco de
lucha por su independencia.
3. La duración del conflicto es un factor clave a tener en cuenta cuando analizamos la
gestión de riesgo de tales hogares. Cuando las perturbaciones se repiten a lo largo del tiempo,
es necesario captar los cambios fundamentales e irreversibles a corto plazo ocurridos en los
sistemas locales de los modos de vida. En este tipo de situaciones prescindir del factor
tiempo y considerar los sucesos de riesgo y la inseguridad de los hogares como temporales
podría encubrir el agotamiento y colapso de los modos de vida. En contextos donde no
existen bases de datos longitudinales, una manera de integrar esta doble dimensión temporal
podría ser a través de la distinción que hace Davies (1996) entre las estrategias transitorias e
inusuales empleadas para afrontar la dinámica a corto plazo y sobrevivir en el sistema vigente
(estrategias de supervivencia), y las estrategias a largo plazo y usuales adoptadas a
consecuencia de un cambio estructural en el sistema (estrategias de adaptación). Algunos
ejemplos de adaptación observados en los TPO pueden ser la localización de los modos de

375
vida – en particular la producción, comercio y los servicios – en las zonas cercadas debido a
la perdida de acceso a los mercados y servicios producida por la fragmentación del
territorio. Otros ejemplos de adaptación son aquellos derivados de las transformaciones
sufridas en la estructura del mercado laboral en favor de la participación de la mujer, del
autoempleo, trabajo familiar, agricultura de subsistencia para compensar la pérdida de
empleo de los hombres y del trabajo asalariado (UNSCO, 2005).
Para identificar las estrategias de afrontamiento y las de adaptación no bastan las actividades
en sí, se necesita conocer las razones por las que se emprenden, así como su frecuencia y
dependencia (Davies, 1996). Comprender el comportamiento de gestión de riesgo de esta
manera es, con mucho, una tarea más compleja que limitarse a observar si determinadas
actividades se realizan o no y presuponer su conexión con la vulnerabilidad de los hogares.
Así, para explorar la gestión de riesgo y poder inscribirla en sus contextos de vulnerabilidad,
la investigación de las estrategias de gestión de riesgo debería incluir información detallada
sobre los sucesos de riesgo y sus implicaciones en el contexto general del conflicto armado,
sobre las estrategias y su frecuencia, eficacia y sostenibilidad, así como sobre las motivaciones
de los hogares a corto y largo plazo. Esta información es esencial para evaluar cómo las
perturbaciones producidas por el conflicto armado afectan a las posibilidades de paz,
seguridad y desarrollo. Ni que decir tiene que el acopio de toda esta información sobre
sucesos de riesgo y estrategias requiere más trabajo en el procesamiento e interpretación de
datos. En vista del escaso conocimiento sobre el proceso de gestión de riesgo en el contexto
de un conflicto, se necesita hacer un esfuerzo para explorarlo desde cero sin los
encorsetamientos de los modelos de la gestión de riesgo durante crisis económicas y
naturales.
Los factores determinantes de la gestión de riesgo
Para entender los factores que influyen en la gestión de riesgo en contextos de conflicto
armado se requiere un cambio de enfoque: de los efectos a los eventos de riesgo. Si la
suposición de que los sucesos de riesgo eran factores exógenos llevó a desatender sus causas y
a definir la gestión de riesgo en base a ciertas características (como su intensidad, cobertura e
previsbilidad), pero sobre todo en base a factores económicos (asociados en su mayor parte
con la pobreza y los activos familiares), entonces su representación como factores endógenos

376
a la gestión de riesgo requiere reconocer que los eventos de riesgo son en algún grado
causantes y por ello deberían emplearse como la variable significativa que explicaría las
diferencias de vulnerabilidad entre hogares y grupos comunitarios. Al atraer la atención sobre
los sucesos de riesgo se le da importancia a las causas (políticas) por encima de los síntomas
(económicos). Esto no significa que los síntomas no importen: importan, pero no podemos
desligarlos de las causas. Según el enfoque de vulnerabilidad política, cuando analizamos las
características relacionadas con la naturaleza de las perturbaciones, la vulnerabilidad de los
hogares no puede atribuirse a la pobreza ni a un fallo de mercado si ha sido producida
deliberadamente (directa o indirectamente) y si su perpetuación favorece a los sectores
poderosos. Las relaciones observadas entre la inseguridad de los bienes y las estrategias de
gestión de riesgo, y las amplias motivaciones de los hogares en conflicto a la hora de elegir su
portafolio de estrategias, son una indicación sobre la necesidad de relacionar los síntomas
económicos con las causas políticas cuando se estudian los factores que influyen en la gestión
de riesgo en un contexto de vulnerabilidad política.
A pesar de ser un área emergente, el estudio del uso de la violencia en los TPO ha resultado
ser un buen laboratorio para entender los vínculos entre los diferentes factores que influyen
en las respuestas de los hogares en conflictos armados. A diferencia del discurso dominante
de Krueger y Male čková (2003), que analiza los ataques suicidas a través de indicadores
económicos cuantificables como la pobreza y la educación, Saleh (2004b) los examina a
través de las estrategias de la ocupación como son el uso de la violencia de los FDI y la
estrangulación económica de la política de restricción al movimiento. Según Saleh (2004b),
un análisis de la militancia palestina no puede desvincular los factores económicos de los
motivos ideológicos pues pasaría por alto la naturaleza de la lucha política, ya que no
consigue explicar las presiones sociopolíticas resultantes tales como la ira, la frustración, la
alienación y el deseo de represalia y venganza. En el contexto de los TPO, la economía
influye y está vinculada al clima político y a la frustración. El hecho de que la depresión
económica con niveles históricos de pobreza y desempleo encontrados en los TPO se
explique en gran medida por la política de restricción al movimiento, requiere tratar la
pobreza no sólo como un problema económico sino también político. Los resultados del
análisis de Saleh (2004b) muestran que los ataques suicidas palestinos sólo se reducirán si hay
un cambio en la política israelí de restricción al movimiento y en las operaciones militares
de las FDI que mejore las condiciones económicas, políticas y sociales de los TPO.

377
Con el fin de estudiar las estrategias de gestión de riesgo a través de sus causas más
inmediatas, se ha analizado en diferentes grupos de población (según las características socio-
económicas de los hogares y del lugar de residencia) la relación entre la intensidad de las
perturbaciones producidas por la ocupación israelí (uso de violencia, restricciones al
movimiento, anexión de tierra) y el empleo de estrategias de gestión de riesgo (estrategias de
solidaridad y de estabilización del ingreso).
Con respecto a las estrategias de estabilización del ingreso se han estudiado dos tipos de
respuesta: la diversificación de la oferta de mano de obra familiar y la agricultura y
ganadería. A pesar de la importancia que este tipo de respuestas cobran durante crisis de gran
cobertura y larga duración (Morduch, 1995), hemos observado en el análisis de asociación
que su utilización parece estar condicionada por la naturaleza de los eventos de riesgo.
Mientras la utilización de las estrategias de ingreso disminuye (a veces de modo no lineal)
con la intensidad de la violencia y los eventos de riesgo producidos por la construcción del
muro, ésta aumenta con la intensidad de las restricciones de movimiento. Teniendo en
cuenta la gran cobertura del conflicto y el grave impacto en el bienestar de las familias
palestinas, si suponemos que un aumento en la intensidad del conflicto debiera aumentar la
necesidad de recurrir a estrategias de gestión de riesgo, entonces una reducción del uso de
estas estrategias podría interpretarse o bien como una falta de recursos del hogar en cuestión
o como un bloqueo a los medios de acceso258. Interesados en esta última hipótesis se han
explorado los casos donde la utilización de las estrategias de ingreso es menor en los pueblos
más afectados por el conflicto.
Las diferencias observadas entre los diferentes tipos de eventos de riesgo y la homogeneidad
en el comportamiento de los hogares, independientemente de sus ventajas comparativas,
parecen descartar la hipótesis de la falta de recursos y confirmar la hipótesis del bloqueo. Los
resultados del análisis de asociación sugieren, en primer lugar, que el acceso a la tierra de
labor y a los mercados de trabajo en aldeas especialmente afectadas por los instrumentos de
ocupación no está determinado por las características económicas de los hogares sino por la
violencia de las FDI y el encierro que produce el muro, factores que bloquean el acceso y
restringen el movimiento aislando a las familias en sus hogares y aldeas. En segundo lugar,
vivir en un campo de refugiados o en aldeas remotas parece reducir la capacidad de los

378
hogares para recurrir a las estrategias de estabilización de ingreso cuando las restricciones de
movimiento son particularmente severas. Estos dos tipos de localidades son particularmente
vulnerables a las restricciones de movimiento debido a sus relaciones (laborales, comerciales
y de servicios) de dependencia con la ciudad. Dadas las limitaciones del análisis y los datos
disponibles habría que explorar si la vulnerabilidad de estas comunidades a la restricción de
movimiento se debe a una pobre infraestructura o a una alta exposición al conflicto así
como la relación de estos dos factores explicativos.
La segunda estrategia que hemos examinado en relación con los instrumentos de la
ocupación es la de la solidaridad entre familiares y entre miembros de la comunidad. En los
TPO, a pesar de la creencia general de que la estructura social y las redes de solidaridad entre
los palestinos son uno de los factores que salvaron a la economía del hundimiento durante
los cuatro años que siguieron a la declaración de la Intifada (UNCTAD, 2005; Banco
Mundial, 2004a), no hemos encontrado ningún análisis que estudie desde una perspectiva
micro esta cuestión. El análisis de asociación llevado a cabo por esta investigación es una
primera aproximación a esta cuestión. Los resultados indican que, de acuerdo con los
procesos contradictorios y complejos que afectan al capital social en situaciones de conflicto,
el grado en que los palestinos recurren a las estrategias de solidaridad según la intensidad de
las perturbaciones producidas por la ocupación varía según la naturaleza de los eventos de
riesgo y del grupo de solidaridad. Interesados en el papel de las estrategias de solidaridad
como amortiguador de las crisis, se exploraron con más detalle aquellos casos en que el uso
de la solidaridad es mayor en las aldeas más afectadas por el conflicto. Los resultados del
análisis de la gestión de riesgo parecen indicar que en los TPO la resiliencia de las estrategias
de solidaridad no sólo depende del tipo de capital social (bonding y bridging), como sugiere la
literatura sobre capital social y sociedad civil en contextos de conflicto armado259, sino
también de la naturaleza del grupo de solidaridad (familia, comunidad) al determinar las
condiciones de pertenencia y las normas de reciprocidad y confianza mutua; de las causas de
la perturbación (uso de violencia, anexión de tierras y restricción en los movimientos) que
influyen en la creación y destrucción del capital social; así como de las características de los
hogares y comunidades, las cuales condicionan la fortaleza del capital social y la exposición
al riesgo. Sería interesante explorar cómo los instrumentos de la ocupación interactúan con
el capital social y cómo esta interacción influye en el comportamiento de los mecanismos de

379
gestión de riesgo que tienen que ver con la distribución del riesgo entre los miembros de un
grupo.
A pesar de las limitaciones del análisis de asociación llevado a cabo para explorar las
estrategias de los hogares a través de sus casuas inmediatas, los resultados parecen indicar que
mientras la relación entre las estrategias y los eventos de riesgo se fortalece, la relación entre
las estrategias y la pobreza de los hogares se debilita. En aldeas gravemente afectadas por el
conflicto, la pobreza ya no parece que constituya la variable clave que explique las diferencias
de vulnerabilidad familiar entre hogares y entre grupos comunitarios.

380
El apoyo a las estrategias de gestión de riesgo en los TPO
Esta última sección propone algunas directrices extraídas de la investigación y esboza una
serie de medidas y enfoques orientados a la elaboración de políticas de cooperación al
desarrollo que podrían aplicar tanto la parte palestina como los donantes, con el objeto de
redefinir el trabajo de estos últimos en la reducción de la vulnerabilidad mediante el apoyo a
estrategias de gestión de riesgo.
La principal propuesta surge del análisis de la implicación de los donantes en el escenario
palestino, el cual muestra una llamativa desconexión entre las políticas diplomáticas de los
actores internacionales, las políticas y programas de ayuda internacional (en forma de ayuda
humanitaria y de cooperación al desarrollo) y la realidad sobre el terreno260 (Keating et al.,
2005). Los países e instituciones internacionales donantes deberían reevaluar radicalmente
los requisitos para unos modos de vida sostenibles en los TPO, teniendo en consideración la
creciente fragmentación territorial, socio-económica y política producida por una serie de
políticas como la ocupación militar continuada, el régimen de restricción al movimiento
impuesto en Cisjordania y la Franja de Gaza desde principios de la década de 1990, la
creación de una «realidad física sobre el terreno» en los TPO mediante medidas tales como la
ampliación de los asentamientos, la construcción de circunvalaciones y otras infraestructuras,
y la construcción del Muro a partir de 2002. Si Israel justifica estas políticas por motivos de
seguridad, éstas deberían ser entendidas como una continuación de la política israelí de
expansión territorial en los TPO, que comenzó en 1967 y conserva su ímpetu hasta el día de
hoy.
De esta manera, si realmente se quieren cumplir los objetivos de apoyar el proceso de paz y
mejorar las condiciones de vida de la población, las políticas de ayuda internacional deberían
ser reformadas de acuerdo con esta realidad. Si en este proceso de paz la solución de los dos
estados continúa siendo la predominante261, en este momento, sólo podrán salvarla los
esfuerzos internacionales y una constante presión sobre Israel para que concluya esta
ocupación de 46 años y se retire a sus fronteras anteriores a 1967. De tal modo, dentro de
una estrategia general de incidencia política, sensibilización y comunicación que enfatiza las
causas del conflicto sobre los síntomas, proponemos intervenciones a pequeña escala para
reducir la vulnerabilidad de los hogares a través del apoyo a estrategias de gestión de riesgo

381
que refuercen el sumud palestino para resistir las políticas israelíes de desposesión y
dominación y transformen la situación actual de un modo que contribuya a la reducción
duradera de la vulnerabilidad política y económica.
Para determinar este tipo de estrategia de gestión de riesgo, se debería realizar un breve
estudio que, teniendo en cuenta las cuestiones tratadas en esta investigación, elaborase un
mapa de estrategias de gestión de riesgo de los hogares y de su funcionamiento dentro del
contexto de vulnerabilidad palestino. Este trabajo presentaría un abanico de posibilidades de
reducción de la vulnerabilidad de los hogares que no perpetué la fragmentación de los
modos de vida. De entre los diferentes mecanismos de gestión de riesgo que se han estudiado
con detalle en el marco de esta investigación hay dos que nos han parecido especialmente
efectivos para afrontar respectivamente la fragmentación social y la expansión territorial
israelí: las estrategias de solidaridad y la agricultura de subsistencia.
Las estrategias de solidaridad son una importante fuente de apoyo en los TPO. La solidaridad
se han concebido sobre todo a través de las redes establecidas por la familia, amigos y
organizaciones caritativas (en su mayoría ONGs). Sin embargo, es necesario ir más allá e
incluir a otros actores tales como las organizaciones de profesionales, los sindicatos, las
asociaciones de ciudadanos, municipales y locales, las de comunidades y los comités
populares. Dada la forma contradictoria y compleja en que el conflicto afecta al capital
social, entendido como la base de la solidaridad y más en general como la base de la
cohesión social, es necesario estudiar cómo el capital social interactúa con las estrategias de
los modos de vida de la población así como con el contexto más general de la economía
política, a fin de averiguar en qué condiciones se fortalece o se debilita. Por ejemplo, como
sostiene Nablusi (2005), habría que legitimar y apoyar la vida asociativa de base o
comunitaria, la cual ha sido ignorada por los donantes en su intento de construir una
sociedad civil apolítica a través de la creación de ONGs mantenidas a través de cuantiosas
subvenciones. Si bien es cierto que a los donantes no les agrada la idea de apoyar redes de
solidaridad constituidas por estructuras representativas asociativas y a menudo políticas,
éstas, a diferencia de las ONGs creadas y/o financiadas por los donantes, al menos tienen la
ventaja de estar fundamentadas en estructuras de base legítima y comprometida con la causa
palestina de la autodeterminación.

382
La segunda estrategia de gestión de riesgo que podría desafiar la actual situación de poder y
contribuir al sumud palestino es la de la ganadería y la agricultura de regadío. Habiendo sido
abandonada por los palestinos a cambio de trabajo no cualificado en Israel, hoy en día se ha
convertido para un amplio grupo de hogares en un sector de alta resiliencia y amortiguador
de las consecuencias de las políticas de restricción al movimiento. A pesar de la importancia
de la agricultura, los donantes apenas le han prestado atención y la han considerado un
asunto delicado dado que está relacionada con cuestiones del uso del agua y de la tierra (gran
parte de las tierras cultivables se encuentran en el Área C). Esta es exactamente la razón por
la que pensamos que hay que apoyar al sector de la agricultura: para que cambie la dinámica
de poder que ha regido la distribución de la ayuda, especialmente en aquellos sectores
implicados en las polémicas cuestiones de la tierra, el territorio y el control de recursos (el
transporte, la agricultura y la energía), y que ha permitido y contribuido al proceso de
fragmentación de los TPO.

383

384
Reunido el Tribunal que suscribe en el día de la fecha acordó otorgar, por
________________________________________________________ a la Tesis Doctoral de Dña.
SILVIA JARAUTA BERNAL la calificación de ________________ .
Alicante ______ de _________ de _________.
El Secretario, El Presidente,
UNIVERSIDAD DE ALICANTE Comisión de Doctorado
La presente Tesis de Dña. SILVIA JARAUTA BERNAL ha sido registrada con el nº ____________
del registro de entrada correspondiente.
Alicante _____ de __________ de _____.
El Encargado del Registro,

385
La defensa de la tesis doctoral realizada por Dña. SILVIA JARAUTA BERNAL se ha realizado en
las siguientes lenguas: INGLES y CASTELLANO, lo que unido al cumplimiento del resto de
requisitos establecidos en la Normativa propia de la UA le otorga la mención de “Doctor Europeo”.
Alicante, ____________de _________ de ________.
El Secretario, El Presidente,


![Multifunctional Cement Composites Strain and …rua.ua.es/dspace/bitstream/10045/33758/1/2013_Baeza_etal_Materials.pdfelectromagnetic interference shielding material [5–7,10] or](https://img.pdfslide.us/doc/110x75/5ab1b1ee7f8b9a00728ca408/multifunctional-cement-composites-strain-and-ruauaesdspacebitstream100453375812013baezaetal.jpg)