Embed Size (px)
Citation preview
RTR Telecom Monitor4th Qua r t e r 2 0 0 9
Data up to June 2009
PREFACE 2
SECTION 1
Fixed-link network 3
SECTION 2
Leased lines 14
SECTION 3
Mobile communications 18
SECTION 4
Comparisons of fixed-link 28
and mobile networks
SECTION 5
Broadband 31
SECTION 6
Business indicators 39
SECTION 7
Appendix 42
Publishing information: Owner, publisher, producer and editor: Austrian RegulatoryAuthority for Broadcasting and Telecommunications (RTR-GmbH), MariahilferStrasse 77-79, A-1060 Vienna, Austria. Tel.: +43 (0)1 58058-0, Fax: +43 (0)1 58058-9191,e-mail: [email protected], http://www.rtr.at. Company Register No. (FN) 208312t – publishedand produced in Vienna, Austria.
PREFACE 2
RTR Telecom Monitor 4 t h Q u a r t e r 2 0 0 9
Preface
Dear Readers,
This section provides information about how the data for the Telecom Monitor is collected and aboutthe basis for data collection and statistical analyses.
Communications Survey Ordinance (KEV)
Under the Communications Survey Ordinance (KEV, Federal Law Gazette II No. 365/2004), which wentinto effect on October 10, 2004, the Austrian Regulatory Authority for Broadcasting and Telecommuni -cations (RTR) is required to carry out statistical surveys and data analyses on a quarterly basis. Thedata collected is to be made available to the public in such a way that information on specific compa-nies can not be deduced. The ordinance essentially pursues two objectives: First, the quarterly collection and publication of keymarket indicators is meant to increase the efficiency of RTR's monitoring process in order to maintainthe authority's transparent, forward-looking and competition-oriented regulatory approach for allmarket participants (companies and consumers) as a means of promoting and ensuring growth,investment and innovation in the sector. Second, these activities serve to inform the interested publicabout the development of the telecommunications markets with current market data. In addition, RTRmakes the KEV data available to Statistics Austria.
Data collection
In order to minimize expenses for the operators, RTR has defined the sample based on Art. 4 Par. 1KEV in such a way that, on the basis of the overall population from the most recent market analyses,a minimum market share of 90% is covered in each cluster (fixed-link, mobile communications, leasedlines and broadband), thus ensuring a representative view of the market situation. RTR then uses thissample as a basis for extrapolation regarding the overall population.
Statistical evaluations and data values
In line with its publishing obligation under Art. 7 Par. 2 KEV, RTR reports the statistics explicitlymentioned in that provision separately for the fixed-link network, mobile communications, leasedlines and broadband using a cluster approach. Due to occasional post-hoc data corrections, the valuesin the charts presented here may differ slightly from the information provided in earlier issues of theTelecom Monitor. Where major deviations (> 5%) arise in individual data values, a comment to thiseffect is provided for the figure in question.
The RTR Team
3
RTR Telecom Monitor 4 t h Q u a r t e r 2 0 0 9
Section 1 Fixed-link network
SECTION 1 I FIXED-LINK NETWORK 4
RTR Telecom Monitor 4 t h Q u a r t e r 2 0 0 9
n Fixed-link penetration (households) n Fixed-link penetration (businesses)
0%
50%
100%
150%
200%
250%
300%
Q12007
Q22007
60%
240%
59%
241%
Q32006
63%
240%
Q42006
62%
239%
Q32007
Q42007
58%
240%
57%
238%
Q12008
58%
222%
Q22008
57%
221%
Q32008
57%
220%
Q42008
57%
222%
Q12009
58%
208%
Q22009
57%
207%
The chart above shows fixed-link penetration rates among households and businesses.
The higher penetration rate among businesses is explained by the fact that companies each generallyhave a larger number of fixed-link lines, meaning that this figure is not directly comparable to thepenetration rate for households.
n For approximately two years now, the penetration rate among households has remained at a constant level; this rate came to 57% in Q2 2009.
n After a sharp decline between Q4 2008 and Q1 2009, the penetration rate for business customers remained roughly at the same level as in the previous quarter, coming to 207% in Q2 2009.
Fixed-link penetration·FIXED-LINK PENETRATION REMAINS STABLE AMONG RETAIL CUSTOMERS
SECTION 1 I FIXED-LINK NETWORK 5
RTR Telecom Monitor 4 t h Q u a r t e r 2 0 0 9
n Retail revenues from access services (residential customers) n Retail revenues from access services (business customers)
€ 0
€ 20,000
€ 40,000
€ 60,000
€ 80,000
€ 100,000
€ 120,000
Q12007
91,700
51,7
00
Q22007
89,200
51,5
00
Q32006
96,600
50,1
00
Rev
enue
s (t
hous
ands
)
Q42006
95,300
50,0
00
Q32007
86,400
51,0
00
Q42007
83,600
51,4
00
Q12008
86,400
49,5
00
Q22008
83,900
49,3
00
Q32008
82,000
48,8
00
Q42008
80,300
48,1
00
Q12009
83,500
45,9
00
Q22009
82,200
45,4
00
Retail revenues from access services include periodic base fees and setup charges.
Base fees refer to revenues which are earned periodically and do not depend on the actual use of the subscriber line.
Setup charges for subscriber lines include revenues generated by the setup, transfer and disconnection ofsubscriber lines for voice telephony.
n Compared to the previous quarter, retail revenues from access services declined very slightly in both the residential and business segments (approximately -2% for residential customers and -1%for business customers).
n The share of overall revenues which can be attributed to the business segment came to approximately 36% in Q2 2009. At the same time, the business segment accounted for 23% of the overall number of fixed-link lines.
Retail revenues from access services·REVENUES STABLE
SECTION 1 I FIXED-LINK NETWORK 6
RTR Telecom Monitor 4 t h Q u a r t e r 2 0 0 9
n Revenues from carrier services (residential customers) n Revenues from carrier services (business customers)
€ 0Q1
2007
78,300
84,7
00
Q22007
70,800 80,1
00
€ 20,000
€ 40,000
€ 60,000
€ 80,000
€ 100,000
€ 120,000
Rev
enue
s (t
hous
ands
)
Q32006
86,700
85,6
00
Q42006
87,000
85,0
00
Q32007
67,300 77,5
00
Q42007
67,800
74,8
00
Q12008
62,200 7
2,4
00
Q22008
58,200 6
9,9
00
Q32008
55,700 6
6,5
00
Q42008
60,500
64,4
00
Q12009
57,600
58,2
00
Q22009
52,500
53,9
00
Retail revenues from carrier services are based on call minutes.
The revenues shown above include retail fees charged by operators for calls to the domestic fixed-link network, domestic mobile networks, international destinations, online services and service numbers.
The corresponding wholesale revenues are not included in these figures.
n The steady decline in retail revenues from carrier services provided for business customers over the entire time series also continued in Q2 2009. Compared to the previous quarter, revenues dropped by approximately 7.4%.
n In the residential segment, revenues from carrier services again decreased after a brief seasonal increase in Q4 2008; these revenues came to a total of EUR 52.5 million.
Retail revenues from carrier services·REVENUES CONTINUE TO DECLINE
SECTION 1 I FIXED-LINK NETWORK 7
RTR Telecom Monitor 4 t h Q u a r t e r 2 0 0 9
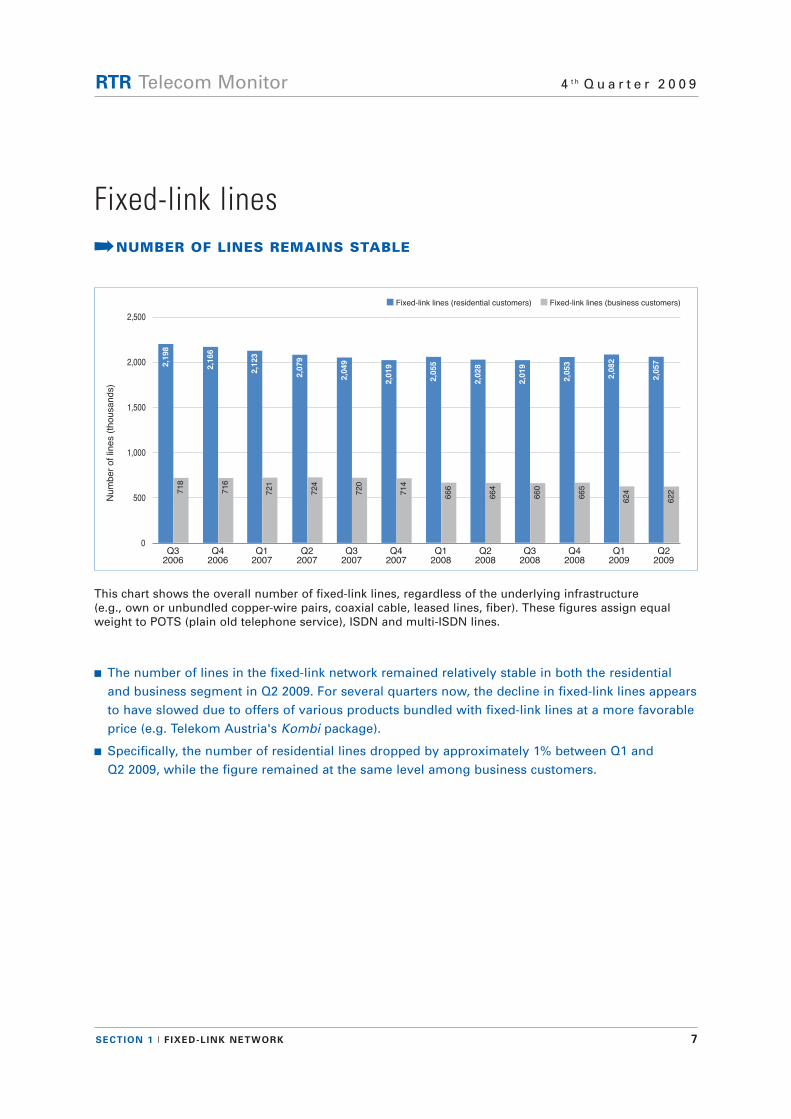
n Fixed-link lines (residential customers) n Fixed-link lines (business customers)
0Q1
2007
2,123
721
Q22007
2,079
724
500
Q32006
2,198
718
Q42006
2,166
716
1,000
1,500
2,000
2,500
Q32007
2,049
720
Q42007
2,019
714
Num
ber
of
lines (
tho
usa
nd
s)
Q12008
2,055
666
Q22008
2,028
664
Q32008
2,019
660
Q42008
2,053
665
Q12009
2,082
624
Q22009
2,057
622
This chart shows the overall number of fixed-link lines, regardless of the underlying infrastructure (e.g., own or unbundled copper-wire pairs, coaxial cable, leased lines, fiber). These figures assign equalweight to POTS (plain old telephone service), ISDN and multi-ISDN lines.
n The number of lines in the fixed-link network remained relatively stable in both the residential and business segment in Q2 2009. For several quarters now, the decline in fixed-link lines appearsto have slowed due to offers of various products bundled with fixed-link lines at a more favorableprice (e.g. Telekom Austria's Kombi package).
n Specifically, the number of residential lines dropped by approximately 1% between Q1 and Q2 2009, while the figure remained at the same level among business customers.
Fixed-link lines·NUMBER OF LINES REMAINS STABLE
SECTION 1 I FIXED-LINK NETWORK 8
RTR Telecom Monitor 4 t h Q u a r t e r 2 0 0 9
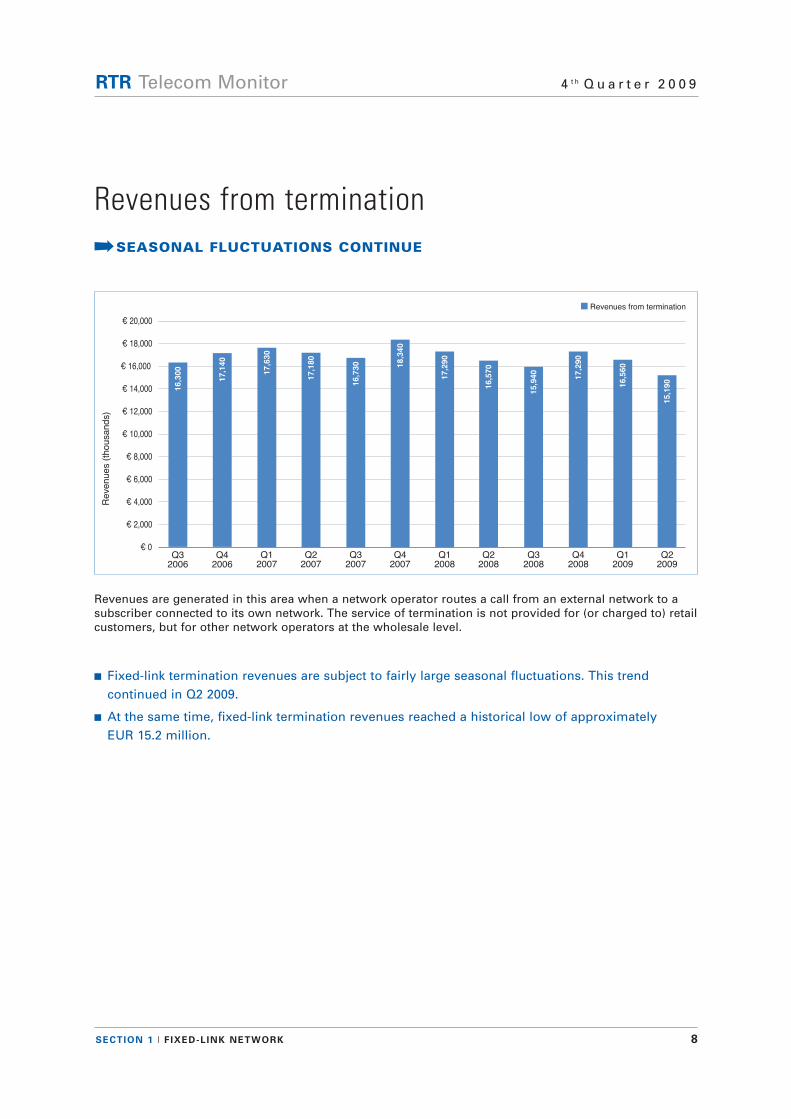
n Revenues from termination
€ 0Q1
2007
17,630
Q22007
17,180
€ 2,000
€ 4,000
€ 6,000
€ 8,000
€ 10,000
€ 12,000
€ 14,000
€ 16,000
€ 18,000
€ 20,000
Revenues (
thousa
nd
s)
Q32006
16,300
Q42006
17,140
Q32007
16,730
Q42007
18,340
Q12008
17,290
Q22008
16,570
Q32008
15,940
Q42008
17,290
Q12009
16,560
Q22009
15,190
Revenues are generated in this area when a network operator routes a call from an external network to asubscriber connected to its own network. The service of termination is not provided for (or charged to) retailcustomers, but for other network operators at the wholesale level.
n Fixed-link termination revenues are subject to fairly large seasonal fluctuations. This trend continued in Q2 2009.
n At the same time, fixed-link termination revenues reached a historical low of approximately EUR 15.2 million.
Revenues from termination·SEASONAL FLUCTUATIONS CONTINUE
SECTION 1 I FIXED-LINK NETWORK 9
RTR Telecom Monitor 4 t h Q u a r t e r 2 0 0 9
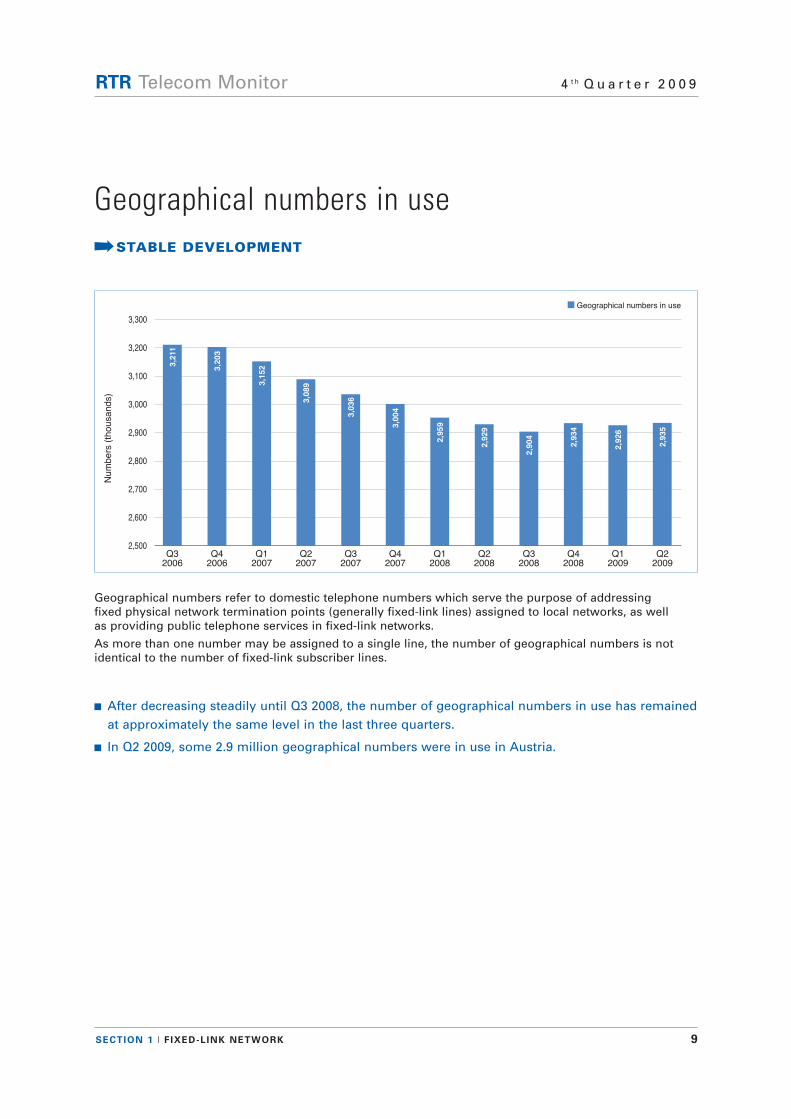
n Geographical numbers in use
2,500Q4
2007
3,004
Num
bers
(th
ou
sa
nd
s)
Q32006
3,211
Q42006
3,203
Q12007
3,152
Q22007
3,089
2,600
2,700
2,800
2,900
3,000
3,100
3,200
3,300
Q32007
3,036
Q12008
2,959
Q22008
2,929
Q32008
2,904
Q42008
2,934
Q12009
2,926
Q22009
2,935
Geographical numbers refer to domestic telephone numbers which serve the purpose of addressing fixed physical network termination points (generally fixed-link lines) assigned to local networks, as well as providing public telephone services in fixed-link networks.
As more than one number may be assigned to a single line, the number of geographical numbers is notidentical to the number of fixed-link subscriber lines.
n After decreasing steadily until Q3 2008, the number of geographical numbers in use has remainedat approximately the same level in the last three quarters.
n In Q2 2009, some 2.9 million geographical numbers were in use in Austria.
Geographical numbers in use·STABLE DEVELOPMENT
SECTION 1 I FIXED-LINK NETWORK 10
RTR Telecom Monitor 4 t h Q u a r t e r 2 0 0 9
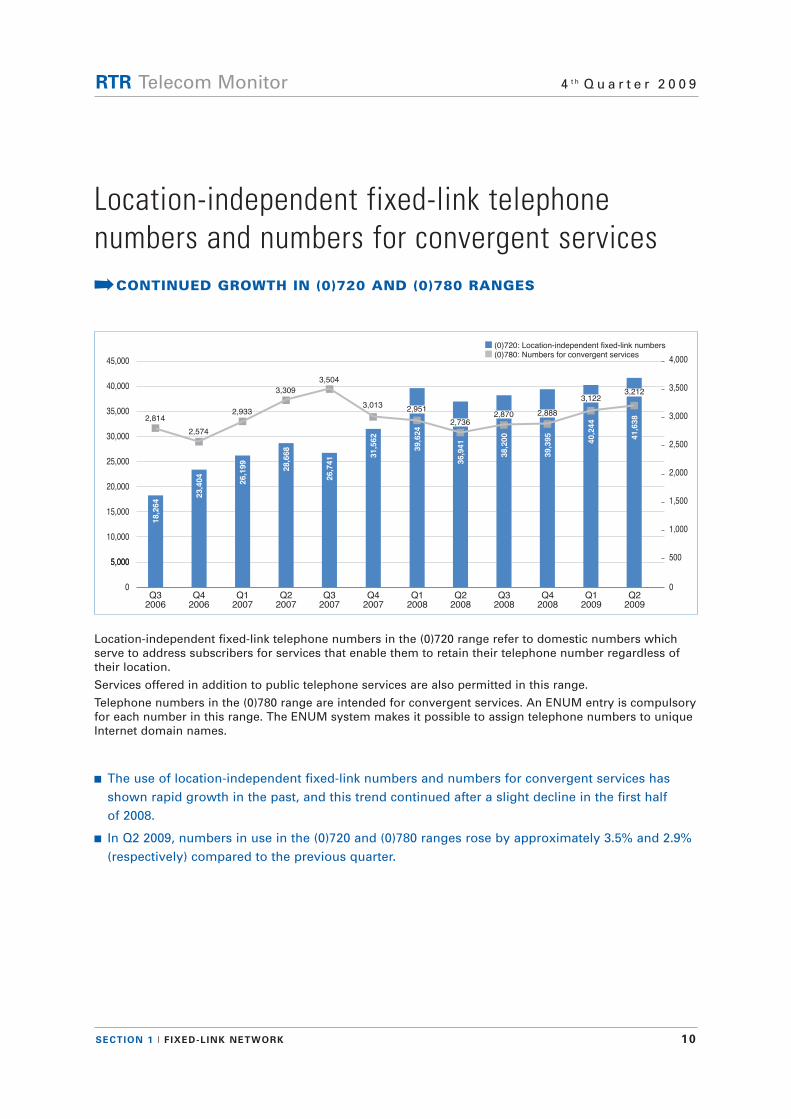
n (0)720: Location-independent fixed-link numbersn (0)780: Numbers for convergent services
0Q3
2006
18,264
Q42006
23,404
Q12007
26,199
Q22007
28,668
Q42007
31,562
0
4,000
Q32007
26,741
3,500
3,000
2,500
2,000
1,500
1,000
500
2,814
2,574
2,933
3,309
3,504
3,013
Q12008
39,624
2,951
5,0005,000
10,000
15,000
20,000
25,000
30,000
35,000
40,000
45,000
Q22008
36,941
2,736
Q32008
38,200
2,870
Q42008
39,395
2,888
Q12009
40,244
3,122
Q22009
41,638
3,212
Location-independent fixed-link telephone numbers in the (0)720 range refer to domestic numbers whichserve to address subscribers for services that enable them to retain their telephone number regardless oftheir location.
Services offered in addition to public telephone services are also permitted in this range.
Telephone numbers in the (0)780 range are intended for convergent services. An ENUM entry is compulsoryfor each number in this range. The ENUM system makes it possible to assign telephone numbers to uniqueInternet domain names.
n The use of location-independent fixed-link numbers and numbers for convergent services has shown rapid growth in the past, and this trend continued after a slight decline in the first half of 2008.
n In Q2 2009, numbers in use in the (0)720 and (0)780 ranges rose by approximately 3.5% and 2.9% (respectively) compared to the previous quarter.
Location-independent fixed-link telephone numbers and numbers for convergent services·CONTINUED GROWTH IN (0)720 AND (0)780 RANGES
SECTION 1 I FIXED-LINK NETWORK 11
RTR Telecom Monitor 4 t h Q u a r t e r 2 0 0 9
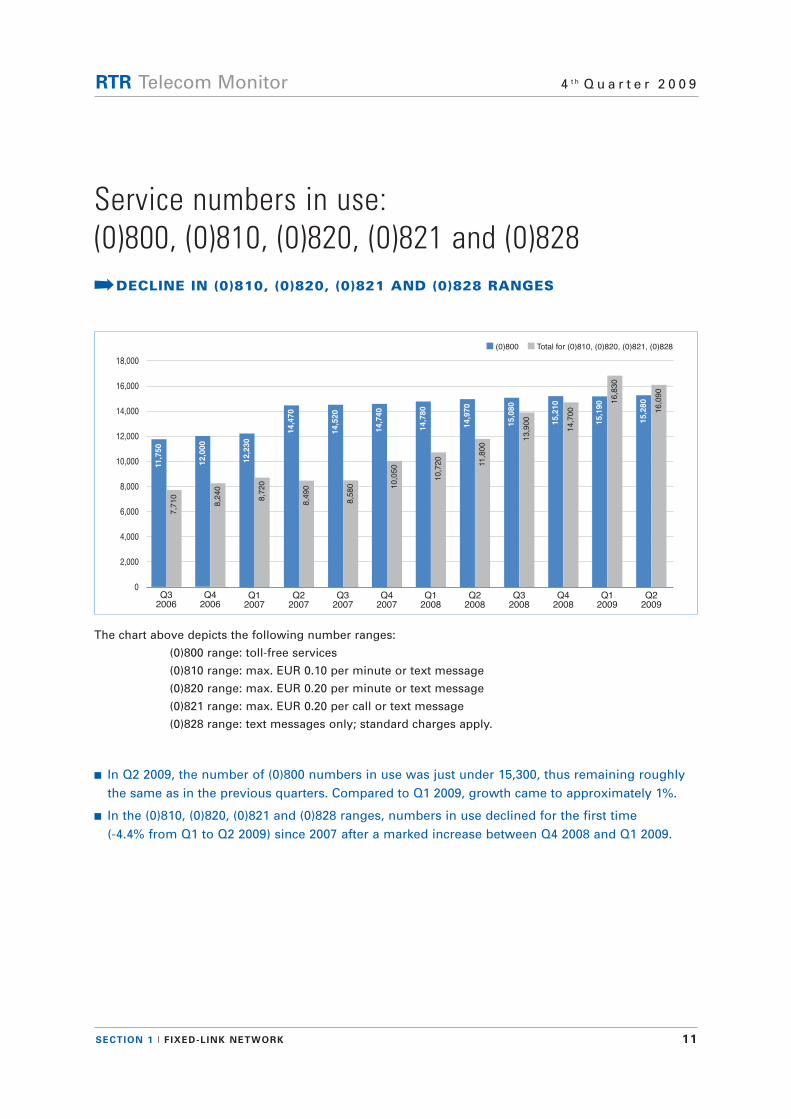
n (0)800 n Total for (0)810, (0)820, (0)821, (0)828
0Q1
2007
12,230
8,7
20
Q22007
14,470
8,4
90
Q32007
14,520
8,5
80
Q32006
11,750
7,7
10
Q42006
12,000
8,2
40
Q42007
14,740
10,0
50
Q12008
14,780
10,7
20
Q22008
14,970
11,8
00
Q32008
15,080
13,9
00
Q42008
15,210
14,7
00
Q12009
15,190 1
6,8
30
2,000
4,000
6,000
8,000
10,000
12,000
14,000
16,000
18,000
Q22009
15,280
16,0
90
The chart above depicts the following number ranges:
(0)800 range: toll-free services
(0)810 range: max. EUR 0.10 per minute or text message
(0)820 range: max. EUR 0.20 per minute or text message
(0)821 range: max. EUR 0.20 per call or text message
(0)828 range: text messages only; standard charges apply.
n In Q2 2009, the number of (0)800 numbers in use was just under 15,300, thus remaining roughly the same as in the previous quarters. Compared to Q1 2009, growth came to approximately 1%.
n In the (0)810, (0)820, (0)821 and (0)828 ranges, numbers in use declined for the first time (-4.4% from Q1 to Q2 2009) since 2007 after a marked increase between Q4 2008 and Q1 2009.
Service numbers in use: (0)800, (0)810, (0)820, (0)821 and (0)828·DECLINE IN (0)810, (0)820, (0)821 AND (0)828 RANGES
SECTION 1 I FIXED-LINK NETWORK 12
RTR Telecom Monitor 4 t h Q u a r t e r 2 0 0 9
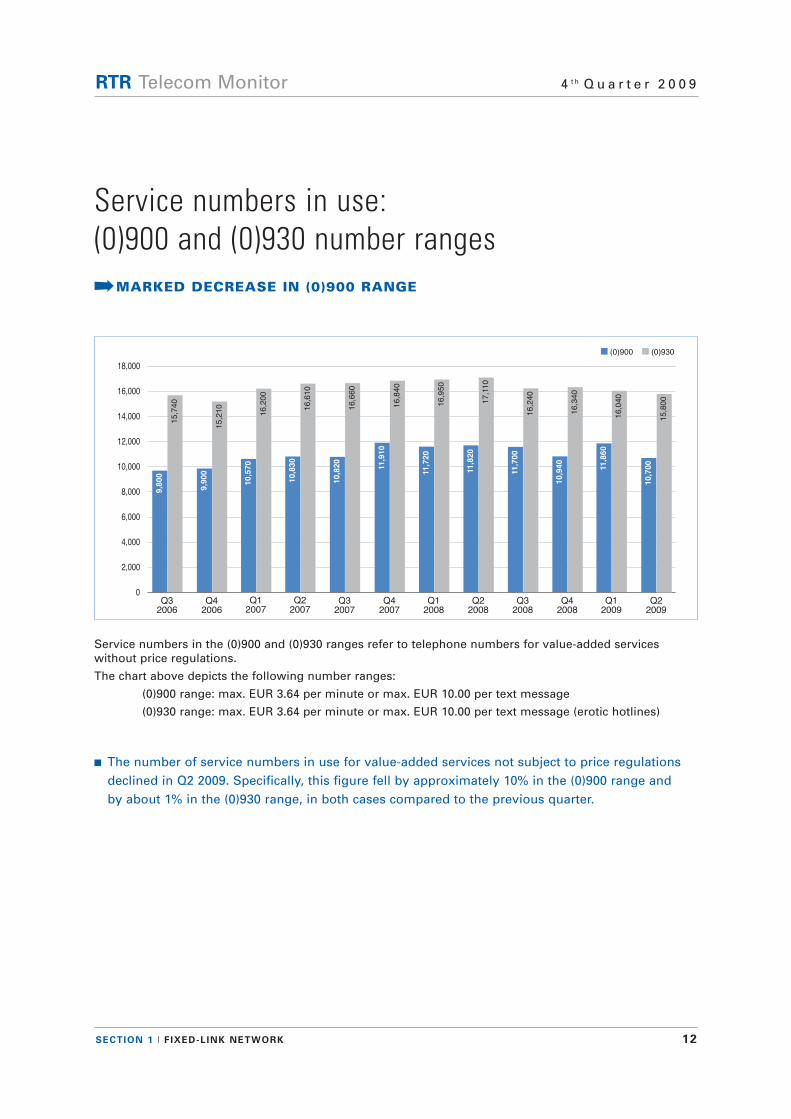
n (0)900 n (0)930
0Q1
2007
10,570
16,2
00
Q22007
10,830
16,6
10
Q32007
10,820
16,6
60
2,000
4,000
6,000
8,000
10,000
12,000
14,000
16,000
18,000
Q32006
9,800
15,7
40
Q42006
9,900
15,2
10
Q42007
11,910
16,8
40
Q12008
11,720
16,9
50
Q22008
11,820
17,1
10
Q32008
11,700
16,2
40
Q42008
10,940
16,3
40
Q12009
11,860
16,0
40
Q22009
10,700
15,8
00
Service numbers in the (0)900 and (0)930 ranges refer to telephone numbers for value-added services without price regulations.
The chart above depicts the following number ranges:
(0)900 range: max. EUR 3.64 per minute or max. EUR 10.00 per text message
(0)930 range: max. EUR 3.64 per minute or max. EUR 10.00 per text message (erotic hotlines)
n The number of service numbers in use for value-added services not subject to price regulations declined in Q2 2009. Specifically, this figure fell by approximately 10% in the (0)900 range and by about 1% in the (0)930 range, in both cases compared to the previous quarter.
Service numbers in use: (0)900 and (0)930 number ranges·MARKED DECREASE IN (0)900 RANGE
SECTION 1 I FIXED-LINK NETWORK 13
RTR Telecom Monitor 4 t h Q u a r t e r 2 0 0 9
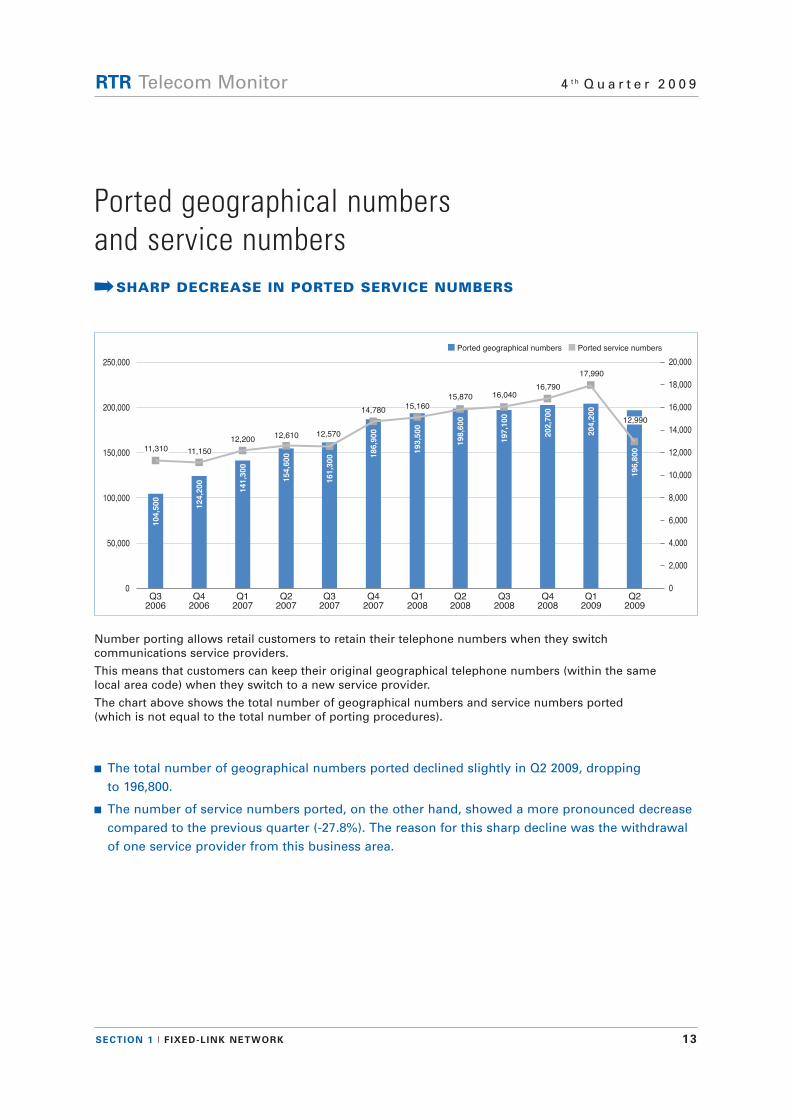
n Ported geographical numbers n Ported service numbers
0
50,000
Q32006
104,500
Q42006
124,200
Q12007
141,300
Q22007
154,600
Q42007
186,900
0Q3
2007
161,300
11,310 11,150
12,20012,610 12,570
14,780
Q12008
193,500
15,160
Q22008
198,600
15,870
100,000
150,000
200,000
250,000
Q32008
197,100
16,040
Q42008
202,700
16,790
2,000
4,000
6,000
8,000
10,000
12,000
14,000
16,000
18,000
20,000
Q12009
204,200
17,990
Q22009
196,800
12,990
Number porting allows retail customers to retain their telephone numbers when they switch communications service providers.
This means that customers can keep their original geographical telephone numbers (within the same local area code) when they switch to a new service provider.
The chart above shows the total number of geographical numbers and service numbers ported (which is not equal to the total number of porting procedures).
n The total number of geographical numbers ported declined slightly in Q2 2009, dropping to 196,800.
n The number of service numbers ported, on the other hand, showed a more pronounced decreasecompared to the previous quarter (-27.8%). The reason for this sharp decline was the withdrawalof one service provider from this business area.
Ported geographical numbers and service numbers·SHARP DECREASE IN PORTED SERVICE NUMBERS
14
RTR Telecom Monitor 4 t h Q u a r t e r 2 0 0 9
Section 2 Leased lines
SECTION 2 I LEASED LINES 15
RTR Telecom Monitor 4 t h Q u a r t e r 2 0 0 9
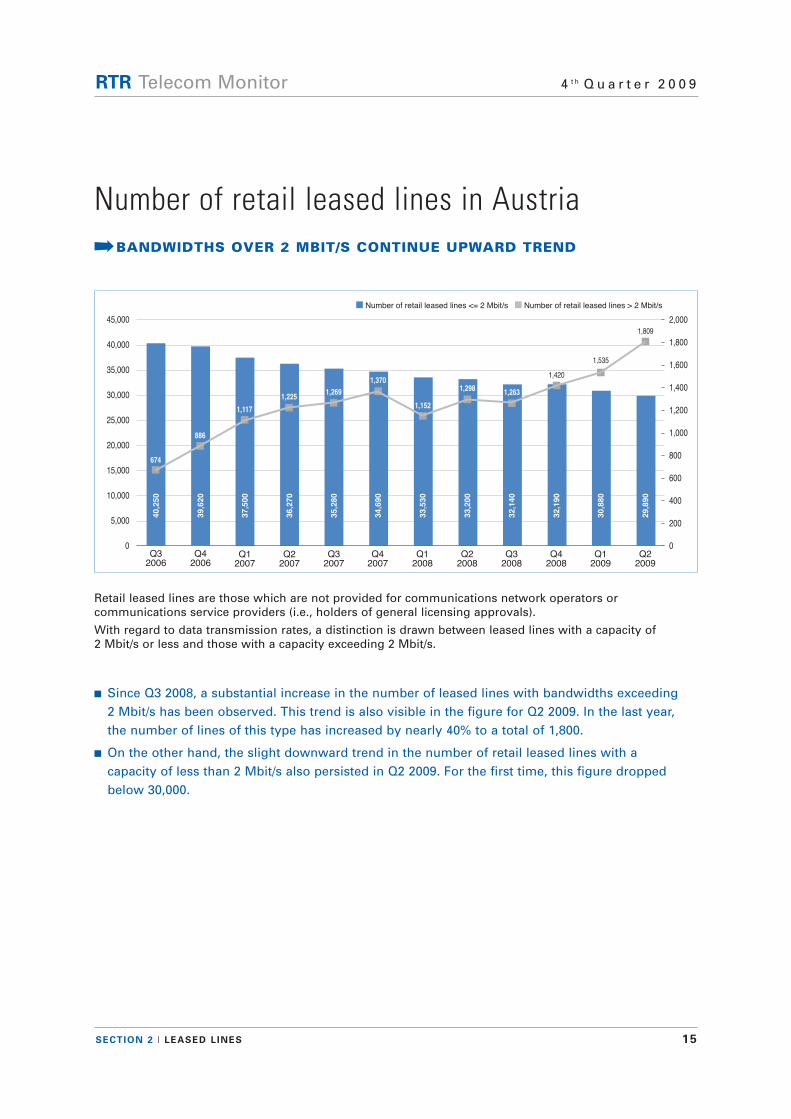
n Number of retail leased lines <= 2 Mbit/s n Number of retail leased lines > 2 Mbit/s
0 0Q4
2007
34,690
674
Q32006
40,250
886
Q42006
39,620
Q32007
35,280
1,370
Q22007
36,270
1,269
Q12007
37,500
1,225
Q12008
33,530
1,1521,117
Q22008
33,200
1,298
Q32008
32,140
1,263
Q42008
32,190
1,420
5,000
10,000
15,000
20,000
25,000
30,000
35,000
40,000
45,000
200
Q12009
30,880
1,535
Q22009
29,890
1,809
400
600
800
1,000
1,200
1,400
1,600
1,800
2,000
Retail leased lines are those which are not provided for communications network operators or communications service providers (i.e., holders of general licensing approvals).
With regard to data transmission rates, a distinction is drawn between leased lines with a capacity of 2 Mbit/s or less and those with a capacity exceeding 2 Mbit/s.
n Since Q3 2008, a substantial increase in the number of leased lines with bandwidths exceeding2 Mbit/s has been observed. This trend is also visible in the figure for Q2 2009. In the last year, the number of lines of this type has increased by nearly 40% to a total of 1,800.
n On the other hand, the slight downward trend in the number of retail leased lines with a capacity of less than 2 Mbit/s also persisted in Q2 2009. For the first time, this figure dropped below 30,000.
Number of retail leased lines in Austria·BANDWIDTHS OVER 2 MBIT/S CONTINUE UPWARD TREND
SECTION 2 I LEASED LINES 16
RTR Telecom Monitor 4 t h Q u a r t e r 2 0 0 9
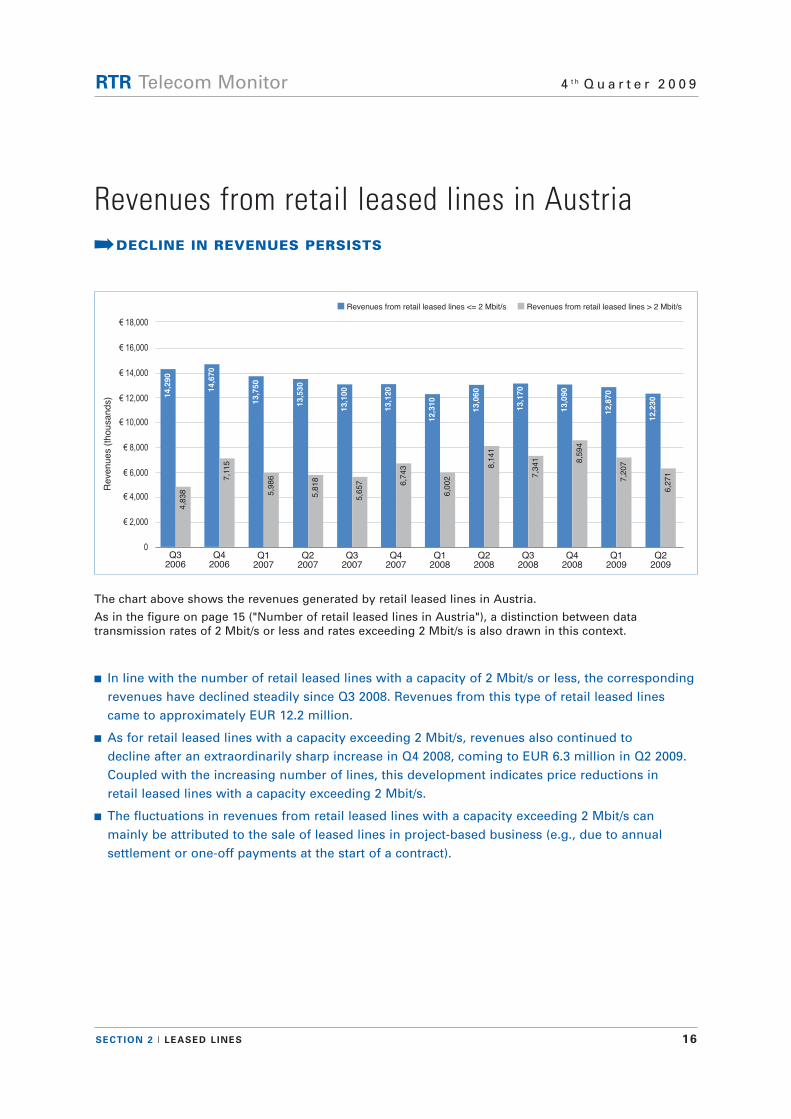
n Revenues from retail leased lines <= 2 Mbit/s n Revenues from retail leased lines > 2 Mbit/s
0Q1
2007
13,750
5,9
86
Q22007
13,530
5,8
18
Q32007
13,100
5,6
57
€ 2,000
Q32006
14,290
4,8
38
Q42006
14,670
7,1
15
Q42007
13,120
6,7
43
€ 4,000
€ 6,000
€ 8,000
€ 10,000
€ 12,000
€ 14,000
€ 16,000
€ 18,000
Revenues (
tho
usa
nd
s)
Q12008
12,310
6,0
02
Q22008
13,060
8,1
41
Q32008
13,170
7,3
41
Q42008
13,090
8,5
94
Q12009
12,870
7,2
07
Q22009
12,230
6,2
71
The chart above shows the revenues generated by retail leased lines in Austria.
As in the figure on page 15 ("Number of retail leased lines in Austria"), a distinction between data transmission rates of 2 Mbit/s or less and rates exceeding 2 Mbit/s is also drawn in this context.
n In line with the number of retail leased lines with a capacity of 2 Mbit/s or less, the correspondingrevenues have declined steadily since Q3 2008. Revenues from this type of retail leased lines came to approximately EUR 12.2 million.
n As for retail leased lines with a capacity exceeding 2 Mbit/s, revenues also continued to decline after an extraordinarily sharp increase in Q4 2008, coming to EUR 6.3 million in Q2 2009. Coupled with the increasing number of lines, this development indicates price reductions in retail leased lines with a capacity exceeding 2 Mbit/s.
n The fluctuations in revenues from retail leased lines with a capacity exceeding 2 Mbit/s can mainly be attributed to the sale of leased lines in project-based business (e.g., due to annual settlement or one-off payments at the start of a contract).
Revenues from retail leased lines in Austria·DECLINE IN REVENUES PERSISTS
SECTION 2 I LEASED LINES 17
RTR Telecom Monitor 4 t h Q u a r t e r 2 0 0 9
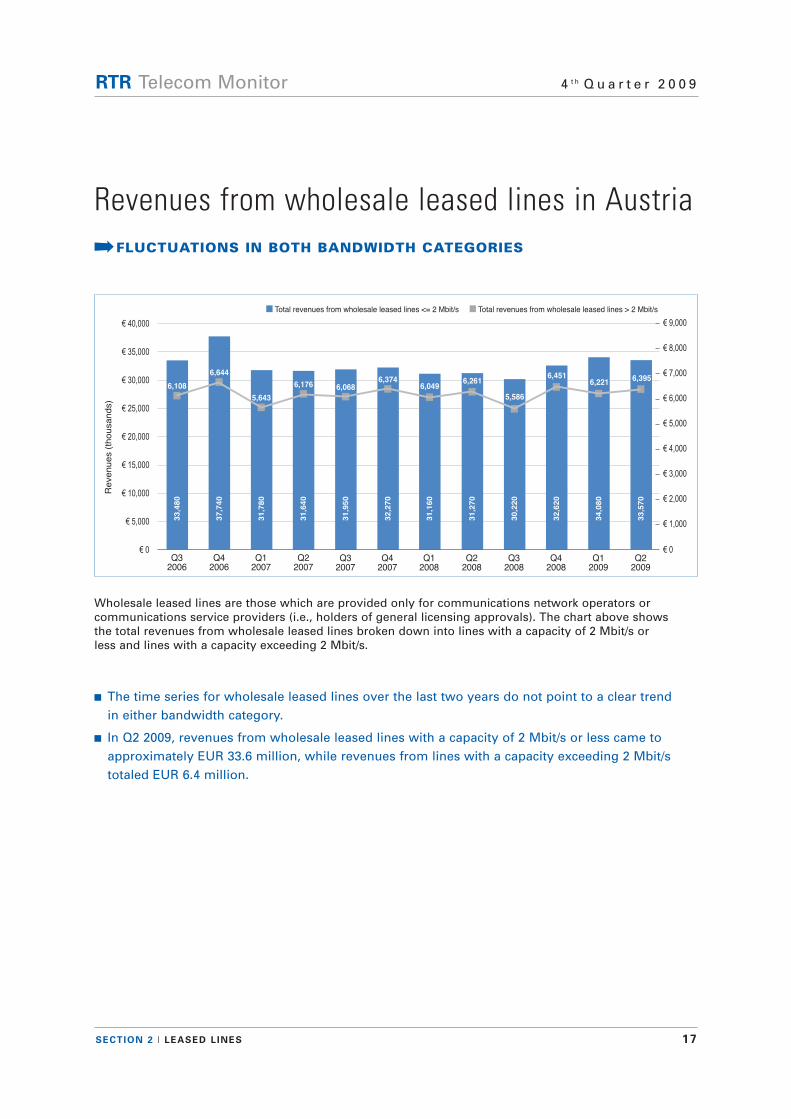
n Total revenues from wholesale leased lines <= 2 Mbit/s n Total revenues from wholesale leased lines > 2 Mbit/s
€ 0Q1
2007
31,780
Q22007
31,640
Q32007
31,950
Revenues (
tho
usa
nd
s)
€ 5,000
€ 10,000
€ 15,000
€ 20,000
€ 25,000
€ 30,000
€ 35,000
€ 40,000
Q32006
33,480
Q42006
37,740
Q42007
32,270
€ 0
€ 1,000
€ 2,000
€ 3,000
€ 4,000
€ 5,000
€ 6,000
€ 7,000
€ 8,000
€ 9,000
6,108
6,644
5,643
6,176 6,0686,374
Q12008
31,160
6,049
Q22008
31,270
6,261
Q32008
30,220
5,586
Q42008
32,620
6,451
Q12009
34,080
6,221
Q22009
33,570
6,395
Wholesale leased lines are those which are provided only for communications network operators or communications service providers (i.e., holders of general licensing approvals). The chart above shows the total revenues from wholesale leased lines broken down into lines with a capacity of 2 Mbit/s or less and lines with a capacity exceeding 2 Mbit/s.
n The time series for wholesale leased lines over the last two years do not point to a clear trend in either bandwidth category.
n In Q2 2009, revenues from wholesale leased lines with a capacity of 2 Mbit/s or less came to approximately EUR 33.6 million, while revenues from lines with a capacity exceeding 2 Mbit/s totaled EUR 6.4 million.
Revenues from wholesale leased lines in Austria·FLUCTUATIONS IN BOTH BANDWIDTH CATEGORIES
18
RTR Telecom Monitor 4 t h Q u a r t e r 2 0 0 9
Section 3 Mobile communications
SECTION 3 I MOBILE COMMUNICATIONS 19
RTR Telecom Monitor 4 t h Q u a r t e r 2 0 0 9
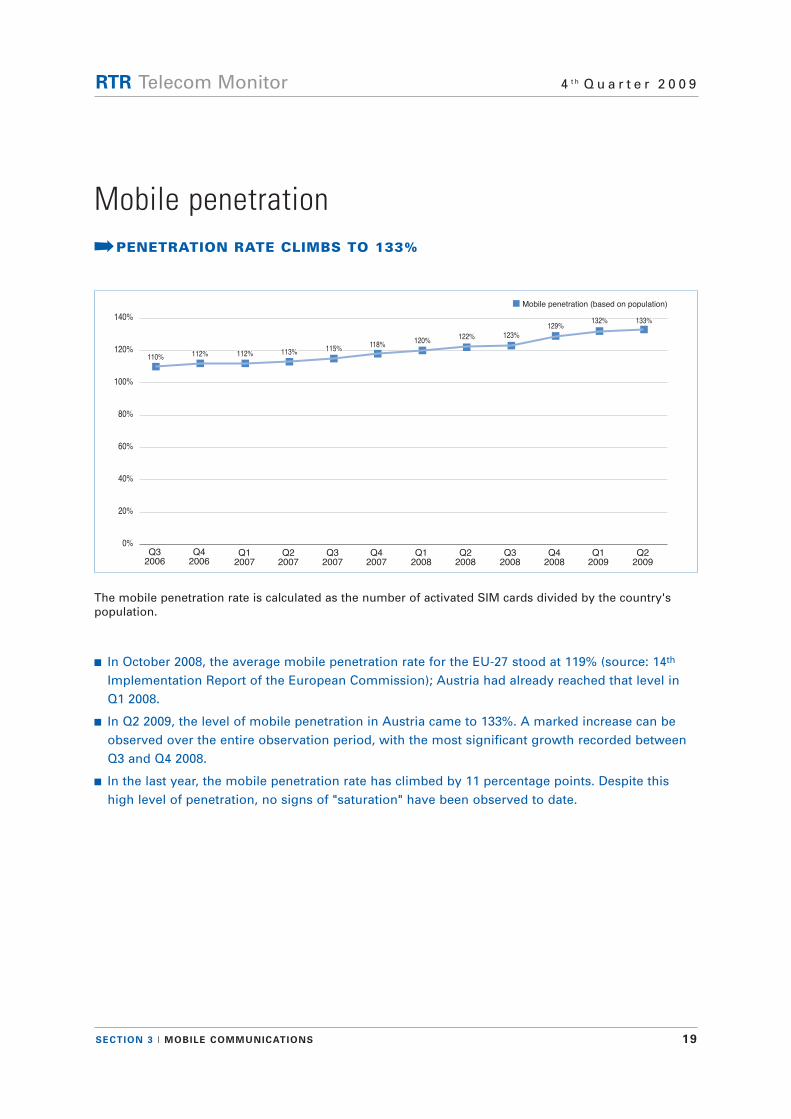
n Mobile penetration (based on population)
0%Q3
2006Q1
2007Q2
2007
112% 113%
Q32007
115%110% 112%
Q42006
20%
40%
60%
80%
100%
120%
140%
Q42007
118%
Q12008
120%
Q22008
122%
Q32008
123%
Q42008
129%
Q12009
132%
Q22009
133%
The mobile penetration rate is calculated as the number of activated SIM cards divided by the country'spopulation.
n In October 2008, the average mobile penetration rate for the EU-27 stood at 119% (source: 14th
Implementation Report of the European Commission); Austria had already reached that level in Q1 2008.
n In Q2 2009, the level of mobile penetration in Austria came to 133%. A marked increase can be observed over the entire observation period, with the most significant growth recorded between Q3 and Q4 2008.
n In the last year, the mobile penetration rate has climbed by 11 percentage points. Despite this high level of penetration, no signs of "saturation" have been observed to date.
Mobile penetration·PENETRATION RATE CLIMBS TO 133%
SECTION 3 I MOBILE COMMUNICATIONS 20
RTR Telecom Monitor 4 t h Q u a r t e r 2 0 0 9
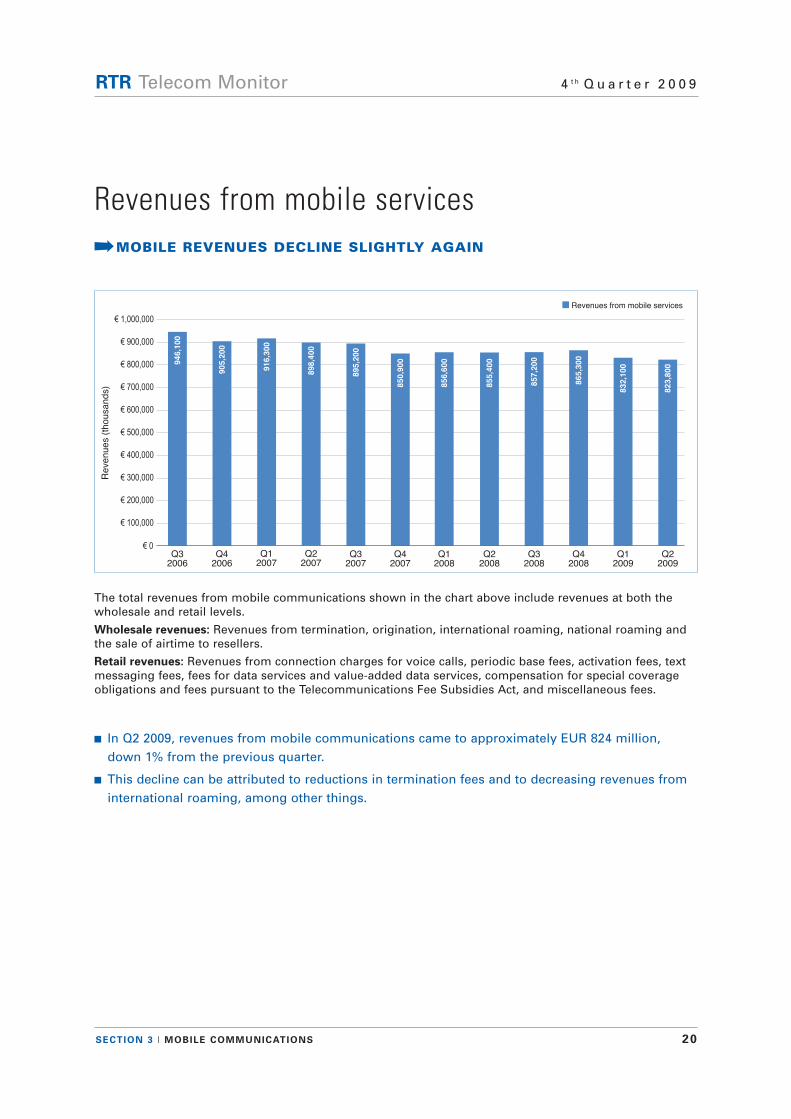
n Revenues from mobile services
€ 0Q1
2007
916,300
Q22007
898,400
Q32007
895,200
€ 100,000
Revenues (
tho
usa
nd
s)
Q32006
946,100
Q42006
905,200
€ 200,000
€ 300,000
€ 400,000
€ 500,000
€ 600,000
€ 700,000
€ 800,000
€ 900,000
€ 1,000,000
Q42007
850,900
Q12008
856,600
Q22008
855,400
Q32008
857,200
Q42008
865,300
Q12009
832,100
Q22009
823,800
The total revenues from mobile communications shown in the chart above include revenues at both thewholesale and retail levels.
Wholesale revenues: Revenues from termination, origination, international roaming, national roaming andthe sale of airtime to resellers.
Retail revenues: Revenues from connection charges for voice calls, periodic base fees, activation fees, textmessaging fees, fees for data services and value-added data services, compensation for special coverageobligations and fees pursuant to the Telecommunications Fee Subsidies Act, and miscellaneous fees.
n In Q2 2009, revenues from mobile communications came to approximately EUR 824 million, down 1% from the previous quarter.
n This decline can be attributed to reductions in termination fees and to decreasing revenues from international roaming, among other things.
Revenues from mobile services·MOBILE REVENUES DECLINE SLIGHTLY AGAIN
SECTION 3 I MOBILE COMMUNICATIONS 21
RTR Telecom Monitor 4 t h Q u a r t e r 2 0 0 9
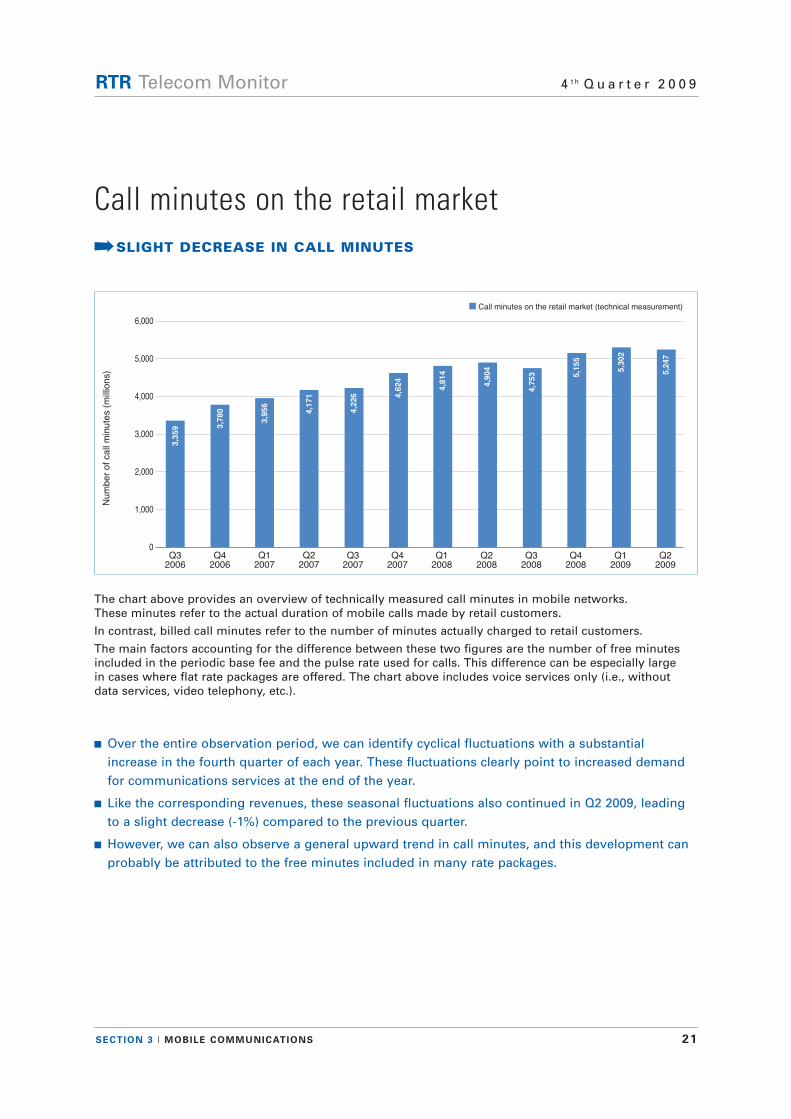
n Call minutes on the retail market (technical measurement)
Q12007
0
3,956
Q22007
4,171
Q32007
4,226
Num
ber
of
call
min
ute
s (
mill
ion
s)
Q32006
3,359
Q42006
3,780
Q42007
4,624
Q12008
4,814
Q22008
4,904
Q32008
4,753
1,000
2,000
3,000
4,000
5,000
6,000
Q42008
5,155
Q12009
5,302
Q22009
5,247
The chart above provides an overview of technically measured call minutes in mobile networks. These minutes refer to the actual duration of mobile calls made by retail customers.
In contrast, billed call minutes refer to the number of minutes actually charged to retail customers.
The main factors accounting for the difference between these two figures are the number of free minutesincluded in the periodic base fee and the pulse rate used for calls. This difference can be especially large in cases where flat rate packages are offered. The chart above includes voice services only (i.e., withoutdata services, video telephony, etc.).
n Over the entire observation period, we can identify cyclical fluctuations with a substantial increase in the fourth quarter of each year. These fluctuations clearly point to increased demand for communications services at the end of the year.
n Like the corresponding revenues, these seasonal fluctuations also continued in Q2 2009, leading to a slight decrease (-1%) compared to the previous quarter.
n However, we can also observe a general upward trend in call minutes, and this development can probably be attributed to the free minutes included in many rate packages.
Call minutes on the retail market·SLIGHT DECREASE IN CALL MINUTES
SECTION 3 I MOBILE COMMUNICATIONS 22
RTR Telecom Monitor 4 t h Q u a r t e r 2 0 0 9
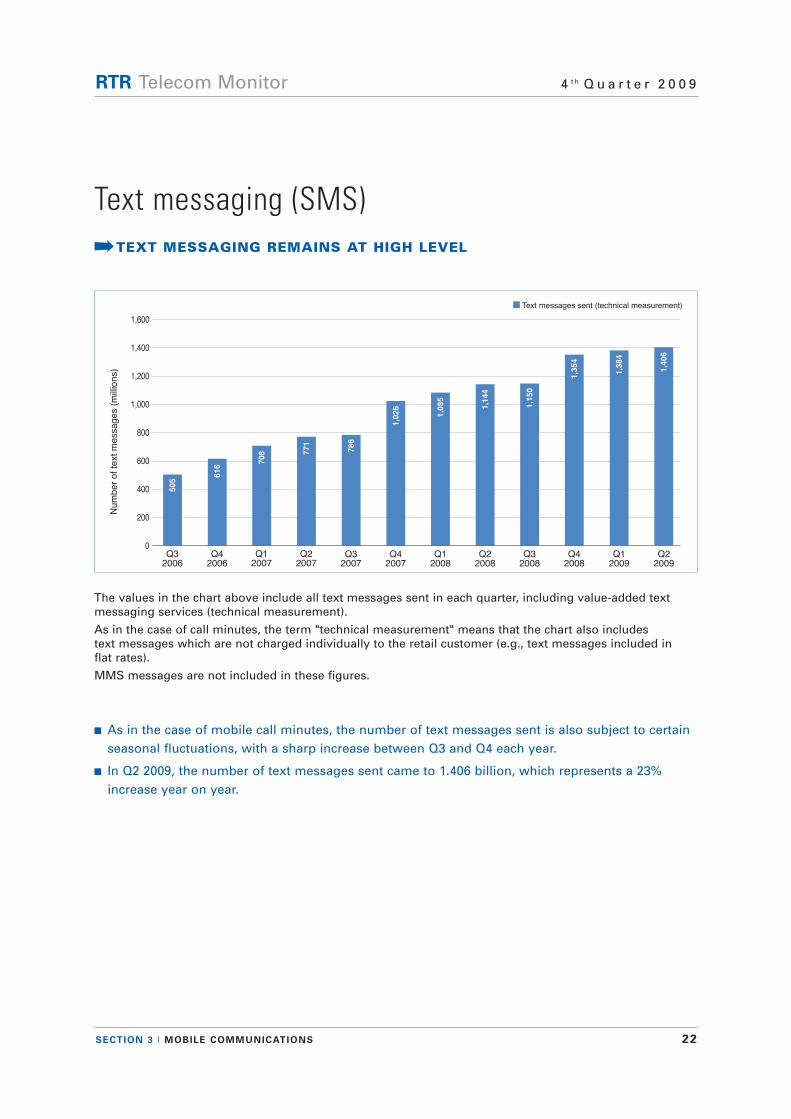
n Text messages sent (technical measurement)
0Q1
2007
708
Q22007
771
Q32007
786
Num
ber
of
text
messa
ge
s (
mill
ion
s)
Q32006
505
Q42006
616
Q42007
1,026
Q12008
1,085
Q22008
1,144
Q32008
1,150
Q42008
1,354
200
400
600
800
1,000
1,200
1,400
1,600
Q12009
1,384
Q22009
1,406
The values in the chart above include all text messages sent in each quarter, including value-added textmessaging services (technical measurement).
As in the case of call minutes, the term "technical measurement" means that the chart also includes text messages which are not charged individually to the retail customer (e.g., text messages included in flat rates).
MMS messages are not included in these figures.
n As in the case of mobile call minutes, the number of text messages sent is also subject to certain seasonal fluctuations, with a sharp increase between Q3 and Q4 each year.
n In Q2 2009, the number of text messages sent came to 1.406 billion, which represents a 23% increase year on year.
Text messaging (SMS)·TEXT MESSAGING REMAINS AT HIGH LEVEL
SECTION 3 I MOBILE COMMUNICATIONS 23
RTR Telecom Monitor 4 t h Q u a r t e r 2 0 0 9
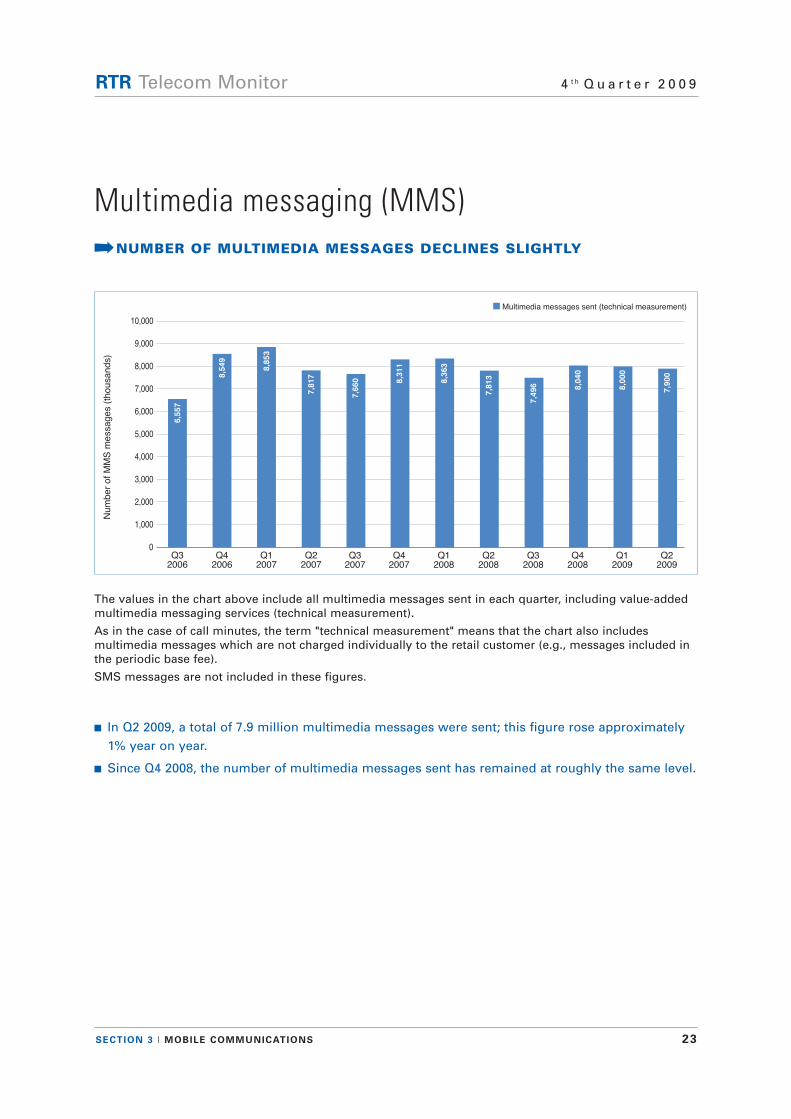
n Multimedia messages sent (technical measurement)
0Q3
2007
7,660
Num
ber
of
MM
S m
essa
ge
s (
tho
usa
nd
s)
Q32006
6,557
Q42006
8,549
Q12007
8,853
1,000
2,000
3,000
4,000
5,000
6,000
7,000
8,000
9,000
10,000
Q22007
7,817
Q42007
8,311
Q12008
8,363
Q22008
7,813
Q32008
7,496
Q42008
8,040
Q12009
8,000
Q22009
7,900
The values in the chart above include all multimedia messages sent in each quarter, including value-addedmultimedia messaging services (technical measurement).
As in the case of call minutes, the term "technical measurement" means that the chart also includes multimedia messages which are not charged individually to the retail customer (e.g., messages included inthe periodic base fee).
SMS messages are not included in these figures.
n In Q2 2009, a total of 7.9 million multimedia messages were sent; this figure rose approximately 1% year on year.
n Since Q4 2008, the number of multimedia messages sent has remained at roughly the same level.
Multimedia messaging (MMS)·NUMBER OF MULTIMEDIA MESSAGES DECLINES SLIGHTLY
SECTION 3 I MOBILE COMMUNICATIONS 24
RTR Telecom Monitor 4 t h Q u a r t e r 2 0 0 9
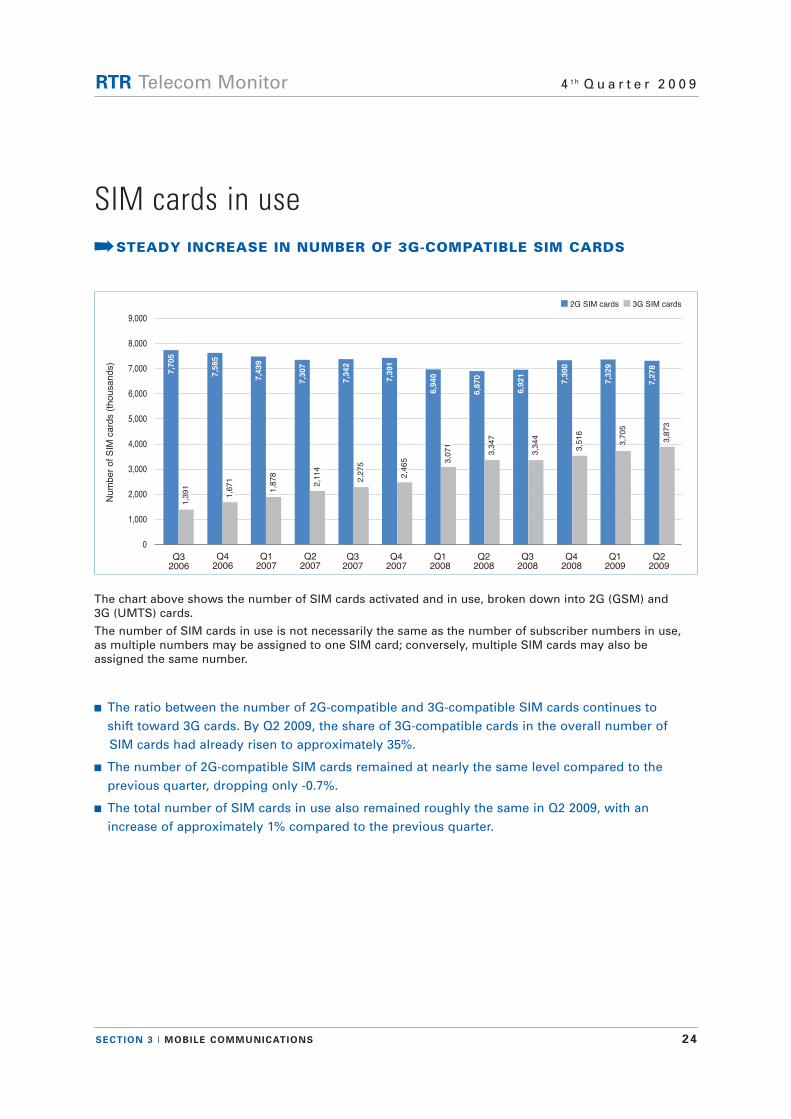
n 2G SIM cards n 3G SIM cards
0
Q32007
7,342
2,2
75
1,000
2,000
3,000
4,000
5,000
6,000
7,000
8,000
9,000
Q32006
7,705
1,3
91
Q42006
7,585
1,6
71
Q12007
7,439
1,8
78
Q22007
7,307
2,1
14
Num
ber
of
SIM
ca
rds (
tho
usa
nd
s)
Q42007
7,391
2,4
65
Q12008
6,940
3,0
71
Q22008
6,870
3,3
47
Q32008
6,921
3,3
44
Q42008
7,300
3,5
16
Q12009
7,329
3,7
05
Q22009
7,278
3,8
73
The chart above shows the number of SIM cards activated and in use, broken down into 2G (GSM) and 3G (UMTS) cards.
The number of SIM cards in use is not necessarily the same as the number of subscriber numbers in use, as multiple numbers may be assigned to one SIM card; conversely, multiple SIM cards may also be assigned the same number.
n The ratio between the number of 2G-compatible and 3G-compatible SIM cards continues to shift toward 3G cards. By Q2 2009, the share of 3G-compatible cards in the overall number of SIM cards had already risen to approximately 35%.
n The number of 2G-compatible SIM cards remained at nearly the same level compared to the previous quarter, dropping only -0.7%.
n The total number of SIM cards in use also remained roughly the same in Q2 2009, with an increase of approximately 1% compared to the previous quarter.
SIM cards in use·STEADY INCREASE IN NUMBER OF 3G-COMPATIBLE SIM CARDS
SECTION 3 I MOBILE COMMUNICATIONS 25
RTR Telecom Monitor 4 t h Q u a r t e r 2 0 0 9
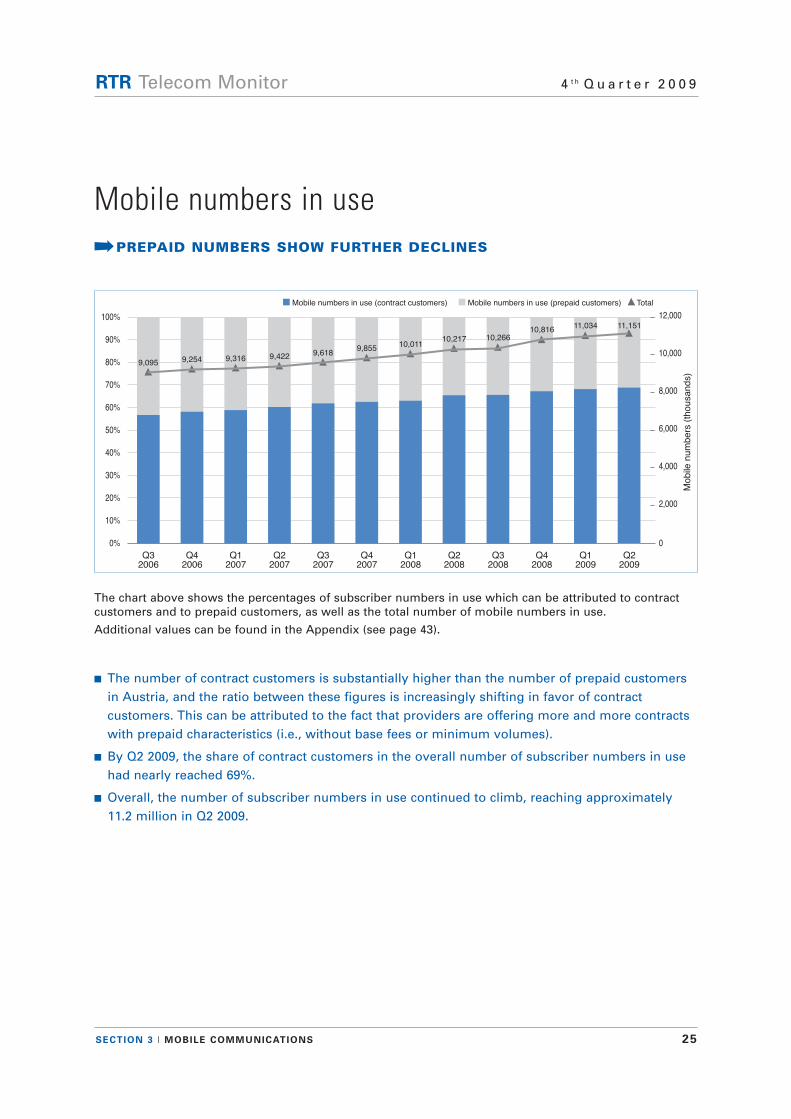
n Mobile numbers in use (contract customers) n Mobile numbers in use (prepaid customers) Total
0%
Q42007
Mobile
num
be
rs (
tho
usa
nd
s)
10%
20%
30%
40%
50%
60%
70%
80%
90%
100%
Q32007
Q22007
Q12007
Q42006
Q32006
9,095 9,254 9,316 9,422 9,6189,855
0
2,000
4,000
6,000
8,000
10,000
12,000
Q12008
10,011
Q22008
10,217
Q32008
10,266
Q42008
10,816
Q12009
11,034
Q22009
11,151
The chart above shows the percentages of subscriber numbers in use which can be attributed to contractcustomers and to prepaid customers, as well as the total number of mobile numbers in use.
Additional values can be found in the Appendix (see page 43).
n The number of contract customers is substantially higher than the number of prepaid customers in Austria, and the ratio between these figures is increasingly shifting in favor of contract customers. This can be attributed to the fact that providers are offering more and more contracts with prepaid characteristics (i.e., without base fees or minimum volumes).
n By Q2 2009, the share of contract customers in the overall number of subscriber numbers in use had nearly reached 69%.
n Overall, the number of subscriber numbers in use continued to climb, reaching approximately 11.2 million in Q2 2009.
Mobile numbers in use·PREPAID NUMBERS SHOW FURTHER DECLINES
SECTION 3 I MOBILE COMMUNICATIONS 26
RTR Telecom Monitor 4 t h Q u a r t e r 2 0 0 9
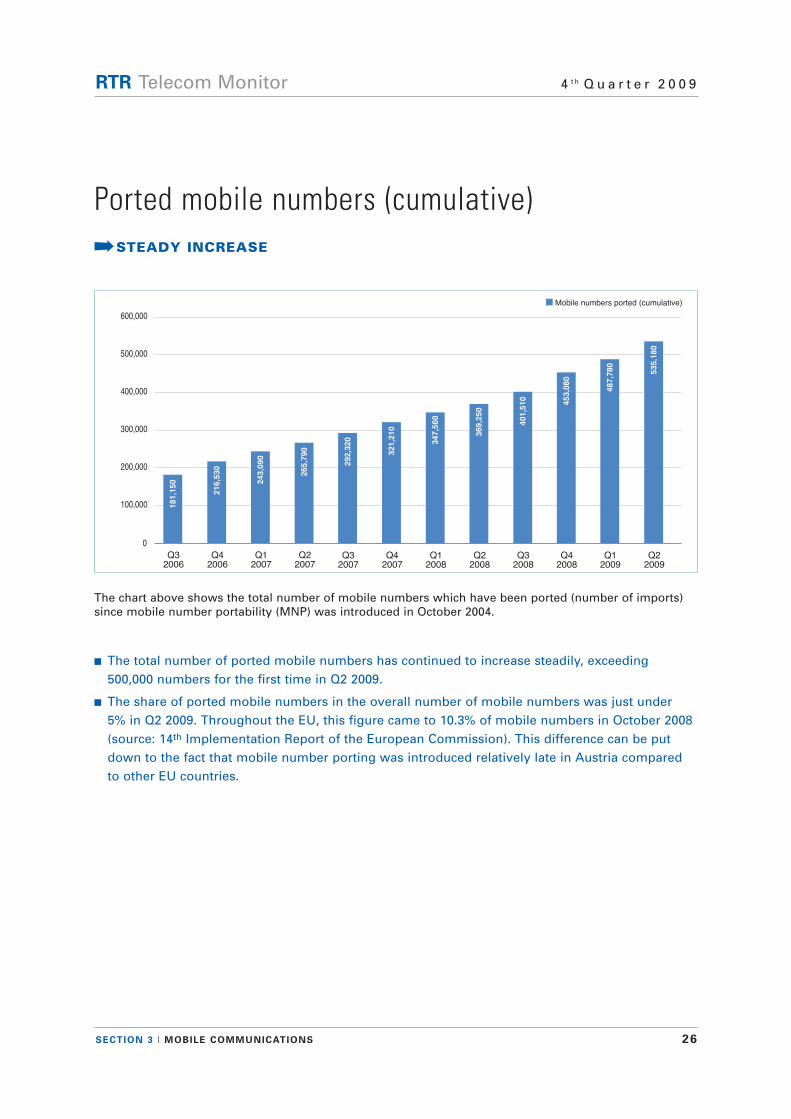
n Mobile numbers ported (cumulative)
0
Q32007
Q32006
181,150
Q42006
216,530
Q12007
243,090
Q22007
265,790
292,320
Q42007
321,210
Q12008
347,560
Q22008
369,250
Q32008
401,510
Q42008
453,080
100,000
Q12009
487,780
Q22009
535,180
200,000
300,000
400,000
500,000
600,000
The chart above shows the total number of mobile numbers which have been ported (number of imports)since mobile number portability (MNP) was introduced in October 2004.
n The total number of ported mobile numbers has continued to increase steadily, exceeding500,000 numbers for the first time in Q2 2009.
n The share of ported mobile numbers in the overall number of mobile numbers was just under 5% in Q2 2009. Throughout the EU, this figure came to 10.3% of mobile numbers in October 2008 (source: 14th Implementation Report of the European Commission). This difference can be put down to the fact that mobile number porting was introduced relatively late in Austria compared to other EU countries.
Ported mobile numbers (cumulative)·STEADY INCREASE
SECTION 3 I MOBILE COMMUNICATIONS 27
RTR Telecom Monitor 4 t h Q u a r t e r 2 0 0 9
0%
100%
n mobilkom austria n T-Mobile n Orange (including Yesss!) n Hutchison 3G (”3”)
Q32006
Q12007
Q42006
Q22007
Q32007
Q42007
10%
20%
30%
40%
50%
60%
70%
80%
90%
Q12008
Q22008
Q32008
Q42008
Q12009
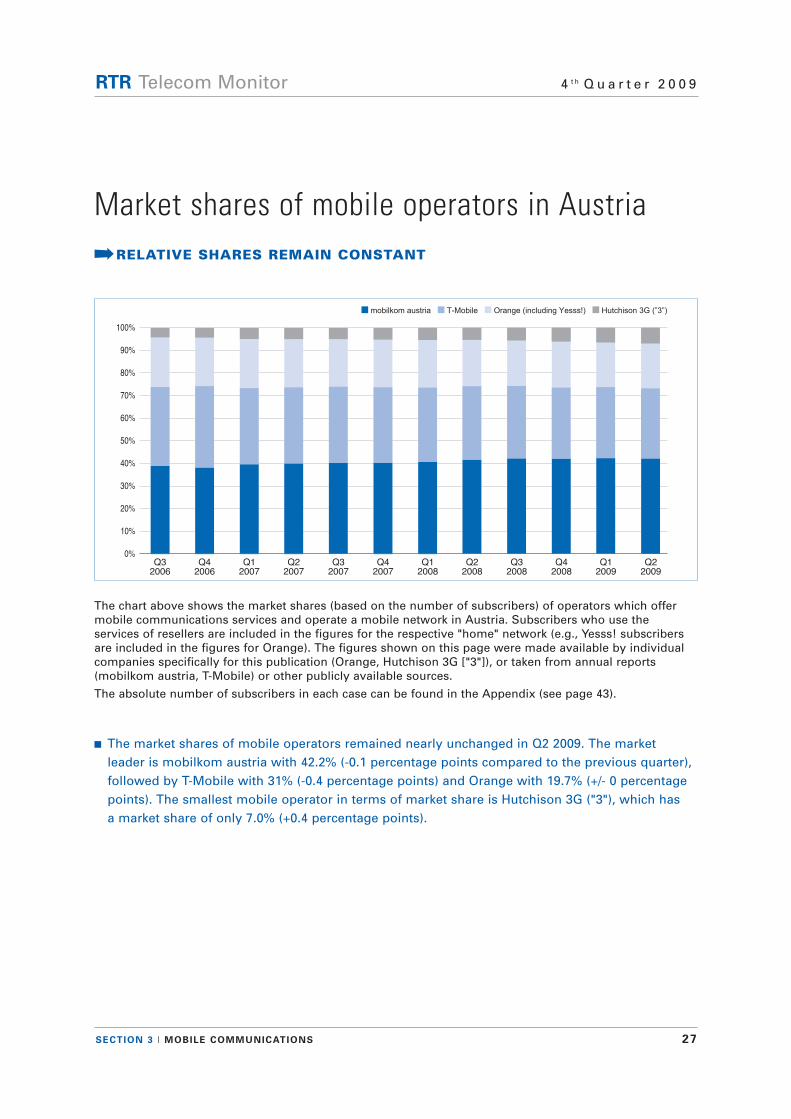
Q22009
The chart above shows the market shares (based on the number of subscribers) of operators which offermobile communications services and operate a mobile network in Austria. Subscribers who use the services of resellers are included in the figures for the respective "home" network (e.g., Yesss! subscribersare included in the figures for Orange). The figures shown on this page were made available by individualcompanies specifically for this publication (Orange, Hutchison 3G ["3"]), or taken from annual reports (mobilkom austria, T-Mobile) or other publicly available sources.
The absolute number of subscribers in each case can be found in the Appendix (see page 43).
n The market shares of mobile operators remained nearly unchanged in Q2 2009. The market leader is mobilkom austria with 42.2% (-0.1 percentage points compared to the previous quarter), followed by T-Mobile with 31% (-0.4 percentage points) and Orange with 19.7% (+/- 0 percentage points). The smallest mobile operator in terms of market share is Hutchison 3G ("3"), which has a market share of only 7.0% (+0.4 percentage points).
Market shares of mobile operators in Austria
·RELATIVE SHARES REMAIN CONSTANT
28
RTR Telecom Monitor 4 t h Q u a r t e r 2 0 0 9
Section 4 Comparisons of fixed-link and mobile networks
SECTION 4 I COMPARISONS OF FIXED-LINK AND MOBILE NETWORKS 29
RTR Telecom Monitor 4 t h Q u a r t e r 2 0 0 9
€ 200
€ 400
€ 600
€ 800
€ 1,000
€ 1,200
Rev
enue
s (m
illio
ns)
€ 0Q3
2007Q3
2006Q4
2006Q1
2007Q2
2007Q4
2007Q1
2008Q2
2008Q3
2008
€ 1,400
€ 1,600
1,5061,479 1,476
1,444 1,4311,364 1,358 1,345 1,326
Q42008
1,336
Q12009
1,291
Q22009
1,267
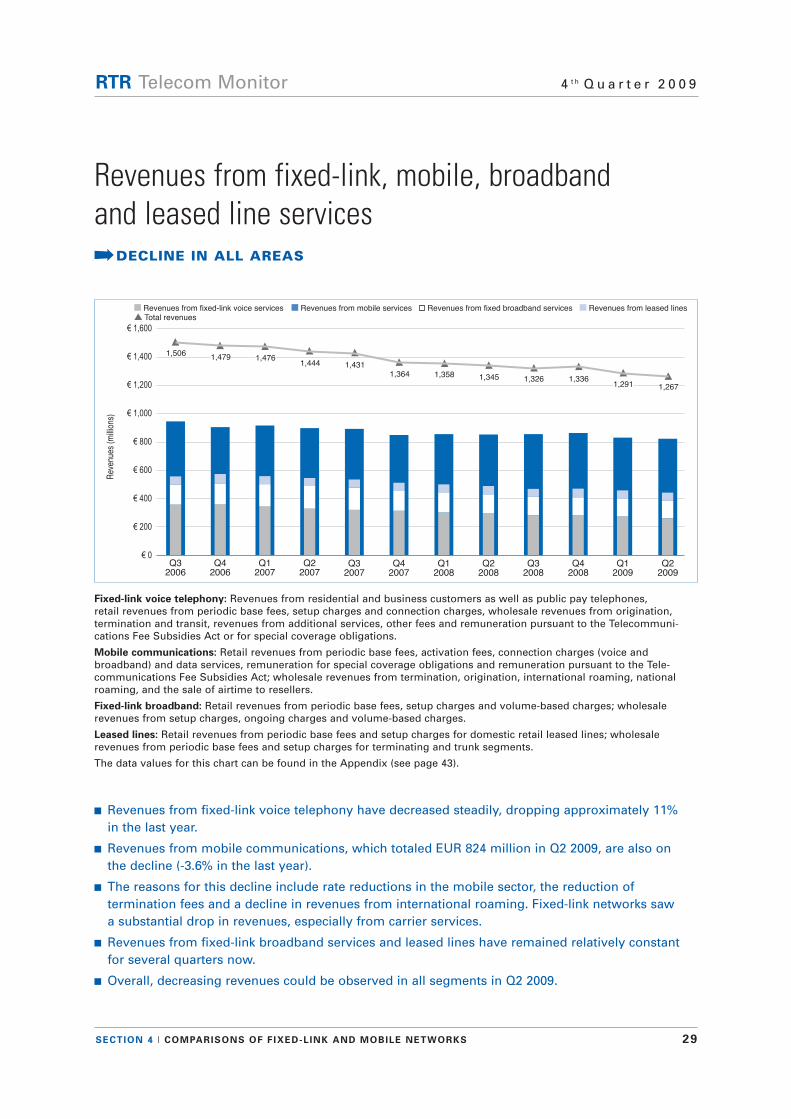
n Revenues from fixed-link voice services n Revenues from mobile services Revenues from fixed broadband services n Revenues from leased lines Total revenues
Fixed-link voice telephony: Revenues from residential and business customers as well as public pay telephones, retail revenues from periodic base fees, setup charges and connection charges, wholesale revenues from origination, termination and transit, revenues from additional services, other fees and remuneration pursuant to the Telecommuni -cations Fee Subsidies Act or for special coverage obligations.
Mobile communications: Retail revenues from periodic base fees, activation fees, connection charges (voice and broadband) and data services, remuneration for special coverage obligations and remuneration pursuant to the Tele -communications Fee Subsidies Act; wholesale revenues from termination, origination, international roaming, nationalroaming, and the sale of airtime to resellers.
Fixed-link broadband: Retail revenues from periodic base fees, setup charges and volume-based charges; wholesale revenues from setup charges, ongoing charges and volume-based charges.
Leased lines: Retail revenues from periodic base fees and setup charges for domestic retail leased lines; wholesale revenues from periodic base fees and setup charges for terminating and trunk segments.
The data values for this chart can be found in the Appendix (see page 43).
n Revenues from fixed-link voice telephony have decreased steadily, dropping approximately 11% in the last year.
n Revenues from mobile communications, which totaled EUR 824 million in Q2 2009, are also on the decline (-3.6% in the last year).
n The reasons for this decline include rate reductions in the mobile sector, the reduction of termination fees and a decline in revenues from international roaming. Fixed-link networks saw a substantial drop in revenues, especially from carrier services.
n Revenues from fixed-link broadband services and leased lines have remained relatively constantfor several quarters now.
n Overall, decreasing revenues could be observed in all segments in Q2 2009.
Revenues from fixed-link, mobile, broadband and leased line services·DECLINE IN ALL AREAS
SECTION 4 I COMPARISONS OF FIXED-LINK AND MOBILE NETWORKS 30
RTR Telecom Monitor 4 t h Q u a r t e r 2 0 0 9
Num
ber
of call
min
ute
s (
mill
ions)
n Technical minutes (mobile) Technical minutes (fixed-link, excluding online minutes) n Online Total voice telephony minutes
0Q3
2006Q1
2007Q4
2006Q2
2007Q3
2007Q4
2007Q1
2008Q2
2008Q3
2008
5,666
6,107 6,150 6,168 6,150
6,6596,772
6,7046,444
Q42008
6,869
1,000
2,000
3,000
4,000
5,000
6,000
7,000
8,000
Q12009
7,058
Q22009
6,858
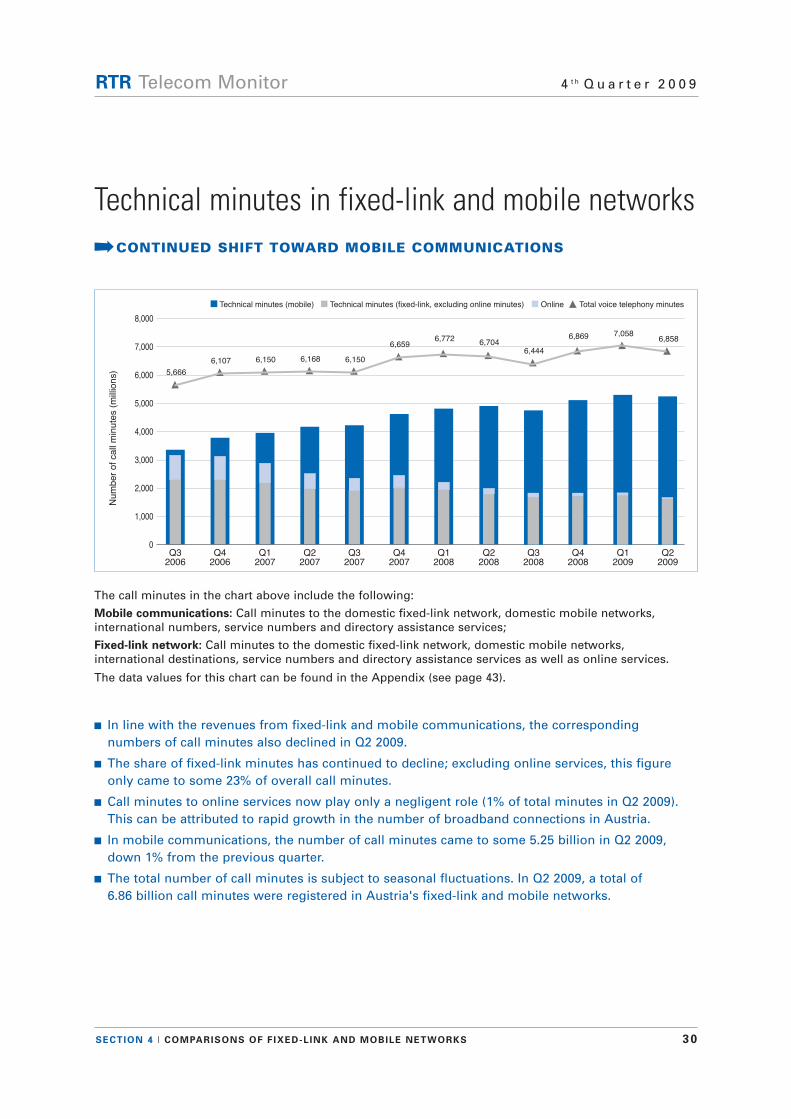
The call minutes in the chart above include the following:
Mobile communications: Call minutes to the domestic fixed-link network, domestic mobile networks, international numbers, service numbers and directory assistance services;
Fixed-link network: Call minutes to the domestic fixed-link network, domestic mobile networks, international destinations, service numbers and directory assistance services as well as online services.
The data values for this chart can be found in the Appendix (see page 43).
n In line with the revenues from fixed-link and mobile communications, the corresponding numbers of call minutes also declined in Q2 2009.
n The share of fixed-link minutes has continued to decline; excluding online services, this figure only came to some 23% of overall call minutes.
n Call minutes to online services now play only a negligent role (1% of total minutes in Q2 2009). This can be attributed to rapid growth in the number of broadband connections in Austria.
n In mobile communications, the number of call minutes came to some 5.25 billion in Q2 2009, down 1% from the previous quarter.
n The total number of call minutes is subject to seasonal fluctuations. In Q2 2009, a total of 6.86 billion call minutes were registered in Austria's fixed-link and mobile networks.
Technical minutes in fixed-link and mobile networks·CONTINUED SHIFT TOWARD MOBILE COMMUNICATIONS
31
RTR Telecom Monitor 4 t h Q u a r t e r 2 0 0 9
Section 5 Broadband
SECTION 5 I BROADBAND 32
RTR Telecom Monitor 4 t h Q u a r t e r 2 0 0 9
n Broadband connections in the fixed-link network
0Q3
2006
1,359
Q42006
1,432
Q12007
1,515
Q22007
1,545
Q32007
1,554
Q42007
1,608
Num
ber
of
bro
adband
co
nn
ectio
ns (
tho
usa
nd
s)
Q12008
1,675
Q22008
1,693
Q32008
1,698
200
400
600
800
1,000
1,200
1,400
1,600
1,800
2,000
1,762
Q42008
1,811
Q12009
1,824
Q22009
The chart above shows the total number of fixed broadband connections in Austria (regardless of the technology used for the connections). In this context, fixed broadband connections include those with adownload rate of at least 144 kbit/s realized using copper-wire pairs in the Telekom Austria network,unbundled lines, coaxial cable, FWA (fixed wireless access, e.g., W-LAN, WiFi and WLL for "fixed" access,not at hot spots) and other infrastructure.
Broadband Internet connections based on mobile technology (UMTS) are not included in the values shownhere.
n In recent years, the broadband market has seen substantial growth. In Q4 2008, there were already some 114 million fixed broadband connections throughout the EU (source: 14th Implementation Report of the European Commission). International comparisons usually only include fixed broadband connections.
n In Austria, the total number of fixed broadband connections came to 1.824 million in Q2 2009, thuscontinuing the trend of steady growth in this segment. In the last year, the number of connections has climbed by 8%.
n The significant jumps in the number of connections around the beginning of each year can largely be attributed to major holiday promotions launched by the operators.
Fixed broadband connections·FURTHER GROWTH
SECTION 5 I BROADBAND 33
RTR Telecom Monitor 4 t h Q u a r t e r 2 0 0 9
n Fixed broadband penetration in % of households n Fixed and mobile broadband penetration in % of households
0%Q3
2006
44%
10%
Q12007
51%
Q42006
47%
Q22007
54%
Q32007
58%
Q42007
62%
Q12008
66%
20%
30%
40%
50%
60%
Q22008
68%
Q32008
70%
70%
80%
39%
43%41%
44% 44% 45%47% 48% 48%
90%
Q42008
76%
49%
Q12009
80%
50%
Q22009
81%
51%
Broadband penetration refers to the ratio of the number of fixed and/or mobile broadband connections tothe total number of households (expressed as a percentage). The broadband penetration rate calculatedhere also includes broadband connections used in businesses.
n In Q2 2009, fixed broadband penetration in Austria (in percent of households) exceeded the 50% mark for the first time.
n Including mobile broadband connections, the penetration rate has reached 81%, which representsan increase of 11 percentage points in the last year.
n By international comparison, Austria is in first place in the EU in terms of mobile broadband penetration based on total population (Austria: 11.4%, EU average: 2.8% in January 2009; source: 14th Implementation Report of the European Commission).
Broadband penetration (% of households)·FIXED BROADBAND PENETRATION EXCEEDS 50%
SECTION 5 I BROADBAND 34
RTR Telecom Monitor 4 t h Q u a r t e r 2 0 0 9
0
n TA DSL lines (copper-wire pairs) Bitstreaming in TA network nn Unbundled lines n Coaxial cable n FWA Mobile broadband Other infrastructure
Q32006
Q12007
Q42006
Q22007
Q32007
Q42007
Q12008
200,000
400,000
600,000
800,000
1,000,000
Q22008
Q32008
1,200,000
Q42008
Q12009
Q22009
The number of retail broadband connections includes all connections which offer a download bandwidth of more than 144 kbit/s. The number of mobile broadband connections refers to the number of mobilecommunications contracts which include a data transfer volume of at least 250 MB per month.
The chart above provides a breakdown according to the infrastructure used: copper-wire pairs in theTelekom Austria network (subdivided into Telekom Austria's retail broadband connections and broadbandconnections implemented through bitstreaming), unbundled lines, coaxial cable, FWA (fixed wirelessaccess, e.g., W-LAN, WiFi and WLL for "fixed" access, not at hot spots), mobile broadband connections andother infrastructure, that is, leased lines, FTTH (fiber to the home), PLC (broadband via power lines) andsatellite broadband connections.
The data values for this chart can be found in the Appendix (see page 44).
n DSL connections and mobile broadband connections continued to grow in Q2 2009. In total, approximately two million broadband connections have been realized using these two types of infrastructure.
n The slight decrease in the number of unbundled lines which was first observed in Q1 2009 also continued in the second quarter (-2.6% compared to the previous quarter).
n Since the end of 2008, the number of retail broadband connections realized via coaxial cable has remained approximately the same (approximately 550,000 in Q2 2009).
Retail broadband connections 1/2·LARGEST INCREASE IN MOBILE BROADBAND
SECTION 5 I BROADBAND 35
RTR Telecom Monitor 4 t h Q u a r t e r 2 0 0 9
0%
100%
n TA DSL lines (copper-wire pairs) n Bitstreaming in TA network nn Unbundled lines n Coaxial cable n FWA n Other infrastructure Mobile broadband
Q32006
Q12007
Q42006
Q22007
Q32007
Q42007
10%
20%
30%
40%
50%
60%
70%
80%
90%
Q12008
Q22008
Q32008
Q42008
Q12009
Q22009
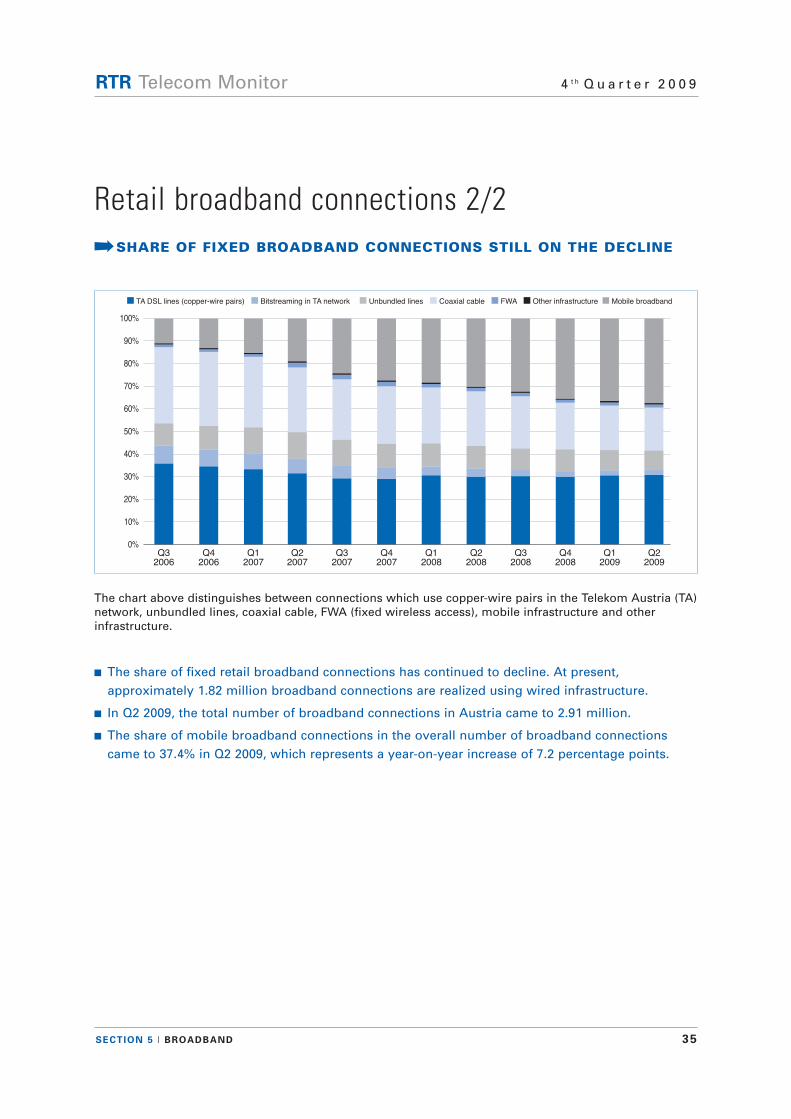
The chart above distinguishes between connections which use copper-wire pairs in the Telekom Austria (TA)network, unbundled lines, coaxial cable, FWA (fixed wireless access), mobile infrastructure and other infrastructure.
n The share of fixed retail broadband connections has continued to decline. At present, approximately 1.82 million broadband connections are realized using wired infrastructure.
n In Q2 2009, the total number of broadband connections in Austria came to 2.91 million.
n The share of mobile broadband connections in the overall number of broadband connections came to 37.4% in Q2 2009, which represents a year-on-year increase of 7.2 percentage points.
Retail broadband connections 2/2·SHARE OF FIXED BROADBAND CONNECTIONS STILL ON THE DECLINE
SECTION 5 I BROADBAND 36
RTR Telecom Monitor 4 t h Q u a r t e r 2 0 0 9
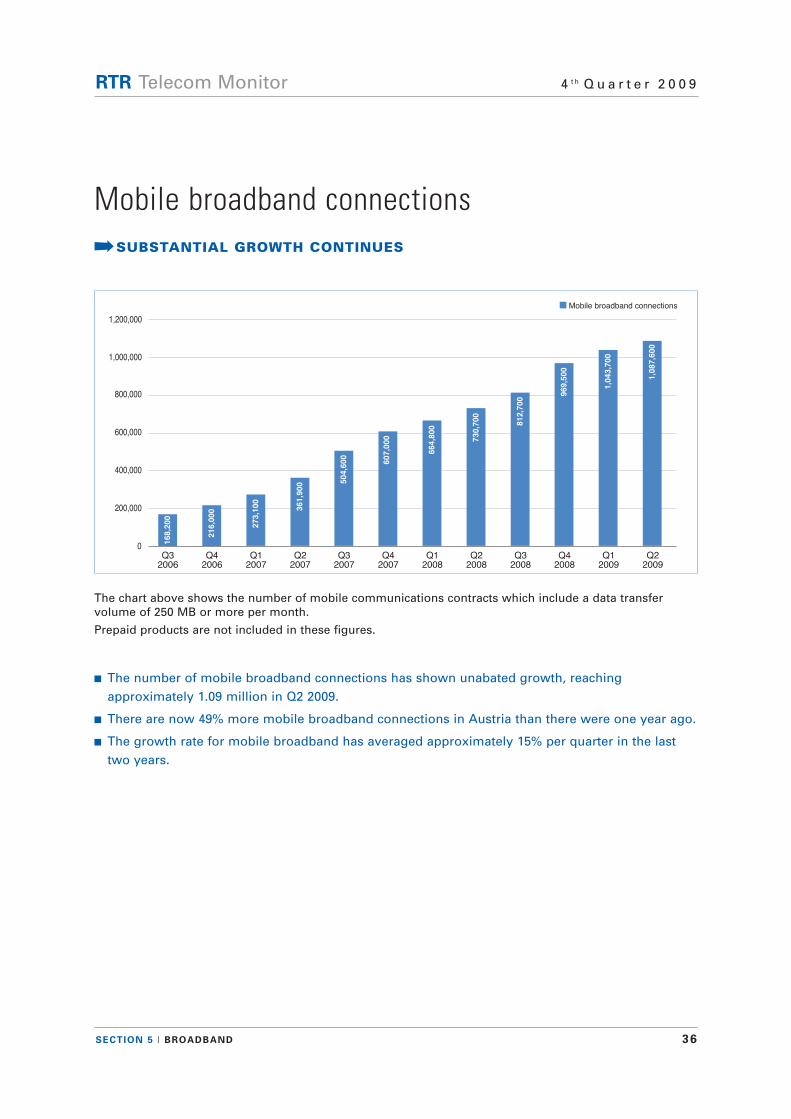
n Mobile broadband connections
0Q3
2006
168,200
Q42006
216,000
Q12007
273,100
Q22007
361,900
Q32007
504,600
Q42007
607,000
Q12008
664,800
200,000
400,000
600,000
800,000
Q22008
730,700
Q32008
812,700
1,000,000
1,200,000
Q42008
969,500
Q12009
1,043,700
Q22009
1,087,600
The chart above shows the number of mobile communications contracts which include a data transfer volume of 250 MB or more per month.
Prepaid products are not included in these figures.
n The number of mobile broadband connections has shown unabated growth, reaching approximately 1.09 million in Q2 2009.
n There are now 49% more mobile broadband connections in Austria than there were one year ago.
n The growth rate for mobile broadband has averaged approximately 15% per quarter in the last two years.
Mobile broadband connections·SUBSTANTIAL GROWTH CONTINUES
SECTION 5 I BROADBAND 37
RTR Telecom Monitor 4 t h Q u a r t e r 2 0 0 9
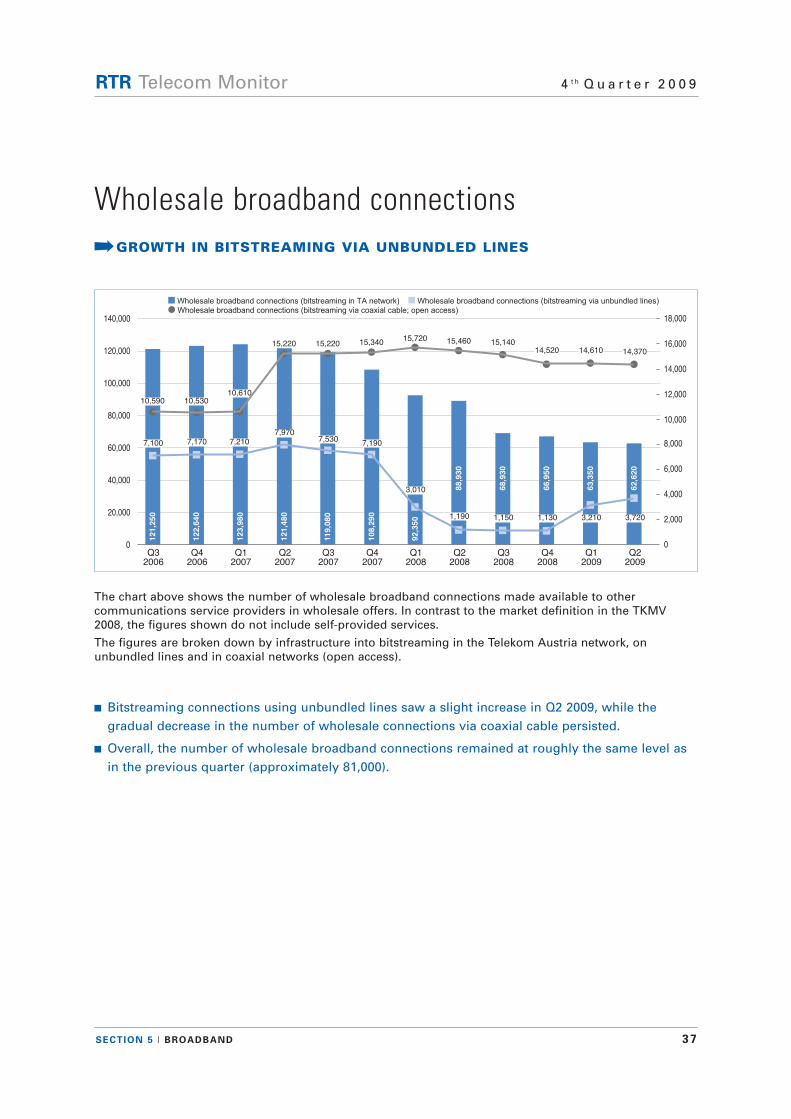
140,000
n Wholesale broadband connections (bitstreaming in TA network) n Wholesale broadband connections (bitstreaming via unbundled lines)
Wholesale broadband connections (bitstreaming via coaxial cable; open access)
0
20,000
40,000
60,000
80,000
100,000
120,000
Q32006
121,250
Q12007
123,980
Q42006
122,640
Q22007
121,480
Q32007
119,080
Q42007
108,290
0
2,000
7,100 7,170 7,2107,970
7,5307,190
10,590 10,53010,610
15,220 15,220 15,340
Q12008
92,350
3,010
15,720
4,000
6,000
8,000
10,000
12,000
14,000
16,000
18,000
Q22008
88,930
1,190
15,460
Q32008
68,930
1,150
15,140
Q42008
66,950
1,130
14,520
Q12009
63,350
3,210
14,610
Q22009
62,620
3,720
14,370
The chart above shows the number of wholesale broadband connections made available to other communications service providers in wholesale offers. In contrast to the market definition in the TKMV2008, the figures shown do not include self-provided services.
The figures are broken down by infrastructure into bitstreaming in the Telekom Austria network, on unbundled lines and in coaxial networks (open access).
n Bitstreaming connections using unbundled lines saw a slight increase in Q2 2009, while the gradual decrease in the number of wholesale connections via coaxial cable persisted.
n Overall, the number of wholesale broadband connections remained at roughly the same level as in the previous quarter (approximately 81,000).
Wholesale broadband connections·GROWTH IN BITSTREAMING VIA UNBUNDLED LINES
SECTION 5 I BROADBAND 38
RTR Telecom Monitor 4 t h Q u a r t e r 2 0 0 9
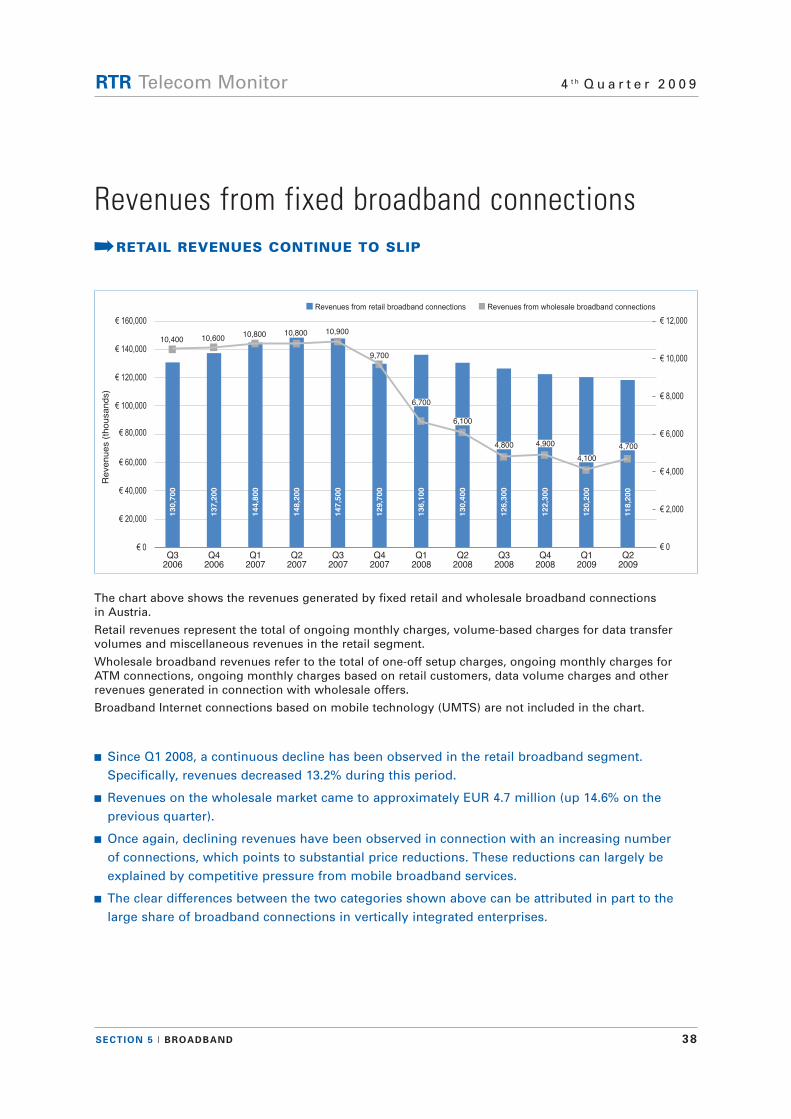
n Revenues from retail broadband connections Revenues from wholesale broadband connections
€ 0
Revenues (
tho
usa
nd
s)
€ 20,000
€ 40,000
€ 60,000
€ 80,000
€ 100,000
€ 120,000
€ 140,000
Q32006
130,700
Q42006
137,200
Q12007
144,800
Q22007
148,200
€ 160,000
Q32007
147,500
Q42007
129,700
€ 0
€ 2,000
€ 4,000
€ 6,000
€ 8,000
€ 10,000
€ 12,000
10,400 10,60010,800 10,800 10,900
9,700
Q12008
136,100
6,700
Q22008
130,400
6,100
Q32008
126,300
4,800
Q42008
122,300
4,900
Q12009
120,200
4,100
Q22009
118,200
4,700
The chart above shows the revenues generated by fixed retail and wholesale broadband connections in Austria.
Retail revenues represent the total of ongoing monthly charges, volume-based charges for data transfervolumes and miscellaneous revenues in the retail segment.
Wholesale broadband revenues refer to the total of one-off setup charges, ongoing monthly charges forATM connections, ongoing monthly charges based on retail customers, data volume charges and otherrevenues generated in connection with wholesale offers.
Broadband Internet connections based on mobile technology (UMTS) are not included in the chart.
n Since Q1 2008, a continuous decline has been observed in the retail broadband segment. Specifically, revenues decreased 13.2% during this period.
n Revenues on the wholesale market came to approximately EUR 4.7 million (up 14.6% on the previous quarter).
n Once again, declining revenues have been observed in connection with an increasing number of connections, which points to substantial price reductions. These reductions can largely be explained by competitive pressure from mobile broadband services.
n The clear differences between the two categories shown above can be attributed in part to the large share of broadband connections in vertically integrated enterprises.
Revenues from fixed broadband connections·RETAIL REVENUES CONTINUE TO SLIP
39
RTR Telecom Monitor 4 t h Q u a r t e r 2 0 0 9
Section 6 Business indicators
SECTION 6 I BUSINESS INDICATORS 40
RTR Telecom Monitor 4 t h Q u a r t e r 2 0 0 9
n Investments
€ 0
2004 2005
759,400
683,600
€ 100,000
Investm
ents
(th
ou
sa
nd
s)
2006
749,600
2007
878,100
€ 200,000
€ 300,000
€ 400,000
€ 500,000
€ 600,000
€ 700,000
€ 800,000
€ 900,000
€ 1,000,000
2008
712,500
The chart above shows the development of investments in frequencies, technical infrastructure, sales andcustomer service in the years 2004 to 2008. In this context, it is important to note that the values reportedare partly based on estimates and extrapolations from individual quarters for entire years. As a result, theexact figure for total investments can not be calculated reliably.
The amounts shown here only include those investments made directly by telecommunications enterprises.They do not include investments in upstream branches of the industry.
n Investments totaled approximately EUR 712.5 million in 2008.
n RTR intends to publish the figures for 2009 in the Telecom Monitor for Q2 2010.
Investments·EUR 712.5 MILLION IN INVESTMENTS IN 2008
SECTION 6 I BUSINESS INDICATORS 41
RTR Telecom Monitor 4 t h Q u a r t e r 2 0 0 9
n Internal employees n Leased employees and freelancers
0
2,000
4,000
6,000
8,000
10,000
12,000
14,000
16,000
18,000
20,000
Num
ber
of e
mp
loye
es
Q32006
17,300
Q12007
17,110
Q42006
17,130
Q22007
16,970
Q32007
16,880
Q42007
16,550
0
200
400
600
800
1,000
1,200
1,400
08100 0810008700
0950009100
1,150
Q12008
16,510
1,340
Q22008
16,450
1,160
Q32008
16,280
1,000
Q42008
15,630
1,170
1,600
Q12009
15,110
08230
Q22009
15,000
07000
The chart above shows the number of employees in the telecommunications sector, broken down into internal employees, leased personnel and freelancers, in terms of full-time equivalents (FTEs).
When interpreting these figures, please note that they only include staff employed directly by telecommunications enterprises.
The figures do not include employees in supplier industries, external call-center employees or outsourced positions.
n Over the entire observation period, a steady decline in the number of internal employees could be observed in the telecommunications sector. This trend persisted in Q2 2009, with the overall number of employees coming to approximately 15,000.
n The reduction in the number of freelancers and leased employees observed in recent quarters manifested itself to a lesser extent in Q2 2009. At the same time, the number of leased employeesdropped by 15% compared to the previous quarter.
Employees in the telecommunications sector·NUMBER OF EMPLOYEES CONTINUES TO DECLINE
42
RTR Telecom Monitor 4 t h Q u a r t e r 2 0 0 9
Section 7 Appendix
SECTION 7 I APPENDIX 43
RTR Telecom Monitor 4 t h Q u a r t e r 2 0 0 9
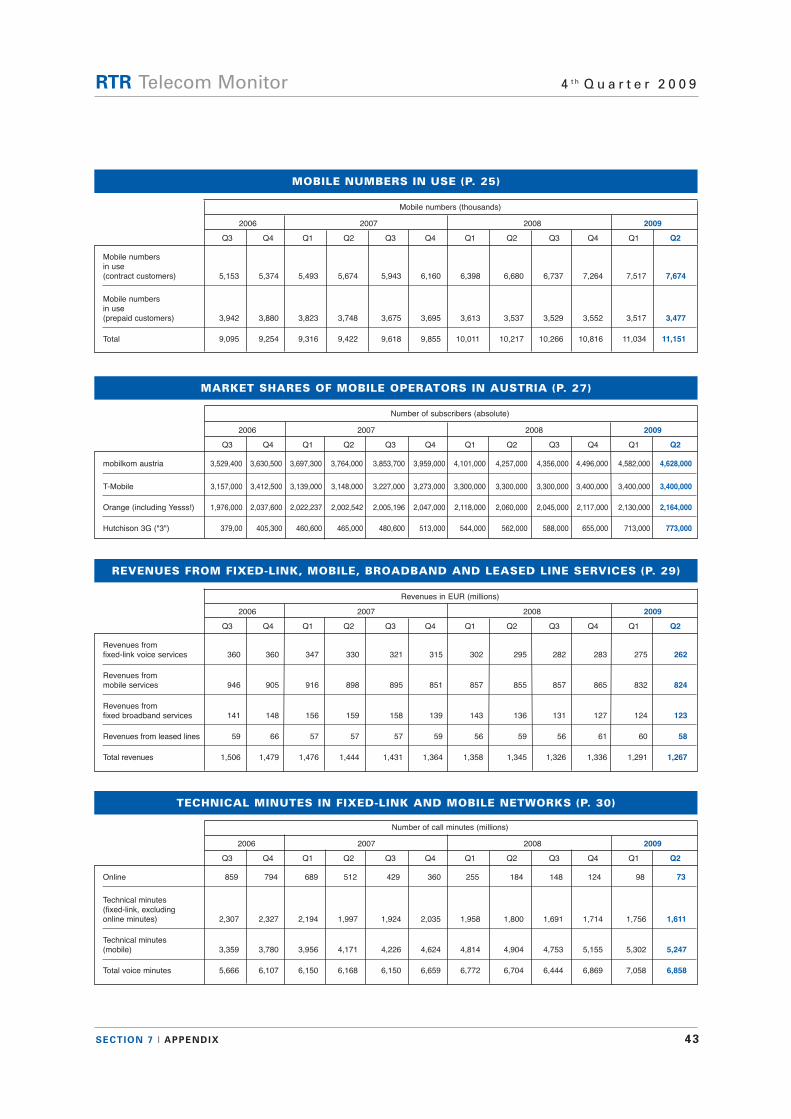
MOBILE NUMBERS IN USE (P. 25)
Mobile numbers
in use
(contract customers) 5,153 5,374 5,493 5,674 5,943 6,160 6,398 6,680 6,737 7,264 7,517 7,674
Mobile numbers
in use
(prepaid customers) 3,942 3,880 3,823 3,748 3,675 3,695 3,613 3,537 3,529 3,552 3,517 3,477
Total 9,095 9,254 9,316 9,422 9,618 9,855 10,011 10,217 10,266 10,816 11,034 11,151
Mobile numbers (thousands)
2006 2007 2008 2009
Q3 Q4 Q1 Q2 Q3 Q4 Q1 Q2 Q3 Q4 Q1 Q2
MARKET SHARES OF MOBILE OPERATORS IN AUSTRIA (P. 27)
mobilkom austria 3,529,400 3,630,500 3,697,300 3,764,000 3,853,700 3,959,000 4,101,000 4,257,000 4,356,000 4,496,000 4,582,000 4,628,000
T-Mobile 3,157,000 3,412,500 3,139,000 3,148,000 3,227,000 3,273,000 3,300,000 3,300,000 3,300,000 3,400,000 3,400,000 3,400,000
Orange (including Yesss!) 1,976,000 2,037,600 2,022,237 2,002,542 2,005,196 2,047,000 2,118,000 2,060,000 2,045,000 2,117,000 2,130,000 2,164,000
Hutchison 3G ("3") 379,00 405,300 460,600 465,000 480,600 513,000 544,000 562,000 588,000 655,000 713,000 773,000
2006 2007 2008 2009
Q3 Q4 Q1 Q2 Q3 Q4 Q1 Q2 Q3 Q4 Q1 Q2
REVENUES FROM FIXED-LINK, MOBILE, BROADBAND AND LEASED LINE SERVICES (P. 29)
Revenues from
fixed-link voice services 360 360 347 330 321 315 302 295 282 283 275 262
Revenues from
mobile services 946 905 916 898 895 851 857 855 857 865 832 824
Revenues from
fixed broadband services 141 148 156 159 158 139 143 136 131 127 124 123
Revenues from leased lines 59 66 57 57 57 59 56 59 56 61 60 58
Total revenues 1,506 1,479 1,476 1,444 1,431 1,364 1,358 1,345 1,326 1,336 1,291 1,267
Revenues in EUR (millions)
2006 2007 2008 2009
Q3 Q4 Q1 Q2 Q3 Q4 Q1 Q2 Q3 Q4 Q1 Q2
TECHNICAL MINUTES IN FIXED-LINK AND MOBILE NETWORKS (P. 30)
Online 859 794 689 512 429 360 255 184 148 124 98 73
Technical minutes
(fixed-link, excluding
online minutes) 2,307 2,327 2,194 1,997 1,924 2,035 1,958 1,800 1,691 1,714 1,756 1,611
Technical minutes
(mobile) 3,359 3,780 3,956 4,171 4,226 4,624 4,814 4,904 4,753 5,155 5,302 5,247
Total voice minutes 5,666 6,107 6,150 6,168 6,150 6,659 6,772 6,704 6,444 6,869 7,058 6,858
Number of call minutes (millions)
2006 2007 2008 2009
Q3 Q4 Q1 Q2 Q3 Q4 Q1 Q2 Q3 Q4 Q1 Q2
Number of subscribers (absolute)
SECTION 7 I APPENDIX 44
RTR Telecom Monitor 4 t h Q u a r t e r 2 0 0 9
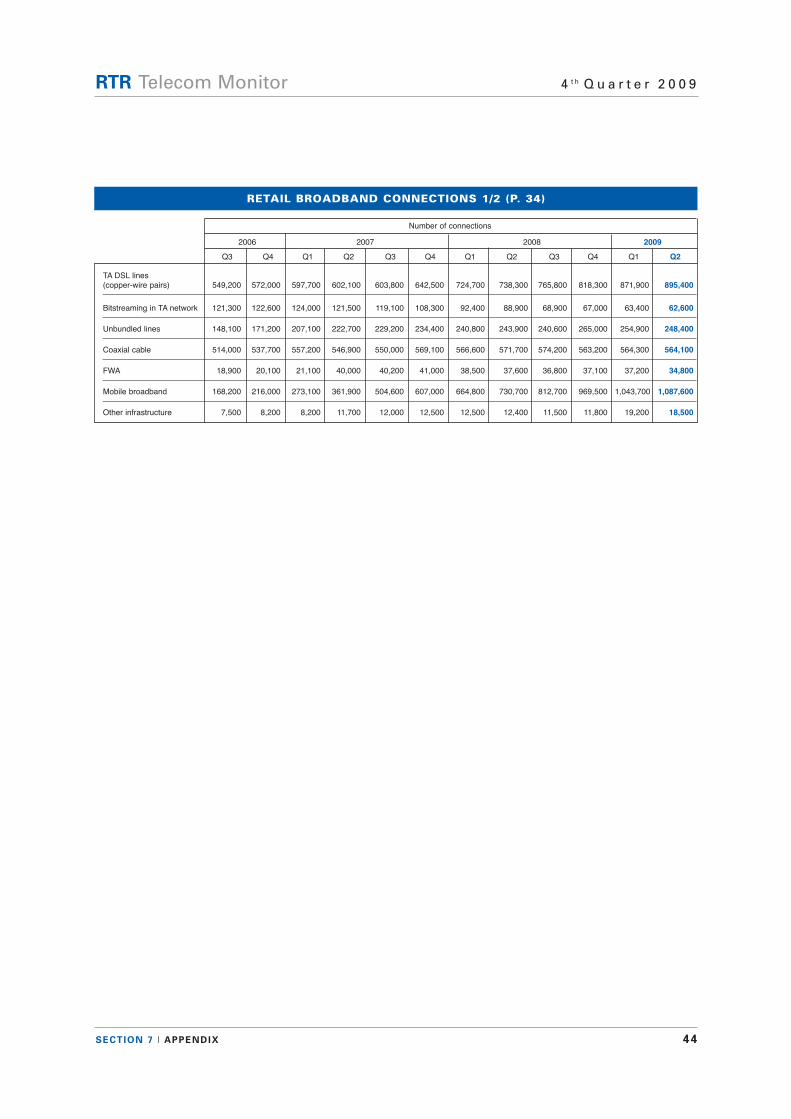
RETAIL BROADBAND CONNECTIONS 1/2 (P. 34)
TA DSL lines
(copper-wire pairs) 549,200 572,000 597,700 602,100 603,800 642,500 724,700 738,300 765,800 818,300 871,900 895,400
Bitstreaming in TA network 121,300 122,600 124,000 121,500 119,100 108,300 92,400 88,900 68,900 67,000 63,400 62,600
Unbundled lines 148,100 171,200 207,100 222,700 229,200 234,400 240,800 243,900 240,600 265,000 254,900 248,400
Coaxial cable 514,000 537,700 557,200 546,900 550,000 569,100 566,600 571,700 574,200 563,200 564,300 564,100
FWA 18,900 20,100 21,100 40,000 40,200 41,000 38,500 37,600 36,800 37,100 37,200 34,800
Mobile broadband 168,200 216,000 273,100 361,900 504,600 607,000 664,800 730,700 812,700 969,500 1,043,700 1,087,600
Other infrastructure 7,500 8,200 8,200 11,700 12,000 12,500 12,500 12,400 11,500 11,800 19,200 18,500
Number of connections
2006 2007 2008 2009
Q3 Q4 Q1 Q2 Q3 Q4 Q1 Q2 Q3 Q4 Q1 Q2